Wildland Fire Management Information (WFMI) Weather Lesson 7: Post-Trip Documentation April 2014.

1
qtVlm is developed in the hope that it will be useful, but without any guaranty. qtVlm does not replace
traditional navigation methods, nor printed paper charts.
Contents
Quick Start ............................................................................................................... 6
Installation ........................................................................................................................... 6
Polar files ............................................................................................................................. 7
Environment ........................................................................................................................ 7
Gribs and Weather Images..................................................................................................... 8
Maps .................................................................................................................................... 9
Offline maps .................................................................................................................................................... 9 Online maps .................................................................................................................................................... 9 Raster and Vector maps................................................................................................................................... 9 Other map parameters .................................................................................................................................. 10
NMEA Connections .............................................................................................................. 11
AIS Module.......................................................................................................................... 12
Instruments and Board ......................................................................................................... 13
Weather Routing Module ..................................................................................................... 14
Routes Module .................................................................................................................... 16
POIs and Barriers .................................................................................................................18
Start Line Mode ....................................................................................................... 19
Mobiles Versions (Android and iOS) ............................................................................ 20
File management on mobile versions .................................................................................... 21
Android.......................................................................................................................................................... 21 iOS................................................................................................................................................................. 21
Polars and boat behavior .......................................................................................... 24
Wind Polar .......................................................................................................................... 24
Waves polar ........................................................................................................................ 25
Engine and penalties for Gybes and Tacks .............................................................................26
Wind Polar Formats ............................................................................................................. 27
CSV format .................................................................................................................................................... 27 POL format .................................................................................................................................................... 27 XML format ................................................................................................................................................... 27
Waves polar format..............................................................................................................28
Viewing Polar ......................................................................................................................29

2
Studying polar ............................................................................................................................................... 29 Showing polar in the main dashboard ........................................................................................................... 29 Showing polar on the map ............................................................................................................................. 30
Environment ........................................................................................................... 30
Menu .................................................................................................................................. 30
QtVlm Menu .................................................................................................................................................. 30 View menu ...................................................................................................................................................... 31 Grib menu ...................................................................................................................................................... 32 Boat menu ...................................................................................................................................................... 33 Routings menu ............................................................................................................................................... 37 Routes menu .................................................................................................................................................. 37 Pathways menu .............................................................................................................................................. 37 Barriers menu ................................................................................................................................................ 38 Marks menu ................................................................................................................................................... 38 Help menu ..................................................................................................................................................... 38
Toolbar ............................................................................................................................... 39
Maps and Instruments icons .......................................................................................................................... 39 Grib icons ....................................................................................................................................................... 40 Boat icons ...................................................................................................................................................... 40 Barriers icons ................................................................................................................................................. 41 Man Over Board icon ..................................................................................................................................... 41
Map and main objects .......................................................................................................... 42
Status bar ........................................................................................................................... 42
Draw a heading ................................................................................................................... 43
Draw a grib reckoning .......................................................................................................... 43
Reckoning ...........................................................................................................................44
Gribs and Weather Images ........................................................................................ 45
Gribs ................................................................................................................................... 45
Gribs general options..................................................................................................................................... 46 Gribs opening ................................................................................................................................................ 47 Gribs download ............................................................................................................................................. 47 Grib display configuration ............................................................................................................................. 53 Setting a grib date, animating the grib .......................................................................................................... 54 Merging gribs ................................................................................................................................................ 54
Weather Images .................................................................................................................. 55
Opening a weather image ............................................................................................................................. 55 Placing a non geo-referenced weather image on the map............................................................................. 56 Displaying KML and KMZ geo-referenced images .......................................................................................... 57
Simulation Mode ...................................................................................................... 58
Start Line Mode ....................................................................................................... 59

3
Maps ...................................................................................................................... 61
Maps Configuration ............................................................................................................. 61
Offline Maps ........................................................................................................................ 63
Mbtiles maps ................................................................................................................................................. 63 GSHHS Maps ................................................................................................................................................. 65
Online Maps ....................................................................................................................... 66
VLM tiles........................................................................................................................................................ 66 Wikimedia tiles (OSM) ................................................................................................................................... 67 OpenTopoMap tiles ....................................................................................................................................... 67 OpenStreetMap tiles ..................................................................................................................................... 68 OpenSeaMap tiles ......................................................................................................................................... 68
Raster and Vector Maps ...................................................................................................... 69
Rasters maps ................................................................................................................................................. 69
Vector maps ........................................................................................................................ 70
NMEA Connections ................................................................................................... 72
Configuration ...................................................................................................................... 72
Activation ........................................................................................................................... 73
AIS Module ............................................................................................................. 75
Configuration ...................................................................................................................... 75
Usage ................................................................................................................................. 76
Target details ................................................................................................................................................ 76 Alarms, CPA, TCPA ......................................................................................................................................... 77
Instruments and Board ............................................................................................. 78
Instruments Configuration ................................................................................................... 78
Available Instruments ......................................................................................................... 80
COG: Course Over ground ............................................................................................................................. 80 SOG: Speed Over Ground .............................................................................................................................. 80 VMC: Velocity Made Course .......................................................................................................................... 81 TSP: Target Speed ......................................................................................................................................... 81 PPC: Polar Percent......................................................................................................................................... 82 TWD: True Wind Direction ............................................................................................................................. 82 TWA: True Wind Angle .................................................................................................................................. 83 TWS: True Wind Speed .................................................................................................................................. 83 AWA: Apparent Wind Angle .......................................................................................................................... 84 AWS: Apparent Wind Speed .......................................................................................................................... 84 CTW: Course Through Water ......................................................................................................................... 85 STW: Speed Through Water .......................................................................................................................... 85 CS/CD: Currents Speed and Direction ............................................................................................................ 86 DPH: Depth ................................................................................................................................................... 86 PRE: Atmospheric Pressure ........................................................................................................................... 87

4
Boards ............................................................................................................................... 88
Microboard .................................................................................................................................................... 88
Main Dashboard ................................................................................................................. 88
Position tab ................................................................................................................................................... 88 Speed and Heading tab ................................................................................................................................. 89 WP tab ........................................................................................................................................................... 89 GPS tab ......................................................................................................................................................... 90 Anchor tab ..................................................................................................................................................... 90 Polar tab ........................................................................................................................................................ 91
Weather Routing Module .......................................................................................... 92
Introduction ........................................................................................................................92
Weather Routing creation ....................................................................................................92
Converting a Weather Routing into a Route .......................................................................... 94
Multi-points routing ............................................................................................................. 95
Other Weather Routing Module functions ............................................................................. 97
Display TWS along and between isochrons ................................................................................................... 97 Displaying alternative routes ......................................................................................................................... 98 Finding the best starting date: multi-routing ................................................................................................. 99 Calculating and understanding inversed isochrons ...................................................................................... 100 Placing and utilizing pivot points .................................................................................................................. 101 Other options and advanced options ........................................................................................................... 102
Other parameters that have impact on routing module ........................................................ 105
Vacation (crank) length ................................................................................................................................105 Grib interpolation formula ............................................................................................................................105 Polar, engine, tacks and gybes parameters ..................................................................................................105
Routes Module ....................................................................................................... 106
Introduction ...................................................................................................................... 106
Creating or editing a route .................................................................................................. 107
Converting a routing into a route ........................................................................................ 108
Coasts or barriers collisions................................................................................................. 108
Simplification/Optimization ............................................................................................... 109
Add/remove POIs to route .................................................................................................. 109
Moving POIs belonging to a route ....................................................................................... 110
Displaying Wind Arrows on POIs ......................................................................................... 110
Boat position extrapolation ................................................................................................ 111
Route logbook ................................................................................................................... 112
Activating a route .............................................................................................................. 113

5
Routes comparator ............................................................................................................ 114
Exporting and importing routes .......................................................................................... 114
General parameters and custom fields ................................................................................. 114
Route Custom Fields ..................................................................................................................................... 115
Pathways module ................................................................................................... 117
POIs and Barriers ................................................................................................... 119
POIs (Points of Interests) .................................................................................................... 119
Introduction .................................................................................................................................................. 119 POI creation and edition ............................................................................................................................... 119 Mark menu .................................................................................................................................................. 120 POI contextual menu ................................................................................................................................... 120 Laylines ........................................................................................................................................................ 121
Barriers ............................................................................................................................. 122
Tutorial Videos ....................................................................................................... 123
6
Quick Start
Installation
qtVlm versions for PC (Windows/Linux/MacOS) as well as Raspberry PI2 and PI3 are available here:
http://www.meltemus.com
Mobile versions (Android et iOS) are available through their respective stores. More information about
mobile versions at the end of this introduction.
Windows: Installing is made through qtVlm’s installer, which will choose automatically between 64bits
and 32bits releases. It is also compatible with Windows XP.
Linux: Installation is made by uncompressing the gz archive. Then to start qtVlm just run “./qtVlm”. A
directory “.qtVlm” containing user data will be created.
MacOS: Install is made by copying the folder “qtVlm” contained in the DMG somewhere on your local
disk. Then you can run qtVlm from this local folder. It is not possible to run qtVlm directly from the DMG
disk.
Raspberry: In a terminal, un-compress the archive with the command
tar zxvf qtVlm-5.8.1-rpi.tar.gz
then you can run qtVlm with:
cd qtVlm
./qtVlm
You can also run: ./qtVlm_touchscreen for a pure tactile version.
In all cases, you will be asked to download qtVlm’s maps (gshhs).

7
Polar fi les
Via the menu “boat->boat settings” you can choose a polar for your boat. qtVlm comes with some typical
polar files, and you can easily create or import a personalized one. It is possible to alter a polar by applying
a coefficient on it, you can specify delays for tacking and gybing, or under which speed you decide to start
the engine, etc. There is also the possibility to define “waves polar”, describing the behavior of the boat
depending on sea conditions.
More about polar files
Environment
qtVlm is divided in several areas: the toolbar and the main menu, the map and its objects, instruments
and status bar, plus several boards. The main dashboard is displayed or hidden by clicking on the
microboard, on the right side of the screen, or through the dedicated icon on the toolbar.
The selection tool can be used to select an area on the map, and can also be invoked with the mouse
and the <shift> key.
More about qtVlm environment

8
Gribs and Weather Images
qtVlm can open or download a wide number of grib types, being grib 1 or grib 2. There are 3 slots where
a grib can be loaded. One can for instance load a Winds grib in the first slot, and a Currents grib in the
second one. It can also be used to load gribs with the same data at different resolutions. Data displayed
on the map can be configured fully through the grib display control available in the toolbar. qtVlm
will always use the data with the better resolution, regardless of the slot number.
It is also possible to configure custom grib addresses for all three slots, for instance:
qtVlm is Iridium GO! certified for Android and iOS. It can request and receive gribs via “Iridium Mail and
Web” or XGate applications..
http://grib.weather4d.com/AromeHD (Winds HD France)
http://grib.weather4d.com/MyOcean (Currents France)
ftp://ftp.bsh.de/Stroemungsvorhersagen/grib1/hires_exp/ (Currents Denmark)
SKIRON gribs are also a very useful resource:
http://www.openskiron.org/gribs_wrf_4km
http://www.openskiron.org/gribs_wrf_12km
http://www.openskiron.org/gribs_skiron
http://www.openskiron.org/gribs_icon_eu
http://www.openskiron.org/saildocs
qtVlm also allows to display weather images over the map. It accepts all image formats, and up to 8 slots
can be pre-configured. Since version 5.7.3 it can also display kml and kmz images for instance from:
http://www.opc.ncep.noaa.gov/gis/index.php
https://earthdata.nasa.gov/earth-observation-data/near-real-time/rapid-response/modis-subsets
More about gribs and weather images

9
Maps
Several map types are available (menu “qtVlm->Configuration”).
Offline maps
These maps are the gshhs maps, which in fact contains the coast lines used by qtVlm in Routes and
Routings modules, and mbtiles charts. It is also there that are managed charts coming from Visit My
Harbour.
Online maps
VLM tiles are the identical to gshhs maps, plus some color to represent altitude.
OpenStreetMap tiles, available on mobile (Android et iOS) only,
OpenSeaMap tiles, which can be displayed over any other type of maps,
Wikimedia tiles,
OpenTopoMap tiles.
Raster and Vector maps
qtVlm can also display georeferenced maps in kap, geotiff, geojpeg, etc format. A folder containing
these maps can be configured, or these maps can just be copied in qtVlm default kaps folder.
Vectors maps (S57) are also supported.
Similarly, qtVlm can read and display maps in mbtiles format, that also just must be copied in a dedicated
folder.
10
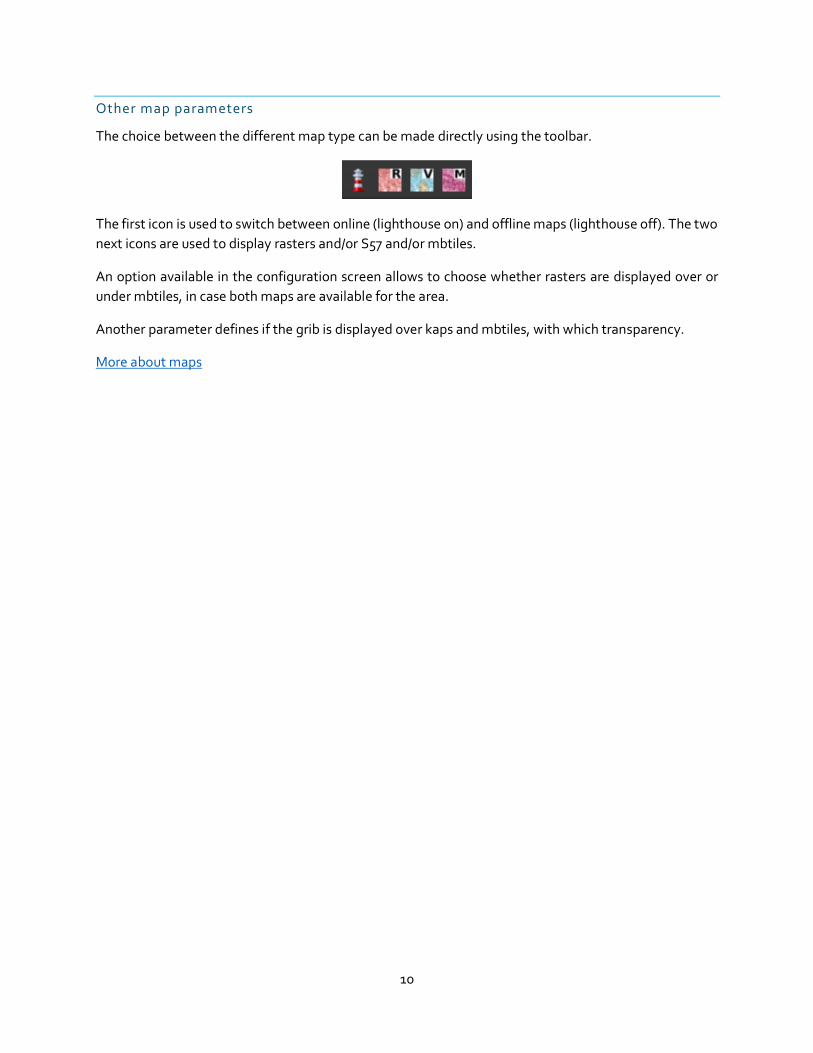
Other map parameters
The choice between the different map type can be made directly using the toolbar.
The first icon is used to switch between online (lighthouse on) and offline maps (lighthouse off). The two
next icons are used to display rasters and/or S57 and/or mbtiles.
An option available in the configuration screen allows to choose whether rasters are displayed over or
under mbtiles, in case both maps are available for the area.
Another parameter defines if the grib is displayed over kaps and mbtiles, with which transparency.
More about maps

11
NMEA Connections
qtVlm can connect to a lot of various NMEA sources (serial port, internal GPS, GPSD, TCP and UDP).
Several sources can be used simultaneously.
Most of NMEA messages are implemented, and are used to feed instruments and/or AIS module.
More about NMEA connections
12
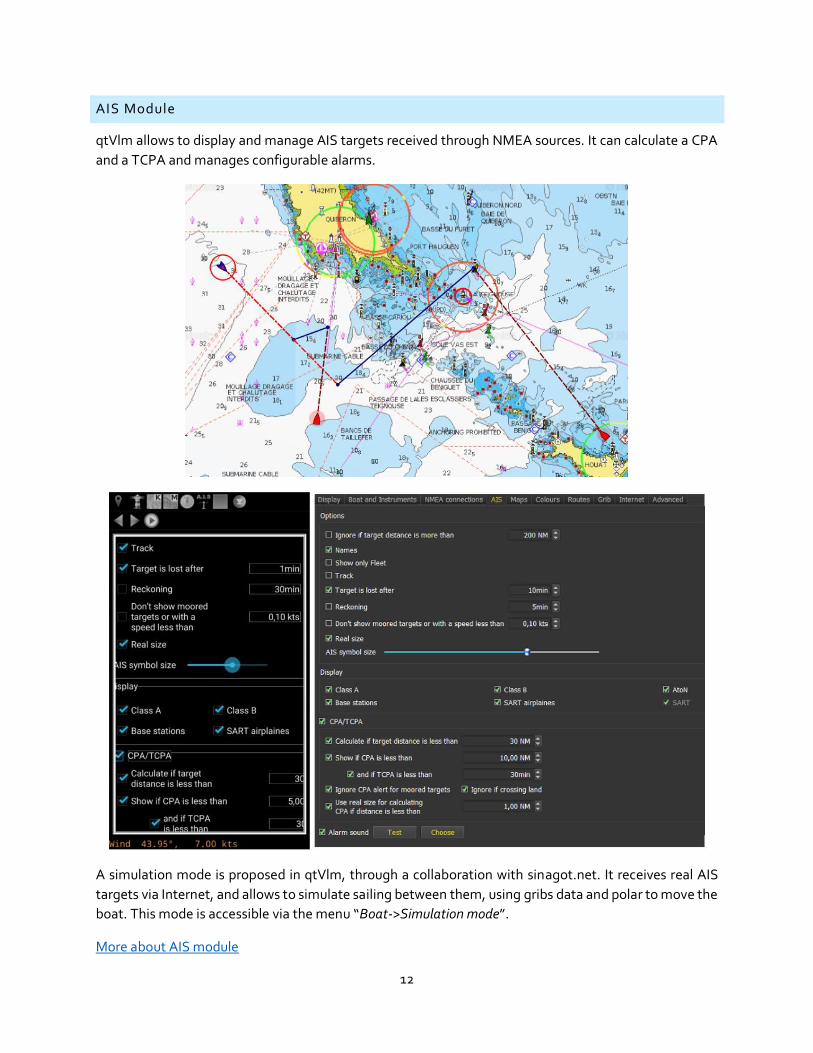
AIS Module
qtVlm allows to display and manage AIS targets received through NMEA sources. It can calculate a CPA
and a TCPA and manages configurable alarms.
A simulation mode is proposed in qtVlm, through a collaboration with sinagot.net. It receives real AIS
targets via Internet, and allows to simulate sailing between them, using gribs data and polar to move the
boat. This mode is accessible via the menu “Boat->Simulation mode”.
More about AIS module

13
Instruments and Board
Most of classical instruments are available in qtVlm. They appear at the bottom of the screen or on the
left side, depending on the screen orientation. They can be hidden or shown with the toolbar instrument
button .
Dials can be shown and hidden by clicking on the numerical displays. Use long-click to display
histograms.
Their sizes and positions are managed with the mouse (plus <shift> key for size) or fingers on mobile
versions. You can lock their size and positions to avoid moving them while manipulating the map or other
objects. It is also possible to select which instruments are displayed.
More about instruments and dashboard
14
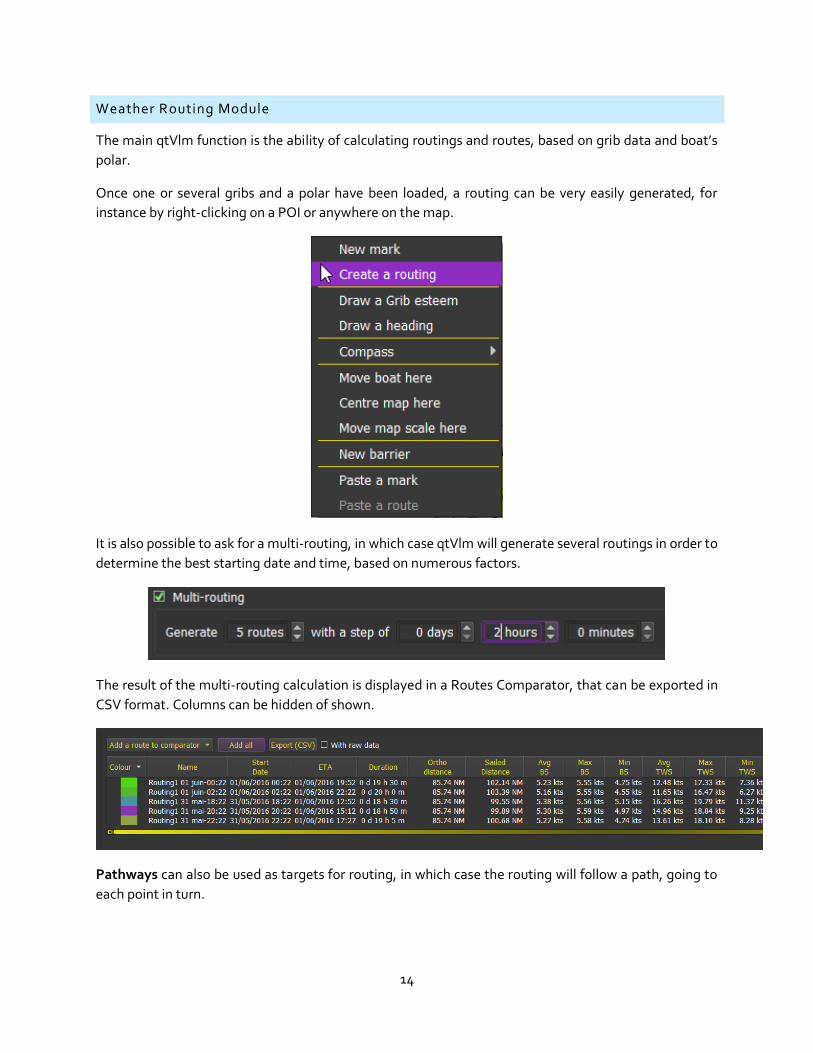
Weather Routing Module
The main qtVlm function is the ability of calculating routings and routes, based on grib data and boat’s
polar.
Once one or several gribs and a polar have been loaded, a routing can be very easily generated, for
instance by right-clicking on a POI or anywhere on the map.
It is also possible to ask for a multi-routing, in which case qtVlm will generate several routings in order to
determine the best starting date and time, based on numerous factors.
The result of the multi-routing calculation is displayed in a Routes Comparator, that can be exported in
CSV format. Columns can be hidden of shown.
Pathways can also be used as targets for routing, in which case the routing will follow a path, going to
each point in turn.

15
Once the routing calculation is terminated, it is possible to convert it in a Route, and then optionally to
simplify and optimize the resulting route. This can be done automatically if the option “convert to route”
is checked before launching the routing calculation.
Many other options are available, like for instance asking for pivot points, calculating inversed isochrones,
placing barriers, multi-points routing, etc.
More about Weather Routing Module

16
Routes Module
Route in qtVlm allows several navigation modes between POIs (vbvmb, vmg or ortho). It can also display
and export in CSV format the route’s log containing many information.

17
More on Routes Module

18
POIs and Barriers
POIs (Point of Interest) are point that can be placed in qtVlm. They can be used for a variety of tasks, like
start or arrival points for routes or routings. They can also be defined as the active boat’s WP, and as such
be sent on NMEA output.
Laylines can also be displayed (from grib or NMEA data). Currents are taken into account.
It’s also possible to create barriers, that will be avoided by Routings and Routes modules.
More about POIs and barriers

19
Start Line Mode
This mode can be activated from “boat” menu. It manages a race chronometer with two configurable
tops, and displays time and distance to line. A safety zone can also be displayed over the start line.
Currents and boat dimensions are taken into account.
More about Start Line Mode

20
Mobiles Versions (Android and iOS)
Android and iOS versions are available on Google Play Store or Apple Store. While PCs versions are 100%
free, the full version must be purchased to benefit from all the functionalities. Once activated, the full
version is available for all your devices for this operating system.
The full version activation adds:
• Routes and Routings modules, Rasters, S57 and Mbtiles modules.
• Instruments and AIS modules.
• Iridium grib requests, and Great Circle (Squid) grib download or requests.
qtVlm on mobiles is designed to be used together with the PC versions. It is possible to load gribs, maps
and so on, to prepare routes and routings on PC and then transfer all to Android or iOS devices.
To achieve this, on the PC side just go to qtVlm->export, then copy the resulting zip file on the mobile
device (on iOS this can be done for instance via iTunes or AirDrop) and run the import function.
Depending on which options were used, the mobile device will then be in the same configuration, with
the same maps, routes, gribs, polars, etc.
Mobiles versions are also of course useable without PC at all. All the functions described in this document
are available on Android and iOS versions.
Google Play Store Apple Store
21
File management on mobile versions
Android
On Android a PC file manager can be used to manage directly qtVlm files. There is a qtVlm folder at the
root of your internal card, where you can find all sub-folders like gribs, kaps, S57, mbtiles, etc. Please note
that most of these folders (including gshhs maps) can eventually be transferred on an external SD-Card.
In that case it is better to use qtVlm’s dedicated folder: /Card/Android/data/org.meltemus.qtvlm/files. For
each main category, there are options in qtVlm configuration screen to indicate where to locate the files.
iOS
On iOS file transfers can be made in several ways.
Most file extensions are declared into iOS for qtVlm, so it is possible to open an email attachment and
send it directly to qtVlm.
For users equipped with a Mac, it is also very easy to transfer gribs, polar, charts, etc. using Airdrop.
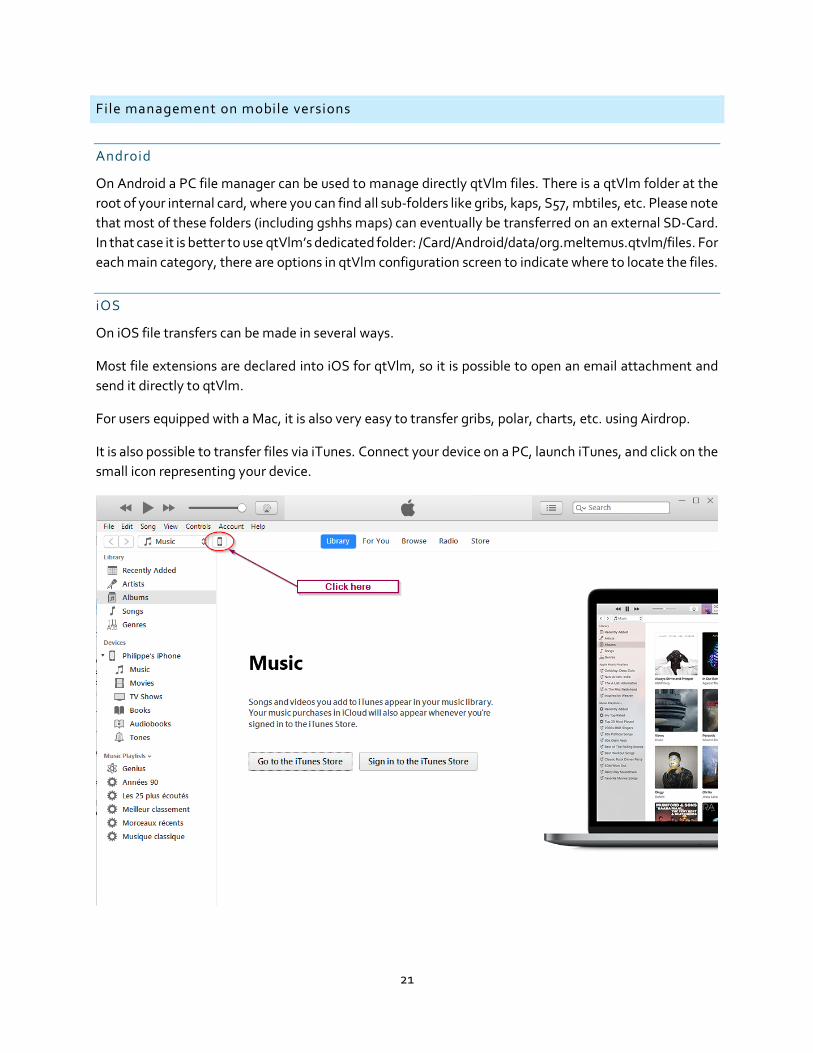
It is also possible to transfer files via iTunes. Connect your device on a PC, launch iTunes, and click on the
small icon representing your device.

22
Then click on “File sharing”:
And finally choose qtVlm as an application:

23
You can now drag and drop files in this folder. For instance let’s imagine you want to transfer “Visit My
Harbour” charts to your iOS device. Just select them from the dongle or the DVD and drop them into
iTunes:
Then you can launch qtVlm, or if it is already running launch “qtVlm->import from iTunes folder” in order
to integrate these files into qtVlm. In the case of VMH charts, you will also have to activate them using
qtVlm->Configuration->Charts and choose “VMH activation”.
Please note that although sub directories in this folder cannot be opened directly in iTunes, you can drag
and drop them on your PC, do whatever you need to do (copy, delete files), and then drag it back into
iTunes.

24
Polars and boat behavior
Wind Polar
From the menu “Boat->Boat settings”, you can select a polar:
To import a custom polar, you can either copy the polar file into qtVlm polar folder or use the button
“import a polar”.
You can also request a polar from our server (internet connection required). More than 250 polars
available and growing.
Another good source for polars: http://jieter.github.io/orc-data/site/
You can apply efficiency factors (different for upwind and downwind), and also specify a polar efficiency
factor during night periods, and you can choose to force best wind angles values, or to let qtVlm calculate
them.

25
Waves polar
Boat’s behavior in waves can be defined in two ways:
• You can specify a “Waves Polar”, that will indicate what gain or loss will be calculated depending
on waves angle and height, i.e. which % to apply on the wind polar. Waves Polar can be defined
for various TWS (1m waves height has more effect in very light winds). For this calculation, qtVlm
uses first “Maximum Waves” height and direction, then if not available it will use “Swell” height
and direction, and finally if nothing else is available, it will use “Primary Waves” direction and
“Combined Waves” height.
• Crossed Sea: You can define what is crossed sea by entering a minimum height and a minimum
angle between wind waves and swell. If wind waves direction is not available (as often), then
wind’s direction will be used instead. If such a condition is met, a coefficient will be applied on
the wind polar.

26
Engine and penalties for Gybes and Tacks
You can specify that when the boat’s speed with sails is under a value, the engine is started, with a boat’s
speed in that case that will override the polar value.
You can also specify parameters for tacking/gybbing (speed loss and duration). Units are expressed in
“Cranks”, which is qtVlm internal calculation step (by default 5 minutes).

27
Wind Polar Formats
CSV format
CSV is the most commonly used format. You can edit it in a spreadsheet.
It must start with TWA/TWS or TWA\TWS.
It is basically a simple text file, with fields separated by a semi-column. The decimal separator is the point.
The 1st line contains wind speeds in knots. It has to be real wind TWS and not apparent wind). The 1st
column contains wind angles (TWA). The table is then filled with a value in each cell that will indicate the
boat’s speed for that couple TWS/TWA. The steps between TWAs and TWs is free of constraints, but each
cell must have a value.
POL format
It is the same as CSV format, except that the separator between field is the <tab> character.
XML format
It the format used by Maxsea. It comes as an XML file.

28
Waves polar format
Waves polars must have an extension “.polwave.csv”. Since it is a csv file, it can be loaded in as a
spreadsheet.
Wave Polars can be defined for various TWS. If only one TWS is defined this wave polar will be used
regardless of the actual TWS.
The first cell indicates for which TWS this polar is meant to apply. Data in abscise represent Waves height
in meters, and data in ordinate represent angle between waves and boat heading.
Data themselves are the percentage to be applied in that case, as a percentage. In the example above
103% of the polar speed will be used if TWS=10, Wave Height is 2 meters and angle between wave and
boat is 120°. Of course, qtVlm will interpolate any intermediate values.

29
Viewing Polar
Studying polar
This function is located under the menu “Boat->Polar analysis”.
This dialog shows critical angles for the polar (best VMGs). Note that it is possible to modify the polar
outside qtVlm in the same time. Just press “Reload polar” each time you save it.
Showing polar in the main dashboard
Polar can also be displayed in the main board. If wind data is available from NMEA sources, the polar will
adjust itself automatically to current TWS, allowing to compare theoretical polar speed with actual one.

30
Showing polar on the map
Polar can also be displayed directly on the map. For this go to the menu “View->show/hide and check the
line “show/hide speed polar” (or press “L” key). For the polar to be displayed a grib has to be loaded.
Environment
Menu
qtVlm menu consists in several sub-menus:
QtVlm Menu
This menu contains the Quit command to close qtVlm (with or without saving data). It also allows to
switch from VLM mode to Real mode or vice versa.
It also contains the Export and Import functions, that allows to transfer all or some data from one qtVlm
installation to another (PC or mobile).
It also contains the Configuration function, with all qtVlm settings.

31
View menu
This menu is managing the display status of qtVlm items (POIs, traces, routes, etc.).
It also allows to display a single kap file (raster map), in which case the quilting mode is deactivated.
There is also a function to display your boat and trace on Google Earth.
You can also choose night mode (either from “Vector Maps light mode” or “Raster maps light mode”), in
which case qtVlm will change its display theme.
32
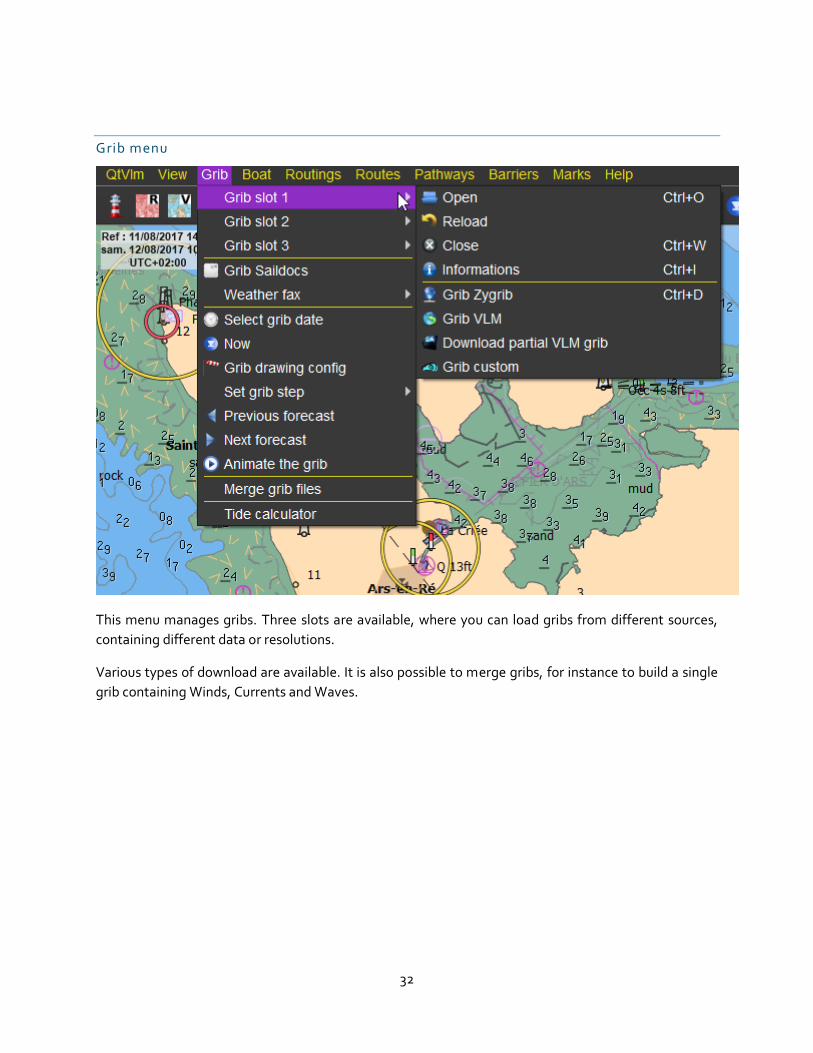
Grib menu
This menu manages gribs. Three slots are available, where you can load gribs from different sources,
containing different data or resolutions.
Various types of download are available. It is also possible to merge gribs, for instance to build a single
grib containing Winds, Currents and Waves.
33
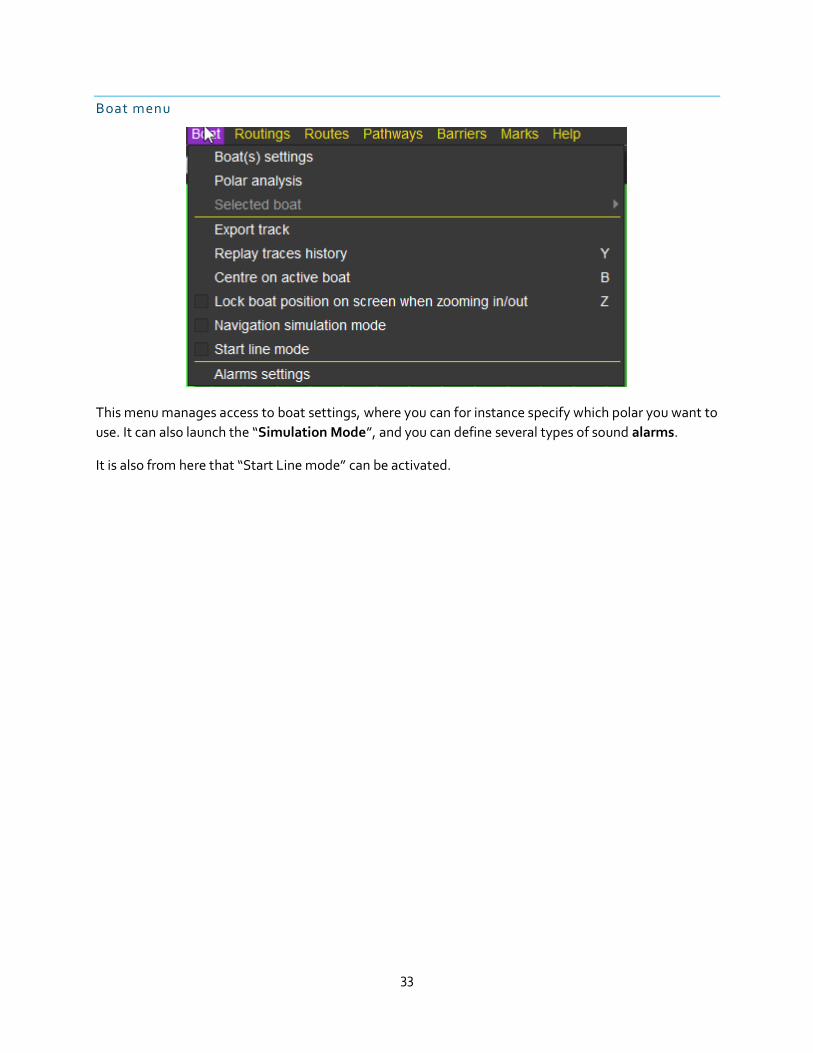
Boat menu
This menu manages access to boat settings, where you can for instance specify which polar you want to
use. It can also launch the “Simulation Mode”, and you can define several types of sound alarms.
It is also from here that “Start Line mode” can be activated.

34
Boat settings
This configuration screen defines various boat parameters, especially concerning wind polar, parameters
depending on sea state, engine usage, etc. See Polars and boat behavior for more info on these settings.
It also allows to set the size of the boat icon displayed on the map. A zero size will display a simple point
and the name of the boat.
The GPS antenna placement on the boat is defined, so the physical size of the boat and AIS targets can
be taken into consideration when calculating CPA and TCPA (closest point of approach in AIS module),
and in Start Line Mode. Draught is not used for the time being.
Own MMSI can be input, in which case messages coming from this MMSI will be ignored by AIS module.

35
Some other options concerning the boat are also available in the main configuration screen, tab “Boat
and Instruments”.
Apart from various reckoning and trace options, you can specify here what Crank duration qtVlm will use.
This is the internal step qtVlm is using for all calculations. A small value gives more precise results, but
will be costlier in CPU, memory and computation times.
You can also specify that you want the boat always centered on the screen, when NMEA reception is
activated. You must center the boat on the screen once after zooming or panning to reactivate this option.
This can be done from the boat menu, or from the microboard’s upper label. After 5mn of inactivity (i.e.
not moving the map), the map is again centered on the boat.

36
Alarms settings
Sound alarms can be triggered on several conditions: on time, or if the boat’s heading or TWA deviates
too much from a defined value. Alarms on speed, depth and currents are also available, as well as an
alarm on Polar Efficiency Percentage (PPC), an alarm on AWA, an alarm on distance to active WP, and
an alarm on Atmospheric Pressure. Several alarms can be defined at the same time. Some alarms have a
delay parameter, that you can use to specify that you want the alarm to ring only if the limit is exceeded
for more than that time. If the defined limit is exceeded by more than 1.5 times, the alarm will be
triggered regardless of the timer.
Alarm on Atmospheric Pressure is available only if the relative instrument and histogram is configured in
Instruments settings.
Anchor and AIS alarms are defined in their respective modules.

37
Routings menu
This menu manages routing (creation, edition, deletion). Note that unlike routes, routing are not saved
when you close qtVlm, and there is no import/export functions. Routings are meant to be converted in
Routes.
Routes menu
This menu manages routes: creation, deletion, edition, import, export, and comparing.
Pathways menu
This menu manages pathways, which can be used for multipoint weather routing. A pathway can also be
activated. More information on that in Pathways module

38
Barriers menu
This menu manages barriers. Barriers are meant to materialize no-sail-zones or other forbidden areas.
They are avoided by the routing calculations.
Marks menu
This menu manages POIs (Point of Interests). It also allows importing marks from other sources.
Help menu
This menu allows access to various help resources. It also contains the recent modification log for qtVlm.
39
Toolbar
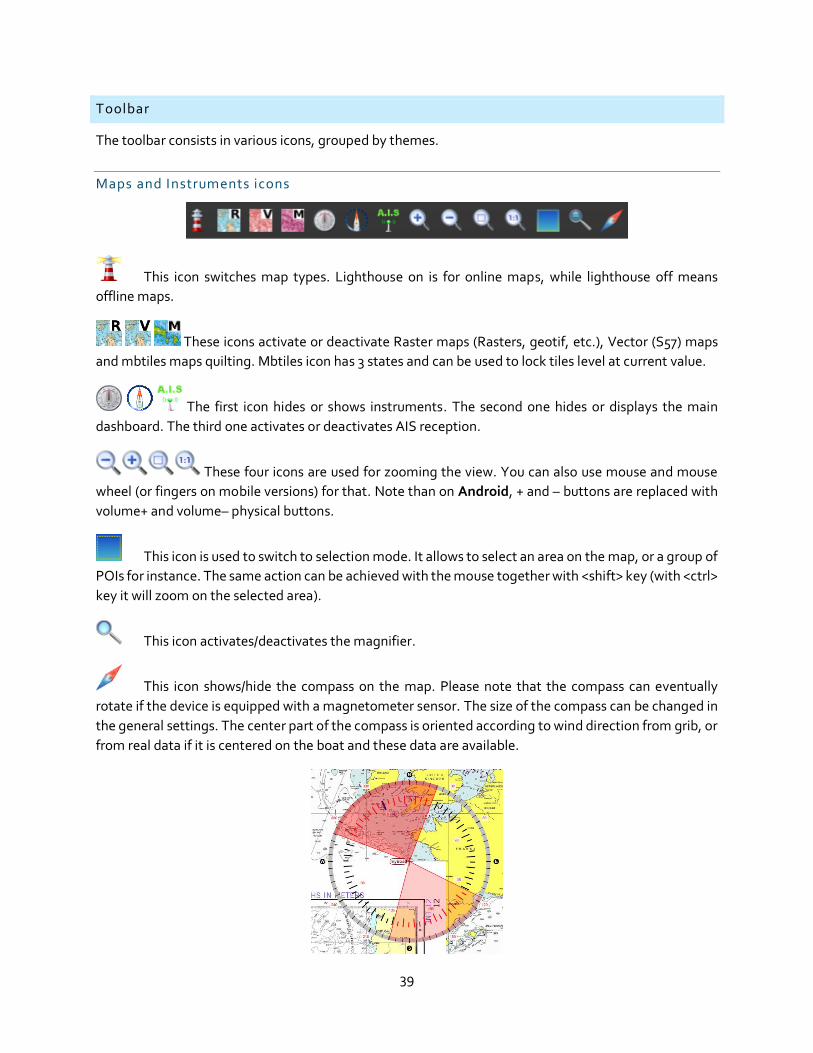
The toolbar consists in various icons, grouped by themes.
Maps and Instruments icons
This icon switches map types. Lighthouse on is for online maps, while lighthouse off means
offline maps.
These icons activate or deactivate Raster maps (Rasters, geotif, etc.), Vector (S57) maps
and mbtiles maps quilting. Mbtiles icon has 3 states and can be used to lock tiles level at current value.
The first icon hides or shows instruments. The second one hides or displays the main
dashboard. The third one activates or deactivates AIS reception.
These four icons are used for zooming the view. You can also use mouse and mouse
wheel (or fingers on mobile versions) for that. Note than on Android, + and – buttons are replaced with
volume+ and volume– physical buttons.
This icon is used to switch to selection mode. It allows to select an area on the map, or a group of
POIs for instance. The same action can be achieved with the mouse together with <shift> key (with <ctrl>
key it will zoom on the selected area).
This icon activates/deactivates the magnifier.
This icon shows/hide the compass on the map. Please note that the compass can eventually
rotate if the device is equipped with a magnetometer sensor. The size of the compass can be changed in
the general settings. The center part of the compass is oriented according to wind direction from grib, or
from real data if it is centered on the boat and these data are available.

40
Grib icons
Press long on this icon to get a sub-menu managing various grib download commands.
This icon will open a grib in the first slot.
This icon manages grib display configuration
This icon selects which grib slot (or all) is activated.
This icon hides or shows grib data on map.
This icon allows to choose a date in the gribs.
This icon sets the grib’s date to now.
These icons are used to move the grib’s date forward or backward, according to the defined
step.
This icon launches the grib animation.
Boat icons
These icons are used to define the unit and the length for boat’s
reckoning line.
This icon is used to defined or stop alarms. It appears in green if no alarm is currently triggered.

41
Barriers icons
This icon can be used to place barriers on the map, that will be avoided by Routings and Routes
modules.
Man Over Board icon
This icon creates a mark with the same symbol at boat position. This mark becomes
automatically the active WP, and some information related to it (time since dropped, heading, distance)
are displayed in the status bar.

42
Map and main objects
POIs (points of interest) can be placed on the map with a right-click on the map (or with pinpoint icon
on mobile versions). POIs can be moved with the mouse, or by capturing new coordinates in their
editor.
The boat can also be moved with the mouse, or by right-clicking the map and selecting “move boat here”,
if GPS reception is not activated.
You can also display a longitude/latitude grid over the map.
Status bar
It contains information from grib data at the mouse position. It can also show other information like
distances, coordinates, or running imports. The font size can be specified in the main parameters.
The status bar also displays information about alarms, when they are activated.

43
Draw a heading
From all objects and directly on the map, the function “draw a heading” can be called, through the
contextual menu (or with the pinpoint on mobile versions).
This function shows orthodromic and loxodromic lines with distances, angles, etc. It will turn red if
crossing a land or a barrier. TWA data is also displayed, based on grib and instruments data.
Draw a grib reckoning
From all objects and directly on the map, the function “draw a grib reckoning” can be called, through the
contextual menu (or with the pinpoint on mobile versions).
This function calculates the boat’s
position based on polar and grib
Winds data. Five legs can be defined,
either in fix TWA or fix heading
mode. Penalties for tack/gybes, and
waves parameters are not taken in
account.

44
Reckoning
Several types of reckoning are available. The choice is made either in the main configuration dialog
(boat tab), or from the boat’s contextual menu (right-click). The reckoning length can be specified in
number of cranks, duration or distance. Reckoning line flashes if it crosses a land.
• Reckoning based on boat’s speed and heading: this is the projection of the instantaneous boat’s
speed and heading. No grib data is used for the calculation. This is based on COG and SOG.
Please note that the boat’s icon orientation is based on CTW, if available.
• Reckoning based on boat’s TWA: this reckoning assumes boat’s TWA will remain the same, and
is calculated using grib data and polar. Currents grib data is taken into consideration also, if
present.
• Reckoning based on boat’s HDG: this reckoning assumes boat’s heading will remain the same,
and is calculated using grib data and polar. Currents grib data is taken into consideration also, if
present.

45
Gribs and Weather Images
Gribs
qtVlm can use gribs from many sources, in format 1 or 2, compressed or not. Three slots are available for
that, so it can manage three gribs simultaneously, containing different data or different resolution for
the same data. If a grib contains the same data at different resolution, the data with the best resolution
is used for calculations and display (if both gribs have the same resolution, the lesser grib slot number
will be used. qtVlm will switch to the bigger resolution only when the data with the best resolution is
exhausted in time or area. You can also force the usage of a single grib slot from the toolbar or from the
grib display settings dialog.
In practice, it is usual for instance to load a grib with Winds data in the slot 1, and a grib with Currents
data in slot 2, but in fact the slots are equivalent and the order does not matter.

46
Gribs general options
This configuration screen is available via the menu “qtVlm->configuration”, Grib tab.
The folder used to store downloaded gribs can be specified. Beware that by default, all gribs in qtVlm
default folder will be deleted if they are older than 3 days. If another folder is specified this cleaning
process will not apply.
It is also possible to filter out irrelevant data and keep only useful data used by Routes and Routings
modules. This is useful to limit memory usage and therefore be able to load bigger gribs.
The first option relates to Saildocs, a service that can send you gribs via email. You can choose if you
want to see Saildocs options screen when you generate a request, or use last settings used.
Depending on which platform you are running qtVlm, you can also generate requests via Iridium. In this
case you must indicate the relevant account information for XGate and/or Iridium Mail and Web.
You can also access directly to your Great Circle (Squid) gribs subscriptions. In this case you must indicate
your Great Circle account information.
Check “use an external mail client” in “E-Mail and Internet” tab is you are using for instance Outlook.
You can also specify custom addresses (URLs) for downloading gribs.
You can also force Winds and Currents, mainly used for educational purposes.
And finally, you can also apply a correction (%) on all TWS data from gribs.
47
Gribs opening
From the menu “Grib->Slot 1 or 2->open” you can open a grib located on the machine. If a grib is too big
to be loaded, you can select a zone on the map before opening it, that will limit the grib to this area. Gribs
are automatically reloaded when the application restarts.
qtVlm knows how to read directly (and even merge) compressed files so it is not necessary to un-
compress them before.
The button on the toolbar can be used to open a grib in slot 1.
Beware that qtVlm will delete all gribs in the folder used to open the grib, if they are older than 3 days.
This behavior can be changed in the grib general options.
Gribs download
qtVlm can download gribs from various sources, either in slot 1 or 2.
Full VLM grib download
VLM server provides 4 times a day a NOAA grib at a 0.5°/3h resolution, with a duration of 5 days, covering
all world. If a selection is made on the map before download, the grib will be limited to this area although
the full grib will be downloaded (35 mb).
Partial VLM grib download
It is the same as the full VLM grib, but only the selected zone will be downloaded. You can also do that
via the contextual menu of the selection area.
Zygrib download
You can request directly a grib to zygrib server (this option is not available on mobile platforms). You
need to select a zone on the map. This action is also available in the selection area contextual menu.

48
Many options are available, which allow you to choose which data you want, which resolution and
duration (maximum 10 days). These gribs also come from NOAA.
49
Saildocs download
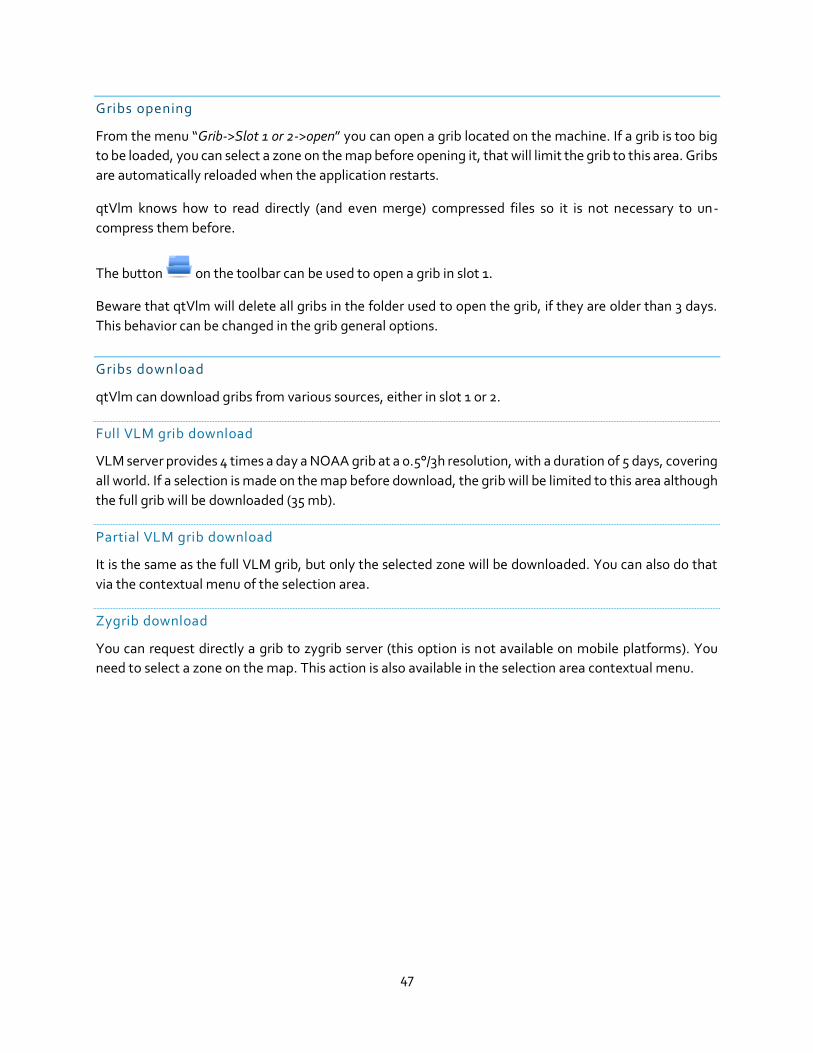
Select a zone on the map, then use its contextual menu to request a Saildocs grib. If the relevant option
is checked in the general grib settings, you can select which kind of model, data, duration, etc. you want
to request.
Some explanations on the different grib models available here: gribmodels
Several mails can be received if several models are selected.
If the usage of an external client for email is unchecked in the options, you will need to copy/paste the
body of the message and send it to [email protected], with whatever object (but not empty).
You will then receive an email with the grib as an attachment, which you can open in one of the three
grib slots.

50
Great Circle gribs download and requests
If you have indicated your Great Circle account information, you can access directly to you GC grib
subscriptions, or generate a mail request eventually through Iridium. To get the following screen, you
must select a zone and request a Great Circle grib via the selection contextual menu, or via the Great
Circle grib entry available in each grib slot.

51
Grib download via Iridium Mail and Web or XG ate applications
qtVlm is Iridium GO! certified on Android, and iOS and can generate Saildocs or Great Circle emails
requests via « Iridium Mail and Web » (IMW) or XGate applications. On Windows and MacOS only XGate
is supported. On Linux these applications do not exist.
Before anything, you must select which application you will use to communicate with satellites:
Then select a zone and request a Saildocs grib via the selection contextual menu:
Be careful to not to select a too big area, and that your Saildocs parameters are set to limit grib file
size to a minimum.

52
The mail is then generated and sent automatically to IMW or XGate. On iOS the corresponding
application will be opened automatically. Your mail is ready to be send:
Similarly, the grib reception is made through IMW or XGate. On Android or iOS qtVlm will be proposed
to open the attachment:

53
Custom grib download
You can also download in either slots a grib from a customized URL, defined in the grib options dialog.
Grib display configuration
The way grib data is displayed is managed from the menu, or with the icon in the toolbar. Arrow
colors can be defined for each slot, to help comparing models together.
Currents arrows length is proportional to Currents speed.

54
Setting a grib date, animating the grib
These icons in the toolbar are used to position the grib at a date, to move the date forward or backward,
and to launch an animation of the gribs.
Merging gribs
Via the menu “Grib->merge grib files”, you can concatenate gribs together (of the same type 1 or 2), to
build a single grib file from many. This is useful for instance to generate a grib file containing Winds,
Currents and Waves that will be easier to manipulate or transfer to a mobile device.
If the same type of data with the same date is available in several gribs, the data with the better resolution
will be kept.
You can merge compressed files without decompressing them.

55
Weather Images
Weather images are either non geo-referenced images (tif, png, jpg, etc), or geo-referenced images (kml
or kmz files). qtVlm can keep up to 8 predefined slots. You can find weather images in many places, for
instance here: http://tgftp.nws.noaa.gov/fax/marine.shtml, or for geo-referenced images for instance
here http://www.opc.ncep.noaa.gov/gis/index.php or here https://earthdata.nasa.gov/earth-
observation-data/near-real-time/rapid-response/modis-subsets.
This function is helpful to compare a grib with a prevision made by a real meteorologist.
Opening a weather image
Opening a weather image is made through the menu “Grib->Weather image->Open a weather image”.

56
Placing a non geo-referenced weather image on the map.
Once a file has been chosen, it is useless to capture coordinates, since it is possible to manipulate the
image directly on the screen with mouse or fingers. Make sure the option “Lock image on map” is
unchecked to allow that.
qtVlm also accepts URLs directly instead of a file name. In this case the image will be downloaded each
time the Ok button is pressed.
Using mouse and the 4 corners, and the transparency slider at the top of the image, position the image
where it belongs, with the help of coast lines for instance.
When the image has been correctly positioned and resized, choose the final opacity and lock it back in
the configuration dialog.
When this image will need to be updated, qtVlm will remember the position and size of this particular
slot (up to 8).
57
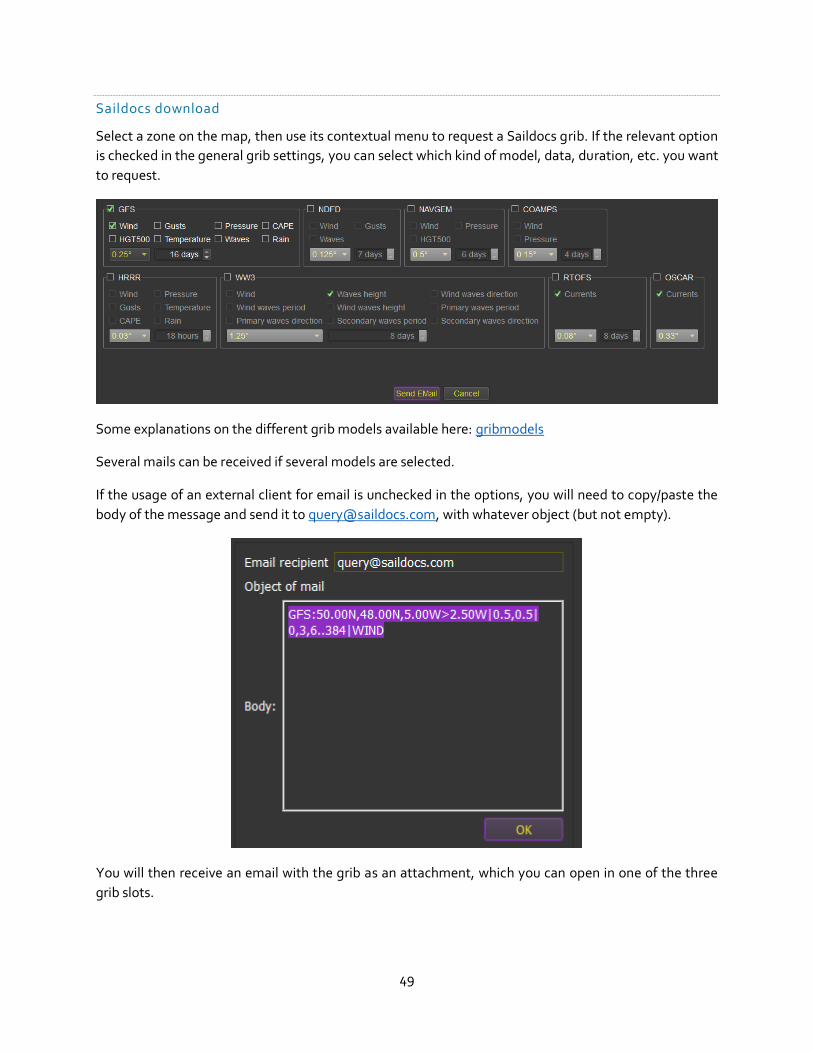
Displaying KML and KMZ geo-referenced images
Similarly, you can specify images files with a kml or kmz extension (can be an url as well, in which case
qtVlm will download the file each time Ok button is pressed). These files are already georeferenced, so
they will be placed and re-projected on the map automatically. On Android and iOS qtVlm is registered
for opening these types of file automatically.

58
Simulation Mode
Thanks to a collaboration with sinagot.net, qtVlm offers a Simulation Mode which allows to simulate
navigation together with real AIS targets, received via Internet. This mode can be activated with the
menu “Boat->Navigation simulation mode”.
In this mode, qtVlm sends your virtual position to sinagot.net server, and receives back all AIS targets
that are in a 30NM range, plus all other qtVlm boat if any. qtVlm simulation boats will appear in blue. The
boat is helmed through a virtual rudder located under the microboard, the boat’s speed being calculated
based on polar and gribs data. Winds and Currents are taken into consideration.
Collisions with land and AIS targets are detected, in which case the penalty is that the simulation stops.
It is also possible to drop the anchor, if the boat is within 500 meters from a coast. Collisions with AIS
targets continue to be detected even at anchor.
In boat’s settings, a parameter allows for randomizing wind data from grib.

59
Start Line Mode
This mode is activated through “Boat” menu. It displays a chronometer with two configurable tops,
“Preparation” and “Attention”.
The chronometer can be move anywhere on the screen, unless the general boat option “Lock
instruments on screen” is checked.
You must select 2 POIs to represent the start line. Please note that “Committee” POI is always considered
to be on the right side of the line.
You can choose to materialize crossing points on the line. A red dot will show the closest point of the line,
and a yellow dot will represent the crossing point of the line at current boat speed and heading. The times
to reach these points will be shown in the chronometer.
Currents are taken into consideration. All time calculations are made related to the boat’s bow, as defined
in boat’s settings.
You can also ‘top” the buoy and committee positions, meaning that the current boat position will be used.

60
If you choose to display the Safe Area, you will get 2 zones on the start line. The red one represents the
area where the line is reachable in time with a port tack, and the green one with a starboard tack.
The 2 zones will be continuously reducing, until the chronometer reaches zero.
Wind and Currents used for the calculations are taken from boat instruments if available. Otherwise grib
data will be used, at the boat’s position.
Note that you can also choose to show laylines at Committee and/or buoy.
The best side for starting will be indicated by the color of the Committee or Buoy label, which will become
green in case it is favored. Some more information is available in the object’s tooltip concerning favored
side calculations.
61
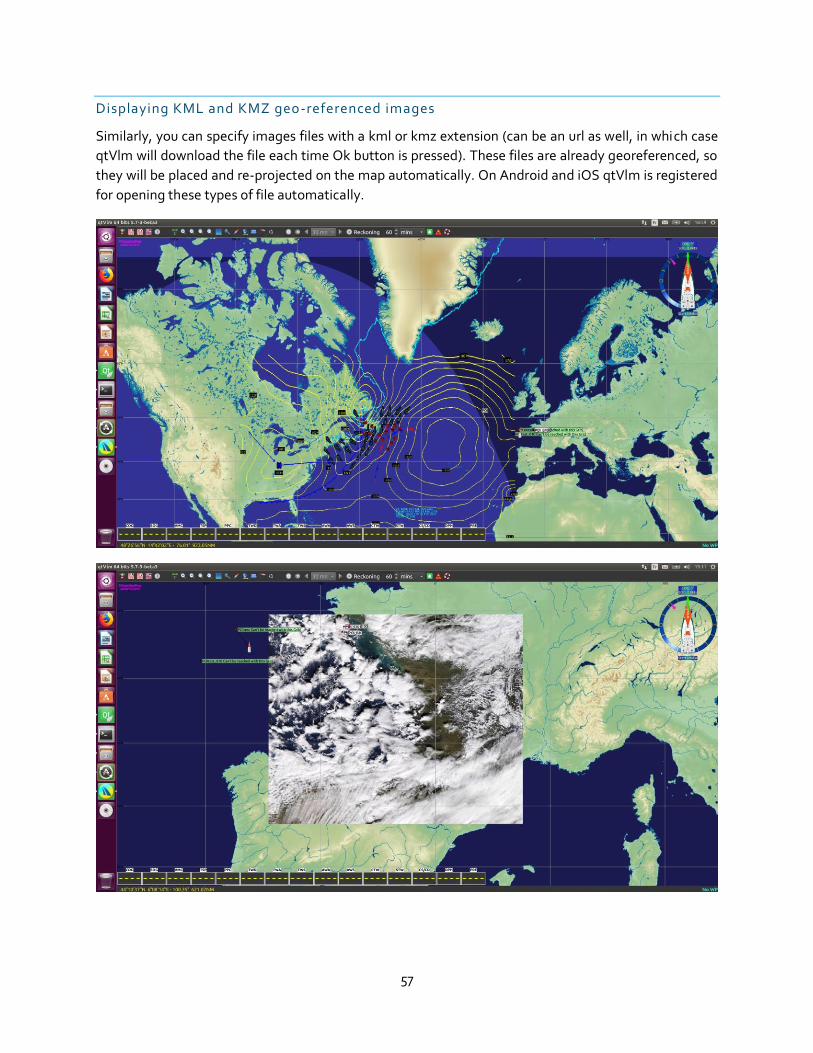
Maps
Maps Configuration
These screens, available through the menu “qtVlm->Configuration”, allow to choose which type of maps
is displayed, and manages various options for each type.

62
The toolbar also has 3 icons dedicated to maps. The lighthouse icon switches from gshhs maps and online
maps, and the three next icons are used to activate additional maps (Rasters, S57 and mbtiles).
On iOS, several methods are available to transfer maps:
1. You can transfer them in a zip file or individual maps via Airdrop if you have a Mac.
2. You can transfer them via iTunes share folder. Just copy the zip or the maps inside the folder and
launch qtVlm, or if it is already launched just run qtVlm->import from iTunes folder.
3. You can send the maps or the zip file with an email and open the attachments with qtVlm
4. You can also export data from a qtVlm PC installation and import it on iOS, by placing the zip
containing all exported data in iTunes share folder.

63
Offline Maps
Mbtiles maps
These maps are files with a “.mbtiles” extension that must be copied in qtVlm (configurable) mbtiles
folder. They contain tiles, that can be displayed offline without any internet connection.
Mbtiles can also be generated with tools like SASPlanet, Maperitive, Mapbox, etc.
Several folders can be used to store mbtiles charts.
It is also possible to manage, and preview installed mbtiles, via the menu “View->mbtiles catalog”.
Note that toolbar’s mbtiles icon has 3 states: on, locked, off. When in locked mode the current tile level
is locked so you can continue zooming/un-zooming without changing the level of details. If you zoom or
pan the map once while in locked mode, next click on the button will just unlock the level.

64
Visit My Harbour Charts
These charts can be acquired here: Visit My Harbour website
They can be installed from a dongle (Windows only), or from a DVD, or as a downloaded zip file. These
files (.vmh and .hdx extensions), must be copied in one of the mbtiles dedicated folders. Activation of
these charts is made through “VMH Activation” button, an unlock code will be requested.
For more information about transferring files on Android and iOS, see the chapter File management on
mobile versions.
Charts delivered on dongle do not need activation. A dongle can be used on several Windows
machines. Dongles can be used only with Windows PCs.
Activation codes can be used only once and are therefore linked to a specific machine. It is not
possible to use Visit My Harbour charts on a virtual machine.
Please check Visit My Harbour website for complete details about their products and licenses.

65
GSHHS Maps
Gshhs maps consists in coasts lines at different qualities and scales. qtVlm cannot run without them.
Several parameters are available in the settings, like showing country names, towns, borders and rivers.
Land and sea color, coast lines width are configurable too. The location of the maps can be changed, for
instance on Android to move them on an external memory card.

66
Online Maps
Online maps need an internet connection for the tiles to be downloaded. A cache system avoids to
download tiles each time they are displayed. Several kinds of this maps can be displayed.
The location of the cache together with its maximum size can be configured.
VLM tiles
VLM tiles are based on the same maps as gshhs, but are coming as tiles from VLM server. Rendering is a
bit faster than local gshhs, and they also have some coloration for relief.
67
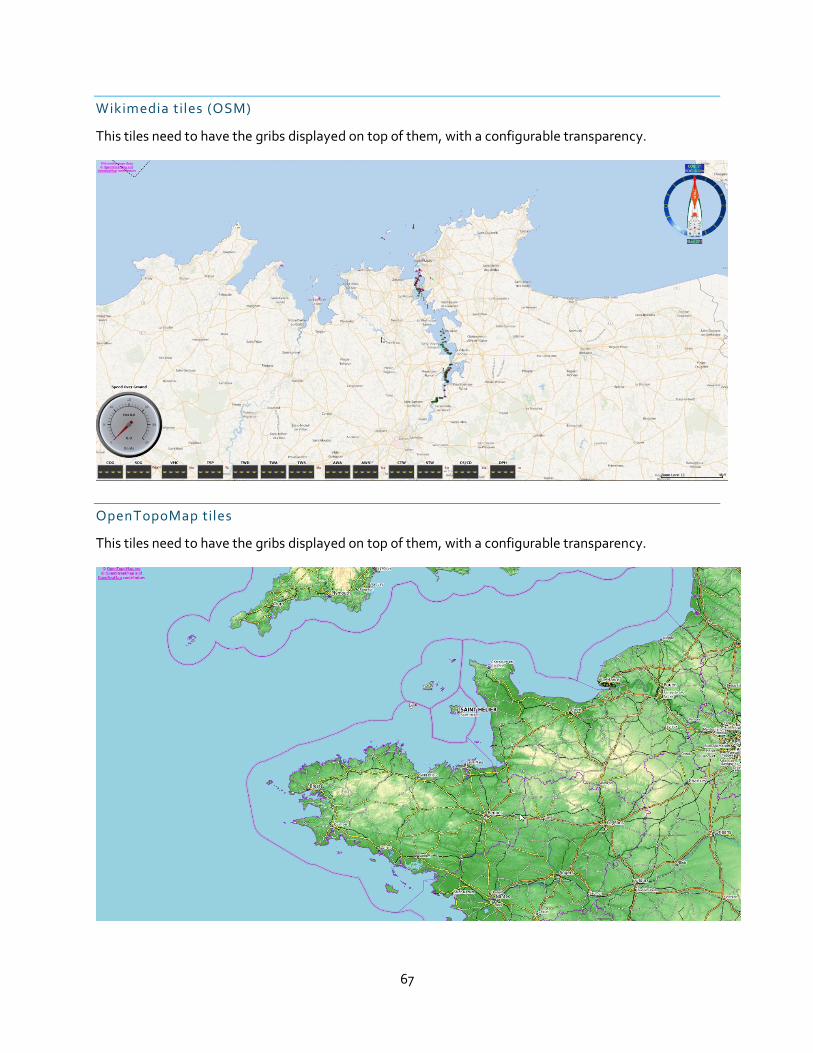
Wikimedia tiles (OSM)
This tiles need to have the gribs displayed on top of them, with a configurable transparency.
OpenTopoMap tiles
This tiles need to have the gribs displayed on top of them, with a configurable transparency.

68
OpenStreetMap tiles
These tiles are available only on mobiles versions (Android and iOS). The sea is transparent and therefore
the grib can be displayed “under” them.
OpenSeaMap tiles
These tiles can be displayed over any other types of maps. They contain only sea objects like buoys,
lighthouses, etc.

69
Raster and Vector Maps
Rasters are offline maps, which need to be installed (i.e. copied) in qtVlm kaps or mbtiles folders. If both
maps are displayed, an option is available to decide which map is displayed over the other, in case both
are available for the same area.
Rasters maps
These maps are georeferenced images, such as kap, geotiff, geojpeg, etc, and must be placed in qtVlm
kaps folder (location can be configured in the parameters). A single raster can be displayed (menu “View-
>Single raster map”), or qtVlm will automatically choose which raster’s to displayed, according to zoom
level and resolution. The number of raster’s to be displayed simultaneously in quilting mode is
configurable (a too big number can slow down the application). On iOS these kind of maps can be
imported through iTunes, Airdrop, etc.
There is also a command to automatically fix headers, in some cases these is useful to fix wrong
metadata.

70
Vector maps
These charts are available for free for some countries like United States, or are sold by various official
sites like SHOM for France.
Like Rasters maps, they must be placed in the relevant, configurable qtVlm folder.
Many display options are available:
Lights sectors can be amplified, by hovering on them:

71
S57 objects can also be queried, through the map contextual menu:

72
NMEA Connections
Configuration
This configuration screen is available via menu “qtVlm->Configuration” and allows to configure NMEA
connections. Using several connections simultaneously is allowed.
Serial connections are not available on Android and iOS. Depending on operating system, internal GPS
connections might also be impossible.
“Internal GPS only” means that qtVlm should not use internet-based localization systems, but only real
GPS fix.
Please note that a GPS-USB on Windows must be configured through a serial port after installation of
the relevant GPS-USB driver. On Windows 10 and MacOS, it might be possible to connect to a GPS-USB
directly using internal connection.
The position accuracy can be materialized on the map (as a circle), for internal connections only for the
time being.
You can specify a server IP address for UDP incoming connections. This address is used only in case of
Multicasting, and therefore the default value (0.0.0.0, meaning any IPV4) should be used in most cases.
You can also indicate “Any”, which stands for any IP addresses (IPV4 and IPV6).
The output channel is used to send current WP information to a navigation system. It can also be used to
send performance data to NKE instruments. There is also an option for retransmitting all NMEA data on
a port. Since version 5.5.3 a second UDP port is available for output.
73
Note that if “retransmit all is checked”, qtVlm will resend all NMEA messages on these port, without any
filtering. If this option is used for instance on a mobile phone using internal GPS, qtVlm will generate the
equivalent NMEA sentences, and therefore this option permits to use the internal Android or iOS GPS on
a PC.
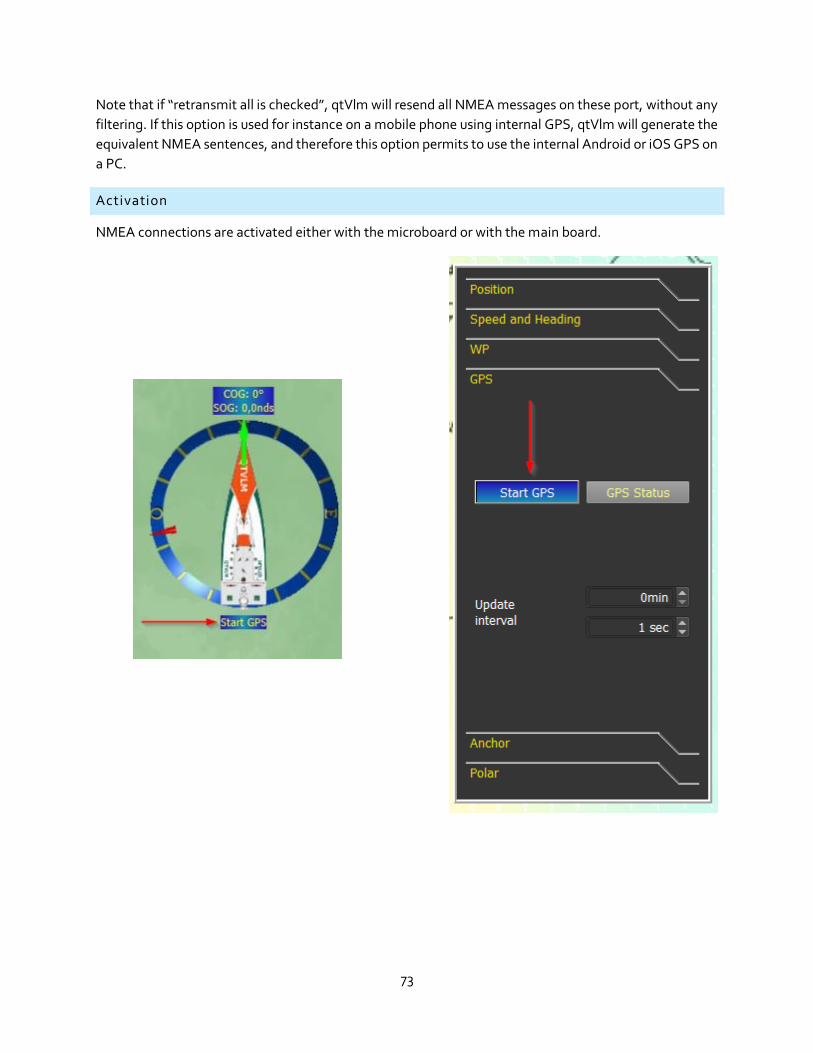
Activation
NMEA connections are activated either with the microboard or with the main board.

74
The frequency at which qtVlm will update data coming from NMEA connections is configurable in the
main board. Especially on Android and iOS, a too small value can have a huge impact on battery
consumption.
When a position has been found (fix), buttons turn green. If no position has been found yet, buttons are
colored in red.

75
AIS Module
Configuration
Many options are available to tune AIS module.
The first option filters out targets based on their distance to boat. This is especially useful when receiving
targets from internet (for instance from GPSD sinagot.net port 2947 or 2948) where the number of
targets can increase to 15,000.
It is also possible to filter out targets based on their types, or to display only targets belonging to fleet.
Options controlling CPA (Closest Point of Approach) and TCPA (time to CPA) allows to configure alarms
(sound and/or visual). Real boat sizes can be used for these calculations. These calculations can be
deactivated completely.
The list of all AIS targets can be obtained through the “display” menu. From this list, it is possible to
display/hide tracks or tracking info, to add remove a target from the fleet, or to center the map on a
target. It is also possible to manage the fleet members, even if their MMSI are not listed.

76
Usage
Target details
Targets have a tooltip information, which summarize main information concerning it. They also have a
contextual menu allowing to display more details. Their color indicates their status (green if all details
have been received, yellow otherwise), or if the target is generating a CPA alarm (red in that case). Lost
targets, i.e. targets that didn’t emit anything during a configurable time, are displayed in grey. They are
deleted after 3 times this time.
It is also possible to search and display this target on Marine Traffic (internet connection required).
Other options manage trace’s display and reckoning.
You can also add or remove this target from the fleet. In this case the target will appear a bit darker on
the map. You can also decide to display only targets belonging to fleet.
You can also display additional tracking data in the target label:

77
Alarms, CPA, TCPA
Depending on parameters, AIS module will generate sound and visual alarms. A target generating a CPA
alert turns red with a flashing dot. A sound (configurable) is also played. A sound alarm can be deactivated
for a specific target, temporarily or forever.
If the sound alarm is deactivated, the visual signal becomes blue. This allows to find which targets are still
generating a sound alarm, since they are still red.
Real boat size can be taken into consideration in CPA calculations, if the distance to the boat is less than
a configurable value. Your own boat size has to be defined in your boat settings (menu “Boat->Boat
Settings”). Boats are drawn in real size if the zoom level is big enough.

78
Instruments and Board
Instruments Configuration
Instruments selection is made through the menu “qtVlm->Configuration”, boat and instruments tab.
Instruments can also be shown/hidden via the toolbar icon .
Each instrument is made of a digital display plus a dial and eventually a histogram. The dial is
displayed/hidden by pressing shortly on the digital display, and the histogram by a long press. Dials and
histograms position and size can be adjusted with mouse drag (plus <shift> key for the size). Once dials
and histograms are correctly positioned and sized, you can lock them on the screen via the options, to
avoid moving them by mistake.
For technical reasons, histograms are not available on Linux 32 bits version.

79
It is possible to smooth data received for wind speed and direction, and boat speed and direction. The
value indicates the number of last received data that should be averaged. As these data are used in all
calculations, it allows to carefully tune the sensibility of instruments, for instance Polar Efficiency
Percentage (PPC). The default value (1) means not smoothing.
You can also ask qtVlm to send performances sentences on NMEA output port, to be displayed on NKE
or Raymarine instruments. These data consist in: theoretical polar speed, opposite track heading with
the same TWA, target speeds for CMG and VMG, optimum polar angles for upwind and downwind, and
currents direction and speed calculated by qtVlm (based on COG, SOG, CTW, STW).
You can also configure qtVlm so it will send KND messages, which can be received by a KND application
via UDP (for instance Expedition Wear for Android Watch, or iDataNet for iOS).

80
Available Instruments
COG: Course Over ground
This instrument displays Course Over Ground, plus heading/distance to WP (in blue).
SOG: Speed Over Ground
This instrument displays Speed Over Ground. The maximum speed reached is also displayed.

81
VMC: Velocity Made Course
This instrument shows Velocity Made Course, also called VMG toward waypoint.
TSP: Target Speed
This instrument expresses the speed (SOG) in percentage of optimum speed as given by the polar to
reach the WP. For instance, for a WP upwind, too much speed means you must luff a bit, while a
percentage lower than 100% means you must ease a bit. This information is often more efficient than
VMC for the helmsman.

82
PPC: Polar Percent
This instrument shows the difference between actual speed and theoretical polar speed, as a percentage
and as values. It is also possible to send this data through the NMEA output port in order to display it on
NKE or Raymarine instruments.
TWD: True Wind Direction
This instrument shows True Wind Direction. If NMEA data do not provide it and if it is possible, qtVlm will
calculate it based on COG, SOG and apparent wind data. The arrow’s color changes with wind speed, and
boat orientation is drawn on background.
Histogram associated with TWD consists in the deviation from the period mean value, which allows you
to know if the wind is heading or lifting.

83
TWA: True Wind Angle
This instrument shows True Wind Angle. If NMEA data do not provide it and if it is possible, qtVlm will
calculate it based on COG, SOG and apparent wind data. The value and the arrow is green when TWA is
inside the polar VMG limits, red otherwise. The digital display also shows a red or green dot, depending
on the tack. The red parts on the dial represent the polar VMG limits, and are recomputed dynamically.
TWS: True Wind Speed
This instrument displays True Wind Speed. If NMEA data do not provide it and if it is possible, qtVlm will
calculate it based on COG, SOG and apparent wind data.
84
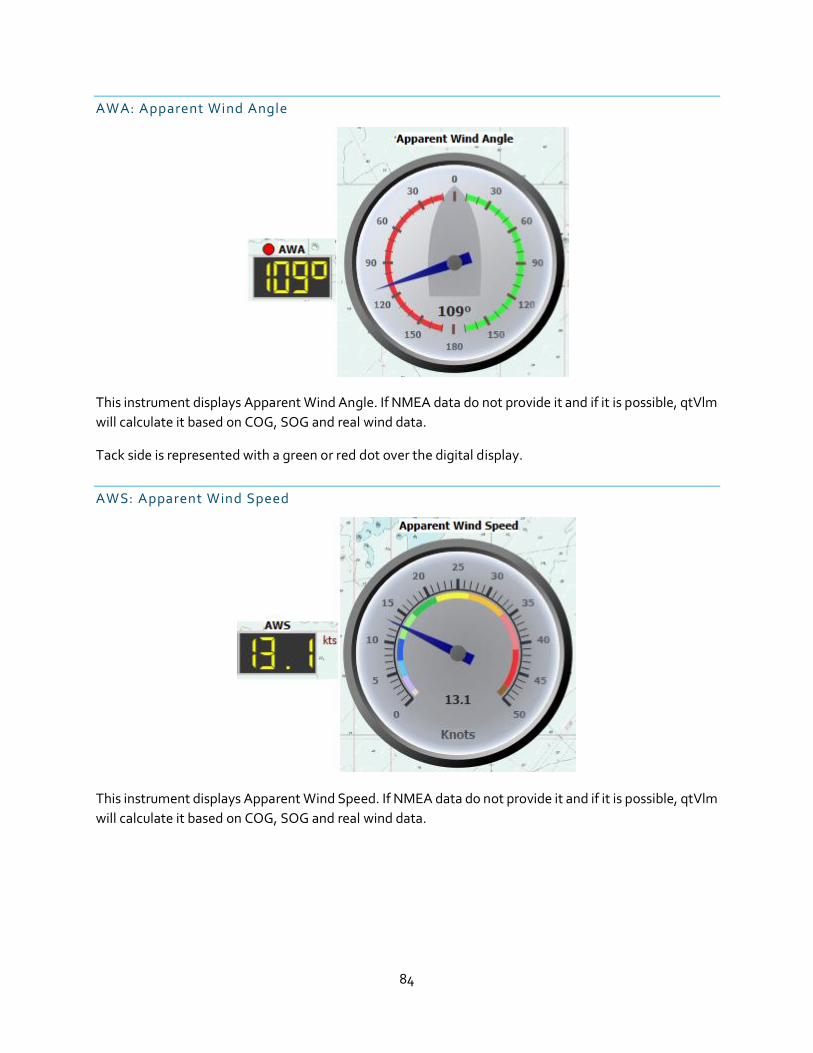
AWA: Apparent Wind Angle
This instrument displays Apparent Wind Angle. If NMEA data do not provide it and if it is possible, qtVlm
will calculate it based on COG, SOG and real wind data.
Tack side is represented with a green or red dot over the digital display.
AWS: Apparent Wind Speed
This instrument displays Apparent Wind Speed. If NMEA data do not provide it and if it is possible, qtVlm
will calculate it based on COG, SOG and real wind data.

85
CTW: Course Through Water
This instrument shows Course Through Water. It is different from COG in case of Currents, for instance.
It also displays heading/distance toward current waypoint (in blue).
STW: Speed Through Water
This instrument shows Speed Through Water. It is different from SOG in case of Currents, for instance. It
also displays the maximum value measured.

86
CS/CD: Currents Speed and Direction
Currents Speed and Direction are either received from NMEA input, or calculated by qtVlm from COG,
SOG, CTW and STW. Please note that Currents direction indicates where the Currents goes, contrary to
Winds for which direction indicates where wind come from.
The boat orientation is drawn on the background of the dial.
DPH: Depth
This instrument displays depth as received from NMEA data. This instrument has no dial, but historical
data can be displayed through its histogram.

87
PRE: Atmospheric Pressure
This instrument displays pressure as received from NMEA data or internal sensor. This instrument has no
dial, but historical data can be displayed through its histogram.

88
Boards
Microboard
The main board is shown or hidden by pressing on the boat image in the microboard, or in the main board
itself. Since 5.7.2 this instrument is less useful, and therefore can be hidden (from main configuration).
Main Dashboard
Position tab
This tab shows boat’s geographical coordinates. It also allows to move the
boat to a precise position by pressing “position” button. You can also reset
the boat’s trace from here. Button “?” can be used to export coordinates,
course and speed in Geodata format. Clicking on the boat image will close
the main dashboard.

89
Speed and Heading tab
This tab shows boat’s speed and heading.
WP tab
This tab shows active WP information. You can also decide to send these
data to NMEA output. DNM (Distance to Next Mark) is displayed, as well
as NDNM (Next Distance to Next Mark), i.e. the distance between active
WP and next mark, if active WP belongs to an active route or an active
pathway.
If active WP belongs to an active route or an active pathway then some
other information is displayed, related to next mark rounding. These
data can be computed based on active route and grib data, or based on
wind data as reported by instruments.
Note that next TWA is red if wind is port side, and green if starboard.

90
GPS tab
This tab shows and commands GPS activation. See NMEA connections
documentation for more info.
Anchor tab
This manages Anchor Alarm.
Anchor is also moveable with
mouse.
Alarm will ring whenever the
boat’s distance to the anchor is
larger than the one configured.
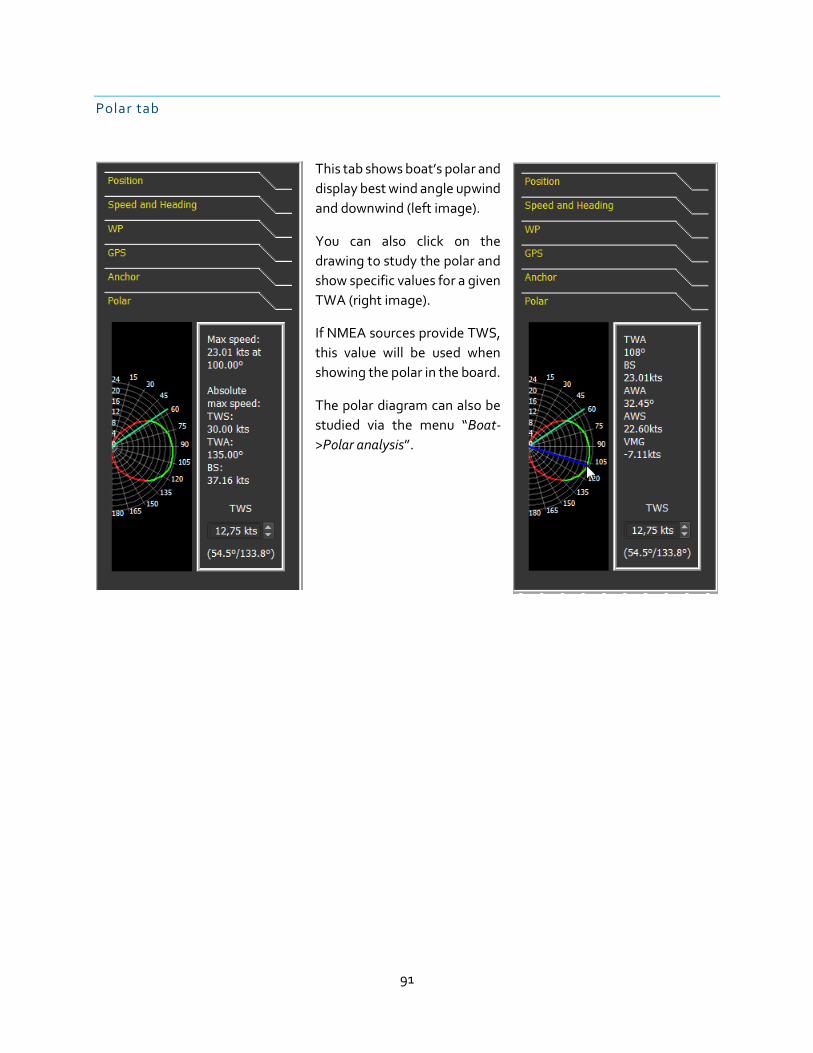
91
Polar tab
This tab shows boat’s polar and
display best wind angle upwind
and downwind (left image).
You can also click on the
drawing to study the polar and
show specific values for a given
TWA (right image).
If NMEA sources provide TWS,
this value will be used when
showing the polar in the board.
The polar diagram can also be
studied via the menu “Boat-
>Polar analysis”.

92
Weather Routing Module
Introduction
qtVlm uses isochrons method to calculate routings. This method consists in calculating all possible boat
positions from a point, using grib data and polar, for a given time (step), and then to re-iterate this
calculation until the arrival point is reached.
To generate a routing, qtVlm uses boat’s polar (eventually adjusted by a performance coefficient), and
gribs data Winds, Currents, CAPE and Waves.
qtVlm has many functions concerning weather routing: pivot point, engine on or off, best starting date
calculation (multi-routing), alteration of gribs data (what-if scenario), as well as many parameters to tune
calculation precision versus calculation speed, depending of the machine.
Weather Routing creation
Creating a weather routing can be made either via a POI contextual menu, or via a right-click somewhere
on the map (for mobiles versions Android and iOS via the pinpoint ), or via the menu “Routings-
>Create a routing”.
You can in most cases run the routing with default options. Press the OK button, and qtVlm will calculate
the best route toward the selected arrival point.

93
Once the calculation has completed, you can convert this routing in a route, via “Routing->Edit a routing”,
or via the routing contextual menu.
If this option is checked before the calculation is launched, the conversion in route will take place
immediately.

94
Converting a Weather Routing into a Route
If you change the default starting date of the routing, or didn’t start the routing from the boat, you need
to select “from routing start”.
Conversion process also proposes to automatically simplify/optimize the resulting route. Simplification
process will remove all useless points (for instance aligned points). Simplification can be optimum (i.e. it
will keep more points), or maximum (which means that the process will try harder to remove points).
At the end of simplification, an optimization phase will be proposed. The process will try to adjust POIs
positions between the isochrons, to optimize the final ETA.
These two phases are by no mean compulsory, but in general it gives better result, by mixing isochrons
method with other calculation algorithms.
Conversion to route may produce “red” POIs. These POIs are non simplifiable, because routing module
has detected that they are important to avoid coasts or barriers.
See Routes Module for more details on routes.

95
Multi-points routing
A multi-points routing will follow a pathway, i.e. will route from one point to another until the end of the
pathway. A pathway can optionally be closed.
A POI can belong to several pathways:

96
Pathway starting options are carried over to the routing (starting point and dates).
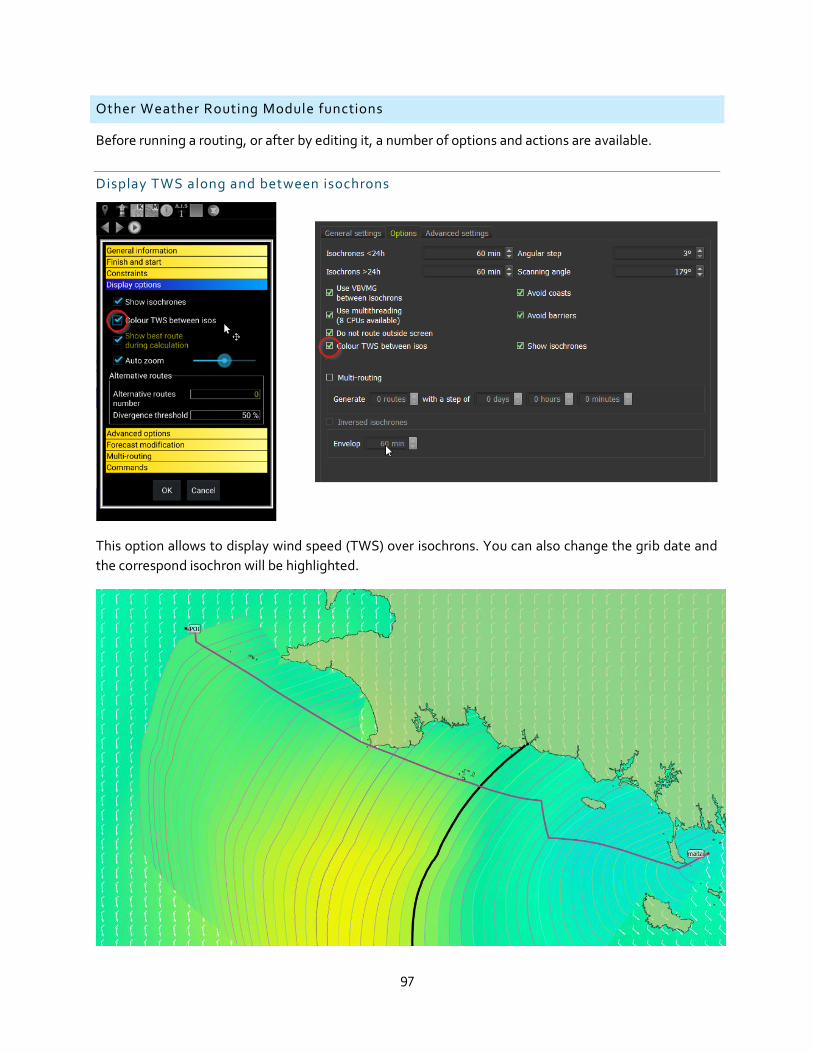
97
Other Weather Routing Module functions
Before running a routing, or after by editing it, a number of options and actions are available.
Display TWS along and between isochrons
This option allows to display wind speed (TWS) over isochrons. You can also change the grib date and
the correspond isochron will be highlighted.

98
Displaying alternative routes
You can request the routing to find and display alternatives to the main route. This is managed in the
routing editor where you can specify a number of alternative routes and with which difference threshold
(i.e. they must be completely different at least for the first half if the threshold is set to 50%).
White routes are alternatives to the main green route.

99
Finding the best starting date: multi -routing
It is common to search for the best starting date and time to reach a destination, based on various criteria
like for instance duration, weather conditions during sailing, time with engine, number of tacks and gybes,
rain, etc.
The multi-routing function allows to generate several routings at fix time interval, and then to load them
in a Route Comparator to compare them based on many criteria.
Since version 5.5.3, it is also possible to request a multi-routing by varying polar efficiency, or
applying corrections to wind TWS.
Generated routes are then loaded in the route comparator. Data can be exported in CSV format, to be
studied in spreadsheet.
Data provided for comparison are:
ETA, duration, sailed distance, average, maximum and minimum BS, average, maximum and minimum
TWS, number of tacks and gybes, beating, upwind and downwind time, engine time, night time, rain,
maximum CAPE, and maximum waves height.

100
Calculating and understanding inversed isochrons
This function calculates inversed isochrons, i.e. it starts from arrival point and date and calculates from
where it could have come to be there, and starts again until it reaches starting point. This calculation
allows to determine an envelope where regular and inversed isochrons are crossing. This envelop shows
where the passage would be equivalent. A thin envelope is a clear sign that there is uncertainty in the
routing because the passage found might well disappear on the next grib update.
On this image, envelope is regular and large enough. The
routing is probably stable and reliable.

101
Placing and utilizing pivot points
Pivots points are placed on isochrons, at isopoints. Their function is to force the routing to pass by this
point, or even to restart from this point and continue routing using another destination. You can chain as
many pivots as you want. Pivots points are inserted by pressing on the isochrons and calling their
contextual menu.
« Create a pivot point » will simply restart the routing there, continuing toward the same arrival. « Edit a
pivot point » allows to edit the routing before, essentially to change arrival point. This function is useful
to force passage points, or even to manage U-turns.

102
Other options and advanced options
Weather Routing Module allows you to choose automatic settings, depending on your machine resources
and power. The slider automatically tunes calculation speed versus calculation precision.
If you uncheck “Automatic Parameters”, you can modify manually various options.
• Isochrons parameters: you can define duration, time step and angle step. Duration can be
different for the first and last 24h, where normally there are more obstacles to deal with.

103
• Crossed sea polar efficiency: By default, this parameter takes the value entered in the boat
parameters. You can override it.
• VBVMG between isochrons: qtVlm uses a formula based on VMGs to calculate route from one
isopoint to another. If you uncheck this option qtVlm will user another, simpler formula. This is
intended to be used with some Virtual Sailing simulators.
• Use multithreading: Uses all CPUs for calculations. Some machines do not support that well (XP
for instance), and need to have this option deactivated.
• Do not route outside screen: qtVlm detects only visible coasts, so if you allow it to route outside
the current view it might not detect crossing coasts. In some rare cases it might be useful to
deactivate this parameter.
• Avoid coasts, avoid barriers: These options can be deactivated, resulting in a much faster
calculation. Note that since version 5.3.12, it is also possible to specify a minimum distance to
coastlines.

104
• Circumvent angle: this option can be useful when the destination is completely obfuscated by an
obstacle and the boat is too close from it for the routing to find a solution. In that case you can
help it by specifying a deviation angle for the few first isochrons.
• Orthodromic routing: heading to destination is calculated with orthodromic formula, loxodromic
otherwise.
• Forecast modifications: gribs data can be altered to follow some “what-if” conditions, like
changes wind speed or shifting grib time.
• Maximum and minimum winds: You can ask routing module to avoid areas with too strong or too
weak winds.
• Maximum waves height: You can ask routing module to avoid areas with waves height over a
value.
• Maximum CAPE: You can also ask routing module to avoid areas based on a maximum CAPE
value.
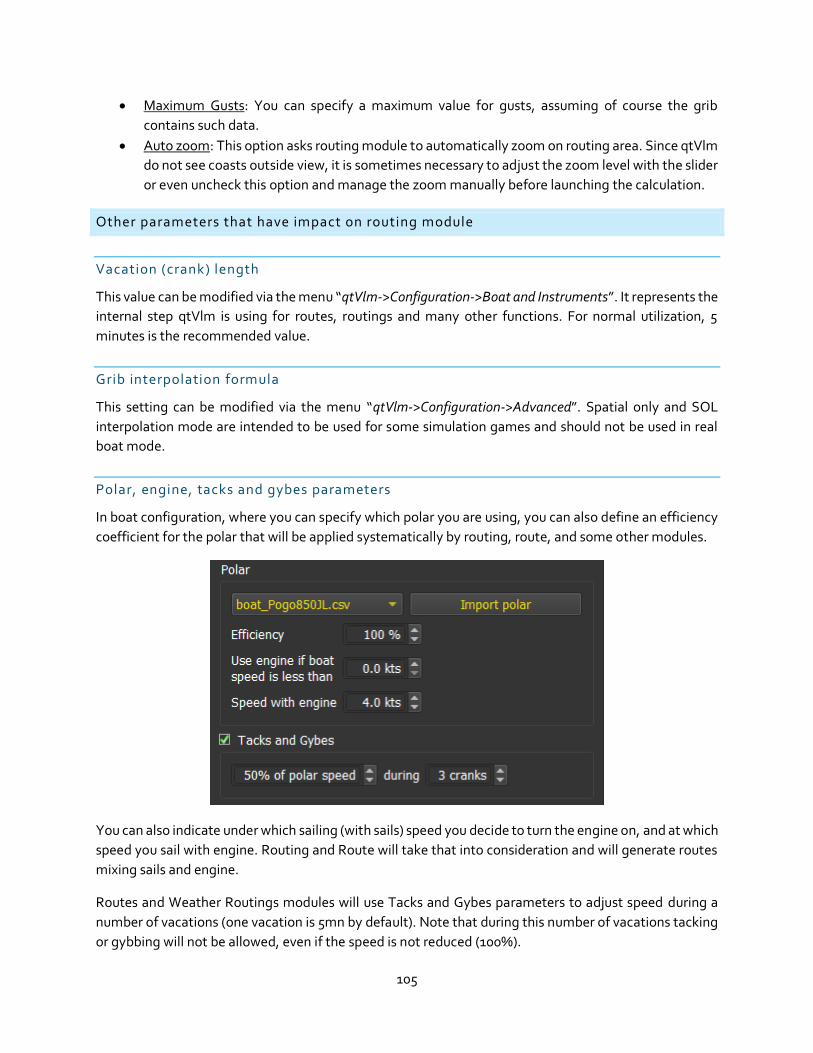
105
• Maximum Gusts: You can specify a maximum value for gusts, assuming of course the grib
contains such data.
• Auto zoom: This option asks routing module to automatically zoom on routing area. Since qtVlm
do not see coasts outside view, it is sometimes necessary to adjust the zoom level with the slider
or even uncheck this option and manage the zoom manually before launching the calculation.
Other parameters that have impact on routing module
Vacation (crank) length
This value can be modified via the menu “qtVlm->Configuration->Boat and Instruments”. It represents the
internal step qtVlm is using for routes, routings and many other functions. For normal utilization, 5
minutes is the recommended value.
Grib interpolation formula
This setting can be modified via the menu “qtVlm->Configuration->Advanced”. Spatial only and SOL
interpolation mode are intended to be used for some simulation games and should not be used in real
boat mode.
Polar, engine, tacks and gybes parameters
In boat configuration, where you can specify which polar you are using, you can also define an efficiency
coefficient for the polar that will be applied systematically by routing, route, and some other modules.
You can also indicate under which sailing (with sails) speed you decide to turn the engine on, and at which
speed you sail with engine. Routing and Route will take that into consideration and will generate routes
mixing sails and engine.
Routes and Weather Routings modules will use Tacks and Gybes parameters to adjust speed during a
number of vacations (one vacation is 5mn by default). Note that during this number of vacations tacking
or gybbing will not be allowed, even if the speed is not reduced (100%).
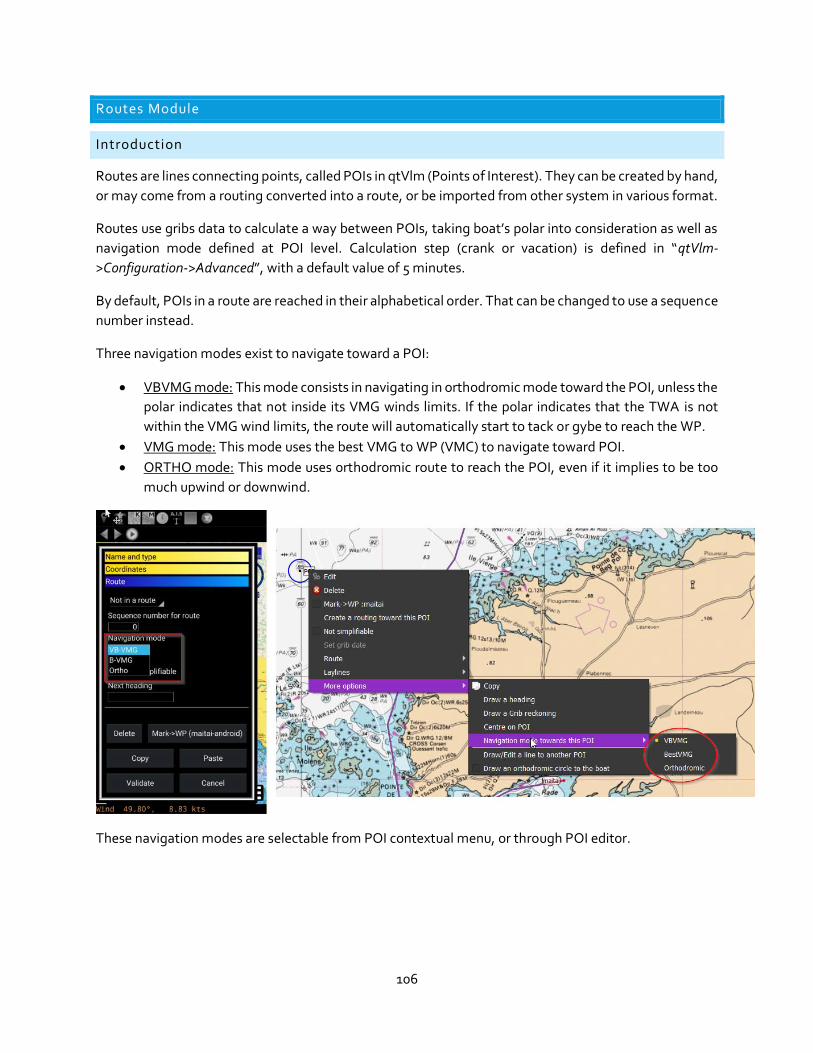
106
Routes Module
Introduction
Routes are lines connecting points, called POIs in qtVlm (Points of Interest). They can be created by hand,
or may come from a routing converted into a route, or be imported from other system in various format.
Routes use gribs data to calculate a way between POIs, taking boat’s polar into consideration as well as
navigation mode defined at POI level. Calculation step (crank or vacation) is defined in “qtVlm-
>Configuration->Advanced”, with a default value of 5 minutes.
By default, POIs in a route are reached in their alphabetical order. That can be changed to use a sequence
number instead.
Three navigation modes exist to navigate toward a POI:
• VBVMG mode: This mode consists in navigating in orthodromic mode toward the POI, unless the
polar indicates that not inside its VMG winds limits. If the polar indicates that the TWA is not
within the VMG wind limits, the route will automatically start to tack or gybe to reach the WP.
• VMG mode: This mode uses the best VMG to WP (VMC) to navigate toward POI.
• ORTHO mode: This mode uses orthodromic route to reach the POI, even if it implies to be too
much upwind or downwind.
These navigation modes are selectable from POI contextual menu, or through POI editor.

107
Creating or editing a route
Creating a route is done via the menu “Routes->Create a route”, or if the route already exists edition is
done via the menu “Routes->Edit a route”, or via its contextual menu.
Several options are available, including most important starting point and starting date. You can also
choose to show or not intermediate POIs, or to detect collision with land and barriers. You can alter grib
data from grib, and play with polar efficiency individually for this route.
A route can be defined as a pathway. In this case, it will appear with dashed lines and it can be used for
multi-points weather routings.
If the route has been created manually, then you need to assign manually some POIs to it. This is made
through the edition of POI, or via their contextual menu.

108
Converting a routing into a route
At the end of a routing calculation, it is possible to convert it into a route (see Weather Routing Module
documentation).
Some POIs will appear in red. These POI are non-simplifiable points, generated by routing, and that
cannot be removed or moved because they are useful to avoid coats or barriers.
It is always needed to manage these points by hand (move or remove or add new), mainly because coasts
lines used by qtVlm are not precise enough.
Coasts or barriers collisions
If the relevant option is checked, route will detect if it crosses a coast line or a barrier. If this is the case,
that particular part of the route will turn red.

109
Simplification/Optimization
A route can be simplified and/or optimized. Simplification has two modes: optimum and maximum.
Optimum mode will keep more points and will get better ETA, while maximum mode will keep only the
strictly necessary points and remove all others. These functions can be called either from the route editor
or from the route contextual menu.
These processes do not try to avoid coasts or barriers, so it is often necessary to flag some POIs as non-
simplifiable to make sure the simplified/optimized route is not crossing a coast line or a barrier. Routing
Module places this points automatically when converting to route.
If an area is selected on the map, only the part of the route inside that area will be simplified/optimized.
Add/remove POIs to route
You can add or remove POIs from a route through its editor, or via its contextual menu.
A POI can also be added where you want by right-clicking the route and selecting New mark. A POI will
be inserted on the route at the mouse (or finger) position.

110
Moving POIs belonging to a route
POIs belonging to a route are move the same way as normal POIs. When a blue circle appears on the POI
after clicking on it, the POI becomes moveable and can be moved with mouse or finger.
Displaying Wind Arrows on POIs
It is also possible to display icons next to POIs, representing the wind at the time of passage. The icons
also show if it will be during day or night.

111
Boat position extrapolation
A big dot appears on the route when the grib date is moved forward. This corresponds to the position of
the boat at that date. It can also be seen when animating gribs.
This also allows to compare boat’s position on several routes.
The route’s tooltip displays all weather information available at passage time
The yellow information is the wind data corrected with the difference between actual measured
wind from instruments and grib wind at current boat position.

112
Route logbook
The route’s logbook is available in the editor screen. It contains many information, that can be exported
in CSV format. The button can be used to configure which columns are displayed or hidden.
Warning: Winds information at route level includes wind generated by Currents, if this data is available
in gribs. As a consequence, wind data in route’s log might differ from pure wind grib data.
It is also possible to export this in a CSV file, to be treated in a spreadsheet calculator.
The last tab “Statistics” contains the following statistical data about the route:

113
Activating a route
Routes can be activated, in which case the first POI will become the active WP. Once the POI is reached
(i.e. the boat is within a configurable distance from the POI), the point is removed from the route and the
next POI is activated.

114
Routes comparator
Via menu “Routes->Routes comparator”, you can compare routes based on many criteria.
Exporting and importing routes
Routes can be imported and exported in a variety of format, kml and gpx being the most common ones.
Imported routes are automatically frozen to keep their original data concerning ETA. You can uncheck
this option later in the route’s editor.
General parameters and custom fields
General configuration screen has a Route tab, which allows you to define most default values for routes.

115
Route Custom Fields
You can define up to three custom fields for routes. These values will be evaluated at each route’s step,
and will be visible in route’s logbook, route’s statistics and route’s tooltip. They are calculated based on
a formula defined by the user, which is in fact a Javascript code. It can use the following variables:
ETA (current timestamp), LON/LAT (boat’s Longitude/Latitude), CTW (Course through Water), STW
(Speed through Water), COG (Course over Ground), SOG (Speed over Ground), TWD (True Wind
Direction), TWS (True Wind Direction), TWA (True Wind Angle), AWS (Apparent Wind Speed), AWA
(Apparent Wind Angle), CS (Currents Speed), CD (Currents Direction), DNM (Distance to Next Mark),
CNM (Course to Next Mark), ENG (engine on), Gust (Gust Speed), DAYL (Day Light), CLOUD (% of cloud
cover), AIRT (Air Temperature), PREC (precipitations), Cape (Cape), WMH (Max Waves Height), WMD
(Max Waves Direction), WCH (Combined Waves Direction), LDIS (Distance travelled during this step),
PLON/PLAT (Longitude/Latitude of active POI).
In addition, it is possible to use a polar file to generate a value based (interpolated) on couple (TWS, TWA).
If this option is activated, then the variable name will be CPOL.
PERM_1, PERM_2, and PERM_3 are “permanent” variables which you can use to store values from
previous steps.
The 3 fields need a name, a short name, units and eventually a way to accumulate them (“Sum”,
“Average”, “Integration” or “Last Value”). The short name is used in the formula.

116
It is possible to calculate many things that way. For instance, let’s imagine you want to calculate current
produced by a wind turbine:
var myAWS = AWS * 0.514444; //knots to m/s if(AWS > 30.0)
myAWS = 20.0 * 0.514444; var S = 1.0; // surface var rendement = 0.2; // rendement var P = 0.0; if(AWS > 6.0 && AWS < 40.0)
P = 0.37 * rendement * S * Math.pow(myAWS, 3); //puissance instan-
tanée P = P / 12.0 // Ampere AMP = P;
The fist field is a bit special: it can also carry its history, defined as a Java array. For instance, if your first
field is called “MFIELD”, you have access to its previous value through the array “PREV_MFIELD”. Let’s
imagine you want to count the number to tacks and gybes. You need to define 2 fields, let’s call them
LTWA and VIRS, then a script that will look like this:
LTWA = TWA; var pTWA = 0.0; var nb = PREV_LTWA.length; if (nb > 0)
pTWA = PREV_LTWA[nb - 1]; VIRS = 0.0; if (pTWA * TWA < 0)
VIRS = 1.0;
By defining accumulation of “VIRS” to be “by total”, you will get the number to tacks/gybes.
The same result can be achieved more efficiently by using one of the “permanent” variable:
VIRS = 0.0; if(PERM_1 * TWA < 0)
VIRS = 1.0; PERM_1 = TWA
You can also define functions, use while/for loops etc. For instance, a function:
function myPow3(i){return Math.pow(i, 3);}
Values calculated like that are shown in route’s logbook, route’s statistics and route’s tooltip.

117
Pathways module
A pathway is a list of POIs that represents for instance marks to be reached in order.

118
A pathway can be used to generate a routing, in which case the routing will reach each point in order. A
pathway can also be activated, meaning that qtVlm will declare the first POI as the active WP, and that
when the boat will enter be inside the arrival circle as defined in this POI, will automatically switch to the
next POI.

119
POIs and Barriers
POIs (Points of Interests)
Introduction
POIs are points (Points of Interest) placed on the map. They can belong to a route or a pathway, be used
as starting or arrival points for a routing, be declared as active WP, etc.
POI creation and edition
POI editor is called via its contextual menu.
Coordinates can be input in both formats.
There are 3 types of POIs: classical, Mark or Beacon. The only difference being their color on the map.
It is possible to copy/paste a POI.
Creating a POI can also be done via right-click menu somewhere on the map (or with the pinpoint for
mobile versions).
Moving a POI can be done with mouse or finger. On PC versions, if you press SHIFT before releasing the
POI, it will come back to its initial position.

120
Mark menu
Mark menu proposes various action concerning POIs
POIs can be imported from other sources, like Geodata or from a gpx file.
POI contextual menu
Most actions related to POIs are available in its contextual menu. For action “draw a heading” or “draw a
grib reckoning” see chapter concerning qtVlm environment, for Route sub-menu see chapter concerning
Routes module.
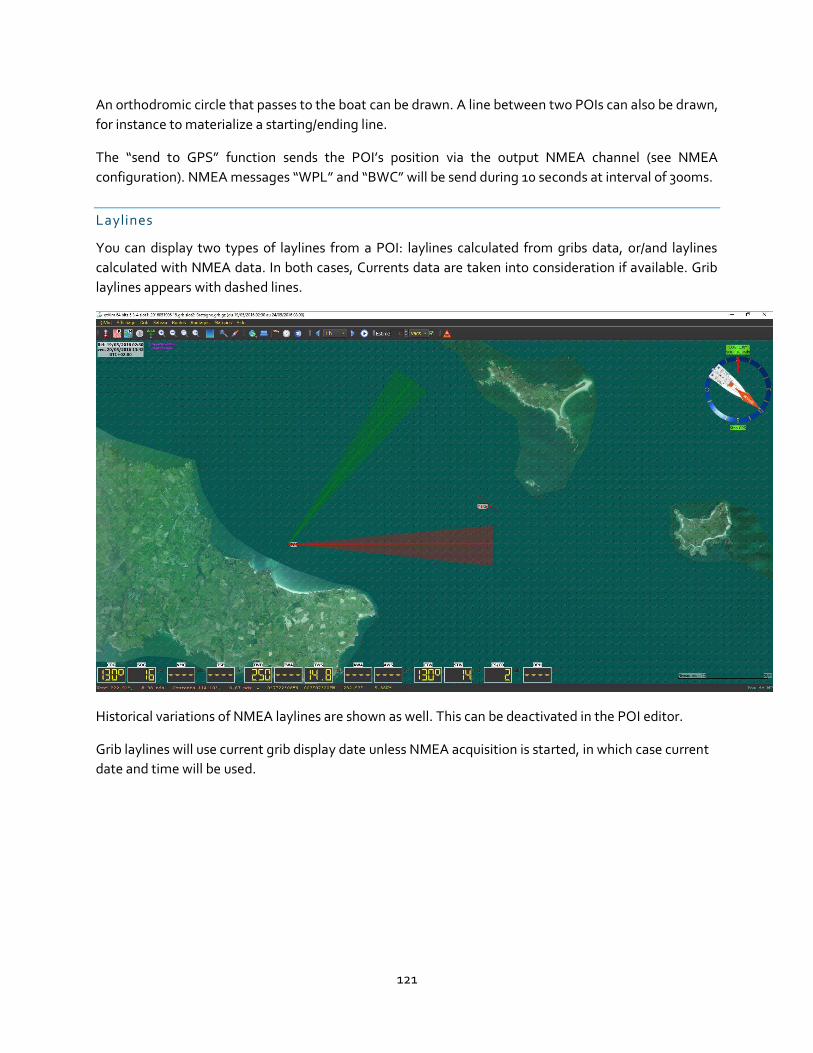
121
An orthodromic circle that passes to the boat can be drawn. A line between two POIs can also be drawn,
for instance to materialize a starting/ending line.
The “send to GPS” function sends the POI’s position via the output NMEA channel (see NMEA
configuration). NMEA messages “WPL” and “BWC” will be send during 10 seconds at interval of 300ms.
Laylines
You can display two types of laylines from a POI: laylines calculated from gribs data, or/and laylines
calculated with NMEA data. In both cases, Currents data are taken into consideration if available. Grib
laylines appears with dashed lines.
Historical variations of NMEA laylines are shown as well. This can be deactivated in the POI editor.
Grib laylines will use current grib display date unless NMEA acquisition is started, in which case current
date and time will be used.

122
Barriers
Barriers management is done via the menu “Barrriers”.
Barriers are positioned with mouse or finger. Once placed you can move points, add/remove points, close
the barrier, etc.
Barriers are used by Weather Routing Module and Routes Module. They can be used to force a passage,
to defined a No Sailing Zone, etc.
They can be locked on the screen, to avoid moving them by mistake while moving the map.

123
Tutorial Videos
Several video tutorials have been realized, many thanks to ChrisCata. It’s in French only (sorry) and you
can find them here: Video qtVlm (in French)