DOCUMENT RESUME TM 004 313 Russell, Nolan F. · DOCUMENT RESUME ED 103 468 TM 004 313 AUTHOR...
69
DOCUMENT RESUME ED 103 468 TM 004 313 AUTHOR Russell, Nolan F. TITLE Getting Inside the EQA Inventory: Grade 8. INSTITU7ION Pennsylvania State Dept. of Education, Harrisburg. Bureau of Planning and Evaluation. PUB DATE 74 NOTE 69p. EDRS PRICE HF-$0.76 HC-$3.32 PLUS POSTAGE DESCRIPTORS Adjustment (to Environment) ; Basic Skills; Confidentiality; Creativity; *Educational Assessment; *Educational Objectives; Ethical Values; Grade 8; Health; Junior High Schools; *Measurement Techniques; Scoring; Self Esteem; *State Programs; State Surveys; Student Attitudes; *Testing; Test Reliability; Test Validity IDENTIFIERS *Educational Quality Assessment; Pennsylvania ABSTRACT Although it is difficult both to determine educational goals and to measure goal attainaent, the Educational Quality Assessment Inventory (EQII) has ambitiously tackled both problems. During a five-year period 45 separate instruments containing over 2000 items were constructed, revised, rejected, and accepted in preparation for the present inventory. This inventory has scales which independently measure different facets of educational goals including basic skill achievement, social and health habits, feelings toward self and others, value placed on learning and human accomplishsent, interest in creative activities, and methods of coping with freedom. The battery of tests was administered to 253,226 students attending 240 commonwealth intermediate schools. Though individual names were erased prior to test scoring information necessary to identify general student groups was obtained through questions of sex, ability level, and father occupation. Answers were scored by both norm- referenced and criterion-referenced methods. Selection of these complementary scoring methods enhance the concept that result accountability goes beyond the school. Recognition of many experiences shaping the educational progress of an individual, however, does not detract from efforts to restructure school programs in hopes of goal attainment. (BJG)
Transcript of DOCUMENT RESUME TM 004 313 Russell, Nolan F. · DOCUMENT RESUME ED 103 468 TM 004 313 AUTHOR...

DOCUMENT RESUME
ED 103 468 TM 004 313
AUTHOR Russell, Nolan F.TITLE Getting Inside the EQA Inventory: Grade 8.INSTITU7ION Pennsylvania State Dept. of Education, Harrisburg.
Bureau of Planning and Evaluation.PUB DATE 74NOTE 69p.
EDRS PRICE HF-$0.76 HC-$3.32 PLUS POSTAGEDESCRIPTORS Adjustment (to Environment) ; Basic Skills;
Confidentiality; Creativity; *Educational Assessment;*Educational Objectives; Ethical Values; Grade 8;Health; Junior High Schools; *Measurement Techniques;Scoring; Self Esteem; *State Programs; State Surveys;Student Attitudes; *Testing; Test Reliability; TestValidity
IDENTIFIERS *Educational Quality Assessment; Pennsylvania
ABSTRACTAlthough it is difficult both to determine
educational goals and to measure goal attainaent, the EducationalQuality Assessment Inventory (EQII) has ambitiously tackled bothproblems. During a five-year period 45 separate instrumentscontaining over 2000 items were constructed, revised, rejected, andaccepted in preparation for the present inventory. This inventory hasscales which independently measure different facets of educationalgoals including basic skill achievement, social and health habits,feelings toward self and others, value placed on learning and humanaccomplishsent, interest in creative activities, and methods ofcoping with freedom. The battery of tests was administered to 253,226students attending 240 commonwealth intermediate schools. Thoughindividual names were erased prior to test scoring informationnecessary to identify general student groups was obtained throughquestions of sex, ability level, and father occupation. Answers werescored by both norm- referenced and criterion-referenced methods.Selection of these complementary scoring methods enhance the conceptthat result accountability goes beyond the school. Recognition ofmany experiences shaping the educational progress of an individual,however, does not detract from efforts to restructure school programsin hopes of goal attainment. (BJG)

a
11.44111111.
rimarogrgi Desmosin I Irinsion 1$74
Ammi-ARAI.
11.1
U DEPARTMENT P NEALTN,EDUCATION **WARENATIONAL INStITUIEOP
EDUCATIONTHIS DOCUMENT MA S BEEN R.; PRODUCED EXACTLY AS RECEIVED FROMTetEr PERSON OR ORGAN iiA T ION DR tGINATAG tT POINTS Of S'tf. A OR OPINIONS
0E1300 NOT Ni 1ISAli Y fir PRE
SENT OIl CIAi NA WAAL 'STU1 E 01EDUCATION PchitION ON Policy
SCOPE OF INTEREST NOTICE
The ERIC Facility has etNIPTedthis document for wootsvngto.
/II our ludgerneot, tha documentdello of unwell to the during.houses noted to the right. Index.
should rent their specialpoints of Wes%
,
dJ. 'ON
A INA,
ONIP
,
4
4 k
,..-
A ,-..,, ,,,,,,,,,.s., 4 F I... -,.,..... .,:zi..... ..:..,..,
' 'QM.; t' iA
04n*
'14-44`4-r.
n it-`
. 2
7'7)1
,ft.rre7 ;Ti.

BEST COPY AVAILABLE
Grade 8
Ge -ngInside
the EQAI--- vPrepared byNolan F. RussellEducational Research AssociateDivision of Educational Quality AssessmentBureau of Planning and EvaluationPennsylvania Department of Education1974

Commonwealth of PennsylvaniaMilton J. Stepp, Governor
Department of EducationJohn C. Pittenger, Secretary
(Mice of Basic EducationDonald M. Carroll, Jr., CommissionerHarry K. Gerlach, Deputy Convnissioner
Bureau of Planning and EvaluationJohn L. Kennedy, Director
Division of Educational Quality AssessmentT homes E . K endig, Chief
Pennsylvania Department of EducationBox 911
Harrisburg, Pa. 17126
4

TABLE OF CONTENTS
Getting Acquainted
Questions and Answers about EQA Inventory
Section One. Goal and Measurement Rationale
Goal I
Goal 11
Goal III
Gail IV
Goal V
Goal VI
Goal VII
Goal VIII
Goal IX
Goal X
Self-Esteem
Tolerance Toward Others
Basic Skills
Interest in School and Learning
Ciazenship
Health Habits
Creative Activities
Vocational Knowledge
Appreciation of Human Accomplishments
Coping with Change
Section Two. Measuremen. Safeguards
Section Three. Validity of Goal Instruments
Section Four. Target Groups for Program Focus
1
1
3
7
9
13
IS
17
19
23
27
29
31
33
37
49
71

GETTING ACQUAINTED
The Intermediate Form of the Educational Quality Assessment Inventory (EQA1) forgrade 8 is an assessment device designed to give Commonwealth educators meaningful, reliable,and accurate information about their students' development in each of the 10 state adopted qualityeducation goals. The EQAI can be characterized as a collection of highly structured,paper -and- pencil measurement scales. These scales represent an attempt to appraise various aspectsof cognitive and human interaction skills together with those attitudes, values, and beliefs thoughtimportant in helping our young people adjust to the demands of today's society and tomorrow'sworld.
Is this a complex task? Yes. Can it be done in such a way as to provide reasonablyaccurate information? We believe so. However, big words and fancy phrases don't get the jobdone.
To insure that the scales included in the EQAI could provide relevant information,the Department of Education maintained the stance of testing the tests before using them totest people. After completing the tasks of operationally defining each goal area and developingmeasurement rationales consistent with these definitions, the department went to the field.
During a five-year period (1969-1974) approxim itely 45 separate instruments containingover 2,000 items were constructed, revised, rejected or accepted on the basis of countless pilot-testsin over 175 Pennsylvania school districts.
This booklet describes in detail those scales that survived the logical and statistical checksand remain in the final form of the EQAI. Aspects of the descriptions are necessarily statisticaland are couched in the language of the test and measurement field. Because the informationcontained in the publication is equally relevant to school personnel and research scientists, wehave made a concerted effort to include explanations of the logic behind the various analyticalmethods used to determine the adequacy and the efficiency of the tests.

QUESTIONS AND ANSWERS
ABOUT EQA INVENTORY
Who takes the test battery?
The Intermediate Form of the EQA Inventory is designed specifically for 8th gradestudents in Commonwealth public schools who have a reading comprehension equal to or greaterthan the average Sth grader. Research indicates that the tests are adequate for students withless reading skill (to grade 3.5) if the tests are read to them. The tests are not recommendedfor special education students.
How long is the inventory?
Eleven separate tests containing a total of 422 items make up the bulk of the battery.Twelve additional questions obtain student background information including occupation of fatheror legal guardian, education of mother, sex, size and type of community, stability of residence,etc. Finally 13 questions measure student perception of parental attitude toward the schooland home climate. The total battery is typically completed in four sessions of one hour each.
What kinds of tests are in the inventory?
Three multiple-choice instruments tap cognitive skill, achievement and awareness in theareas of verbal analogies, mathematics and vocations respectively. The math and verbal tests aretimed. The remaining eight are self-report attitude and interest scales asking students to respondto statements on various continuums such as agree-disagree, true of menot true of me, yes-no,etc.
What do the tests cover?
Each scale is designed to measure some facet of one state quality education goal. Alongwith basic skills the various instruments examine 1) social and health habits, 2) feelings towardself and others, 3) value placed on learning and human accomplishments, 4) interest in creativeactivities and 5) methods of coping with frustration.
Do the tests completely cover each goal?
No. The goals are very broad statements organizing many related concepts under oneumbrella. An inventory of 5,000 items probably could not measure the goals in their entirety.Strong efforts have been made to sample some of the most salient facets of each goal. SectionOne in this book describes in detail which aspects of the goals are measured.
What types of scoring procedures are used?
For the achievement tests simply the number of correct answers is counted. The attitudescales are scored in two ways. First, each set of response options is given a weighting consistentwith its corresponding item's direction (i.e. I like school; strongly agree = 3, agree = 2, disagree= 1, and strongly disagree = 0). Item scores are then summed to form a composite score. Thisis called norm-referenced scoring. The second procedure classifies options into categories offavorable and nonfavorable. In the above example the strongly agree and agree choices are givena score of one while disagree and strongly disagree are given a score of zero. Students choosingfavorable responses on a simple majority of scale items meet the criterion of minimum positiveattitude. This technique is called criterion-referenced scoring.
3

Can the tests be used to pinpoint specific student-body strengths and weaknesses?
Yes. With the exception of the basic skills instruments, all questionnaires are brokeninto smaller components called subscales. The inventory's 26 subscales give more specificinformation than can be provided by the composite scores alone. For example, the GoalV-- Citizenship instrumentoffers additional scores in the areas of 1) concern for the welfare anddignity of others, 2) respect for law and authority and 3) personal responsibility and integrity.Section One contains descriptions of all subscales.
Are the tests reliable?
Extensive investigation concerning the consistency . student responses within each scale(internal consistency) and the stability of student responses to the scales over time (test-retestreliability) have been conducted by Division of Educational Quality Assessment personnel. Alltotal scales demonstrate high internal consistency reliability and adequate stability. Some of theshorter subscales, however, demonstrate weak internal consistency reliability. Reliability statisticsfor all subscales and total instruments are presented in Section Two.
Do students fake their answers?
MI self-report questionnaires are susceptible to this sort of response bias. During fieldtrials correlations were computed between test scores and a special instrument called the socialdesirability scale which is designed to pick up the tendency to make oneself look good. Wherelarge correlations were found, the tests were revised or dropped. Correlations between lie andtotal instrument scores are presented in Section Two.
Are the tests valid?
Correspondence between ratings made by teachers and the student scores i:ss beendemonstrated for six of the attitude scales. Results for a group of studies conducted by theDivision of Research coupled with outcomes form a factor-analysis lend further validity support.Findings relating to test validity are presented in Section Three.
How much does testing climate affect final outcomes on the tests?
A 1971 study involving 91 schools showed that the emotional climate (student eagerness,concentration and carefulness) became poorer as the testing session progressed. Correlationsbetween emotional climate and instrument scores, although slightly positive, were not statisticallysignificant. Also schools experiencing adverse testing conditions in terms of settings, distractions,etc. were not found to score lower than schools with no testing distractions on any of the scales.
Are individual student profiles provided?
No. The unit of analysis of all data received from the Educational Quality AssessmentProgram is the school. No individual student profiles are given. In fact, student names are removedfrom the answer booklets before being scored as a means of insuring confidentiality of studentanswers.
Do the tests identify target groups for program focus?
Yes. Even though individual records are unavailable, it is possible to organize data tohelp identify general student groups having difficulty in a goal area. This is done by summarizingdata for various subgroups of students formed from selected student characteristics. The threestudent characteristics in these analyses are ability level, sex and father's occupation. SectionFour shows the proportion of students in each of 18 subgroups who demonstrate positive attitudeson all goal instruments except basic skills and vocational awareness.
48

Is the EQA Inventory the only source of information for the Educational Quality AssessmentProgram?
No. In addition to the student questionnaires, there is a survey for teachers and anotherfor school administrators. The results of these surveys are combined to generate a report foreach participating school. For a complete description of the contents of these surveys refer toManual for Interpreting School Reports.
What kinds of information does the inventory provide?
Information includes 1) student-body standing on each composite goal test relative toa statewide reference group, 2) student-body standing relative to groups similar in home andschool environments, and 3) proportion of student-body who demonstrate minimum positiveattitudes.
Are teachers held accountable for poor test scores?
No. The Educational Quality Assessment Program uses three separate assessmentinventories to examine student goal achievement at grades 5, 8 and 11. Students at other gradelevels do not take the tests. Test outcomes are not solely a result of what teachers at thosethree levels are or are not doing. Student attitudes and achievements are a complex productof the total home, school and community experience. Accountability only comes into play interms of taking quality assessment results into consideration when trying to meet the needs ofstudents.
Does the Department of Education offer any help in identifying and implementing curricularstrategies that might increase student goal achievement?
Curriculum specialists are investigating new curricular approaches and related literaturein the hope of offering interested Pennsylvania schools help to meet student goal needs. As thesematerials become finalized they are being made available to school districts.
Is there any indication that schools can improve student attitudes by implementing programs?
Yes. Several programs developed by school districts have already yielded measurableimprovements on the EQA Inventory scales. The most recent example involves a large districtin western Pennsylvania that under an ESEA Title III grant implemented curricular changes whichresulted in an increase in their student-body's interest in learning. Specific information aboutthis project is available at the offices of the Division of Educational Quality Assessment uponrequest.
What information is eon tallied in this booklet?
Section One discusses the 10 quality education goals and the measurement devicesassociated with each. Included in thh section are goal and measurement rationales, scale andsubbcale descriptions, and specifications for scoring. Section Two describes the safeguards usedto produce tests of high quality and describes how the EQAI tests fare on these checks. Thethird section surveys the results of validity studies including teacher ratings, factor analysis andindependently conducted studies. Section Four identifies potential student target groups forprogram focus.

Are there any additional statistical summaries on the tests which are not contained in this booklet?
Yes. This booklet highlights only the major empirical data that are available on theEQA Inventory. Additional materials include item frequency distributions, per cent favorablentsponses to each item, item -to -total correlations, a complete factor analysis with orthogonalrotations of 2 through 10 factors and various other descriptive statistics including skewness,kurtosis, means, standard deviations and standard errors of measurement for each sub and totalscale. These are in computervrintout form and may be seen at the offices of the Division ofEducational Quality Assessment in Harrisburg.
6
10

EMU bk9Goal

BEST COP! AVAILABLEwisp
1W GOT NOMIN 011 /WM14 WON/7W.)LOOK AT Me! PULL...,PU14, HAMM Z
5°6
GOAL I Self-EsteemQuality education should help every child acquire the greatest possible understanding of himselfor herself and appreciation of his or her worthiness as a member of society.
GOAL RATIONALE
It is widely held that self-understanding is significantly associated with personalsatisfaction and effective functioning. How students view their adequacies and inadequacies, theirvalues and desires, can strongly influence their performance in school.
No matter what the level and pattern of students' talents, the school experience shouldstrengthen, not damage, their self-esteem. School should operate so that children of all talentlevels can appreciate their worth as persons in a society that claims to be equally concernedfor all its members.
MEASUREMENT RATIONALE
Self-esteem is a personal judgment of worthiness. It is a subjective experience whichthe individual conveys to others verbally or by other behavior. Most theories acknowledge thatour self-image and feelings of worthiness are determined largely by how well we can live upto our own aspirations and meet expectations of others.
Aspirations become closely associated with personal goal-setting behavior originating inour internalized system of values. Expectations are external in nature and are related to goalsset collectively by society or by significant individuals in our lives. Assessment in this area isbased on four components believed to be related to the development of positive self-esteem.
The first his to do with locus of control whether one views personal success asdependent upon one's own efforts or external influences. Externally controlled individuals willtend to be more dependent on others and more willing to ride with the tide, accepting docilelythings which happen to them. Internal individuals will more actively attempt to control self-destiny.
The second related concept is self-confidence the feeling of self-worth and the beliefthat one is capable of handling things successfully. Those who lack self-confidence are oftencharacterized as being timid, cautious, submissive individuals who feel inadequate, fearful, inferiorand expect to be unsuccessful in dealing with new situations.
The third component is Image in school settings. Those having favorable self-imagesare likely to experience subjective success with schoolwork, feel that they are favorably viewedand understood by teachers and enjoy class participation.
9 12

The final dimension considers how students feel about the quality of their relationshipswith others. Individuals who have difficulty in interpersonal relations will tend to believe thatothers have little confidence in or low regard for them.
GENERAL SCALE DESCRIPTION
The self-esteem scale is comprised of 40 short, self-description statements. Twenty-oneare positively wordeddescribing the student in a favorable light and 19 are negatively wordedcharacterizing the student in a negative vein.
Sample positively worded item: I'm easy to get along with.
Sample negatively worded item: Things are all mixed up in my l(fe.Response options available to the students are (I) very true of me, (2) mostly true of me, (3)mostly t itrue of me and (4) very untrue of me.
The items within the scale are grouped to yield four subscale scores in addition toa total scale score.
Subscale 1:
Subscale 2:
Self-conftdenci: contains 10 items measuring feelings of success, self-determination,attractiveness and self-worth. Sample item: I'm pretty sure of myself.
Feelings of control over environment contains 13 items tapping belief that successin school and work depend on effort, not luck. Sample item: My getting goodgrades In school depends more on how the teacher feels about me than on howwell I can do my work.
Subscale 3: Relationships with others contains 10 items assessing the student's perceived easein making and keeping friends and the student's feelings of acceptance by others.Sample item: I often feel picked on by other kids.
Subscale 4: Sep' -image In school comprises 10 items designed to measure feelings of successin school work, class recitation and teacher relationships. Sample item: In class,I often feel 'put down' by teachers.
NORM-REFERENCED SCORING
For norm-referenced scoring the item weighting scheme used is:
Response Choices
Item Very True Mostly True Mostly Untrue Very UntrueDirection of Me of Me of Me of Me
Positive 3 2 0
Negative 0 1 2 3
476Ate rGrarValea result of extensive revision of the Goal I instrument which was usedfor grades S and 11% Richard L. Kohr and Nolan F. Russell from the Division of EducationalQuality Assessment were responsible for the revisions.

CRITERION - REVERENCED SCORING
Responses are considered favorable if they reflect a positive self-hinge. An individual'sscore on a given scale (total or subscale) is the percentage of items to which a favorable responsewas given. For the self-esteem instrument the scoring scheme applied to the items is:
Response Choices
Item Very True Mostly True Mostly Untrue Very UntrueDirection of Me of Me of Me of Me
Positive 1 1 0 0
Negative 0 0 1 1

GOAL II Tolerance Toward OthersQuality education should help every child acquire understanding and appreciation of personsbelonging to other social, cultural and ethnic groups.
GOAL RATIONALE
Students fulfilling the requirements of Goal 'II will more likely enjoy easy interactionwith all people speaking to and selecting as friends students of different origins and beliefs.They will be more willing to actively seek information or participation in activities which willincrease their knowledge about different cultures and social settings.
The school experiences should help students learn to respect and interact easily withchildren who differ from them in various aspects (e.g., skin color, cultural traditions, economicstatus, religious beliefs, physical abilities, manner of speech and degree of intellectual competence).
MEASUREMENT RATIONALE
The processes and determinants of interpersonal interaction are complex, involving amyriad of perceptual, feeling and behavior responses.
The notion of tolerance toward others has meant different things to various theorists.Some define tolerance in terms of the social distance individuals keep between themselves anddiffering others. Others use tolerance to describe the tendency of individuals to prejudge or acttoward differing others solely on the basis of the differing others' group membership.
The assessment of this goal area is based on still another component of tolerance. Thiscomponent is the degree of comfort felt by individuals when in contact with differing others.
GENERAL SCALE DESCRIPTION
Items describe situations where differing others interact with the individual. Differencesare in terms of racial, religious and social background or physical and mental attributes.Twenty-nine items suggest an approach toward the student, e.g., A cripple wantsyou to become a close friend. Six items suggest an avoidance of the student, e.g., A girl witha bad limp avoids you because she thinks you might make Jim of her. Response choices areI would feel (1) very comfortable, (2) comfortable, (3) slightly uncomfortable and (4) veryuncomfortable.
The tolerance toward others instrument was developed by Eugene W. SldffIngton and Nolan F.Russell from the Division of Educational Quality Assessment and Peggy L Stank and TomMcGinnis from the Division of Research.
13
15

The items within the scale are grouped to yield five =Wale scores in addition to atotal scale score. Assignment to subscales is based upon the characteristic of the hypotheticaltarget person that makes that person different from the respondent. The five subscales are race,religion, socioeconomic status, intelligence and handicap. All subscales contain seven items.
NORM-REFERENCED SCORING
For norm-referenced scoring, the item weighting scheme is:
ItemDirection
VeryComfortable
Response Options
SlightlyComfortable Uncomfortable
VeyUncomfortable
Positive
Negative
3
0
2
1
1
2
0
3
CRITERION-REFERENCED SCORING
Responses are considered favorable if they reflect comfort when interacting withfdifferingothers or discomfort when being shunned by differing others. An individual's score-on a givenscale (total or subscale) is the percentage of items to which a favorable response was given. Forthe tolerance toward others instrument the scoring scheme for items is:
Response Options
Item Very Slightly VeryDirection Comfortable Comfortable Uncomfortable Uncomfortable
Positive 1
Negative 0
1
0
0 0
1

BEST COP1 AVAILABLE
GOAL Ill Basic SkillsQuality education should help every child acquire, to the fullest possible extent, mastery ofthe basic skills in the use of words and numbers.
GOAL RATIONALE
Mastery of the basic skills in the use of words and numbers is ftmdamental toachievement in all academic areas. Basic skills include the ability to get ideas through readingand listening, to handle mathematical operations, to reason logically and to respect evidence.The level of performance that can be reasonably expected in each of these areas will vary fromschool to school. However, it is of profound importance that the level of expectation in basicskills for any group of pupils shall not be underestimated or regarded as fixed.
MEASUREMENT RATIONALE
In 1969 when Pennsylvania's Educational Quality Assessment Program centered on 5thand 11th grade students, schools could select either of two standardized achievement batteriesfor measurement in this goal area. It quickly became apparent that the use of these tests increasedthe length of the testing time so as to cause great difficulty in scheduling and completing theentire questionnaire.
Therefore, the use of achievement batteries was discontinued and shorter verbal andmath scales developed by Educational Testing Service which were group reliable were substituted.
In the verbal area assessment was directed at the ability to abstract or generalize andto think constructively, rather than at simple fluency or vocabulary recognition. The item typethought most appropriate was one using verbal analogies.
The test in the math area is directed at those mathematics skills and concepts all studentsshould be familiar with and not skills and concepts attainable only by academically gifted persons.
GENERAL SCALE DESCRIPTION (VERBAL)*
The verbal scale contains 30 verbal analogies presented in a multiple-choice format.Each scale is timed (15 minutes). The scales are scored by giving one point for each correctanswer. No adjustment is made for guessing.
*Copyright (c) 1973 Educational Testing Service

Sample item: (Grade 8) MEAL: BANQUET::A diamond: jewelB car: limousineC design: ornamentD silver: gold
GENERAL SCALE DESCRIPTION (MATH)**
The mathematics scale has 30 items and is timed (15 minutes). Its ability to identifyspecific strengths and weaknesses in math-related areas is limited. However, it is considered agood measure for the general level of math achievement on a group basis. Modern math concepts(set notion, modular arithmetic, etc.) and advanced concepts such as trigonometry, logic andgeometric proofs are not included. Areas tapped are arithmetic computation, algebraic andgeometric concepts and measurement. A multiple-choice format is used. Eat item requires studentsto make a size comparison between two quantities. The scale is scored by giving one point foreach correct answer. No adjustment is made for guessing.
Sample item: (Grade 8)
Cohunn Ax
3 x927
21
3 A
A. The part in Column A is greater.B. The part in Column B is greater.
* C. The two parts are equal.D. Not enough information is given to decide.
**Copyright (c) 1973 Educational Testing Service.

Sci WO. IS 15441.00;1441W1111r- riarittpl
Z may^40,0
PI ALFovstifg411sowi'l
GOAL IV Interest in School and LearningQuality education should help every child acquire a positive attitude toward the learning process.
GOAL RATIONALE
The school represents perhaps the most powerful single force in determining a person'soverall attitude toward learning. The climate and learning atmosphere in the school, the educationalexperiences the school p-ta .idis and the quality of the personal interactions it fosters betweenstudent and educator all shape the students' life-long attitudes toward learning.
The school experience should be such that students find the learning activities associatedwith it enjoyable and rewarding to the point that they are motivated to do well and to continuelearning on their own initiative beyond the requirements of formal education. Everything possibleshould be done to ensure that the attitude of the teacher, the atmosphere of the school, andthe school's physical condition contribute toward this end so that the individualboth as a childand later as an adultwill hold education high among his or her values.
MEASUREMENT RATIONALE
In assessing student feelings about education, it is necessary to examine more than justthose feelings within the context of the students' present school experience. We must alsodetermine how this experience is influencing the students' general future attitudes toward learningbeyond the formal educational setting. The measurement device developed in support of thisgoal attempts to sample student attitudes in two areas: The first relates specifically to the presentschool experience while the second focuses on learning as a lifetime process.
GENERAL SCALE DESCRIPTION*
In this scale there are 30 statements about the school, teachers, course content andthe learning experience. Fifteen items cast these areas in a favorable light, e.g., Most of my subjectsthis year are worthwile. The remaining items are negatively stated. e.g., Teachers don't knowwhat they are talking about. Response options available to the student are (1) strongly agree,( 2) agree, (3) uncertain, (4) disagree and (5) strongly disagree.
*The interest in school and learning scale is a result of extensive revisions of the Goal IV instru-ment which was used for grades S and 11. George E. Brehman from the Division of Researchand Nolan F. Russell from the Division of Educational Quality Assessment were responsible forthe revisions.
17
19

The items within the scale are grouped into two subscales each having 15 items.
Subscale 1:
Attitude toward learning measures the student's willingness to expend effort to learnand to appreciate the value of continued learning throughout life. Sample item: Itis very important to me to learn as much as I possibly can
Subscale 2:
Attitude toward school investigates the degree to which the student believes schoolattendance is important and the student's attitude toward the school setting, teachersand course work. Sample item: Most of my classes this year we boring.
NORM-REFERENCED SCORING
For norm-referenced scoring, the following weighting scheme is used:
ItemDirection
StronglyAgree Agree
Response Options
Uncertain DisagreeStrongly
Disagree
Positive
Negative
4
0
3
1
2
2
1
3
0
4
CRITERION- REFERENCED SCORING
Responses are considered favorable if they reflect student agreement with positivestatements about school and learning or disagreement with negative statements concerning schooland learning. A student's score on a given scale (total or subscale) is the percentage of itemsto which a favorable response was given. For this scale the scoring scheme applied to the itemsis:
ItemDirection
Positive
Negative
Response Options
Strongly
0
I
0
Uncertain
0
0
18
Strongly
0 0
1

BEST COPY AVAILABLE
GOAL V CitizenshipQuality education should help every child acquire the habits and attitudes associated withresponsible citizenship.
GOAL RATIONALE
Responsible citizenship embodies a much more complex concept than commonlyexpressed in love of country and participation in the democratic processes. Viewed in its broadestsense responsible citizenship implies a respect for law and proper authority, a willingness to assumeresponsibility for our own actions ani for those of the groups to which we belong, respect forthe rights of others and overall personal integrity.
Schools should encourage pupils to assume responsibility for their actions as well asthe actions of the group. Opportunities should be provided for pupils to cooperate and worktoward group goals and to demonstrate integrity in dealing with others. Pupils should be giventhe chance to take the initiative and assume leadership for group action as well as lend supportto group efforts as followers.
MEASUREMENT RATIONALE
The mores, codes, laws and social expectations of society provide the reference pointsfor judging which behaviors reflect responsible citizenship and which indicate poor citizenship.A review of literature revealed that the National Assessment of Educational Progress developednine general citizenship objectives. The criterion for inclusion of any one objective was its relativeimportance to society as agreed upon by a committee of scholars and lay people.
These national objectives were used to provide the frame of reference for what wasto be measured. Objectives in the factual domain such as (a) knowing structure of governmentand (b) understanding problems of international relations were not considered in developing thescale.
Arriving at a satisfactory definition of citizenship was much less complicated thanapplying the definition to the assessment of students' attitudes and behaviors. The display ofresponsible citizenship behaviors like honesty or integrity are most often situational.
A student's display of good citizenship behavior under one set of motivating conditionstells us little about the way he or she can be expected to behave if those conditions are altered.The context in which the behavior is elicited therefore becomes at least as important in determiningthe outcome as the predisposition of the individual involved.

To assess citizenship, a behavior referenced model incorporating elements related tothe psychological notion of threshold is used. In reference to citizenship, threshold refers to thatset of conditions necessary to bring about the desirable responses. Thus by varying the situationand introducing conditions of reward and punishment we are able to determine the cutoff levelsat which the student will display positive behavior. In this way it is possible to assess not onlythe students' predisposition to behave in a manner consistent with responsible citizenship butalso to provide some measure of the intensity of that predisposition across a wide spectrum ofsituations.
GENERAL SCALE DESCRIPTION*
Fifty-four items measure willingness to exhibit good citizenship in many social situationsunder a variety of motivating conditions. Social contexts are given by 18 stories, each posinga problem and suggesting an action predefined as good or poor citizenship. Each story has threeitems which list positive or negative consequences resulting from the action. Students are askedto decide whether to take the action for each consequence.
Sample Story (grade 8):
Sample item set:
Morton has broken a school window but did not mean to. If I wereMorton, I would TELL THE PRINCIPAL OR TEACHER about mybreaking the window when I knew. . .
1. The principal would make mestay after school.
2. My parents would have to payfor the window.
3. 1 would have to pay for thewindow.
Yes Maybe No
The items within the scale are grouped in such a way as to yield three subscale scoresIn addition to a total score.
Subscale I: Concern for the welfare and dignity of others contains IS items (item sets fromfive stories) designed to measure concern for the feelings of others, willingnessto protest unjust treatment of others, and the tendency to accept new peopleinto a group. Also measured is the degree of restraint from teasing or degradingothers.
Subscale 2: Respect for law and authority has 21 items measuring the willingness to reportlaw-breaking of others, obey authorities during emergencies and prevent classroomdisruptions. Also assessed is the degree of restraint from violent actions that couldharm others or damage property.
Subscale 3: Personal responsibility and integrity has 18 items which tap the willinpaess to honor
*Nolan F. Russell from the Division of Educational Quality Assessment is the author of thecitizenship scale.
22)

self-made commitments to individuals or groups and the willingness to takeresponsibility for one's own mistakes and to report mistakes made in one's favor.
NORM-REFERENCED SCORING
The following item weighting scheme is used for norm-referenced scoring:
Response Options
Behavior Direction Yes Maybe No
Positive Citizenship 2 1 0
Negative Citizenship 0 1 2
CRITERION- REFERENCED SCORING
Responses are considered favorable when they reflect a willingness to display propercitizenship behaviors or an unwillingness to use poor citizenship behaviors. A student's score ona given scale (total or subscale) is the percentage of items to which a favorable response wasgiven. For the citizenship scale the scoring scheme applied to the items is:
Response Optionswe,
Behavior Direction Yes Maybe No
Positive Citizenship 1 0 0
Negative Citizenship 0 0 1

at AGMAT SIC
IN0114.47 e viissist 1.NOW THAT SC44001.-
IS out, wtosr,offt.t. ww. troyIls
BEST COP! AVAILABLE
GOAL VI Health HabitsQuality education should help every child acquire good health habits and an understanding ofthe conditions necessary for maintaining of physical and emotional well-being.
GOAL RATIONALE
In their own interest, as well as in the interest of society at large, children shouldknow how to take care of themselves and how to keep physically fit. They should know whatthe requirements are for physical and mental health and what practices, harmild to health, shouldbe avoided. After gaining this knowledge they should acquire habits which increase the probabilityof remaining healthy and fit throughout life.
In cases where the home has been deficient in encouraging the child to practice soundhealth habits, the school has an obligation to be aware of the situation and to see that opportunitiesto remedy the deficiency are provided.
MEASUREMENT RATIONALE
Understanding how diseases and their prevention, dental care, nutrition, personal hygiene,safety and drug use relate to the structure and function of the human body is an Importantfirst step in each individual's willingness to consistently exhibit habits which are conducive tothe maintenance of personal health and well-being. One does not need to be a doctor to displaygood health practices or a lawyer to display good citizen behaviors.
Therefore, assessment in this goal area attempts to get at students' willingness to displayproper health behaviors in a variety of situations.
GENERAL SCALE DESCRIPTION*
The scaling technique in this inventory is similar to the psychophysical method of limits.This method holds the behavior constant while systematically allowing the stimuli to vary. Thestrength of the. stimulus (in physical units) which is required to cause a change in the behavioris used to define the threshold of that behavior.
In the cas,.. of this health behavior inventory, the student is asked to decide whetherhe or she would take a given healthrelated action. Each action is predefined as indicating either
*The health habits scale was developed jointly by Nolan F. Russell and Eugene W. Skiffingtonfrom the Division of Educational Quality Assessment and Mary L. Lydon from the Division ofResearch.
23

good or poor health practice. Stimulus contexts surrounding the choices are systematically varied.The health - behavior threshold is defined in terms of the severity of the stimulus contexts toleratedbefore changing from good to poor health behavior. More specifically performance is used toinfer health-behavior threshold by idendfying the supportive contingencies in the environmentnecessary to maintain good health practices.
The format of each question is a situational story about a make-believe junior highstudent. The respondent is first asked to consider taking a specific action. In each question threemotivation-including conditions, i.e., rewards and punishments, are made contingent upon thetaking of the action.
Sample story: When Norma had the flu the doctor gave her some medicine. The medicinealso took away the stomach ache Norma had. After she got over the flu,Norma had another stomach ache. If I were Norma, I would TAKE THEMEDICINE AGAIN when I thought..
Sample item set: Yes Maybe No
N
N
N
The Items within the scale were grouped to yield three subscale scores in addition toa total scale score.
The medicine tasted good. Y M
2. It might cure my stomach ache quickly. Y M
3. My parents might nor want me to take it. Y M
Subscale 1: Personal and cvmmunity health contains 21 items (seven health situations). Contentincludes willingness to follow proper diet, to take proper medical precautions, touse good personal hygiene practices and to refrain from interpersonal contacts when
Subscale 2: Personal and community safety contains 18 items from six health situations.Measured is the degree of restraint from unnecessary risk-taking at home, at schooland at play and restraint from :,ubmitting others to undue risks.
Subscale 3: Drugs contain five situations with IS questions to measure restraint from ( I)improper use of prescription drugs. (2) experimentation with drugs and (3)maintaining close contact with others who are using drugs. Improper use ofprescription drugs includes restraint from using old medicine, medication prescribedfor others, or more medicine than has been prescribed by the doctor.
NORM-REFERENCED SCORING
For norm-reference scores, the following item weighting scheme is used:
Response Ovotions
Behavior Direction Yes Maybe No
Positive Health Behavior 2 1 0
Negative Health Behavior 0 1 2
24 25

CRITERKON-REFERENCFD SCORING
Responses are considered fivotuble when they reflect a willingness to take goodhealthrelated actions or an unwillingness to display behaviors that might be harmilll to health.A student's score on a given scale (total or subscale) is the percentage of items to which a favorableresponse was given. For the health scale the scoring scheme applied to the items is:
Response Options
Behavior Direction Yes Maybe No
Good Health Practice 1 0 0
Poor Health Practice 0 0 1
25 26

BEST COPY. MMUS're
GOAL VII Creative ActivitiesQuality education should give every child opportunity and encouragement to be creative in oneor more fields of endeavor.
GOAL RATIONALE
'the notion of creativity has been variously defined. It is used here to encompassworthwhile activities that children initiate and pursue on their own activities having an outcomethat is perceived by the children themselves or by others as a contribution to their world. Suchactivities can be found in a wide variety of fields, not only the sciences and the arts, but alsothe organization of human affairs and the development and exercise of salable skills in theproduction of practical things that enrich our way of living.
The school environment should encourage and reinforce activities that can enablechildren to express themselves creatively and productively.
MEASUREMENT RATIONALE
Attempts to assess creativity have traditionally used methods which analyze thecomponents of the creative process or subjective judgments about the quality of the productof the creative act. Neither of these procedures is particularly well adapted to a large scaleassessment effort which covers the broad spectrum of creative talent represented in the school.In order to overcome this Problem a two-dimensional model of creativity was proposed whichprovided a theoretical basis for the assessment of Goal VII. The first dimension is based on thestudent-expressed interest in participating in creative activities, while the second attempts todetermine the extent of recognition gained through active involvement. This approach seemssound since the Goal VII statement stresses opportunities and encouragement for all studentsrelative to creativity rather than emphasizing individual talent and production in any one area.
GENERAL SCALE DESCRIPTION*
The creative activities checklist contains 36 activities which require originality in visualarts, performing arts, science and writing. Sample activities include performing an original scientificexperiment with living things, writing an original poem, modeling an outift in an original way,performing an original magic or novelty act.
Response options give six ways to show degree of involvement in each activity. Optionsare (1) No, and have not wanted to; (2) No, but have wanted to; (3) Yes, but with no recognition;
The creativity scale was developed by James F. Hertzog and Nolan F. Russell, both from theDivision of Educational Quality Assessment.
27

(4) Yes, with teacher or adult leader recognition; (5) Yes, with school-wiee recognition; and (6)Yes, with area-wide recognition. The scale contains four subscales each having nine items.
Subscale 1:
Visual arts contains nine items, some dealing with more than one activity. Activitiesinclude sculpturing; cartooning; printmaking; graphic design; painting; photography;flower arrangement; design of window displays, stage sets, decorative items and clothing.
Subscale 2:
Performing arts contains nine items which include activities dealing with singing, speech,music, magic, modeling, directing, acting and sports.
Subscale 3:
Writing arts has nine items related to writing such as poetry, news, essays, stories, scripts,letters, jokes and recipes.
Subscale 4:
Science activities contains nine items such as performing experiments using physicalobjects or living things, constructing models to show a scientific principle, exploring,training animals, directing recreational activities, developing campaign strategies for(school) elections, working with radios or other electronic equipment and designinggadgets.
NORM-REFERENCED SCORING
All items in this scale are positively worded. Each item describes an activity and asksthe students to describe the level of their involvement in that activity.
Response Options Score Obtained
(1) No, and have not wanted to 0(2) No, but have wanted to i(3) Yes, but no recognition 2(4) Yes, with teacher or adult leader
recognition 3(5) Yes, with school-wide recognition 4(6) Yes, with area-wide rece;,nition 5
CRITERION-REFERENCED SCORING
Two criterion-referenced scoring methods are used for this scale. The first defines asfavorable those choices which reflect a willingness to try the activities presented in the scale.Thus only the option No, and have not wanted to is considered unfavorable. Scores generatedfrom this method are called Attitude Toward Creative Activities.
The second scheme defines as favorable those choices indicating that the student hactually participated in the activity. Thus two choices are considered unfavorable: No, and havenot wanted to and No, but have wanted to.
28kb

BEST COPT IWADJUILE
GOAL VIII Vocational' KnowledgeQuality education should help every child understand the opportunities open to him or her toprepare for a productive life and help each child to take full advantage of these opportunities.
GOAL RATIONALE
Students Should be aware of the vast array of possibilities for continuing self-developmentin the world of work so that they will be motivated to pursue excellence in all forms of humanendeavor that are appropriate for them individually.
Most children can profit from some form of education beyond high school, whetherit be a forefeet college, a school of nursing, a community college, a technical institute or thelike. Each student should be aware of these opportunities and seek out the kind of educationbest suited to his or her talents and interests. This goal also implies that the school will providestudents with guidance that will enable them to do so.
MEASUREMENT RATIONALE
Vocational development, for purposes of assessment, is a series of processes involvingboth the acquisition of knowledge about different kinds of work and the forming of attitudeswhich will enhance one's chances of succeeding in the work-aday world.
In the initial stages of vocational maturity students become aware of different kindsof work and workers. This is followed by a growing understanding of the relatedness of educationaland occupational opportunities. The more vocationally mature students will actively seekinformation, accept personal responsibility for career decisions and finally base their career choicesupon a realistic appraisal of their interests, achievements and aptitudes.
The first stage, measured at this grade level, assumes that the awareness of jobs andJob opportunities will lead to development of vocational maturity.
GENERAL SCALE DESCRIPTION*
This scale contains 30 items which focus on the student's knowledge concerning theduties, conditions, training, salary and educational requirements of various occupations. Themultiple-choice format requires the student to select the best answer from alternatives. One pointis given for each correct reiponse. No adjustment is made for guessing.
The authors of this scale are Francis J. Reardon and James P. Lewis from the Division of Research.
29 29

Sample items:
Which of these jobs requires a period of apprenticeship?
A. electricianB. stockbrokerC. porterD. truck driver
A claims adjuster would most likely be working for
*A. an insurance companyB. a hospitalC. a welfare officeD. a department store
ao "

BEST COPT AVAILABLE
GOAL IX Appreciation of Human AccomplishmentsQuality education should help every child to understand and appreciate as much as possible ofhuman achievement in the natural sciences, the social sciences and the humanities and the arts.
GOAL RATIONALE
Students should be encouraged and helped to gain knowledge about humanaccomplishments. Possessing knowledge they will then be ready to receive and not to avoid thestimuli that the sciences and arts provide. At the next level, they will be ready to more clearlyand consciously perceive these stimuli and will begin to discriminate among art forms. Whenthey reach the next stage of development, they will be ready to respond rather than merelyattend to phenomenathey will choose to see a piay, to read of a famous scientist or to contemplatethe design of a building.
Insofar as possible the school experience should provide an increasing openness tothe life of the mind and an increasing ability to find meaning for one's own life in the heritageof the past and in the intellectual thrusts of the present age.
MEASUREMENT RATIONALE
Attitudes associated with the understanding and appreciation of human accomplishmentsmay be inferred from samplings of behavior taken at several points along a response hierarchy.The lowest point in the hierarchy is represented by behaviors indicating a state of passive receptivityreflecting little more than an awareness that certain human endeavors exist. At the highest pointof this hierarchy are overt behaviors resulting in direct involvement in the activities and inferringhigh motivation. Between these two extremes are several intermediate steps based on the valueplaced on the activities and willingness to receive stimuli that these activities provide.
In developing the assessment model to be used in this goal area, it was determinedthat the instrument would not attempt to sample behaviors at either extreme. Instead items weredesigned to concentrate on attitudes concerned with the degree of value placed by students onvarious areas of human accomplishment and the willingness of students to seek out environmentswhere firsthand experience in these endeavors would be possible.
GENERAL SCALE DESCRIPTION*
This scale contains 48 items measuring how much value the students place on human
The appreciating human accomplishments scale was developed by Joan S. Beers and Nolan F.Russell for the Department of Education.
3131

achievements in the arts and sciences and the degree to which they are willing to vicariouslyreceive stimuli from these endeavors. Areas included are literature, art, athletics, ecology,government, science, music and drama. The scale is organized into two subscales each haying24 items.
Subscale 1:
Valuing measures the amount of importance the student attaches to achievements inthe arts and sciences and how much the student values the role played by people inthese areas. Sample item: Most scientists don't care how their work affects people.
Subscale 2:
Receiving measures willingness to learn more about achievements in the arts and sciencesand to seek out firsthand information on what people in these areas are doing. Sampleitem: It would be fun to watch people paint at an art studio.
NORM-REFERENCED SCORING
The item weighting scheme used for norm-referenced scoring is:
Response Options
Item Direction Agree Uncertain Disagree
Positive 2 1 0
Negative 0 1 2
CRITERION REFERENCED SCORING
Responses to this scale are considered favorable when they reflect agreement withstatements which (1) stress the value of human endeavors in the arts, sciences, politics, etc.,or (2) suggest that it is personally rewarding to approach the people and places associated withthese endeavors. For the appreciation of human accomplishments scale the following scoringscheme is used.
Item Direction Agree Uncertain Disagree
Positive Statements1 0 0
Negative Statements 0 0 1

GOAL X Coping with Change BEST COPY AWAKE
Quality education should help every child to prepare for a world of rapid change and uiforeaeeabledemands in which continuing education throughout adult life should be a normal expectation.
GOAL ATIONALE
Ability to cope with a rapidly changing world is important for today's youth. Thedevelopment of the abilities and their associated attitudes which allow the individual to viewchange as an opportunity rather than a threat poses a new challenge for education.
Schools should help students develop attitudes of openness to the possibilities of changechange in their personal world as well as external change. Students should be encouraged to
show tolerance for uncertainty and to welcome new experiences.
MEASUREMENT RATIONALE
Ability to cope with change and deal effectively with frustration is essential to personaladjustment. These adaptive behaviors are seldom learned in response to external changes of greatmagnitude and import but are acquired as part of a gradual process requiring daily changesin the life of the student.
Assessment in this goal area attempts to draw upon several elements believed to beassociated with a student's ability to accommodate change and to adapt emotionally andbehaviorally to unexpected or sudden alterations in the environment. Primary among these aremeasures of the student's ability to tolerate frustration and uncertainty and to apply past !earningsand coping behaviors in new and different situations.
The situations presented as a means of measuring these attitudes and behavioraldimensions were gleaned from student responses to open -ended questions asking for descriptionsof events they had experienced which necessitated some form of adjustment and which wereremembered as being difficult to cope with.
GENERAL SCALE DESCRIPTION*
Thirty-five items measure emotional and behavioral reactions to change. The scale'sformat contains seven stories describing unpleasant change situations in which student'sexpectations or needs are not met. These situations were obtained from previous student statementsdescribing events that were difficult to adjust to. Five reactions predefined as indicating positive
The preparing for a changing world scale was authored by Nolan F Russell, Division of Educa-tional Quality Assessment.
3333

or negative adaptation to change are given following each story. The purpose of the scale isto get at student reactions in response to a variety of events, not to predict what students willdo in the particular situations presented.
Sample situation: I was elected class president. I came home to tell my parents the goodnews. They told me that my dad had taken a job out of state and wewere going to move in two weeks. So I had to withdraw from schooland move.
Sample items: If this happened to you, how much time would you spend on each thinglisted below:
A Great VeryDeal of Time Some Time Little Time No Time
1. Being upset.
2. Trying to find someoneto stay with so I couldremain in my school.
3. Planning a going-away party.
4. Fighting with my parents.
5. Reading about the place weare going to move to.
Subscale 1: Effective solutions contains 13 items to measure the tendency to try solutionsreflecting positive adjustment to change. In the above, sample items three and fiveare assigned to this subscale.
Subscale 2: Ineffective solutions contains 13 items to measure tendency to avoid use ofaggressive or withdrawing reactions in face of change. In the above, sample itemstwo and four are assigned to this subscale.
Subscale 3: Emotional adjustment contains nine items to measure the perception of the lengthof time needed for the student to adjust emotionally to change. Item one aboveis assigned to this subscale.
NORM-REFERENCED SCORING
The item weighting scheme for norm-referenced scoring is:
Response OptionsType of Items A Great Deal of Time Some Time Little Time No TimeEffective Solutions 3 2 1 0
Ineffective Solutions 0 1 2 3
Emotional Adjustment 0 1 2 3
3434

CRITERION-REFERENCED SCORING
Responses are considered favorable when they reflect (1) a willingness to adjustpositively, (2) an unwillingness to withdraw or become aggressive and (3) a rapid emotionaladjustment to change. An individual's score on a given scale (total or subscale) is the percentageof items to which a favorable response was given. The item weighting scheme for the preparingfor a changing world scale is:
A Great
Response Choices
VerySome Little No
Item Type Deal of Time Time Time lime
Effective Solution 1 1 0 0
Ineffective Solution 0 0 1 1
Emotional Adjustment 0 0 1 1
35
35
OEM
Safeguards

THE OVERALL PICTURE
During the fin t two weeks of March 1974, 53,226 students attending 240Commonwealth intermediate schools completed the Grade 8 EQA Inventory. This represents nearlya quarter of a million hours of student time. Do the outcomes which are summarized by theManual for Interpreting Intermediate School Reports accurately reflect student progress on the10 state education goals? To answer this question one must know where the tests came from,what they really measure, how accurately and reliably they measure it, and how much influencefaking and response bias have on the final results. The following two sections highlight thesafeguards used to produce high quality instruments and show how the instruments stood upto these checks.
A WORD ABOUT ATTITUDES
Attitudes, beliefs, values, etc., are abstractions. Nevertheless they are real enough toeach individual holding them. They are typically thought of as a state of readinessa predispositionto act or react in a certain way when faced with certain situations. A person's attitudes arealways present but remain dormant most of the time. They are expressed in speech or otherbehavior only when the object of the attitude is perceived. A person may have strong attitudesfor or against astrology but actively express them only when some issue connected with astrologyarisesor when confronted by an attitude scale ! Attitudes are often reinforced by beliefs (thecognitive component) and attract strong feelings (the emotional component) that will lead toparticular behaviors (the action tendency component).
The measurement of attitudes always involves making inferences. Since the attitudescannot be seen or measured directly, we must infer their pretence from consistencies that appearin the individual's behavior. Observing individuals across time in everyday situations is probablythe best way to learn how the individual thinks, feels and acts.
Clearly, this method is much too cumbersome and costly when we want to investigatethe intensity and direction of attitudes for a large number of people, forcing us to rely insteadon verbal reports of the individuals concerned.
WHAT ABOUT PAPER AND PENCIL TESTS OF ATTITUDES?
The use of paper and pencil techniques for measuring attitudes is often questioned.These questions are directed at both the test and the test taker. Test critics are concerned withthe possibilities that:
1. People misunderstand what the items are asking.
2. People don't always tell the truth on this type of test.
3. Scores on tests of this type are seldom presented in any meaningful way.
4. People might not respond consistently to similar questions.
5. People might respond to items differently at various times.
In the development of the EQAI scales, these and other concerns were taken into consideration.
From the outset, all pilot instruments were put through an obstacle course of checksand balances designed to determine their susceptibility to various errors of measurement. Thetests were then revised and submitted to additional field trials. This philosophy of testing thetests before using them to test people resulted in a five-year developmental period requiring strongcooperation between the Department of Education and over 175 Commonwealth school districts.

YES, BUT CAN THEY READ IT?
If students can't read the tests, the tests can't read the students. Although it is impossibleto control the range of verbal comprehension in a program assessing over 50,000 students, itis feasible to develop scales that can be read and understood by the vast majority of respondents.
Toward this end, monitors conducting field- trials were required to submit detailed reportson the understandability of directions, item sentence structure and vocabulary for each instrument.Also, students were asked to comment on the scales and identify words and/or items that didn'tmake sense to them. Changes resulting from these data increased the readability of all EQAinstruments.
After each scale was finalized, its leadabiEty level index was estimated by theGunningFog formula. This formula takes into consideration both the average number of sentencesand the percentage of three-or-more syllable words contained in 100 words. The index is expressedin grade level terms. An instrument with a readability index of 5.0 should be understood bythe average student just entering Sth grade. Nine scales within the inventory have Gunning-Fogreadability indices ranging from 4.0 through 5.0. The creative activities and appreciating humanaccomplishment scales have madabilities of 6.0 and 6.7 respectively.
Results from a study involving a limited number of special education students in alarge suburban school district indicate that the majority of the tests comprising the battery needadditional revision before becoming appropriate for our special education population.
FROM ITEM CONTENT TO ANSWER SHEET
Handing someone a list of attitude questions, waiting 10 minutes, then collecting itdoes not insure that the check marks you find in the answer column. were made solely in responseto the content of statements on the list. Those other factors influencing answers are called responsesets. The two most common types of response set contamination are the tendency of respondentsto tell you what they think you want to hear (make a good impression) or to randomly checkanswers without regard to item content.
In their developmental stages. all scales and items were checked against a special 36-iteminstrument designed to pick up the tendency to make socially desirable answers. This scale*contained such questions as:
( I ) I never forget to say please and thank you.
(2) Sometimes I don't like to obey my parents.
(3) I always finish my homework on time.
(4) Sometimes I do things I've been told not to do.
Those items and scales whose scores were found to be associated with socially desinible respondingwere deleted or revised to minimize the relationships found. The correlations between the finaltotal instrument scores and s 30-item version of the social desirability scale range from .04 through.08 (N=400).
We have tried to minimize the effects of position bias by including both positivelyand negatively worded items in the goal scales. The creative activities check-list is the only EQAI
*Item sources for this instrument included the Crown-Marlow Scale (1960) and the Childrens'Social Desirability Scale by Crandall (1965).
3840

instrument which does not contain reflected items. An estimate of response position bias canbe determined by counting the number of perfect scores. To get a perfect score the studentmust answer Yes. I have done this activity and have received area-wide recognition for its qualityto each of 36 separate activitiesa highly questionable feat! Fewer than one-half of one percent of the 50,000 respondents obtained a perfect score on the scale.
FROM ITEM ANSWERS TO TEST SCORES
To give school personnel a clearer picture about the performance of their students onthe EQAI, two scoring methods are used for each attitude scale. The first scoring method organizesthe response options with each scale into a hierarchy. Different scoring weights are then appliedto each level of the hierarchy. Consequently, for an item such as I like school with responseoptions (a) strongly disagree, (b) disagree, (c) agree and (d) strongly agree, weights of zero throughfour are applied respectively to each answer choice. This method is based on the assumptionthat strongly agreeing with a statement is more positive than merely agreeing with the statement.
Item scores obtained by this method are summed and used to give norm - referencedinformation about student performance. How well a group of students perform on the scalesis determined by the relationship of their scores to other student groups. This norm-performancetells very little about favorableness of student responses.
To obtain information about favorable and unfavorable responding, acriterion-referenced scheme is used. This scoring method is based on the notion that each itemwithin the scale offers the respondent the chance to show a positive or negative attitude towardthe specific content presented by the item. Hence, the response choices to the above item arescored by assigning a one to both the strongly agree and agree choices and a zero to the remainingchoices.
The number of positive responses given by each student is compared to an independentlydetermined standard or criterion. If the number of favorable responses meets or exceeds thestandard, the student is said to have achieved the standard. In the case of scales used in EQAI,three criteria were set: Level One requires students to respond favorably to more than 35 percent of the items; Level Two requires favorable responses to more than SO per cent of theitems. Level Three requires favorable responses to more than 70 per cent of the items.
RESPONSE CONSISTENCY WITHIN THE TESTS
Reliability is that characteristic of a measuring instrument which deals with consistencyof resultseither within the scale itself (internal consistency) or over time (stability). Reliabilitycoefficients are reported as two-place decimal figures ranging from ,00 to 1.00. As the instrumentincreases in reliability the coefficient increases in value.
Reliability coefficients are interpreted as the proportion of the variance in a set ofscores which is caused by variation in the examinees true scores, rather than by errors ofmeasurement.
The coefficients are derived by taking into account the length of the test and the extentto which test items contribute mutually confirming or consistent information.
The KR-20 reliability formula is used for the knowledge scales scored on a right vs.wrong basis. For the attitude scales, coefficient alphas give us estimates of scale and subscaleinternal consistency. Internal-consistency reliabilities based on criterion-referenced scoring of thescales are obtained using Livingston's formula.* As the magnitudes of these coefficients increase,
Livingston, Samuel A., Criterion-Referenced Applications of Classical Test Theory Journal ofEducational Measurement, Vol. 9, No. 1, Spring 1972, pp 13-25.
41 as

we can be more confident that errors of measurement are unlikely to make a difference betweenmeeting or not meeting the criterion for many of the examinees.
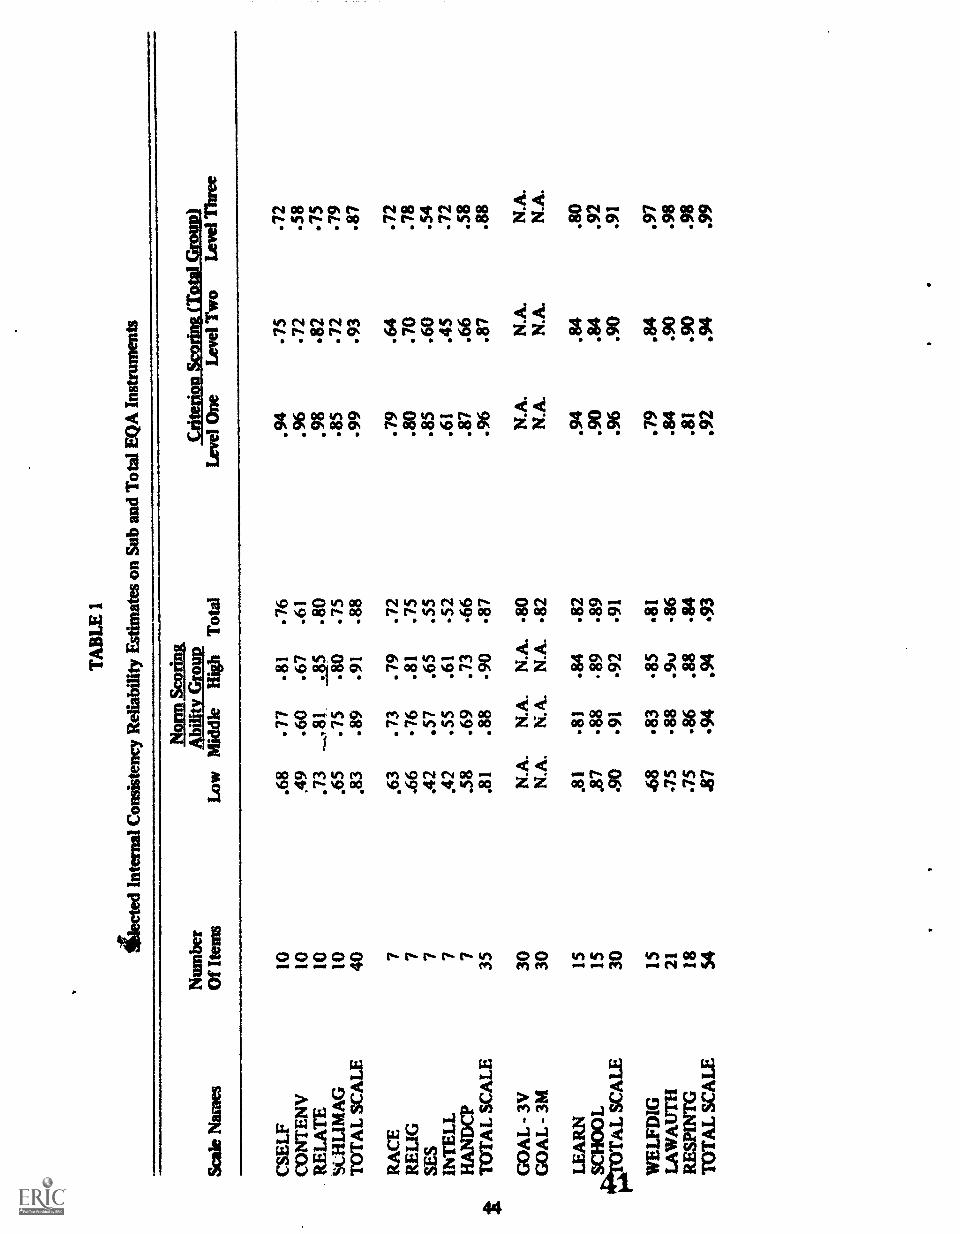
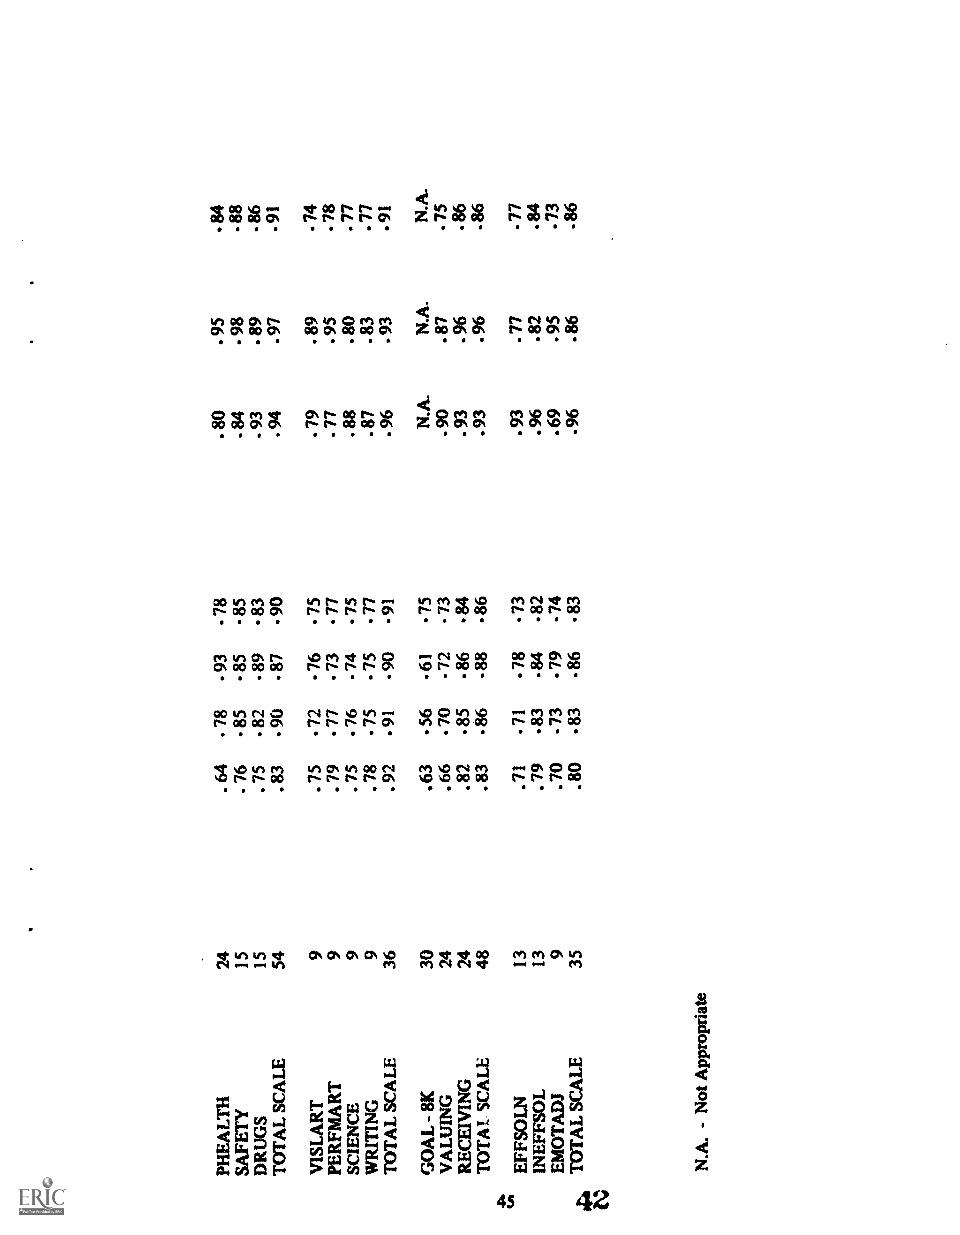
Table 1 presents seven separate internal consistency estimates for each sub and totalEQA scale. These are based upon a sample of 3,500 student records randomly drawn from all240 schools administering the inventory in March 1974. Therefore, these reliability findings canbe generalized across various schools, communities and test setting within the Commonwealth.Sub and total scale names are presented in acronym form. For complete names refer to SectionOne.
To clarify test appropriateness for students of differing reading and achievement levels,coefficient alphas are given for low achievement (N=1160), average achievement (N=1180) andhigh achievement (N=1080) students groups. These groups are defined by scores on the compositemath-verbal scale.
As a rule of thumb, Kelley has proposed that tests designed to discriminate betweengroups should display reliabilities greater than .50. Note that only three subscales (CONTENV,SES, and INTELL) fail to meet this minimum criterion and then only for the low ability studentgrouping Also evident from Table 1 is the increase in r3liability for most scales as ability levelincreases and the high reliability obtained on all total scale scores.
The three extreme right columns of Table 1 show criterion score reliabilities of 3,500records across the three criteria levels. Here again the reliabilities are very high. This indicatesthat the tests are capable of eliciting consistent responses from students.
Other indicators of internal consistency available in printout form at the Division ofEducational Quality Assessment in Harrisburg are ratios between standard-error of measurementand standard deviations, average inter-item correlations and items-to-total correlations for all suband total scales. These indicators confirm conclusions obtainable from Table 1.
T. L. Kelley, Interpretation of Educational Measurements, New York: Harcourt, Brace, andWorld, Inc. 1972.
4240
TA
BL
E 1
gtec
ted
Inte
rnal
Con
sist
ency
Rel
iabi
lity
Est
imat
es o
n Su
b an
d T
otal
EQ
A I
nstr
umen
ts
Scal
e N
ames
Num
ber
Of
Item
s
liCill
ik91
.108
.A
bilit
Y G
fouP
Low
Mid
dle
Hig
hT
otal
Slik
tiattl
intil
l&a2
Bgr
dSM
Lev
el O
neL
evel
Tw
oL
evel
Thr
ee
CSE
LF
10.6
877
.81
.76
.94
.75
.72
CO
NT
EN
V10
..49
.60
.67
.61
.96
.72
.58
RE
LA
TE
10.7
3__
.,81
..3
5.8
0.9
8.8
2.7
5SC
HL
IMA
G10
.65
.75
.80
.75
.85
.72
.79
TO
TA
L S
CA
LE
40.8
3.8
9.9
1.8
8.9
9.9
3.8
7
RA
CE
7.6
3.7
3.7
9.7
2.7
9.6
4.7
2R
EL
IG7
.66
76.8
1.7
5.8
0.7
0.7
8SE
S7
.42
.57
.65
.55
.85
.60
.54
INT
EL
L7
.42
.55
.61
.52
.61
.45
.72
HA
ND
CP
7.5
8.6
9.7
3.6
6.8
7.6
6.5
8T
OT
AL
SC
AL
E35
.81
.88
.90
.87
.96
.87
.88
GO
AL
- 3
V30
N.A
.N
.A.
N.A
.-8
0N
.A.
N.A
.N
.A.
GO
AL
- 3
M30
N.A
.N
.A.
N.A
..8
2N
.A.
N.A
.
LE
AR
N15
Al
.81
.84
.82
.94
.84
.80
15.8
7.8
889
.89
.90
.84
.92
.SC
HO
OL
'TO
TA
L S
CA
LE
Mm
ei30
.90
.91
.92
.91
.96
.90
.91
WE
LFD
IG15
48.8
3.8
5.8
1.7
9.8
4.9
7L
AW
AU
TH
21.7
5-8
8.9
%)
-86
.84
.90
.98
RE
SPIN
TG
18.7
5.8
6.8
8.8
4.8
1.9
0.9
8T
OT
AL
SC
AL
E54
.87
.94
.94
.93
.92
.94
.99
PHE
AL
TH
24.6
4.7
8.9
3-7
8.8
0.9
5.8
4SA
FET
Y15
.76
8585
8584
98.8
8D
RU
GS
15.7
582
8983
.93
.89
.86
TO
TA
L S
CA
LE
54.8
390
.87
90.9
4.9
7.9
1
VIS
LA
RT
9.7
572
7675
.79
.89
74
PER
FMA
RT
9.7
977
73-7
7.7
7.9
5.7
8SC
IEN
CE
9.7
576
-74
-75
.88
.80
.77
WR
ITIN
G9
.78
.75
7577
.87
.83
77
TO
TA
L S
CA
LE
36.9
2-9
1-9
0-9
1.9
6.9
391
GO
AL
- 8
K30
.63
5661
75N
.A.
N.A
.N
.A.
VA
LU
ING
24.6
670
-72
73.9
0.8
7.7
5R
EC
EIV
ING
24.8
2.8
586
84.9
3.9
686
TO
TA
L S
CA
LE
.48
.83
8688
86.9
3.9
6.8
641
.ut
.E
FFSO
LN
13.7
1.7
1.7
8.7
3.9
3.7
7.7
7IN
EFF
SOL
13.7
9.8
3-8
4.8
2.9
6.8
2.8
4E
MO
TA
DI
9.7
073
7974
.69
.95
.73
41T
OT
AL
SC
AL
E35
.80
8386
83.9
6.8
6.8
6
N.A
. - N
ot A
ppro
pria
te

RESPONSE CONSISTENCY OVER TIME
Two questions relate to stability of test scores. Do students stay in the same rankorder position relative to one another from one test occasion to the next? Do students whoare classified as having positive or negative attitudes remain in their respective categories acrosstesting occasions? The first question is answered by computing correlations between the two testscores obtained at different points in time. The latter Is answered by adding the percentage ofstudents who slay in the favorable attitude classification with the percentage remaining in theunfavorable classification.
In February and March 1974, data on test stability for eight of the 11 scales overa four and one-half week period were obtained from 400 8th grade students in a large schooldistrict in southeastern Pennsylvania. Test administration followed procedures recommended inthe EQA statewide Monitor's Handbook. A second study involving 120 students attending aschool district in western Pennsylvania produced stability estimates for the remaining three scales.
Table 2 presents test-retest correlations developed from norm referenced scores on allsub and total scales. An index of continuity for scores on each of three criterion scoring levelsis also given. This index tells us the per cent of students remaining in the same scoring category(i.e., those passing on the first occasion who also pass on the second occasion or those failingon the first occasion, who also fail on the second occasion). From this table it can be seenthat the total scale reliabilities are quite high and range from .73 through.81. The continuityindex figures show that a large percentage of students don't change their answers sufficientlyacross testing occassions to be placed in a different category.
4 3'6

TABLE 2
TEST-RETEST RELIABILITY AND CONTINUITY INDICESFOR SUB AND TOTAL EQA INSTRUMENTS
Scale Name Test- Retest Reliability Indices of Continuity(Criterion Scoring)
Level One Level Two Level Three
CSELF .73 91% 81% 80%CONTENV .63 95% 87% 81%RELATE .79 94% 86% 85%SCHLIMAG .76 86% 79% 80%TOTAL SCALE .80 96% 88% 84%
RACE .67 83% 78% 78%REUB .72 82% 77% 79%SES .62 88% 80% 83%INTELL .64 80% 70% 80%HANDCP .69 86% 92% 73%TOTAL SCALE .76 91% 82% 83%
GOAL 3V .79 N.A. N.A. N.A.GOAL - 3M . 81 N.A. N.A. N.A.
LEARN .74 87% 80% 81%SCHOOL .81 86% 84% 81%TOTAL SCALE . 81 88% 84% 81%
WELFDIG .67 71% 78% 85%LAWAUTH . 70 73% 79% 89%RESPINTG . 68 73% 79% 88%TOTAL SCALE . 73 77% 84% 91%
PHEALTH .67 71% 78% 85%SAFETY .69 72% 77% 87%DRUGS .75 87% 83% 81%TOTAL SCALE . 71 84% 76% 88%
VISLART .63 79% 75% 80%PERFMART . 54 73% 73% 80%SCIENCE .60 84% 78% 76%WRITING . 56 84% 80% 76%TOTAL SCALE . 64 87% 80% 80%
GOAL - 8K . 76 N.A. N.A. N.A.VALUING .66 N.A. N.A. N.A.
RECEIVING .75 N.A. N.A. N.A.TOTAL SCALE . 75 N.A. N.A. N.A.
EFFSOLN .63 87% 77% 75%INEFFSOL 71 92% 84% 78%EMOTADJ 68 70% 86% 87%TOTAL SCALE , ) 91% 82% 77%

w_.
_____n w
1800
EENNI3 H IliZEO

WHAT IS VALIDITY?
Validity is evidence evidence that helps us separate fact from fiction concerning testresults. In the case of the Educational Quality Assessment Program, information on the validityof each scale can help state educators translate the paper goals and number outcomes into abetter understanding of Pennsylvania school age children. No single procedure or experimentaldesign gibes a complete picture of a test's validity. Instead each study, in its own way, helpsround out a picture of what each instrument measures and, therefore, aids our interpretationof test outcomes.
Most test manuals at some point address themselves to questions of validity andreliability. Underpinning these concepts are the more basic questions of the interpretability andusefulness of information engendered from the test. The internal structure characteristics of theEQAI instruments which are presented in Section 3 offer initial evidence of the tests' useabilityby demonstrating empirically that the scales can elicit consistent student responses both withinsets of similar items and across time. Low susceptibility to faking and ease of readability alsosupport the premise that the vast majority of 8th grade students can interact easily with thebattery in the test-setting.
The internal structure of tests also can be examined by asking students to describetheir general reactions to each scale and asking professional educators to judge the appropriatenessof contents of each scale.
ALLOWING STUDENTS TO REACT TO THE INVENTORY
During tleldtesting, a six-statement questionnaire was inserted at the end of eachproposed EQAI scale. Students who were selected to respond to the questionnaire representeda range of high, average and low socioeconomic backgrounds attending urban, suburban and ruralschools. Approximately 300 students per EQA1 scale responded to the special questionnaire. Forexample, students who had completed the Goal ISelf-Esteem scale were asked:
I. In general, do you feel that the questions get atself-understanding?(Please circle Yes or No)
2. Do you think you answered these questions honestly?(Please circle Yes or No)
3. Please write a sample question that would better reflectself-understanding.
4. Go back through the scale and identify those statements whichyou had difficulty understanding. Please write down thequestion numbers.
5. Please list the words which you had difficulty understanding.
6. General comments. Here is a chance for you to write anycomments you might have about this scale.
Data obtained from this procedure were used to refine the instruments and to obtainestimates of face validity. The percentage of respondents agreeing that particular tests appearedto reflect the trait of interest ranged from 93 per cent for the creative activities scale through98 per cent for the Goal III mathematics test. An average 96 per cent felt that they had respondedhonestly to test items. Responses to question six indicate that fewer than 5 per cent of thestudents felt that time spent completing the scales was wasted (i.e. they thought the tests werestupid, not relevant, or unrealistic to their personal lives.)
51 46

JUDGMENTS OF TEST CONTENT BY EDUCATORS
When constructing tests to be used in a statewide assessment program, it is extremelyimportant to make systematic efforts to insure that item and scale content are both logicallyand empirically related to the concepts they are designed to me ure. From the outset, contentspecifications were developed for each goal area. Items and test formats were then designed toreflect these specifications as closely as possible. Working papers for each instnnnentdescribingits item development and selection procedurestogether with its content map, are available atthe office of the Division of Educational Quality Assessment in Harrisburg.
During all stages of test development, curriculum specialists from the Department ofEducation, together with measurement researchers and local school district personnel, judged itemcontent, scope and appropriateness. In addition, 40 teachers and administrators from the CarlisleArea School District who had undergone a 15-hour training program in quality assessmentprocedures were asked to rate each final instrument in terms of item and content appropriateness.The lowest agreement of content appropriateness was found for the creative activities scale (90per cent thinking the test adequately measured the concept). Between 94 and 98 per centagreement on content appropriateness was obtained for the other 10 scales.
STUDENT SCORES vs TEACHER PERCEPTIONS
The major purpose of the quality assessment procedure is to identify student progressin the 10 quality education goal areas. This will enable educators to more clearly focus curriculumefforts on student strenghths and weaknesses. The ability cf teachers to identify student needsby classroom observation techniques is germane to meeting student needs or maintaining alreadyhigh levels of student achievement. An important question in this regard is: Do student test scorescorrespond to teacher Judgments based upon observations of student classroom behaviors?
Faculty and administrators from both the middle (N=8) and senior high schools (N=20)of Carlisle Area School District participated in a 15 hour in-service workshop sponsored Jointlyby the state educational department's Bureau of Curriculum Services, Capitol Area IntermediateUnit and the Carlisle Area School District. Training was conducted by Division of QualityAssessment personnel and was designed to communicate the nature and substance of the EQAprogram and to familiarize teachers with goal measurement rationales and test content.Concurrently the entire student body at both grades 8 and 11 completed appropriate forms ofthe EQA Inventory. After initial training in classroom observation techniques, teachers were askedto nominate the highest 20 per cent and lowest 20 per cent of their students in the areas ofself-esteem, tolerance, attitude toward school and learning, citizenship, health habits, creativeperformance and coping with change.
Each student was then assigned a score based on the number of high or low nominationsthe student received. Each score was a ratio formed by taking the number of positive highnominations minus the number of negative low nominations divided by the number of possiblenominations. Distributions formed from these scores were then examined in order to place studentsinto high and low groups for the purpose of analysis.
The number of students in each group varied from goal to goal and typically rangedfrom 75 to 100. Differences in mean scores between the high/low groups were statistically evaluatedvia a series of Fisher-Behrens t tests which correct for biases associated with unequal varianceswhen sample sizes are unequal.

esT copy AvKABLE
Table 3 presents the mean scores for the high and low teacher nominated groups, thet value along with its associated level of statistical significance and the point biserial correlationcoefficient between group membership and scale scores. Scale names are given in acronym form.As can be seen from the probability column, student scores on five of the seven compositeinstruments are significantly related to teacher perceptions.
Statistically significant relationships between teacher perception of classroom behaviorand test scores are found for the total scale and each subscale for Coal I-self-esteem, GoalIV-interest in school, Goal V-citizenship and Goal VI-health habits. This indicates that teacherswere readily able to observe characteristics in their students which were also picked up by thestudent's responses to the test items. The relationship found for Goal II is significant for thetotal scale and three of the five subscales. The race and religion subscales failed to reveal significantdifferences. Student tolerance toward others of a different race or religion may rarely be expressedin this school and, therefore, be observed by teachers too infrequently to serve as a reliablebasis for classification. Only one subscale for Goal X-coping with change was significant. Again,circumstances in which teachers might observe students with regard to this characteristic mayappear very seldom in the classroom environment. None of the Goal VII-creative performancescales showed reliable relationships with teacher perception.
Table 4 gives a criterion-referenced perspective to the results of the Carlisle study. Theper cent of students passing at each of the criterion scoring levels for high and low groups areshown. Also given is the difference in the per cent passing between the groups and the levelof statistical significance of this difference based on test results.
Note that the interest in school and citizenship instruments show significant differencesacross all three criterion levels.
The creative activities scale shows statistically reliable differences at the second criterionlevel. Recall from Table 3 that this scale failed to discriminate between groups when norm scoringprocedures were used.
All seven instruments investigated in this study show the ability to discriminate betweenteacher-selected high and low groups on at least one, and in most cases more than one, criterionlevel.
The combined norm-referenced and criterion-referenced results give strong support tothe notion that teachers, through close classroom observation, can identify generally the samestudy is that the tests show to be above average or below average on the seven general traitsmeasured by the EQAI.
53
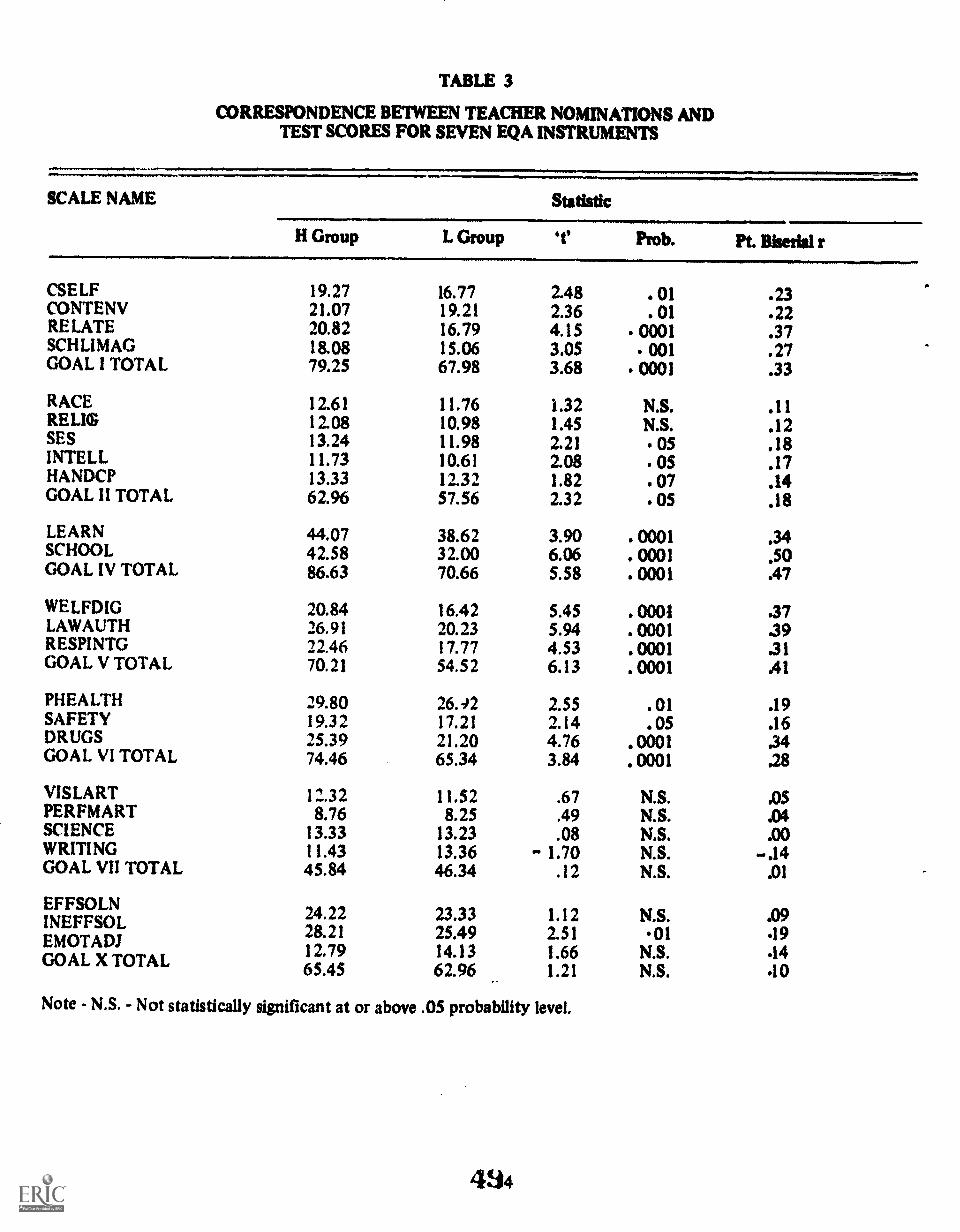
TABLE 3
CORRESPONDENCE BETWEEN TEACHER NOMINATIONS ANDTEST SCORES FOR SEVEN EQA INSTRUMENTS
SCALE NAME Statistic
H Group L Group "t' Prob. Pt. Bkerfal r
CSELF 19.27 16.77 2.48 . 01 .23CONTENV 21.07 19.21 2.36 .01 .22RELATE 20.82 16.79 4.15 0001 .37SCHLIMAG 1&08 15.06 3.05 001 .27GOAL I TOTAL 79.25 67.98 3.68 0001 .33
RACE 12.61 11.76 1.32 N.S. .11RELIG 12.08 10.98 1.45 N.S. .12SES 13.24 11.98 2.21 05 .18INTELL 11.73 10.61 2.08 . 05 .17HANDCP 13.33 12.32 1.82 . 07 .14GOAL II TOTAL 62.96 57.56 2.32 . 05 .18
LEARN 44.07 38.62 3.90 . 0001 .34SCHOOL 42.58 32.00 6.06 . 0001 .50GOAL IV TOTAL 86.63 70.66 5.58 .0001 .47
WELFDIG 20.84 16.42 5.45 . 0001 .37LAWAUTH 26.91 20.23 5.94 .0001 .39RESPINTG 22.46 17.77 4.53 .0001 .31GOAL V TOTAL 70.21 54.52 6.13 . 0001 .41
PHEALTH 29.80 26.42 2.55 .01 .19SAFETY 19.32 17.21 2.14 . 05 .16DRUGS 25.39 21.20 4.76 .0001 .34GOAL VI TOTAL 74.46 65.34 3.84 .0001 .28
VISLARTPERFMART
12..328.76
11.528.25
.67
.49N.S.N.S.
.05
.04SCIENCE 13.33 13.23 .08 N.S. .00WRITING 11.43 13.36 - 1.70 N.S. -.14GOAL VII TOTAL 45.84 46.34 .12 N.S. .01
EFFSOLNINEFFSOLEMOTADJGOAL X TOTAL
24.2228.2112.7965.45
23.3325.4914.1362.96
1.122.511.661.21
N.S.01
N.S.N.S.
.09
.19
.14
.10
Note - N.S. - Not statistically significant at or above .05 probability level.

TA
BL
E 4
CO
RR
ESP
ON
DE
NC
E O
F ST
UD
EN
T P
LA
CE
ME
NT
IN
TO
HIG
HL
OW
GR
OU
PS B
Y T
EA
CH
ER
NO
MIN
AT
ION
AN
D T
EST
SC
OR
ES
FOR
SE
VE
N E
QA
IN
STR
UM
EN
TS:
CR
ITE
RIO
N-R
EFE
RE
NC
ED
SC
OR
ING
Scal
e N
ame
Self
Est
eem
Tol
eran
ceto
war
dO
ther
s
Inte
rest
inSc
hool
titC
itize
nshi
pie
l
Hea
lthH
abits
Cre
ativ
e
Gl
vAct
i 'tie
s
PreP
arbi
gfo
rC
hang
e
Scor
ing
Lev
els
Lev
el O
neL
evel
Tw
oL
evel
Thr
ee
% P
assi
ng P
er G
roup
% P
assi
ng P
er G
roup
% P
assi
ng P
er G
roup
Hig
hL
owD
M*
Prob
.H
igh
Low
Mr
Prob
.IR
AL
owD
IMPr
ob.
9792
5N
.S.
8961
28.0
001
6943
2700
20
9185
6N
.S.
7572
3H
.S.
4026
14.0
050
9672
24.0
004
8045
35.0
001
6742
35.0
001
7630
36. 0
001
3913
26.0
001
186
12.0
100
9672
24.0
001
6043
17.0
100
16II
5N
.S.
8879
9N
.S.
7762
16.0
200
3730
7N
.S.
9996
3N
.S.
8482
2N
.S.
2310
13.0
300
Not
e;D
iff*
sta
nds
for
diff
eren
ce b
etw
een
per
cent
pas
sing
in H
igh
vs L
ow g
roup
s.
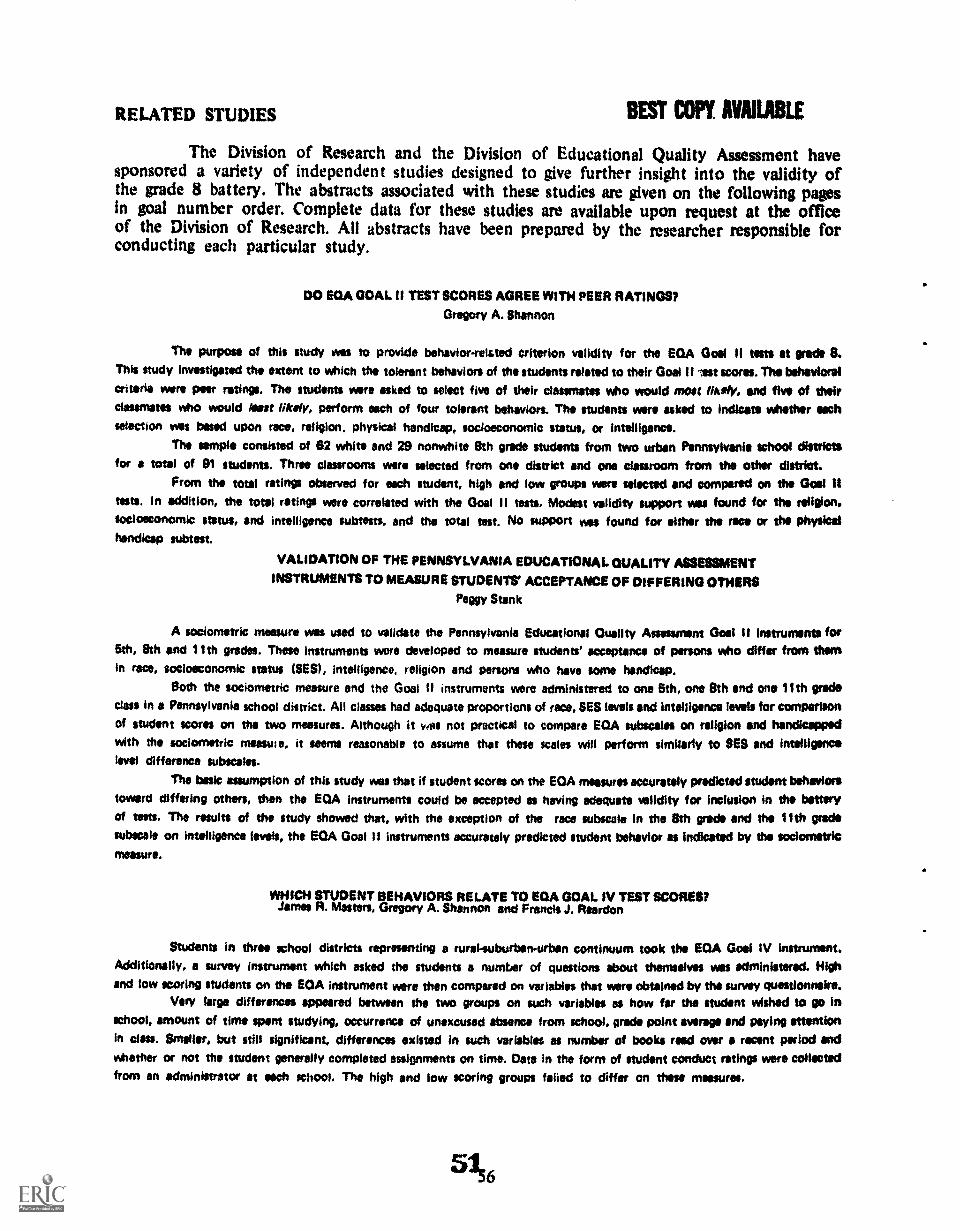
RELATED STUDIES BEST COPY AVAILABLE
The Division of Research and the Division of Educational Quality Assessment havesponsored a variety of independent studies designed to give further insight into the validity ofthe grade 8 battery. The abstracts associated with these studies are given on the following pagesin goal number order. Complete data for these studies are available upon request at the officeof the Division of Research. All abstracts have been prepared by the researcher responsible forconducting each particular study.
DO EGA GOAL II TEST SCORES AGREE WITH PEER RATINGS?
Gregory A. Shannon
The purpose of this study was to provide behavior-relfited criterion validity for the EGA Goal II tests at grade B.This study investigated the extent to which the tolerant behaviors of the students related to their Goal II lest worts. The behavioral
criteria were peer ratings. The students were asked to select five of their classmates who would most /fa*, and five of theirclassmates who would Mast likely, perform each of four tolerant behaviors. The students were asked to indices whether eachselection was based upon race, religion, physical handicap, socioeconomic status, or intelligence.
The sample consisted of 62 white end 29 nonwhite 8th grade students from two urban Pennsylvania school districtsfore total of 91 students. Three classrooms were selected from one district and one classroom from the other district.
From the total ratings observed for each student, high and low groups were selected and compared on the Goal II
tuts. In addition, the total ratings were correlated with the Goal II tests. Modest validity support was found for the religion.socioeconomic status, and intelligence subtests, and the total test. No support was found for either the rams or the PhYsioldhandicap :tamest.
VALIDATION OF THE PENNSYLVANIA EDUCATIONALQUALITY ASSESSMENTINSTRUMENTS TO MEASURE STUDENTS' ACCEPTANCE OF DIFFERING OTHERS
Peggy Stank
A sociometric measure was used to validate the Pennsylvania Educational Quality Assessment Goal II Instruments for5th, 8th end 11th grades. These instruments were developed to measure students' acceptance of persons who differ from themin race, socioeconomic status (SEW, intelligence, religion end persons who have some handicap.
Both the sociometric measure and the Goal II instruments were administered to one 6th, one 8th and one 11th gradeBass in a Pennsylvania school district. All classes had adequate proportions of race, SES levels and intelligence levels for comparison
of student scores on the two measures. Although it Was not practical to compare ERA SubeCallte on religion and handicapped
with the sociometric imam., it seems reasonable to assume that these scales will perform similarly to SES and intelligencelevel difference subscribe.
The basic assumption of this study was that if student scores on the EGA measures accurately predicted student behaviors
toward differing others, then the EGA instruments could be accepted as having adequate validity for inclusion in the battery/of tests. The results of the study showed that, with the exception of the race subscale in the 8th grade and the 11th Wadesubecale on intelligence levels, the EQA Goat II instruments accurately predicted student behavior as Indicated by the soolornehiomeasure.
WHICH STUDENT BEHAVIORS RELATE TO EQA GOAL IV TEST SCORES?James R. Misters, Gregory A. Shannon and Francis J. Reardon
Students in three school districts representing a rural-suburbenurban continuum took the EGA Goal IV instrument.Additionally, a survey instrument which asked the students a number of questions about themselves was administered. Highand low scoring students on the EQA instrument were then compared on variables that were obtained by the survey questionnaire.
Very large differences appeared between the two groups on such variables as how far the student wished to go inschool, amount of time spent studying, occurrence of unexcused absence from school, grade point average and paying attentionin class. Smeller, but still significant, differences existed in such variables as number of books reed over a recent period andwhether or not the student generally completed assignments on time. Data in the form of student conduct ratings were collectedfrom an administrator at each school. The high and low scoring groups failed to differ on these measures.
5156

UST COPY AVAILABLE
Extremely high and tow scorn on the EGA Gael IV test differ markedly on several behavioral variables that indicatepositive attitudes. Such a finding lends a great deal of support to the validity of the 8th grade Instrument es a measure ofstudent attitude toward school.
DISCRIMINATION OF CITIZENSHIP CHARACTERISTICS
IN AN INSTITUTION FOR NEGLECTED AND DELINQUENT GIRLS
N. F. Russell
This study was conducted in a home for wayward girls located In western Pennsylvania. The institution ties a statedpolicy of periodic appraisal (awry three months) of each resident's social and emotional adjustment. Evaluations are made by
a three - member teem including a psychologist, a case WWIr and a cottage attendant. Characteristics which are evaluated include
parsons! responsibility, honesty, fighting behaviors and ability to get along with others. Assignments to living quarters are made
contingent upon the above evaluations. As a girl's adjustment improves, she is moved to another cottage with girls of similaradjustment and with more privileges. There are five cottage units in the institution with cottage number five housing the mostadjusted of the students.
The scale was administered to the entire population of girls IN481 living in the institution. For purposes of analysisthe girls were separated into two groups. Those living in the first three cottages formed group one (snort msdatiusted, W2e)Group two (mot adiusapit N211 was composed of girls housed in coneve four and five.
Analyses revealed that the citizenship scale could (1 discriminate between these two groups (the adiusted group
higher, and (2) discriminate between the total institutional group and a group of public school children having *IC homebackgrounds (the public school group scoring higher.
THE RELATIONSHIP BETWEEN THE EGA GOAL VII SCORES
AND SELECTED AREAS Of CREATIVE ATTITUDE AND OUTPUT
Gregory A. Shannon and James R. Masters
This study was designed to obtain validity support for the EGA Goal VII subtusts and the total test %nen scoredby either the norm-referenced or the criterion-reference ./ "withod. The Natoli consisted of 38 grade 8 students from a suburban
Pennsylvania school district.
The criterion measures included a questionnaire and a semantic differential instrument. For each activity describedin the al VII test, the questionnaire asked about the students' willingness to do the activity, how much they felt their schoolwould encourage them in it, the grade level at which the students last performed the activity, and the number of dines eachactivity wes performed during the previous two years. The second Instrument asked the students to respond to adjective wordizeirs
describing how they felt about working on visual arts, performing arts, writing end science Projects. This Instrument *redmeasures of how much the students would like to do the activities, how competent they felt about doing the activities, andthe extent to which they felt that their teacher would encourage them.
Validity support *es found for the total Goal VII test and all of the subteen when tared by ether of the twoscoring methods, except the output scars of the visual arts subtest. Students who earned high scores on the total test tendedto enjoy working on eruptive activities. Students who earned high scores on the subteen tended to have a positive attitudetoward doing the activities described by each subtest. Students who earned high mores on the performing arts, writing andscience Waists tended to have performed these activities at either the 7th or the 8th grade level.
Thus, the studies done in 1974 support the validity of this test by showing a positive relationship between EGA GoalVII test scores and saignorts of student behaviors and attitudes.
GOAL IXRADE S VALIDITY STUDYGrace E. Laverty and Joyce S. Kim
Goal IX wee validated by a correlational study with scores from the EGA inventory subsea* compared with choicesmade in the tame content area on a survey of possible field trips and pre emotions.
The sample included 66 eighth grade pupils from a school representing suburban and rural communities and varioussocioeconomic levels. The 8th grade sample NM taken from two social studies classes which were completely heterogeneous
groups. Thus, the sample for testing was fairly representative of the 8th graders in the school.
57

The pupils completed the EQA inventory and a survey of special events presented as possible field trips or specialprograms. They were asked to select as many of the 18 events as they would be interested in attending. The analysis comparedtheir choices in each of the nine content areas with their wore on the inventory items representing that content are.
A similar study was done at grades 5, 8 end 11. Over ell grubs and content areas, representing 30 separate correlations,coefficients were positive except for one. The 8th spade analysis showed positive correlations in ail areas and on the overallwet, end all were statistically significant except world events and science. In general, the evidence gathered by comparing actualchoices by students in the survey of special events with their scores in the related area of Goal DC Inventory-suggested thatthe instrument is meesuring attitudes and virtues in these areas of human licCOMPIlehrtient
00 EQA GOAL X SCORES AGREE WITH TEACHER RATINGS OF STUDENTS' ABILITY TO ADJUST TO CHANGE?
James R. Misters and Gregory A. Shannon
A study of the instrument's validity yes conducted in e suburban school district where a Iwo percentage of the studentpopulation had undergone change in their lives. Approximately 60 8th grade studentswho had experienced a greet deal of change(termed the Change group), end 60 8th grade students who had experienced little change itermed the Nonchange Croup) participatedIn the study. The Change group had lived through such upsets as parental divorces, separations or deaths, or had experiencedat least two residential movements. Because they had lived through change, their ONY4041Y behaviors would reflect how wonthey had been able to dui with It. Also, since situations described in the EQA instrument would be similar to those theyhad experienced, their predictions of behavior would be expected to be more accurate than those of others In their schools.
From the 120 students, teaches were asked to choose 'Unions high and low in emotional fortitude -defined as theability to 1) recover from a serious median& setback, 2) confront difficult obstacles, and 3) dist:Wino and direct one's ownbehavior in order to achieve a goal.
For the Change group, those rated high scored higher than those rated low on both the ineffective solutions subeditsand the total instrument. For the Nonchange group no differences were found between highs and Ions for any submit* orfor the total instrument.
Support was found, therefore, for the validity of both the ineffective solutions subscaki and the total instrument. Inaddition, students had little difficulty Piecing themselves in the situations presented in the instrument, and 92 per cent feltconfident that their responses accurately reflected their actual behaviors.
551
VALIDITY INFORMATION FROM FACTOR ANALYSIS
Factor analysis is a term used to describe a set of statistical procedures which canbe used to analyze the intercorrelations among a set of variabits such as test scores. Factor analysisaids us in interpreting these relationships in terms of underlying factors and gives us insight intothe amount of variation in each separate EQAI instrument which is associated with each of thehypothetical factors. In the general sense, factor analysis presents a picture of how students respondto the test battery in its entirety by showing how the scale scores within the battery clustertogether.
Factor analysis begins with a correlation matrix of all the instrument scores containedin the battery. For the purposes of this publication, the matrix presented in Table S is limitedto the 26 subscales and the math and verbal instruments. All subscale names are given in acronymform due to space limitations. This table has two X and Y columns per page. In each columnset acronyms for two subscales are given together with the correlation coefficient for that pair.Correlations are based upon approximately 3500 student records selected from the March 1974testing period which constitute a systematic sample from the data tape containing about 50,000student records.
A series of analyses were performed on this correlational data which helped identifythe underlying factor structure of the EQA Inventory. This structure may inferred by examiningthe clusters of subscales displaying correlations to a given factor. Resuhs wf these analyses arepresented in Table 6.
This table lists the subscales in the left hand column. The coefficients in the bodyof the table are correlations between each subscale and the eight factors listed horizontally nearthe top of the table. These correlations are called factor loadings, and define the factor by showinghow much each subscale is related to it. The highest loadings for each factor are highlightedby a box drawn around them. By looking to the subscale names associated with these loadingsf3ne can understand which subscales describe the factor.
FACTOR ONE: RESPONSIBILITY FOR WELL -BEING OF SELF AND OTHERS
Factor one appears to be composed of the citizenship (Goal V) and health (Goal VI)subscales. That these two goal areas cluster is due in part to methods used to obtain scores.Both tests have identical formats: persons are asked to put themselves in a make-believe student'splace and decide whether to take ideal actions under a variety of motivation-including conditions,(i.e., peer pressure, reward, etc).
Although the clustering of these subscales appears to be artifact of type of formatused to elicit students' n'sponses, a common variable also seems to be mirrored by this factor.Each of .the subscales in this cluster require that the students exhibit a sense of personalresponsibility for their own well-being and the well-being of others in relation to health, safetyand social interactions.
Extraction of principal components followed by variance rotationSee Harmon, H. H., ModemFactor Analysis, Chicago Press, 1960.
59 34

FACTOR TWO: ATTITUDE TOWARD CREATIVE ENDEAVORS
This factor is chiefly defined by the creative activities subscales indicating that the GoalVII instrument tends to give information about students, which is relatively independent fromthat offered by the other EQAI scales. The relatively high correlation of this factor to the GoalIX receiving subscale, shows that people who like to participate in science, art, writing andperforming activities also like to observe others who are recognized as being proficient in similarareas.
FACTOR THREE: SELF-ESTEEM
The subscale cluster comprising this factor is basically associated with the self-esteeminstrument. In addition, a clear relationship is also found between this factor and the interestin school (Goal IV) subscale. This is understandable since many of the items in the Goal I testattempt to assess self-esteem in the context of the classroom environment. Therefore, it is notsurprising to find that some students who have a good self-concept in the school setting alsotend generally to have positive feelings about their school experiences.
FACTOR FOUR: TOLERANCE TOWARD OTHERS
How comfortable students feel when coming into contact with others differing in racial,religious, wealth, intellectual, or physical attributes forms the base of this factor. This feelingstate also has an action counterpart which is mirrored by the idency to refrain from behaviorsthat might harm others. Evidence for this action component ;hown by the significant positiverelationship between the Goal V citizenship subscale-concern Tor welfare and dignity of othersand this factor. The Goal IX valuing human accomplishments subscale also relates to this factor,demonstrating that the tendency to stereotype others in a negative way is also related to theperson's intolerance of others.
FACTOR FIVE: BASIC COGNITIVE SKILLS
Th factor is composed of the three basic skills measures (math, verbal and vocationalknowledge) and the Goal VI drugs subscale. The positive correlation between the Goal I controlof environment subscale and this factor suggests that students who are more successful in schoolachievement believe that they can influence, to a greater extent, their personal destinies.
FACTOR SIX: VALUING THE EDUCATIONAL EXPERIENCE
This factor is complex in that it is defined by various subscales across four goal areas.Included in this factor are the Goal I image in school settings, Goal IV attitude toward schooland interest in learning, Goal IX valuing and receiving and Goal X effective solution subscales.All of these scales relate to attitudes and behaviors associated with classroom or school-relatedsettings.
It appems from the way these subscales cluster that this factor might represent a beliefthat the classroom, school and general community are all fertile grounds to engage in learningexperiences.
FACTOR SEVEN: EMOTIONAL ADJUSTMENT TO CHANGE
This factor is defined by two subscales in the Goal X coping with change instrument.The length of time necessary to adjust emotionally to frustration is seen to be strongly associatedwith the tendency to refrain from aggressive or withdrawal reactions to frustrating events. A
5560

vicious circle might be reflected here in that people who get very upset in the face of changemight be more willing to try negative solutions to their personal problems, leading to a newproblem and, hence, a continuation of anxiety.
FACTOR EIGHT: PERSONAL AND EMOTIONAL HEALTH
This factor is basically defined by the Goal VI health, drug and safety subscales tAggetherwith the effective and ineffective solution subscales of Goal X. All five of these subscales Hateto student willingness to take various actions in social settings which relate to their physicalor mental well-being. Interpretation of this factor suggests that people who are less able to copewith frustration tend to take greater risks in areas of safety, health and drug areas.
Tables 7 and 8 present additional statistics resulting from factor analytic procedures.The proportion of variation within each subscale that can be accounted for by the eight factorsolution is shown in Table 7. The explained variation ranges from .54 for the religion subscaleto a high of .87 for the emotional adjustment subscale. The Percent of Trace column in Table8 shows what proportion of variability in student scores in the entire test battery can be explainedby each of the eight factors.
566 I
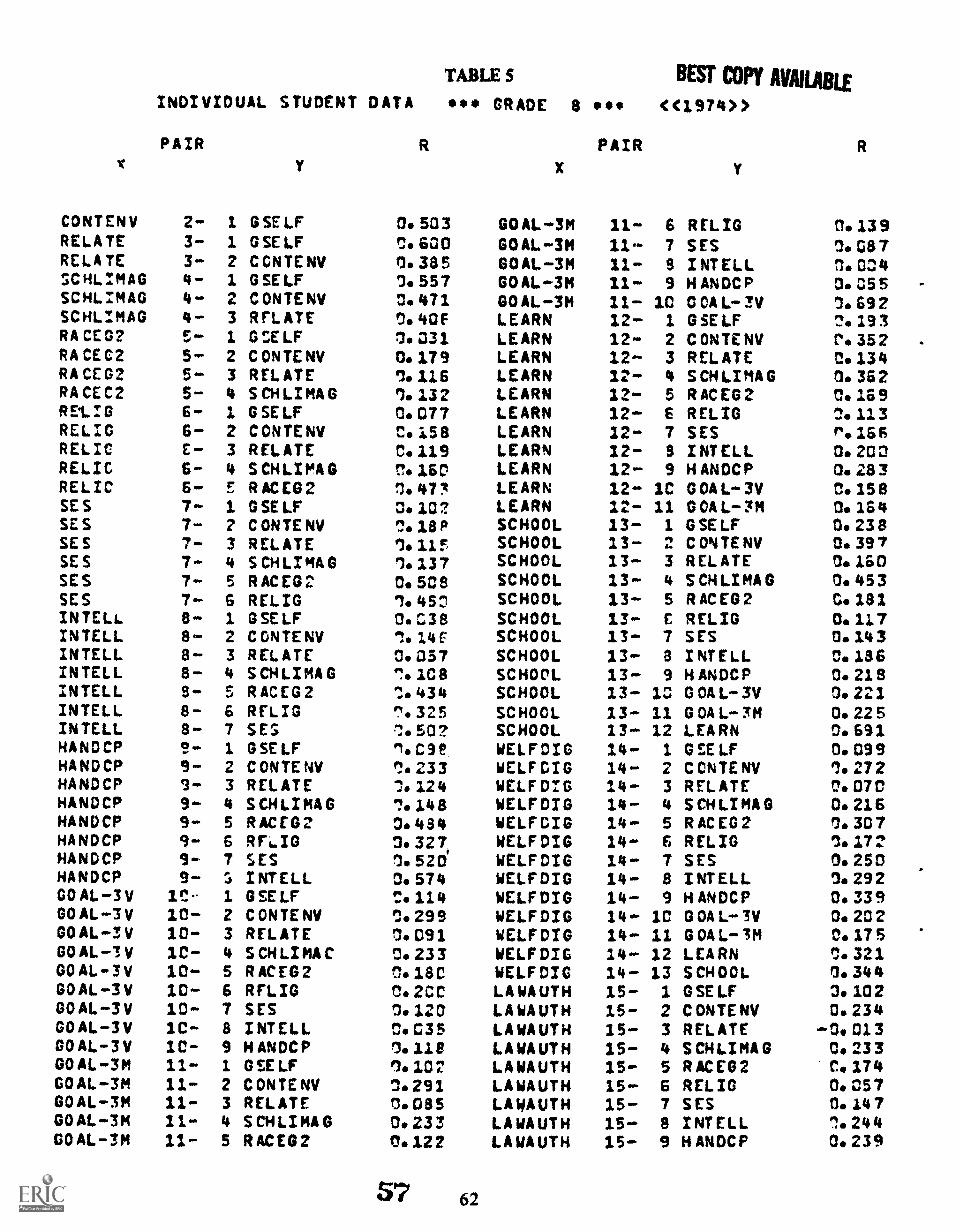
TABLE S BEST COPY AMIABLEINDIVIDUAL STUDENT DATA loPAIR R
GRADE 8
X
'es
PAIR
<C1974>>
Y
R
CONTENV 2- 3. GSELF 0. 503 GOAL -3M 11- 6 RELIG 3.139RELATE 3- 1 GSELF C. 600 GOAL -3M 11-* 7 SES 3.087RELATE 3- 2 CCNTENV 0.385 GOAL -3M 11* 9 INTELL 3.004SCHLIMAG 4- 1. GSELF 0.557 GOAL -3M 11- 9 HANDCP 0.055SCHLIMAG 4.. 2 CONTENV 0.471 GO AL*3M 11- 10 COAL -3V 0. 692SCHLIMAG 4* 3 !MATE 0. 40F LEARN 12* 1 GSELF 7. 193RA CEO? 1 GSELF 0. 031. LEARN 12- 2 CONTENV C. 352RACEC2 5.* 2 CONTENV 0. 179 LEARN 12* 3 RELATE C. 134RA CE 02 5* 3 RELATE l116 LEARN 12- 4 SCHLIMAG 3. 362RACEC2 5- 4 SCHLIMAG 3.132 LEARN 12- 5 RACEG2 C. 169RE'LIG 6* 2. GSELF 0.077 LEARN 12- 6 RELIC .1. 113RELIC 6- 2 CONTENV C. 158 LEARN 12- 7 SESRELIC C- 3 RELATE 0.119 LEARN 12- 3 INTELL 0.200RELIC 6- 4 SCHLIMAG 0. 1.6C LEARN 12* 9 HANDCP 0.283RELIC 6- = RACEG2 1. 477 LEARN 12- 1C G OA L*3V C. 158SES 7* 1 GSELF 0.3.02 LEARN 12- 11 G OA L*3M 0. 164SES 7- 2 C ONTE NV ^.18P SCHOOL 13- 1 GSELF 4.238SE S 7- 3 RELATE 1. 115 SCHOOL 13- 2 CONTENV 0.397SE S 7- 4 SCHLIMAG 1. 137 SCHOOL 13- 3 RELATE 0.160SES 7*. 5 RACEG2 0. 538 SCHOOL 13- 4 SCHLIMAG 0.453SES 6 RELIC 1. 450 SCHOOL 13* 5 RACEG2 3.181INTELL 8- 1 GSELF 0. C38 SCHOOL 13* E RELIG D. 11.7INTELL 8* 2 C ONTE NV 1.14E SCHOOL 13- 7 SES O. 143INTELL 8.* 3 RELATE 0.057 SCHOOL 13- 3 INTELL 0. 186INTELL 8- 4 SCHLIMAG .0108 SCHOOL 13- 9 HANDCP 0. 218INTELL 8- 5 RACEG2 1.434 SCHOOL 13* IC GOAL -3V 0.221INTELL 8- 6 RELIC 325 SCHOOL 13- 11 GOAL -FM 0. 225INTELL 8- 7 SES 502 SCHOOL 13* 12 LEARN O. 691HANDCP 1? 2. GSELF 1. C9P WELFDIG 14- 1 GEE LF 0.099HANDCP 9- 2 CONTENV 1. 233 WELFDIG 14- 2 CCNTENV 1. 272HANDCP 9- 3 RELATE di. 124 WELFDIG 14* 3 RELATE 0. 070HANDCP 9.* 4 SCHLIMAG 1.148 WELFDIG 14- 4 SCHLIMAG 0.216HANDCP 9- 5 RACEG2 0.484 WELFDIG 14* 5 RACEG2 3.307HANDCP 9- RFIG 0. 327 WELFDIG 14- £ RELIC 0.172HANDCP 9.. 7 SES 7.520 WELF DIG 14- 7 SES 0. 250HANDCP 9- INTELL 0. 574 WELFDIG 14- 8 INTELL 0. 292GO AL*3 V IC.- 1 GSELF 0.11.4 WELFDIG 14- 9 HANDCP 0. 339GO AL*3 V 2 CONTENV 3.299 WELFDIG 14- 10 GOAL -'!V 0. 202GO AL*3 V 10- 3 RELATE 7. 091 WELFDIG 14* 11 GOAL*3M 0.175GOAL-3V 10- 4 S CHUM C 0. 233 WELFDIG 14- 12 LEARN C. 321GO AL*3 V 10- 5 RACEG2 0. 18C WELF DIG 14* 13 SCHOOL 0.344GOAL -3V 10.-. 6 RELIG Co 2CC LA WA UTH 15* 1 GSELF 3. 102GO AL..-3 V 10- 7 SES 0. 120 LA WA UTH 15- 2 CONTENV 0.234GOAL -3V IC- 8 INTELL C. 335 LA WA UTH 15- 3 RELATE -0.013GO AL*3 V 10- 9 HANDCP 0.118 LA WA UTH 15* 4 SCHLIMAG O. 233GOAL -3M 11* 1 GSELF LA WAUTH 15- 5 RACEG2 C. 174GOAL -3M 11- 2 CONTENV 3.291 LA WA UTH 15- 6 RELIC 0.057GOAL -3M 11- 3 RELATE O. 085 LA WA UTH 15* 7 SES 0. 1.47GOAL -3M 11* 4 SCHLIMAG 0.233 LA WA UTH 15- 8 INTELL la 244GOAL-3M 11- 5 RACEG2 C. 122 LA WA UTH 15- 9 HANDCP 0.239
57 62
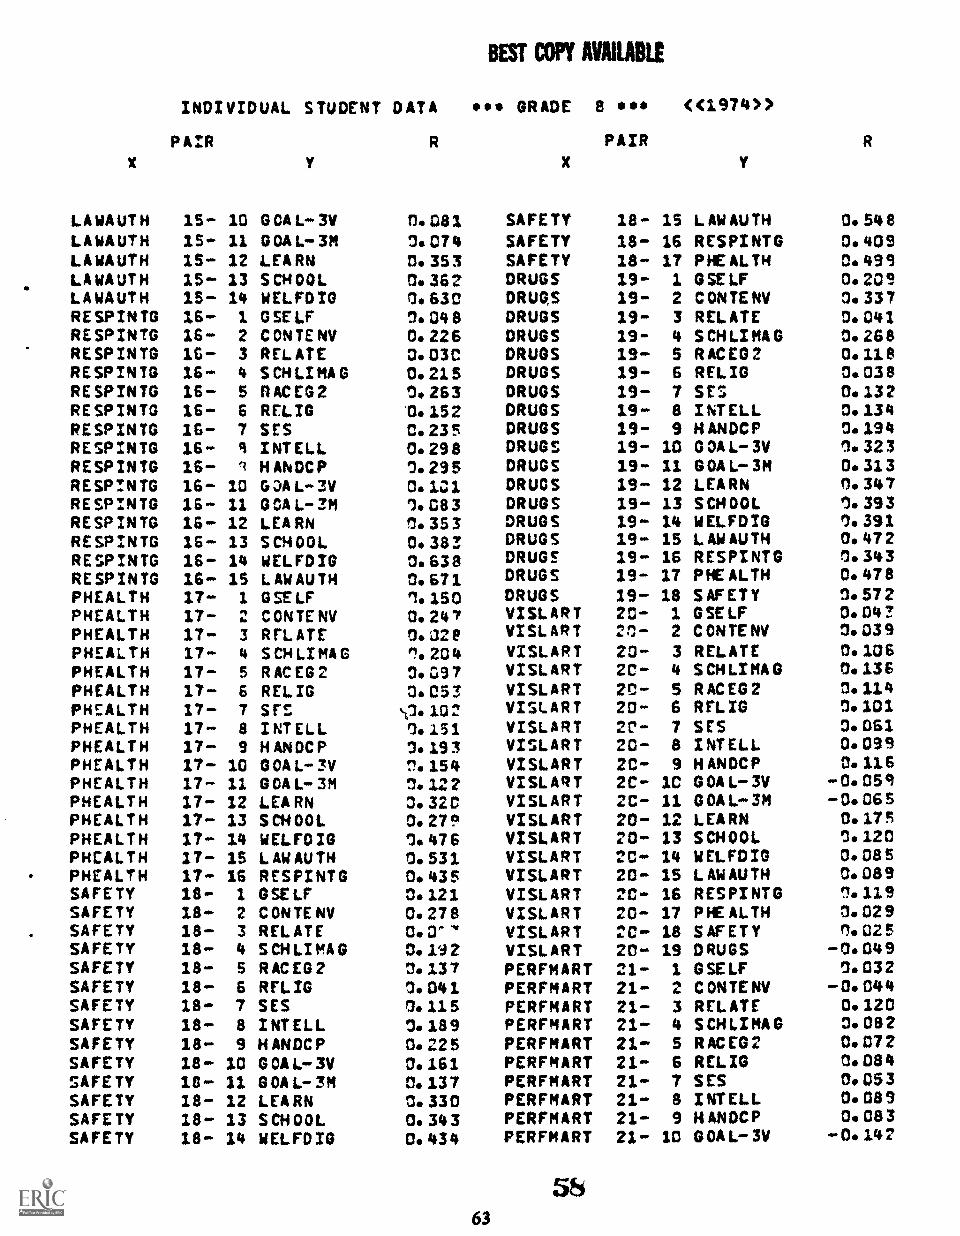
BEST COPY MAN
X
INDIVIDUAL STUDENT DATA
PAIR R
Y
GRADE
X
e los*
PAIR
((1974))
Y
R
LAWAUTH 15*. 10 GOAL -3V 0.081 SAFETY 18- 15 LAWAUTH 0.548LAWAUTH 15- 11 GOAL -3M 0.074 SAFETY 18- 16 RESPINTG 0. 409LAWAUTH 15- 12 LEARN 0. 35 3 SAFETY 18- 17 PHEALTH 0.439LAWAUTH 13 SCHOOL a. 362 DRUGS 19*. 1 GSELF 0.209LAWAUTH 15*. 14 WELFDIG 0. 630 DRUGS 19- 2 CONTENV 0. 337RE SP IN TO 16*. 1 GSELF 0. 04 8 DRUGS 19- 3 RELATE 0. 041RE SP IN TO 16- 2 CONTENV 0. 22 6 DRUGS 19* 4 SCHLIMAG 0. 268RE SP IN TO 16- 3 RELATE O. 030 DRUGS 19- 5 RACEG2 0.138RESPINTG 16- 4 SCHLIMAG 0.215 DRUGS 19- 6 RELIC 0.038RE SP IN TG 16*. 5 RACEG2 0. 263 DRUGS IT* 7 SES 0.13 2RESPINTG 16- 6 RELIG 01.152 DRUGS 19** 8 INTELL O. 134
RESPINTG 16- 7 SES C. 23 DRUGS 19- 9 HANDCP 0. 134
RESPINTG 16- i INTELL 0. 29 8 DRUGS 19*. 10 GOAL -3V 1. 323RESPINTG 16- '1 HANDCP 0.2955 DRUGS 19- 11 GOAL -3M O. 31 3
RESPINTG 16- 10 G3AL*..3V 0.101 DRUGS 19- 12 LEARN 0. 34 7
RESPINTG 16- 11 GCAL...ZM 1. 083 DRUGS 19.* 13 SCHOOL 0. 393
RE SP INTO 16- 12 LEA RN 0. 35 3 DRUGS 19*. 14 WELFDIG 0.391RESPINTG 16*. 13 SCHOOL 0.383 DRUGS 19*. 15 LAWAUTH 0.472RESPINTGRE SP INTO
16*.
16...
1415
WELFDIGLAWAUTH
0.6380.671
DRUGSDRUGS
19-19-
1617
RESPINTGPHEALTH
0.3430. 478
PHEALTH 17*. 1 GSELF 1. 150 DRUGS 19- 18 SAFETY 3. 57 2
PHEALTH 17... 2 C ON TE NV 0.241 VISLART 20- 1 GSELF O.04?PHEALTH 17** 3 RELATE 0.32P VISLART 2C- 2 CONTENV 3.03 9
PHEALTH 17- 4 SCHLIMAG 1.204 VISLART 20*. 3 RELATE O. 106
PHEALTHPHEALTHPHEALTHPHEALTH
17-17.*
17-17-
5
6
7
8
RACEG2RELIGS rS
INTELL
0.0370. 053
'II. 10
0.151
VISLARTVISLARTVISLARTVISLART
20-20-20-2C*
4
56
7
SCHLIMAGRACEG2RELICSES
0. 136
a.1143.1013.061
PHEALTH 17** 9 HANDCP 7.19 3 VISLART 20- 8 INTELL 0.039PHEALTH 17*. 10 GOAL -3V 0. 154 VISLART 20.* 9 H ANDCP 0. 116
PHEALTH 17*. 11 GOAL --3M I. 122 VISLART 20... 10 GOA L**3V -0.059PHEALTH 17- 12 LEA RN 0. 320 VISLART 2C 11 GOAL -3M -0.065PHEALTH 17- 13 SCHOOL 0.279 VISLART 20*. 12 LEARN 0.17SPHEALTH 17.* 14 WELFDIG 1.476 VISLART 20- 13 SCHOOL S. 120
PHEALTH IT.* 15 LAWAUTH 0. 531 VISLART 2C 14 WELFDIG 0.085PHEALTH 17- 16 RESPINTG 0.435 VISLART 20- 15 LAWAUTH 0. 089
SAFETY 18- 1 GSELF 3. 121 VISLART 20... 16 RESPINTG 13.9
SAFETY 18.* 2 CONTE NV 0.278 VISLART 20- 17 PIE ALTH 3.02 9SAFETY 18- 3 RELATE O. 0" VISLART 20- 18 SAFETY R. az sSAFETY 18** 4 SCHLIMAG 3. 19 2 VISLART 20*. 19 DRUGS -0.049SAFETY 18*. 5 RACEG2 3.137 PERFMART 21*. 1 GSELF 0.032SAFETY 18- 6 RELIC 0.041 PERFMART 21- 2 CONTENV 044SAFETY 18*. 7 SES 0.115 PERFMART 21** 3 RELATE 0. 120
SAFETY 18*. 8 INTELL 0.18 9 PERFMART 21*. 4 SCHLIMAG 3.032SAFETY 18- 9 HANDCP O. 22 5 PERFMART 21** 5 RACEG2 0. 07 2
SAFETY 18*. 10 G OA L..* 3V 0.161 PERFMART 21- 6 RELIC 0.084SAFETY le 11 GOA L.. 3M 0. 137 PERFMART 21- 7 SES 0.053SAFETY 18- 12 LEARN 0. 330 PERFMART 21.* 8 INTELL 0. 089SAFETY 18- 13 SCHOOL 0. 34 3 PERFMART 21*. 9 HANDCP 0. 08 3
SAFETY 18*. 14 WELFDIG 0. 434 PERFMART 21- 10 GOAL- 3V -0.142
5863

zr r4 CA 40 U4 LC 10 LO r4 141 r4 PI CJ CA Cn cr 01 P` Cu C.1 C.- PIA+ NtTM r4 cn C- um 02 on r4 cn 41* .4 Ch CNA r4 LC co cnLO v4 U2 NI v4 C3 0 0 CO C3 Pn PI 4P 40 UI c0 r- 4, 4' tP 13 P. CD 01 NU) cn VI C3 0 C4 4P (3 02 L3 Pn r4 PI 4P tO (3 111 CO C4 V) 61 r4 PI U0
CC (0 (0 .4 NI r4 N r4 44 r4 r4 UI 4 C4 r4 C3 C3 04 v4 NI C3 r4 0 4 .4 M r4 6'1 C1 N N CV N 61 61 4r 4 V% 0.1 PI C4 04 PI CI C3 C3 C3 NIteaCl C'tC =aaaC NC 0ancC DNC) C) NC) 0Nc] 000C3C'tC7C]N00CCOC]C3C')NC)C)( I Cl C3 CI C3 Cl Cl Cl1111 4
1-6 0 CD r- CD CD F0- CC La Zs Ng >2 0 Ze F. MC F.. CC 1/4 0 > et >Z CD X I.- :r r- CC ta 0 ICCC 4( to 2 La lc r, .1 CL NI ty: -3 1.4 I- it Fm N.- Cc at 0 ;C Z ta 3: r4 .j C. PI Pm .2 *4 1- it 1- 2,- cc 4 LA ar wN g 3C 2! U. Li 0.* F4 CD 0 - I is 1 I it CI 0 :I F4 -A r- un ,4c lc z f-tka. La r- F4 CD (2 .J CI 1 1 am c) a :o 04 .4 1... 0 0C 3: it F4 I_A u. Lij -3 F-. 4C -.1 La i...t La CI -3.40 CA ii. .4 CL 4c La 0 .4 La. La r- -1 F 4X .4 Li h4 Li C2 .4 .4 CC CI LA. a a. a La co ..1 L6 La 1- -JLl La It itt 4i 2C .4 2C LI 141 Lt. :2 umee r4 1.4 Li i! -2 OC C2 2! 0c 4c :c U1 CC pi 6.4 4x1-1 La C4 LA 0 LA CA AlIC L.; La 2! 4 CI C2 La C4 La 44 La 7C 4C a 04 La 0 c v 0 La 4.2 az La Li it 01 C2 C3 La t4 La we IA, 7C We Ce P4 Li CI CC 050 CI. Un CD C2 CC Ul CC CC tn F4 le 0 0 .4 GI 3t .4 Ct CL tn ca > a. in 2C CD 0 CC 0 CC CC LI 04 3C CD CD .4 EA 70 -3 CC CI. tn 0 311 Ci. 0 7B 0
C3 r4 Ci w4 04 rn c2 Ms CO C3 r4 C4 61 4P c0 h CO en 0 r4 Od P", N Pm cp um to pft 00 CI Ca r4 04 MI sr um U3 r- 0) cm ca v4 04 tn srN V4 04 v4 r4 r4 r4 v4 r4 '4 r4 r4 r4 P4 C4 04 ra r4 r4 r4 ri '4 r4 r4 r4 r4 r4 04 04 C4 04 C4
CC 1 1 1 4111411114441141111441111111111111111141414411141 H Men F) 4' 4' 4 4'4 a'4. e041 4' 4' 4' 4 4 ' 4 at 4 4 Us Ill Ws in Li) um um in U) U1 U) in um in (n u1 Is) CA In In It) U) in ina N C4 C4 04 C4 CA Ci CA CA CA CA CA C4 e4 C4 04 C4 C1 04 04 0104 C404 04 04CA 04 C4 ON CA Cs& f4 04 C4 04 em 04 C4 04 C4 C4 C4 CA C4 C4 C4 C4 C4 C4
CO11.
CO t3 0 IC DC IC DC IC NC SC SC NC `,4 2C NC IC IC NC NC SC NC IC SC IC IC YO 0 CD (2 C) 0 0 0 t2 C2 CD 0 CD CD CD CD 0 CD CD 0 CD CD CD (3Lat D C 2 Z 2 CO CO cO cO c0 c0 c0 c0 4M CC c0 co co CO CO CO CO CO a) cc act c0 0.122727ZZ2ZZ7Z2ZZ2272Z222Z
14 r4 I-1 ki P.1 #.4 14 hl Fi r4 rl r4 1.4 Fi $.1 F4 F4 F4 F4 F4 IA 04 F4at F.- 1.- F... .4 -4 .4 .4 .4 .4 -3 .4 .4 .4 .4 .4 -4 .4 .4 .4 .4 .4 .4 .4 .4 .4 J> :3 :3 :3 :2 :3 :3 :2 :3 :2 :2 :2 :2 :3 :3 :2 Z2 :2 :3 :3 :2 :21.4 F4 Fl 4 4( 4'4'4 et diC 4C 4t ele 0C qt mC 4 4IC 0C Ng NI Ne 4J -4 .4 .4 -4 .4 -4 -I -3 -3 ...I .4 -3 -3 -3 -3 ...A .4JO CL' EC CC 0 ca C) C) C) 0 C) C) 0 0 C) CI C2 0 CI C3 C) C3 0 C3 CI C3 014 4 01 0C 0C C 441 44C wel 4IC Ne we we we we we We we we Ne We We ot
3 21 31 c) C2 C2 C3 CS CD 0 0 CD CD C2 CD CD CO C2 0 CD C2 0 0 CO CI CD Zs Zs zs zr :pp :0 :0 :0 :0 :0 :0 21, :0 :lb :0 :1/1 :0 :0 :0 :0 :0 :2' :* Z.
Cn 0) r4 .4 41, OD 0 CO U" r4 h et tl F- cC CO 04 r% (34 tC 4 r4 4' r4 C30) ti L P- 4 Cl C2 C4 CC F- Pr, sr tO C5 Ur. 4 CO r4 0 U3 Or, 0 to WOFAS 01 N 4 4 CO 0 N .4 P... 61 .-4 C3 6... CO t cn 4 t4 N CO 04 to 11 (3 CO 04 r4 UI 4 to is tfl h+ 01 N an N C 4 .4 r4 C) N Ci N 64 r4 UDC) 0at Cr r4 0 C3 Cl 0 Ott 0 r4 u2 C3 Ca r4 C) C2 C3 0 r4 r4 0 CI r4 c) Ci r3 C3 C3 C3 C3 til 1.0 C3 C3 Cl C3 t3 C3 C3 C2 Cl r4 r4 r4 Ll ca 0 CD C3 C3 C3
4- 41114t Cl C Cl C3 0 CI Cl C. 0 0 0 0 Cl Cl C: C? Cl Cl Ci Cl Cl G CI CI C-1 Cl CI Ct fl Cl CI CI 0 Cl C3 0 C3 0 CI 0 0 C1 Cl C3 Cl 0 0 C2 C3 0O 1 1 1 1 1 1 1 4 I 1 4 1 1
F-2LaG co co co:2 = 024-2 I-- > oc D0X co m I- 7- r- Clr'''' D. 41Cf.2 242
C9(1) N XF- 61 .4 Fi 3... ze r- a- ce it La X r4 -3 O. M. 0r1 J)-t4-Z)-.>- Cc sc 2E La le 04 -4 CL Ph tI -J ti t- am r- a-Ln 2- 1 it (D CI :2 F4 -4 0.- LI ot L. La 4.- N4 CD CD -A Cl I 1 2 0 (2 :3 14 -4 1+ LI 4C 3C LI. La 0-- 14 0 0 -.A Ci I 1 JC 0 a :2 }4 L4 F. LI
.4 CC C3 U. a CL a La CD -4 -4 1+ 44 -4 LI 14 Li C3 -3 -A CC CI U. 4C CL 41:1 Li 0 -4 U. .4 F.. 4t .4 La *4 ta 0 .4 .4 CC (3 1A. 4t CL Ng La CDOIC 4r Mt -4 314 CA Lo tx. CI Lo La 3C C) .4 .-ot 4t er et MC .2 2B Col Lj 1J. La MC C4 F- 2 ies 4t OX 2C -4 31 tn La La. :2O L. C4 6J 41C La 7C 4 cC tl 4.1 C2 La CD si La La 7C. NC C) CD La Cs to wg la 7: se Ca, r4 CU LI Ci LA 1.) We LI. ur 2 4t C cs 141 C2 La 41 La MC et CCC2 -J LI 21 .4 ce CL 0 C3 t* CD t3 CC 0 CC CC 0 142 CD C5 .j LA nit .43. CL IA CI 50 CL CD C2 ce t.1 Cr sr tn F4 MC (D t2 J11) 3C -4 CC CL LI CI
r4 CA NI 41, un tO 4*- co Cis C) 14 C1 61 gp ul to p- 02 ch rl r4 04 11 .1r al to P.. 0) CM C3 r4 v4 ti VI 4' Ll uP h 00 01 C2 14 C4 t1 gr um to t- C5 CIr4 r4 v4 11.4 44 44 r4 v4 r4 C4 r4 .4 r4 r4 r4 r4 .4 r4 14 r4 04 N r4 r4 r4 r4 r4 r4 r4 '4 r4 r4
c e 1 1 4 1 1 1 4 i IIIIIII I I 1 I I 1 I I il 1 I I I I I i I i 1 1 1 I i 1 1 I I i II ii I 1
r4 r4 r4 .4 r4 r4 04 r4 v4 .-4 v4 fi N t4 Cl 04 C4 t4 (4 t4 Cl t4 04 f4 t4 hi r4 N C4 N N CA PI Pm Pm 1.1 Pm Pm re) F') PI I') lei V% P) PI pn pq pm F') hn4 C/ C4 C4 04 C4 CA C4 CA C4 CA t4 CA C4 i'l 4%4 e4 04 C4 (A CA hi CA C4 C4 C4 CA 61 CA C4 CA CA t4 04 t4 Ci C4 CA t4 cq P.4 ra 04 CA C4 C4 04 C4 C4 CA CACL
im $ 11.. 1 1Cr Cr Cr Cr ce ce CC ce cc (C 41 ta Li Li Li L4 Li Li Li 44 Li Lisa 1.1 La LI LI LI Li 14) Li 0 t3 0 C90 0 to 0 C2 c3 CD 0 CU 42 CD CD CD CO CD
2c a a4 4@ r 4.4 c.) L) Li L.) (..) 1-1 CA LW C.) C.) CI CI (1 t.) (.) 44-42222Y222'22222222zZ 2Z2 3CWXIIEXIIE.2-22222222:2222222227222.4-44-44-11-11-4 H 44 tri H I-4 tri /-11141-4 H 44 N HLL U . tL b - L U. b . LL LL Li Li Li L i 14 (4 is L a 14 L a tai tJ W 41 14 Li i d LI Cal LA L i F- 0- F.- 1 - - F F- F- F- }. F-
CC C Z C C C c C c Cr Cr C C C C CC r4 r4 r4 Fi rt hl r1 It 14 hi F 4 ri f1 r1 F 1 r4 H 51 ri hl rl 14 11 ki h4 hl 14 1.14-111 hi hi hi 4 - 4 4- 1 1 4 14 H F4LJ 1J 142 b2 42 UJ Li CI t) 0 ti t) t) 0 C.) t) C4 0 0 t4 t4 C3 CI C2 CI CI C4 CC cc cc cc CC CC CC CC CC CC ce cr CC ce cr cr Cr Ce cr
0. CL CL Ct. O. Cu Cu CL CL CL tn un un ton Ln Lm Lm LI um um con um um tin Ln Ln cm 0 LI 41 21 7t 7B 7n 7e 7n 31 31 31 31 31 7B 3I 711 311 31 21 3C 3C

BEST COPY AVAILABLE
X
INDIVIDUAL STUDENT DATA
PAIR R
*** GRADE 8
X
***PAIR
(C1874) )
RE CE IVNO 26- 1. GSELF 0. 120 EFFSOLN 27- 26 RECEIVNGRECEIVNG 26... 2 CONTENV 0.231 INEFFSOL 28... 1 GSELFRECEIVNG 26... 3 RELATE 0. 103 INEFFSOL 28... 2 C ONTE NVRECEIVNG ?G..- 4 SCHLIMAG 0. 270 INEFFSOL 28... 3 RELATERECEIVNG 26- 5 RACEG2 0.214 INEFFSOL 28- 4 SCHLIMAGRECEIVNG 26- 6 RELIC 4.180 INEFFSOL 28- 5 RACEG2RE CE TVNG 26... 7 SES 0.231 INEFFSOL 28... 6 RFLIGRECEIVNGRECEIVNG
26-26...
89
INTELLH ANDCP
0. 2780. 304
INEFFSOLINEFFSOL
28-28...
78
SESI NT ELL
RECEIVNG 26- 10 G OA L... 3V 0. 102 INEFFSOL 28.. 9 H ANDCPRE CEIVNG 26... 11 GOAL -3M 0. 089 INEFFSOL 10 GOAL -3VRE CE TVNG 26- 12 LEARN 0.469 INEFFSOL 28- 11 GOAL -3MRE CEIVNG 26'.. 13 SCHOOL 0. 413 INEFFSOL 28- 12 LEARNRE CE TVNG 26... 14 WELFOIG 0. 319 INEFFSOL 28- 13 SCHOOLRECEIVNG 26... 15 LAWAUTH 0. 321 INEFFSOL 28- 14 WELFDIGRECEIVNG 26... 16 RESPINTG 3.362 INEFFSOL 28- 15 LAWAUTHRE CE IVNG U..- 17 PHEALTH 0.248 INEFFSOL 28- 16 RESPINTGRE CEIVNG 26- 13 SAFETY 3.247 INEFFSOL 28- 17 PHE ALTHRECEIVNG 26... 2.9 DRUGS 0.213 INEFFSOL 28- 1.8 SAFETYRECEIVNG 26- 20 VISLART 0.237 INEFFSOL 28- 19 DRUGSRECEIVNG 26- 21. PERFMART 3. 192 INEFFSOL 28... 20 VISLARTRECEIVNGRE CEIVNG
26-26-
2223
SCIENCEWRITING
0.2130. 173
INEFFSOLINEFFSOL
28-28-
2122
PERFMARTSCIENCE
RECEIVNG ZS- 24 GOAL -8K 3.119 INEFFSOL 28- 23 WRI TINGRE CEIVNG 25 VALUING 0.513 INUFSOL 28- 24 G OA 8KEFFSOLN 27'.- 1 G SE LF 0. 137 INEFFSOL 28- 25 VALUINGEFFSOLN 27.- 2 CONTENV 0.253 INEFFSOL 28- 26 RECEIVNGEFFSOLN 27- 3 RELATE 1. 087 INEFFSOL 28- 27 EFFSOLNEFFSOLN 27- 4 SCHLIMAG 3.249 cMOTADJ 29- 1 GSELFEFFSOLN 27- 5 RACEG2 r7. CV: EMOTADJ 29- 2 CONTENVEFFSOLN 27... 5 RELIG 0. 024 EMOTADJ 29'.. 3 RELATEEFFSOLN 27- 7 SES 1.117 EMOTADJ 294. 4 SCHLIMAGEFFSOLN 27.... 8 INTELL 0. 174 EMOTADJ 29- 5 RACES 2EFFSOLN 27- 9 H ANDCP 0.197 EMOTADJ 29.... 6 RELICEFFSOLN 27- IC G OA L.- 3V 0. 062 EMOTADJ 29.-- 7 SESEFFSOLN 27- 11 GOAL -3M 0. 060 EMOTADJ 29- 8 INTELLEFFSOLN 27- 12 LEA RN 3.454 EMOTADJ 29- 9 HANDCPEFFSOLN 27- 13 SCHOOL 0. 396 EMOTADJ 29- 10 GOAL -3VEFFSOLN 27- 14 WELFDIG 0. 276 EMOTADJ 29- 11 GOAL --3MEFFSCLN 27... 15 LAWAUTH 0.370 EMOTADJ 29- 12 LEARNEFFSOLN 27- 16 RESPINTG 0.327 EMOTADJ 29- 13 SCHOOLEFFSOLN 27-.. 17 PHEALTH 0.314 EMOTADJ 29- 14 WELFDIGEFFSOLN 27... 18 SAFETY O. 299 ENOT AD J 29- 15 L AW AUTHEFFSOLN 27- 19 DRUGS 3. 290 EMOTADJ 29- 16 RESPINTGEFFSOLN 27.. 20 V ISLART 3.098 ENO TAD.) 29- 17 PHE ALTHEFFSOLN 27- 21 PERFMART 0.034 EMOTADJ 29- 18 SAFETYEFFSOLN 27*. 22 SCIENCE O. 057 (MOT AD J 29- 19 DRUGSEFFSOLN 27... 23 WRITING 3. 039 EMOTADJ 29- 2C VISLARTEr F SOLN 27... 24 G OA L-8K O. 1Q1 EMOTADJ 29- 21 PERFMARTEFFSOLN 27... 25 VALUING 0.267 EMOTADJ 29- 22 SCIENCE
6065
R
0.3190.2590.3970.1290. 3140.1820.12R0.2163.1980.2580.210.1710« 3740.4460. 3520.384O. 3790. 3490.4480. 4460.028
-0.031-0.001- -0.058
0. 189O. 3500.2850. 3660 1550. 1360.0640.1170.1100. 1040. 090n 0840.0980. 0560.0430.0670.0970.0970.0803. 0830.1350. 1220.121
-0.030-0.025-3.012

INDIVIDUAL STUDENT DATA see GRADE 8 s** ((197477
PAIR R
X Y
EMOTADJ 29- 23 WRITING 0.041EMOTADJ 29- 24 GOAL-8K 0.059E MO T AD J 29.- 25 VALUING 0. 051EMOTADJ 29- 26 RECEIVNG 3.028EMOTADJ 29.... 27 EFFSOLN - 0.018EMOTADJ 29- 28 I NEFFSOL 0. 406
6166

89
CI 04 PI 23 4C 61 IC LA IS 4C C2 CO 13 2) r* lc (on I"'
0;1104 4001 73 73 QI 23 CI 6)
x ze NI pi 10 C2 PD CI PI 0.4 AD Po SC rn 30 rn cl r, C3 C3 70 2e rn rn 3o en rn C3 in O PI nI 0 r- lb *4 F4 AD 401 C: IN PI cl IC r- m: IP ,P 3P SC .4 o r- rn ze r- 2C ref
-4 11 CI rn c: fft -4 rn II ro 0 r, IF 13 $o dln 0 AP r- r* 0 rn o4 pi r- ao -4 V'
So n1 C3 F4 *4 f Pa 3! 1C IP ti .4 r- F4 C: C3 C3 1! 4 4 0 r° 0 0 4.4 .4 rl 41 0 0 r- 4 2! CO 3C CI 30 xp 4 .4 2 .4 #.4 rm up c4 13 r. N 3C PI PC
C. C3 SC Se el 21: 01 CI 30 eml SC -4 Se CI SC 40 3111 40 r° 0 .4 CO 61
N N N N N N Pi N N N 04 P4 PA 04 04 :a 1' 04 PA FA O 0 -4 01 UM Jr 44 C4 /"1 0 CD Co .4 UI 0 44 Is) Fa C3 tO C0 -44 CM cm 0 104 N
C3r10C30ClCAO0 013
41100111 Cl N PA r4 4 C3 Cl fl 0 C3
C) Cl C3 0 0 .17 0 01 .4 IO
40 422 do u2 Ma ha N 41 P4 Is LA tO n) tO 1061 CO U) tn on to pa Cl to CM 4, Cn 40 CO CM W Fa r4 0) Oa 0 vi .4 C2 C4 4.4 04 Pa CM CA
Ln W.4 CD 1.4 01 L4 0 hs
I
0a0c.3 C C)
O POO. C3 CJ 0 N Cl CI C) PA C3 SP up ha 01 co *a Ntn
c0 .1.4 0 t0 N t4 Cn em Cm .4
04 01 Jr Li, I-4
ti C3 C3 t.3
10
of 10 CD CO W CM CM N
LO Q4 -4 *4 42 en t4 FA "4 "4 PA
C3 0 13
C3 0 Cl t3 C) FA C) C3 CI C3 C) c) Cl 0 C) C) Ci .4 rj N 444 ps N FA C) 01 r1 t.m w 01 ma co 01 p4 PS 0 0 0 ea ;JO 44 Oa 44 4 LAI 42 4) Pi !n 0 L4 pp 01 fj CI 4.4 FA 0 .4 C4 4: LO 0JwFa1DNN0C3 0 tO P4 PJ CI 03 tO Cn C4 U0 03 As NP.) L4 0 P4 Cl DON
.1
Cl C3 Cl Cl CI C3 0 C3 C3 C3 C3 0 -4 N '+r)r1F A FA 0 Ci FA 004 0 Oa CJ CD
01 LM 01 ha N to un 01 0 N .0 N 22 4: P4 P4 CO CM 4.4 444 01 0 wa 10* co 4 44 F a C3 01 CM c0 0 0 44 t.4 Pa 40 FA 440 CO -4 C3 0, Cl d1 4n el Oa p4 FA
./1
I I 270
C) r) '1 :3 0 0 4 7 43 .3 C3 C3 C3 4, 41 4
1
C3 r3 C3 C3 t1 C1 t7 0 0 r.) 43 s] el SI r3 f3 t 3 cl to 0 0 El 03 0 0 4 1 . . 1 . 1 111
el Pa 0 C5 Ph 0 0 C3 0 C3 0A c' CI Cl C1 (1 04 04 Cl 41 el C, cl .4 m4 40 44 Pa 40 44 FA 41S 4.4 Oa 04 44 -4 C3 LAI na co 01 C3 ua to t4 411 QD Pa +.4 13 NJ 0 tl 01 .4 12 .4 ,JD Fa J1 *4 .7 CAI J1 ,J 13 01
L2 0 -4 P4 .4 40 U2 Ca .n cm L4 as r4 FA pj .4 .4 u3 FA 0 41 u, 01
CI PA .4 21 N j: 21 N L4 U) N 04 s r3 01 N CO IJ .4 ^4 04 LI co .4
CI C3 C3 Cl C3 CI C3 Ci (/ Cl C) C) Cl C) Cl C3 C) 4)
010 6410 C3 Oa C3 P4 P4 C3 0 L3 L3 0 0 C3 C3 oa C3 nJ C3 CI 0 C3 .4 Is 01 04 04 CI 00 tm 0 4: PO ED N 44 in t0 Cc .1 Ph/ (.4 C3 IS) CO 04 1'4 N 0.1 C3 .4 tm 4c C2 01 C3 ca 4s cm
CO 44 LO 60 C4 rn 44 .4 fl KJ Cl Q4 4s Of t4 L4 LO NJ t4 O 01 .4 0 -4 44 u) ha 04 LA C7 44 to u3 g4 Ul to OD 14
1
C) t3 r3 r3 4.441
Cl C3 a CO Up CO CO cn co cm 42 04 0 -4 Cl
Pj
411.
114
IN.
C3 CM C3 0 44
L4 VI On 4 01 -4 4.4
NW (2 uP 01 00 04 P2 LO CI L4 LO
0 CI
0 NJ Oa 60 FA CI r..1 Oa O 14
C2 C1 C) Ise. C3 C3 r3
ors L4 ha ha tO 4 t%) t43
44 co I-' co in in m tn
Ci
44 .4 04 CM to
I 1
Cl Cl 0 C3 C3 C1 Cl 4) 41
04 rl C3 r3 oa Pa CI U 10 0 N 44 01 Co tm up 01.. 4 .4 0 W2 Q4 co N C3 On
t+1C)tOW.0 1 C3
rl C3 U C3 L2 el Cl t 3 Cl C3 t3
01-0 C3 C2 43 Fa FA Oa irJw C3 ha 0 Is) ts) CO 4 Oa -.4 ha 01 C3 01 P4 4 13) VA to Oa 0 1-' (4 CI .4 40 Cl Cm 47 Cl C) .4 tO P4 N 44 01 Co tO tO t4 01
r) 13 0 C3 a
cm no 01 co 01 NJ CI .4 v2 I" 31 wn al up .4 0 to 00 Oa Co
(1 6,7 C7 0 ...Iv .4 .4 .4 01 4.4
tn CD *a 44 Co J O Cm 0 0.1 W 11 ma ns Fa 4 n) 01 .4
11/01M11.0,..
.104111.1,,
O :3
v-4
OM Co IQ Um 0 Jr
VIMP.MWOh
1p C1 CI el el
-4 LI P*1 Pa C7 C3 L4 0 C4 Cl 23 PA W .14 co C4 c4 um Q4 60 fa 0
*11
43 Cl C 3 Cl C3 '1 f) rd CD el 444 .4
to 0 C3 4a 04 PA C3 40 Cl oa co 0 L4) C4 CI ha 01 Is4 la W Cl Jr tO to pa tm 42 Ar to C3 60 U, 00 Co to pa cm 0 14 PA OM OD t0 0
C3 rl r3 Cl CI CI
C C3 t2 FA P.' C) C)
CCD
co CI .4w -4 ko4 Cm to 014: La t4 C3 CD 164 (4 PO 14 u) L4 pa to co 44 F.1
C3
L4 Q4 j
Cl
c3 0 es so
-4 C3 N 4.4
41 FA 01 .0 en 4: Lm W N 1.64 01
$ 1 1 1111111111 1111 11 IP C3 0 s) C3 03 ri U c3 0 CI r3 C3 0 el 0 C3 C3 0 Cl 1 0 0 0 0 0 c3 t 3 el
Goollosessieso**6*::::::: -4 C3 C3 C3 C2 C3 C3 C2 C) PA 04 C3 C3 C, C3 Fa C3 C3 t3 C3 C3 C3 Oa 0 C3 C3 0 FA o tO C3 im) MA 41) N Q4 P4 L4 0 c4 n4 Fa N) tn PA PJ C3 PA t4 (4 CM Ca 40 up 0 42
C4 k0 LSI 0 Jr N ON -4 OM L4 44 4 Om PJ Poi C3 .4 CI .4 0 01 UD C3 LI .4 0 44 cn 44 01 -4 cD 0 L4 ha -.4 01 N UM OD Cm P4 41) .4 01 N t0 0 01 CO Fa 01 O.0
C3 0 m4 Oa J7raRlCINtO01FAFAmv30VIin na c3 pi .4 kJ up cl .cp .4
Ammo.
I I
Ll L3 0 0 0 C3 C2
PA (1 C1 C, 0 0 t; N tO C) 4 w4 s1 a
en 04 43 FA .4 L4 C, 14 M2 Ar tn pa C) N is NJ
I
U Cl ISO 01 01 W
r11 t4 4 4: rj
tAl
NJ r,
1111 t) 0 0 CI CI CI C3 C3 Cl C) 9111** 511 rl P' 11 Cl Oa 0 f1 04 FA r)
;A '4 0 -4 t4 (4 P4 no 1.4
f4 id 1 CM r) 04 Co 0 .4 .2 44 ma P4 (.4 mj mj 04 01 01 CI CO 0) 04 CM Cl rl c4
0 L4 .3
4.4
*a
11
I I Cl C3 c3 C3 t CI -4
F.6 C) 0 04 PA 0 it )4 .1 in ') I
Jr to .4 0 As Cl 11 N -4 F16 0 Cm t4 ro
1* .4 22
4.1
rm
na

TABLE 7
VARIMAX ROTATIONBEST COPY AVAILABLE
INDIVIDUAL STUDENT DATA as GRADE 8 es (<1974),
ROTATION OF FIRST 8 FACTORS
COMMUNALITIES
GSELF 1 0.79325 LAWAUTHCONTENV 2 C.59120 RESPINTGRELATE 3 C.70286 PHEALTHSCHLTMAG 4 C.61943 SAFETYRACEG2 5 C.61111 DRUGSRELIC s 0.54738 VISLARTSES 7 0.65130 PCRFMARTINTELL 8 Co64378 SCIENCEHANDCP 9 0.67431 WRITINGGOAL -3V 10 0.78570 COAL -8KGOAL -3M 11 0.73730 VALUINGLEARN 12 0.70538 RFCEIVNOSCHOOL 13 0.68840 EFFSOLNWELFDIG 14 0e73912 INEFFSOL
EMOTADJ
15 0.7729516 0.7569917 0.5764118 0.6500719 0.6855520 0.7115121 0.7515822 0.7676923 0.7011224 0.6917325 0.!917826 0.6067927 0.5349528 0.6946429 0.87793
TABLE 8SUM OF SQUARED ROTATED FACTOR LOADINGS
SUM FOREACH COLUMN
FACTOR 1 7.2255
FACTOR 2 2.9777
FACTOR 3 2.4540
FACTOR 4 2.9833
FACTOR 5 2.6424
FACTOR E 2.9307
FACTOR 7 1.3167
FACTOR 8 1.3720
69 63
PERCENTOF TRACT
11.12
10.27
8.46
10.29
9.11
10.11
4.54
4.59

The Pennsylvania Education Quality Assessment Inventory's efficiency in generating anaccurate profile of studentbody needs hinges on the ability of people to communicate with peoplethrough the medium of paper-and-pencil tests. Evidence supporting this notion has been obtainedthrough a long series of studies conducted by Department of Education personnel with the helpof administrators, teachers and students in over 40 per cent of Pennsylvania's local school districts.Findings support generalizations that:
Students can read and understand the questions in the battery
Students tend to answer the questions in such a way as toreflect their true feelings
Students answer similar items in a consistent manner
Students tend to answer items in similar ways across time
Student classroom behaviors are mirrored by student test scores
Students generally feel the tests are worthwhile and the vastmajority take the tests seriously
64 70

OECT1 H Pp
forProg F "L.

ORGANIZING INFORMATION TO IDENTIFY STUDENT TARGET GROUPS
Ideally, when preparing to initiate a program to facilitate student progress in any goalarea, one should be able to identify students most likely to benefit from that program. However,information available to ..chools participating in Pennsylvania's Educational Quality AssessmentProgram does not contain 1ata on individual students. Consequently, it is impossible for schoolpersonnel to identify by name the members of the target group toward whom a program mightbe focused.
Even though individual profiles are unavailable, it is possible to organize data in waysthat help identify general student groups that demonstrate needs in a given goal area. This isdone by summarizing data for various subgroups of students formed from selected studentcharacteristics. The characte.ristics defining the subgroups are achievement level, sex and father'soccupational status.
Student ability is categorized into three levels on the basis of the composite mathverbalachievement score. Students scoring below the 30th percentile are defined as the low ability group.Students scoring between the 30th and 70th percentile are placed in the middle ability group.Those exceeding the 70th percentile are defined as the high ability group.
Students are also assigned to three groups on the basis of their father's or legal guardian'sreported occupation. These occupation categories are labeled for convenience as semiskilled, skilledand professional. These categories are abstractions based upon the average educational requirementsnecessary to obtain the job and the average amount of compensation for the particular occupations.It is recognized here that there are exceptions in any or all of these categories. The semiskilledoccupational category includes hospital attendant laborer, operator of industrial equipment, packer,wrapper, miner, quarry worker, painter, roofer, paper hanger, carpet layer, truck driver, taxi driver,service station attendant, watchman, barber, waiter, cook, farmer and carpenter.
The skilled occupational category included cabinetmaker, dental technician, nurse,librarian, foreman, toolmaker, machinist, electrician, plumber, bricklayer, stonemason, heavyequipment operator, mail carrier, telephone operator, printer. decorator, policeman, firefighter,repairman, butcher, mechanic, tailor, forester, secretary, clerk. office worker, salesperson, grocerand minister.
The professional occupational category includes dentist, doctor, veterinarian, architect,pilot, teacher, school administrator. editor, farm agent, stockbroker, insurance agent, real estateagent. personnel manager, bank official, lawyer, judge, engineer, social scientist and naturalscien tist.
Eighteen groups are formed by taking all possible combinations of the three studentcharacteristics. The proportion of students who responded favorably to more than one-half ofthe items comprising each scale are presented in Table 9.
6673

TABLE 9
PER CENT OF STUDENTS SHOWING POSITIVE ATTITUDE:BY GOAL AREA
TYPE OF STUDENTS
Low ability
Low ability
Low ability
Low ability
Low ability
Low ability
Middle ability
Middle ability
Middle ability
Middle ability
Middle ability
Middle ability
High ability
High ability
High ability
High ability
High ability
Average per cent showing
Semiskilled fathers
Semiskilled fathers
Skilled fathers
Skilled fathers
Professional fathers
Professional fathers
Semiskilled fathers
Semiskilled fathers
Skilled fathers
Skilled fathers
Professional fathers
Professional fathers
Semiskilled fathers
Semiskilled fathers
Skilled fathers
Professional fathers
Professional fathers
positive attitudes
Males
Females
Males
Females
Males
Females
Males
Females
Males
Females
Males
Females
Males
Females
Males
Males
Females
Clearly, in today's world, women are playing an increasingly important role in defining theoccupational level of the family. However, data were unavailable to reflect this tren1 Therefore,we are forced to use the father's occupational level as a proxy for the socioeconomic conditionsof the home.
74
67

TABLE 9 (don't.)PER CENT OF STUDENTS SHOWING POSITIVE ATTITUDE:
BY GOAL AREA
GOAL NUMBE I II IV V VI VILA VII-P IX X
70 60 52 11 23 61 28 28 70
66 68 62 19 28 63 17 38 72
69 64 55 10 20 68 30 31 64
70 68 65 20 35 70 20 41 74
69 72 61 18 29 70 30 33 68
77 68 65 27 33 63 22 43 75
84 66 61 17 33 60 17 32 76
78 83 68 34 45 64 13 48 74
82 67 62 26 38 56 13 41 75
79 79 66 39 47 63 12 46 79
86 70 57 20 35 57 15 42 77
75 81 75 36 41 67 17 S4 79
82 68 73 28 55 53 15 43 79
86 8 9 85 54 59 64 19 62 82
88 71 72 24 50 62 12 52 77
83 81 79 42 51 66 13 SS 79
89 72 79 2S 52 62 16 58 79
91 93 83 45 53 73 25 72 84
79% 72% 67% 26% 40% 63% 18% 45% 75%
Note: Student percentages based on random sample of 3,459 8th grade students.

Acknowledgments
Illustrations were composed by Nolan Russell,Division of Educational Quality Assessment,Jan Shaul! and Tom Ross, Division of Publica-tions, and Darlene Dalton, a student at NorthernHigh School, Northern York County SchoolDistrict.
1
69