DOCUMENT RESUME Statistical Comparison of Gender ... · academic probation were removed from the...
36
DOCUMENT RESUME ED 263 950 JC 850 600 AUTHOR Smith, Alan D. TITLE Statistical Comparison of Gender Differences and Stopouts/Dropouts in the Two-Year Colleges. PUB DATE [79] NOTE 36p. PUB TYPE Reports Research/Technical (143) EDRS PRICE MF01/PCO2 Plus Postage. DESCRIPTORS *Academic Persistence; Age; Community Colleges; Comparative Analysis; *Dropouts; Females; Males; *Nontraditional Students; *Sex Differences; Two Year Colleges; *Two Year College Students IDENTIFIERS *University of Akron OH ABSTRACT In 1978-79, a study was conducted of students enrolled in the Community and Technical College at the University of Akron to test for discriminative relations between male and female students, nontraditional (25 years of age and older) and traditional students, and persisters and nonpersisters. A questionnaire distributed to students who were enrolled in fall 1978, and either returned or failed to return for the spring 1979 semester, yielded response rates of 21% for nonpersisters and 28% for persisters. Study findings included the following: (1) 90.1% of the nonpersisting traditional students were seeking an associate degree, compared to 72.5% of the nontraditional students; (2) in comparison to traditional-aged persisters, nontraditional persisters tended to be more satisfied with the university, enrolled more often in evening classes and on a part-time basis, enrolled for less hours, and lived closer to the school; and (3) respondents had higher achievement test scores and high school grade point averages, and enrolled for more course work than nonrespondents. A three-page reference list and extensive data tables are appended,. (LAL) *********************************************************************** Reproductions supplied by EARS are the best that can be made from the original document. ***********************************************************************
Transcript of DOCUMENT RESUME Statistical Comparison of Gender ... · academic probation were removed from the...

DOCUMENT RESUME
ED 263 950 JC 850 600
AUTHOR Smith, Alan D.TITLE Statistical Comparison of Gender Differences and
Stopouts/Dropouts in the Two-Year Colleges.PUB DATE [79]NOTE 36p.PUB TYPE Reports Research/Technical (143)
EDRS PRICE MF01/PCO2 Plus Postage.DESCRIPTORS *Academic Persistence; Age; Community Colleges;
Comparative Analysis; *Dropouts; Females; Males;*Nontraditional Students; *Sex Differences; Two YearColleges; *Two Year College Students
IDENTIFIERS *University of Akron OH
ABSTRACTIn 1978-79, a study was conducted of students
enrolled in the Community and Technical College at the University ofAkron to test for discriminative relations between male and femalestudents, nontraditional (25 years of age and older) and traditionalstudents, and persisters and nonpersisters. A questionnairedistributed to students who were enrolled in fall 1978, and eitherreturned or failed to return for the spring 1979 semester, yieldedresponse rates of 21% for nonpersisters and 28% for persisters. Studyfindings included the following: (1) 90.1% of the nonpersistingtraditional students were seeking an associate degree, compared to72.5% of the nontraditional students; (2) in comparison totraditional-aged persisters, nontraditional persisters tended to bemore satisfied with the university, enrolled more often in eveningclasses and on a part-time basis, enrolled for less hours, and livedcloser to the school; and (3) respondents had higher achievement testscores and high school grade point averages, and enrolled for morecourse work than nonrespondents. A three-page reference list andextensive data tables are appended,. (LAL)
***********************************************************************
Reproductions supplied by EARS are the best that can be madefrom the original document.
***********************************************************************

"PERMISSIONIITO REPRODUCE THISMATERIAL HAS BEEN GRANTED BY
A. SMTTH
TO THE EDUCATIONAL RESOURCESINFORMATION CENTER (ERIC)."
OLC1
r(N
CJC1LIJ
STATISTICAL COMPARISON OF GENDER DIFFERENCES AND
STOPOUTS/DROPOUTS IN THE TWO-YEAR COLLEGE
Alan D. Smith
Department of Quantitative and Natural Sciences
Robert Morris College, Coraopolis, FA 15108
2
U.S. DEPARTMENT OF EDUCATIONNATIONAL INSTITUTE OF EOUCATION
EDU -10NAL RESOURCES INFORMATIONCENTER (ERIC)
This document has been repmduced asreceived from the person or organizationoriginating it.
17(-Minor changes have been made to Improvereproduction Quaky.
Points of view or opinions stated in this document do not nimessanly represent official NIE
position or policy.

STATISTICAL COMPARISON OF GENDER DIFFERENCES ANDSTOPOUTS/DROPOUTS IN TWO-YEAR COLLEGE
Alan D. SmithDepartment of Quantitative and Natural Sciences
Robert Morris College, Coraoplois, PA 15108
ABSTRACT
Community and Technical College students enrolled at The
University of Akron during the 1978-1979 academic year were divided into
persisters and nonpersisters, once those students who were placed on
academic probation were removed from the study. These students were
given modified NCHEMS questionnaires for program completers or program
noncompleters. In addition selected demographic variables from the student
master file were tested, along with the questionnaire responses, in
198 research hypotheses using multiple linear regression and corrected
for multiple comparisons. Results indicate that only 19 hypotheses were
found to significantly discriminate between male traditional and non-
traditional. student, as well as, between female traditional and nontradi-
tional students. Both male and female nontraditional students appeared
to be more satisfied with certain university functions, and enrolled for
less hours, more part-time and evening classes than their traditional
counterparts.
1
3

3
INTRODUCTION
Dropping out of college and its related academic problems
has been a much researched topic, as evidenced by the magnitude
of recent dissertations on the subject. Much of this research
has too often focused on counting numbers and establishing
causal relationships when, in fact, there may be none.
Alexander W. Astin (1975), a pioneer in the attrition and
retention field, pointed to the fact that much of this research
has not clearly revealed which factors influence students to
leave or how these factors might be controlled by those with
a vested interest in preventing students from leaving. Accord-
ing to Summerskill (1962), previous research arose chiefly in
institutional or administrative concerns, and only rarely has
the process of attrition been analyzed in psychological or
sociological terms.
Since most universities are facing, or will be facing,
declining enrollments -- "perhaps the biggest concern of college
administrators and faculty members during 1970s" (Astin, 1975,
p. 2), adjustments to this trend are especially difficult.
This adjustment is also compounded by the fact that many public
and private institutions have become accustomed in the 1960s
to rapid expansion (Astin, 1975; Summerskill, 1962). Although
college administrators and faculty members have traditionally
seen recruitment as the principal means to keeping enrollments
high, an equally promising approach to this problem is to
reduce the dropout rate.

1
3
Demographic data collection and its statistical manipulation
traditionally has been a major technique in the analysis of
college student attrition rates (Astin, 1969,
1971, 1975; Bayer, 1968; Bayer, et al., 1973; Clegg, Prichard,
& Weigard, 1979; Cope & Hannah, 1975; Gorter, 1978; Summerskill,
1962; Tibby, Hirabayashi, Olson, & Peterson, 1978; Tweddale,
1978). Most of the attrition appears to 1,2 during the first
year and among those who are academically less talented (Cope,
1978; Cope & Hannah, 1975; Sexton, 1965).
In terms of sex, women have been found to have a slightly
higher probability of completing their bachelor's degree in
four years than men (Astin, 1972; Roger & Creager, 1976). This
implies that women tend to graduate on schedule more often
than men, but men are more likely to complete degree require-
ments (Cope & Hannah, 1975; Tinto & Callen, 1973). However,
several studies over the years suggested that there is not a
significant difference between attrition rates among men and
women (Iffert, 1958, Summershill, 1962; Summerskill & Darling,
1955). Summerskill (1962, p. 632), suggested that man and
women students withdraw at similar rates "does not mean they
withdraw for similar reasons." Astin (1969 p. 221) in a
study of 6,660 high aptitude students found that women had a
significantly higher dropout rate than men. Astin found that
male dropouts were more inclined to check doubts about the
appropriate course of study, poor academic performance, and
dissatisfaction with being a student as their reasons for
leaving. Female dropouts, on the other hand, are more likely
to check family responsibilities and money.

Astin (1975, p. 12) in a more recent study dealing with
the class of 1968 entering freshmen, 681,281 of which were
male and 300,611 of which were female, found that women were
"more likely than men to complete the Bachelor's degree in
four years." Astin found that even including those students
who did have a degree at the end of four years, but were
enrolled continuously since 1968 and at the ti'e of the study
were currently enrolled, women showed a higher persistence
rate. Interestingly, though, Astin found that the graduate
school attendance rate is about three percent higher among
men than among women. Clearly, according to Astin, the
relative loss of women in the transition from undergraduate
to graduate study is substantial. Of ccurse, this issue
is complex and outside the confines of this study.
Research findings conducted by Cope and Hannah (1975,
p. 60-61) revealed that academic ability was the best indica-
tor of the likelihood a student will return to higher educa-
tion. However, according to Cope and Hannah, the cause of
withdrawal is also a good indicator of whether or not the
student will return. Those students citing marriage and job
opportunities are least likely to return, while those stu-
dents citing personal problems or lack of goals are most
likely to return. Sexton (1965, p. 302) supported these
findings in his research and found that in most withdrawal
studies, the time of dropping out was found to be significant
as well as the reason for leaving. Sexton discovered that
for the majority of students, the first year was the most

difficult in terms of persistence. Although academic, financial,
and family problems rank relatively high as possible reasons for
withdrawal, other reasons need to be investigated in order to
more fully understand the "why's" of student persistence and
nonpersistence, regardless of college enrollment. Gorter (1978)
in a research effort to study nonreturning students at Mercer
County Community College in Trenton, New Jersey, found that
the two most frequently given reasons for not returning in-
cluded financial difficulties and getting a good job.
Along similar lines of research, Slark (1978, p. 2) also
conducted a site specific survey to review the more important
reasons for nonpersistence. The largest concentrations of
reported reasons were the desired class was closed, going
to another schools class of interest was not offered, class
not offered at a convenient time, and lost interest.
Astin (1975), in a large and comprehensive study, found
that the most frequent reasons for dropping out for both
men and vomen included boredom with courses, financial dif-
ficulties, and dissatisfaction with collegiate requirements
or regulations. Women gave marriage, pregnancy or other
family responsibilities more often than any other stated
reason.
Panos and Astin (1968, p. 62) reported in a large national
study that the major reasons for leaving the college of matric-
ulation in /961 wiled somewhat by sex. Males cited dissatis-
faction with college environment, wanted tim., to reconsider
interests and goals, and could not afford cost of school

C
O{
most often as major reasons for withdrawal. Females stated
marriage, dissatisfaction with college environment, and
changed career plans as the major reasons for leaving.
A more traditional approach taken in student attrition
studies at the post-secondary educational level is the compari-
son of persistent and nonpersistent students by age. Age at
matriculation studies have shown no consistently conclusive
findings. studies at three different colleges have shown
similar attrition rates for both younger and older students
(Gable, 1975; Suddarth, 1975; Thompson, 1953). Summerskill and
Darling (1955) suggested from research results done at other
colleges that older students are somewhat less likely to
graduate than their younger counterparts. This trend has been
supported by both Newman (1965) and Trent and Medsker (1967).
A study of nonreturning students completed by the Office of
Institutional Analysis (Tweddale, 1978) based on a survey of
students enrolled Fall, 1977, who did not re-enroll Winter,
1978, in aeven colleges, found that in four undergraduate
colleges, only 14 percent of the nonreturnees fell in the
18-19-year-old category. According to Tweddale (p. 12), this
tends to cast doubt on the commonly held conception that
primary retention efforts should be focused on the new entering
high school graruates.
METHOD
The institution under study was The University of Akron,
located in Akron, Ohio. This 114-acre campus is centrally
located in an industrial urban area of approximately 1.5

Cmillion persons. At the time of the study, the university
enrolled more than 23,000 day and evening students in credit
courses, with an additional 7,000 in "informal" adult educa-
tion. The University of Akron is distinguished from the
residential college or university in terms of its student
population. The University of Akron, as with most typical
urban post-secondary educational institutions, has.a signi-
ficant population of students who are older, working full
or part-time, day and/or evening, living at home, first
generation students who predominantly come from Middle and
lower class socio- economic backgrounds, and in a close
relationship with the community in which the university is
located.
The population under investigation included students who
were enrolled during the Fall Semester, 1978, end either
returned or failed to return to register for the Spring
Semester, 1979. In addition, the population of enrolled
undergraduate students in the Community and Technical
College was investigated for this time period. The major
focus of this study was determining the factors related to
the attrition of students enrolled in this college based
on age and sex differences. Accordingly, the population
under study was also divided into enrollment status accord-
ing to persistence and nonpersistence and sex/traditional-
nontraditional status. A nontraditional student was con-
sidered for the purposes of this study to be age 25 or older.

The selection of participants in this study were those
nonpersister3 who returned a questionnaire designed for them
specifically by the National Center for Higher Education
Management Systems (NCHEMS) with slight variations made by
the Retention Committee at the University, and those per-
sisters who completed the questionnaire given to them and
returned it. The questionnaire completed by the persister
segment of the population was also designed by NCHEMS with
slight modifications by the Retention Committee at The
University of Akron (Bower & Myers, 1976; Byers, 1975).
The community and technical college has traditionally
experienced big student attrition rates. Differentiating
between male and female student persisters and nonpersistars
should provide information for the establishment and verifi-
cation of significant relationships of student characteristics
and attrition rates in this college.
In terms of validity, two types were established for
both instruments used in the study. Each of these two types
of validity, namely, expert judge validity and content
validity, are described in the following:
1. Expert judge validity was determined from the con-
current opinions of the members of the Retention Committee
and the Office of the Assistant to the President at The
10

University of Akron, all well versed in the problems of con
ducting student attrition studies and knowledgeable about the
unique characteristics of the University. Also, due to the
nature of the original questionnaires, the basic structure
of the instruments was developed by a team of experts on
the NCHEMS staff specifically for the purpose of conducting
attrition studies.
2. Content validity was established from the extensive
work, preparation, and testing through pilot studies by the
NCHEMS staff. The instruments proved not only successful
in isolating certain reasons and degrees of satisfaction
associated with college persistence and nonpersistence, but
also proved equally adaptable and responsive to the unique
needs and characteristics of the universities involved in
the various pilot studies conducted by the NCHEMS staff.
Table 1 represents the data for undergraduate students
who were enrolled in the Fall, 1978, and continued on to
reregister in the Spring, 1979. The total number of
persisters who were enrolled in the General College and
Community and Technical College was 10,V9. Table Z and
Figure 1 illustrate data for undergraduate students not
(INSERT TABLE I HERE)
enrolled spring L979, but were enrolled fall 1978 as a
percent of fall 1978 undergraduate enrollment.
(INSERT TABLE 2 AND FIGURE 1 HERE)
The variables that were considered for this study
concern stated degree of satisfaction with The University
11
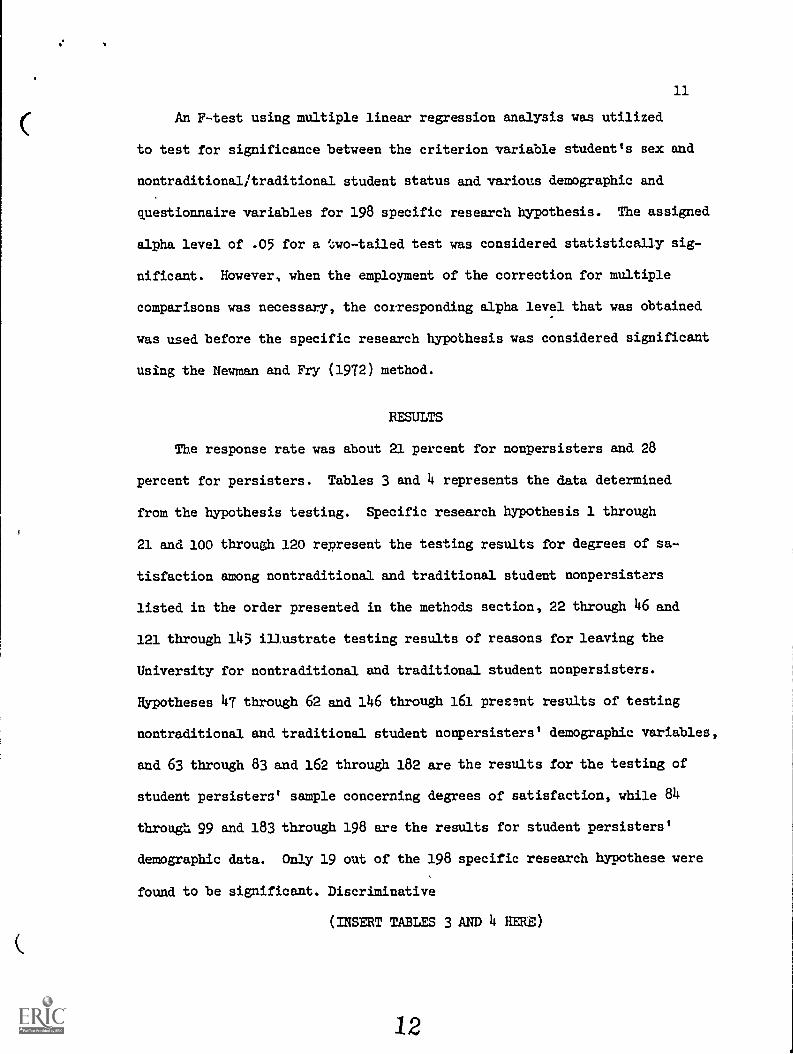
An F-test using multiple linear regression analysis was utilized
to test for significance between the criterion variable student's sex and
nontraditional traditional student status and various demographic and
questionnaire variables for 198 specific research hypothesis. The assigned
alpha level of .05 for a ;:wo-tailed test was considered statistically sig-
nificant. However, when the employment of the correction for multiple
comparisons was necessary, the corresponding alpha level that was obtained
was used before the specific research hypothesis was considered significant
using the Newman and Fry (1972) method.
RESULTS
The response rate was about 21 percent for nonpersisters and 28
percent for persisters. Tables 3 and 4 represents the data determined
from the hypothesis testing. Specific research hypothesis 1 through
21 and 100 through 120 represent the testing results for degrees of sa-
tisfaction among nontraditional and traditional student nonpersisters
listed in the order presented in the methods section, 22 through 46 and
121 through 145 illustrate testing results of reasons for leaving the
University for nontraditional and traditional student nonpersisters.
Hypotheses 47 through 62 and 146 through 161 present results of testing
nontraditional and traditional student nonpersisters' demographic variables,
and 63 through 83 and 162 through 182 are the results for the testing of
student persisters' sample concerning degrees of satisfaction, while 84
through 99 and 183 through 198 are the results for student persisters'
demographic data. Only 19 out of the 198 specific research hypothese were
found to be significant. Discriminative
(INSERT TABLES 3 AND 4 HERE)
12
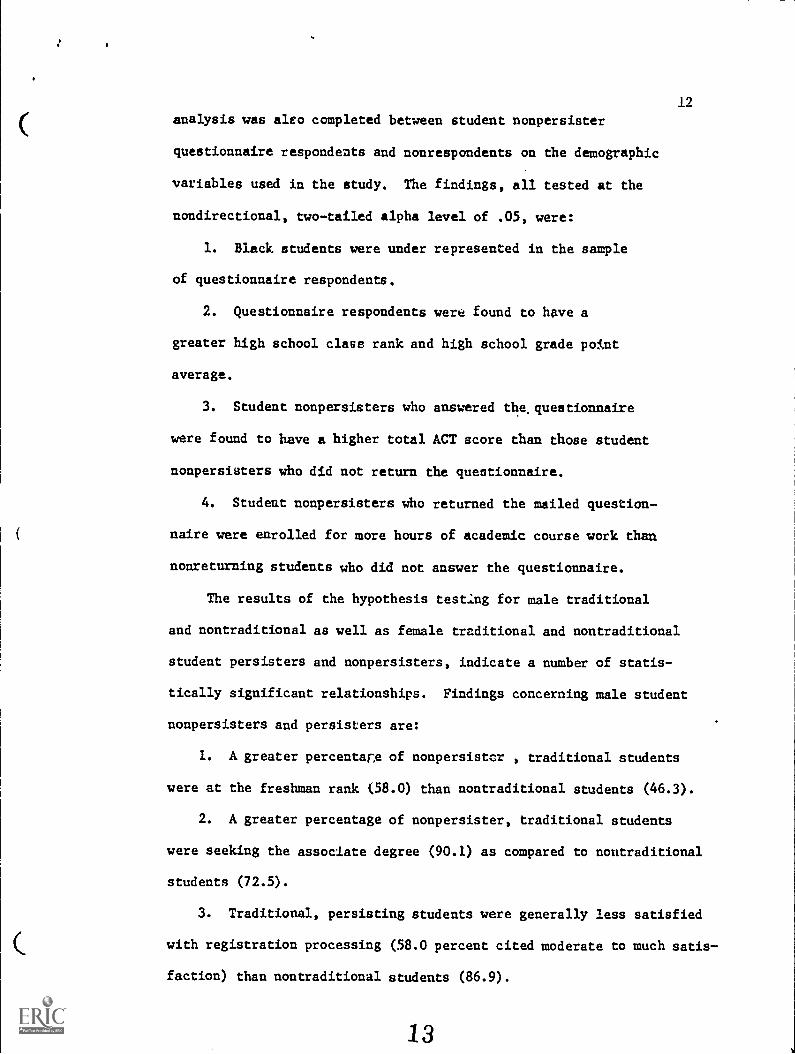
analysis was aleo completed between student nonpersister
questionnaire respondents and nonrespondents on the demographic
variables used in the study. The findings, all tested at the
nondirectional, two-tailed alpha level of .05, were:
1. Black students were under represented in the sample
of questionnaire respondents.
2. Questionnaire respondents were found to have a
greater high school class rank and high school grade point
average.
3. Student nonpersisters who answered the questionnaire
were found to have a higher total ACT score than those student
nonpersisters who did not return the questionnaire.
4. Student nonpersisters who returned the mailed question-
naire were enrolled for more hours of academic course work than
nonreturning students who did not answer the questionnaire.
The results of the hypothesis testIng for male traditional
and nontraditional as well as female traditional and nontraditional
student persisters and nonpersisters, indicate a number of statis-
tically significant relationships. Findings concerning male student
nonpersisters and persisters are:
1. A greater percentage of nonpersister , traditional students
were at the freshman rank (58.0) than nontraditional students (46.3).
2. A greater percentage of nonpersister, traditional students
were seeking the associate degree (90.1) as compared to nontraditional
students (72.5).
3. Traditional, persisting students were generally less satisfied
with registration processing (58.0 percent cited moderate to much satis-
faction) than nontraditional students (86.9).

13
4. More nontraditional, persisting students enrolled for evening
time days (97.9 percent) as compared to their traditional counterparts
060.0 percent).
5. More nontraditional, persisting students enrolled for part-time
student loads (93.8 percent) than traditional students. (52.0).
b. Traditional, persisting students carried a larger semester hour
course load (9.75) as compared to their nontraditional counterparts (6.08).
The research findings concerning female traditional and nontraditional
student persisters and nonpersisters are:
1. Traditional, nonpersisting students cited greater dissatisfaction
(56.5) percent listed no or little satisfaction) when compared to their
nontraditional counterparts (16.9).
2. Nontraditional, persisting students were more satisfied (83.1
percent) with the intellectual stimulation at the University than tradi-
tional students (94.4).
3. Traditional, persisting students were less satisfied (12.4 per-
cent cited little or no satisfaction) with the urban location of the
school than nontraditional females (4.9).
4. Traditional persisting students cited greater moderate satisfac-
tion (75.9 percent) with the quality of instruction than the nontraditional
students (53.2).
5. Nontraditional, persisting students perceived greater satisfaction
(32.3 percent cited much satisfaction) with class size than traditional
counterparts (13.1).
6. A greater proportion of nontraditional, persisting students
(84.4 percent) were enrolled in evening classes than traditional persisting
females (51.5).

14
7. A greater proportion of nontraditional, persisting students
(82.8 percent) were enrolled as parttime than traditional persisting
females (55.7) .
8. A greater percentage of nontraditional, persisting students
(87.5) lived in the same county as compared to traditional female persisters
(77.3).
9. Traditional persisters enrolled for more semester hours (9.32)
than their nontraditional, female persiater counterparts (6.52).
SUMMARY
Although only 19 out of 198 research hypotheses that tested for
discriminative relations between male and female nontraditional and tradi-
tional student persisters and nonpersisters, a number of interesting
results were found. The female nontraditional persister appeared to be
more satisfied with the University concerning the significant variables
found in the study, greater proportion enrolled in the evening and part-
time, enrolled for less hours, and lived closer to the school, than their
traditional counterparts. The basic trend also held true for nontradi-
tional persisting males.

15
REFERENCES
Astin, A. W. Personal and environmental factors associated with
college dropouts among high aptitude students. Journal of
Educational Psychology, 1969, 55, 219-227.
Astin, A. W. Predicting Academic Performance in College. New
York: Free Press, 1971.
Astin, A. W. College dropout: A national profile. Washington,
D. C.: Office of Research, 1972 (ERIC Document Reproduction
System No ED 059 691).
Astin, A. W. Preventing Students from Dropping Out. San
Francisco: Jossey-Bass, 1975.
Bayer, A. E. The College dropout: Factors affecting senior
college completion. Sociologyof Education, 1968, 41, 305-316.
Bayer, A., Royer J., & tlebb, R. Four years after collegeentry.
American Council on Research Reports, 1973, 8 (1).
Bower, C. & Myers, R. A ManuLl for Conducting Student Attrition
Studies in Institutions of Post-Secondary Education. Boulder,
Colo.: National Center for Higher Education Management
System at Western Interstate Commission for Higher Education,
1976.
Byers, M. Information Exchange Procedures Outcomes Study Procedures.
Boulder, Colo.: National Center for Higher Education Management
Systems at Western Interstate Commission for Higher Education,
1975.
Clegg, Jr., A. A., Prichard, K. & Weigand, P. Multiple regression
as a technique for predicting college enrollment. Multiple
Linear Regression Viewpoints, 1979, 9 (5), 10-19.

16
Cope, R. G. Why students stay, why they leave. In Lee Noel
(Ed.), Reducing the Dropout Rate. San Francisco: Jossey-
Rasa, Inc., 1978.
Cope, R. & Hannah, W. Revolving College Doors: The Causes and
ConseQuences of Dropping Out, Stopping Out, and Transferring.
New York: Wiley, 1975.
Gable, R. J. A study of the student dropout problem at Miami
University. Unpublished doctoral dissertation, University
of Miami, 1957.
Gorter, S. Non-returning students, Spring 1978. Trenton, N.J.:
Mercer County Community College, 1978. (ERIC Document
Reproduction System No. ED 161 473)
Iffert, R. E. Retention and Withdraw at College Students (Bulletin
1958, No. 1, U. S. Department of Health, Education, and
Welfare). Washington, D. C.: U. S. Government Printing
Office, 1958.
Newman, M. A. The Student and the College Community A Study
of Attrition and Persistence in a Highly Selective Liberal
Arts College, Cooperative Research Project No. S-130.
Chicago, Ill.: University of Chicago, 1965.
Newman, I. & Fry, J. A response to 'A note on multiple comparisons'
and comment on shrinkage. Multiple Linear Regression Viewpoints,
1972, 2 (3), 36-39.
Panos, R. J. & Astin, H. W. Attrition among college studencs.
American Educational Research Journal, 1968, 5, 57-72.
Roger, J. T. & Creater, J. A. A profile of 198 college freshmen
in 1972. ACE Research Report, 1976, 10.

17
Sexton, U. S. Factors contributing to attrition in college
populations: Twenty-five years of research. The Journal of
General Psychology, 1965, 75, 301-326.
Slark, J. S. The relation of disparity in student and faculty
educational attitudes to early student transfer from college.
Research in Higher Education, 1975, 3, 329-344.
Suddarth, B. M. Factors influencing the graduation of, freshmen
who enroll at Purdue University. Unpublished report. 1957.
Summerskill, J. Dropouts from colleges. In The American College:
A Psychological and Social Interpretation of the Higher
Learning, N. Sanford (Ed.). New York: Wiley, 1962.
Summerskill, J. & Darling, D. E. Six Differences in adjustment
to college. Jcurnal of Counseling Paychology, 46, 355-361.
Thompson, M. Admission information as predictors for graduation.
Unpublished Master's thesis, Cornell University, 1953.
Tibbey, E., Itirabayashi, J. B., Olson, J. & Peterson, R. What
Really Happened to the Class of '75? Berkeley, CA: Educational
Testing Service, 1978 (ERIC Document Reproduction Service
No. ED 161 316)
Tinto, V. & Cullen, J. Dropout in higher education: A review
and theoretical synthesis of recent research. Washington
D. C.: Office of Planning, Budgeting, and Evaluation, 1973
(ERIC Document Publication Service No. ED 078 802).
Trent, J. W. & Medsker, L. I. Beyond High School: A Study of
10,000 High School Graduates. Berkeley, CA: Center for Research
and Development in Higher Education, University of California, 1967.

18
Tweddale, R. B. The nonreturning student: Why do they leave
and will they return? Allendale, Mich.: Grand Valley
State Colleges, Official Institutional Analysis, 1978 (ERIC
Document Publication Service No. ED 156 023).

FIGURE 1
Total Undergraduate Students Not Enrolled Spring 1979Who Were Enrolled Fall 1978 and Did Not Graduate
Nor Were On Academic Probation By College
CC}-N
_JCCCCUJ UJ
UJCD UJ
EMEEEEEE
CDz
CC
z
15.31 23.01 11.70 4.5 8.22 9.60 9.18 6.95 10 56
PERCENTAGE OF FALL ENROLLMENT INTHE COLLEGE
Source. Data obtained from Office of the Assistant to the PresidentThe University of Akron.
20

C
TABLE 1
Continuing Students, Minus New Freshmen, At The University of AkronSpring Semester, 1979, by College, Daytime/Evening-Time
Enrollment Status, and Sex (N=10,449)
College M/Da M/Eb F/Dc F/Ed
DTe
ETf
General College 2,885 602 2,573 .670 5,458 1,272(N=6,730)
Community and 972 760 1,341 646 2,313 1,406Technical College(N=3,719)
TOTAL 3,857 1,362 3,914 1,316 7,771 2,678
Note. Total students included only those students who did not graduateSpring Semester, 1979.
aDenotes male/daytime student
bDenotes male/evening-time student
cDenotes female/daytime student
denotes female/evening-time student
eDenotes daytime student
(Denotes evening-time student
21

TABLE 2
Undergraduate Students Not Enrolled Spring 1979 Who Were EnrolledFall 1978 as a Percent of Fall 1978 Undergraduate Enrollment
CollegeF.T.aDaybNo.
% ofFall
P.T.e
DayNo.
% of
Fall
AllDay
No.
.
% of
Fall
F.T.
Eve.dNo.
x ofFall
P.T.
Eve. % ofNo. Fall
AllEve.
No.
% of
FallTotalNo.
% of
Fall
General 392 7.3 278 22.2 670 10.1 36 24.5 560 37.4 596 36.2 1,266 15.31
Community &Technical (2yr) 152 9.3 223 25.8 375 15.0 19 14.7 578 36.3 597 34.7 972 23.01
SUB TOTAL 2,238 17.91Arts & Sciences 41 6.2 38 16.0 79 8.8 4 16.7 50 23.3 54 22.6 133 11.70
Engineering 12 3.0 10 6.4 22 3.9 1 16.7 5 9.6 6 10.3 28 4.50
Education 17 3.1 20 8.6 37 4.8 1 3.2 40 28.4 41 23.8 78 8.22
Business 16 2.2 31 15.5 47 4.9 6 7.1 101 18.9 107 17.3 156 9.60
Fine &Applied Arts 18 3.4 27 15.1 45 6.4 3 13.6 26 32.9 29 28.7 74 9.18
Nursing 10 2.2 19 18.3 29 5.1 0 N/A 9 20.5 9 15.3 38 6.05
Community &TechnicalCollege (4 0 3 13.0 4 40.0 7 21.2 0 N/A 8 7.8 8 7.3 15 10.56
SUB TOTAL 522 8.83
GRAND TOTAL 2,760 15.00
Note. Data obtained from Office of the Assistant to the President, The University of Akron.
!denotes full-time studentbdenotes day student
cdenotes part-time studentddenotes evening student
22

(
(
(
TABLE 3
Summary of F-Ratios, Probability Levels, R2 for Both theFull and Restricted Models, Degrees of Freedom-Numerator,Degrees of Freedom-Denominator, and Significance for EachResearch Hypothesis Testing Discriminative Relations Be-tween Male Nontraditional and Male Traditional Nonpersisters,as Well as Between Male Nontraditional Persisters and Male
Traditional Persisters, Enrolled in the Community andTechnical College
HypothesisNumber
R2f R2r
df F Probability Sign.
la0.00773 0.0 1/83 0.64690 .42352 NS
2a
0.02888 0.0 1/88 2.61728 .10929 NS
3a
0.01980 0.0 1/72 1.45415 .23181 NS
4a 0.07875 0.0 1/22 1.88067 .18407 NS
5a0.04995 0.0 1/28 1.47213 .23513 NS
6a 0.04018 0.0 1/34 1.42326 .24112 NS
7a0.04625 0.0 1/41 1.98821 .16607 NS
8a0.00022 0.0 1/47 0.01041 .91917 NS
9a0.02251 0.0 1/76 1.74987 .18985 NS
10a 0.00314 0.0 1/76 0.23973 .62581 NS
ila0.00094 0.0 1/23 0.02160 .88442 NS
12a 0.00625 0.0 1/81 0.50940 .47745 NS
13a0.00250 0.0 1/86 0.21546 .64369 NS
14a 0.00019 0.0 1/83 0.01537 .90163 NS
15a 0.02284 0.0 1/55 1.28547 .26180 NS
16a 0.02899 0.0 1/82 2.44793 .12153 . NS
TABLE 3 (Cont.)
23

TABLE 3 (Cont.)
Summary of F-Ratios, Probability Levels, R2 for Both theFull and Restricted Models, Degrees of Freedom-Numerator,Degrees of Freedom-Denominator, and Significance for EachResearch Hypothesis Testing Discriminative Relations Be-tween Male Nontraditional and Male Traditional Nonpersisters,as Well as Between Male Nontraditional Persisters and MaleTraditional Persisters, Enrolled in the Community and
Tec%nical College
HypothesisNumber
R2f R2r
df F Probability Sign.
17a0.00623 0.0 1/86 0.53901 .46484 NS
18a 0.00424 0.0 1/85 0.36217 .54890 NS19a
0.00043 0.0 1/83 0.04025 .84148 NS
20a 0.00193 0.0 1/81 0.15699 .69298 NS
21a 0.00394 0.0 1/77 0.30487 .58244 NS
22a 0.02834 0.0 1/83 2.42112 .12351 NS
23a 0.00919 0.0 1/83 0.76996 .38286 NS24a
0.00147 0.0 1/83 0.12233 .72741 NS
25a 0.00420 0.0 1/82 0.34551 .55828 NS
26a 0.00133 0.0 1/82 0.10948 .74158 NS
27a 0.01556 0.0 1/83 1.31223 .25528 NS
288 0.03277 0.0 1/83 2.81215 .09732 NSd
29a 0.01100 0.0 1/83 0.92333 .33939 NS
308 0.00610 0.0 1/83 0.50900 .47757 NS
31a 0.01740 0.0 1/84 1.48715 .22607 NS
32a 0.00320 0.0 1/84 0.26972 .60488 NS
TABLE 3 (Cont.)
24

TABLE 3 (Cont.)
Summary of F-Ratios, Probability Levels, R2 for Both theFull and Restricted Models, Degrees of Freedom-Numerator,Degrees of Freedom-Denominator, and Significance for EachResearch Hypothesis Testing Discriminative Relations Be-tween Male Nontraditional and Male Traditional Nonpersisters,as Well as Between Male Nontraditional Persisters and MaleTraditional Persisters, Enrolled in the Community and
Technical College
HypdthesisNumber
R2f R2r
df F Probability Sign.
3380.01898 0.0 1/84 1.62553 .20584 NS
34a 0.00027 0.0 1/83 0.02256 .88097 NS358
0.00000 0.0 1/83 0.00012 .99129 NS
368 0.03657 0.0 1/83 3.15052 .07957 NSd
378 0.01742 0.0 1/83 1.47174 .22851 NS38a
0.00006 0.0 1/82 0.00527 .94231 NS398
0.01629 0.0 1/83 1.37406 .24447 NS
408 0.02350 0.0 1/82 1.97348 .16386 NS
418 0.00083 0.0 1/83 0.06928 .06928 NSd
42a 0.01562 0.0 1/83 1.31683 .25496 NS
438 0.00963 0.0 1/84 0.81698 .36865 NS
44a 0.00947 0.0 1/83 0.79363 .37558 NS
45a 0.00015 0.0 1/79 0.01212 .91262 NS
468 0.02075 0.0 1/78 '1.65317 .20233 NS
47b
0.05631 0.0 1/93 5.54976 .02058 NSd
48b
0.06799 0.0 1/93 6.78390 .01071 NSd
TABLE 3 (Cont.)
25

(
c
TABLE 3 (Cont.)
Summary of F-Ratios, Probability Levels, R2 for Both theFull and Restricted Models, Degrees of Freedom-Numerator,Degrees of Freedom-Denominator, and Significance for EachResearch Hypothesis Testing Discriminative Relations Be-tween Male Nontraditional and Male Traditional Nonpersisters,as Well as Between Male Nontraditional Persisters and MaleTraditional Persisters, Enrolled in the Community and
Technical College
HypothesisNumber
R2f R2r
df F Probability Sign.
49b
0.05552 0.0 1/93 5.46645 .02153 NSd
50b
0.30120 0.0 1/2 0.86207 .45118 NS
51b
0.50439 0.0 1/89 90.57762 .00000 S
52b
0.00189 0.0 1/40 0.07563 .78472 NS
53b
0.10286 0.0 1/47 5.38878 .02466 NSd
54b
0.05755 0.0 1/35 2.13731 .15267 NS
55b
0.0 NOT TESTABLEc
56b
0.09261 0.0 1/93 9.49197 .00272 S
57b
58b
0.03770
0.07026
0.0
0.0
1/93
1/92
3.64323
6.95204
.05938
.00983
NSd
dNS
59b
0.04031 0.0 1/93 3.90625 .05107 NSd
60b
0.00306 0.0 1/92 0.28238 .59642 NS
61b
62b
0.09964
0.16687
0.0
0.0
1/90
1/17
9.96004
3.40486
.00217
.08251
S
dWS
63a 0.00068 0.0 1/91 0.0615d .80464 NS
64a 0.11067 0.0 1/94 11.69778 .00093 S
TABLE 3 (Cont.)

TABLE 3 (Cont.)
.Summary of F-Ratios, Probability Levels, R2 for Both theFull and Restricted Models, Degrees of Freedom-Numerator,Degrees of Freedom-Denominator, and Significance for EachResearch Hypothesis Testing Discriminative Relations Be-tween Male Nontraditional and Male Traditional Nonpersisters,as Well as Between Male Nontraditional Persisters and MaleTraditional Persisters, Enrolled in the Community and
Technical College
Hypothesis
NumberR2f R2r df F Probability Sign.
65a 0.00566 0.0 1/85 0.48400 .48851 NS
66a 0.01825 0.0 1/27 0.50181 .48475 NS
67a 0.01349 0.0 1/45 0.61542 .43686 NS
68a0.00216 0.0 1/44 0.09513 .75920 NS
69a 0.03961 0.0 1/58 2.39206 .12739 NS
70a 0.02670 0.0 1/58 1.59130 .21219 NS
71a 0.00971 0.0 1/86 0.84296 .36112 NS
72a 0.06876. 0.0 1/90 6.69538 .01157 HSd
73a0.01042 0.0 1/22 0.23158 .63507 NS
74a 0.00415 0.0 1/91 0.37878 .53979 NS
700.00262 0.0 1/92 0.24211 .62386 NS
76a 0.01964 0.0 1/91 1.82294 .18032 NS
77a0.00164 0.0 1/51 0.08354 .77372 NS
78a0.01526 0.0 1/90 1.39436 .24078 NS
79a0.0 NOT TESTABLEc
80a0.07676 0.0 1/90 7.48245 .00751 NS
d
TABLE 3 (Cont.)

(
(
TABLE 3 (Cont.)
Summary of F-Ratios, Probability Levels, R2 for Both theFull and Restricted Models, Degrees of Freedom-Numerator,Degrees of Freedom-Denominator, and Significance for EachResearch Hypothesis Testing Discriminative Relations Be-tween Male Nontraditional and Male Traditional Nonpersisters,as Well as Between Male Nontraditional
Persisters and MaleTraditional Persisters, Enrolled in the Community and
Technical College
Hypothesis
NumberR2f R2
rdf F Probability Sign.
81a 0.00226 0.0 1/91 0.20576 .65119 NS
82a 0.00049 0.0 1/82 0.03999 .84199 NS
83a 0.0 NOT TESTABLEc
84b
0.21338 0.0 1/96 26.04173 .00000 S
85b
0.21822 0.0 1/96 26.79729 .00000 S
86b
0.00743 0.0 1/94 0.70363 .37333 NS
87b
0.00244 0.0 1/17 0.04162 .89074 NS
88b
0.67504 0.0 1/87 180.72798 .00000 S
89b
0.02250 0.0 1/36 0.82868 .36870 NS
90b
0.12934 0.0 1/41 6.09047 .01785 NSd
91b
0.03465 0.0 1/32 1.14876 .29181 NS
92b
0.47248 0.0 1/2 1.79132 .31263 NS
93b
0.06988 0.0 1/96 7.21272 .00853 NSd
94b
0.0 NOT TESTABLEc
95b
0.18528 0.0 1/96 21.83198 .00000 S
96b
0.0 NOT TESTABLEc
TABLE 3 (Cont.)

(TABLE 3 (Cont.)
Summary of F-Ratios, Probability Levels, R2 for Both theFull and Restricted Models, Degrees of Freedom-Numerator,Degrees of Freedom-Denominator, and Significance for EachResearch Hypothesis Testing Discriminative Relations Be-tween Male Nontraditional and Male Traditional Nonpersisters,as Well as Between Male Nontraditional Persisters and MaleTraditional Persisters, Enrolled in the Community and
Technical College
HypothesisNumber
R2f R2r
df F Probability Sign.
97b
0.04530 0.0 1/96 4.55517 .03537 NSd
98b
0.08438 0.0 1/96 8.84723 .00371 NSd
99b
0.16374 0.0 1/31 6.06993 .01951 NSd
aalpha corrected for multiple comparisons equal to 0.002
balpha corrected for multiple comparisons equal to 0.003
cF-level or tolerance-level insufficient for computation
dapproaching significance
29

TABLE 4
Summary of F-Ratios, Probability Levels, R2 for Both theFull and Restricted Models, Degrees of Freedom-Numerator,Degrees of Freedom-Denominator, and Significance for EachResearch Hypothesis Testing Discriminative Relations Be-tween Female Nontraditional and Female Traditional Non-persisters, as Well as Female Nontraditional and FemaleTraditional Persisters, Enrolled in the Community
and Technical College
HypothesisNumber
R2f
R2r df F Probability Sign.
100a 0.02492 0.0 1/94 2.40204 .12454 NS
101a 0.00314 0.0 1/103 0.32472 .57001 NS
102a 0.00022 0.0 1/82 0.01825 .89287 NS
103a 0.01003 0.0 1/23 0.23294 .63388 NS
104a 0.00148 0.0 1/44 0.06532 .79965 NS
105a 0.01190 0.0 1/38 0.45783 .50273 NS
106a 0.01937 0.0 1/47 0.92860 .34015 NS
107a 0.10272 0.0 1/53 6.06719 .01706 NSd
108a 0.02317 0.0 1/90 2.13464 .14749 NS
109a 0.00550 0.0 1/97 0.53619 .46578 NS
110a 0.01344 0.0 1/43 0.58577 .44823 NS
111a
0.00699 0.0 1/97 0.68293 .41061 NS
112a 0.03366 0.0 1/108 3.76241 .05503 NSd
113a 0.01208 0.0 1/102 1.24687 .26677 NS
114a 0.04294 0.0 1/72 3.23008 .07649 NSd
TABLE 4 (Cont.)

4
(TABLE 4 (Cont.)
Summary of F-Ratios, Probability Levels, R2 for Both theFull and Restricted Models, Degrees of Freedom-Numerator,Degrees of Freedom-Denominator,
and Significance for EachResearch Hypothesis Testing Discriminative Relations Be-tween Female Nontraditional and Female Traditional Non-persisters, as Well as Female Nontraditional and FemaleTraditional Persisters, Enrolled in the Community
and Technical College
HypothesisNumber
R2f
R2r df F Probability Sign.
115a 0.13828 0.0 1/101 16.20681 .00011 S
116a 0.02666 0.0 1/100 2.73880 .10107 NS
117a 0.00902 0.0 1/106 0.96512 .32814 NS
118a 0.02833 0.0 1/98 2.85681 .09417 NSd
119a 0.01158 0.0 1/93 1.08922 .29935 NS
120a 0.06439 0.0 1/87 5.98769 .01642 NSd
121a 0.00155 0.0 1/101 0.15709 .69269 NS
122a 0.02770 0.0 1/101 2.87793 .09289 NSd
123a 0.00094 0.0 1/100 0.09388 .75994 NS
124a 0.00060 0.0 1/102 0.06121 .80509 NS
125a 0.00005 0.0 1/101 0.00459 .94612 NS
126a 0.00000 0.0 1/101 0.00001 .99748 NS
127a 0.01115 0.0 1/100 1.12801 .29076 NS
128a 0.00161 0.0 1/98 0.15849 .69142 NS
129a 0.00515 0.0 1/98 0.50712 .47808 NS
TABLE 4 (Cont.)

'4
TABLE 4 (Cont.)
Summary of F-Ratios, Probability Levels, R 2 for Both theFull and Restricted Models, Degrees of Freedom-Numerator,Degrees of Freedom-Denominator, and Significance for EachResearch Hypothesis Testing Discriminative Relations Be-tween Female Nontraditional and Female'Traditional Non-persisters, as Well as Female Nontraditional and FemaleTraditional Persisters, Enrolled in the Community
and Technical College
HypothesisNumber R2
fR2
r df F Probability Sign.
130a 0.00374 0.0 1/100 0.37540 .54146 NS
131a 0.03524 0.0 1/98 3.57994 .06143 NSd
132a 0.00326 0.0 1/100 0.32701 .56871 NS
133a 0.01443 0.0 1/10,, 1.46456 .22906 NS
134a 0.03478 0.0 1/S9 3.56723. .06186 NSd
135a 0.02322 0.0 1/98 2.33007 .13012 NS
136a 0.03959 0.0 1/97 3.99810 .04835 NSd
137a 0.04017 0.0 1/99 4.14291 .04448 NSd.
138a 0.01521 0.0 1/100 1.54412 .21691 NS
139a 0.01758 0.0 1/98 1.75317 .18856 NS
140a 0.01997 0.0 1/99 2.01760 .15863 NS
141a 0.08287 0.0 1/98 8.85540 .00368 NSd
142a 0.00003 0.0 1/100 0.00279 .95798 NS
143a 0.01883 0.0 1/100 1.91889 .16906 NS
144a 0.00961 0.0 1/99 0.96054 .32944 NS
145a 0.00057 0.0 1/92 0.05261 .81909 NS
TABLE 4 (Cont.)

"4 D
(TABLE 4 (Cont.)
Summary of F-Ratios, Probability Levels, R2 for Both theFull and Restricted Models, Oegrees of Freedom-Numerator,Degrees of Freedom-Denominator, and Significance for EachResearch Hypothesis Testing Discriminative Relations Be-tween Female Nontraditional and Female Traditional Non-persisters, as Well as Female Nontraditional and FemaleTraditional Persisters, Enrolled in the Community
and Technical College
HypothesisNumber R2
fR2
r df F Probability Sign.
146b
147b
148b
149b
150b
151b
152b
153b
154b
155b
156b
157b
158b
159b
160b
0.05319
0.01590
0.04112
0.50319
0.03341
0.08375
0.05620
0.00912
0.01508
0.04218
0.00032
0.00163
0.02298
0.0
0.0
0.0
0.0
0.0
0.0
0.0
0.0
0.0
0.0
0.0
0.0
0.0
0.0
0.0
1/112
1/112
1/112
NOT
1/109
1/46
1/49
1/43
NOT
1/112
1/112
1/111
1/112
1/112
1/109
6.29182
1.80933
4.80313
TESTABLEc
110.39913
1.58992
4.47867
2.56048
TESTABLE
1.03109
1.71519
4.88816
0.03565
0.18243
2.56322
.01356
.18131
.03648
.00000
.21369
.03943
.11689
.31209
.19299
.02909
.85058
.67011
.11227
NSd
NS
NSd
S
NS
NSd
MS
NS
NS
NSd
NS
NS
NS
TABLE 4 (Cont.)c

TABLE 4 (Cont.)
Summary of F-Ratios, Probability Levels, R2 for Both theFull and Restricted Models, Degrees of Freedom-Numerator,Degrees of Freedom-Denominator,
and Significance for EachResearch Hypothesis Testing Discriminative Relations Be-tween Female Nontraditional and Female Traditional Non-persisters, as Well as Female Nontraditional and FemaleTraditional Persisters, Enrolled in the Community
and Technical College
Hypothesis
NumberR2
f R2r df F Probability Sign.
161b 0.08688 0.0 1/48 4.56713 .03772 NSd
162a 0.05178 0.0 1/143 7.80949 .00591 NSd
163a 0.09380 0.0 1/149 15.42279 .00013 S
164a 0.00211 0.0 1/121 0.25550 .61415 NS
165a 0.00966 0.0 1/34 0.33161 .56850 NS
1668 0.10048 0.0 1/57 6.36684 .01444 NSd
1678 0.05080 0.0 1/60 3.21086 .07820 NSd
168a 0.03932 0.0 1/75 3.06941 .08387 NSd
169a 0.01165 0.0 1/83 0.97820 .32552 NS
170a 0.06529 0.0 1/135 9.42971 .00258 S
1718 0.06270 0.0 1/139 9.29769 .00275 S
172a 0.01112 0.0 1/49 0.55084 .46151 NS
173a 0.02576 0.0 1/145 3.83450 .65213 NSd
174a 0.06427 0.0 1/147 10.09632 .00181 S
1758 0.06896 0.0 1/144 10.66625 .00136 S
1768 0.06324 0.0 1/91 6.14338 .01504 NSd
TABLE 4 (Cont.)
34

'4
L
TABLE 4 (Cont.)
Summary of F-Ratios, Probability Levels, R2
for Both theFull and Restricted Models, Degrees of Freedom-Numerator,Degrees of Freedom-Denominator, and Significance for EachResearch Hypothesis Testing Discriminative Relations Be-tween Female Nontraditional and Female Traditional Non-persisters, as Well as Female Nontraditional and FemaleTraditional Persisters, Enrolled in the Community
and Technical College
Hypothesis
NumberR2
fR2
r df F Probability Sign.
177a 0.04730 0.0 1/147 7.29808 .00772 NSd
178a 0.00712 0.0 1/133 0.95378 .33053 NS
179a 0.02229 0.0 1/147 3.35092 .06919 NSd
180a 0.00723 0.0 1/133 0.96846 .32685 NS
181a 0.03165 0.0 1/134 4.38004 .03825 NSd
182a 0.05350 0.0 1/136 7.68778 .00634 NSd
183b
0.11859 0.0 1/150 20.18134 .00001 S
184b
0.68129 0.0 1/150 13.27164 .00037 S
185b
0.03413 0.0 1/150 5.30077 .02269 NSd
186b
0.01755 0.0 1/30 0.53582 .46983 NS
187b
0.62517 0.0 1/144 240.17460 .00000 S
188b
0.0 NOT TESTABLEc
189b
0.03063 0.0 1/70 2.21197 .14143 NS
190b
0.02895 0.0 1/59 1.75885 .18988 NS
191b
0.0 NOT TESTABLEc
192b
0.00052 0.0 1/150 0.07865 .77952 NS
TABLE 4 (Cont.)

4 ID
TABLE 4 (Cont.)
Summary of F-Ratios, Probability Levels, R2for Both the
Full and Restricted Models, Degrees of Freedom-Numerator,Degrees of Freedom-Denominator, and Significance for EachResearch Hypothesis Testing Discriminative Relations Be-tween Female Nontraditional and Female Traditional Non-persisters, as Well as Female Nontraditional and Female
. Traditional Persisters, Enrolled in the Communityand Technical College
HypothesisNumber
R2f
R2r
df F Probability Sign.
193b
0.00108 0.0 1/150 0.16161 .68825 NS
194b
0.10408 0.0 1/150 17.42603 .00005 S
195b
0.00607 0.0 1/150 0.91623 .34001 NS
196b
0.02713 0.0 1/150 4.18255 .04259 NSd
197b
0.00240 0.0 1/143 0.34467 .55807 NS
198b
0.01841 0.0 1/56 1.05017 .30987 NS
aalpha corrected for multiple comparisons equal to 0.002
halpha corrected for multiple comparisons equal to 0.003
cF-level or tolerance-level insufficient for computation
dapproaching significance
ERIC CLEARINGHOUSEFOR JUNIOR COLLEGES
JAN 2 4 1986