DOCUMENT' RESUME JC 810 503 Student jnformation … › fulltext › ED206357.pdf · DOCUMENT'...
41
DOCUMENT' RESUME ED'-206 357 JC 810 503 TITLE. Student jnformation Questionnaire, Fall 1980. INSTITUTION city Coll. of SO.n Francisco, Calif. PUB DATE 80 'NOTE' 41p.- ,Er)RS PPICE MF01/PCO2 Plus Postage. DESCRIPTO?S Community Colleges: *Day Students: Educational c- Tren1s: *Evening Students: Participant Satisfaction: Questionnaires: *Student Charactbristics: *Student Educational ObjectiveS: Trend Analysis: To Year Coilege_Studemts ABSTRACT' In order'to obtain an updated profile of the student_ population. of the City College of San Francisco (2CSFf, day and evening students were surveyed. Of the 15,297 students surveyed durIag registration for day classes, 9,295 (62.8%) responded: and unduplicated responses were obtained from 7,044 (65.7%) of the ,10,718 students registered for4eyeaing classes.'The survey instrument solIcited information on students' major, sex, age, race, cit!zenship, veteran status, means of traasputatioa, residence, highest degree obtained, college choice, educational goal, course load, previous CCSF attendance, educational plans, employment status, Intended use of student services', rating of instruction, and family income. The study revealedthat there was vdontianing increase in. *he percentage of females, a slight increase :in student age, and a continuing-increase in minority group representation. Transferring to a four-year school remained the primary gbal amqng students, and the absence of tuition was more than ever thetdotinant variable in their, decision to attend CCSF. 'More students were workiag full-time while oarsuing their education, and', as a consequence, were carrying iIghter unit loads. Career guidance'andeducationml planning weie-elle *w student seryides that students most frequently intended to uses .'he study report illustrates trends in the responses to each questionnaire Item, looking at responses of day aad evening students .to 1976,1918, and 1980 surveys. The questionnaire is appended. 4Author/AYC1 \ P ********************************************************************** Reproductions supplied by MIS are the best thatcan bemade * from the original document. ********************************************************************** A
Transcript of DOCUMENT' RESUME JC 810 503 Student jnformation … › fulltext › ED206357.pdf · DOCUMENT'...

DOCUMENT' RESUME
ED'-206 357 JC 810 503
TITLE. Student jnformation Questionnaire, Fall 1980.INSTITUTION city Coll. of SO.n Francisco, Calif.PUB DATE 80'NOTE' 41p.-
,Er)RS PPICE MF01/PCO2 Plus Postage.DESCRIPTO?S Community Colleges: *Day Students: Educational c-
Tren1s: *Evening Students: Participant Satisfaction:Questionnaires: *Student Charactbristics: *StudentEducational ObjectiveS: Trend Analysis: To YearCoilege_Studemts
ABSTRACT'In order'to obtain an updated profile of the student_
population. of the City College of San Francisco (2CSFf, day andevening students were surveyed. Of the 15,297 students surveyeddurIag registration for day classes, 9,295 (62.8%) responded: andunduplicated responses were obtained from 7,044 (65.7%) of the ,10,718students registered for4eyeaing classes.'The survey instrumentsolIcited information on students' major, sex, age, race,cit!zenship, veteran status, means of traasputatioa, residence,highest degree obtained, college choice, educational goal, courseload, previous CCSF attendance, educational plans, employment status,Intended use of student services', rating of instruction, and familyincome. The study revealedthat there was vdontianing increase in.*he percentage of females, a slight increase :in student age, and acontinuing-increase in minority group representation. Transferring toa four-year school remained the primary gbal amqng students, and theabsence of tuition was more than ever thetdotinant variable in their,decision to attend CCSF. 'More students were workiag full-time whileoarsuing their education, and', as a consequence, were carryingiIghter unit loads. Career guidance'andeducationml planning weie-elle*w student seryides that students most frequently intended to uses.'he study report illustrates trends in the responses to eachquestionnaire Item, looking at responses of day aad evening students.to 1976,1918, and 1980 surveys. The questionnaire is appended.4Author/AYC1
\ P
**********************************************************************Reproductions supplied by MIS are the best thatcan bemade
* from the original document.**********************************************************************
A

-
O
L
71.
r
I
STUDENT INFORMATION QUESTIONNAIRE3
CITY COLLEGE OF SAN FRANCISCO
ift
FALL 1980
a
. .'
4
',Prepared by:
The Office of Testing and Research. . . 44
,e
r
"FERMI = ION TOfIEPRODUCE THIS
MAT IAL HAS BEEN GRANTED &Y
1 R. C. tlesnia rl
THE EDUCATIONAL RESOURCES. INFORMATION CENTER (ERI,G)."
:
2-,
. U S. DEPARTMENT 9F EDUCATIONNATIONAL i TITUTE OF EDUCATION
EDUCATIONAL ESOURCES INFORMATIONC NTER (ERIC/
XThm document has been reprojiuced asreceived from the person or organizationonginating it .
I fiVor changes have been made to improvereproduction quality
Points of view or opinions stated in this document do not necessarily represent official NIEposition or policy
I
0
A'
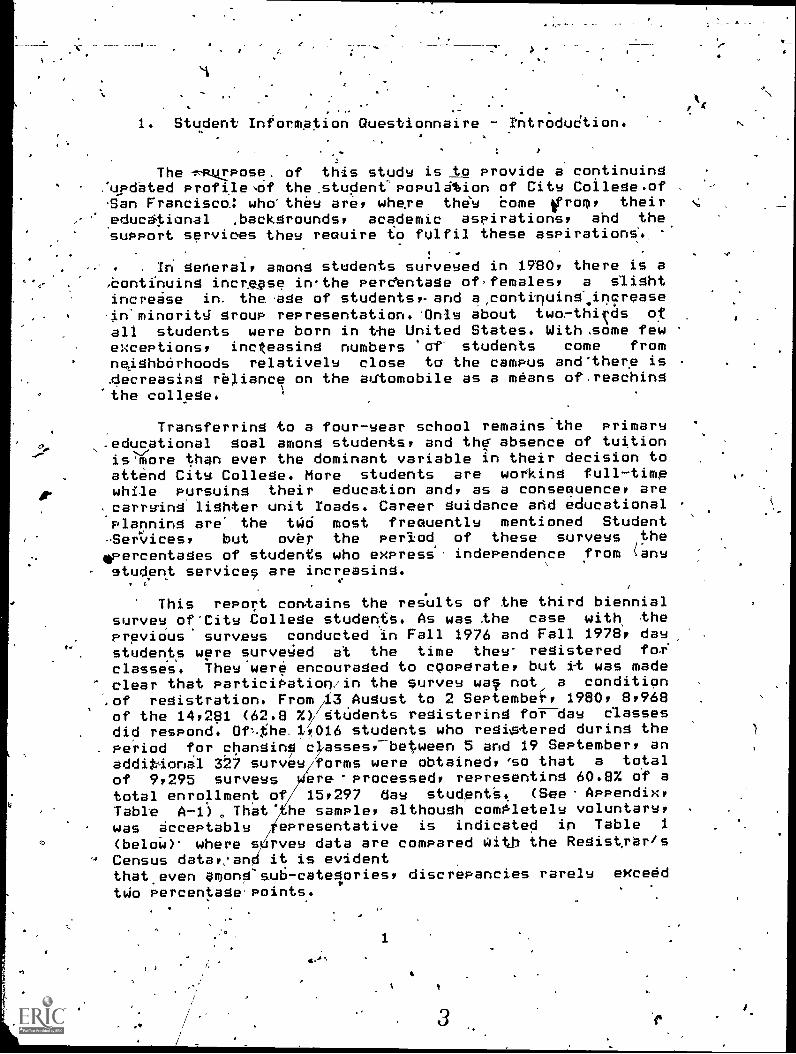
1. Student Information Questionnaire - rntroduCtion.Se
.
The -- prose, of this study is to provide a' continuing:updated Profile,Of the_student'populAion of City College.of'San Franciscol who'they are: where they Come pomp theireduc6tional ,backgrounds: academic aspirations: and thesupport services they reeuire to fulfil these aspirationS.,
.
In general, among students surveyed in 1780: there is a?Continuing increase irthe perdentage of,females: a Slightincrease in the ge of students,- and a,continuing-4increase-in'minoritg group representation.J)nle about two - thirds of
all students were born in the United States. With,some fewexceptions: inclZeasing numbers 'af- students come fromneighborhoods relatively close to the campus and'there is.decreasing reliance on the automobile as a means ofreachingthe college.
Transferring to a four-wear school remainsthe primaryo .educational goal among students: and the- absence of tuition
is 'more than ever the dominant variable in their decision toattend City College. More students are working full-timewhile Pursuing their education and: as a conseeuence: arecarrying lighter unit roads. Career guidance and educationalPlanning are the two most frequently mentioned Student-Services: but over the period of these surveys thepercentages of students who express independence from Canastudent services are increasing.
.
This report contains the results of the third biennialsurvey ofCity College students. As was .the case with, theprevious. surveys conducted in Fall 1976 and Fall 1978: daystudents were surveged at the time they- registered forclasses. they were encouraged to cpoPerate: but it was madeclear that particiPation/in the survey wad not a condition.of registration. From 43 August to 2 Septembe: 1980, 8:968of the 14:281 (62.8 %)Students registering foY'-day classesdid respond. Of%t'he 1:016 students who registered during the
. Period for changing classes:-between 5 and 19 September: anadditional 327 survey forms were obtained: 'so that a total
of 9:295 surveys ere'Processed: representing 60.8% of atotal enrollment of 15:297 day student's. (See Appendix:Table A-1), That" he sample: although comPletely voluntary:was acceptably /ePresentative is indicated in Table 1
(below) where survey data are compared with the Registrar's'-' Census data,:and it is evident
that even among-sub-catelories: discrepancies rarely exceed'two percentage points.
1
6
While agreement between% the ,sample data and the
poPulation, figures is not-as strong as that shown in Table :-
1, the typical sample:ciescepancy is in the' order 6f 'two..
Percentage -points_ar_less..__Ev_ening samples. are a reflectionof attendance during the .fourth ar' fifth' week of thesemester, whereps the Registrar't -figures indicate, the %-
active enrollment at that time.'
There are distinct normative differences .between, dayand evening Students at Cit4 College; for thit reason, theresponse patterns of the'two segments'ae shown_ separately.Figures for the College 'total have been apprapriatelv
tweighted._ ...
. Vi i .
.As a Ploose rule of thumb, one percentage.oint in___:, the
total. day figures dare' be construed as representingaPProximately 150 students . For the evening, a percentage'
.. POint represents approximately 105 student's. For exampler
where &.I.0. data-indicatethat 48.9'Z of day students are
iaaaes, the apProxibate day male enrollment could be,as.V.rmed '..
1 to bl4around 7,335-4150 x'48.9). The actual figure. for Fall 01980 was 7i137..
%This brief overview cannot begin to exhaust the Varietw ..
of important interactions among, the varziables contained inthese data. Persons wishing mor*P'recise%information in an
t
of the areas included in this survey are invited and
A- ,encouraged to make teauests for, amPlification 'cif env' of.4_,..,:these items to the Office of Testing and Re.earch. 4,
4 . i '
0
:110
.3
5
4
,

O
While agreement between% the ,samOle deta and the
Populations figures is not-as 'strong as that shown in Table1, the twPical sample:gescepancw is in the' order of twolpercentage -points_ox less..._Evening samples are b reflectionof attendance during 'the ,fourth fifth" week of', thesemester, whereas the. Registrar't .figures ind.icate- the
active enrollmenteilrollment at that time.'
.
. e
There are distinct normative differences between, dayand evening students at Citw College; for thit reasons the rresPonse patterns' of the. two segments*bre s,hown_ separately.Figures for the College total have been apprepriatelweighted. ¢'
A.
As elbose rule of thumb, one percentage.point thetotal, daw. figures dart' be construed as represerAin;!
,
approximately 150 students For the evening, a percentage.. POint represents approximatel 105 student's. For exampler-
where S.I.C. data'indicate.that 48.9' of dad students are
'males, the aPproxi"mate day male enrollment could be,as.imedto b.4arourid 7'335.4150 x'48.9). The actual figure for Fall 01989 was 7i137..
8
This brief overview cannot begin to exhaust the Varietof important interactions among, the 'varaables contained inti)ese data. Persons wishing more'F%recise..information in .anw
of the area's included in this survey 'are .d.nv.ited and
encouraged to make reauests for. amplification an .0f.
7these items to the Office of Testipg and Rerarch.
1
0
.3
5
4
a
4
'2* Response Patterns - Fall 1976 to rill 1980.'
4
The f011owing 'pages give the response patterns of thecurxentsui4vey, as well as those of the previous years.. 'the
Oxactwordingof eachitem as it appeared in the 1980 survey
is -given ',it, 'followed bld' a table of the percentages ofk
resPontes to .the alternatives, and a brief'discussion-of the.
''itemas a report of 'what appear to, ,be the- mostsignificant features.
,
.4,
., In ' addition, where apProPriate,', the outcomes are
represented -graphically, Partitioned over the total
distribetion,of 100 percent. The graphic representations aid'
lin- ' ;slacing the tabled figures fn perspective. Minor'fluctuctions,i& pencentage points .are barely discernable: A
V' 0 chanqe/ of ..one percentage point'is, after all, onlv, a change ,
of aneone-hundredth of-the whole. On the other hand/ trendsin the 'data are enhanced when represented graphically. °The
1. graphs also accentuate, regardless Of the year, th"distincta. differences, betwevn' the composition of dau and evening
Classes on almost every variable.
I
./
. Considerable discretion must 'be used in -reporting*ends .from these tables, ,since thq, nature of .the Questions
Cod,the available alternatives' for responses have not been
consistent over the three survey forms.__Some changes arelikelydue, at Feast in Part, to these Changes rather than
.significant shifts in City' College student population It, is'
advisable J.6. Paw. careful.attention-to the mans asteritkt.andpound signs inserted in the tables indicating changes, in the
,.
content of.01b item over the three survey periods.(
. ,-) . -
" _6.y
tt
C
* A facsimile of the 8.1/2' x 14' survey formsappended, Page''36.
6
4
1
S
4
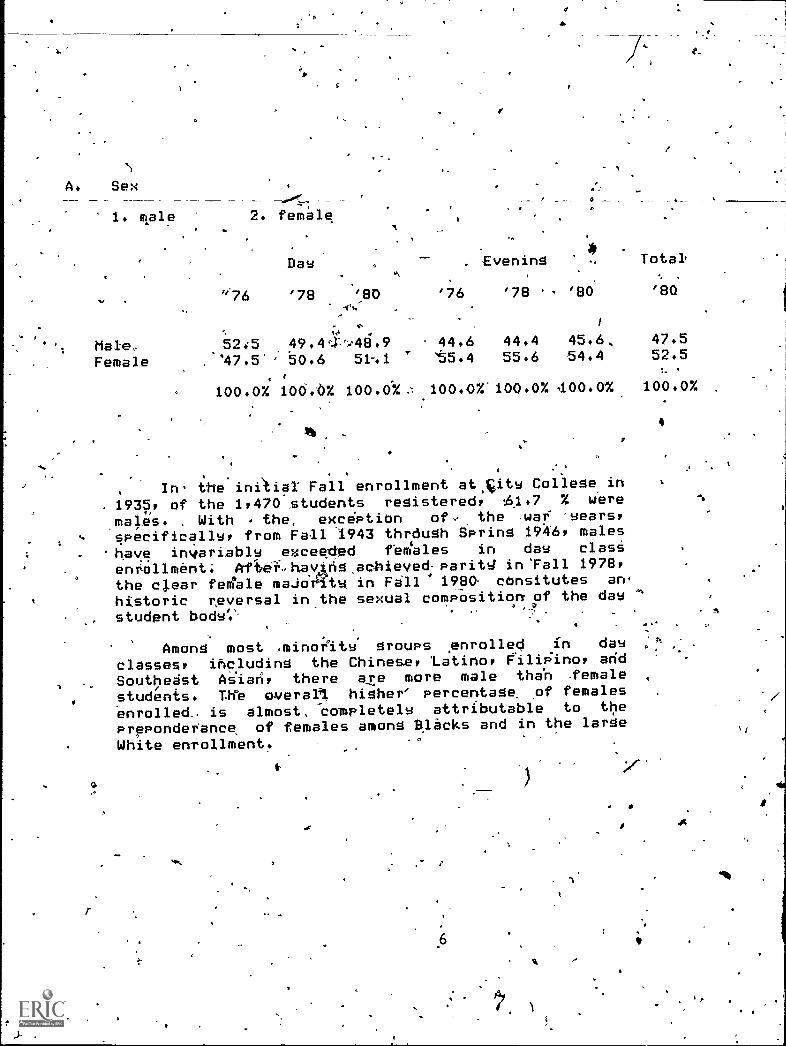
A. Sex
1. male 2. female
Day
'176 '78 '80
tIMale, 52.5 49.448.9 44.6 44.4 45.6, 47.5
Female . 447.5. 50.6 51-.1 '55.4 55.6 54.4 52.5
100.0% 106.'6% 100.0'%. 100.0%.100.0% 400.0% 100.0% .
- ,
at.
, *. Evening Total'
'76 '78 '80
4
In the inAiai° Fall enrollment at,city College in
1935, of the 1,470 .students registered, :61.7 % were
males. , With the, exceAion of, the .war 'years,specifically, from Fall 1943 thrdugh Spring 15467 males
have ifwariably exceeded fem'ales in day clasi
enrollment: Af4fei-haqhg.aohieved.paritg in:Fall 1978,the clear feMaIe majoffty in Fill 1980 cOnsitutes an4
historic reversal in the sexual composition of the dau
student body:' '..
Among most .minority groups enrolled in day
classes, including the Chinese, Latino, Filipino, and
Southeast As'ian, there are more male tha.n .female
students. Theme °waren, higher' percentage. of females
enrolled- is almost, Completely attributable to the
preponderance of females among Blacks and in the large
White enrollment. -° 'V.
6
A
"4)

11
DistributiOni)y .Sex of City College Day and Evening 'Students
Fa'11.1976 to Fall 1980
100%
90
80 2
.. 70
60r .
50 -
. 40 -
30
20.
0 _
'76 '78 '80
Day
0
'76 '78 .180
tvenin
Male s Female s1.
e
160'
Total
4.1
RCM .
- 414
S.
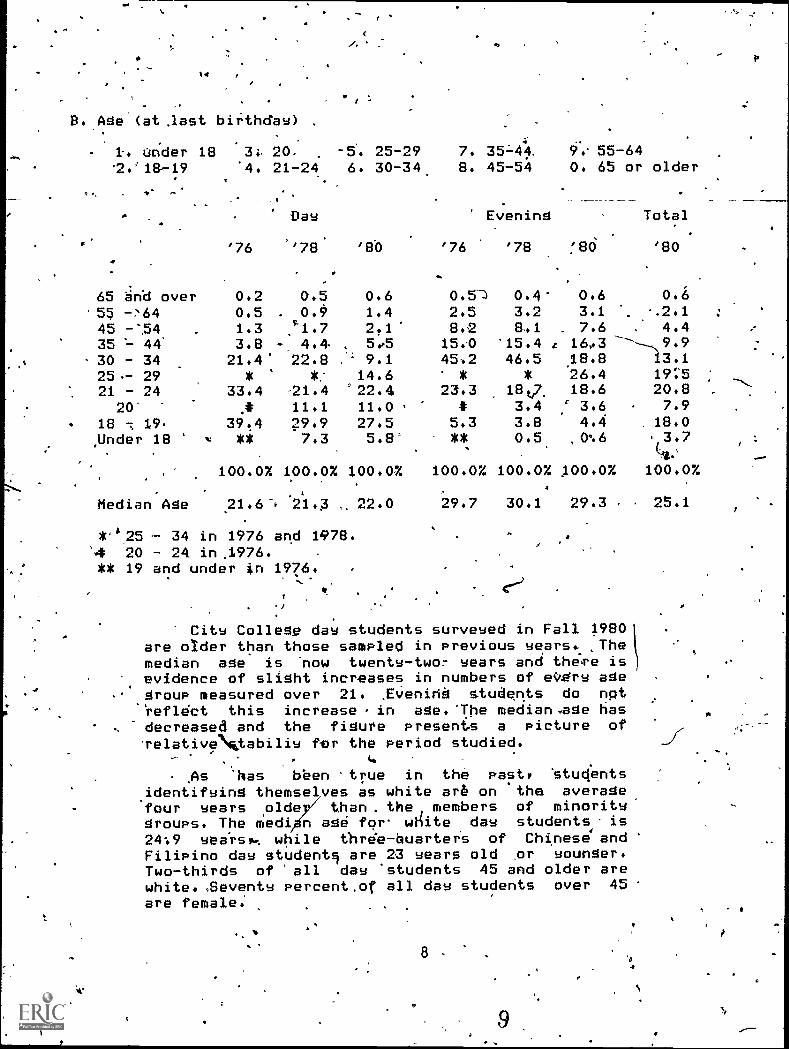
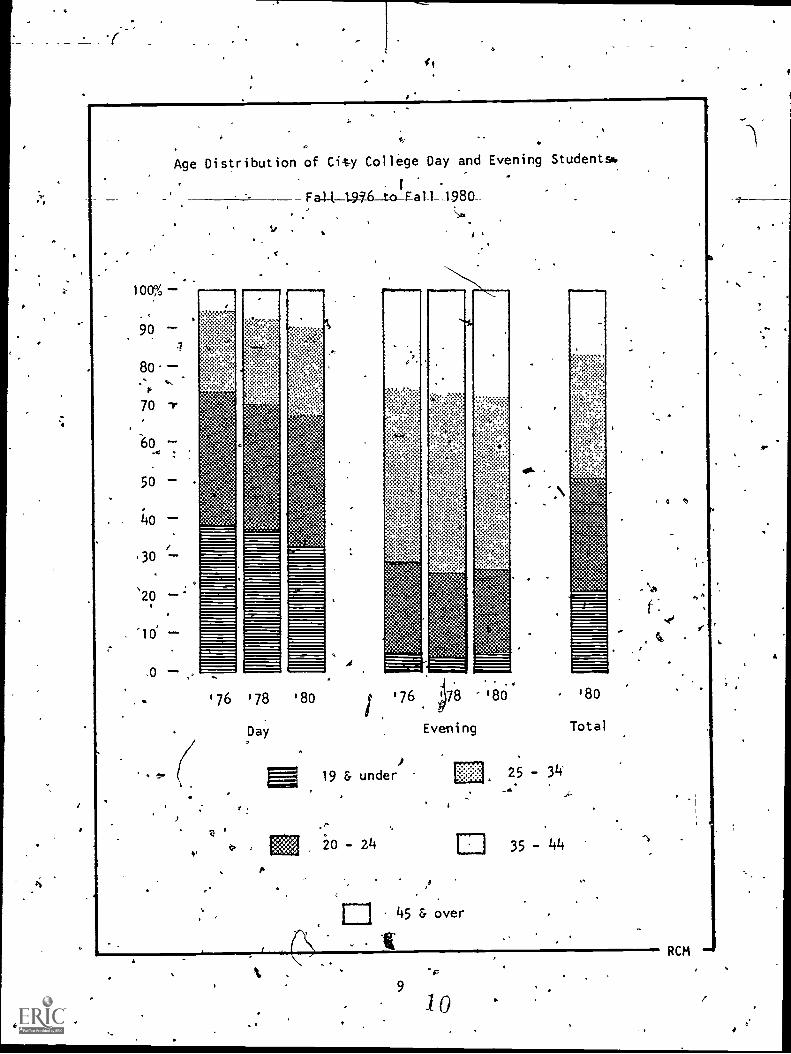
B. Age (at Jest birthday)4
.., 1. Under 18 3'4 20. -5. 25-29 7. 35L41. 9.. 55-64.2.:18-19 '4. 21-24 6. 30-34. 8. 45-54 0. 65 or older
, ..- ,...' 0-1-
a
* Oas Evening Total
'76 ''78 '80 '76 '78 '80 '80
.1 .
65 and over 0.2 0.5 0.6 0.57 0.4' 0.6 0.655 -,N64 0.5 . 0.9 1.4 2.5 3.2 3.1 . .2.1 :
45 -'54 1.3 .31.7 2.1' 8.2 841 . 7.6 : 4.435 - 44' 3.8 - 4. . 595 15.0 '15.4 z 16,.3 -----,,9.9
30 34 21.4' 22.8 :: 9.1 4542 46.5 18.8 13.125.- 29 * *. 14.6 * * 26.4 19'.'5
21 - 24 33.4 -21.4 '22.4 23.3 18t,7 18.6 20.890- .# 11.1 11.0 . * 3.4 : 3.6 . 7.9
18 -.., 19. 39.4 29.9 27.5 5.3 3.8 4.4 . 18.0
.Under 18 ** 7.3 5.8- ** 0.5 ,00.6 . 3.7
100.0% 100.0% 1.00.0% 100.0% 100.0% 100.0% 100.07.
Median Age .21.6'. 21.3 22.0 29.7 30.1 29.3 . . 25.1
*'$25 - 34 in 1976 and 1978.'4 20 - 24 in .1976.** 19 and under 01 1976!
City College day students surveyed in Fall 1980are older than those sampled in previous years. ,Themedian age is now twenty- -two- sears and the'Te isevidence of slight increases in numbers of every agegroup measured over 21. ,E%;enind students do npt'reflect this increase, in age. 'The median .age hasdecreased and the figure presents a picture ofelativeNktabiliy fur the period studied.
As 'has bben true in the pasty Studentsidentifying themselves as white are on the averagefour Years ,olde than the, members of minoritw
mgroups. The edi n age for white day students. is24:9 Yea'rsy.: while three- Quarters of Chinese andFilipino day students are 23 Years old or 9ounNer.Two-thirds of all day students 45 and older arewhite. .Seventy Percent.of all day students over 45are female.
8
.,11'111111111111111111111
:..
'':',::::::.4,
'...f3.'"'.
1111
..
UUUUUUUUNN
11115
4iI11111111111111111111111111111111111111
iNC
:141"11121111111111111111111111111111111111111111111
,°_
11111111111111111111111111111111111111111111111
M
eft
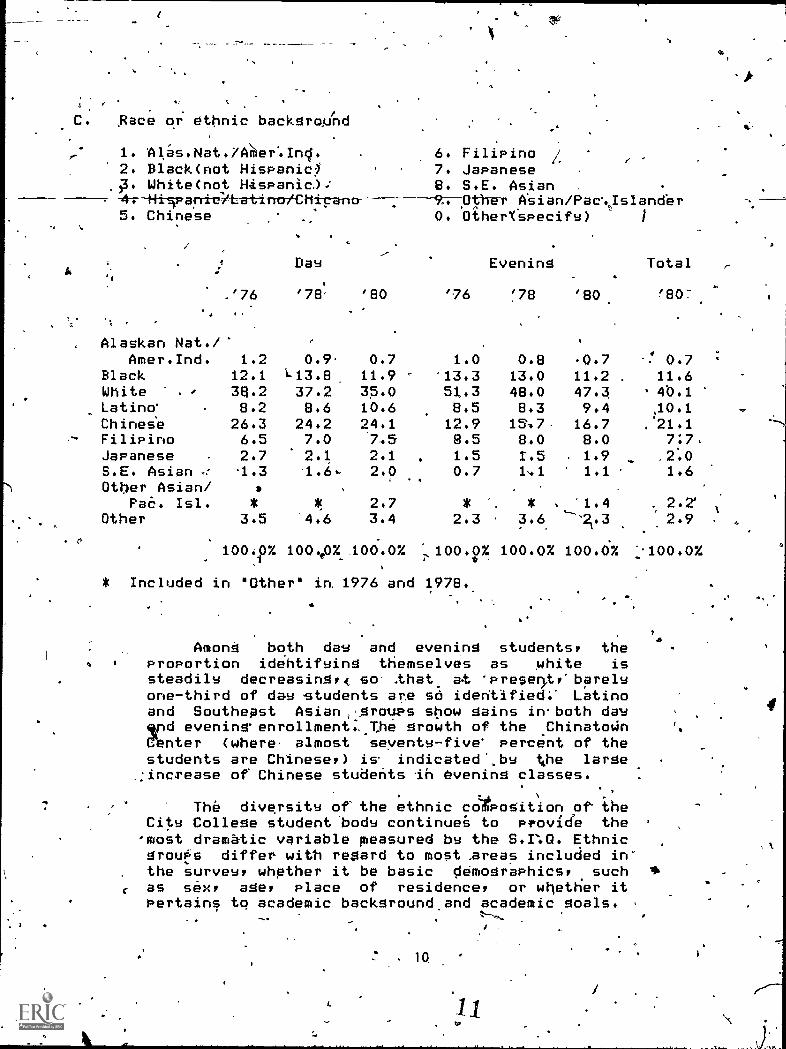
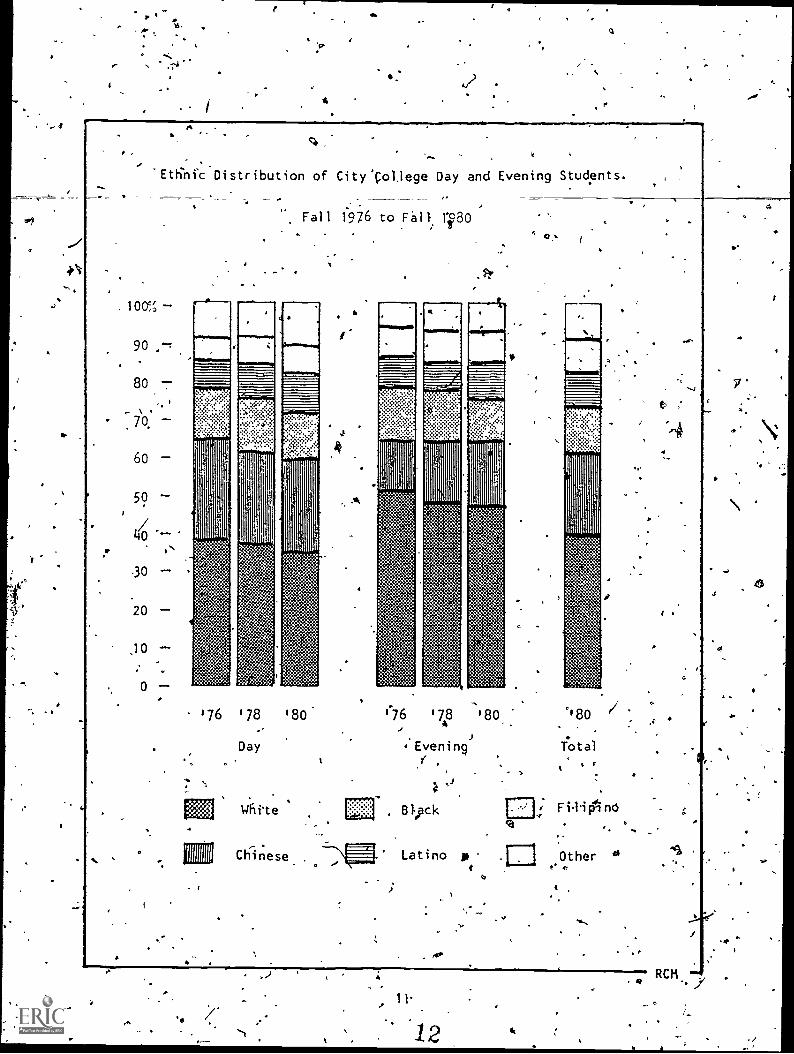
C. Race or ethnic background
1. AlPs.Nat.Yeler..Incl.2. Black(not Hispanic?
White(not Hispanic):4i-HIIpahriciteATITionrnir
6. Filipino /7. Japanese8. S.E. Asian
Other Aeian/Pa.js/ander
tia
A
1
5. Chinese O. OtherXspecifY) 1
4
DaY Evening Total
.'76 '78" '80 '76 '78 '80 '80
;
Alaskan Nat. /'Amer.Ind. 1.2 0.9 0.7 1.0 0.8 0.7 ! 0.7
Black 12.1 1-13.8 11.9 - '13.3 13.0 11.2 . 11.6White 38.2 37.2 35.0 51,.3 48.0 47.3 40.1Latino' 8.2 8.6 10.6 8.5 8.3 9.4 ,10.1 S,
Chinese 26.3 24.2 24.1 12.9 15%7. 16.7 21.1Filipino 6.5 7.0 '7.5 8.5 8.0 8.0Japanese 2.7 2.1 2.1 1.5 t.5 1.9S.E. Asian -1.3 '1.6., 2.0 0.7 1.1 1.1 1.6Other Asian/
Pae. Isl.)1!
2.7 * ', * . '1.4 2.2' 1.
Other 3.5 '4.6 3.4 2.3 . 3.6 --s2t.3 2.9
C'
100.07. 100'e0% Awi.o% 100.0% 100.0% loo.d% 1.100.0%
* Included in 'Other' in. 1976 and 1978.
4
Among both daY and evening students, theproportion identifying themselves as white issteadily decreasing,( so. .that at 'PreseDty'barelYone-third of day students are std identified: Latinoand Southeast Asian%graups show gains inboth daygrid eveninwenrollment:,The growth of the .ChinatoOnebnter (where almost seventy -five' percent of thestudents are Chinese.) indicated..bY the largeincrease of Chinese students in evening classes.
The diversity of the ethnic compoSition of theCity College student 'bodY continues to provide themost dramatic variable pleasured by the S.r.a. Ethnicgrouts differ with regard to most ,areas included in-the survey, whether it be basic demograPhicsy such *
c as sex, age, place of residence, or whetlier itPertains to academic background and academic goals.
a
10,
iJLFIItII
?*.-
:,
:.
.+
4:4::
ar..4 <Z
4 V
?:".".
:s.
..
:*',-.
:, "
: :%
f::
:- %-
s:
::
:::.
. f.
%.
;%;
% *"
" "::
:: %
I I

e_
4
4
D. Citizenship status
1. U.S. citizen-nativeborn
2. U:S. citizen-naturalized.34 Permariqnt-resident(gReen cTd)4. .refugee-Parolee-S.E.Asia f
5. refugee-Parolee7th.g.8.R.
C6. refugee-parolee-
.
Central, S. America7 refugee-parolee-other,
- 8. visitor visa9. student,visa(I-20)0: other visa(specify)
o,
Day ,,Evening"
j
Total ,
'76 '78 '80 '76, '78 '80 . '80 .
Native U.S. 79.7 67.'6 64..1 87.9 7.2.2 70.8 .66.4Naturalized, 11e7 112.3! *. 13.2 14.1 013.0Perm. Residept16.8 18.0 9.7 11.5 13.7'' 117,4Refugee ' 1.5 0.9 2.1 0.3 0.6 0 «6 1.6,
Visitor Visa - 043 0.1 0.1
Student Visa 1.2 1.3 0.1 0.1.: '40.2 0.8
Other Visa 0:5 0.3.:.; 0.2 0:1 0.? 0+3 ,4
100.0% 1'00,0% 100:0% 100.0% 1000% 100.0% 100.64
* 'Naturalized' included'With Mgtive U.S.'ip 1976.
. , - ,-
The Percente5es of naturalized citizens and,
especiallv porMarient -rei="idents ,have increasedsteadily at the expense of the percentage of nativeborn tudents who now,COnstitute barely two-thirdsof. the 'total enrollment.. Aathough then are still a
relatively small component of the student body, thePercentage of refugees is increasing,' and thirty
percent of Southeast Asian claw 'students PlacetNemselves in a-refugee Status. /.
S
12
I

1
Citizenship Status of.City College Day °and Evening Students.
'Fall '1978 and Fall 1980'
loo°4
,90
80
70
60
50
/ 40
0-30
20 2-
10
I.
'76 '78 '80
Day
ti
'76 '78 '80
Evening
17771 Perm. Res.
F77 Refugee
Visa
Native Born
Naturalized
A
'80
Total
e
13
14
RCM

I sm.a U. military veteran
1. priOr to Vietnam 3.2. Vietnam,era . 4.
Day
post-Vietnamno U.S. military service
rvening Total
'76 '78 '80 -'76 '78 '80 '80
Pre-Vietnam *, * 1.8 * * 5.1 .2Vietnamf 10.0 7.6' 3.8 19,.1 16. 7.2 5.3Post Vietnam * * 2.4 * '4( 2.1 2.3Non-veterart 90.0 92.4 92.0 80.9 83.9 85.6 89.2
. :,
,100:0% 100.0% 100.0% 10-0.0% 100.0% 100.0%. 100.07.
* 'Only "veteran' vert'us'non-veteran' in 1976 'end-1979.
Slightly more than one in ten ofoCity College students claimsU. S.. ,military experience.. About ten percent of these veteransarefemales. The veterans at City College are predominately white orblack, and tend to fall in the 35 to. 44 wear age group.
,-,
.
F. I usually get4to mw City Coflege classes mainly by *
, ik ,,
I. carpi drive 3. bus/streetcar 5. bicycle 7. motorcycle2.. car as passenger 4. BART 6. walking 49. other:
Day Evening # Totalo
'76 '78 '80
Drive car 36.5 35.8 35.4Car passenger 1.3 2.8 2.9MUNI . 491/4.3 47.5 ..46.4BART*
..
6.5 7.1 7.8Bicmcle * .0.7 1.Walk 3.2 (4.0 4.3Motdrcycfe * 1..6 1.6Other 3.2 0.5 ,0.5
oft100.07.'100.0% 100.0%
4
.176
69.4'3.519.63.3*
2.7*
1.5
100.0%
# Excludes off' - campus classes inEvening.* Data not available for 1976.
'80 '80
..'
63.7 60.1 43:99.3 8.0 , 4.7
17.9,-. 22.4 3824.6 4.4 6.60.2 0.5 Ot9/'3.0 3.2 ,3.90.9 1.1 1.40.4 0.3 .0.4
100.0% 100.0% 101:0:0%
The graph to the right does not .discriminate,betwee thee'utilization of a car-bw the driver and lhat'of a passensdr. anli,conseouently does not reflect the increase in car-Pooling\ that/has occured for -the past two reaps. -Despite the =nergO i
scrunch', utilization of MUNI by day students is decreHowever, one in five evening students now`- uses this me nsreach the campus. I 44A
14
15

tt
11)
Cr ar
(1.)
(1.)
a)(1.)
0
O
C0
4-O(1.)
O"0
>r.
41.
1
COaL
ft)LL
ti
I I 1
O' CD CD CD CD CD CD CD CD0 CO c-
CDCO
CoCCC)
0
CD'CO
CO T.(13
CCCC
CD
L.C)
C J
-C

G. . bur.ine this semester I Will live
.
0
1. with my spouse 3.0.
with mV parent(s) / 5. with friend(s)2., :as a singie parent 4. with other relative(s) 6. bw myself
%.
Day Evening Total
# '78 '80 # '78 :8Av: '80
W/ spouse Y 11.2. 13.2 ' 30.8 30.6' 20.3
. Single parent * 4.7. * 5.7 5,1
4/. parent(s) 50.1 47.3 1448 17.4 35,0
-14/ relative(s) 5.0 5.3 4.9 4.5 ,5.0 .
W/ friends . 13.2 12.8 -15.1 ,16.7 14.4
... BY myself 20.5 16.7 34,..4 25:1 '20.2
i °
10040% 100.0% 100.0%100.0% 100.07.
# Item not used tn 1976.* Not asked in 1978.
The percentage of students who report that they live alone has
dropped. Some of this reduction can be attributed to the.inclusion° of the alternative 'Single parent'.
0
H. In the United States,the highest diploma, certificate.or degree I have received is
1. education not in the U.S. 5. G.E.D. or Proficiency Cert.2. did not complete eltMentaru school 6. occupational certificate3. elementery schoOl 7. community:c011eie(AA or AS)
4. high school 8. college or university(BAorBS)9. pogt graduate (MA,PhOOD.,..)
Day Evening Total
'7.6 '78 '76 '78 '80 '80.
,
,Foreign Ed. 4.0 5.1. 9.4 7.6- 8.5 12.0 10.5
None f 4.3 6.4 0.4 3.1 4.0 0.2 0.3
Elementary 1.9 1..4 1.6's - 0.6 0.6 0.6 . 1.2
High School 74.2 66:1 64.6 44.6 412.0 39.5,- 64.3
M.D. 3:4 3.8 5.3 ' 32 3.1: 3.0 4.3
Occup. Cert. 3.0 .3.1 3.5 7.1 6.3 .5.8 4.4 ..
A.A./A.S. 449 S.8 7.3 ' 9.9 10.4 10.6 . 8.7
11.4,1.S. ' 3.6 6.8 6.5 18.6 18.8 21..2- - 12.6
PoSt Grad. 0.7 ' 1.5 1.4 5.3 7.3 7.1 3.7.41:!:'
100.0% 100.0% 100.0% 100.0 %, 100.0% 100.0% 100.0k'4 Av
f This alternative stated 'None' in 1976 and 1978.
The increased numbers of stUdentS whq identify themselves as
having been educated in a foreign country, as well as the increasing
numbers reporting pOst secondary degrees, have greatly reduced the
percentages of those with only a high school diploma Obtained in theUnited States among both day and evening students.
.
rt

e .
Highest U. S. Diploma Held by City College Day and Evening Students.
pow**
vet
Fall 1976 to Fall 1980
90
80
70
60
50
40
30
20
10 --
0
C
wiewoollo
'76 '78 '80., !76
pay Evening Total
'80
Foreign Ed:
Elm: or lets
HS Grad.
11111WGED or Cert.
AA/AS
BA & higher
6
17
18
RCM
4

4
f. +is main reason Apr choosing City College insteadof other colleges was
1. parent advised 5. no tuition2. high school advised 6. sPcial programs available3. CCSF.. student recommended 7. friend(s) go here4. to live at-home 8.-CCSF publicity
4
9. other.. (specify)
Day Evening Tote].
# '78 '80 # '78 '80,, '80
Parent advised 4.6 3. 0.8 1.0 2.3
H.S. advised 4.7 446°' 1.0. 1.1 3.2
CCSF studentrecommended * ' 6.0 , * 3.4 . . 4.9
Live home 7.0 11.2 1.6 6.0 9.0
No tuition 31.2 38.0 40.8 50.4 43.1
Programs. 22.5 20.4 29.6 24.5 22.1
: Friends go 2.8 3.9 1.3 1.9 3.1
Publicity * 3.6 * 3.4 3.5
Other .27.2 90. 24.9 8.3 8.8 11014
--
100.0% 100..07. 1Q ...-G( 10.0%
-
# Item not used in 1976.* Alternative not used in 1978.
or"
a
A
0
The current focus- on the issue of tuition
undoubtedly is reflected in the very large increasein Percentages of both des and'eveningstudents, whocite ,lack of tuition as the primers reason for
selecting Cits College frOm among the. mans
post-seconders institutions in this area. Half ofthe evening students, mans of whom are attending to
satisfy. personal intei:ests, give this as their
reason. In the two wears that this item pertaining
to choice of school has been Use0, the diversity ofspecial programs.offered at-City college appears- to
have lost some of .its lattractiveness as the prime
reason for attending*
:18
19 v,
- I
4

J. My.main educational goal while at CCSF is to
1. transfer to a 4 wear school2. complete a 2 sear degree program only3. obtain a semiprofessional certificate4. prepare for an entry level Job5..advance in present occupational field6.,change to a new occupation7. determine my ability in a new occupational field.8. learn or improve my English.9. personal interest0. other<specify)
Item '76
Transfer 48.52.Yr Prog. 22.0Certificate #
Ex}try Level 4.8Jot! Advance 3.4Change Job 2.-9
Dav
'78 '80
43.94 42.616.3 14.8
#- 6.44.6 4.85.3 4.04.9°' 5.8
Determine .
Ability 2.9 , 5:3 . 3.9
Improve Engl. 0.g 1.6 1.9 .
Pers.Interest 6.8 8.0 972-7-
Other . 1.7 /5.4, 1.6 .
Undecided \6.1 Y5.6 *
100.0% 100.0%100.0%
Evening Totalx
/
__'76 '78 , '80 .'80,
20.7 18.4 . 19.8 '36.2
8.6 5.9 6.7 11.5 °
f # 6.6 6.52.8 3.2 , 2.4 3.814.3 14.4 .15.5 8.7 )t,
9.0 .8.8 ,10.2 (7..6
. .
8.9 10..1 5.8 4.61.6 g.2 2.5 2.2
25.3 25.1 27.5' 16.73.9 8.9 3.0 2.24.9' 3.0, , * -
100.0% 100.0% 100.0% loo.az...
# Grouped under 2 sear occupational Programs 'in 1976 and 1978.'
* Not asked in 1980.
The intention to prepare for transfer, to a fou'r-year
school remains the dominant goal among City 'College
students, more than one out of every three students
indicating this. intention. Among day students, Chinese
students constitute' thirty. percent of all stu0eNts citing
this goal, since it is the stated goal of fifty-eight
percent of all Chinese day students. Similarly, while Black
students represent drily tWelve*Fsercent of .students aspiiqng
,.to transfer, it Ls the stated asPiration of about half ofall Black'day ttddente. Thee. Peebentage of White students
planning to7-transteie4(is
the lowest 'of anv..of the maJor
ethrriC grouPF0'41 PaiVbecaus.b about' seventy -five percent of
all Cites college'day.stuslents who already'hold a degree are
White.
-Taking courses out of a personal interest shows
cipeases in both day and evening as do the relatively smallPer6entages whose'Primary goal is-to' improve their English
.
language skills.
A19
.
r-
.t.
;.5
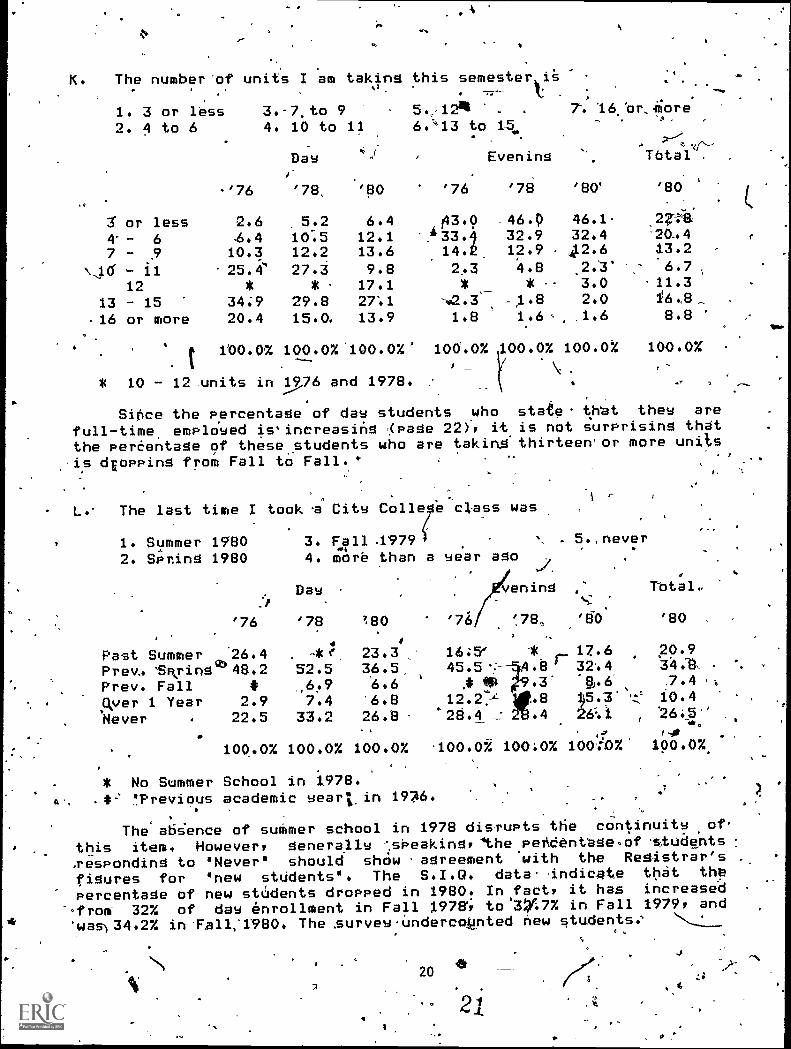
K. The number'of units I am taking this semester isos
1. 3 or less 3.-7.to 9 5...12
2. 4 to 6 4. 10 to 11 6."'1.3 to
Dav Evening
-'76 '78, '80 '76
3 or less 2.6 5.2 6.4 143.9
4'- 6 .6.4 10.5 12.1 .433.17 9 10.3 12.2 13.6 14.2_
\46 -25.4' 27.3 9.8 2.312 * 17.1
13 15 34.9 29.8 27'.1 -4,2.3'
16 or more 20.4 15.0, 13.9 1.8
4t 160.0% 100.0% 100.0%' 106.0%
* 10 12 units in 1976 and 1978..
Si0ce the percentage of day students whofull-time, emPloved is'increasing .(page 22), itthe perCentage of these students who are takingis dEopping from Fall to Fall. ''
L.' The last time I took -a City Colle e c]ass
1. Summer 1980 3. Fall .1'979
2. SPning 1980 4. more than a sear ago
Day2.0
'76 '78 4:80 '76
Past Summer '26.4 . -*; 23.3ji 16:51
Prey,. 14vingct) 48.2 52.5 36.5, 45.514;3
Prev. Fall 4 _6.9 6.6 ' 4 Vik
Aver 1 Year 2.9 7.4 '6.8 12.2"..-4
Never . 22.5 33.2 26.8 28.4
100.0% 100.0% 100.0% 100.07
* No Summer School in 1978.4#:' "Previous academic yearl.in 19?6.
.
,
The abs'ence of summer school in 1978 disrupts
this item, However, generally -";sPeaking,"theperldentageof.responding to 'Never" should show agreementFigures for new stUdents". The S.I.Q. data'
percentage of new students dropped in 1980. In'-from- 32% of day enrollment in Fall 1978', to'3*7%'wash 34.2% inTa11:1980. The surveY-UndercoMnted
20
7747.
7. 16 br,41core15.
Total .
'78 '80` '80
,46.6 46.1 .2za32.9 32.4 -26.412.9 42.6 13.24.8 ,2.3° 6.7* - 3.0 -11.3
-1.8 2.0 /6.81.6 c .1.6 8.8
100.0% 100.0% 100.0X -
4
. .
state- th'at they areis not surprising thatthirteen'or more units
.7
was
5.,never
.,./. 4.
vening ,`
s..; :
'18, ibb '80 ,
17 .6 ,20.9
8r 32.4 34.8.
.- -g.6 /.41)5.3' 10.4
211.4 ,
ey 1.0100.0% loohn 100.0%
the continuity ,of.-students
with the Registrar'sindicate that the
fact, it has increasedin Fall 1979, and
new students
21
-

ti
ch.
O
) .
M. Tpe total time (including.a,
semestert'already'completed) that 7 expect to attend CCSF is
one semester.2., one year
03h, one and. a half sears4. twb Years
One ,semesterOne sear. .
3 semestersTwo Years5 semesters'3:or 4'urs..-Over 4 yrs.Don't know
Mb.
Dag ;,*
#.
s.
one and a half searsthree-of four searsMore than four sears
8. don't -know
'Evening Total
* -# .'80. "00a
?
10.6?. 6.,3
0-2743 ,
, 16..2%.*
15.0.3.315t1 .
,.100 07./ 4
5.4 5.89,7 10.2 "\
6.9 6.615. -8 22.67.4 12..6
12.4x. 13.97,2 4.9
35.2 43.4 4.#100.0% bei.ot
, - . . . ,, ....p. -3'# New item, not on Prayious euestionnaiTesi.-
. s - -4.. I 3N.. .,
Thesd data are:%mildlY"weentaminatied by those
reSpondents who interrited the item as asking fortime previoutlt, s!.,en .04. the. -College. Thee modal
response of two yeiOt .owevero reflects the
raditional.belief thatAkomilunity college programs'
reauire 1'60- semesters for coMpletign. When theseresponses are bralten -down ;bw..stted .educa*ional 'goals (Item 'J),' 'the. modal response for mostsullgroUP's -i-s ale0 two uevs, :irrespectiyd- of the
goal. .(The only exCePtioils.$re from.those who areseeking to improve their-occupational siivationy or .
to improve English. language sio.illso and", 'not
surOrisingluo, those v. Whp'-'-'4Te 'studuing -to satisfy. personal inte'res0 These?grqpps tend to select the
alternatfve.'Doet knowl.O.. .
Students who resPonped.with longer periods 'oftime may be nbn-traditienal-: but have. 'a more
realistic view. ents,.:S" graduating from CitytIgcCollege in the acade veer 1978-79 attended on the
average foethtee sears, (median 5.8 semesters), and.the maximum was 2A s sters. ,--
°
t
4p4.1
,,, it 21 1. -"N
..
2cot
f'
1,

ti
N. Mu ...job situation now' iss
1. full-time emplOyed,.30 hours or more-2.,regualr part-time workat CCSF3'. regular part-timd wpk not'at CCSF4. occasional part-time work .
5: looking fOr work'thfough CCSF Placement Office6. lopking foP work through,otrier sources7. full-time hdoemakey
not be yorkAng
..
Er.1,.
, '76 '78.., ,
Fu11'7time, 13.0 19.9Pt-tio!e. CCSF 5.9 5.7.0,-time.other 35.5. 33.4Mime pt-time 11.6 9.2
'`Looking CCU.. 7.3 .6.8
4/ Looking other 10.6 6.7Homemaker, - * 2.5Will not work 16.1 15.8
\
'80 ''76
Evening
'78.
.
'86
Total
`80
23.6 - 77.1 8 .6 80.9 47.24.2 1.2' .9 0.7 2.8
2.0.7.' 9.5 6.7 5.7 14.5.
\15.0 3.6 -2.5 3.6,. 10.36.7 2.5 1;2 0.5 4.1
a 8.1 ., 2.9 1.9' -3.3 6.13.6 * 1.3 1.8 2.9,18.1 3.2 2.9 3:5 12.1
100.0% 100.0% 100.0% 100.0% 190:0%100.0% 100,07.,
..
Not asked in 1976. .
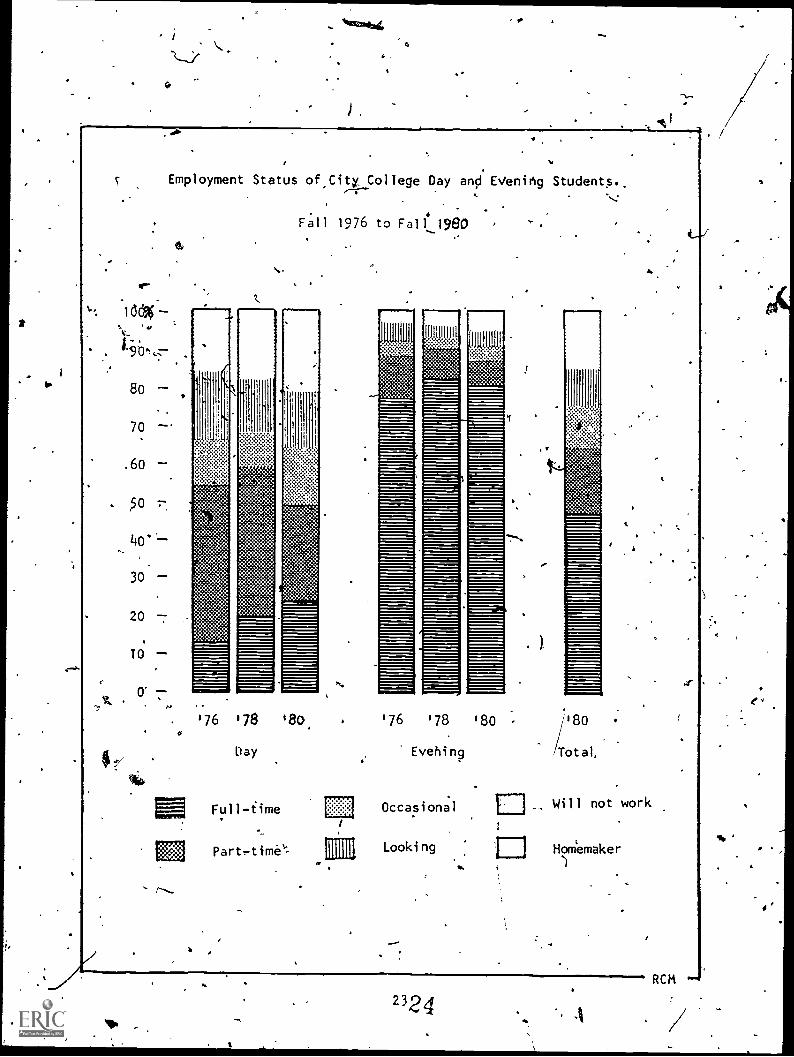
In the 'four-Year period spanned by thissurvey,. the number ey* dabs students who statethat they will 4e working full-time ,while
attending college has almost, doubled./Percentages of those working part- imer .
however, have fluctuated over this.periodl' andthe one in four -- students with regUlar-Part- mework is considerably less than the fortspercent ir, 1976. In spite of the age 'incrTaseawing,. day-students, there is also an increasedpercentage of these 'students who tate thatthey do not intend to 'work while to r ng coursesa1, City College. 'Percentages o , part-.4meworkers have beeri dropping steadily amongevening students.
22
iIfatosibit
Employment Status of.City College Day and Evening Students..
Fall 1976 to FalC1980
N.
80
70
.60
50
30.
20 7-
TO
'76 '78 '80.
Day
Full -time
Part,-time.
111111111K
Ts.
-v
11
10,.'76 '78
Evehing
Occasional
Looking
.=11.
8o /180
/Total,
Will not work
Homemaker
The two student services I will use most(in order of their imPortanCe)'are:
1. career counseling and gdidance 5. child carp -2. educational and program Planning 6. personal problems cOunseling
3. Job placeMent assistance 7. individual tutoring ,
4; student financial health8. health service0 , 9. none
First- Student Service:,
Tutoring 6.1.Hpalth Serv. *
_None 14.7Other 8.1
Daw
'76 '78 '80
Career Suid. 26.3 ,18.3 26.4e '23.8
Educ. Planing 10.6 8:7: 11.0 14.1
Job Placemnt 27.3 [17.5 10.6. 7 ,12.4
Financial Aids. * r 23.5 17.3 *
Child care * 1.9 A 1.8Pers. Counsel. 6.9 5.6 1.4 , 6.8
4.4 .3.7
3.2 2.916.'9 _ 22.9
*-
A.6-
,
*. 28.5
9.8
'76
100.0% 1001% 100.0% '100:0%
Not asked in 1976..# No4, asked in 1978 and,1980.-, ,
SecondVStudent Service:IL-,
a.
Career OUid.Educ. PlanningJob PlacemntFinancial AidChild CarePers. Counsel.. .4
* TutoringHealth Serv.None.
V
,Day
'80
.
/15.811.29.81.2
( 2.2:5.2
: 4.042.8
100.0%
e.
N
15.3 23,.2 26.312.5 12:7 11.79.0 5.47.7 4.5 12.02.1 1.0 1.45.3 0,.8 1.24.2 2.4 . 3.22.9 .° 1.4 -2.3
37.0 - 48.6 k 33.5
* *
Evening
100.0% 100.0% 100.0%
-
Evening Total
#. . '80 '80
6.514.2
.5 5.0
3.4,0.71.2'2.41.7
64.9
100.0%
'80
Total
'80.
7%315.18.6"7.21.01.84.13.051.9
100.0%
# lea item' not on Previous Questionnaires..
- .' .
214
25a
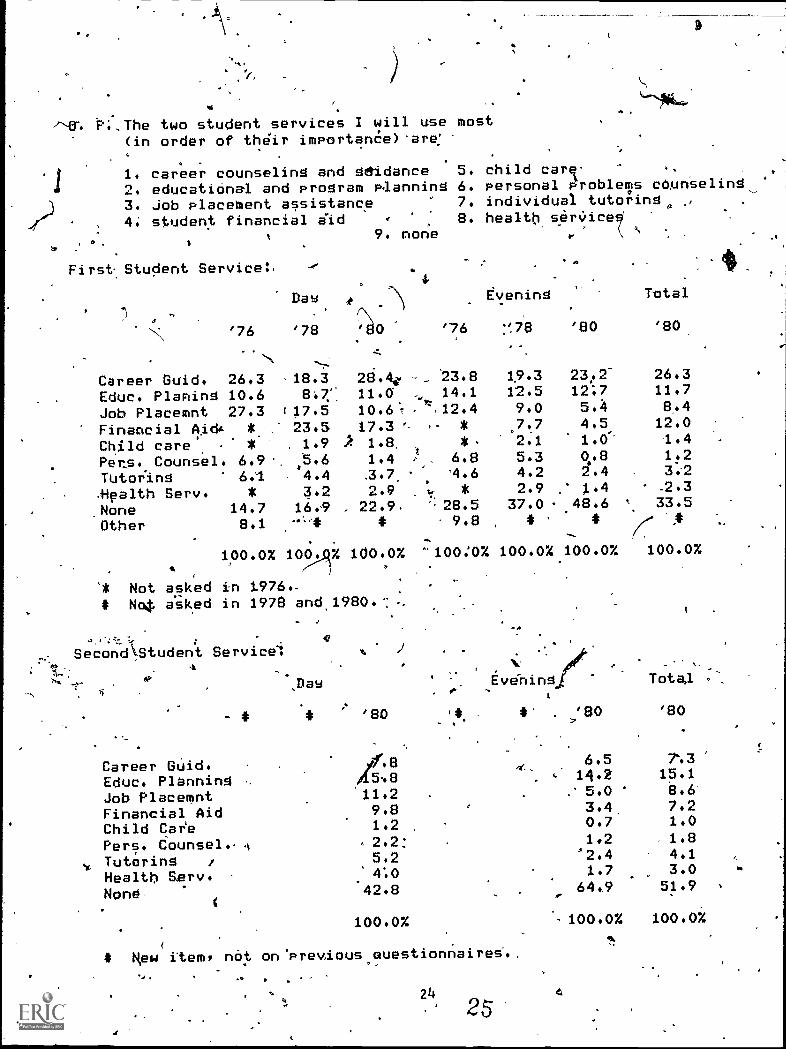
Assessing Student Services needs accurately is auestionablyreliable when the resporiara is restricted .to a single.alternative. The Present. survey -attempted 'to 4circUmvent thisrestriction by providing the opportuniy for a seconcryesponse to
r
the item.
However, the most conspicuous, trend emerging over the surreyperiod has-been that 0i' the rinereasing Percentages of- students,both day and evening, who express independence from anY. of thesndent services Offered: more than one in five 'day students andalmost-fiftvipeOcent of those who attend classes in the evening.
.Fcu both grduPs, day and evening, desire for career guidance&
is the conspicuous Prfority.'Of the respondents who exPr..essed an .
.interest..in Student Services in _Question 0, .about seventy-five'percent selected a second alternative as welly"--but studentsexpressing * need. for career guidance tended not to take advantageof this option.Students expz.ressing the need- for financial aid,
alto-tended to.cite this peed to the exclusion of a second choice.
.
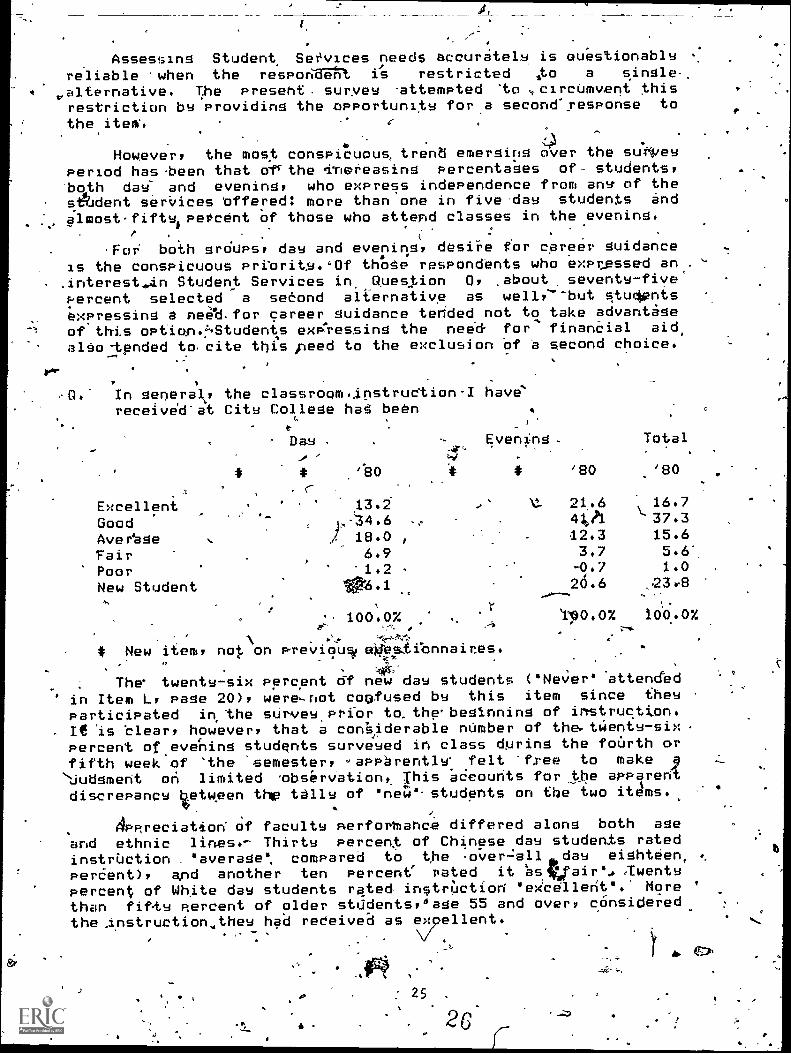
Q. In general, the classroom.lnstructionI have"receiveIdat City College hag been .
c
r
- Day -
- '-ir' Evening - Total.
- z-w .
.
# # ,'130 4 # '80 'BO. .
Excellent ' 13.2 ..` N-:- 21.6 16.7
Good.
, 40 37.3
Ave rage .
, ),:14.6 ,
/ 18.0 , 12.3 15.6
Fair 6.9 3.7 5.6Poor '1.2 - -0.7 1.0
New Student 0,6.1 20.6 23r8--
100.0% tpo.ox 10.o%
it New item, not. on reviou, Wes,tibnnaires.
The twenty-six percent of new day students ("Never' 'attended.
' in Item LP Page 20), were-not confused by this item since they
participated in the sUrvey.prior to.the'beginning of instruction.re is bleary_ however, that a considerable number of the- twenty -sixpercent ofevehina students surveved ih class during the foUrth orfifth week of 'the 'semester, -apparently' felt 'tree to make 9.
'judgment on limited 'observation,. This keourits for the apparerildiscrepancy letween thv tally of 'new'students on the two itJms.
4Ppreciation of faculty RerforMance differed along both age
and ethnic lines.- Thirty percent of Chinese day students ratedinstruction 'average'. compared to the over-:all aiday eighteen, a
perCent), and another ten Percent' rated it bsttairi, ;twentyPercent of White day students rated instrctiori 'excellent'.' More '
than fifAw percent of older students,6age 55 and over& consideredthe Anstruction.they had received as ex llent.
,ffR ,25
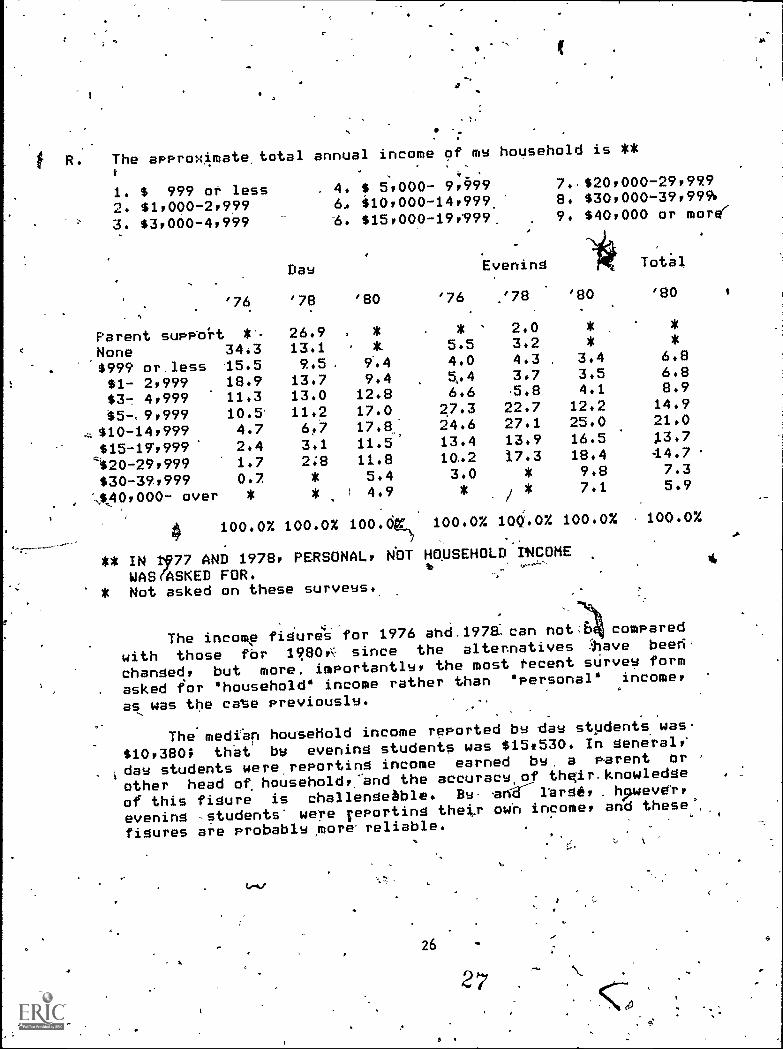
1 R. The approximate, total annual income of mw household is **°
,..
1. $ 999 or less2. $1,000-2,9993. $3,000-4,999
'76
Parent supPoi.t C.one 34:3
. $999 or.less 15.5$1- 2,999 18.9$3- 4,999 11.3
$5 9,999 10.5'
.1 $10-14,999 4.77,
$15-17,999 2.4
---$20-29,999 1.7
$30-39,999 0.7
, A40,000- over *
4 100.0%
4. $ 5,000- 9,999 7..$20,000-29,9996, 310,000- 14,999_' 8. $30,000-39,9991
6. $15,000-19,999. 9. $40,000 or more'
Dew Evening Tot'al
'78 '80 '76 '78 '80 '80
26.9 . * . * 2.0 * *
N 13.1 , * 5.5 3.2 * *
9..5, 9.4 4.0 4.3 , 3.4 6.8
13.7 9.4 5,.4 3.7 3.5 6.8
13.0 12.8 6.6 -5.8 4.1 8.9
11.2 17.0 27.3 22.7 12.2 14.9
6.7 17.8,: 24.6 27.1 25.0 21.0
3.1 11.5 13.4 13.9 16.5 13.7
2;8 11.8 10..2 17.3 18.4 44.7
* 5.4 3.0 * 9.8 7.3
* r 4.9 * / * 7.1 5.9
100.0% 100.0 100.0% 104.0% 100.0% 100.0%
** IN 1177 AND 1978, PERSONAL, NOT HOUSEHOLD INCOME
WAS ASKED FOR.%
* Not asked on these surveys.
The income figure4s for 1976 and_1978: can not4' compared
with those for 19)80ii: since the alternatives 'have beeti
changed, but more, importantly, the most recent survey form
asked for 'household' income rather than 'Personal' income,
as was the case previously.
The median household income reported bw taw students was
$10,380; that by evening students was $15,530. In general,'
;day students were, reporting income earned bw. a Parent br
other head of household,and the accuracy of their-knowledge
of this figure is challengeable. Bw- shArrarge, hpuever,
evening ,students' were reporting the,.r own income, and these',
figures are Probablv,more'reliable.
ti
26
27
V.t

t
The surveu form (see Appendix, Page 36), was pr4faced
4 with a auestion designed to categorize respondents b major
-0 principal area .of interestt
In what .subject area v ou elan to take most ojuourcourses ?
Dau
Percent Median Percent A.A. or
Response age male more
English 5.5 22.8 46.2 6.9
Fine Arts 9.6 25.2 42.4 25.3 -
Foreign Language 1.7 26.4 4245 36.8
Social Science 5.0 -22.2 '45.6 11.1
Phus. Science 6.0 22.3 56.8' 16.4
Phusical'Educ. 2.1 23.3 42.4 20.0
Nursing 6.2 24.8 ,'14.5 21.4
Other Health.1. 4.9 21.5 , 28.0 14.4
Engineering Tech. 11.6. 21.3 86.6 11.6
,Other Tech. 5.0 22:9 , 67.0 18.7
Computer'Sci. 9.6 ' 20.6 ,, 51.3 11.1
Accounting 6.5- 20.6 ,--4i4,0 . 10.5
,.Secretarial 2.0 20.1 ;5.9 ', 5.5
Other BusinessOthec
9.913.9
20.822.9
, 40549.3
10:918.2
'.
Engineerin.g Technologu, Computer 'Science;
Business and 1Fine Arts account for attribStfiftu
percent of all, responses. Engineering students are
primarily maler'although thirteen 'percent female
was probable unheard-of a decadougo. Engineeringstudents.tend to be uounger students, and sl*ghtlu
over one third are Chinese.
With thd exception of Fine Arts and Foreign
Language courses, .fftincirjAw students constitutemajorities in all of these classifications.: Over
eightu, percent of the dau students in ComputerScience are from minority grouP,s.
4
a

C
PercentResponse
Evening
Medianage
Percentmale
A.A. ormore
English 4.9 31.9 41.1 23.2
Fine Arts 7.7 30.0 44.7 47.1
Foreign Lanuage' 5.2 30.9 -43.9 61.2
Social Science 4.9 29.6 47.1 21.1
PhYs. Science 28.6 51.6 38.5Physical Educ,
.3.729.3 33.8 57.9
Nqrsing 2.8 27.7 15.3. 32.4
Other, Health 27.5 25.3 30.5
Engiheeting Tech., 5,p6 27.2 87.4 27,9
Other Tech. 2.9 '29.8 72.6 439.0Computer Science 12.8 28.5 52.1 38.4
Accounting 8.2 28.3 40.0 31.4
Secretarial 1.1 25.8 7.7 15.4Other Business. 20.4 30.2 46.3 42.8,
Other 11.9 29.9 43.0 42.3
Interest in business courses'', where a large
Percentage of evening students _already have atleast an Associate degree, - dominate EveningPregramming. As .was true of day classes, a highPercentage of evening students is alSo interestedin Computer Science. Among. evening students,'
' minority students constitute..about two-thirds of
those taking Engineering and ComPuter-Sciencecourses,, but, in general, the majority of students-in these listed courses in .the evening are White.
28 29

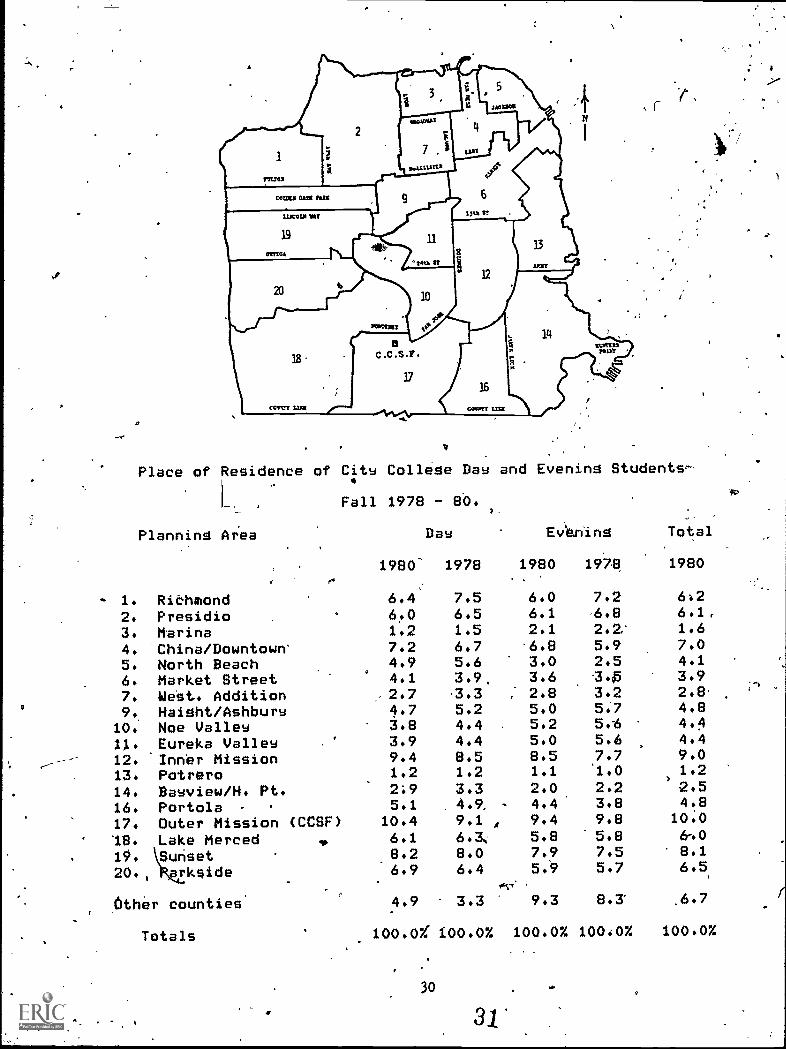
Residence by Planning Areas.
For purposes of identirging the students' places ofresidence, San Francisco is divided into 18 planning areasroughlw eouivalent to the postal ZIP Code areas. Sixadditional planning areas are used to identify the place 'ofresidence of students from the California countiescdntiguous with the City and Counts of San Francisco: (There .
are no planning areas numbered 8 and 15, these having beenabsorbed into adjacent areas prier to 1976.) The following.tables and figures identify the planning areas and show thepercentage. of the student body coming from each.. Comparablefigures for Fall' 1978 are shown, as well as combined day andevening totals.
There are few nota e changes in the distribution ofresidences when 1980 f ures are compared with those from1978. As a general rule, a eas more distant from the campustend to show reduced Percentages; those nearest to CityCollege indiCate gains. The percentage representation fromthe Richmond district (Area 1) dropped in both daw'andeveningi whereas, the Outer Mission (Area 17) and the InnerMiSsion (Area 12) now provide almost one out of every fivedabs students. The percentages of out of county students hdvealso increased, a reflection of the relaxed procedures forcrossing districtclines.
29
30
NA'
,r
Place of Residence of Cits College Dabs and Evening Students-
. 1
Planning Area
Fall 1978 - Bb.
Dav Ev6ing Total
e1980- 1978 1980 1978 1980
1. RiChmond 6.4 7.5 6.0 7.2 6:2
2. Presidio 6.0 6.5 6.1 .6.8 6.1,
3. Marina 1.2 1.5 2.1 2.2,' 1.6
4. China/Downtown' 7.2 6.7 6.8 5.9 7.0
5. North Beach 4.9 5.6 3.0 2.5 4.1
6. Market Street 4.1 3.9, 3.6 -3.i 3.9
7. West. Addition 2.7 3.3 2.8 3.2 2.89. Haight /Ashburn 4.7 5.2 5.0 5:7 4.8
10. Noe Valley 3.8 4+4 5.2 5.6 4.4
11. Eureka Valley 3.9 4.4 5.0 5.6 4.4
12. Inner Mission 9.4 8.5 8.5 7.7 9.0
13. Potrero 1.2 1.2 1.1 .1.0,)
1.2
14. Bavview/N. Pt. 2:9 3.3 2.0 2.2 2.5
16. Portola - 5.1 4.9, , 4.4 3.8 4.8
17. Outer Mission (CCSF) 10.4 9.1 A 9.4 9.8 10.0
'18. Lake Merced . 6.1 6.3, 5.8 5.8 6-.0
19. Sunset 8.0 7.9 7.5 8.1
20., arkside.8.26.9 6.4 5.9 5.7 6.5
. 0
Other counties 4.9 3.3 9.3 8.3" .6.7
Totals 100.0% 100.0% 100.0% 100:0% 100.0%
30
31
S

I1I
1
A
:4ks..
% .
11
1
1
1
II,
II1
I III
11.
r
4
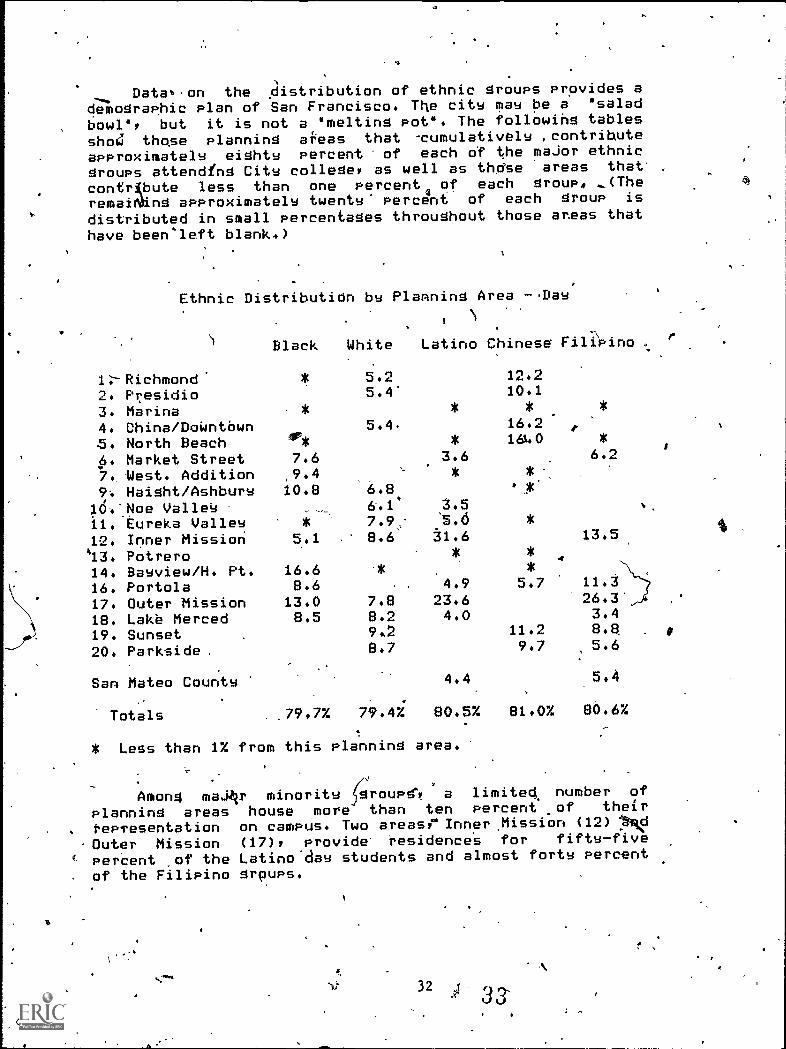
Datat.on the sdistribution of ethnic grouPs Provides ademographic plan of San Francisco. The cite maw be a 'salad
bowl', but it is not a 'melting pot'. The following tables
shod those planning areas that .cumulativelw ,contributeapnroximatelw eights percent of each of the major ethnicgroups attending Citw college, as well as thdse areas that
contri(bute less than one percent of each group. ..(The
remaiNling approximatelw twentw" percent of each group is
distributed in small percentages throughout those areas thathave been-left blank ..)
Ethnic Distributicin bw Planning Area -.Dawn
1:-Richmond'2. Presidio3. Marina4. China/DoWntbwn. North Beachk. Market Street
West. Addition
Black
*
7.6,9.4
White
5.25.4'
5.4.
Latino Chinese Filipino
12.210.1
16.21640
3.6 6.2* *
Haight/Ashburw 10.8 6.8 ,*
1.64Noe Valley 6.1' 3.5
11. Eureka Valley 7.9: tod,
12. Inner Missiori 5.1 8.6' 31.6 13.5,413. Potrero *
14. Bawview/H. Pt. 16.6 *16. Portola 8.6 4.9 547 11.3
17. Outer Mission 13.0 7.8 23.6 26.3'
18. Lake Merced 8.5 8.2 4.0 3.4
19. Sunset 11.2 8.8. .
20. Parkside. 8.7 9.7 5.6
San Mateo County 4.4 5.4
Totals .79.7% 79.4% 80.5% 81.0% 80.67..
* Less than 1% from this Planning area.
Among majkv minority g'''rouPS", a limited, number of
planning areas house more than ten percent of their
ePresentation on campus. Two areas, Inner Mission (12) 44144:1
. Outer Mission (17), provide' residences for fifty-five
( perbent of the Latino'claw students and almost forte Percent
. of the Filipino grouPs.
32 3a
v
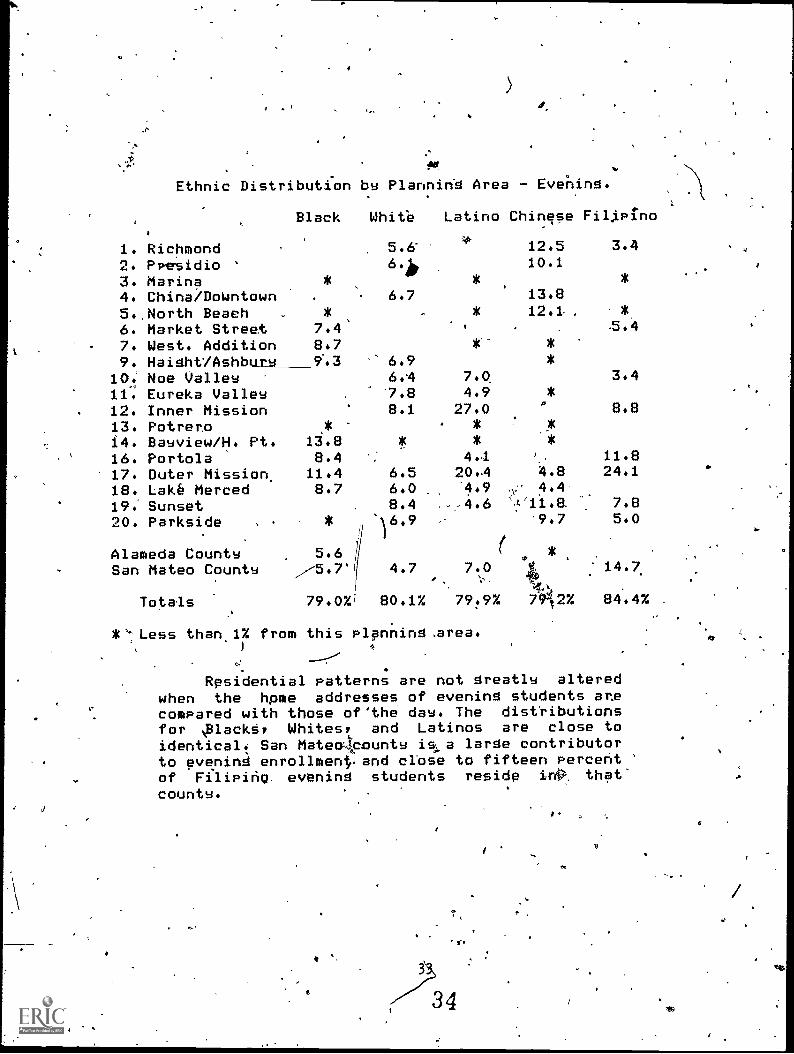
Ethnic Distribution by Planning Area Evehing.
*'-Less than 1% from this planning ,area.
Residential patterns are not greatly alteredwhen the home addresses of evening students arecompared with those of'the dabs. The distributionsfor 411ackt, Whites, and Latinos are close toidentical: San Mateo county is, a large contributorto evenini enrollment,. and close to fifteen percent '
of Filipino. evening students reside in*. thatcounts.
* : *
14. Bayview/H. Pt. 13.8 * *
16. Portola 8.4 4. 11.8
17. Outer Mission 11.4 6.5 20. 4.8 24.1
18. Lake Merced 8.7 6.0 "4,9 4.4
19. Sunset 8.4 -.:4.6 '11.8. 7.8
20. Parkside , * )6.9 9.7 5.0
Alameda Counts 5.6 ( *
,,,.San Mateo Counts 5.7' 4.7 7.0 1 : 14.7
Totals 79.0% 80.1% 79.9% 7912% 84.4% .
6
Residential patterns are not greatly alteredwhen the home addresses of evening students arecompared with those of'the dabs. The distributionsfor 411ackt, Whites, and Latinos are close toidentical: San Mateo county is, a large contributorto evenini enrollment,. and close to fifteen percent '
of Filipino. evening students reside in*. thatcounts.
O
0
O
0
Av.
6
!I4k;.
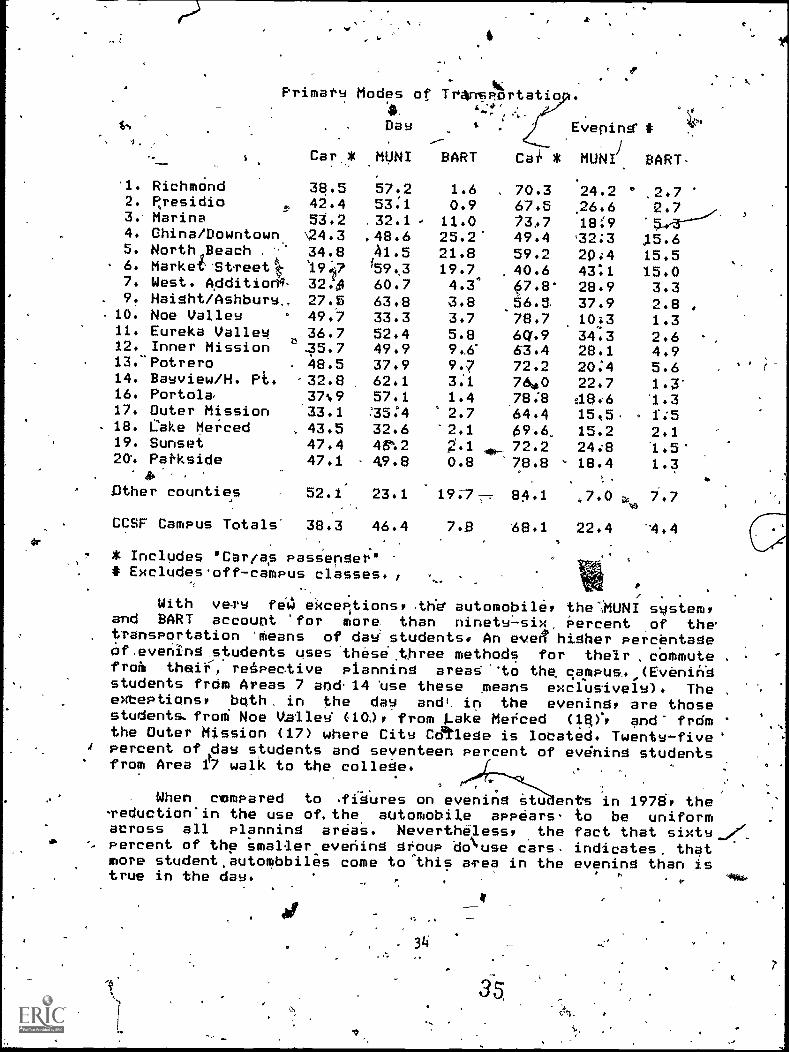
Primatw Modes of Trrr5portatio .
4v t r , .
leN Day .
.0
Evening' * efi:°
, ..
1 I---$ Car -* MUNI BART Car * MUNI BART-
'1. Richmond 38.5 57.2 1.6 , 70.3 24.2 ° ,2.72. Rresidio
3'42.4 53.1 0.9 67.5 26.6 2.7 /
,3.' Marina 53.2 .32.1 , 11.0 73,7 18:9 '5_,-3----4. China/Downtown 24.3 ,48.6 25.2' 49.4 ,32:3 15.65. North Beach . ''' 34.8 41.5 21.8 59.2 2Q.4 15.56. Market Street %' 19:"? 159.,3 19.7 .40.6 43:1 15.07. West. Additiore- 32.10 60.7 4.3° 67.8' 28.9 3.3
. 9. Haight /Ashburn., 27.5 63.8 3.8 56. 37.9 2.8. 10. Noe Vallew ' 49.7 33.3 3.7 78.7 10:3 1.311. Eureka Valley ,36.7 52.4 5.8 6q.9 34.3 2.612. Inner Mission .35.7 49.9 906' 63.4 28.1 4.913.-Potrero 48.5 37.9 9.7 72.2 20.4 5.614. Bayview/H. Pt. '32.8 62.1 31 76.40 22.7 1.3'16. Portola, 37s9 57.1 1.4 78.8 :18*6 1.317. Outer Mission -33.1 :35:4 2.7 64.4 15.5 . 1:518. Cake Merced , 43.5 32.6 '2.1- 696. 15.2 2.119. Sunset 47.4 48°.2 2'.1 72.2 24.8 1.5.20'. PaKside 47.1 49.8 0.8 78.8 ' 18.4 1.3
. a«. =. .
Ather counties 52.1 23.1 19:77-, 84.1 .7.0 ikw 7.7
CCSF Campus Totals' 38.3 46.4 7..B 68.1 22.4 -4.4
* Includes sCarta,s passenger'# Excludes'off-campus classes. ,
.
With very fe4 excerptions, the* automobile, the-;,MUNI system,and BART account for more- than ninety-six, Percent ,of thetransportation 'Means of dam students. An even higher Percentageof.evehing.students uses-theseAhree methods for their ,commutefro& theitcre4pective planning areas ''to the camPus. (Ever-lit-1'g
students from Areas 7 and. 14 use these means exclusively). The ,
extePtions, bqth, in the dew ands, in the evening, are thosestudents,frorti Noe Valley' (10i, from Lake Merced (1a)', and frdmthe Outer Mission (17) where City Cdtlege is located. Twenty-five'
A percent of dart students and seventeen Percent of evening students' from Area walk to the college,
C
When compared to ,figures on evening Stu ents in 1978, the-reduction'in the use of.the automobile aPpears to be uniformacross all planning areas. Nevertheless, the fact that sixtypercent of the smaller evening group dohuse cars. indicates, thatmore student,autombbilis come to°this area in the evening than istrue in the day. * 44AW
34
1
35:

r
r.
.0
4.
a .. s
t'Median Household Inca:6e bv.Planning Area.
tiLiav
o .
1. Richmond $ 1.17970.
2. Presidio 107290._3. Marina /15,360.4.-111-China/Downtown '77890..
5. North Beach .' 9;370:6. Market Street -4,610.7. West. Addition 67457.
.9. Haight /Ashburn, C 7270:
10. Noe Valley 13,170.11. Eureka Valley "8,370.
12. Inner Mission 77990'.
13. Potrero -
14. 'Bauview/HunterS:Pt. 97420:116. Portola 117130.17. Outer Mission 127020.18. Lake Merced .17/20041
19. Sunset20. :farkside 14,1460.
Other Counties
Midian Income
Evening
$ 15700.
17,840.137070.147-500.
4 11,620.147200..137750.18i540.14,880.
..127450.16,460.13,330.17,140.16,230.17610.
17,220.
4 ° I144:480 4
.4 19,100D.
/ '
.' I
40*380. 113.7530.
.
When personal income by pAanning area forevening students in 1978 is -Compared ./with the
household income reported evening students in1980, the correlatkons .9'47. In spite Of the .
difficulties in 'obtaining accurate income-
knfo6ation7,the impressive consistency over a
two-Year. pericid lends.erecWnceN.to the validitw ofthese data..
I
.35
36.w
4. .
4.
, e C. s . ,,
4

SAN FRANC ISCO COMMUNITY COLLEGE DISTRICT CITY COLLEGE OF SAN FRANCISCO
. STUDENT INFORMATION QUESTIONNAIRE Day - Reeistratios
FALL. 1980 ;- Evades - In aim.N.
The informationcompiled from this surve'yivill be used for planning purposes to help meet the educational .
needs of antudents at City Co No personal identification is used.a
In whatsublect area do you plan to take most of your courses?I. i.nstishs Letten 6. Physical Education2. Fine Ana 7. Nursing3. i orris; Languages 8. Other Health Related4. &mil Sciences 9. Engmeenng TechnologiesS. Phi seal S, tenets 10. Other Technologies
I I. Computer* Info Sciences12. Accounting13. Secretarial14. Other Business (specify)IS. Other (spectfyL
9 4
FOR EACH QUESTION. CIRCLE THE NUMBER OF THE ONE ANSWER THAT BEST DESCRIBESYOU. WRITE THAT NUMBER IN THE APPROPRIATE SPACE IN THE COLUMN AT THE RIGHT,BUT, FIRST, WRITE YOUR HOME ZIP CODE IN THE4SPACE BELOW.
,ZIPXODE of my home address is BESTa. COPV
A. Sex N.'VAILABLE.
...a.,
.ti
8. Age (at last birthday)I. under 18 9 3. 202. 18 19 4. 21.24
2. female
5. 25 296. 30 - 34
9
7. 3S448. 45 34
9. 55 64O. 65 or older
C. Race' or ethnic backgroundI. Alas. Nat. Amer. Ind. 3. White (not Hispanic)2. Black (not Hispanic) 4. Hispanic/Latino/Chicano
ti5. Chillier 7. Japanese 9. Other AsianfPac. Islandet6. Filipino 8. S.E. Asian 0. Oche* (specify)
B.
D: Citizenship status.. D.
I. u S. citizen native bom 4. refugee - parolee S.E. Ads 8. visitor visa2. L.S. citizen naturalized , 5. refugee parolee U.S.S.R. 'p 9. student visa (I 20)
3. permanent resident (green card) 6. refuge parolee Central. S. Arena 0. othet visa (specify)7. re&gee - parolee other
E. I am a U. S. military veteranI. prior to Vietnam 2. Vietnam era - 3. post-Vietnam 4. no U.S. militazyllrinee
F. I usually get to my City Cc:liege classes mSinly byI...u.. dove 3. bus /streetcar2. i sir as pusenget 4. BART
E.
F.5. bicycle6. walking
7. motorcygle '8. other
G. During this semester Twill live1. with my spriuse with my parent(s)2. 33 a single parent ',a 4. with other relattve(s)
5. with friends). 6. by myself
H. In the United States. the highest diploma, certificate or degree I have received is1. education nil in the U.S. 4. hfgh schgol 7. community college (AA.or AS)2. did not complete elementaiy school 5. G.E.D. tit Proficieticy Cert. 8. college Or unnersoly (BA or 13S)
3, elementary school 6. occupational certificate - 9. post graduate (Mk PhD. MD .7.) 6
H.
"
.Myoain reason for choosing City College instead of other7coileges waseI. parent advised 4. to hve at Mote -1. friend(*) go2. high school advised e S. no tuition , 8. CCSF pu3. CCSF student recommended 6. special programa available ' 9. othet (sp
city(y)
J. My main educational goal while at CCSF is toI. transfer 10 3 4 yeilId1001
2. complete a 2 yea* pt6vam only3. obtain a semiprofessional certificate4. prepare rot an entry level job5. advance in present occupational field S.
,6..,change to new occupation7. determine my *bat/ inwhew occupational field8. IC3.171 Of improve my English9. pencoal interest0. other (specify)
J.
K. The number of units I am taking this semester is K. o
I. 3 or leo 2. 4' to 6 3. 7 to 9 4. Idor II 5. 12 6. 13 to IS 7. 16 or more
L. The last time I took a City College class *asI'. Summer 1980 2. Spoils 1980 3. Fall 1979 4. mom than a yeu ago
L.
M.
5. never
M. The total time (including Semesters already completed) that I expect to attend CCSF is1. one semester 3. one and half years 5. two and a half years 7. more than fair yetis2. one year 4. two years 6. threc,or foiityeul , 8. don't know
N.N. My job situation now is
1. ritptane employe% 30 hours or more 5. looking for work through CCSF Placement Office2. regular parttimeJ. ngulu pasttime w t at CCSF
6. looking for work through other sources7: fu0 time homemaker
4, occasional parttime 8. will not be working
0. P. The rwo student seivices I will use most (in order of their importance) areI. career counseling and guidance 4. student financial aid2. educational and prograrnplahning S. child tare3, job placement aadstance 6. personal problems counseling
7. individual tutoring& heath anima9. none
O. In general, die classroom instruction I have received at City College has beenI. ...tenni 2. good 3. average 4. fair S. poor 6, new skknt no classes yet
P.t
Q.
Rr The,apprdximete total annual income of my household is1. S 999 or less 3. 53.000 4.999, 5. 110,000 14,999 7. S20,000 29,999 9. SIO.000 or more
2. 11.000 2.999 4. S5.0003 9.999 6. 515.000 19.999
R.
8. S30.000 39.999
S. EVENING DIVISION ONLY: I have answered this questionnaire this semesterI. in another Evening Chu 2. in day tegistratitin 3: both l and 2
36 3834. no.

tr
.
I
,..
IP-____,/
1 ,.
I
o,
kea
***
Identification of'Planning Areas Used to DetermineStudent's Place of e nce.
g
. 37..e
39
-Pi
.....,......,....!
*
.

/
STUDENT SORVENAATA-
Div School.Fall 1980
Date
13 Aug.
14
-15
18.
19
20
21 .
22
25
26
27,
28
29
'2 Sept.
5 19*
Daily
Enrtill. Surveyed
1347 851:,
0
1164 1142
1012 642
,1408 1083
818 508_
1236 ; 7E4'
1080' *581
1013 634. .
1120 614
949' 623'
- 884' 585
661- 293
'r823 539 ,
766- 484.
.1016 327
X
63.2
63.7
63.4
76.9
62.1
63.8
53.8
:62.4,
54.8
65.6
- 66.2
44.3
65.5
63:2
32.2
..\
Enroll
1347
2511
3523
4931
5749
6985
' 8065
17078
1-0198
11147
12031
12692
'13515
14281
15297
Cumulative
Surveyed
851
1593
2235
3318
3826
4615,
25196
5830
-6444
7067
'7652
t.,, 7945ve
8484
8968.
9295
i'X '
63.2
63.4
63e4.
-67.3
66.6
i1
64.4 , ,0 .---
64.4
63.2:
63.4. ..----
'63.6
62.6.-
62.8
62.8.
60.8,tis . ,
9' 4
firN'* Late regstation during Add and Drop Pe'tiod.
11
Table A - 1
$38
40,

C-
STUDENT SURVEY DATA
. tven4ns School
site
Fall
Classes
1980
-.7
Returns. Percent
Arriba Juntas 1 1 100.0 %
Airport 2 2 100.0
'Chinatown 16 13 81.2
c 413 371 89.8 4't
DowptliWn 85 81 95.3
PubliC Librarw 2 1 '50.0
fire Dept. 3 2 66.7.
-'-Hunters Point' 13 9 69.2
El Colegio 17 15 88.2
Presid4o 2 100.0
Star 7 100.0
skills Center 1 100.0
Sunset 9 7 77:8
Totals 571 512 89.-7
Table A - 2
OCT 2 198/-
.pIC Clearinghousefor Junior Coheges96 Powell Library Building
University of California,(A Angeles, California 90024
(
39,41
ts,