DOCUMENT RESUME - files.eric.ed.gov · the Rorschach, the Kuder Personal Preference Record, and the...
36
ED 044 738 AUTHOR TITLE INSTITUTION SPONS AGENCY PUB DATE NOTE AVAILABLE ERCM FDRS PRICE DESCRIPTORS ABSTRACT DOCUMENT RESUME CG 006 031 Gilbert, Dunham H.; Lester, James T. The Pelationshirs of Certain Personality and Demographic Variables to Success in Vocational Rehabilitation. Orthonaedic Hospital, Ios Angeles, Calif. Department of Health, Education, and Welfare, Washington, D.C. Social and Rehabilitation Service. Set) 70 3Fn. Dunham H. Gilbert and James T. Lester, orthopaedic Hospital, 2U00 South Flower Street, Los Angeles, California 90007 FDRS Price ME -$0.25 FC-$1.85 *Individual Characteristics, *Intelligence Differences, Intelligence Factors, Personality, *Personality Assessment, Personality Tests, Projective Tests, *Pehabilitation, Rehabilitation Counseling, Rehabilitation Programs, *Vocational Rehabilitation, Vocational Petraining The role of certain personality and intellectual factors in the vocational adjustment of a sample of 1/ vocational rehabilitation clients with a variety of problems was investigated. All subjects were administered the Minnesota Multiphasic Personality Inventory (MMPI) , the Rorschach, t'.e Kuder Personal Preference Record, and the Wechsler Adult Ir elligence Scale (WATS); in addition, selected demographic information was obtained. Several years later the sample was classified into three criterion groups: (1) rehabilitated (R) ; (2) nonrehabilitated due to physical considerations (NE-P) ; and (3) non-rehabilitated due to a "motivational" deficiency (NR-M). Among other findings, Group P members demonstrated relatively favorable psychological resources, both intellectual and emotional, had a slightly higher level of formal education, and were frequently unmarried. Results for the non-rehabilitated groups are included. A discussion of the value cf the various testing measures for this client population concludes the paper. (Author/TL)
-
Upload
truonghuong -
Category
Documents
-
view
215 -
download
0
Transcript of DOCUMENT RESUME - files.eric.ed.gov · the Rorschach, the Kuder Personal Preference Record, and the...
ED 044 738
AUTHORTITLE
INSTITUTIONSPONS AGENCY
PUB DATENOTEAVAILABLE ERCM
FDRS PRICEDESCRIPTORS
ABSTRACT
DOCUMENT RESUME
CG 006 031
Gilbert, Dunham H.; Lester, James T.The Pelationshirs of Certain Personality andDemographic Variables to Success in VocationalRehabilitation.Orthonaedic Hospital, Ios Angeles, Calif.Department of Health, Education, and Welfare,Washington, D.C. Social and Rehabilitation Service.Set) 703Fn.Dunham H. Gilbert and James T. Lester, orthopaedicHospital, 2U00 South Flower Street, Los Angeles,California 90007
FDRS Price ME -$0.25 FC-$1.85*Individual Characteristics, *IntelligenceDifferences, Intelligence Factors, Personality,*Personality Assessment, Personality Tests,Projective Tests, *Pehabilitation, RehabilitationCounseling, Rehabilitation Programs, *VocationalRehabilitation, Vocational Petraining
The role of certain personality and intellectualfactors in the vocational adjustment of a sample of 1/ vocationalrehabilitation clients with a variety of problems was investigated.All subjects were administered the Minnesota Multiphasic PersonalityInventory (MMPI) , the Rorschach, t'.e Kuder Personal PreferenceRecord, and the Wechsler Adult Ir elligence Scale (WATS); inaddition, selected demographic information was obtained. Severalyears later the sample was classified into three criterion groups:(1) rehabilitated (R) ; (2) nonrehabilitated due to physicalconsiderations (NE-P) ; and (3) non-rehabilitated due to a"motivational" deficiency (NR-M). Among other findings, Group Pmembers demonstrated relatively favorable psychological resources,both intellectual and emotional, had a slightly higher level offormal education, and were frequently unmarried. Results for thenon-rehabilitated groups are included. A discussion of the value cfthe various testing measures for this client population concludes thepaper. (Author/TL)
CoPe\
-4"
THE RELATIONSHIPS OF CERTAIN PERSONALITY AND
C:1
LLJ DEMOGRAPHIC VARIABLES TO SUCCESS IN
VOCATIONAL REHABILITATION
James M. Holt, Ph.D.
James T. Lester, Ph.D.
Project Directors
Written by
Dunham H. Gilbert, Ph.D.
and
James T. Lester, Ph.D.
Orthopaedic Hospital, 2400 South Flower StreetLos Angeles, California 90007
September 1970
M This investigation was supported, in part, by Grant NumberRD-283 from the Division of Research and DemonstrationGrants, Social and Rehabilitation Service, Department of
°oHealth, Education, and Welfare, Washington, D.C. 20201.
C.)

TABLE OF CONTENTS
Page,
Abstract iv
Introduction 1
Statement of Problem 1
Review of Selected Literature 1
Method 3
The Sample 3
Predictor Variables 4
Criterion Variable 5
Results 6
Methods of Analysis 6
Demographic Data 7
Type of Disability 9
Psychological Test Data 10
Discriminant Analysis 20
Discussion 24
The WAIS 24
The MMPI 25
The Kuder 26
The Rorschach 27
Concluding Considerations 28
References 29

LIST OF TABLES
Table Number page
1. Summary of Demographic Resdlts whichhad at Least Marginal StatisticalSignificance 8
2. Frequency Distribution for the MaritalStatus Variable as a Function ofCriterion Group 9
3. Summary of Statistically SignificantResults on WAIS Variables 11
4. Mean Scores for WAIS Variables 12
5. Summary of at Least MarginallySignificant Results for MMPI Variables . . . 14
6. Mean T-scores for the MMPI Variables 15
7. Frequency Distribution for the Numberof MMPI Clinical Scales with T-scoresAbove 70 as a Function of CriterionGroup
8.1: Frequency Distribution for the Numberof Critical Items Selected on the MMPIas a Function of Criterion Group
16
16
9. Summary of Significant StatisticalTests on Kuder Variables 18
10. Mean Scale Scores for the Kuder 19
11. Frequency Distribution for KuderExpressive-minus-Adjustive Scores asa Function of Criterion Group
12. Frequency Distribution of RorschachHuman Movement Responses as aFunction of Criterion Group
ii
20
20
Table Number page,
13. Discriminant Coefficients and Constantsfor Selected Predictor Variables Usedto Determine Criterion Status . . . .
14. Comparison of Predicted vs. ActualRehabilitation Status Using theDiscriminant Analysis
22
23
ABSTRACT
The major purpOse of the project was to investigate the roleof certain personality and intellectual factors in vocationaladjustment. A sample of 133 California Bureau of VocationalRehabilitation clients with a variety of physical problems wereadministered the Minnesota Multiphasic Personality Inventory,the Rorschach, the Kuder Personal Preference Record, and theWechsler Adult Intelligence Scale; in addition, selected demo-graphic information was obtained. Several years later the samplewas classified into three criterion groups: rehabilitated, R(employed or attending school); non-rehabilitated due primarilyto physical considerations, NR-P; and non-rehabilitated as aresult of a "motivational" deficiency, NR-M. Group R membersdemonstrated relatively favorable psychological resources, bothintellectual and emotional, had a slightly higher level offormal education, and were more frequently unmarried. Thedata pattern for the NR-M category suggested that only a mar-ginal level of personal adjustment was present, and that theclients were usually married. Group'NR-P resembled NR-M inmany respects but appeared to be better adjusted psychologically.Using a subset of weighted variables, criterion status waspredicted rather successfully; however, cross-validation ismandatory before the method can be used in the everyday rehabili-tation setting.
iv
INTRODUCTION
Statement of the Problem
The primary purpose of the project was to develop a techniquefor assessing rehabilitation potential based upon personalityand intellectual factors. That is not to say that physical dis-ability does not impose important limitations; however, it iswell known that psychological complications often interfere withthe rehabilitation process so that vocational and/or socialadjustment is poor. The desired end result would be a relativelystraightforward procedure whereby selected psychological anddemographic variables would be weighted in proportion to pre-dictive efficacy and would yield a derived score. On the basisof this measure the professional worker would then be able tomake more realistic decisions about a candidate's readiness forand response to rehabilitation procedures. Such a system wouldin theory save the agency both time and funds. Even if thehigh risk cases were accepted, special attention or modifiedtechniques might be implemented from the beginning with the aimof reducing the incidence of "failure."
Review of Selected Literature
While many surveys and discursive reviews of rehabilitationexperiences from a variety of clinical settings have emphasizedthe necessity of understanding personality factors, only a fewsystematic attempts have been made to validate prognostic scales.The study of Ayer, Thoreson, & Butler (1966) examined therelationships of certain demographic data and the usual MMPIT-scores to several criterion measures. The sample consistedof information for 45 cases characterized by some form ofemotional illness and 34 individuals with obvious physical dis-abtlity, drawn from the files of a district office of theDepartment of Vocational Rehabilitation in Wisconsin. Criterionmeasures included occupational level, upward mobility, and closurestatus. The latter, closure status (employed and/Or successfullytrained persons vs. others), had a multiple correlation of 0.65with the predictor variables. But, when considering correlations
-1-
between closure status and other independent variables indivi-dually, the only statistically significant finding was an r of-0.30 for age at time of application. The authors conclude thatMMPI scales might be rendered more meaningful if a standardi-zation were performed on a disability sample, a suggestion whichwill be mentioned again in a later section of the presentreport.
Less encouraging findings have been presented by Lowe (1967).A sample of persons who had been previously hospitalized withsome form of psychiatric problem were tested using the WAIS,MMPI, and Rorschach. These data were compared to occupationalstatus (gainfully employed vs. unemployed). Only 3 of 39 testscale comparisons were statistically significant, and not oneof the three was confirmed when a cross-validation subsamplewas analyzed.
Another investigation (Nadler, 1957) sought to determine thepredictive validity of prorated estimates of WAIS Verbal andPerformance IQ's, and Bender-Gestalt scores, with respect towork performance of 53 older severely handicapped individLals.The correlations of WAIS-Verbal and WAIS-Performance scoreswith a measure of job performance were 0.51 and 0.54, respectively.Thus intellectual factors appeared to account for about 25%of criterion variance. The mean scores associated with thetwo WAYS variables were Verbal = 92.5 and Performance = 87.5;the author speculates that the relatively lower Performance IQmight be a function of the physical disability of the patient.
Manson (1953) attempted to predict rehabilitation outcome for agroup of 30 male amputees at a V.A. hospital in California.It was concluded that fundamental differences in personalitystructure and dynamics were very important factors in rehabili-tation activities.
The major purpose of a relatively successful study (Ehrle, 1964)was to devise an instrument based upon biographical data in orderto predict eventual employment status. Items contained on theMissouri State Vocational Rehabilitation Form R-4 were thepotential predictors. Using a differential weighting system,and two cross-validation samples, expectancy charts wereestablished. One scoring key based upon only 20 variables,identified correctly 69% of the second cross-validation group.
-2-
Several conclusions may be drawn regarding the cited examplesof research findings:
1. Certain personality and intellectual factors do indeed seemto play an important part in an individual's response to rehabili-tation efforts.
2. Studies have usually been confined to either demographicor psychological predictors, but rarely both.
3. There is clearly a need to evaluate other types of psycholo-gical instruments (e.g., interest inventories and projectivetechniques) as potentially useful indicators of rehabilitationoutcome.
METHOD
The Sample
All individuals making application to the Los Angeles officeof the California Bureau of Vocational Rehabilitation were eligiblefor inclusion in the study, with the following exceptions:
1. Persons who were clearly mentally retarded (whose testresults would have been questionable).
2. Persons who were blind, deaf, or otherwise had some impair-ment of communication ability so that the investigative pro-cedures would have been inappropriate.
3. Persons whose primary disability was paychiatric.
4. Persons employed or attending school full-time atof application.
5. Persons who had previously received psychologicalfrom the Bureau.
the time
testing
6. Persons who had no telephone, and thus could not be con-tacted directly in order to ensure appearance for a researchappointment.
The Bureau reported that such restrictions eliminated about
-3-
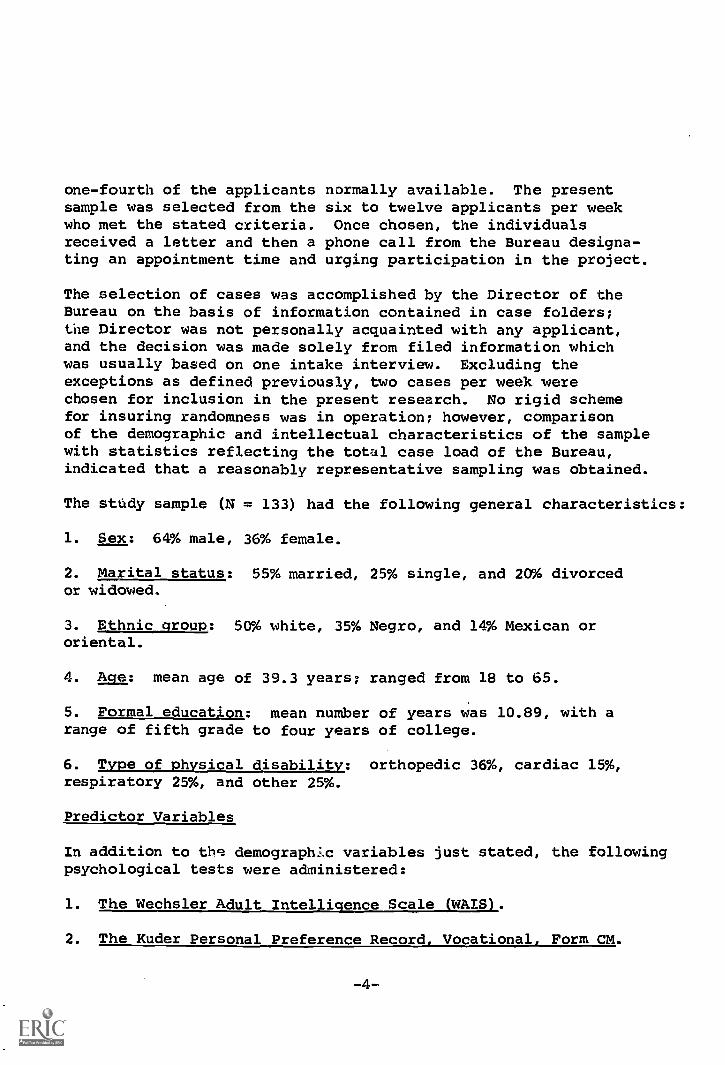
one-fourth of the applicants normally available. The presentsample was selected from the six to twelve applicants per weekwho met the stated criteria. Once chosen, the individualsreceived a letter and then a phone call from the Bureau designa-ting an appointment time and urging participation in the project.
The selection of cases was accomplished by the Director of theBureau on the basis of information contained in case folders;the Director was not personally acquainted with any applicant,and the decision was made solely from filed information whichwas usually based on one intake interview. Excluding theexceptions as defined previously, two cases per week werechosen for inclusion in the present research. No rigid schemefor insuring randomness was in operation; however, comparisonof the demographic and intellectual characteristics of the samplewith statistics reflecting the total case load of the Bureau,indicated that a reasonably representative sampling was obtained.
The study sample (N = 133) had the following general characteristics:
1. Sex: 64% male, 36% female.
2. Marital status: 55% married, 25% single, and 20% divorcedor widowed.
3. Ethnic group: 50% white, 35% Negro, and 14% Mexican ororiental.
4. Age: mean age of 39.3 years; ranged from 18 to 65.
5. Formal education: mean number of years was 10.89, with arange of fifth grade to four years of college.
6. Type of physical disability: orthopedic 36%, cardiac 15%,respiratory 25%, and other 25%.
Predictor Variables
In addition to the demographic variables just stated, the followingpsychological tests were administered:
1. The Wechsler Adult Intelli ence Scale WAIS .
2. The Kuder Personal Preference Record, Vocational, Form CM.
-4--
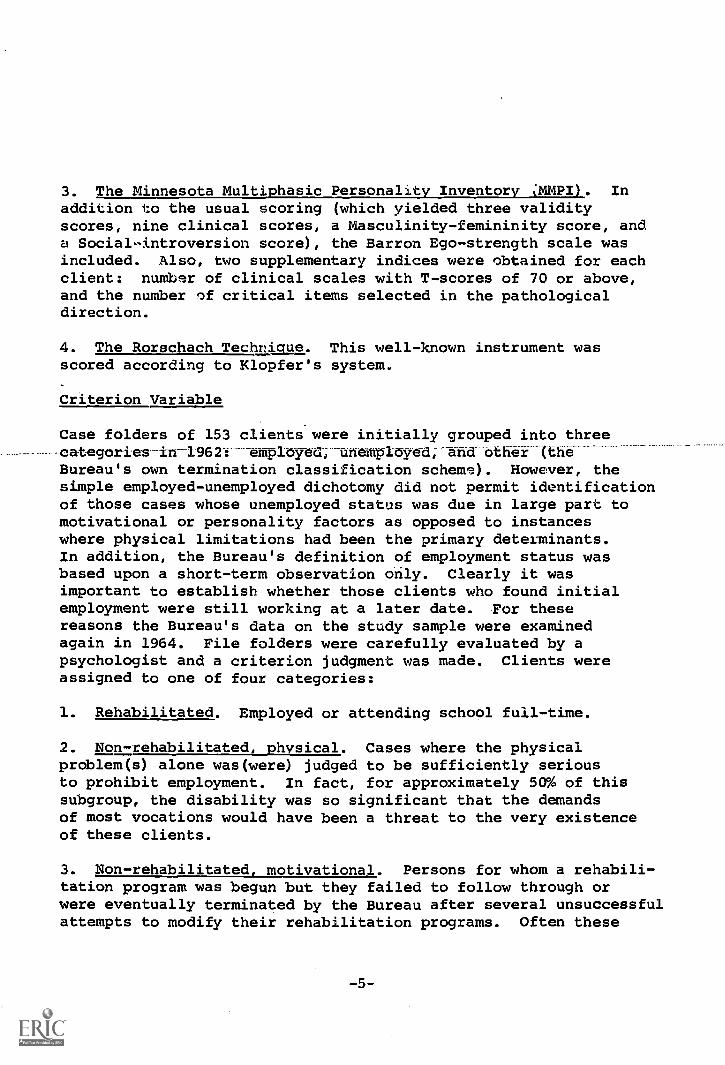
3. The Minnesota Multi hasic Personalit Inventor MMPI . Inaddition to the usual scoring (which yielded three validityscores, nine clinical scores, a Masculinity-femininity score, anda Social-introversion score), the Barron Ego-strength scale wasincluded. Also, two supplementary indices were obtained for eachclient: number of clinical scales with T-scores of 70 or above,and the number of critical items selected in the pathologicaldirection.
4. The Rorschach Technique. This well-known instrument wasscored according to Klopfer's system.
Criterion Variable
Case folders of 153 clients were initially grouped into threecategories-in-1962T -employed; unemployed and -other ( theBureau's own termination classification scheme). However, thesimple employed-unemployed dichotomy did not permit identificationof those cases whose unemployed status was due in large part tomotivational or personality factors as opposed to instanceswhere physical limitations had been the primary determinants.In addition, the Bureau's definition of employment status wasbased upon a short-term observation only. Clearly it wasimportant to establish whether those clients who found initialemployment were still working at a later date. For thesereasons the Bureau's data on the study sample were examinedagain in 1964. File folders were carefully evaluated by apsychologist and a criterion judgment was made. Clients wereassigned to one of four categories:
1. Rehabilitated. Employed or attending school full-time.
2. Non-rehabilitated, physical. Cases where the physicalproblem(s) alone was(were) judged to be sufficiently seriousto prohibit employment. In fact, for approximately 50% of thissubgroup, the disability was so significant that the demandsof most vocations would have been a threat to the very existenceof these clients.
3. Non-rehabilitated, motivational. Persons for whom a rehabili-tation program was begun but they failed to follow through orwere eventually terminated by the Bureau after several unsuccessfulattempts to modify their rehabilitation programs. Often these
-5-.

individuals did not keep appointments for counseling, andtheir counselors felt that they were generally uncooperative.Physical considerations did not appear to impose notable restric-tions in activity. Like members of the second category, theywere not employed.
4. Unassigned. These 20 people were not capable of being placedin one of the preceding classifications due to either a lack ofrelevant data (e.g., persons who moved without completing aprogram, died, etc.), or because there was not sufficient informa-tion on file for the psychologist to render a meaningful decision.
The sample frequencies and associated percentagescriterion categories were:
in the various
Rehabilitated . . . . 86- (65%)
Non-rehRbilitated, physical (NR-P) . . . . 20 (15 %)
Non-rehabilitated, motivational (NR-M) . . 27 (20%)
Final total N .133
RESULTS
Methods of Analysis
Initially, each individual predictor was examined in regard toits association with the criterion variable. Once this was done,a discriminant analysis was performed in which a subset of in-dependent variables were evaluated jointly in terms of predictiveusefulness.
Several fundamental statistical techniques were chosen to analyzethe data obtained in the present study, and are described below:
1. Biserial correlation. This statistic was designed to beused in situations where one of two variables is in 1Tact con-tinuously measurable, but for practical purposes has been dichoto-mized. In the present case it was both expedient and justifiableto assume that the criterion variable (rehabilitated vs. non-rehabilitated) was continuous; but in the absence of an adequatemeasuring instrument had been reduced to two basic categories.
-6-
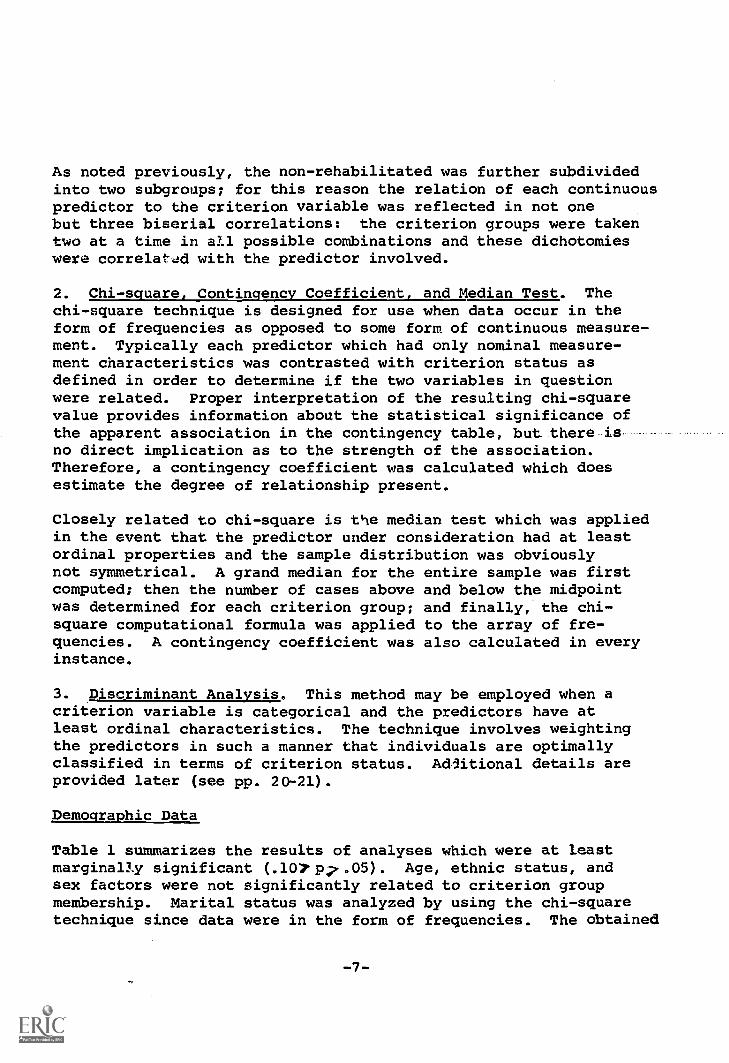
As noted previously, the non-rehabilitated was further subdividedinto two subgroups; for this reason the relation of each continuouspredictor to the criterion variable was reflected in not onebut three biserial correlations: the criterion groups were takentwo at a time in all possible combinations and these dichotomieswere correlatJd with the predictor involved.
2. Chi - square Contin enc Coefficient and Median Test. Thechi-square technique is designed for use when data occur in theform of frequencies as opposed to some form of continuous measure-ment. Typically each predictor which had only nominal measure-ment characteristics was contrasted with criterion status asdefined in order to determine if the two variables in questionwere related. Proper interpretation of the resulting chi-squarevalue provides information about the statistical significance ofthe apparent association in the contingency table, but there isno direct implication as to the strength of the association.Therefore, a contingency coefficient was calculated which doesestimate the degree of relationship present.
Closely related to chi-square is the median test which was appliedin the event that the predictor under consideration had at leastordinal properties and the sample distribution was obviouslynot symmetrical. A grand median for the entire sample was firstcomputed; then the number of cases above and below the midpointwas determined for each criterion group; and finally, the chi-square computational formula was applied to the array of fre-quencies. A contingency coefficient was also calculated in everyinstance.
3. Discriminant Analysis. This method may be employed when acriterion variable is categorical and the predictors have atleast ordinal characteristics. The technique involves weightingthe predictors in such a manner that individuals are optimallyclassified in terms of criterion status. Additional details areprovided later (see pp. 20-21).
Demographic Data
Table 1 summarizes the results of analyses which were at leastmarginally significant (.107 p7 .05). Age, ethnic status, andsex factors were not significantly related to criterion groupmembership. Marital status was analyzed by using the chi-squaretechnique since data were in the form of frequencies. The obtained
-7-

value of chi-square was 9.094 which had an associated probabilityof .10>p> .05. Inspection of the contingency table, and cell-square contingencies, indicated that there were a greater number
Table 1
Summary of Demographic Results whichhad at Least Marginal Statistical Significance
VariableGroups
Considered StatisticStatisticValue Probability
.10>p;>.05
.107.. p.05
pc:.01
p:.05
1Marital Status*
Marital Status*
Education**
Education**
R, NR-M, NR-P
R, NR-M, NR-P
R, NR-M
R, NR-P
Chi-square
Contingency,Coefficient
BiserialCorrelation
BiserialCorrelation
9.094
0.254
0.322
0.284
'*Sample Size: R = 85, NR-M = 27, NR-P = 20
**Sample Size: R = 84, NR-M = 27, NR-P = 20
of single persons in group R than would be expected on a chancebasis, and fewer single persons in both groups NR-M and NR-P.Table 2 presents the observed frequencies for marital statusas a function of criterion category.
The education variable was treated statistically by computingbiserial correlations for the criterion groups taken two at atime. The value of the biserial correlation (rb) for thecomparisons between groups R and NR-M was 0.322 (p<.01), themean number of years of formal education for group R being11.30, and 10.07 for group NR-M. The R vs. NR-P comparison
-8-
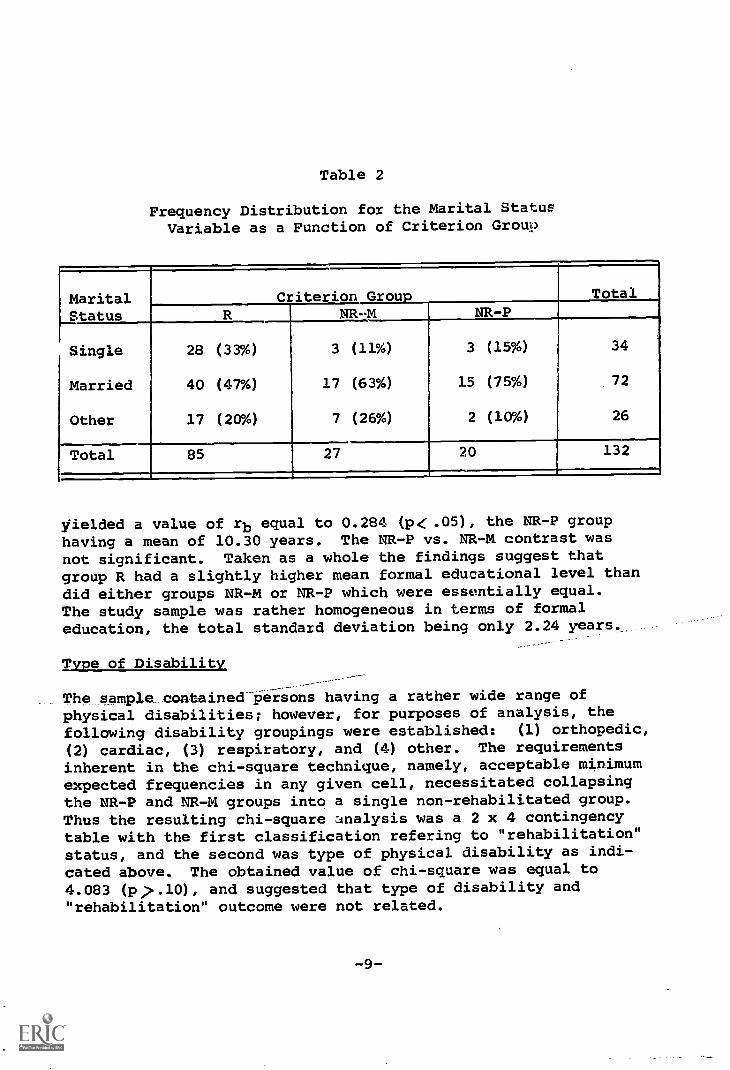
Table 2
Frequency Distribution for the Marital StatusVariable as a Function of Criterion Group
MaritalStatus
Criterion Group Total
3
17
7
NR -,M
(11%)
(63%)
(26%)
3
15
2
NR-P
(15%)
(75%)
(10%)
34
72
26
Single
Married
Other
28
40
17
(33%)
(47%)
(20%)
Total 85 27 20 132
yielded a value of rb equal to 0.284 (p<.05), the NR-P grouphaving a mean of 10.30 years. The NR-P vs. NR-M contrast was
not significant. Taken as a whole the findings suggest thatgroup R had a slightly higher mean formal educational level than
did either groups NR-M or NR-P which were essentially equal.The study sample was rather homogeneous in terms of formaleducation, the total standard deviation being only 2.24 years.
Type of Disability
The eample_contained-rsons having a rather wide range of
physical disabilities; however, for purposes of analysis, the
following disability groupings were established: (1) orthopedic,
(2) cardiac, (3) respiratory, and (4) other. The requirementsinherent in the chi-square technique, namely, acceptable minimumexpected frequencies in any given cell, necessitated collapsingthe NR-P and NR-M groups into a single non-rehabilitated group.Thus the resulting chi-square analysis was a 2 x 4 contingencytable with the first classification refering to "rehabilitation"status, and the second was type of physical disability as indi-
cated above. The obtained value of chi-square was equal to4.083 (p;>.10), and suggested that type of disability and"rehabilitation" outcome were not related.
-9-
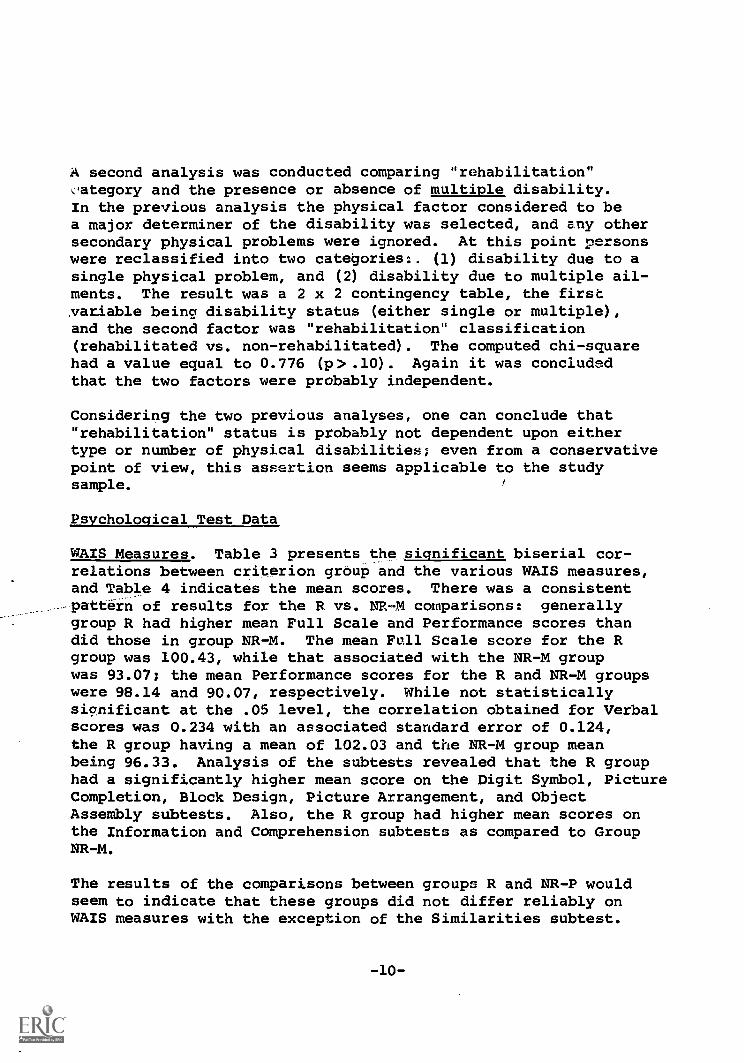
A second analysis was conducted comparing "rehabilitation"category and the presence or absence of multiple disability.In the previous analysis the physical factor considered to bea major determiner of the disability was selected, and any othersecondary physical problems were ignored. At this point personswere reclassified into two categories:. (1) disability due to asingle physical problem, and (2) disability due to multiple ail-ments. The result was a 2 x 2 contingency table, the firstvariable being disability status (either single or multiple),and the second factor was "rehabilitation" classification(rehabilitated vs. non-rehabilitated). The computed chi-squarehad a value equal to 0.776 (p> .10). Again it was concludedthat the two factors were probably independent.
Considering the two previous analyses, one can conclude that"rehabilitation" status is probably not dependent upon eithertype or number of physical disabilities; even from a conservativepoint of view, this assertion seems applicable to the studysample.
Psychological Test Data
WAIS Measures. Table 3 presents the significant biserial cor-relations between criterion group and the various WAIS measures,and Table 4 indicates the mean scores. There was a consistentpattern of results for the R vs. NR-M comparisons: generallygroup R had higher mean Full Scale and Performance scores thandid those in group NR-M. The mean Full Scale score for the Rgroup was 100.43, while that associated with the NR-M groupwas 93.07; the mean Performance scores for the R and NR-M groupswere 98.14 and 90.07, respectively. While not statisticallysignificant at the .05 level, the correlation obtained for Verbalscores was 0.234 with an associated standard error of 0.124,the R group having a mean of 102.03 and the NR-M group meanbeing 96.33. Analysis of the subtests revealed that the R grouphad a significantly higher mean score on the Digit Symbol, PictureCompletion, Block Design, Picture Arrangement, and ObjectAssembly subtests. Also, the R group had higher mean scores onthe Information and Comprehension subtests as compared to GroupNR-M.
The results of the comparisons between groups R and NR-P wouldseem to indicate that these groups did not differ reliably onWAIS measures with the exception of the Similarities subtest.
-10-
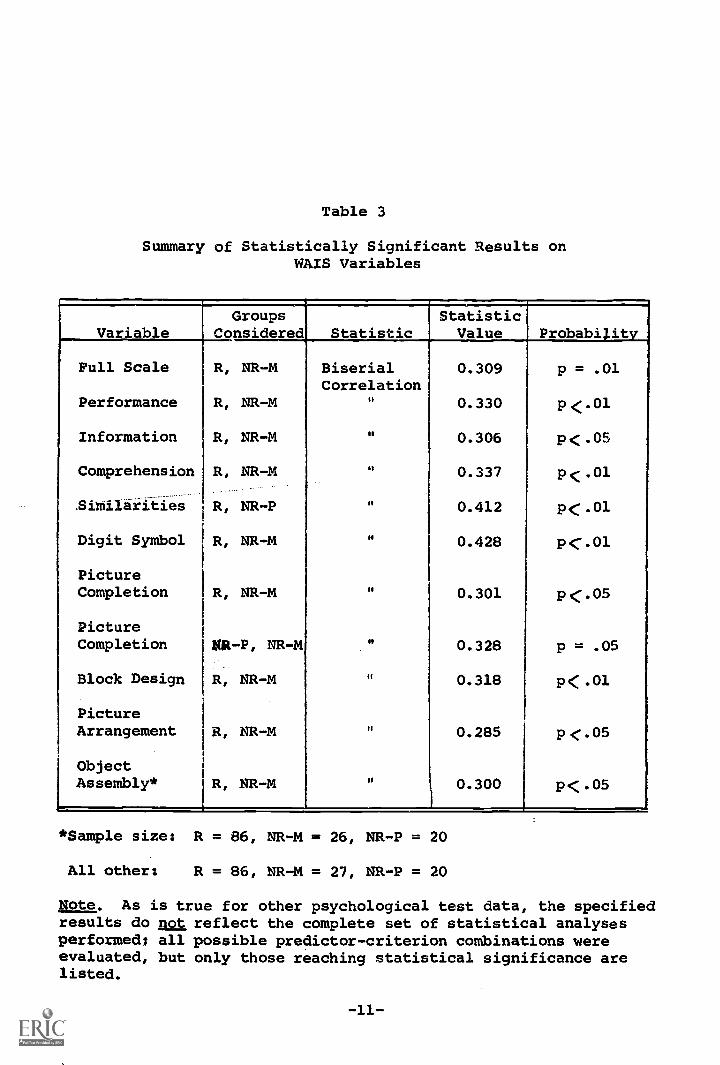
Table 3
Summary of Statistically Significant Results onWAIS Variables
Groups StatisticVariable Considered Statistic Value Probability
Full Scale R, NR-M Biserial 0.309 p = .01Correlation
Performance R, NR-M li 0.330 p4(.01
Information R, NR-M ii, 0.306 p<z.05
Comprehension R, NR-M n 0.337 p(.01
.Similarities
Digit Symbol
R, NR-P
R, NR-M
,, 0.412
0.428
p<:.01
P<;.01
PictureCompletion R, NR-M i, 0.301 p<.05
PictureCompletion NR-P, NR-M it 0.328 p = .05
Block Design R, NR-M ,, 0.318 p<C.01
PictureArrangement R, NR-M II 0.285 p4;.05
ObjectAssembly* R, NR-M ,, 0.300 p< .05
*Sample size: R = 86, NR-M = 26, NR-P = 20
All other: R = 86, NR-M = 27, NR-P = 20
Note. As is true for other psychological test data, the specifiedresults do not reflect the complete set of statistical analysesperformed; all possible predictor-criterion combinations wereevaluated, but only those reaching statistical significance arelisted.

Table 4
Mean Scores for WAIS Variables
Criterion GroupNR-M Nit -PVariable R
I
Full Scale 100.43 93.07 ,96.30
Performance 98.14 90.07 97.15
Verbal 102.03 96.33 95.90
Information 10.27 8.93_ -4----9-;a0-- -Comprehension 11.71 9.70 10,75
Arithmetic 9.74 9.19 8.70
Similarities 9.98 9.07 8.00
Digit Span* 8.96 8.78 7.95
Vocabulary** 10.26 9.27 9.70
Digit Symbol 8.08 6.33 7.20
Picture Completion 8.87 7.41 8.85
Block Design 9.16 7.70 8.80
Picture Arrangement 8.88 7.59 8.65
Object Assembly*** 8.70 7.38 9.10
* Sample Size: R = 85, NR-M = 27, NR-P = 20** Sample Size: R = 85, NR-M = 26, NR-P = 20*** Sample Size: R = 86, NR-M = 26, NR-P = 20
All Other: R = 86, NR-M = 27, NR-P = 20
-12-

Comparisons of the NR-P and NR-M data suggest that WAIS measuresdid not differentiate these two groups. However, it should benoted that the value of rb for the Performance score wts equalto 0.318 with an associated standard error of 0.169, hence justfalling short of the .05 level. In connection with this state-ment is the fact that the total sample size for the NR-P vs.NR-M comparisons was 47, a number about one-half as large asthat for the other two possible criterion comparisons. Witha total sample size as small as this, it is to be expected thatthe magnitude of the standard error will be elevated and givena descriptive interpretation, the conclusion that the NR-P vs.NR-M comparison for the Performance scale is sizeable for thestudy sample, is certainly warranted. The only other signi-ficant result was that__ or -the Picture Completion subtest
___Arb-=-0:328f) means for NR-M and NR-P were 7.41 and 8.85,respectively.
MMPI Measures. Tables 5 and 6 portray statistical comparisonsand mean T-scores, respectively. The obtained biserial correla-tions suggest that the R group (mean = 63.14) was lower on theDepression scale than either the NR-M group (mean = 69.52) orthe NR-P group (mean = 68.68). Analysis of the Barron EgoStrength (Es) subtest revealed an opposite trend: the meansfor the R, NR-M, and NR-P groups were 50.40, 46.27, and 43.61,respectively. The obtained biserial correlations for the Esscale that reached statistical significance (p4:.05) were thosefor the NR-M vs. R comparison (rb = 0.285), and NR-P vs. R(rb = 0.407). The NR-P vs. NR-M comparison was not significant.Finally, the Hypochondriasis scale seemed to differentiate theR group and the NR-P group. The mean score for the R categorywas 62.04, and that for the NR-P category was 65.53. Analysisof the Masculinity-Femininity scale indicated that the meansassociated with the NR-P and NR-M groups were 53.26 and 59.30,respectively, with a significant rb of -0.399 (p<;.05). Thelatter finding should be interpreted cautiously since data formales and females were combined.
The number of clinical scales exceeding a T-score of 70 maybe considered an indicator of gross pathology. A grand medianwas computed for the entire sample (1> Mdn>0), followed byconstruction of a contingency table which showed the numberof persons above and below the grand median as 1 function ofcriterion group membership (see Table 7). The value of chi-square for this analysis was 5.719 (.10,p7 .05). The related
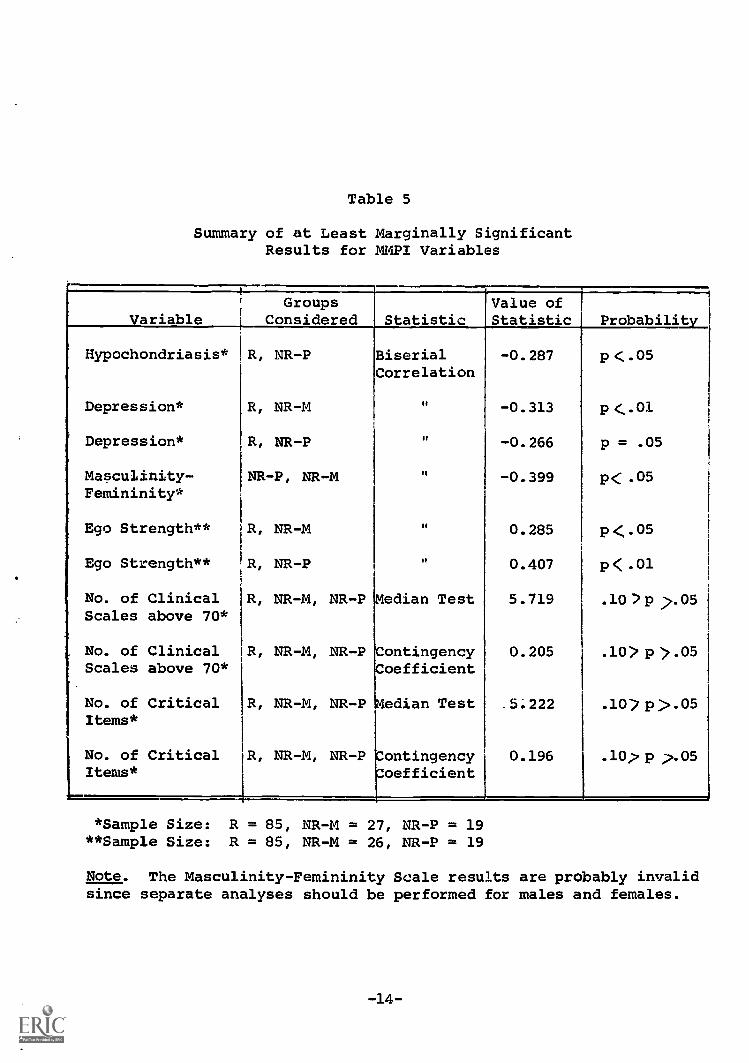
Table 5
Summary of at Least Marginally SignificantResults for NVIPI Variables
VariableGroups
Considered StatisticValue ofStatistic Probabilit
Hypochondriasis* R, NR-P Biserial -0.287 p (.05Correlation
Depression* R, NR-M 11 -0.313 p<.01
Depression* R, NR-P 11 -0.266 p = .05
Masculinity- NR-P, NR-M 11 -0.399 p<.05Femininity*
Ego Strength** R, NR-M 11 0.285 p<.05
Ego Strength** R, NR-P It 0.407 p< .01
No. of Clinical R, NR-M, NR-P edian Test 5.719 .10 7pScales above 70*
.>.05
No. of ClinicalScales above 70*
R, NR-M, NR-P Contingencyoefficient
0.205 .10>p).05
No. of Critical R, NR-M, NR-P edian Test .5;222 .10,?p:>.05Items*
No. of Critical R, NR-M, NR-P (Contingency 0.196 .10;, p 3,-,. 05
Items* Coefficient
*Sample Size: R = 85, NR-M = 27, NR-P = 19**Sample Size: R = 85, NR-M = 26, NR-P = 19
Note. The Masculinity-Femininity Scale results are probably invalidsince separate analyses should be performed for males and females.
-14-

Table 6
Mean T-scores for the MMPI Variables
VariableCriterion Group
R NR-M NR-P
K* 56.72 53.26 53.68
L* 54.19 52.85 54.16
F* 53.67 55.56 52.26
Hypochondriasis* 62.04 63.30 65.53
Depression* 63.14 69.52 68.68
Hysteria* 60.16 63.81 66.58
Psychopathic Deviate* 61.41 63.19 58.79
Masculinity- 55.46 59.30 53.26Femininity*
Paranoia** 53.47 53.31 52.53
Psychasthenia** 56.81 60.73 58.05
Schizophrenia** 57.31 57.92 56.16
Hypomania* 54.73 56.11 55.42
Social Introversion* 52.52 55.78 55.16
Ego Strength** 50.40 46.27 43.61
*Sample Size: R = 85, NR-M = 27, NR-P = 19**Sample Size: R = 85, NR-M = 26, NR-P = 19
-15-
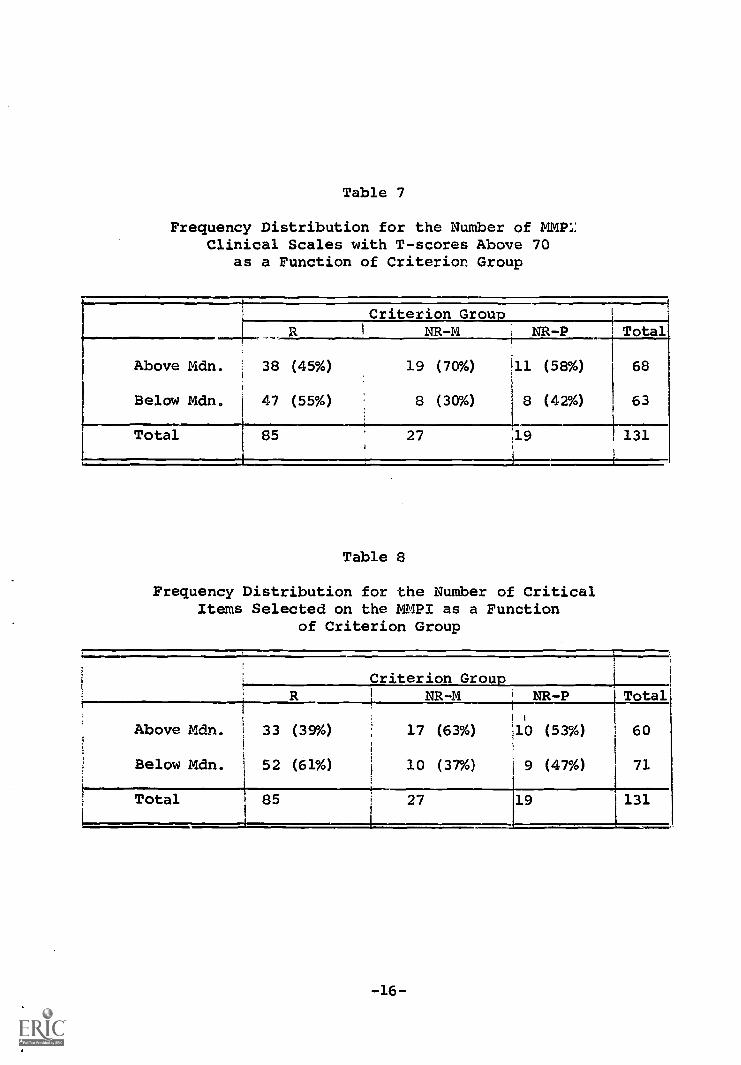
Table 7
Frequency Distribution for the Number of MMP::Clinical Scales with T-scores Above 70
as a Function of Criterion. Group
Criterion GroupR NR-M
Above Mdn.
Below Mdn.
38
47
(45%)
(55%)
19
8
(70%)
(30%)
Total 85 27
Table 8
NR-P Total(
111 (58%) 68
8 (42%) 63
19 131
Frequency Distribution for the Number of CriticalItems Selected on the MMPI as a Function
of Criterion Group
Above Mdn.
Below Mdn.
Total
Criterion GroupNR-M NR-P Total
33
i 52
(39%)
(61%)
17
10
(63%)
(37%)
10
9
(53%)
(47%)
60
71
85 27 19 131

value of the contingency coefficient was 0.205. Inspection ofcell-square contingencies indicated that the NR-M group had arelatively greater number of individuals above the grand medianthan did either the R ar NR-P group.
Another index of gross pathology consisted of the number ofcritical items selected on the MMPI. Once again a median testwas performed (2 7 Grand Mdn.;>1) on the array of observed fre-quencies shown in Table 8. The resulting value of chi-squarewas 5.222 (.10p ).05), and the contingency coefficient wasequal to 0.196. The R group was characterized by having apreponderance of cues below the midpoint, but the reverse wastrue for NR-M. Group NR-P was distributed about as expectedby chance.
Kuder Personal Preference Record Data. It can be generallystated that criterion group category was not systematicallyrelated to the usual scales of the Kuder. Two significantcorrelations did emerge, however, with regard to the Verificationscale. As can be seen in Table 9, the value of rb for the R vs.NR-M comparison was 0.568, and that for the R vs. NR -P comparisonwas 0.312. The mean scale scores for the R, NR-M, and NR-Pgroups were 40.35, 37.05, and 38.26, respectively. Such lowvalues indicate that the responses to the Kuder are of doubtfulvalidity. Nevertheless, the mean scale scores for the varioussubtests of the Kuder are shown in Table 10.
A special Kuder score (Forer, 1951, 1953) was derived for eachsubject, and was determined in three steps. First, an over-allAdjustive score was calculated for every person and was simplythe sum of scores obtained on the Outdoor, Mechanical, Computa -'tional, Scientific, and Clerical subtests. Then an over-allExpressive score was computed being the sum of scores on thePersuasive, Artistic, Literary, Musical, and Social Servicesubtests. Finally, a difference score was calculated by sub-tracting the Adjustive score from the Expressive score for everymember of the sample (difference scores were corrected byadding a constant in order to eliminate negative values). Thedifference scores were subsequently subjected to a median testwith the resulting value of chi-square being equal to 9.008(.02>p.01). The associated contingency coefficient was0.262. Examination of the contingency table indicated thatthere were a greater number of individuals above the grand
-17-
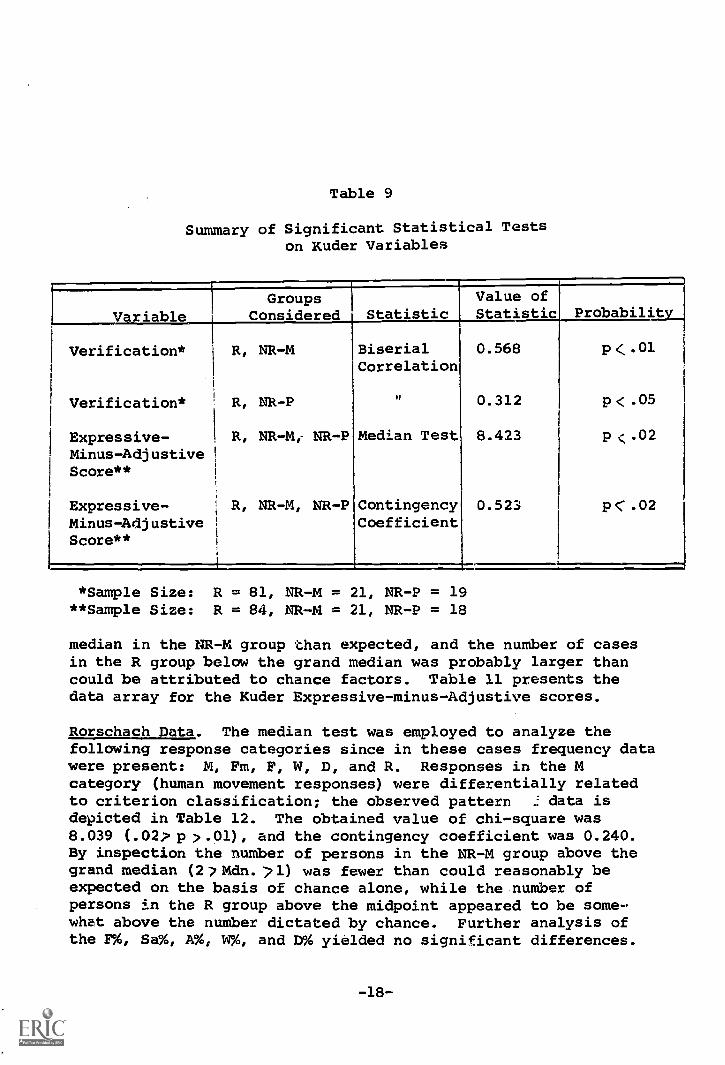
Table 9
Summary of Significant Statistical Testson Kuder Variables
VariableGroups
Considered StatisticValue ofStatistic Probability
Verification* R, NR-M Biserial 0.568 p < .01
Correlation
Verification* R, NR-P ir, 0.312 p<.05
Expressive- R, NR -M,- NR-P Median Test 8.423 p c;.02
Minus-AdjustiveScore**
Expressive- R, NR-M, NR-P Contingency 0.523 p(.02Minus-Adjustive CoefficientScore**
*Sample Size: R = 81, NR-M = 21, NR-P = 19**Sample Size: R = 84, NR -M = 21, NR-P = 18
median in the NR-M group than expected, and the number of casesin the R group below the grand median was probably larger thancould be attributed to chance factors. Table 11 presents thedata array for the Kuder Expressive-minus-Adjustive scores.
Rorschach Data. The median test was employed to analyze thefollowing response categories since in these cases frequency datawere present: M, Fm, F, W, D, and R. Responses in the Mcategory (human movement responses) were differentially relatedto criterion classification; the observed pattern ,1 data is
depicted in Table 12. The obtained value of chi-square was8.039 (.02 p x.01), and the contingency coefficient was 0.240.By inspection the number of persons in the NR-M group above thegrand median (27Mdn. ?1) was fewer than could reasonably beexpected on the basis of chance alone, while the number ofpersons in the R group above the midpoint appeared to be some-what above the number dictated by chance. Further analysis ofthe F%, Sa%, A%, W%, and D% yielded no significant differences.
-18--

Table 10
Mean Scale Scores for the Kuder
Criterion Grou.R NR-M NR-P
Verification* 40.35 37.05 38.26
Mechanical 38.30 39.52 45.74
Computation 57.74 58.62 55.89
Scientific 46.24 50.86 52.37
Persuasive 46.77 38.76 45.63
Artistic 52.04 45.76 44.84
Literary 45.44 44.43 38.00
Musical 50.59 42.86 53.79
Social Service 66.23 64.43 73.74
Clerical 54.94 62.43 55.89
Outdoor 38.13 36.71 37.00
*Sample Size: R = 81, NR-M = 21, NR-P = 19All Other: R = 82, NR-M = 21, NR-P = 19
-19-
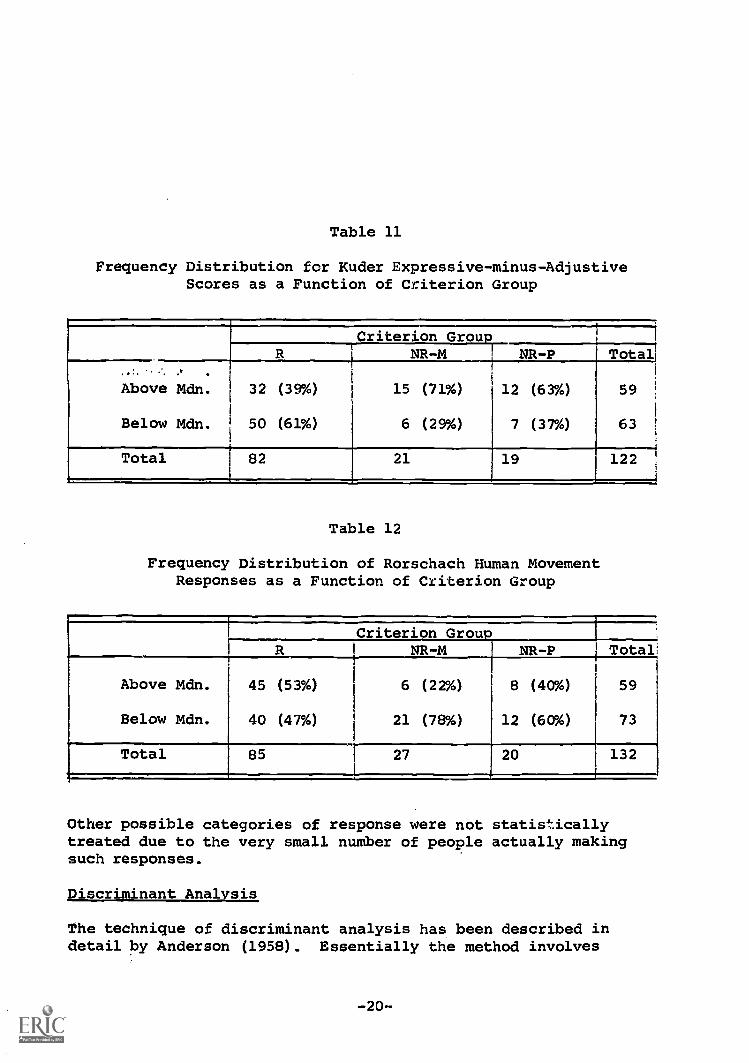
Table 11
Frequency Distribution for Kuder Expressive-minus-AdjustiveScores as a Function of Criterion Group
Criterion GrouR NR -M NR -P Total
Above Mdn.
Below Mdn.
32
50
(39%)
(61%)
15
6
(71%)
(29%)
12
7
(63%)
(37%)
59
63
Total 82 21 19 122
Table 12
Frequency Distribution of Rorschach Human MovementResponses as a Function of Criterion Group
Criterion GroupIx NR-M NR-P Total
Above Mdn.
Below Mdn.
45
40
(53%)
(47%)
6
21
(22%)
(78%)
8
12
(40%)
(60%)
59
73
Total 85 27 20 132
Other possible categories of response were not statisticallytreated due to the very small number of people actually makingsuch responses.
Discriminant Analysis
The technique of discriminant analysis has been described indetail by Anderson (1958). Essentially the method involves
-20-
computing set of linear functions for the purpose of classifyinga person into one of several groups, the assignment being madeon the basis of the largest estimated probability density.Since the rehabilitation criterion was categorical in nature,the discriminant analysis appeared to be the most suitablemultivariate procedure available.
The predictor variables selected included: Age; number of yearsof formal education; WAIS Full Scale, Verbal, and Performancescores; MMPI-K, L, F, Hs, D, Hy, Pd, Mf, Pa, Pt, Sc, Ma, Si,and Es; and Kuder Verification and Expressive-minus-Adjustivescores. Thus a total of 21 predictor indices were employed.The number of subjects in the R, NR-M, and NR-P groups forthis analysis were 81, 21, and 19, respectively (persons withtwo or more predictors missing were excluded from the analysis,while those having only one score missing were retained and thevalue was estimated from the remaining data of the criteriongroup to which the individual belonged).
The resulting coefficients listad by predicted classificationcategory are specified in Table 13, along with calculated con-stants to be addedl. Multiplying each predictor score by theassociated coefficient, and then summing the products for all21 predictor variable-coefficient combinations, yields a probabilityvalue which indicates the likelihood that a given individual isin the particular criterion group. A probability estimate isdetermined for each of the three possible criterion classifica-tions for every person; the individual is then assigned to apredicted criterion group on the basis of the largest calculatedprobability value. Table 14 compares predicted classificationfrom the discriminant function to the actutl rehabilitationclassificatio-.1. For the R group, 51 (63%) cases were assignedcorrectly; the UR-M group had 14 (67%) people identified accurately;and 11 (58%) NR-P individuals were appropriately classified.This inforvaatien provides the basis for estimating the predictivestrength which is gained by using the indicated discriminanttechnique as ce:o.pared to the condition where no such informationis available. Assuming a person wore drawn at random from a
1The discriminant analysis was performed at Western Data ProcessingCenter, University of California at Los Angeles, using an IBM 7094computer system. The authors are indebted for the assistance andcooperation received at the Center.
-21-
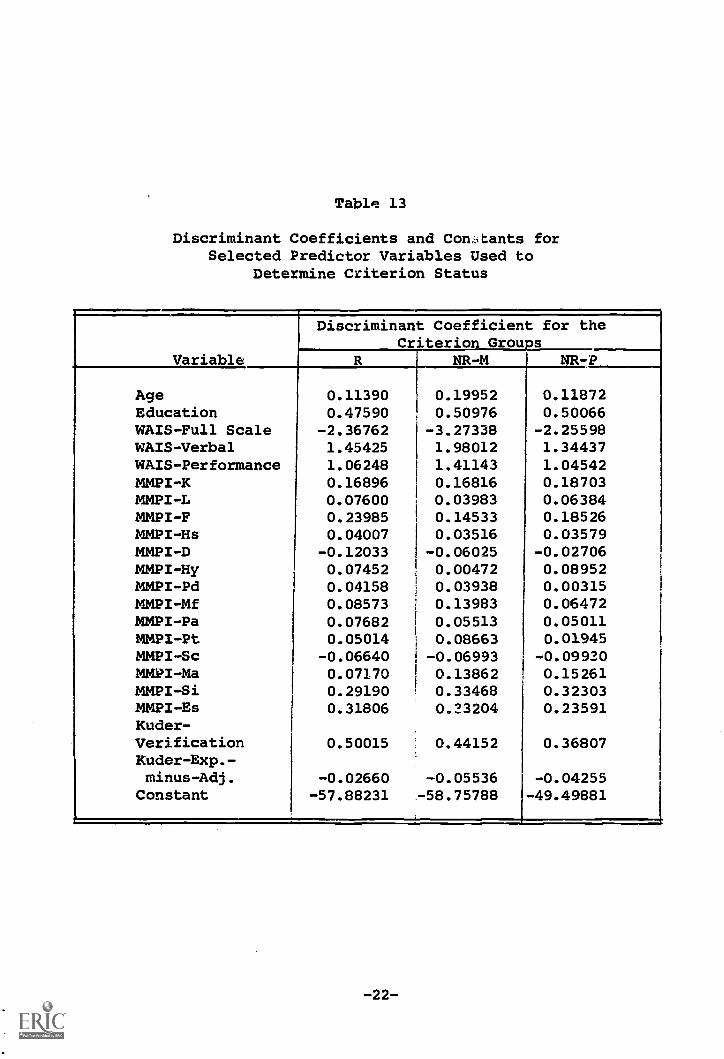
Table 13
Discriminant Coefficients and Conotants forSelected Predictor Variables Used to
Determine Criterion Status
Variable
Discriminant Coefficient for theCriterion Groups
R NR-M NR-P
Age 0.11390 0.19952 0.11872Education 0.47590 0.50976 0.50066WAIS-Full Scale -2.36762 -3.27338 -2.25598WAIS-Verbal 1.45425 1.98012 1.34437WAIS-Performance 1.06248 1.41143 1.04542MMPI-K 0.16896 0.16816 0.18703MMPI-L 0.07600 0.03983 0.06384MMPI-F 0.23985 0.14533 0.18526MMPI-Hs 0.04007 0.03516 0.03579MMPI-D -0.12033 -0.06025 -0.02706MMPI-Hy 0.07452 0.00472 0.08952MMPI-Pd 0.04158 0.03938 0.00315MMPI-Mf 0.08573 0.13983 0.06472MMPI-Pa 0.07682 0.05513 0.05011MMPI-Pt 0.05014 0.08663 0.01945MMPI-Sc -0.06640 -0.06993 - 0.0990MMPI-Ma 0.07170 0.13862 0.15261MMPI-Si 0.29190 0.33468 0.32303MMPI-Es 0.31806 0.23204 0.23591Kuder-Verification 0.50015 0.44152 0.36807Kuder-Exp.-minus-Adj. -0.02660 -0.05536 -0.04255
Constant -57.88231 -58.75788 -49.49881
-22-
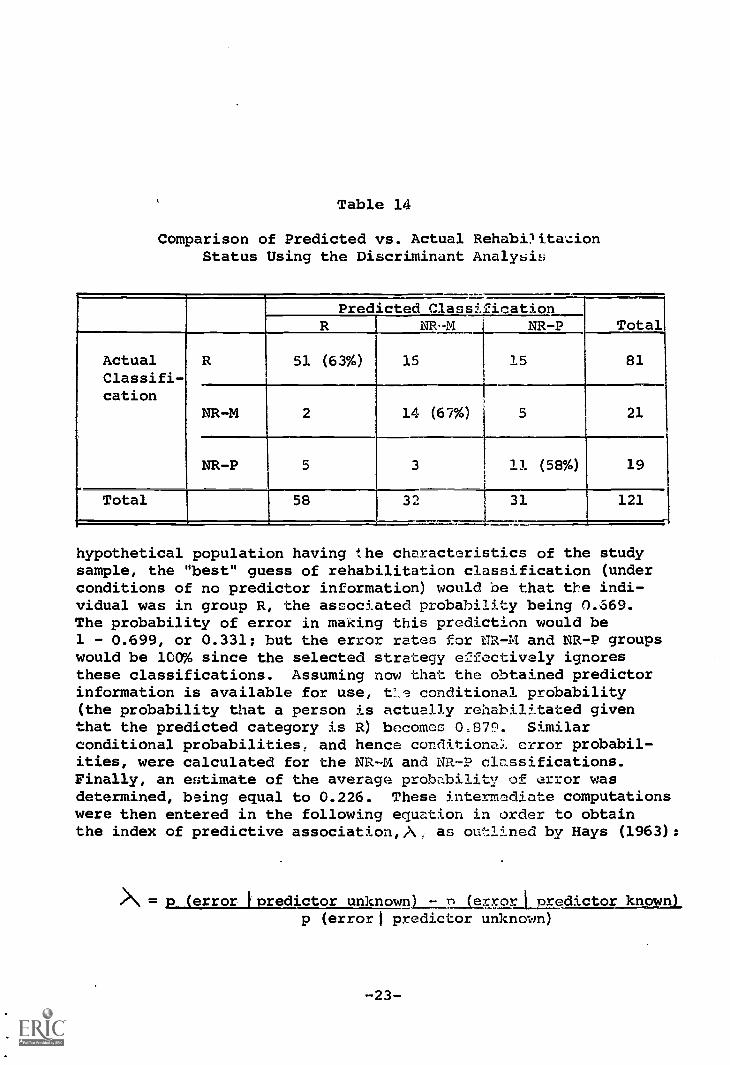
Table 14
Comparison of Predicted vs. Actual Rehabi?ita.zionStatus Using the Discriminant Analysis
Predicted ClassificationTotalR NR M NR-P
ActualClassifi-cation
R 51 (63 %) 15 15 81
NR-M 2 14 (67%) 5 21
NR-P 5 3 11 (5e%) 19
Total 58 32 31 121
hypothetical population having the characteristics of the studysample, the "best" guess of rehabilitation classification (underconditions of no predictor information) would be that the indi-vidual was in group R, the associated probability being 0.569.The probability of error in making this prediction would be1 - 0.699, or 0.331; but the error rates for ISR -M and NR-P groupswould be 100% since the selected strategy e2fectively ignoresthese classifications. Assuming now that the obtained predictorinformation is available for use, t:.s conditional probability(the probability that a person is actually rehabilitated giventhat the predicted category is R) becomes 0.879. Similarconditional probabilities, and hence conditiona:L error probabil-ities, were calculated for the NR -A'1 and NR-P classifications.Finally, an estimate of the average probability of error wasdetermined, being equal to 0.226. These intermediate computationswere then entered in the following equation in order to obtainthe index of predictive association, A; as outlined by Hays (1963):
X= p (error 'predictor unknown) - n (errormedictor known)p (error' predictor unknown)
-23-
The index shows the proportional reduction in the probabilityof error gained by specifying the predictor information. For
the obtained data,
= 0.331 - 0.226 = 0.3170.331
Thus knowing the predicted classification by using the discri-
minant function improves ability to predict the actual rehabili-tation status, the probability of error being reduced by approxi-mately 32%. The advantage of this method of evaluation residesin the fact that an estimate of predictive strength is determineddirectly rather than a simple statistical significance statementwhich often implies very little about the ability to make practi-cal predictions.
The results from the discriminant analysis should be regardedas suggestive only, in large measure due to the very small numbersof cases in the NR-M and NR-P categories. Before such a methodis used in the everyday rehabilitation setting, it is mandatorythat a cross-validation study be performed; in this way it maybe ascertained whether or not the predictor-criterion relation-ship is a stable one. As is usually the case, some shrinkagein the error reduction probability stated above should be ex-pected. With these cautions in mind it is still justifiableto conclude that the discriminant method may well be a valuableasset to the rehabilitation professional in the future when thenecessary refinements have been achieved.
DISCUSSION
The WAIS
Analysis of the Full Scale IQ, Performance IQ, and Verbal IQindicated that group NR-M had a lower mean on the first twomeasures than did group R. Verbal IQ means for groups R andNR-M were not different from a statistical point of view, despitethe fact that the NR-M mean was lower.
Inspection of the subtest means revealed two conspicuous patterns.First, while not supported by statistical evaluation, group NR-Phad consistently lower mean scores on all Verbal subtests thandid group R. In terms of Performance subtests, group NR-M means
-24-
were invariably below those for group R; such a finding is notparticularly surprising since Performance IQ's were dissimilar,but the lack of even one reversal is impressive.
Wechsler (1958) indicates that a marked discrepancy betweenVerbal and Performance IQ's in favor of the former, is commonlyfound when some form of mental disorder is present. One shouldnot immediately infer that this was the case for members ofgroup NR-M. As Wechsler goes on to say, the educational andvocational history of a person may be important factors in therelationship between the two IQ measures. Additionally, cul-tural differences could be implicated. The obtained data werealso consistent with the information presented by Nadler (1957).As will be recalled, he mentioned that a lower Performance IQmay be attributable to the physical disability per se.
There is no ready means of distinguishing between the variousalternatives specified above. Perhaps it is advisable simplyto conclude that the NR-M group did differ reliably from groupR in one aspect (Performance) of measured intellectual capacity-This inference, relatively unsophisticated as it may be, isindeed important in relation to the prediction of rehabilitationoutcome.
The MMPI
The MMPI data were quite interesting. For all three criteriongroups the neurotic triad--Hypochondriasis (Hs), Depression(D), and Hysteria (Hy)--was elevated, but particularly so forgroups NR-M and NR-P. Of three statistically reliable compari-sons within this triad, two involved the D scale, with groupsNR-M and NR-P having a higher mean T-score than was the casefor group R, and the third was the R vs. NR-P comparison onthe Hs scale (NR-P mean;>R mean). Such a configuration has beenObserved by Moos and Solomen (1964) in a group of patientssuffering from rheumatoid arthritis. In general, one wouldexpect such an elevated triad in the event of physical dis-ability accompanied by discernable organic pathology. Perhapsmore common in the literature is the "conversion-V" pattern(elevated Hs and Hy with D relatively lower). The latter has1.2en found to be associated, for example, with individualshaving low-back syndromes (Phillips, 1964), and psychogenicbackache (Hanvik, 1951).
-25-

The markedly lower mean Ego-strength (Es) scores for groupsNR-M and NR-P as compared to the mean R value, is readily inter-preted. Barron (1956) has stated that high Es scores havebeen associated with one or more of the following: personalstability, independence of judgement, an adequate sense ofreality, effectiveness in social situations, and high intelli-gence. Also, there appears to be evidence for a negativecorrelation between Es scores and the tendency to developpsychiatric symptoms. Certainly, then, the relatively lowscores achieved by groups NR-M and NR-P would not seem to beconducive to successful vocational rehabilitation.
With respect to the two measures of gross pathology (number ofclinical scales above a T-score of 70, and the number of criti-cal items checked in a pathological direction), members of groupNR-M more often responded in a less favorable way than didindividuals in both R and NR-P. If one assumes that thesemeasures are suggestive of at least some degree of psychiatricsymptom formation, then the consistency with the Es data isobvious.
When all the MMPI data are considered, it was apparent thatgroups NR-M and NR-P were very similar, with two exceptions,namely, a higher mean D and the elevated indices of grosspathology for NR-M. In a predictive sense, then, it would bedifficult to distinguish between the two non-rehabilitatedcategories. But, the differences between group R and eitherNR-M or NR-P were definitely more pronounced.
The Kuder
The nature of the mean scores on the Verification scale indicatedthat responses to the instrument were of questionable validity,especially so for groups NR-M and NR-P. Bearing in mind thenecessity for cautious interpretation, the Expressive-minus-Adjustive data are now discussed.
Refering once more to Table 11, the outstanding deviation fromchance expectation was due to the preponderance of NR-M membersabove the grand median. Stated in an alternate fashion, mostindividuals in group NR-M emphasized Expressive categoriesrather than Adjustive choices. Forer (1951, 1953) has contendedthat Kuder profiles may reflect not only occupational potentialbut can render insights into emotional adjustment. Expressive
-26-
scales are concerned with activities that allow free personalityexpression along with a minimum adherence to socially c'ictatedcriteria. An Adjustive pattern is characterized by activitiesrequiring development of skills through study and practice underrelatively formal and standard conditions. Forer, commentingupon his study of 400 disabled veterans, concluded that anemphasis on Expressive interests is indicative of maladjustment.The relevance to the data obtained for the study sample iscertainly clear: NR-M cases did tend to stress Expressivechoices and were "maladjusted" in the sense that they were notemployed or attending school full time. Although not nearlyas marked, there was a reverse trend for group R persons- -fewer had strong inclinations for Expressive preferences, andby definition, had experienced a more satisfactory vocationalstatus.
Even though not statistically significant, group NR-P had amean Social Service score of 73.74 which was higher than thecomparable means for NR-M and R. Forer (1953) argued thatthis kind of elevation in disabled groups is probably an ex-pression of interpersonal anxiety, and Newman (1955) arrivedat the same conclusion for a group of tuberculosis patients.
The Rorschach
The only measure which served to differentiate the criteriongroups was the frequency of human movement (M) responses. Itwill be recalled that group NR-M members typically were locatedbelow the grand median and there was a suggestion that theopposite was true for group R individuals. Klopfer, Ainsworth,Klopfer, and Holt (1954) state that a high number of M responsesmay be associated with: (1) a high level of ego functioning;(2) superior intellectual capacity; (3) an effective degreeof inner control and hence stability; (4) adequate self-accep-tance accompanied by a capacity for delayed gratification inthe interest of long-range goals; and (5) satisfactory empathy.Conversely, low M production could be indicative of a state ofaffairs in which functioning in non-creative activities wouldbe possible, while emotional and social adjustment are marginal.It is well to bear in mind that M incidence was not very highfor the total sample (27 grand median 1), so that inferencesare strictly relative to the present research setting. Whenconsidered in conjunction with previous data (Kuder Expressive-minus-Adjustive scores, MMPI indices of gross pathology, and
-27-

WAIS data), it would seem justifiable to predict that the typicalNR-M individual would not have an overabundance of personalresources, either intellectual or emotional, and rehabilitationpotential would be marginal at best.
Concluding Considerations
One serious problem in the present study involved the mannerin which sample size varied for the criterion groups. TheNR-M vs. R and NR-P vs. R comparisons involved a much largertotal sample than was the case for NR-M vs. NR-P contrasts.Thus one would expect the latter situation to result in signi-ficant statistical findings being relatively infrequent, allother things being equal. It would have been more reassuringhad NR-M vs. NR-P differences emerged in a greater number ofanalyses; then one would be confident that two truly distinctpopulations had been sampled. Nevertheless, the results weresufficiently definitive to conclude that the typical individualin NR-M was quite different from a representative person inNR-P.
Future investigations should consider the proposal of Ayer etal. (1966). A re-standardization of psychological tests fordisabled populations might well enhance the chances of detectingdifferential personality characteristics. The suggestion wouldappear to be applicable to settings which are like the presentstudy and involve comparisons of subgroups from a physicallydisabled universe.
The results of the discriminant analysis were encouraging, andwith additional research efforts in the future, could becomea valuable instrument for the rehabilitation counselor. Onceidentified, the potential clients with "motivational" deficitspresumably would be placed in special programs--the methods andimplementation of such techniques remain in the realm of specula-tion at the moment, however.
-28-

REFERENCES
Anderson, T.W. Introduction to multivariate statistical analysis.New York: John Wiley & Sons, 1958.
Ayer, M.J., Thoreson, R.W., & Butler, A.J. Predicting rehabili-tation success with the MMPI and demographic data. Personneland Guidance Journal, 1966, 44, 631-637.
Barron, F. Ego-strength and the management of aggression. InWelsh, G.S. & Dahlstrom, W.G. (Eds.), Basic readings on theMMPI in psychology and medicine. Minneapolis: University ofMinnesota Press, 1956, Pp. 579-585.
Ehrle, R.A. Quantification of biographical data for predictingvocational rehabilitation success. Journal of AppliedPsychology, 1964, 48, 171-174.
Forer, B.R. Personality dynamics and occupational choice.American Psychologist, 1951, 6, 378 (abstract).
Forer, B.R. Personality factors in occupational choice. Educa-tional and Ps cholo ical Measurement, 1953, 13, 361-366.
Hanvik, L.J. MMPI profiles in patients with low-back pain.Journal of Consulting Psychology, 1951, 15, 350-353.
Hays, W.L. Statistics for psychologists. New York: Holt,Rinehart, & Winston, 1963.
Klopfer, B, Ainsworth, M.D., Klopfer, W.G., & Holt, R.R.Developments in the Rorschach technique. Volume 1. Techni-ques and theory. New York: World Book, 1954.
Lowe,C.M. Prediction of posthospital work adjustment by the useof psychological tests. Journal of Counseling Psychology,1967, 14, 248-252.
Manson, M.P. Some psychologic;:il findings in the rehabilitationof amputees. Journal of Clinical Psychology, 1953, 9, 65-66.
-29-

Moos, R.H., & Solomen, G.F. MMPI response patterns in patienf:swith rheumatoid arthritis. Journal of Psychosomatic Research,1964, 8, 17-28.
Nadler, E.B. Prediction of the sheltered shop work performancewith severe physical disability. Personnel and GuidanceJournal, 1957, 36, 95-98.
Newman, J. The Kuder Preference Record and personal adjustment;a study of tuberculosis patients. Educational and Psycholo-gical Measurement, 1955, 15, 274-280.
Phillips, E.L. Some psychological characteristics associatedwith orthopaedic complaints. Current Practice in OrthopaedicSurgery, 1964, 2, 165-176.
Wechsler, D. The measurement and appraisal of adult intelligence.Baltimore: Williams & Wilkins, 1958.
-30-