DOCUMENT RESUME - files.eric.ed.gov · CMMT Analysis of Focus Passage FP3.. . 98. 4. ... passages...
345
DOCUMENT RESUME SD 071 423 811 015 697 AUTHOR Kane, Robert B.; Holz, Alan W. TITLE A Technique for Studying the O.ganization of Mathematics Text Materials.. Final Report. INSTITUTION Purdue Research Foundation, Lafayette, Ind. SPONS AGENCY National Center for Educational Research and Development (DREW /OE), Washington, D.C. Regional Research Program. BUREAU NO BR-1-E-131 PUB DATE Nov 72 GRANT OJEG5-72-0011(509) NOTE 344p. EDRS PRICE MF-40.65 HC- $13.16 _DESCRIPTORS .*Instructional. Materials; *Mathematics; Mathematics - Curriculum; *Mathematics Education; *Textbook Evaluationl.Textbook Research; Textbooks ABSTRACT The validity and the reliability of a technique for identifying and studying presentation variables in mathematics texts were investigated in this study. A category system for classifying messages in mathematics texts in terms of mathematical content and processes and in terms of mode of representation, procedures for applying this system to texts, and a method for analyzing the information collected through tbese techniques were developed. Sections of twelve textbooks ranging from grade levels four through twelve as well as six pairs of contrived passages were analyzed using these methods. Results showed that this type of analysis can be used to describe the nature of the presentation in mathematics text passages, that through these methods data are provided on variables Which statistically differentiate among textbooks, and that there were no significant differences between groups of raters using this technique to analyse the textbooks. (Author/DT)
Transcript of DOCUMENT RESUME - files.eric.ed.gov · CMMT Analysis of Focus Passage FP3.. . 98. 4. ... passages...

DOCUMENT RESUME
SD 071 423 811 015 697
AUTHOR Kane, Robert B.; Holz, Alan W.TITLE A Technique for Studying the O.ganization of
Mathematics Text Materials.. Final Report.INSTITUTION Purdue Research Foundation, Lafayette, Ind.SPONS AGENCY National Center for Educational Research and
Development (DREW /OE), Washington, D.C. RegionalResearch Program.
BUREAU NO BR-1-E-131PUB DATE Nov 72GRANT OJEG5-72-0011(509)NOTE 344p.
EDRS PRICE MF-40.65 HC- $13.16_DESCRIPTORS .*Instructional. Materials; *Mathematics; Mathematics
- Curriculum; *Mathematics Education; *TextbookEvaluationl.Textbook Research; Textbooks
ABSTRACTThe validity and the reliability of a technique for
identifying and studying presentation variables in mathematics textswere investigated in this study. A category system for classifyingmessages in mathematics texts in terms of mathematical content andprocesses and in terms of mode of representation, procedures forapplying this system to texts, and a method for analyzing theinformation collected through tbese techniques were developed.Sections of twelve textbooks ranging from grade levels four throughtwelve as well as six pairs of contrived passages were analyzed usingthese methods. Results showed that this type of analysis can be usedto describe the nature of the presentation in mathematics textpassages, that through these methods data are provided on variablesWhich statistically differentiate among textbooks, and that therewere no significant differences between groups of raters using thistechnique to analyse the textbooks. (Author/DT)

0 S OF PAR TMI% k OF "I At Tr.!DULA JP.. & %At '.IAktOff ICE Of I OLR A Fit)%
\ *. \ .
7

Final Report
Project No. 1-E-131
Grant No. OEG-S-72-0011(509)
A Technique for Studying theOrganization of Mathematics Text Materials
Robert B. Kane and Alan W. Holz
Purdue Research Foundation
Lafayette, Indiana
The research reported herein was performed pursuant to agrant with the Office of Education, U. S. Department ofHealth, Education, and Welfare. Contractors undertakingsuch projects under Government sponsorship are encouragedto express freely their professional judgment in the con-duct of the project. Points of view or opinions stated donot, therefore, necessarily represent official Office ofEducation position or policy.
U. S. DEPARTMENT OFHEALTH, EDUCATION, AND WELFARE
Office of EducationBureau of Research

LIST OF TABLES .
LIST OF FIGURES.
111
TABLE OF CONTENTS
Page
vi
ix
ABSTRACT . . . . . . . . . . . . xi
CHAPTER
I. INTRODUCTION. .
Need for the Study. .
1
1Introduction to the CMMT Technique 3Overview of the Study. 7Significance of the Study . 10
II. BACKGROUND OF THE STUDY . . 12
Approaches to Presenting Mathematics inText Form . . . 12
Descriptive and Comparative Studies ofMathematics Text. . . 15
Systematic Research of Mathematics Text. . . 18Sequence Theory . . . . . . . 18Readability Studies. . . . . 22
Methodological Techniques and Other RelatedResearch
. 26Summary . . . .
. . 29
III. DEVELOPMENT OF THE CMMT TECHNIQUE. . 30
Development of the CMMT Category System. . 32Description of the CMMT Categories . 39
Description of Dimension 1 Categories. 39Description of Dimension 2 Categories.
. 44Procedures for Using the CMMT System. . 45
Unit of Measure . . . . . 45Partitioning Passages into Messages 46Weighting Messages . . . . . 48Coding Passages . . . . . . 50General Coding Procedures. . SONotes on Using Dimension 1 Categories . . 50Notes on Using Dimension 2 Categories . . 52

iv
CHAPTER
Range of Application and the Samplingof Passages.
. . .
Description of CMMT Analysis.
ListiPg. . .. . . .
Matrices . . . .
Proportions . . . . . . .
A Method of Estimating Rater Reliability .
IV. PROCEDURES FCR THE EMPIRICAL STUDIES. . .
Page
. 53. 54. 54. 54. 60. 64
. 67
The Validity Study. . . . . . . 67Materials Stutlied .
. . 68Method of Stud'ing the Materials . . . 77The Reliability Study. . . . . . . 84Materials . . . . . . . . 85Subjects . . . .
. . 86Design of the Reliability Study. . . . . 87Method of Analyzing the Reliability Data. . 87
V. RESULTS OF THE EMPIRICAL STUDIES . . . . . 92
Results of the Validity Study . . . . . . 92Descriptive Results for the Focus Passage . 92
Focus Passage FP1. . . .. 93
Focus Passage FP3. . . .. 97
Focus Passage FPS. . . .. 101
Focus Passage FP8. . . . . 106Focus Passage FP11 . . . . . . . 109Focus Passage FP12 . . . . . . . 113
Descriptive Results for the ContrivedPassages. . . .
. 117Contrived Passages CP2a and CP2b. . . . 118Contrived Passages CP4a and CP4b. . . . 123Contrived Passages CP6a and CP6b. . . . 128Contrived Passages CP7a and CP7b. . . . 133Contrived Passages CP9a and CP9b. . . . 137Contrived Passages CP10a and CP1Ob . . . 142
Statistical Results.. 147
The Sampling Problem. .. 147
Correlational Comparisons of Passages . . 150Identifying Presentation Variables . . . . 153
Results of the Reliability Study. . . . . 158
Between-Rater Results . . . . . . . . 158Within-Rater Results
. 167Investigator Reliability . . . . . . . 175
VI. SUMMARY, CONCLUSIONS, AND DISCUSSION. . . . 176/
Summary of the Research . . . . 176Conclusions and Discussion . . . . . . 180

V
Developmental Aspects .
The Validity Study . . .
The Reliability Study .
Recommendations for Further Research.
Page
. 180
. 183. 185. 188
BIBLIOGRAPHY. . .. 191
APPENDICES
Appendix A: Rater Training Booklet . . . . 196Appendix B: Criterion Passage Booklet . . . 262Appendix C: Validity Focus Passages. . . . 275Appendix D: Contrived Passages . . . 285Appendix E: CMMT Analysis Computer Program . . 317Appendix F: Computer Program for Scott
Reliability Coefficients . . . . 321Appendix G: Computer Programs for Scoring
Criterion Passages . . 325Appendix H: Computer Programs for Determining
Criterion Ratings. . . . . 330

vi
LIST OF TABLES
Table Page
1. CMMT Proportions for Iliustrative Passage. . . 63
2. CMMT Analysis of Focus Passage FP1 . . . 93
3. CMMT Analysis of Focus Passage FP3 . . . . 98
4. CMMT Analysis of Focus Passage FP5 . . . . 102
5. CMMT Analysis of Focus Passage FP8 . . . . 106
6. CMMT Analysis of Focus Passage FP11 . . . . 110
7. CMMT Analysis of Focus Passage FP12 . . . . 114
8. CMMT Analyses of Contrived Passages CP2a andCP2b .
. . . 119
9. CMMT Analyses of Contrived Passages CP4a andCP4b . . . . . . . . 124
10. CMMT Analyses of Contrived Passages CP6a andCP6b . . 129
11. CMMT Analyses of Contrived Passages CP7a andCP7b . .
. 134
12. CMMT Analyses of Contrived Passages CP9a andCP9b . . 138
13. CMMT Analyses of Contrived Passages CP10aand CP10b. . 143
14. Correlations between Increasing Samples andEntire Experimental Sections . . . . 148
15. Number of Passages Necessary to Sample toReach and Maintain Correlations of.90 and .95 with Entire Sections . . . . . 149
16. Average Correlations of Passages withinand between Textbooks. . . 151

vii
Table Page
17. Results of A2 Tests for Comparing AverageCorrelations between Textbooks. . . . . . 152
18. Homogeneity of Variance Tests forPresentation Variables . . . . . 154
19. Analysis of Variance Tests forPresentation Variables . . . . . 156
20. Summary of Newman-Keuls Tests forPresentation Variables . . . . . . . 157
21. Internal Consistency Estimates forbetween-Rater Scores . . . . . . 159
22. Homogeneity of Variance Tests forbetween-Rater Scores . . . . . . . . 160
23. Between-Rater Analysis of Variancefor Dimension 1. . . . . . 161
24. Between-Rater Differences among Passageson Dimension 1 . . . 162
25. Between-Rater Analysis of Variancefor Dimension 2. . . . . . 163
26. Between-Rater Differences among Passageson Dimension 2 . . . . . 164
27. Between-Rater Reliability Coefficients . . . . 166
28. Internal Consistency Estimates for167.
29. Homogeneity Lf Variance Tests for168.
within-Rater Scores .
within-Rater Scores .
30. Within-Rater Analysis of Variancefor Dimension 1. . . . . . . 169
31, Within-Rater Differences among Passageson Dimension 1 . . . . . 170
32. Within-Rater Analysis of Variancefor Dimension 2. . . . . 171
33. Within-Rater Differences among Passageson Dimension 2 . . . . 172

viii.
Table Page
34. Within-Rater Reliability Coefficients. . . 174
35. Investigator Reliabilities. . . . 175

ix
LIST OF FIGURES
Figure
1. Rational for Dimension 1 CMMT Categories . .
2. Uniform Subdivision of Illustrative Passage .
Page
37
,7
3. CMMT Partition of Illustrative Passage.. 49
4. Coded Illustrative Passage. . . 51
5. CMMT List for Illustrative Passage. . . 55
6. Dimension 1 Interaction Matrix forIllustrative Passage. . . . 56
7. Dimension 2 Interaction Matrix forIllustrative Passage. . . . .
8. Between-Dimension Interaction Matrix forIllustrative Passage. . .
58
59
9. Method of Computing between-RaterReliability Estimates . . . . . 65
10. Materials Used in the Validity Study . . 78
11. Analysis of Variance Design for IdentifyingDifferences between Textbooks. . . 83
12. Experimental Procedure for the ReliabilityStudy. . . . 88
13. Analysis of Variance Design for AssessingPassage Rating Difficulty and Differencesbetween Groups. . . . . . . 89
14. Summary of Reliability Coefficients Computedfor Each Group of Experts on Each CriterionPassage . . . . . . . . . . 91

xi
ABSTRACT
In this research a technique for identifying and study-
ing presentation variables in mathematics text was developed
and investigated. These presentation variables concern the
manner in which mathematics text is communicated in printed
form. From a developmental point of view the purpose of the
research was to develop a technique of studying presentation
variables in mathematics text. From an empirical point of
view the purpose of the research was to investigate the
validity and reliability of the technique.
The developed technique has three basic components.
The first component consists of a two dimensional system of
categories, called the CMMT category system, for classifying
messages in mathematics text. Dimension 1 of the system
classifies messages in mathematics text in terms of mathe-
matical content and processes. Dimension 2 of the system
classifies messages in terms of mode of representation. The
second component of the developed technique concerns pro-
cedures for applying the category system to classify messages
in mathematics text. The third component, called CMMT
analysis, is a method of analyzing thgt information collected
1

xii
by applying the CMMT categories to mathematics passages.
CMM1 analysis utilizes a computer program to provide informa-
tion about an analyzed passage in the form of a sequential
list of messages in the passage, interaction matrices showiqg
the relationships among types of messages, and various pro-
portions reflecting the frequency with which types of mes-
sages appear. The union of the three components is called
the CMMT technique.
The purpose of the validity study was to investigate
the validity of the CMMT technique as a means of studying
presentation variables in mathematics text. Validity was
studied in a descriptive and statistical manner. Sections
of twelve textbooks ranging from grade levels four through
twelve as well as six pairs of contrived passages were sub-
mitted to CMMT analysis. The results of the validity stud;
indicate (1) CWT analysis can be used to describe the
nature of the presentation in mathematics text passages, (2)
passages sampled at random from textbook sections tend to
correlate high?: with the entire sections from which they are
sampled, (3) passages sampled from the same textbook tend to
correlate more highly than passages sampled from different
textbooks, and (4) CMMT analysis provides data on variables
which statistically differentiate among textbooks.
The purpose of the reliability study was to determine
within- and between-rater reliability estimates for subjects
using the CMMT technique. Three groups of subjects consist-
ing of mathematics education specialists, secondary

mathematics teachers, and student teachers of secondary
mathematics were trained in the use of the CMMT technique.
On two occasions these subjects coded six criterion passages.
The results of the reliability study were (1) there were no
statistical differences between groups of raters, (2) some
passages were statistically more difficult to code than
others, (3) between-rater reliability coefficients for
dimension 1 categories ranged from approximately .50 to .80
while for dimension 2 they ranged from about .75 to 1.00,
(4) within-rater reliability coefficients for dimension 1
categories 3anged from about .60 to .90 while for dimension 2
they ranged from about .75 to 1.00, and (5) investigator
reliability measured in terms of the codings of subjects
averaged .77 for dimension 1 categories and .99 for dimen-
sion 2 categories.
The conclusion which may be drawn from the validity and
reliability studies is that the CMMT technique has potential
for becoming a useful technique for investigating presenta-
tion variables in mathematics text. Future research will
have to determine if this potential will be realized.

1
CHAPTER I
INTRODUCTION
Need for the Study
A major component of mathematics instruction is neces-
sarily the instructional materials used. Usually these
materials are in the form of printed text. The past fifteen
years has seen the production of vast amounts of various
mathematical text materials produced by publicly supported
writing groups as well as by many independent authors and
publishing firms.
Aside from the actual mathematical subject matter,
. which is essentially common to all recent mathematics text-
books, different writing groups and authors hold differing
views on how mathematics should be presented. Advertisements
for new textbooks would have the reader believe that each set
of mathematics materials offers a unique (and superior)
approach to the presentation of mathematics in printed form.
While the advertising claims no doubt overemphasize the point,
casual comparisons of modern mathematics textbooks reveal
that while content seems indeed tc be similar, approaches to
presenting this content appear varied.
Unfortunately, research concerned with the investigation
of presentation variables in mathematics text is practically

2
non-existent. In fact, it is very difficult to even estab-
lish what constitutes a given approach to presenting mathe-
matics text, much less to compare various approaches. There
have been great numbers of descriptive and comparative
studies of "modern" and "traditional" approaches to mathema-
tics instruction and most of these studies include written
materials. However, these studies typically confound presen-
tation variables with content and teacher variables making
the results, when there are any, uninterpretable in terms of
presentation approaches.
There has been some research relating more specifically
to written materials than the broad descriptive and compara-
tive studies referred to above. Research has been conducted
in the sequencing of mathematical instructional materials and
work is continuing in this area (Hei'" 59). Others have
studied the relationship between reading ability and mathe-
matics text. Progress has been made toward adapting ordinary
English readability techniques for use on the language of
mathematics (Kane, 1970).
Research which effectively studies printed mathematics
materials is indeed sparse. Other than in the areas of
sequence theory and readability there appears to be no
research designed to systematically study mathematics text.
Additional significant variables in mathematics text need to
be identified and methodologies for investigating these vari-
ables need to be developed.

t3
Introduction to the CMMT Technique
In this research a technique for identifying and study-
ing presentation variables in mathematics text was developed.
These presentation variables, which concern the manner in
which authors attempt to communicate mathematics in printed
form, were investigated in terms of various content and
representational structures in mathematics text.
The structure of any object may be defined by its ele-
ments and by the interrelationships among these elements.
These interrelationships concern the sequencing or ordering
of the elements and the frequency with which the various
elements occur. When considering the presentation structure
of mathematics text, the elements may be thought of as
messages. The interrelationships among the messages deter-
mine the organization of the material.
A mathematics text passage can be thought of as consist-
ing of a series of messages. In terms of formal mathematical
content, the basic message types can be conceived of as
undefined terms, definitions, axioms, and theorems. Defini-
tions require examples and theorems require proofs. For
mathematics to be meaningful, applications are required.' To
help the student learn the mathematics, exercises and prob-
lems are usually provided. In terms of representation of
the content, the basic messages can be conceived of as con-
sisting of words, special mathematical symbols, or various
types of illustrations.

4
These considerations of mathematical content and mode
of representation along with extensive examination of exist-
ing mathematics textbooks led to the development of a two
dimensional category system for classifying messages in
mathematics text. This system of categories is given next.
Classification of Messages in Mathematics Text
(CMMT Categories)
Dimension 1: Content Mode
0. Blank Space
I1. Definition (Meaning of words and symbols.)2. Generalizations (Rules, axioms, theorems,
Reception formulas, etc.)(Exposition) 3. Specific Explanation (Concrete examples,
specific discussion.)4. General Explanation (Proofs, general
discussion.)
5. Procedural Instruction (Directions.)6. Developing Content (Questions in exposi-
tion, developmental activities, guideddiscovery exercises, etc.)
Messages 7. Understanding Developed Content (Exer-requiring cises involving routine computation,responses. practice, identification, etc.)(Exercises, 8. Applying Developed Content (Real worldproblems, problems, applications of generaliza-
etc.) tions in concrete situations, etc.)9. Analyzing and Synthesizing Developed
Content (Proving propositions, findingnew relationships, unguided discovery,etc.)
10. Other Material (Headings, non-mathemati-cal materials, etc.)

S
Dimension 2: Representation Mode
0. Blank Space
Written 1. Words2. Mathematical Symbols
Illustrations
3. Representations of Abstract Ideas (Venndiagrams, geometric diagrams, mappingpictures, etc.)
4. Graphs (Number lines, coordinate graphs,bar graphs, etc.)
S. Representations of Physical Objects ofSituations (Plans, maps, cross sec-tional drawings, photographs, etc.)
6. Non-mathematical Illustrations (Motiva-tional photographs, cartoons, etc.)
7. Combinations of Illustrations withWritten Text (Flow charts, mathemati-cal tables, tree diagrams, etc.)
The CMMT category system is applied to mathematics text
passages in much the same way that many other observation
scales are applied to the phenomena they measure. The basic
unit of measure used is one-fourth of a line of print. An
area unit is used so that quantitative aspects of the
organization of passages can be described in terms of the
space devoted to the various types of messages. To apply
the category system, a page of text is partitioned into
sections conforming to the format of the page. A category
number for each dimension of the CMMT system is recorded
for each section of this partition.
When classification of all messages in a passage is
completed the information may be analyzed in ways which
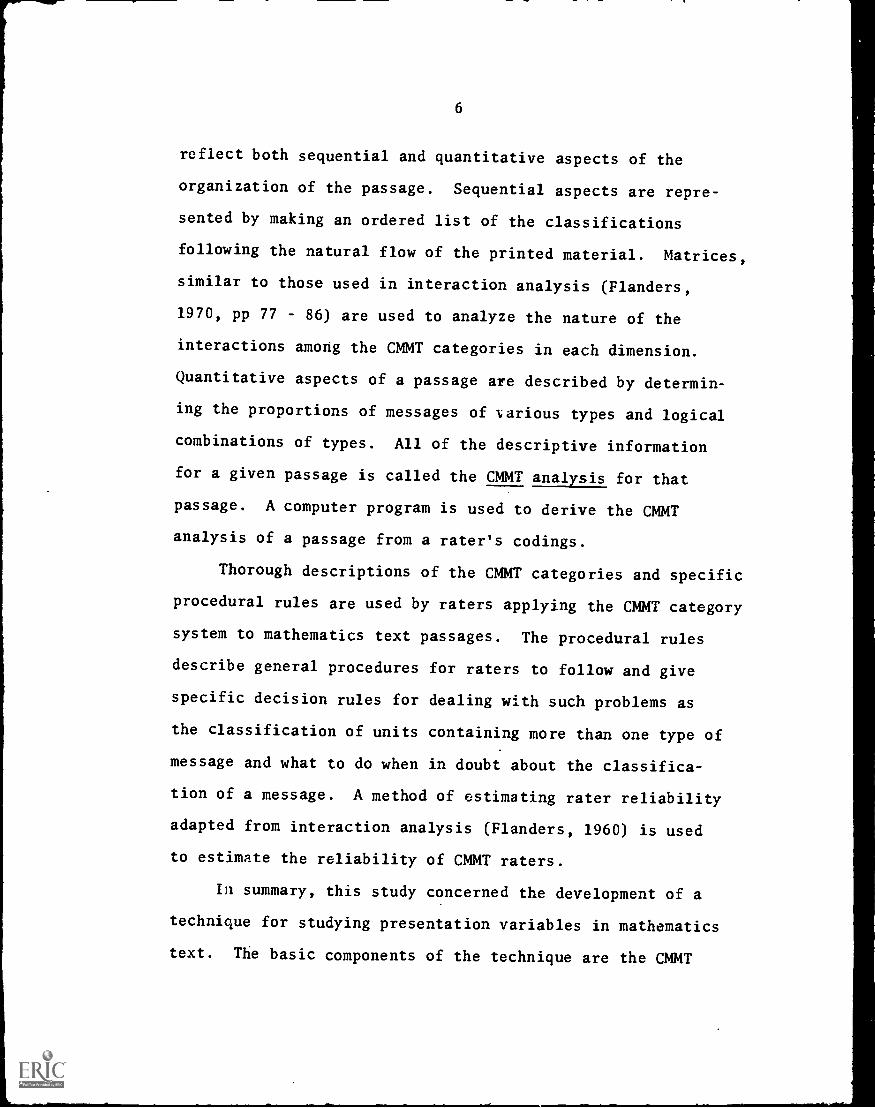
reflect both sequential and quantitative aspects of the
organization of the passage. Sequential aspects are repre-
sented by making an ordered list of the classifications
following the natural flow of the printed material. Matrices,
similar to those used in interaction analysis (Flanders,
1970, pp 77 - 86) are used to analyze the nature of the
interactions among the CMMT categories in each dimension.
Quantitative aspects of a passage are described by determin-
ing the proportions of messages of various types and logical
combinations of types. All of the descriptive information
for a given passage is called the CMMT analysis for that
passage. A computer program is used to derive the CMMT
analysis of a passage from a rater's codings.
Thorough descriptions of the CMMT categories and specific
procedural rules are used by raters applying the CMMT category
system to mathematics text passages. The procedural rules
describe general procedures for raters to follow and give
specific decision rules for dealing with such problems as
the classification of units containing more than one type of
message and what to do when in doubt about the classifica-
tion of a message. A method of estimating rater reliability
adapted from interaction analysis (Flanders, 1960) is used
to estimate the reliability of CMMT raters.
In summary, this study concerned the development of a
technique for studying presentation variables in mathematics
text. The basic components of the technique are the CMMT

7
category system, the procedures for using the CMMT categories,
and CMMT analysis. The union of these components is called
the CMMT technique.
Overview of the Study
This study had purposes which were both developmental
and empirically oriented. From a developmental point of
view, the purpose of the study ws.s to develop and refine the
CMMT technique. From an empirical research point of view,
the purpose of the study was to investigate the reliability
and validity of the CMMT technique as a measurement instru-
ment.
The development of the CMMT technique was an evolution-
ary process. The germinal idea was developed from classroom
interaction analysis studied by Flanders (1973), Amidon
(1967) and others. The idea was to use a technique similar
to interaction analysis to study mathematics text. The
first step in the development of such a technique was to
examine existing mathematics textbooks and to begin forming
a classification system. Successive tentative category
systems were developed, tried out on mathematics textbooks,
submitted to critical discussion, and revised. As the
category system was being developed a theoretical rationale
for the choice of the categories also began to evolve. Thus,
the final form of the CMMT category system was based on both
practical experience and theoretical considerations.

8
Procedures for using the system to code text materials
were also developed. Procedural matters which were dealt
with included the choice of the unit of observation,
decision rules, sampling procedure, and the scope or range
of application. 'Sim1 ultaneous with the development of the
CMMT category system and procedures, the method of CMMT
analysis and a method of estimating rater reliability were
developed. Computer programs were written for deriving the
CMMT analysis of a passage from a rater's codings and for
determining rater reliability estimates. Chapter 3 is
devoted to a detailed discussion of the development of the
CMMT technique.
The specific purposes of the empirical part of the
study were:
1. To investigate the validity of the CMMT technique
as a means of studying the organization of
mathematics text.
2. To investigate the reliability of raters trained
in the use of the CMMT technique.
To carry out these purposes, twelve textbooks ranging
from grade four through grade twelve were studied. A total
of 99 passages from the twelve textbooks plus twelve con-
trived passages were submitted to CMMT analysis in the
validity portion of the study. Certain focus passages were
used to demonstrate that CMMT analysis can be used to
describe the organization of mathematics text. The contrived

9
passages, which were written in pairs following opposing
organizational plans, were used to show that CMMT analysis
reflected these plans. Successive correlations were made
between entire sections of the textbooks and increasing
samples of passages chosen randomly from these sections
using data from the CMMT analyses. These correlations were
used to determine what constituted an adequate sample of
passages from the textbooks. Passages within textbooks were
also correlated using data from the CMMT analyses. These
correlations were compared to correlatioris between passages
from different textbooks to determine if passages within
',:extbooks correlated more highly than passages between text-
books. Finally, an analysis of variance model was used to
identify differences between the twelve textbooks on a
number of CMMT organizational variables.
Three groups of subjects including university seniors
studying to become secondary mathematics teachers, practicing
secondary mathematics teachers, and professional mathematics
education experts were used to study rater reliability. The
subjects in each group studied a training booklet to learn
the CMMT technique and then rated six criterion passages on
two occasions separated by a minimum four week period of
time. Repeated measures analyses of variance were performed
to determine if within- and between-rater differences existed
between the groups of subjects and to determine if differ-
ences existed in the rating difficulty of the criterion

10
passages. Within- and between-rater reliability coefficients
were determined for the subjects in each group who obtained
proficiency in the application of the CMMT technique. Chap-
ters 4 and 5 are devoted to a discussion of the reliability
and validity studies.
Significance of the Study
The CMMT technique has import for both practical appli-
cation and research. Since CMMT analysis provides a means
of describing the presentation of mathematics text in a
specific concrete manner, it could be used to provide valu-
able information about existing textbook materials. Pub-
lishers may wish to use CMMT analysis to help describe the
nature of their textbooks. Authors and editors of mathe-
matics textbooks may wish to use CMMT analysis to assist
them in the writing and revision of text material. Textbook
selection committees may wish to use CMMT analysis to help
them gain more information about the textbooks they are
considering. CMMT analysis could be utilized in mathematics
teacher education programs as an aid in the study of mathe-
matics materials. Thus, CMMT analysis could become a valu-
able practical tool for helping publishers, authors, text-
book selection committees, and students of mathematics
education gather information about mathematics instructional
materials.
From a research point of view, the CMMT technique
offers a way of manipulating and controlling variables in

11
comparative studies of written mathematics text materials.
Researchers could contrive materials which systematically
vary on a number of CMMT organizational variables. The
relationships between these variables and learner outcomes
could then be investigated. Since the CMMT technique can
be applied to any mathematics text materials, it is possible
that results of completed comparative studies could be more
meaningfully interpreted by submitting the materials used in
these studies to CMMT analysis. Researchers may wish to use
CMMT analysis to search for organizational differences among
existing mathematics textbooks. Thus, CMMT analysis could
prove useful in research for both identifying and systema-
tically studying organizational variables in mathematics
text.

12
CHAPTER II
BACKGROUND OF THE STUDY
The first thrust of the revolution that swept mathematics
education in the post-Sputnik era had to do with changing the
content of school mathematics. A comparison of the tables of
contents of textbooks used today with those used in the 1950's
reveals the success of this part of the revolution.
A second thrust of the school mathematics revolution
dealt with how mathematics should be presented to students.
Romberg (1969) states that while there is now considerable
agreement about what mathematics should be taught there is
not agreement about how it should be taught. Clearly, how
mathematics should be taught is closely related to how it
should be presented to students in written form. This chapter
discusses presentation approaches employed by authors of
mathematics textbooks, research on mathematics text'which has
been carried out, and research methodologies related to those
used in this study.
Approaches to Presenting Mathematics in Text Form
Different writing groups and authors hold differing
views on how mathematics should be presented in written form.
Beberman (1958) described the presentation approach utilized

13
by the University of Illincis Committee on School Mathematics
(UICSM). This approach which has come to be known loosely
as "guided discovery" used problems and exercises to develop
concepts and skills. The UICSM approach was based on the
belief that the student will come to understcnd mathematics
if he plays an active part in developing mathematical ideas
and procedures. According to Beberman, UICSM materials
stressed precision in the use of mathematical language with
the final verbalization of concepts being delayed until after
the student has worked with the concepts and come to under-
stand them.
Wooten (1965) described the more traditional expository
presentation approach taken in materials written by the School
Mathematics Study Group (SMSG). Typically SMSG materials
consisted of an exposition of a mathematical concept followed
by exercises and problems over the developed content. Interest-
ing applications and extensions of the developed content were
included periodically as problems; however, subsequent content
development was not usually dependent on these problems.
Like UICSM materials, SMSG materials stressed the precise
use of mathematical language but no attempt was made to pro-
vide extensive experience with concepts before verbalization.
The differences of presentation exemplified by UICSM and
SMSG materials are typical of the types of differences in
presentation which can he found in other mathematics text
materials. An examination of existing mathematics textbooks

1
14
reveals a number of apparent presentation variables in
mathematics text. These apparent variables include quanti-
tative variables such as the amounts of verbal material,
symbolic material, illustrative material, blank space,
expository material, exercises, problems, etc. They also
include sequential variables such as the degree of integra-
tion of exercises with exposition, the placement of illus-
trations, the order of presentation of examples and general-
izations, etc. Finally, these variables include certain
qualitative variables such as the levels of abstraction,
concreteness, generality, application, etc.
The advertisements of textbook publishers also indicate
the existence of a number of approaches to the presentation
of mathematics in text form. The advertisements claim that
various books utilize the discovery approach, the manipulative
approach, the structural approach, the axiomatic approach,
the informal approach, the inductive approach, the workbook
approach, the application approach, the spiral approach, the
programed text anproach, etc. While it is not always clear
exactly what all of these terms mean, the advertisements
support the contention that there are a variety of approaches
to presenting mathematics in printed form.
In summary, there are apparent identifiable presentation
variables in mathematics text. Some of these variables have
been describes by authors su;h as Beberman and Wooten.
Others can be inferred from the examination of existing

15
textbooks and from advertisements for new mathematics text-
books. Unfortunately, research relating specifically to
presentation variables in mathematics text is practically
nonexistent. There has been some research relating to
other specific variables in mathematics text and to mathe-
matics text in general. This research is discussed in the
following sections.
Descriptive and Comparative Studies of Mathematics Text
Romberg (1969) reviewing current research in mathematics
education reported little research specifically concerned
with mathematics text. He reported a number of descriptive
studies related to the effectiveness of instructional pro-
grams and many of these studies included written materials.
However, the main emphasis of these studies appeared to
concern the mathematical content i.e., could a certain topic
be taught to a given group of students. No control or com-
parison groups were present in these studies and instructional
variables other than written text were present to confound any
results. Hence, these descriptive studies only remotely
relate to the study of mathematics text and no generalizations
about variables in mathematics text can be made from them.
Romberg (1969) also reported that numerous studies have
been conducted comparing "modern" and "conventional" mathe-
matics instruction and most of these studies included written
materials. However, he found it difficult to make any
generalizations about the effectiveness of written materials
I

16
from these studies. Most of the studies were small "one
shot" affairs in which no significant differences were found.
When differences were found it was usually not clear how
treatments actually differed and confounding variables such
as teacher influence and between student interactions were
usually present. Thus, the results of these comparative
studies were uninterpretable in terms of the learning mate-
rials used.
Kieren (1969) reviewed the research in discovery learn-
ing in mathematics and found that published research in the
area was large in volume and generally poor in quality.
There have been a great number of studies comparing "dis-
covery" and "traditional" approaches to mathematics teaching
which have utilized written materials. Kieren noted, how-
ever, that each researcher seemed to have a different con-
ception of what constituted a "discovery" and a "traditional"
treatment. In addition to this lack of operational defini-
tion of treatments, he suggested that discovery research
generally suffers from a bias of having the development
effort expanded on the discovery treatment. Hence, it is
very difficult to make many conclusions about mathematics
text from the research reported in Kieren's review.
By far the most comprehensive study comparing mathe-
matical text materials is the National Longitudinal Study
of Mathematical Abilities carried out by the research group
of the School Mathematics Study Group (Wilson, et al., 1969).

17
In that study the relative effects of a number of mathemat-
ics textbook series were studied over a period of several
years. A vast amount of data concerning achievement and
attitude was collected and submitted to intense and sophisti-
cated analysis. While the study avoided many of the problems
inherent in smaller comparative studies the results do not
shed much light on the question of what constitute effective
approaches to presenting mathematics in written form.
Apparently, all that can be said about written materials
from the results of the study is that book A appeared to be
superior to book B in some aspect of student achievement or
attitude. It is impossible to identify what variables made
the approach of book A superior to that of book B.
Thus, in the past there have been great numbers of
descriptive and comparative studies involving mathematics
text. These studies have ranged from small "one shot"
studies to the extensive National Longitudinal Study of
Mathematical Abilities. A search of research since the time
of Romberg's and Kieren's reviews in 1969 reveals that little
has changed. Descriptive and comparative studies involving
mathematics text continue to be done. The recent studies
appear to suffer from the same deficiencies described by
Romberg and Kieren and the differences, when there are any,
do little to identify specific meaningful variables in
mathematics text.
Both Romberg and Kieren in their reviews infer a need
for long range systematic research of mathematics text.
A

18
Important variables in mathematics text need to be identi-
fied and methodologies for studying them need to be developed.
Descriptive and comparative studies involving mathematics
text have done little to meet this need. Fortunately, there
has been some research relating more specifically to mathe-
matics text than these broad types of studies. This research
is discussed in the next section.
Systematic Research of Mathematics Text
Two areas where some systematic research of mathematics
text has been carried out are the areas of sequence theory
and the readability of the language of mathematics. These
areas of research will now be discussed in turn.
Sequence Theory
Heimer (1969) described the research and development
efforts toward producing an adequate sequence theory in
mathematics instruction. He defined instructional sequence
to mean the order in which the learner interacts with the
units of content. Heimer claimed that every effort to
construct mathematical materials demands decisions about
structuring the content and designing and ordering instruc-
tional tasks. Thus, sequence theory has important implica-
tions for the study of variables in mathematics text.
A major theoretical formulation of sequence theory
which has implications for the sequencing of mathematics
text concerns Gagne's learning hierarchies. According to

19
Gagne (1968) a subject may be organized into hierarchical
structure with a terminal task at the top and prerequisite
tasks below. To learn the subject a learner starts at the
bottom of the hierarchy and works his way up through the
prerequisite tasks to reach the terminal task at the top.
This theoretical formulation has been particularly appealing
for the design of sequences in mathematics text since mathe-
matics has a logical structure which is hierarchical in
nature.
Heimer (1969) claimed that a critical analysis of the
nature and role of learning hierarchies gives rise to a
number of issues which need exploring. These include:
1. How is a learning hierarchy constructed?
2. How is the validity of a learning hierarchy to be
determined?
3. What is the relationship between an hypothesized
learning hierarchy and the associated presentation
sequence for instruction?
4. What is the connection between the logical structure
of the content and the associated learning hierarchy?
Heimer in his review indicates that a number of studies
(e.g., Gagne & Paradise, 1961; Gagne, 1962; Gagne et al.,
1962; Merrill, 1965; and Briggs, 1968) have explored these
questions and he called for continued systematic research in
the area. Such studies have obvious implications for the
design of sequences in mathematics text.

20
The position of Ausubel (1963) on learning hierarchies
and sequencing is not unlike Gagne's. Ausubel claims that
most tasks can be analyzed into a hierarchy of learning
units. He stated that the sequential organization of subject
matter can be useful with each new increment of knowledge
serving as an anchor for subsequent learning. Ausubel's
conceptualization of advance organizers, which appear to
consist of general non-technical overviews or outlines of
the content to be learned, also has implications to the
construction of sequences in mathematics text. Several
studies by Ausubel and others (e.g., Merrill & Stolurow,
1965; Ausubel, Robbins & Blake, 1957; Woodward, 1966; and
Scandura & Wells, 1967) concerning advance organizers have
been conducted, but the results are inconclusive. A major
problem with these studies seems to be that no generally
accepted operational definition of advance organizers has
been established.
Suppes (1967) has been another contributor to the theory
of sequencing in mathematics instruction. Suppes subscribes
to the idea of the importance of content structure in the
study of learning sequences. He has theorized about the
connection that exists between the psychological processes
of acquisition and the logical structure of mathematical
concepts. He has made only a few tentative hypotheses
regarding this and systematic long-range research is needed
in the area. 7ae implications such research would have for
the design of mathematics text are clearly important.

21
There have been many studies concerning sequence theory
other than those closely related to the theories of Gagne,
Ausubel, and Suppes. Some researchers (e.g., Roe, Case, &
Roe, 1962; Roe, 1962; Payne, Krathwohl & Gordon, 1967; and
Pyatte, 1969) have studied the effects of "logically ordered"
versus "scrambled" sequences in programed text, but the over-
all results have been inconclusive. Heimer (1969) indicated
that the effect of scrambling may be dependent of the size
of the learning unit which was scrambled, on the logical
interrelatedness of the content being presented, and on the
validity of the order of the "logical" sequence which was
scrambled. Heimer questioned the purpose of studies of
scrambled order sequences and inferred that the results of
such studies add little to the knowledge of how to construct
effective sequences.
A number of studies reported in Heimer's review concerned
the evaluation and/or contrasting of sequence strategies in
mathematics materials. These studies involved the tree-graph
structuring of content into concepts and subconcepts (Newton
and Hickey, 1965), the effect of structurally related classes
of previous learning on problem solving (Scandura; 1966a,
1966b, 1966c), multiple concept versus single concept
sequences (Short and Haughey, 1967), and variables of repeti-
tion and spaced review (Reynolds et al., 1964). Hickey and
Newton (1964) also set forth a set of eight hypotheses for
the study of structure and sequence.

.
22
In concluding his review of the research in sequence
theory, Heimer stated that knowledge about the construction
of efficient instructional sequences in mathematics materials
was desperately sparse. He indicated that while a number of
researchers are working in the area there is a need for
systematic long-range programs of research of the sequencing
of instructional materials in mathematics.
The research in sequence theory briefly described here
is only tangentially related to the type of presentation
variables in mathematics text investigated in this study.
Hence, the research in sequence theory was not reviewed in
depth. An area of research more closely related to this
study is the area of the readability of mathematical language
discussed in the next section.
Readability Studies
Readability formulas have been widely used to assess
the ease with which written material can be comprehended by
readers. A readability formula is a prediction equation.
The predictor variables typically include such variables as
average sentence length, the number of difficult words
according to some standardized vocabulary list, the number
of personal pronouns, and others. These predictor variables
depend only on the reading materials and not on the reader.
The criterion measure, on which a readability formula is
validated, is some measure of the comprehensibility of the
material such as readers' comprehension test scores, expert
judgement, or other validated readability formulas.

23
Thus, a readability formula can be applied to written
text independent of the reader to assess the readability of
the material. Care should be taken, however, when applying
readability formulas to written material. Any measurement
instrument is valid for a given purpose, for specific sub-
jects, and specific content. Therefore, a given readability
formula should only be applied to measure the readability of
material similar to the material which was used in its
validation and for subjects comparable to the subjects on
which it was validated.
Most readability formulas were validated using materials
of a general reading nature. Kane (1968, 1970) described
some of the differences between ordinary English and mathe-
matical English. For example, he pointed out that mathemati-
cal English has a specialized vocabulary and contains special
symbols not found in ordinary English. He discussed the
inappropriateness of applying existing readability formulas
to mathematical writing. Chall (1958, p. 125) noted that
it is questionable whether existing readability formulas
are valid for estimating reading difficult. of mathematics
textbooks.
Nevertheless, a number of researchers (Heddens & Smith,
1964a, 1964b; Wiegand, 1967; Smith, 1969; Cramer & Dorsey,
1969) have used standard readability formulas in an attempt
to measure the readability of mathematics textbooks. In
these studies mathematical words were usually classified as

24.
difficult words and mathematical symbols were ignored in
applying the formulas. For reasons described above the
results of these studies are highly suspect.
A few researchers have made progress toward adapting
regular readability techniques to the language of mathematics.
The cloze procedure has been used by researchers as a measureof the readability of ordinary English. Cloze tests are con-
structed by deleting words or symbols from passages and
replacing them with blanks which subjects attempt to fill-in
with the correct word. Hater (1969) validated the cloze
procedure as a measure of reading comprehension on the
language of mathematics at grade levels 7 through 10.
Most readability formulas utilize some measure of
vocabulary difficulty. Because of the specialized nature
of mathematical vocabulary and mathematical symbolism, word
familiarity lists constructed for ordinary English are
inadequate for measuring the familiarity of mathematical
language. Byrne (1970) established a measure of the famili-
arity of mathematical terms and symbols to seventh and
eighth grade students in the United States.
Building on Hater's and Byrne's research Kane, Hater,
and Byrne (1970) constructed a readability formula for the
language of mathematics. This formula predicts mean cloze
scores for seventh through tenth grade students on mathe-
matics passages. The predictor variables in this formula
were the number of mathematics words not on the list of
t

25
mathematics words judged known by 80 percent of the seventh
and eighth graders in the United States and the number of
different words with three or more syllables. These vari-
ables accounted for 60 percent of the variation in mean
cloze scores for the criterion passages. These researchers
are continuing work toward the construction of a second
formula based on a broader sample of materials than the
initial formula.
Kulm (1971) studied the readability of elementary algebra
textbooks. He used multiple regression analysis with criterion
measures of mean cloze scores to search for predictors of
readability. He found that the percentage of mathematical
symbols, the percentage of mathematical vocabulary words,
average sentence length, and the percentage of questions
were the best four predictors accounting for approximately
40 percent of the variation.
While the research in the readability of the language of
mathematics is not directly related to the technique of study-
ing presentation variables in mathematics text developed in
this study, one major aspect of the readability research is
similar. Readability formulas provide a means of obtaining
specific information about mathematics text. This study
represents an extension of readability studies in the sense
that its purpose was to develop a technique for obtaining
other useful information about mathematics text. On the
other hand, the methodology of constructing prediction

26
equations is not employed in this study. Methodological
techniques and other research directly utilized in this
study are described next.
Methodological Techniques and Other Related Research
The germinal idea for the technique of investigating
presentation variables in mathematics text which was developed
in this study came from the systems of classroom interaction
analysis developed by Flanders (1970), Amidon (1967) and
others. These systems of interaction analysis utilize sets
of categories for classifying types of student and teacher
classroom behaviors. The classifications of the behavior in
classrooms are then analyzed to describe the nature of the
interaction which has taken place.
An observer utilizing an interaction analysis system
classifies the type of behavior occurring in a classroom at
time intervals of say every three seconds. The sequence of
these classifications is then listed to describe the sequence
of behaviors which occurred in the classroom. The percentage
of observations in each category or logical combinations of
categories are computed to describe the amount of time devoted
to various behaviors. Interac .ons which exist between the
classified behaviors are analyzed with the use of a matrix.
For an n category system, an n x n matrix is constructed with
the ijth entry representing the frequency with which category
i was followed by category j in the observer's sequence.
Various interactions between the classified behaviors can be

27
described in terms of the entries ih certain regions of the
matrix.
The technique of interaction analysis has led to a
great deal of fruitful research in analyzing teaching
behavior. Application of interaction analysis has been made
to problems of improving teacher behavior and to the training
of teachers. While interaction analysis research and its
applications are interesting, it is the technique of inter-
action analysis which is important to the study presented
here. The idea of this study was to develop a system of
categories for classifying material in mathematics text and
to use a technique similar to interaction analysis to
analyze the interrelationships among classifications.
The first major problem to be faced was the construction
of a category system for classifying the material in mathe-
matics text. As a theoretical starting point three estab-
lished classification systems were drawn upon. Bloom (1956)
presented a system for classifying educational objectives.
This hierarchial system is summarized below.
1. Knowledge - involves the recall of specifics,
methods, or processes.
2. Comprehension - involves the understanding and use
of material without relating it to
other material or seeing its full
implications.

28
3. Application - involves the use of abstractions in
particular and concrete situations.
4. Analysis - involves the breakdown of material into
its constituent elements so relations
between ideas are made explicit.
S. Synthesis involves the putting together of
elements so as to form a whole.
6. Evaluation involves judgments about the value
of material.
The National Longitudinal Study of Mathematical Abilities
(Wilson, et al., 1969, pp. 39-40) developed a system not
unlike the Bloom system to classify materials for testing
mathematical abilities. These categories are summarized
below.
1. Computation - straight forward manipulation accord-
ing to rules.
2. Comprehension emphasis on demonstrating under-
standing of concepts and relation-
ships.
3. Application requiring recall of knowledge, selec-
tion of operations, and performance
of operations.
4. Analysis requiring a non-routine application of
concepts.
Finally, Bruner (1967) described a system of represen-
tation which had implications for the category system

29
developed in this study. He theorized that the representa-
tion of material may be symbolic, iconic, or enactive.
Symbolic representation is exemplified by languages and
systems of mathematical symbols. Iconic representation
concerns pictures, illustrations, and physical models.
Enactive representation involves the manipulation of real
objects.
Summary
There are apparent variables in the presentation of
mathematics text. These variables have been described by
mathematics textbook authors and can be inferred from
observations of textbooks. Research related to mathematics
text consists of descriptive studies, comparative studies,
sequencing studies, and readability studies. Little is
known from the research about presentation variables in
mathematics text.
In this study the technique of classroom interaction
analysis served as a model for the development of a technique
for studying presentation variables in mathematics text.
Classification systems of Bloom, the National Longitudinal
Study, and Bruner served as a theoretical starting point
for establishing a system of categories for classifying
material in mathematics text. The category system and
technique which were developed are described in the follow-..,
ing chapter.

30
CHAPTER III
DEVELOPMENT OF THE CMMT TECHNIQUE
One of the main-purposes of this study was to develop a
technique for identifying and studying presentation variables
in mathematics text. These presentation variables concern
the manner in which authors attempt to communicate mathemat-
ical content in printed form.
Presentation variables in mathematics text were studied
in terms of both content and representational structures
within mathematics materials. The structure of any object
is determined by its elements and by the interrelationships
among its elements. In considering presentation structures
of mathematics text, the elements are called messages. The
interrelationships among the messages in mathematics text
determine the organization of the material.
As a first step in the development of this technique
for studying the presentation of mathematics text, a means
of identifying the basic elements or messages had to be
developed. To accomplish this, a system of categories for
classifying messages in mathematics text was devised. The
categories in this system define the message types investi-
gated in this study. The classification system is called
the CMMT category system. The letters CMMT stand for
"Classification of Messages in Mathematics Text."

31
The second step in the development of this technique
was to devise a method of describing and analyzing the
interrelationships among the messages in mathematics text.
These interrelationships, which determine the organization
of mathematics text, concern the ordering or sequencing of
the messages and the frequencies with which the messages
occur. The method which was developed for analyzing the
organization of the messages is called CMMT analysis. The
CMMT category system and method of analysis along with the
procedures for using the category system are the basic com-
ponents of the CMMT technique.
The specific developmental objectives of the study were:
1. To develop a system of categories for classifying
the messages in mathematics text.
2. To develop complete, usable descriptions of these
categories.
3. To develop procedures for using the category system
to classify messages in mathematics text.
4. To develop a method of analyzing the organization
of mathematics text from the classification system.
5. To develop a method of estimating reliability for
raters using the category system.
This chapter is devoted to describing how each of these
developmental objectives was attained.
I

32
Development of the CMMT Category System
The CMMT category system grew out of considerations
which were both theoretical and practical in nature.
Theoretical considerations concerned the structure of mathe-
matical systems, cognitive processes used in learning mathe-
matics, and systems of representation of learning material.
Practical considerations concerned the nature of existing
mathematics textbooks--i.e., the. types of things which are
possible to classify in mathematics text. The CMMT category
system which was included in Chapter 1 is repeated here for
convenience. It is followed by a description of its develop-
ment.
Classification of Messages in Mathematics Text
(CMMT Categories)
Dimension 1: Content Mode
0. Blank Space
Messagesrequiringonly
reception.
1. Definition (Meanings ofwords or symbols.)
2. Generalizations (Importantrules, axioms, theorems,formulas, etc.)
3. Specific Explanation(Concrete examples anddiscussion in specificterms.)
4. General Explanation(Proofs of propositions,general discussion, etc.)
Exposition

33
Messagescalling
forresponses
otherthan
reception.
5. Procedural Instructions(Directions.)
6. Developing Content(Questions in exposition,developmental activities,guided discovery exercises,etc.
7. Understanding DevelopedContent (Exercises involv-ing routine computation,practice, identification,etc.)
8. Applying Developed Content(Real world problems,applications of generaliza-tions in concrete situa-tions, etc.)
9. Analyzing and SynthesizingDeveloped Content (Provingpropositions, finding newrelationships in developedcontent, unguided discovery,etc.
Subclassi-ficationsof ques-tions,exercises,problems,activities,etc.
10. Other Material (Headings, non-mathematicalmaterials, etc.)
Dimension 2: Representation Mode
0. Blank Space
TWrittentext.
4'
I
1. Words2. Mathematical Symbols
Illustration
1
3. Representations of Abstract Ideas (Venndiagrams, geometric diagrams, mappingpictures, etc.)
4. Graphs (Number lines, coordinate graphs,bar graphs, etc.)
5. Representations of Physical Objects orSituations (Plans, maps, crosssectional drawings, photographs, etc.)
6. Non-mathematical Illustrations (Motiva-tional photographs, cartoons, etc.)
7. Combinations of Illustrations withWritten Text (Flow charts, mathematicaltables, tree diagrams, etc.)

34
The development of the CMMT category system began with
the examination of a number of existing mathematics text-
books. From the beginning the broad division between exposi-
tion and exercises or problems was apparent. It was obvious
that books differed in the amount of space devoted to exposi-
tion versus exercises and problems. From these initial
observations the broad categories of messages requiring only
reception versus messages calling for responses beyond
reception were abstracted.
Another major distinction made clear by the examination
of existing textbooks concerned the mode of presentation of
mathematics text. Materials appeared to vary with respect
to the amounts of words, mathematical symbols, and illustra-
tions which were present. It was clear that there were
interactions between these modes of representation and
classifications concerning content. Thus, it was decided
to construct a two dimensional system of categories with
dimension 1 classifying mathematical content and dimension 2
classifying the type of representation used.
As the category system began to evolve, a theoretical
rationale for the choice of categories took shape. The
subclassifications of exposition in the content mode are
based on considerations of the structure of mathematical
systems. The elements of the structure of a mathematical
system may be thought of as undefined words, definitions,
axioms, and theorems. Theorems are statements requiring

35
verifications which are called proofs. Many times general
mathematical concepts arc explained in terms of specific
instances which are called examples. It was decided to
classify messages requiring only reception on the part of
the learner in terms of these elements of the structure of
mathematical systems.
In order for mathematics to become meaningful to a
learner, he must interact with it. To help meet this need
most textbooks provide exercises and problems. Some text-
books contain other interrogative material woven into the
exposition. The problems and questions in mathematics
textbooks play various roles in helping students learn
mathematics. Some exercises serve to make the learner
participate in the development of content. Others aid the
learner in understanding concepts of skills. Some problems
require the student to extend developed content through
application, analysis, and synthesis. Thus, it was decided
to classify messages in the content mode requiring responses
beyond reception in terms of the cognitive processes required
of the learner.
Bloom (1956) provided the hierarchical classification
of cognitive processes listed below.
1. Knowledge
2. Comprehension
3. Application
4. Analysis
36
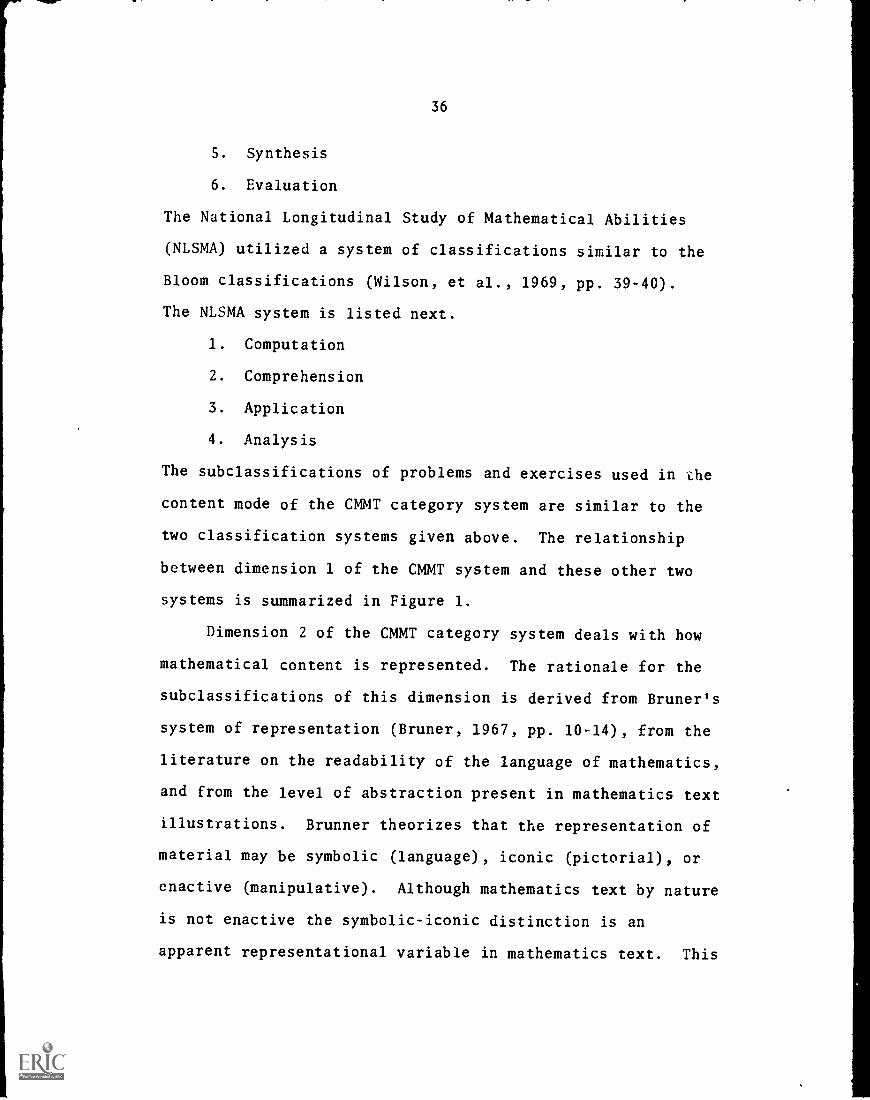
S. Synthesis
6. Evaluation
The National Longitudinal Study of Mathematical Abilities
(NLSMA) utilized a system of classifications similar to the
Bloom classifications (Wilson, et al., 1969, pp. 39-40).
The NLSMA system is listed next.
1. Computation
2. Comprehension
3. Application
4. Analysis
The subclassifications of problems and exercises used in the
content mode of the CMMT category system are similar to the
two classification systems given above. The relationship
between dimension 1 of the CMMT system and these other two
systems is summarized in Figure 1.
Dimension 2 of the CMMT category system deals with how
mathematical content is represented. The rationale for the
subclassifications of this dimension is derived from Bruner's
system of representation (Bruner, 1967, pp. 10-14), from the
literature on the readability of the language of mathematics,
and from the level of abstraction present in mathematics text
illustrations. Brunner theorizes that the representation of
material may be symbolic (language), iconic (pictorial), or
enactive (manipulative). Although mathematics text by nature
is not enactive the symbolic-iconic distinction is an
apparent representational variable in mathematics text. This

37
Structure of aMathematical System
Classifications
CMMT Bloom NLSMA
Undefined WordsDefinitions
AxiomsTheorems
Examples
Proofs
1
1 & 2Not
Applicable
2
3
4
Processes Used in StudyingMathematics Text >(:
Developing Content
Understanding Developed Content
Applying Developed Content
Analyzing and SynthesizingDeveloped Content
6
1 & 2 1 & 2
7
8 3 3
9 4 & 5 4
Note: Blank Space (0), Procedural Instructions (6), andOther Materials (10) are essentially non-mathematicalin nature and are excluded from the above table.However, these types of messages occur frequently inmathematics textbooks and therefore are included inthe CMMT system.
Figure 1
Rational for Dimension 1 CMMT Categories

38
distinction provides the rationale for the broad classifica-
tions of written text and illustration.
Readability literature indicates that the distinction
between words and mathematical symbols may be an important
variable related to the readability of the language of
mathematics (Kane, 1970). This distinction serves as the
rationale for the subclassification of written text into
words and mathematical symbols. The subclassifications of
illustration are based on the level of abstraction of the
illustration. Categories (3) through (S) of dimension 2 of
the CMMT system represent a range in levels of abstraction
with (3) representing the most abstract and (S) the least
abstract type of illustration.
In summary, the rationale for the choice of the CMMT
categories is based on both practical and theoretical con-
siderations. As the system evolved decisions as to what
classifications would be theoretically meaningful had to be
made in the light of the practicality of using the system to
classify messages in existing mathematics text. Several
tentative classification systems were developed, tried out
on existing materials, submitted to critical discussion, and
revised. The classification system which in the end was
developed is not the only possible system. Further research
will have to determine if it is a system which is usable and
meaningful.

39
Description of the CMMT Categories
As the final form of the CMMT category system began to
take shape, tentative descriptions of the categories were
written. These descriptions were used in the classification
of messages in existing text. Problems in applying these
descriptions were noted and on the basis of this experience
the descriptions were revised and refined. The resulting
complete descriptions follow.
Description of Dimension 1 Categories
0. Blank Space: Any unit which is completely blank.
1. Definition (Meanings of words or symbols.):
Messages whose primary purpose is to give the mathe-
matical meanings of words, symbols, or phrases.
Any statement of a definition or any description of
a mathematical term. May be integrated into the
written text or set off as a formal definition.
2. Generalization (Important rules, axioms, theorems,
formulas, etc.): Messages whose primary purpose is
to give important general mathematical concepts,
ideas, or procedures. Any statement of an axiom or
theorem. May be integrated into the written text or
formally set off as a rule, formula, principle, etc.
3. Specific Explanation (Concrete examples and discus-
sion in specific terms.): Messages whose primary
purpose is to give specific or concrete instances of
general definitions, axioms, or theorems. Any

40
discussion or explanation of concrete examples.
May be integrated into written text or specifically
set off as formal examples.
4. General Explanation (Proofs of propositions, general
discussion, etc.): Messages whose primary purpose
is to explain or discuss general concepts, ideas or
procedures. Any proof of a formal proposition.
General statements which seek to clarify, justify,
show how or why, etc. May be used to introduce,
relate, or summarize aspects of a passage. Exposi-
tory statements with mathematical content which are
not clearly classifiable as 1 through 3.
5. Procedural Instructions (Directions.): Procedural
directions appearing anywhere in a text passage.
May indicate to the reader what he is to do with a
set of exercises or problems. May be stated in
the form of a question. Does not apply to directive
statements containing substantial mathematical
information.
Typical examples:
a. Solve the following equations.
b. Complete.
c. Look at Figure 7.
d. What are the solution sets for the open sen-
tences below?
6. Developing Content (Questions in exposition, develop-
mental activities, guided discovery exercises, etc.):

41
Questions, activities, or exercises designed to
help develop content. May call for verbal discus-
sion, physical activity, or thought or written
responses. May be designed to guide the student
to discover some mathematical concept. Exercises
or proLlems whose orimary purpose is to develop or
present new content. Questions, activities, or
exercises integrated into the exposition which are
designed to make the reader participate in the
development of the content.
7. Understanding Developed Content (Exercises involving
routine computation, practice, identification, etc.):
Exercises which are clearly on the knowledge or
comprehension level of Bloom's Taxonomy. May involve
lowest level of application where a generalization
is used in a situation essentially identical to the
situation in which the generalization was presented
in the text. The emphasis here is on understanding
the content which was presented in the text. May
involve the recall of specific information and pro-
cedures or the understanding of presented content
with only routine alterations of material. May
involve the use of material without relating it to
other me-erials or situations or seeing its broader
implications.

42
Typical examples:
a. Exercises of a purely computational nature.
b. Exercises intended to give practice in a skill
or procedure.
c. Exercises which are essentially the same as
examples given in the text. That is, exercises
whose solutions depend cn the imitation of
examples worked out in the text.
d. Problems which require only a direct routine
application of a definition or generalization.
Such as finding the circumference of a circle
with a given radius. (Where the emphasis is
on understanding the generalization rather than
on using it to find solutions to problems.)
8. Applying Developed Content (Real world problems,
applications of generalizations in concrete situa-
tions, etc.): Exercises or problems which are on
the application level of Bloom's Taxonomy. The
emphasis here is on using the content presented in
the text in a new or different situation. The new
situation may be mathematical or a real life or
physical situation. May involve the use of an
abstraction in a concrete situation which the
student has not seen before. Involves the recall
and understanding of information and in addition
the utilization of the content in a non-routine
manner to find the answer to a problem.

43
Typical examples:
a. Using general formulas or procedures to solve
mathematical problems.
b. Using general mathematical principles developed
in the text to find solutions to real life
problems. (Word problems.)
c. Applying general definitioptz, axioms, and
theorems in concrete situations or to specific
mathematical models.
d. Interpreting concrete examples in terms of
general structures.
9. Analyzing and Synthesizing Developed Content
(Proving propositions, finding new relationships
in developed content, unguided discovery, etc.):
Problems which are on the analysis or synthesis
level of Bloom's Taxonomy. May involve the break-
down of content into its basic elements so that
relationships between ideas are made more explicit.
Typical examples:
a. Problems requiring the proof or disproof of a
proposition.
b. Problems requiring the discovery of new r-qation-
ships between elements of developed content.
10. Other Material (Headings, non-mathematical materials,
etc.): Messages not fitting categories 0 through 9.
May be headings of sections, exercises, etc. May be

44
motivational or historical material. Messages
which are non-mathematical in character.
Description of Dimension 2 Categories
0. Blank Space: Any unit which is completely blank.
1. Words: Messages which are made up predominately of
ordinary English words.
G. Mathematical Symbols: Messages which are made up
predominately of mathematical symbols.
3. Representations of Abstract Ideas: May be drawings
to illustrate abstract sets, Venn diagrams, mapping
pictures, geometric diagrams, etc.
4. Graphs: May be bar graphs, line graphs, circle
graphs, etc. Or, may be number lines or various
types of coordinate system graphs.
5. Representations of Physical Ob'ects or Situations:
Must have some mathematical content. May be drawings
or photographs of real objects or living things which
illustrate mathematical content. Could be cross
sectional diagrams, maps, plans, charts, etc.
6. Non-mathematical Illustrations: Non-mathematical
in nature and not illustrating any mathematical
content being considered. May be motivational or
historical cartoons, photographs, or drawings.
7. Combinations of Illustrations with Written Text:
May be some sort of diagram which contains substan-
tial mathematical information in the form of words

45
or symbols. Includes all mathematical tables,
flow charts, tree diagrams, etc.
Procedures for Using the CMMT System
As the definitions of the CMMT categories were being
developed a number of procedural matters dealing with how to
use the system in classifying messages in mathematics text
had to be considered. These procedural matters concerned
the unit of observation, the method of subdividing material
for classification, coding procedures, specific decision
rules to use when deciding between conflicting classifica-
tions, general approaches to classifying passages, the scope
or range of application of the system, and the sample size
to use when analyzing material in existing textbooks.
Unit of Measure
It was decided that an area unit of measure would be
used so that the material in a passage could be represented
quantitatively in terms of the space devoted to various
categories and to logical combinations of categories. From
experience rating textbook passages it was learned that,
except for the symbol-word classifications, messages as
classified by the CMMT system usually took up more area
than one-fourth of a line of print. It was also found that
units smaller than one-fourth of a line of print tended to
make the task of classifying the messages in a passage too
tedious. Thus, the area of one-fourth of a line of print

46
on a given page was chosen as the basic unit of measure for
that page. A "greatest part rule" was made for classifying
units containing more than one type of message.
Partitioning Passages into Messages
Initially it was thought that to code a page of text
all that was needed was to arbitrarily partition the page
into units and then proceed to code each unit. To do this
a uniform rectangular grid was drawn with each section in
the grid having an area of one-fourth of a line of print.
Such a subdivision of a page of text is-shown in Figure 2.
Experience showed that the uniform grid method of par-
titioning a page of text had a number of drawbacks. Typically
the format of a page of mathematics text aid not conform well
to the grid. Much of the time the natural divisions between
types of messages on a page did not fit the arbitrary divisions
imposed by the grid. The grid produced many subdivisions con-
taining parts of two different types of messages and this
made classification difficult. The grid also tended to divide
single messages into a number of units and this made the task
of coding the units unnecessarily repetitive.
Because of the problems inherent with the uniform grid,
it was decided to use a method of subdivision which would
more closely conform to the natural divisions between types
of messages. This subdivision of a page of text is determined
by first drawing boxes around each illustration, sentence,
exercise, section heading, and blank space which appears on a
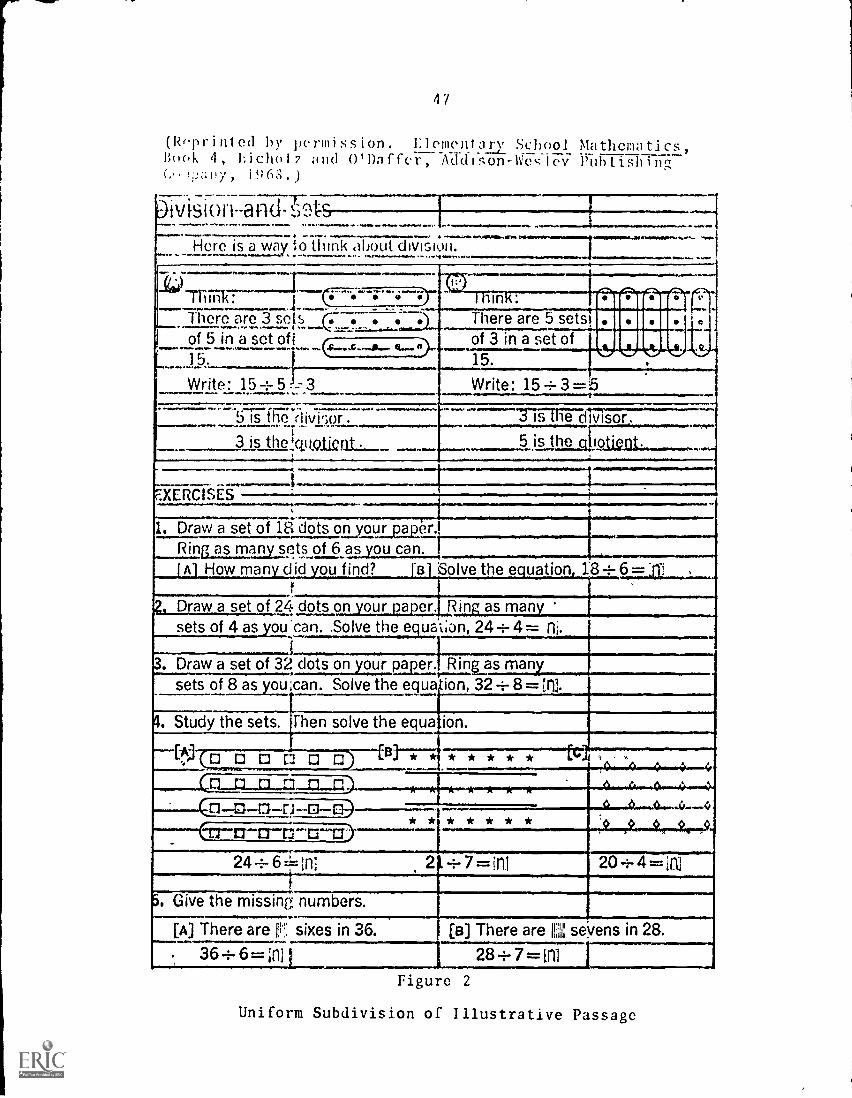
47
(R(rinted by lwmission. Llemenlary SchoolBook 4, hichol7 and O'Daffer, AddlSon-VCSIT7
!ny, 196.)
Mathematics,Publishina
Otv[sion-and- s9tc-.Here is aw21y to think about division.
-Milli : 1 --7:--..--;":- lin . fauriiingi L.L There are 3 sets . . . . There are 5 setst 131 . 1m .a:a_
of 3 in a set of vim1 of 5ina set ofL4c......,.._s_415.
vir 1hr
Write: 154.5 -,3 Write: 15 --:- 3 ==5.. ,.........*'.5-17t fie "ii ivi"1-1- .--- 17-57-i-FRIM-717.-----7,-
5.15.1 the ctilptigat..........._,. I3 is tne Cit tptic rit.:__.................--.
0. -----1I E. g -
.
EXE RC ...
1. Draw a set of 18 dots on youraaer.Ring as many sets of 6 as ou can. I ...-
_al How many did you find? -I3 Solve the equation, 184.6-Lai___,___$
?, Draw a set of 24 dots on your paper. R12- as manysets of 4 as_you.can. .sallttineaulson, 24 -ir 47-= N.
3. Draw a set of 32 dots on your papa R i riga s mansets of 8 as you .can. Solve the equa iion, 32 --ir 8 = [IT
4 Study the sets. then solve the equa ion.
6.9 Op 0 0 Ll 1-4---7=_.1-13L. * * * * * * * . . .
11,41.xl...o...11.4).
4.--0.---.0
O
,-...(11-0-D-ri-0- * * * * * * *etr-tr-crm-c-a)------244-6.61n] 2 ÷ 7 =i111 20.i.. 4:= A
f
5. Give the missing numbers.
[A] There are r sixes in 36. [Et] There are IliillIseyens in 28.
. 364.6:=A 28+7=0 IFigure 2
Uniform Subdivision of Illustrative Passage

page. Sentences are then further subdivided by separating
the words from the mathematical symbols. Experience showed
that this more natural method of subdivision produces a
partition of a page which is easier to work with than the
partition determined by the uniform grid. An example of a
partitioned passage is given in Figure 3. This partition
can be compared with the partitioning by the rectangular
grid given in Figure 2.
Weighting Messages
Even though the uniform rectangular subdivision was
rejected, a basic area unit was retained in the sense that
when a CMMT analysis is made of a passage each subdivision
is weighted in terms of its area. This unit of area is the
area occupied by one-fourth of a line of print in the passage
being analyzed. Its length is determined by one-fourth of
the distance between the right and left margins of a full
line of expository print. Its height is the distance between
the lower edges of two successive lines of expository print.
Each subdivision in a coded passage is weighted to the
nearest number of units which it occupies. Thus, if a sub-
division covers the area of approximately two and one-fourth
lines of print it receives a weight of nine. If it takes up
the area of two-thirds of a line of print it receives a
weight of three. Subdivisions taking up less than one-
eighth of a line of print receive a weight of one.

4q
(Reprinted by permission. Llementary School Mathematics,Book 4, Iii chol z and O'Daffer, Addison-116 PUblishiwzClw;.;1;!/,-----)ivision and sets [-
Here is a way to think about division.
Think:There are 3 setsof 5 in a set of15.
0Think:There are 5 sets
of 3 in a set of15.
1 0
-"` F
(f.,
( : :3( :7-.7)( )
Write: 15+5=3 Write: 15 4- 3=5
5 is the div'sor. 3 is the divisor.
3 is the quotient . 5 is the quotient.
EXERCISES I.
1. Draw a set of 18 dots on your paper. I
Ring as many sets of 6 as you can. I
A] Now many did you find? I fE31 Solve the equation, 18 -,.- 6=
2. Draw a set of 24 dots on your paper.' Ring as manysets of 4 as ou can. Solve the equatiomf24 4. 4 .= n ..
. Draw a set of 32 dots on your paper.1 Ring as manySets of 8 as you caniSolve the equation432 4. 8 =1-1,.
4. Study the sets. [hen solve the equation.
1[A]1
[B] * * * * * * *
* * * * * * *
[C] . .000000000 o0 0 0 0 '0
0 0 0 0 4
(0 0nonn)Co c-: :-.1 0)(n n CI CI 0 CO
* * * * * * *CPrinriGP_)
24 4-6=11 I f 2 =rni j I20 4-4=
. Give the missing numbers.
[A] There are El sixes in 36. [Et] There are al sevens in 28.
36.+6==g 284.7 = AI
Figure 3
CMMT Partition of Illustrative Passage

50
In CMMT analysis, these weights are used to determine
areas devoted to the various types of messages in a passage.
The weighting of subdivisions in terms of area allows the
method of subdividing a passage to be somewhat arbitrary
with the weighting system correcting for any differences in
subdivisions determined by different users.
Coding Passages
After a passage has been subdivided the messages in
each subdivision are classified on both dimensions of the
CMMT category system. This is done by recording a symbol
of the form m-n in each subdivision, where m is the classi-
fication on dimension 1 and n is the classification on
dimension 2 of the CMMT category system. Figure 4 is an
example of a coded page of text.
General Coding Procedures
Experience coding passages using the CMMT system led to
the discovery of some general procedures and decision rules
which proved useful. These are presented below in outline
form as notes on using the CMMT technique.
Notes on Using Dimension 1 Categories.
A. Begin by mentally delineating between the blank spaces
(0), exposition (1 4), messages requiring responses
(5 - 9), and other material (10). This will make the
task of making finer distinctions easier.

51
(Reprinted by permission. Elementary School Mathematics,Book 4, LichoIv. and O'Daffer, Addison-Wesley PublishingColpAny, 196P.I
ivisionkcicod setsHere ri.41.vay to think about division. 0
Think: I-1
There are 3 setsof 5 in a set of15.
71-14) ° T h i n k :3- I
There are 5 setsof 3 in a set of15.
1:
(( .1.)
Write:I : 5=31 0 Write: 1.-ti*-.. 5 0
05 is thdrfvisor.
° ° .
3 is tliehivisor.05 is tliquotient.3 is thMotient
0:XEgl ES
1. Draw a set of 18 dot7eti your paper. 0Ring ,s many sets ot.:S-gs you can.[Al 'low many did ypti-find? I [a] Solve th7squation,118÷6= n:7 -2.
9. Draw a set of 24 dots r.-) al o u r paper. Ring as7i-riany 0sets of 4 as gout can., Solve thezi:tiation,c24-:-7p=z4;.
c. Draw a set of 32 dots on j'bul paper. I Ring as44Trany 0sets of 8 as",914 can. )Solve the;z3qt.lation,132÷1,34:111.
..
4 Study the sets. fhen.1,5tqe the equation. I 06) [a] * * * 7... g * * [C] .07730
4 0 4 4 *o o o o '4>
0 0 0 0 0
0 120 474-4:11:
(0m 02.i-15-)
* * * * * * ** * * * * * *
(Donna o)( n n o o a )Cri n o n n .71)
o 124 -?61:11 I o 121- 76aj111 f
. Give the missing n(uapers. 0[A) There are 1!:!;;; .,%xe.t in 36. [a] There are 12,14s4vens in 28.
36 i.-6::::-..:11: 1
0 28?-?-74= .111 I oFigure 4
Coded Illustrative Passage

52
B. To rate exposition (.1 4):
1. First identify definitions (1) and generaliza-
tions (2) .
2. Of the remaining exposition, classify all messages
giving specific instances of more general content
as specific explanation (3) .
3. Classify the remaining exposition as general
explanation (4).
C. To rate messages requiring responses (5 9):
1. First identify procedural instructions (5).
2. Base decisions involving exercises and problems
(6 9) on the processes involved. Do not base
these decisions on the difficulty of the problem
or exercise.
D. Illustrations as well as written messages must be
classified on dimension 1. The classification of an
illustrative message is determined by the same rules
as the classification of written messages. If a
diagram illustrates a definition it is classified as
a definition, if it illustrates a proof it is classi-
fied as general explanation, etc.
E. When in doubt about how to classify a message reread
the descriptions of the appropriate categories.
Notes on Using Dimension 2 Categories.
A. To decide if a written message in a unit is predominantly
words or symbols, count the words necessary to say the

53
message. If the symbols account for more than or the
same number of these words as the ordinary English
then classify the message as symbols (2). Otherwise,
classify the message as words (1).
B When classifying messages (3 7) identify the non-
mathematical illustrations (6) first. Then make the
remaining classifications. When in doubt reread the
appropriate category descriptions.
Range of Application and the Sampling of Passages
The range of applicability for the CMMT technique was
conjectured to be grade levels 4 through 12. This range was
chosen since children in grades K through 3 seldom study
mathematics through reading text materials and since most
college mathematics textbooks are formal in nature and
written for specialized audiences.
Typically mathematics textbooks are divided into large
sections which cover a single broad topic or set of related
topics. In turn, these sections are usually divided into
short lessons. In each lesson a set of related concepts
are presented. When sampling text passages for CMMT analysis
entire lessons should be sampled. Only in this way can the
organization of the material in a text be adequately
described.

54
Description of CMMT Analysis
When a passage of text has been coded using the CMMT
system, the information obtained may be displayed and analyzed
in the following ways.
Listing
The sequence of messages in a passage may be displayed
by listing them in the order in which they appear in the
text. This order is determined by following the natural
flow of the material through the subdivisions of the parti-
tion used in the classification process. The natural flow
of the material is basically a left-to-right and top-to-bottom
ordering with modifications to accommodate the format of the
passage. In the list, the classifications for each dimension
of the category cvstem and the associated weight are recorded
for each subdivision of the partition. The manner in which
the list may be used to analyze the sequential nature of a
passage is illustrated in Figure 5 which is the list for the
illustrative passage coded in Figure 4.
Matrices
Matrices are used to analyze the interactions between
categories in each dimension and the interaction between
dimensions of the CMMT system. For interactions between
categories within dimensions a matrix of the frequency with
which a given message is followed by another given message
is used. This yields a 10 x 10 matrix for dimension 1 and
4,

55
Dim 1 Dim 2 Weight
Heading - ---+ 100
Intro. Statement-+ 4
3
Example followed_ 3
by definition. 3Exposition 0
Exercises
1
0
3
Example followed_ 3
by definition. 3
0
1
0
Heading 100
Exercise-[ 77
0
Exercise
Directions
Exercise[I ;
0
1 1
0 3
] 2
0 2
4
3 Illus. 4
2 Symbol 1
0 Sequence. 2
1 2
0- Word 1
1 4
3_Illus.
42
Symbol1
0-- Sequence.2
1 2
0 5
1 1
0 7
lit_ Word 7
0 67
7
lWord S
2 Symbol. 1
0 0 65 1 2
0 0 2
3Illus. S
2 Symbol. 1
0 1
3Illus. S
2 Symbol. 1
1 2
1-[Word 2
2 Symbol. 1
0 1
1-1_Word 2
2_j Symbol. 1
0 1
Exercise
Directions
Exercise
Exercise
[ 75
[ 7
0
L70
(The weight indicates the number of area units of approxi-mately one-fourth of a line of print devoted to each messagerecorded in the list.)
Figure 5
CMMT List for Illustrative Passage

56
a 7 x 7 matrix for dimension 2. The manner in which these
within dimension matrices are used to analyze passages is
illustrated below by the matrices for the illustrative
passage coded in Figure 4.
Dimension 1Categories
1
2
3
4
5
6
7
8
9
10
Dimension 1Categories
1 2 3 4 5 6 7 8 9 10
0 1 0 0 0 0 0 0 1
0 0 0 0 0 0 0 0
A2 0 0 0 0 0 0 0- t.
0 0 1 0 0 0 0 0 0
0 0 '0 0 0 2 0 0
0 0 0 0 0 0 0 0 .0-B
0 0 0 0 2 0 0 0 0..
0 0000 o 0 0 .'0:
0 0 0 0, 0 0 0 Q o.
o 0 0 1 o AL t. 0 0 Nk
Figure 6
Dimension 1 Interaction Matrix for Illustrative Passage
The notes which follow describe the dimension 1 inter-
action matrix given in Figure 6.
a. Entries in the matrix are in terms of units of one-
fourth of a line of print. Entry n in row i and
column j indicates units of type i were followed by
units of type j, n imes in the passage. Blank
space is ignored.

57
b. The sum of the entries in the shaded area represents
the number of shifts between messages requiring
only reception and messages requiring responses.
in the passage analyzed in the above matrix there
was only one such shift, from category 10 to
category 7.
c. Entries on the diagonal of the matlix represent
numbers of successive repetitions of catevries.
The 16 in position (3,3) and the 35 in position
(7,7) indicate that the passage analyzed -.;') the
above matrix consisted mainly of examples (category
3) and comprehension exercises (category 7).
d. Off diagonal entries in area A represent shifts
between expository categories. There were four
such shifts in the passage analyzed in the above
matrix.
c Off diagonal entries in area B represent shifts
between categories requiring responses. In the
passage analyzed there were four such shifts, all
between directions (category 5) and comprehension
type exercises (category 7).
f. Rows 2, 6, 8, and 9 contain all zeros, indicating
that in the passage analyzed no generalizations
were made, there were no developmental exercises,
and no exercises or problems requiring application
or higher mathematical processes.

Dimension 2Categories
58
Dimension 2Categories
1 2 3 4 5 6 7
0 0 0
4 0 0 0 0 0
5 0 .) '0 0 0 0 0
6 0 0 0 0 0 0
D 0 0 0 0 0
Figure 7
Dimension 2 Interaction Matrix for Illustrative Passage
The notes which follow describe the dimension 2 inter-
action matrix given in Figure 7.
a. Entries in this matrix are in terms of weights.
Entry n in row i and column j indicates units of
type i were followed by units of type j, n times
in the passage. Blank space is ignored.
b. The sum of the entries in the shaded area of the
matrix represents the number of shifts between
written materials and illustration. In the passage
analyzed in the above matrix there were 10 such
shifts.
c. Entries on the diagonals represent numbers of
successive repetitions of categories. The 29 in

59
position (1,1) and the 18 in position (3,3)
indicate that the majority of the material con-
sisted of word messages (category 1) and illustra-
tive representations of abstract ideas (category 3).
d. Off-diagonal entries in area A -epresent shifts
between symbols and words within the written
message. There were 10 such shifts in the passage
analyzed above.
e. Off-diagonal entries in area B represent shifts
between types of illustrations. There were no
such shifts in the passage analyzed above.
To analyze interactions between dimensions of the CMMT
category system, a 10 x 7 matrix is used. The between
dimension interaction matrix for the passage coded on page
21 is given below.
Dimension 1Categories
1 2 3 4 5 6 7
1 4 0 0 0 0 0 0
2 0 0 0 0 0 0 0
3 8 2 8A
0 0 0 0
4 2 0 0 0 0 0 0
Dimension 2 5 4 0 0 0 0 0 0Categories
0 0 0 0 0 0 0
7 16 7 15B 0000
8 0 0 0 0 0 0 0
9 0 0 0 0 0 0 0
10 2 0 0 0 0 0 0
Figure 8
Between Dimension Interaction Matrix for Illustrative Passage

60
The following notes describe the between dimension
interaction matrix given in Figure 8.
a. Entries in this matrix are made in terms of weights.
Entry n in row i and column j indicates units of
type i on dimension 1 were of type j on dimension
2, n times in the passage.
b. Entries in area A show the presentation mode used
for the exposition. The matrix above shows that
the exposition in the passage analyzed consisted
of four units of definition presented in words
(row 1), 18 units of specific explanation presented
in words, symbols, and illustrations (row 3) and
two units of general explanation in words (row 4).
c. Entries in area B show the presentation mode used
for exercises and problems. The matrix shows that
in the passage analyzed four units were word direc-
tions (row 5) and 38 units were comprehension
exercises presented in words, symbols, and illus-
trations (row 7).
Proportions
The list and the matrices are used to describe sequen-
tial aspects of mathematics passages. Proportions computed
in terms of the weights of the various messages are used to
describe quantitative aspects of the organization of
passages. The defining formulas for the proportions are

61
given below. In the defining formulas, cn,i = the number of
units devoted to category i on dimension n.
Proportion of blank space in total passage.
C1,0
10
C1,1
0
Proportion of category j in non-blank material dimen-
sion 1:
10
c1 ,j/1 c1,1i
Proportion of category j in non-blank material dimen-
sion 2.
7
C /223
C2,1
.
Proportion of exposition in non-blank material.
1
/
4
C .//0
C .
1,1 1,11 1
Proportion of content development in non-blank material.
4 10
(/ C1,1 C1,6 / C1,i1
Proportion of exercises in content development.
4
C . + C )1,1 1,61
Proportion of exposition in content development.
4 4
1
CI,i(41
C,,i C1,6)

Proportion requiring responses in non-blank material.
9 10
/ Ci,i// Ci,i5
Proportion of mathematics illustration in non-blank
material.
5 7
C 2,1/ C2,1
/ .
Proportion of illustration in non-blank material.
7 7
C2,i// C2,i1
The proportions computed for the illustrative passage
coded on page 21 are given in Table 1.
The proportions in Table 1 indicate that in the passage
analyzed the non-blank material consisted mainly of specific
explanation or examples (category 3 of dimension 1) and com-
prehension exercises (category 7 of dimension 1). Slightly
over one-half of the material consisted of word messages
(category 1 of dimension 2), about one-third consisted of
abstract illustrations (category 3 of dimension 2), and the
remainder consisted of mathematical symbols (category 2 of
dimension 2). The passage can be characterized as consist-
ing of about one-third exposition and about two-thirds
exercises %nd problems. All of the content development
material was presented in an expository manner.
A computer program was written to do the work of deriving
the CMMT analysis for a passage from a rater's codings. The

63
Table 1
CMMT Proportions for Illustrative Passage.
Proportion of blank space in total passage .409
Proportion of each category in non-blank material.
Category Dimension 1 Dimension 2
1 .060 .5372 .000 .1193 .269 .3434 .030 .0005 .030 .0006 .000 .0007 .552 .0008 .0009 .000
10 .030
Proportion of exposition in non-blank material .358
Proportion of content development innon-blank material .358
Proportion of exercises in content development .000
Proportion of exposition in content development 1.000
Proportion requiring responses in non-blankmaterial .612
Proportion of mathematics illustration innon-blank material .343
Proportion of illustration in non-blank material .343

64
output of this program includes the list, the matrices, and
the proportions for the analyzed passages. The Fortran
statements for the program and data set up for using it are
included in Appendix E.
A Method of Estimating Rater Reliability
A method of estimating the reliability of raters using
the CMMT technique has been adapted from a method of estima-
tion used in interaction analysis (Flanders, 1960, p 161).
This method first proposed by Scott (1955), is based on an
adjusted proportion of agreement between raters. The estimate
can be made whenever two or more raters code the same passage.
It is relatively easy to compute and interpret. Thus, the
estimate is more practical than other possible reliability
coefficients based on analysis of variance or on correla-
tional procedures.
Scott's coefficient is called "pi" and is determined by
the formulaPo Pe
w1 P
e
Po is the proportion of agreement between two raters. P
eis
the proportion of agreement between two raters expected by
chance which is found by squaring the proportion of classifi-
cations made by the raters in each category and summing
these over all categories. That is,
kPe
Pi= 1 P. ,
i
I

65
where P. is the proportion classified as category i out of k
categories. The coefficient 7r can be expressed in words as
the amount that two observers exceeded chance agreement
divided by the amount that perfect agreement exceeds chance.
When determining a between-rater reliability estimate
for more than two raters, the Scott coefficient is determined
for each pair of raters and the average of all such pairs is
taken as the reliability estimate. When investigating the
reliability of raters using the CMMT technique, an estimate
is made for each dimension of the category system. The com-
putational formulas are given in Figure 9.
Reliability Estimatefor Two Raters onDimension n.
Po Pe
1 Pe
Proportion of Agree-ment between TwoRaters on Dimension n.
po
(Number of agreements ondimension n)(Total number of messages]
Proportion of Agree-ment Expected byChance between TwoRaters on Dimension n.
Pe =
.
Pii
(Number of dimension messagesclassed as i by first raterplus the number classed as iby second)2 (total number of messages)
a. Blank space (category 0) is ignored in reliabilitycomputations.
b. For more than two raters compute all pairs of coeffici-ents and average.
Figure 9
Method of Computing between-rater Reliability Estimates.

66
The Scott coefficient for estimating reliability may be
used to determine a within-rater reliability coefficient by
computing the proportion of the time a rater agrees with
himself on two trials separated by a period of time. A Scott
coefficient of .85 or above is considered to be a reasonable
level of performance for raters using interaction analysis
(Flanders, 1960, p 166). Acceptable levels of performance
using the CMMT technique will have to be determined by
research. The computer program found in Appendix F is used
to compute Scott coefficients from the ratings of observers.

67
CHAPTER IV
PROCEDURES FOR THE EMPIRICAL STUDIES
The main purposes of the empirical studies were
1. To investigate the validity of the CMMT technique
as a means of studying the organization of mathe-
matics text.
2. To investigate the reliability of raters trained
in the use of the CMMT technique.
This chapter is devoted to describing the procedures which
were used to 'achieve each of these purposes.
The Validity Study
Validity was studied in both a descriptive and a statis-
tical manner. A number of passages were chosen from mathe-
matics textbooks and submitted to CMMT analysis by the inves-
tigator. These passages were used to demonstrate how CMMT
analysis may be used to describe the organization of mathe-
matics text. The data from the CMMT analyses were also
submitted to correlational analysis and to analysis of vari-
ance in order to show further evidence of validity of the
CMMT technique.
The specific validity objectives were
1. To demonstrate that CMMT analysis can be used to

68
describe the organization or existing mathematics
text passages.
2. To demonstrate that CMMT analysis reflects similari-
ties and differences between passages , ith known
organizational similarities and differences.
3. To determine if CMMT analyses of entire sections of
textbooks can be closely approximated by sampling a
small number of CMMT sample passages.
4. To determine if the CMMT analyses of passages
sampled within the same textbook are more closely
related than the CMMT analyses of passages sampled
from different textbooks.
5. To determine if the data obtained from CMMT analysis
may be used to identify significant differences in
organization between different mathematics textbooks.
The Materials Studied
The CMMT technique was designed to be applied to mathe-
matics materials at approximately grade levels 4 through 12.
Hence, questions of validity needed to be studied at a range
of grade levels using various mathematical topics. The
materials used in the study were grouped into three sets.
The levels and corresponding topics for each set were
Set 1. Upper Elementary Materials (grades 4 6)
Arithmetic, Geometry, Introductory Algebra.
Set 2. Junior High School Materials (grades 7 9)
Arithmetic, Algebra, Geometry, Probability.

69
Set 3. Senior High School Materials (grades 10 12)
Algebra, Geometry, Trigonometry, Algebraic
Structure.
Twelve textbooks were chosen on a rational basis to
obtain samples of all the topics and levels indicated above.
Eight of the twelve textbooks were published by eight differ-
ent commercial publishers. The other four books were written
by fear different mathematics curriculum groups. This
selection procedure was used to insure coverage of a variety
of topics, levels, and text types. No attempt was made to
generalize about a particular publisher's or study group's
textbooks in this study.
The textbooks studied were:
Set 1: Bl. Elementary School Mathematics, Book Four,
by Eicholz and O'Daffer, C 1968 by
Addison-Wesley Publishing Company.
(Grade level 4)
B2. Learning Mathematics, by Deans, et al., C
1368 by the American Book Company.
(Grade level 5)
B3. Exploring Elementary Mathematics, Five,
by Keedy, et al., C 1970 by Holt,
Rinehart and Winston, Inc.
(Grade level 5)
B4. Six, Modern School Mathematics, by Duncan,
et al., C 1967 by Houghton Mifflin Company.
(Grade level 6)

70
Set 2: B5. Seeing Through Mathematics, Book One,
by Van Engen, et al., C 1962 by Scott,
Foresman and Company.
(Grade level 7)
B6. Mathematics for Junior High, Volume 2,
Part II, by the School Mathematics Study
Group, C 1961 by Yale University Press.
(Grade level 8)
B7. Unified Modern Mathematics, Course II,
Part I, from the Secondary School Mathe-
matics Curriculum Improvement Study, C
1969 by Teachers College, Columbia University.
(Grade level approximately 8)
B8. Contemporary Algebra, Book One, by Smith,
et al., C 1962 by Harcourt, Brace and
World, Inc.
(Grade level 9)
Set 3: B9. Book Six, Relations, from the Comprehensive
School Mathematics Program, C 1971 by
CEMREL, Inc.
(Grade level approximately 10)
B10. High School Mathematics, Unit 6, Geometry,
by the University of Illinois Committee on
School Mathematics, C 1960 by University
of Illinois Press.

71
B11. Contemporary Algebra, Second Course, by
Mayor and Wilcox, C 1965 by Prentice-
Hall, Inc.
(Grade level 11)
B12. Algebra with Trigonometry, by Fehr, et al.,
C 1963 by D. C. Heath and Company.
(Grade level 12)
From each of these twelve textbooks one experimental
section was selected on a ratilnal basis to cover the topics
listed above for the various sets of material. The experi-
mental sections, including 99 passages covering 310 pages,
served as data sources for the study of the validity objec-
tives. The sections and corresponding topics are listed
below.
ESI. Arithmetic
(Chapter 3 of Bl: Multiplication and Division,
14 passages, pages 72-87)
ES2. Geometry
(Chapter 7 of B2: Geometry, 9 passages, pages
229- 242)
ES3. Arithmetic
(Chapter 2 of B3: Addition and Subtraction,
13 passages, pages 31-51)
ES4. Introductory Algebra
(Chapter 5 of B4: Statements, 11 passages, pages
130-141)

72
ESS. Arithmetic
(Unit 7 of B5: The Rational Numbers of Arithme-
tic, 9 passages, pages 308-327)
ES6. Probability
(Chapter 8 of B6: Probability, 6 passages,
pages 311-345)
ES7. Geometry
(Chapter 3 of B7: An Introduction to Axiomatic
Affine Geometry, 6 passages, pages 120-173)
1"S8. Algebra
(Chapter 4 of Z8: Operations with Algebraic
Expressions, 11 passages, pages 119-135)
ES9. Algebraic Structure
(Chapter 2 of B9: Ordered Pairs and Relations,
4 passages, pages 27-69)
ESIO. Geometry
(Section 6.07 of B10: Similarity, 5 passages,
pages 6-179 to 6-218)
ES11. Algebra
(Chapter 7 of Bli: Exponents and Radicals,
10 passages, pages 201-216)
ES12. Trigonometry
(Chapter 12 of B12: Trigonometric Functions,
7 passages, pages 427-448)

73
A focus passage representing a specific instance of the
topics and levels to be studied was chosen on a rational
basis from each of the twelve experimental sections. Some
of these passages served as data sources for studying ho.
CMMT analysis could be used to describe the organization of
existing text. Others provided the mathematical material
from which pairs of passages were contrived for studying
how CMMT analysis can be used to compare similar passages.
The focus passages were also used as practice and criterion
passages in the reli;J'ility study discussed in the next
section. The various focus passages and corresponding topics
arc listed below.
FP1. Division and Sets
(Page 73 of Bl)
FP2. Circumference
(Pages 231-233 of B2)
FP3. Commutative Property of Addition
(Page 32 of B3)
FP4. Using Equations and Inequalities
(Pages 136-137 of B4)
FPS. Multiplication of Rational Numbers
(Pages 324-325 of B5)
FP6. Probability of A or B
(Pages 328-332 of B6)
FP7. Some Logical Consequences of the Affine Axioms
(Pages 128-135 of B7)

FP8. Expressions with Grouping Symbols
(Page 132 of B8)
FP9. Cartesian Products and Relations
(Pages 47-53 of B9)
FP10. Mean Proportional and the Pythagorean Theorem
(Pages 6-203 to 6-207 of B10)
FP11. Fractional Exponents
(Pages 210 -21.1 of B11)
FP12. Extending the Abs and Ord Functions
(Pages 431-432 of B12)
From each of six focus passages a pair of contrived
passages was written. Each contrived passage covered the
same mathematical material as the focus passage on which it
was based. The passages in a contrived pair were written
following different organizational plans and were approxi-
mately the same length. The twelve contrived passages were
used to study how CMMT analysis reflects similarities and
differences be-ween passages with known organizational
similarities and differences. The organizational plans
followed i constructing the contrived passages are listed
next.

75
1. Plans of the contrived passages based on FP2.
High proportion of develop-mental exercises.
Dimension 1 Low proportion of explanation.Integration of exercises withexpository.
CP2a: Other aspects constant with CP2b.
CP2b:
Dimension 2: Constant with CP2b.
( No developmental exercisesHigh proportion of explanation.
Dimension 1: Exposition separated fromexercises.
Other aspects constant with CP2a.
Dimension 2: Constant with CP2a.
2. Plans 3f the contrived passages derived from FP4.
1
High proportion of examples.Dimension 1: Low proportion of general
explanation.
CP4a:Dimension 2: Use of motivational illustration.
Other aspects constant with CP4b.
I Na examples.( Dimension 1: High proportion of general
( explanation.
CP4b: Dimension 2: Use of mathematica' illustra-tions.
Other aspects constant with CP4a.
3. Flans of contrived passages derived from FP6.
{
Dimension 1: Constant with CP6b.
CP6a:High propottion of symbols and
Dimension 2: illustrations.Low proportion of words.
CP6b:Low proportion of symbols and
Dimension 2: illustrations.High proportion of words.
1
Dimension 1: Constant with CP6a.

76
4. Plans of contrived passages based on FP7.
1
General explanation followedDimensional:
{
Dimensiol: by generalization sequences.
'CP7a: Other aspects constant.
Dimension 2: Constant with CP7a.
Generalization followed byDimension 1: general explanation sequences.
CP7b: Other aspects constant.
Dimension 2: Constant with CP7a.
S. Plans of contrived passages based on FP9.
Low proportion of definition,generalization, and generaleDimension 1: explanation.
High proportion of examples.Exercises integrated with
CP9a: exposition.
Dimension 2: Constant with CP9a.
CP9b:
High proportion of definition,generalization, and generalexplanation.Dimension 1:
Low proportion of examples.Exposition separated from
exercises.
Dimension 2: Constant with CP9b.
6. Plans of contrived passages based on Frio.
J 1
High proportion of exposition.Dimension 1: Low proportion of exercises
and problems.CP10a:
Dimension 2 illustrations grouped separatef:om written text.
Other aspects constant with CP10b.
f Low proportion of exposition.Dimension 1: High proportion of exercises
[ and problems.CP10b:
Dimension 2: 1 Illustrations integrated withwritten text.
Other aspects constant with CP10a.

77
The choice of the organizational plans followed in the
preparation of a given contrived pair of passages was made
on a rational basis depending on the related focus passage.
For example, if the focus passage cont maned mostly manipula-
tive algebraic material no attempt was made to contrive
passages with differing illustrative material. Thus, the
material in the focus passages limited to some extent the
organizational variables which could be manipulated in the
contrived passages. No attempt was made in this study to
exhaust or even adequately sample all possible organizational
variables which could be investigat-d. The contrived
passages served only to demonstrate the feasibility of using
CMMT analysis to describe the organization of passages.
The chart in Figure 10 summarizes the selection and
preparation of the materials used in the validity portion
of the study. The labeling scheme used here for materials
will be used throughout the remaining chapters to refer to
materials.
Method of Studying the Materials
All of the materials described in the previous section
were submitted to CMMT analysis by the investigator. These
analyses were used to attain the validity objectives given
on page 2.
The focus passages PP1, FP3, FPS, FP8, FP11, and FP12
were used to demonstrate that CMMT analysis can be used to
describe the organization of mathematics rssages. These

78
Existing Textbooks
(Twelve books of various types selected withfour books corresponding to each set level.)
Twelve TextbooksSet 1 (grades 4-6): Bl B4Set 2 (grades 7-9): B5 B8Set 3 (grades 10-12): B9 B12
(One section from each textbook selected tocorrespond to various topics.)
Twelve Experimental SectionsSet 1: ES1 ES4Set 2: ES5 ES8Set 3: ES9 ES12
(One focus passage selected from eachexperimental section.)
Twelve Focus PassagesSet 1: FP1 - FP4Set 2: FPS FP8Set 3: FP9 F.12
(Pairs of contrived passages correspondingto FP2, FP4, FP6, FP7, FP9, and FP10 preparedfollowing opposing plans of organization.)
Twelve Contrived PassagesSet 1: CP2a, CP2b, CP4a, CP4bSet 2: CP6a, CP6b, CP7a, CP7bSet 3: CP9a, CP9b, CP10a, CP1Ob
Figure 10
Materials Used in the Validity Study.
...P.

79
passages are included in Appendix C. The CMMT analyses of
these passages were studied in detail. The manner in which
the analyses reflected the organization of the passages is
discussed in Chapter 5.
The CMMT analyses of the contrived passages were com-
pared and contrasted to see how they reflected the organiza-
tional plans of the passages. The manner in which the CMMT
analyses described the planned similarities and differences
between the contrived passages in each pair is discussed in
detail in the next chapter. The contrived passages are
included in Appendix D.
To determine if CMMT analyses of entire sections of
textbooks can be closely approximated by sampling a small
number of CMMT sample passages, successive correlations were
made between each entire experimental section and increas-
ingly larger random samples of passages from the same section.
For these correlations, 25 items of data readily available
from the CMMT analyses of the entire sections and the samples
were useu. These items of data are listed below.
1. The average number of non-zero entries in the
dimension 1 interaction matrices.
2. The percentage of off-diagonal entries in the
dimension I interaction matrix.
3. The percentage of shifts between exposition and
exercises in the dimension 1 interaction matrix.

80
4. The average number of non-zero entries in the
dimension 2 interaction matrices.
5. The percentage of off-diagonal entries in the
dimension 2 interaction matrix.
6. The percentage of shifts between written and
illustration in the dimension 2 interaction matrix.
7. The average number of non-zero entries in the
between-dimension interaction matrices.
8, The percentage of blank space.
9.
The percentage in each category (1 10) on
J
. dimension 1.18.
19.
The percentage in each category (1 7) on. dimension 2.
25.
The following procedure was used in making these
successive correlations. A passage was selected at random
from a given section and the above data from the CMMT analysis
of the entire section was correlated with the corresponding
data for the passage. Then another passage was randomly
selected from the remaining passages in the section, combined
with the first passage for CMMT analysis and the same corre-
lational procedure was repeated. The process was continued
until all passages in the section were sampled. It was
determined how many passages it was necessary to sample in
order to reach and maintain correlations of .90 and .95

81
between the sample and the entire section. The entire
procedure was repeated for each of the twelve experimental
sections.
To determine how closely the CMMT analyses of passages
sampled within the same textbook are related, each passage
in an experimental section was correlated with each other
passage in the section using the 25 items of CMMT data listed
above. The average of these within-textbook correlations
was computed for each experimental section. A A2 test sug-
gested by Ostle (1963, p. 227) was used to test for signifi-
cant differences among the twelve average within-textbook
correlations.
In addition, the average correlation between all possi-
ble pairs of twelve passages, one chosen at random from each
experimental section, was computed using the 25 items of
CMMT data. This average between-textbook correlation was
compared with each of the twelve within-textbook average
correlations to determine if the within-textbook passages
correlated significantly higher than the between-textbook
passages. The A2 test mentioned above was also used for
making these comparisons.
To determine if the data obtained from CMMT analysis
could be used to identify significant differences in
organization between different textbooks, an analysis7of
variance model was used. The variables investigated in
this manner were variables whicl could be readily obtained

82
from the CMMT analyses of the passages. These variables
were chosen to represent the types of CMMT variables it is
possible to study. They do not exhaust all possible CMMT
variables which could be investigated. The sixteen variables
which were investigated are listed next.
1. Total units per passage.
2. Number of non-zero entries in the dimension 1
interaction matrix per passage.
3. Percentage of off-diagonal entries in the dimension
1 interaction matrix per passage.
4. Percentage of shifts between exposition and exer-
cises per passage.
5. Number of non-zero entries in the dimension 2
interaction matrix per passage.
6. Percentage of off-diagonal entries in the dimension
2 interaction matrix per passage.
7. Percentage of shifts between written and illustra-
tion per passage.
8. Number of non-zero entries in the between dimension
interaction mai
rix pe 'passage.
9. Percentage of space per passage.
10. Percentage of exposition per passage.
11. Percentage of content development per passage.
12. Percentage of activities in content development
per passage.
13. Percentage of exposition in content development
per passage.

83
14. Percentage requiring responses per passage.
15. Percentage of mathematical illustration per passage.
16. Percentage of illustration per passage.
Each of the above variables was submitted to a one-way
unequal cell analysis of variance as illustrated in Figure
11 (Winer, 1962, pp. 96-104). In this design, passages
within textbooks are used in place of the more typical
subjects within treatments. Thus, in the analysis of
variance MSbetween treatment is interpreted as
MSbetween textbooks and MSwithintreatments is interpreted
as MSwithin textbooks' When significant Cfferences were
found between the experimental textbooks on a given vari-
able, the Numan-Keuls Sequential Range Test (Winer, 1962,
p. 80) was used to obtain an ordering ;,f the textbooks on
the variable.
Variable m
B1 B2 B12
X1,1
Xi,1
X13,1
x 1,2
X.1,2
.
.
X9,2
x 1,12
X.1,12
X7,12
x. = variable m CMMT score oni,j passage i of textbook Bj.
Figure 11
Analysis of Variance Design for Identifying Differences
between Textbooks.

84
The Reliability Study
To study the reliability of raters trained in the use:
of the CMMT technique, a rater training booklet and a booklet
of criterion passages were prepared. The materials for these
booklets were drawn from the validity materials described in
a previous section. Three groups of subjects studied the
training booklet individually and on two occasions coded the
passages in the criterion booklet. These passages were
scored in terms of the proportion of agreement of each sub-
ject with the most frequent ratings of the meassages.. A
repeated measures analysis of variance model was used to
analyze the differences between groups and between the
rating difficulties of the criterion passages. The five
subjects in each group who received the highest scores were
considered proficient in applying the CMMT technique and
were defined as experts in their groups. Within- and
between-rater reliability coefficients were determined for
the experts in each group.
The specific reliability objectives were:
1. To determine if there are significant differences
between groups of raters with differing academic
background and experience.
2. To determine if there arc significant differences
in the level of rating difficulty between different
types of passages.

85
3. To determine between-rater reliability coefficients
ioraters who obtained proficiency in the CMMT
technique.
1. To determine within-rater reliability coefficients
for raters who obtained proficiency in the CMMT
technique.
5, To determine a reliability esti-nate for ratings
made by the investigator in the validity portion
of the study.
Materials
A training booklet was written fo:- subjects to use in
training themselves in the use of the CMMT technique. The
booklet consisted of an introduction to the CMMT categories,
thorough descriptions of the categories, procedural sugges-
tions for applying the CMMT system, and many-keyed practice
passages. Descriptive material in the training booklet was
based on the developmental work discussed in Chapter 3. The
practice passages included were selected from the textbooks
studied in the validity portion of the study and represented
a range of subject matter and grade levels. Each practice
passage was followed by a coded version of the passage so
that subjects could ohtain some feedback as they learned the
system. A copy of the training booklet is included in
Appendix A.
The booklet of criterion passages, included in Appendix
consisted of partitioned passages to be coded by the

86
subjects. Three of the six criterion passages were focus
passages FPI, FP8, and FP12 of the validity study. The
other three criterion passages were contrived passages
CP2b, CP6a, and CP10b. One focus passage and one criterion
passage corresponded to each of the three levels of materi-
als studied in the validity study. The criterion passages
ranged in subject matter over arithmetic, algebra, geometry,
probability, and trigonometry. None of the criterion
passages was taken from the same experimental section as
practice passages used in the training booklet. The order
in which the criterion passages appeared was randomized for
each booklet. This was done to avoid any possible order
effect in the analysis of passage rating difficulty.
Subjects
Three groups of subjects from different populations
were used as CMMT raters in the reliability study. The
groups were
Group 1. Doctoral students and faculty members in
mathematics education.
Group 2. Experienced secondary mathematics teachers
with or near a Master's degree.
Group 3. University seniors preparing to become
teachers of secondary mathematics.
Subjects in group 1 consisted of people working in
mathematics education or recent graduates in mathematics
education from Purdue University, the University of Georgia,

87
and California State Polytechnic College. Subjects in
group 2 consisted of members of Purdue University's 1971
N.S.F. Summer Institute for secondary mathematics teachers.
Subjects in group 3 consisted of Purdue students in Educa-
tion 304S which is a course in the metho.s of teaching
secondar: school mathematics offered during the professional
semester of the senior year. All subjects participated on
an invited basis. There were 15 subjects in each group.
Design of the Reliability Study
Each group of subjects used the training booklet to
learn the use of the CMMT technique. Subjects were directed
to tr'iin themselves by studying the booklet. After this
self-training, subjects were directed to code the criterion
passages on two different occasions separated by an interval
or at least four weeks. Subjects worked individually and
were instructed to spend a maximum of four hours on the
training booklet and one hour on each rating of the criterion
passages. Subjects were allowed the use of the training
booklet for reference during the rating of the criterion
passages. The experimental procedure is illustrated in
Figure 12.
Method of Analyzing the Reliability Data
To obtain between-rater scores, each subject's criterion
passages for trial 1 were scored in terms of the proportion
of kreement with criterion scores based on the most frequent
classifications of the messages in these passages. To

88
Subjects
Subjectsindividuallytrainedusing thetrainingbooklet.
Trial 1:Subjectsratedcriterionpassages.
Fourweekwaitingperiod.
Trial 2Subjectsratedcriterionpassagesagain.
/////Group 1 .
15+
1+
Group 2 .
15+
1+.
i
Group 3 .
15+
Figure 12
Experimental Procedure for the Reliability Study.
obtain within-rater scores each subject's criterion passages
were also scored in terms of the pioporflion of messages
rated the same on both trials. In addition to an overall
score of each type, a between- and within-rater score on
each CMMT dimension was obtained for each subject on each
passage. A computer program was written to score the cri-
terion passages and to compute the KR20 reliability coeffi-
cient for each CMMT dimension of each passage. This program
is included in Appendix G.

89
To assess differences between groups and between the
rating difficulty of passages on each of the CMMT dimensions
in terms of each scoring procedure, four repeated measures
analyses of variance were performed. The design for these
analyses of variance which is given in Winer (1962, pp. 302-
318) is illustrated in Figure 13. Appropriate a posteriori
tests were made when differences among means were found.
Passages
Level 1 Level 2 Level 3
Subjects FP1 CP2b FP8 CP6a FP12 CP10b
Group 1
1-*
.
15+
Group 2
1-*
.
15+
Group 3
1-*
.
15+
Level 1 (grades 4 6).Level 2 (grades 7 9).Level 3 (grades 10 12).Analysis 1: Dimension 1 between-rater scores.Analysis 2: Dimension 2 between -rater scores.Analysis 3: Dimension 1 within-rater scores.Analysis 4: Dimension 2 within-rater scores.
Figure 13
Analysis of Variance Design for Assessing Passage RatingDifficulty and Differences between Groups.

90
For a number of reasons, high levels of performance
were not expected of all subjects. Subjects could not be
expected to be highly motivated in this situation. They
were not required to speAd a great deal of time training
considering the complexity of the task. Further they had
no opportunity to ask questions or -co receive any other
type of live feedback. Hence, it was not expected that
all subjects would become proficient in the technique with
the training they received. Ir order to estimate reliabil-
ity, subjects obtaining proficiency were needed. In an
attempt to obtain such subjects, the top five subjects in
each group were selected on the basis of average overall
first trial scores. These experts from the respective
groups were used to determine reliability estimates.
Between- and within-rater reliability coefficients for
each group of experts were determined for each criterion
passage on each dimension of the CMMT system. This was done
by computing the average Scott reliability coefficients
described in Chapter 3 for each group of experts and each
passage. A summary of all reliability coefficients computed
for each group of experts on each passage is given in
Figure 14.
To complete the reliability study a check was made of
the reliability of the investigator. This was done by
computing the proportion of agreement between the investiga-
tor and the between-rater criterion ratings on each criterion

91
Between-rater Within-rater
Scott
Coefficients
Dimension 1
1
i<j.ff
lij
5
k=1Pik
101 10
Dimension 2
7L
i<j
72ij
5
1k=1
7 2A
10 10
it .. = between-rater Scott coefficient for dimenFian m andmid
expert pair (i,j).
7mk
= within-rater Scott coefficient for dimension m andexpert k.
Figure 14
Summary of Reliability Coefficients Computer for Each Group
of Experts on Each Criterion Passage.
pass,',go. A Scott reliability coefficient was also computed
between the investigator and the criterion ratings on each
criterion passage. These coefficients .sere used to infer
the reliability of the ratings made by the investigator in
the validity study.

CHAPTER V
RESULTS OF THE EMPIRICAL STUDIES
This research concerned the development of the CMMT
technique for studying presentation variables in mathematics
text. The purpose of tho empirical studies was to investi-
gate the validity and reliability of the CMMT technique.
The results of these studies are presented in this chapter.
Results of the Validity Study
The validity results are both descriptive and statisti-
cal in nature. The descriptive results illustrate how CMMT
analysis may be used to describe and compare mathematics
text passages. The statistical results concern the number
of passages which provide an adequate sample from a textbook
section for CMMT analysis, correlational comparisons of the
CMMT analyses of passages within and between textbooks, and
the identification by CMMT analysis of presentation variables
on which textbooks can be differentiated.
Descriptive Results for the Focus Passages
In order to illustrate how CMMT analysis may be used to
describe mathematics text passages, focus passages FP1, FP3,
FPS, FP8, FP11, and FP12 are presented in detail. These
passages are included in Appendix C. In this section, a

93
short description of the level and content of each of the
passages is given. Each description is followed by the CMMT
analysis of the passage described, which in turn is followed
1, a brief discussion of what the analysis shows.
Focus Passage FP1. This passage dealt with the rela-
tionship between sets and division at the Fourth grade level.
It was a one page passage consisting of two simple examples
of how division may be interpreted L. terms of sets, followed
by a set of exercises quite similar to the examples. The
CMS, analysis of focus passage FP1 is given in Table 2.
Table 2
CMMT Analysis of Focus Passage FP1.
Exposition
List.
Dim.1 Dim.2 Weight
Heading
Intro. Statement
Example followedby definition.
Example followedby definition.
....
Heading
100
4
0
3
3
3
0
1
0
3
3
3
0
1
0
100
1
0
1
0
1
3
2
0
1
0
1 13
2 jo
1
0
1
0
Word,illustration,symbol sequence.
Word,F illustration,symbol sequence.
1
3
2
2
4
4
1
2
2
1
4
4
1
2
2
5
1
7

Exercises
94
Table 2. cont.
Exercise f 71 Word, 7I
1 72 symbol 1
0 0 6
1Exercise
7
1 ] Word, S
7 2 symbol. 1
0 0 6
Directions 5 1 2
0 0
Exercise -FL 73 1 Illustration, 5
7 2 symbcl. 1
0 0
1Exercise
7
3 t Illustration, 5
7 2 symbol. 1
Directions 5 1 2
Exercise1 7
1 I Word, 2
7 2 symbol. 1
0 0 1
iExercise
7
1 1 Word, 2
7 2 j symbol. 1
0 0 1
Dimension 1 interaction matrix.
Dimension 1 Categories
1 2 3 4 S 6 7 8 9 10
Dimension
Categories
1
3
4
S
6
7
8
9
10
2
0 0 1
0 0 0
0 0 0
0 0 0 0
0 '0 0 0
0 0 0
0 0 0 1 0 0 1 0

Table 2. cont.
Dimension 2 interac,:ion matrix.
Dimension 2 Categories
1 2 3 4 5 6 7
Dimension
Categories
2
2
3
4
5
6
7
0 5
0
0 0
0 0
3
2
0
,
0
0
0
0
0
0
0 0 0 0
0 0 0
B0 0 0 0
0 0 0 0
0 0 0 0 0 0
Between dimension interaction matrix.
1
2
3
4
Dimension 15
Categories6
7
8
9
10
Dimension 2 Categories
1 2 3 4 5 6 7
4 0 0 0 0 0 0
0 0 0 0 0 0 0
A8 2 8 0 0 0 0
2 0 0 0 0 0 0
4 0 0 0 0 0 0
0 0 0 0 0 0 0
B16 7 15 0 0 0 0
0 0 0 0 0 0 0
0 0 0 0 0 0 0
2 0 0 0 0 0 0

96
Table 2. cont.
CMMT proportions.
Proportion of blank space in total passage
Proportion of each category in non-blank material.
Category
.41
Dimension 1 Dimension 2
1 .06 .542 .00 .123 .26 .344 .03 .005 .03 .006 .00 .007 .55 .008 .009 .00
10 .03
Proportion of exposition in non-blank material .36
Proportion of content development in nen-blankmaterial .36
Proportion of exercises in content development .00
Proportion of exposition in content development 1.00
Proportion requiring responses in non-blankmaterial .61
Proportion of mathematics illustration innon-blank material .34
Proportion of illustration in non-blank material .34

97
The CMMT list for passage FPI revealed that the
passage consisted of two example-definition sequences
followed by I set of exercises. The interaction matrices
showed that there was some interaction among categories on
dimension 1 (10 off-diagonal entries) while there was rela-
tively more interaction between categories 1, 2, and 3 of
dimension 2 (20 off-diagonal entries). The most numerous
messages yere examples (3) and exercises (7) and these two
types of messages were represented in all of the three
basic modes (rows 3 and 7 of the between-dimension matrix).
The UNIT proportions indicated that the content development
was entirely expository and accounted for a little more
than one-third of the passage while the exercises accounted
for a little less than two-thirds of the passage.
Focus Passage FP3. This fifth grade passage concerned
the Commutative Property of addition. It consisted of a
short sequence of developmental questions culminating in a
statement of the Commutative Property. This developmental
material was followed by a set of simple exercises. The
CMMT analysis of focus passage FP3 is given in Table 3.

98
Table 3
CMMT Analysis of Focus Passage FP3.
List.
Dim.l Dim.2 Weight
Heading
Developmental_Exercises
Directions
Generalization --
Developmental _IExercises
HeadinDirections
ExercisesDirections
10 1
0
1
0
5 =1
2
1
0
2
0
1
0
1
2
0
1
2
0
1
1
0
2
1
2 _
RepresentationalIllustration
_Symbol WordCombinations
4
4
6
2
242
1
3
2
3
1
1
3
8
102
6
2
8
1
1
3
8
4
8
0
6
0
6
6
6
6
0
6
0
5
0
6
2
0
6
6
0
105
0
7
5
7

99
Table 3. cont.
Dimension
Categories
1
2
3
4
5
6
7
8
9
10
Dimension 1 interaction matrix.
Dimension 1 Categories
1 2 3 4 5 6 7 8 9 10
'N Q 0 0
A0 0 0 0 0 0 0
0 0 0 0 1 0 0 0 0
0 0 0 0 0 0 0 0 0
0 G 0 0 0 0 0 0 0
0 0 0 0 1 2 0 0 0
Bo 1 o 0 1 0 0 0 1
0 0 0 0 1 0 4 0 U 0
0 0 0 0 0 0 0 I 0 0
0 0 0 0 0 0 0 0 I 0
0 0 0 0 1 1 0 0 0
Dimension 2 interaction matrix.
Dimension 2 Categories
1 2 3 4 5 6 7
0 1 0 0
0 0 0 0
Dimension 2 0 0 0 0
B
0 0 0Categories 4 0 0
5 1 0 0 0 0 0
6 0 0 0 0 0
0 0 0 0 0
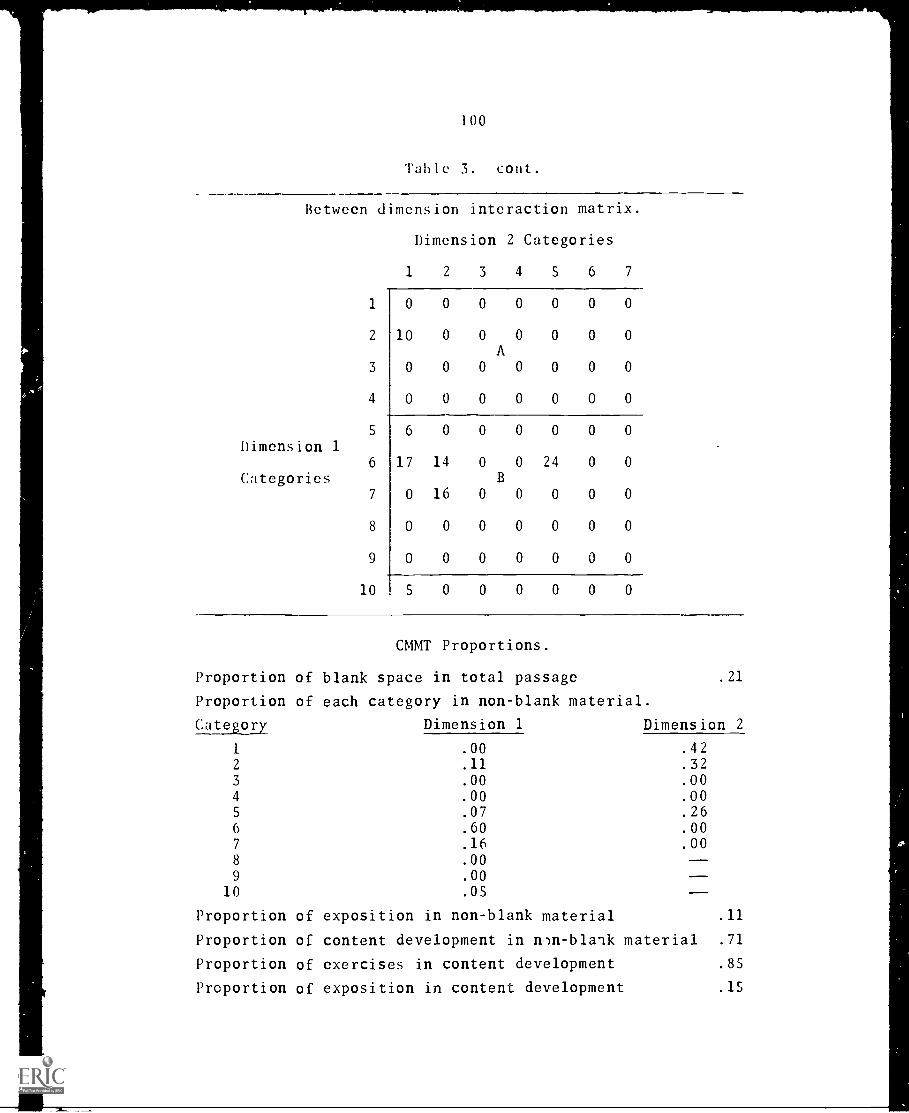
100
Table 3. cont.
Between dimension interaction matrix.
Dimension 2 Categories
1 2 3 4 5 6 7
Dimension 1
Categories
1
2
3
4
5
6
7
8
9
10
0 0 0 0 0 0 0
10 0 0 0 0 0 0
A0 0 0 0 0 0 0
0 0 0 0 0 0 0
6 0 0 0 0 0 0
17 14 0 0 24 0 0
B
0 16 0 0 0 0 0
0 0 0 0 0 0 0
0 0 0 0 0 0 0
5 0 0 0 0 0 0
CMMT Proportions.
Proportion of blank space in total passage .21
Proportion of each category in non-blank material.
Category Dimension 1 Dimension 2
1 .00 .422 .11 .323 .00 .004 .00 .005 .07 .266 .60 .007 .16 .008 .00 --9 .00
10 .05 --
Proportion of exposition in non-blank material .11
Proportion of content development in n)n-blank material .71
Proportion of exercises in content development .85
Proportion of exposition in content development .15

101
Table 3. cont.
Proportion requiring responses in non-blank material .83
Proportion of mathematics illustration in non-blankmaterial .26
Proportion of illustration in non-blank material .26
The CMMT list for passage FP3 indicated that the basic
sequencing of this passage consisted of developmental exer-
cises, generalization, developmental exercises, and compre-
hension level exercises. The matrix for dimension 1 revealed
a number of interactions (10 off-diagonal entries) all
involving categories 5, 6, and 7. While there was little
interaction between illustration and written material shown
in the dimension 2 matrix, there were a number of interac-
tions between word and symbol entries (11 off-diagonal
entries in region A). The between dimension matrix showed
that more than one representational mode was used only in
the case of developmental exercises (row 6). The CMMT pro-
portions demonstrated that the passage consisted of about
15 percent exposition with about 83 percent of the messages
requiring responses. While about 26 percent of the passage
was in the illustrative mode this consisted of a single
illustration.
Focus Passau FPS. In this junior high school level
passage multiplication for rational nuribers was defined.
The passage consiste2. of a series of developmental exercises
interwoven with exposition. Most of the passage was

102
developmental with only a few practice exercises included
at the end. The CMMT analysis of the passage is given in
Table 4.
Table 4
CMMT Analysis of Focus Passage FPS.
List.Dim. 1 Dim. 2
0 0
Heading 10 1
0
4 1
Directions 5 1
6 1
General 4 1
Explanation 6 1 Wordsand Directions 5 1
Developmental 4 1
Exercises 6 1
4 1
0 0
4 1
6 1
Definition 1 1
Explanation --- 4 l
0 0
Example 3 2 Symbols0 0
1 1 WordsDefinition
1 2 Symbols0 0
General lirections 5 1'Explanation 6 1
and Directions 5 1 WordsDevelopmental 4 1
Exercises 6 1
0 0
Definition 1 1
1 2
5 1
6 1
Developmental6 2 Word
Exercises6 1 Symbol6 1 Combinations6 2
6 1
irections 5 1
0 0
Exercises 7 2
irections
Weight123
2
141
5
2
2
1
6
4
6
1
4
2
106
1
602
5
2
5
1
5
2
5
5
1
7
1
1
2
1
4
2
1
5
5
1
4

103
Table 4. Cont.
Dimension
Categories
1
2
3
4
5
6
7
8
9
10
Dimension 1 interaction matrix.
Dimension 1 Categories
1 2 3 4 5 6 7 8 9 10
0
0
1
0
A0
1
0
2
0
0
0
0
0
0
0
0
0
0
0
1 0 0 0 0 0 0 0 0
0 0 1 1 4 0 0 0 0
0 0 0 2 3 1 0 0 0
2 0 0 2 3 0 0 0 0
B0 0 0 0 0 0 0 0 0
0 0 0 0 0 0 0 . 0 0
0 0 0 0 0 0 0 0 0
0 0 0 1 0 0 0 0 0
Dimension 2
Categories
Dimension 2 interaction matrix.
Dimension 2 Categories
1 2 3 4 5 6 7
0 0 0 0 0
0 0 0 0
0
0
5 0
6 0
7
0 0 0 0
B
0 0 0
0 U
0 0
0 0 0
0 0 0 0

104
Table 4. cont.
Between dimension interaction matrix.
Dimension 1
Categories
Dimension 2 Categories
1 2 3 4 5 6 7
1 22 3 0 0 0 0 0
2 0 0 0 0 0 0 0
A3 0 60 0 0 0 0 0
4 43 0 0 0 0 0 0
5 11 0 0 0 0 0 0
6 36 2 0 0 0 0 0
B
7 0 4 0 0 0 0 0
8 0 0 0 0 0 0 0
9 0 0 0 0 0 0 0
10 3 0 0 0 0 0 0
CMMT Proportions.
Proportion of blank space in total pa.,sage .12
Proportion of each category in non-blank material.
Category Dimension 1 Dimension 2
1 .14 .632 .00 .373 .33 .004 .23 .005 .06 .00
6 .21 .007 .02 .00
8 .009 .00
10 .02
Proportion of exposition in non-blank material .70
Proportion of content development in non-blank material .91
Proportion of exercises in content development .23
Proportion of exposition in content development .77

105
Table 4. cont.
Proportion requiring responses in non-blank material .28
Proportion of mathematics illustration in non-blankmaterial .00
Proportion of illustration in non-blank material .00
The CMMT list for passage FP5 showed a varied sequence
of developmental exercises interwoven with general explana-
tion, examples, and definitions. The dimension 1 matrix
showed a number of interactions among seven categories of
the system (24 off-diagonal entries). There were 13 inter-
actions between exposition and messages requiring responses
in this passage (13 entries in the shaded region). The
dimension 2 matrix revealed interactions only between words
and symbols (11 entries in region A). The between dimension
matrix showed that except for the examples which were entirely
symbols the passage was predominantly words. The CMMT pro-
portions showed that the passage consisted of 90 percent
content development of which about 80 percent was exposition.
About 30 percent of the messages required responses. There
were no illustrations.
The CMMT analysis of passage FP5 may be somewhat mis-
leading in one respect. In the passage the examples were
physically isolated from the rest of the passage as shown in
the analysis. However, the reader was referred to the various
examples throughout the developmental material. Thus, there
was really more interaction between examples and other

106
categories than indicated by the analysis.
Focus Passage FP8. This passage concerned the use of
grouping symbols in beginning algebra. The passage consisted
of an expository section, in which general explanation and
examples were interwoven, followed by numerous exercises on
removing parentheses from expressions. The CMMT analysis for
the passage is given in Table 5.
Table 5
CMMT Analysis of Focus Passage FP8.
List.
Dim.1 Dim. 2 Weight
Heading 10
Explanation 4
I--
1 Words6
6
21
0 0
Example 3 2 Symbols 8
Explanation 4 1 Words 11Heading 10 1 1
0 0 7
Example1 3
12
Word, Symbol153
1_
0 0 5
Explanation 4 1 Words 180 0 2
Example-E 33
1} Word, Symbol6
7
__ 0 0 8
Heading 10 1 1
0 0 7
Directions 5 1 Words 4
7 2 12
7 2
Practice 0 0-1-Symbols 1218
0 0- 6
Exposition
Exercises

107
Table 5. cont.
Dimension 1 interaction matrix.
Dimension 1 Categories
1 2 3 4 5 6 7 8 9 10
Dimension 1 0 0 0
Categories 0 0 0
0 0 0
0 0 0
0 0 0 0
Dimension 2 interaction matrix.
Dimension 2 Categories
1 2 3 4 5 6 7
Dimension 2
Categories
0 0 0 0
0 0 0 0
0 0 0
0 0 0 0 0 0
B
0 0 0 0 0 0
0 0 0 0 0 0
0 0 D 0 0 0

108
Table 5. cont.
Between dimension interaction matrix.
1
2
J
4
5
Dimension 1
6
Categories7
8
9
10
Dimension 2 Categories
1 2 3 4 5 6 7
0 0 0 0 0 0 0
0 0 0 0 0 0 0 '4A
9 30 0 0 0 0 0
35 0 0 0 0 0 0
4 0 0 0 0 0 0
0 0 0 0 0 0 0
B
0 30 0 0 0 0 0
0 0 0 0 0 0 0
0 0 0 0 0 0 0
4 0 0 0 0 0 0
CMMT Proportions.
Proportion of blank space in total passage .41
Proportion of each category in non-blank material.
Cate ,or Dimension 1 Dimension 2.00 .47
2 .00 .533 .35 .004 .31 .005 .04 .006 .00 .007 .26 .008 .00
9 .00
10 .04
Proportion of exposition in non-blank material .67
Proportion of content development in non-blank material .67
Proportion of exercises in content development .00
Proportion of exposition in content development 1.00
Proportion requiring responses in non-blank material .30
Proportion of mathematics illustration in non-blankmaterial .00
Proportion of illustration in non-blank material .00

109
The list for passage FP8 revealed an exposition-followed-
by-exercises sequence. The exposition consisted of general
explanation and examples. The dimension 1 matrix shows the
passage contained little interaction between mathematical
messages (only 5 off-diagonal entries for categories 1 - 9).
The dimension 2 matrix showed some interaction between words
and symbols (7 off-diagonal entries in region A). The
between dimension matrix showed only four of the nine mathe-
matical content categories were present with the explanation
consisting entirely of words and the exercises consisting
entirely of symbols. The CMMT proportions indicated about
two-thirds of the passage was exposition and about one-third
was comprehension leve., exercises. The passage was about 47
percent words and about 53 percent symbols with no illustra-
tion.
Focus Passage FP11. This passage from second year alge-
bra developed the definition of fractional exponents. The
passage began with general and specific explanation leading
to the definition. This was followed by some practice exer-
cises with answers which served to complete the development
of the concept of fractional exponents. The passage concluded
with numerous exercises dealing with changing back and forth
between fractional exponent and radical notation and with
evaluating nui..orical expressions containing fractional expon-
ents. The CMMT analysis for the passage is given in Table 6.
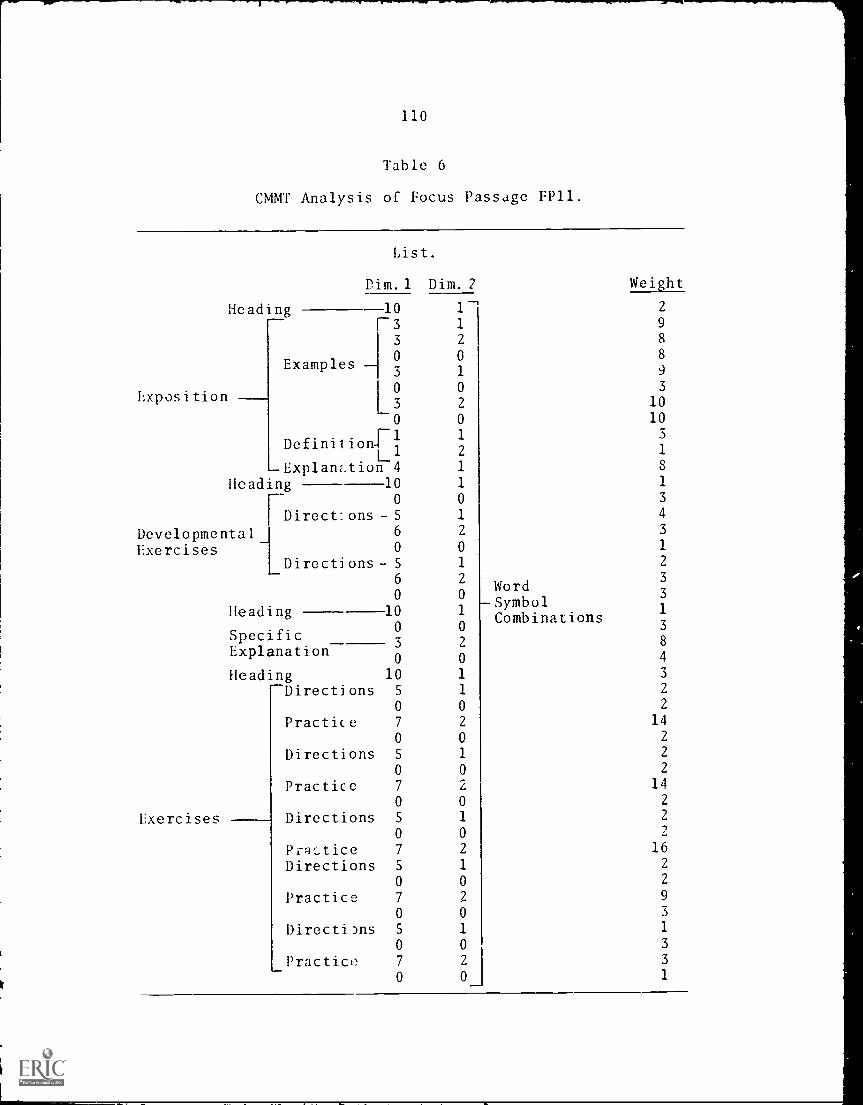
110
Table 6
CMMT Analysis of Focus Passage FP11.
Exposition
List.
Pim. 1 Dim. ?
Heading 10
F-3
]
3
Examples 0
L 3°
0
2
0 0
DefinilionEl
1
2
--ExplanLtion 4 1
1'1
2
0
1
Heading
DevelopmentalExercises
100
Direct:ons -56
0
Directions- 56
0
[leading 10
Specific0
3Explanation
0
Heading 10--Directions 5
0
Practice 7
0
Directions 5
0
Practice 7
0
Exercises Directions 5
0
Prqtice 7
Directions 5
0
Practice 7
0
Directi)ns 5
0
_ Practice 7
0
1
0
1
2
0
1
2
0
1
0
2
0
1
1
0
2
0
1
0
2
0
1
0
2
1
0
2
0
1
0
2
0
WordSymbolCombinations
Weight
2
9
8
8
9
3
10103
1
8
1
3
4
3
1
2
3
3
1
3
8
4
3
2
2
142
2
2
142
21L
162
2
9
3
1
3
3
1

Table 6. cont.
Dimension
Categories
1
3
4
5
6
7
8
9
10
Dimension 1 interaction matrix.
Dimension 1 Categories
1 2 3 4 5 6 7 8 9 10
0 0 1 0 0 0 0 0 0
Ao I 0 0 0 0 0 0 0 0
1 0 0 0 0 0 0 1
0 0 0 0 0 0 0 0 1
0 0 0 0 : 2 5 0 0 0
B0 0 0 0 1 0 0 0 1
0 0 0 0 4 0 0 0 0
0 0 0 0 0 0 0 S 0 0
0 0 0 0 0 0 0 0 0 0
0 0 2 0 2 0 0 0 0
Dimension 2 interaction matrix.
Dimension 2 Categories
1 2 3 4 S 6 7
0 0 0 0
0 0 0 0
Dimension 2 3 0 0 0 0 0 0
BCategories 4 0 0 0 0 0 0
5 0 0 0 0 0 0
6 0 0 0 0 0
0 0 0 0 0 0

112
Table 6. cont.
Between dimension interaction matrix.
Dimension 2 Categories
1 2 3 4 5 6 7
1
2
3
4
Dimension 1 5
Categories 6
7
8
9
10
3 1 0 0 0 0 0
0 0 0 0 0 0 0
A18 26 0 0 0 0 0
8 0 0 0 0 0 0
15 0 0 0 0 0 0
0 6 0 0 0 0 0
B0 56 0 0 0 0 0
0 0 0 0 0 0 0
0 0 0 0 0 0 0
7 0 0 0 0 0 0
CMMT Proportions.
Proportion of blank space in total passage .28
Proportion of each category in non-blank materialCategory Dimension 1 Dimension 2
1 .03 .372 .00 .633 .32 .004 .06 .005 .11 .006 .04 .007 .40 .008 .009 .00
10 .05
Proportion of exposition in non-blank material .40
Proportion of content development in non-blank material .45
Proportion of exercises in content development .10
Proportion of exposition in content development .90
Proportion requiring responses in non-blank material .55
Proportion of mathematics illustration in non-blankmaterial .00
Proportion of illustration in non-blank material .00

113
The CMMT list for passage FP11 reflected a sequence
consisting of exposition, developmental exercises, and com-
prehension level exercises. The dimension 1 interaction
matrix showed there was some interaction among categories
(21 off-diagonal entries) of which twelve were interactions
between categories 5, 6, and 7 (12 off-diagonal entries in
region B). The dimension 2 matrix showed some interaction
between words and symbols (21 off-diagonal entries). The
between dimension matrix showed that only in the case of
examples were both words and symbols used (row 3). The CMMT
proportions indicated that the messages were about 45 percent
content development of which about 90 percent was exposition
and about 10 percent developmental exercises. About 54 per-
cent of the messages required responses. About 37 percent of
the messages were words and 63 percent were symbols. There
were no illustrations.
Focus Passage FP12. This passage from trigonometry
concerned the development of functions relating the time a
particle moves along a square at a constant rate to the
first and second coordinates of the particles. The passage
consisted of exposition followed by exercises and applica-
tions demanding modifications of the developed functions.
The CMMT analysis of the passage is given in Table 7.

114
Table 7
CMMT Analysis of Focus Passage FP12.
List.
Exposition
Dim.1 Dim.2 Weight
Heading 100
3
3
3
3
3
3
3
1 2
0 2
1 --Words 281
4 122
Words, 4
4
1_Illustration, 1
Symbols12
2 41- sequence1
Explanation ---4
Examples
3 4 123 2 4
Explanation 4 1 :-- Words 190 0 1
10 1 1Heading0 0 7
Directions 5 1 Words 1
0 0 3
2 Symbols 6
Exercises Exercises 0
[70 2
and _ 7 1 --Words 4
Problems 0 0 4
8 1 Words 33
Applications8
0
4 Illustration 220 1
8 1 Words 6
0 0 2

115
Table 7. cont.
1
2
3
4
Dimension 1 5
Categories 6
7
8
9
10
Dimension 1 interaction matrix.
Dimension 1 Categories
1 2 3 4 5 6 7 8 9 10f
$ 0
0 9
0
A0
0
0
0
0
0
0
0
0
0
0
0
0
0
0
o 0 , 1 0 0 0 0 0 0
0 0 1 , 0 0 0 0 0 1
0 0 0 0 0 1 0 0 0
o 0 0 0 0 0 0 0 0
B0 0 0 0 0 0 1 0 0
0 0 0 0 0 0 0 0 0
0 0 0 0 0 0 0 0 0
0 0 0 1 1 0 0 0 0
Dimension 2 interaction matrix.
Dimension 2 Categories
1 2 3 4 5 6 7
0 4 0 0 0
0 0 0 0
Dimension 2 3 0
Categories 4 1
S 0
6 0
7 0
0 0 0 0
B0 0 03
0 0 0 0
0 0 0 0
0 0 0 0

Table 7. cont.
Between dimension interaction matrix.
Dimension 2 Categories
1 2 3 4 5 6 7
0 0 0 0 0 0
0 0 0 0 0 0 0
A0 12 0 36 0 0 0
4 47 0 0 0 0 0 0
Dimension 1 5 1 0 0 0 0 0 0
Categories 6 0 0 0 0 0 0 0
B7 4 6 0 0 0 0 0
8 39 0 0 22 0 0 0
9 0 0 0 0 0 0 0
10 6 0 0 0 0 0 0
CMMT Proportions.
Proportion of blank space in total passage
Proportion of each category in non-blank material
Category Dimension 1 Dimension 21 .002 .003 .284 .275 .016 .007 .068 .359 .00
10 .03 --
.11
. 56. 11.00.34.00.00.00
Proportion of exposition in non-blank material .56
Proportion of content development in non-blank material .56
Proportion of exercises in content development .00
Proportion of exposition in content development 1.00
Proportion requiring responses in non-blank material .41
Proportion of mathematics illustration in non-blankmaterial .34
Proportion of illustration in non-blank material .34

117
The CMMT list for passage FP12 demonstrated an exposi-
tion-followed-by-exercises sequencing. The exposition con-
sisted of general explanation which was followed by some
examples which were followed by more explanation. The
exercises consisted of comprehension level exercises fol-
lowed by some application level exercises. The dimension 1
interaction matrix showed that there were few interactions
(only 7 off-diagonal interactions). There were relatively
more interactions on dimension 2 (13 off-diagonal entries)
with eight interactions between written material and illus-
tration (8 entries in the shaded regions). The between
dimension interaction matrix showed that the examples con-
sisted of symbols and illustration (row 3) while the general
explanation consisted of words. Exercises and problems
were presented in all three representational modes. The
CMMT proportions demonstrated that the passage was about SS
percent exposition and 41 percent exercises. The represen-
tation was S6 percent words, 10 percent symbols, and 34
percent illustration.
Descriptive Results for the Contrived Passages
To illustrate how CMMT analysis can be used to compare
and contrast text passages, six pairs of contrived passages
were written following contrasting organizational plans.
These passages are included in Appendix D. In this section,

118
a description or each pair of contrived passages is given.
Each of these descriptions is followed by the CMMT analyses
of the passages in the pair described. The manner in which
these CMMT analyses reflect the planned organization of the
passages in the pair is discussed.
Contrived Passages CP2a and CP2b. These contrived
passages were based on focus passage FP2, which was a grade
five treatment of circur4erence. Contrived passage CP2a
was constructed to contain a high proportion of develop-
mental exercises and a low proportion of explanation.
Exercises were integrated with expository material. Con-
trived passage CP2b was constructed to contain a high
proportion of explanation, no developmental exercises, and
separation of exposition from exercises. An attempt was
made to hold dimension 2 constant over both passages.
The CMMT analyses of these passages are given in Table 8.

119
Table 8
CMMT Analyses of Contrived Passages CP2a and CP2b.
I I fol ( P2.I. I P,t lut ( P21, .
((119),;
IIIII 1
10
0
6
0()
(I
0 in..2
I
0
I
II
3
0
1%(.16111
1
3
3
3
'-
I
1 I 3
6 I I S
o 0
0 u I
0 5 3
0 0 1...,
0 S 3
0 0 -
1 1 t 10:10 5 3
0 (I t>
.19(1I 7
0 0 7
c 101mcnt (1 I60
7
0
19
3
6 1 110 0 -
1 9I 1 1
I 2 1
0 I 4
0 0 .
6 I 5
6 2 4
0 (1 1 I
6 1 130 (( 3
ad 1 lig 10 1 I
0 0 3
S 1 i0 II I
7 i i0 9 3
^ i 3
0 0 3
7 2 1
U 0 1
7 2 1
0 o 1
8 I 4
0 0 I
8 3 4
0 0 4
8 I 7
0 0 1
8 1 9
ri0blew, U II 3
8 I I I
0 0 0N 00 9 C
9I
(/ 0 2
9 19
0 0 59 3 I
0 6 I
,I I I
8
8 1 6
DINI. I Dm 2 Wctb1 1t
Ilcadiug 10 I 1
00 3
4 1 3
0 0 3
1 3 S
0 0 1
I 1 3
4 1 11
1 1 6
0 0 1
3 5 3
0 0 2
3 5 3
o u 2
3 5 3
0 0 6
3 1 9
Ixim.,111011 0 0 8
1 7 130 0 6
3 1 15
0 0 1
2 1 9
1 1 4
1 2 1
3 1 S
0 0 1
2 1 5
2 2 4
0 0 11
4 1 130 0 3
Heading 10 1 1
5 1 2
0 0 127 7 18
0 0 7
5 1 3
0 0 1
7 3
0 (1 3
7 3 3
0 0 3
7 3 3
0 0 3
1 3 3
0 0 3
I xe r l I Se'N 7 2 1
0 0 1
and 7 2 1
U 0 1
Problem-, 7 2 1
0 0 1
7 2 1
0 0 1
8 1 4
0 0 4
8 3 4
0 0 4
8 1 7
0 0 1
8 1 6
0 0,
8 1 11
0 0 6
8 5 7
0 0 8

120
Table 8. cont.
bINIU,I.Alt interaction matrix for CV2a.
Dlion,lon 1 tategories
4
01
21X01
I 2 3
0 0
0 0
4 ll 0 0Pimtnsitan 1
, 0 0 0I it, 10,1 IL
6 1 1 0
7 0 0 0
8 0 0 0
9 0 0
10 0 0 0
5 6 7 8 9 10_-
0 2 0 0 0 0
A00000000 0 0 0 0 0 0
'1/, 0 0 0 0 0 0
0 1 1 0 0 0
0 1 0 0 0 1
0 0 0 1 0 0
0 0 0 0 1 0
0 0 0 0 1
0 1 1 0 0 0
Ilintnsiun 1 intetattion mattlx (0z CP2a
Dimension 2 fategories
1
1
2
2 4
3 3 1
b))in,lon4 0 0
tit gal IC
2 0
0 0
7 1 0
3 4 5 0 7
4 0 2 0 1
O 0 0 0 0
lY 0 0 0 0
O X'0, 0 0
N 11
0 0 13, 0 0
0 0 0 \11. 0N,O 0 0 0 1,
Dimension 1 interattion matrix for LP2b
Dimension 1
tategosies
Dimension 1 Categories
1 2 i 4
0 1 1 0 0 0 0 0
2 1 0 1 0 0 0 0 0
S 6 7 8 9 10
4
5
6
7
8
9
10
0 2 0 0 0 0 0 0
1 0 1 0 0 0 0 0
0 0 0 0 0 2 0 0
0 0 0 0 0 0 0 0B
0 0 0 0 1 0 1 0
0 0 0 0 0 0 0
0 0 0 0 0 0 0 0
0
0
0
0
0
0
0
0
0 0 0 1 1 0 0 0 0
Dimension 2 inteiaction matrix for
Dimension 2
fategories
Dimension 2 Categories
1 2 3 4 5 6 7
3 0 2 0 2
0 0 0 0
0 6 0 0
0 0 0B
0 0 0 0
1

121
Table 8. Cont.
0 I fa
1
t
14,
2
ion
3
mit 714 1,11
I att 1:)'113
4
''.
,
I 0 .1 0 0
000000A
0 U 0 U
400U010 0 0 0 0 0
1 U r 0 19
(1 6 0 ti U 0
1) LI 1, I) (I
2304000011) . 00000
(MM1 6roloitiuns
0 rr.16,1o71 intera,tion matrix i ti.a
11IT.W4.104 1
I it( gOrles
Dimtnsiun 2 rategolit.
3 4
1 7 1 0 0 0
14 4 0 I,
A
1 15 0 0 5
1 .17 0 5 0 0 0
5 5 U 0 U 0 0 0
0 0 0 0 0 0 u 0B
7 (3 4 12 0 0 () 19
8 28 0 4 0 7 0 U
9 0 0 0 0 U U 0
1U 0 0 0 0 0 0
1/ass4,,C (1.4 ra,sage (P2b
Aolt111 Of blank .pkt II) 10141 p,,,age
ul )4,1, t It11.. IN nun blank material
t tit
7
8
9
t rot t 01 Ixpo,111.n in non blank material
ot ,ontent dC))1Cpflit111 14 nun-blank material
11i011 Of tXCI(Ist. in 1.10,11t deelopmtnt
1'I1 Itto0 of expo.iti.n in ,ontent dvelvpmnt
11.1..1t14,11 requilIng rt,pon,t, in hull blank mittlial
11,1;'. rtion 01 mathemati., illu,tration In nun blank material
of /114S1141104 In non blank material
011,1
.04
.040000
0545
0)24
.1S01
08
S3
.84
lb
.91
17
2t,
-1
7
Din, 2
.6,r
04U9
.00U'
00
.09
-Dim 1
04
09.2916
0100
.18
.:0
.00
.01
Sb-
1.21441
61
u!,
11
0008
.00
.16
.59
59
.00
1 00
40
.14
.34

122
The organizations of contrived passages CP2a and CP2b
were reflected by the CMMT analyses of the passages. The
CMMT lists indicated that essentially the same sequence
was used for both passages except that developmental exer-
cises were used in passage CP2a where explanation was used
in passage CP2b. The lists also revealed that similar
sequences of dimension 2 categories are found in both
passages.
The dimension 1 interaction matrices revealed that
passage CP2a contained seven interactions between exposition
and exercises and only one interaction between exposition
categories, while passage CP2b contained one interaction
between exposition and exercises and eight interactions
among exposition categories. These interaction differences
reflected the planned degree of integration of exposition
and exercises in the two passages. The dimension 2 inter-
action matrices showed a high degree of similarity between
the two passages in the interaction of categories in the
representational mode as planned.
The CMMT proportions reflected the planned differences
in quantity of explanation and exercises between the two
passages. Passage CP2a contained less than 10 percent
exposition while passage CP2b contained about 60 percent
exposition. About 90 percent of the messages in passage
CP2a required responses while only about 40 percent of

1 2.3
pJ,,sage CP2b required response-. rhe dimension 2 propor
Lions were approximately the same for both passages.
,Contrived Passages CP4a and CP4b. Those passages were__
based on focus passage FP4 which was a sixth grade passage
on the use of equations and inequalities to solve verbal
problems. Contrived nassage CP4a was constructed to
contain a high proportion of examples and a low proportion
of general explanation while contrived passage CP4b was
constructed to contain no examples and a high proportion
of general explanation. Passage CP4a utilized non-
mathematical motivational illustrations and passage CP4b
utilized illustrations with mathematical content. The
CMMT analyses of these passages are given in Table 9.
k

124
Table 9
CM TT Analyses of Contrived Passages CP4a and CP4b.
(fading
Lxamples
Heading
_.Lit for CP4a.
11im,1 Dim.2 Weight
0 1
0 01 1
0 0
3 2
0 0
3 1
3 2
3 1
0 0
3 1
0 03 2
0 0
3 1
3 2
3 1
0 010 1
0 0
1
1
0
61
060
1
0
60
1
0
b
0
1
2
1
2
1
060
1 3
Directions S
1 8
i 0
10
8
0
10
0
8
0
10
0
8
0
10
0
8
8
8
8
8
0
L 100
Appl 1 t_ations
and
Motivational
Illustrations
i
Words
and
Symbols
2
2
77
1
2
t
I
3
8
I
1
2
4
I
4
3
1
3
4
9
3
12
10
S
11
6
5
5
12
6
11
S
10
6
2
1
1
1
2
0
127
List for CP4b.
Dim. I Dim. 2 Weight
Heading 1
0 0
4 1
0 1.
4 1
0 0
General4 1
4 2
0 0Explanation
4 1
4 2
4 1
4 2
0 0
4 1
0 0
Heading ----- 10 1
0 0
DI rect ions 5 1
I 81
0 08 S
8 1
0 I8 5
0 0Applications 8 1
0 0
and 8 50 0
Mathematical 8 1
0 0
Illustrations 8 50 0
8 1
8 2
8 1
8 2
8 1
0 08 7
0 0
Words
and
Symbols
2
2
7
1
67
4
1
3
2
1
2
1
6
6
2
1
3
4
9
3
1210
5
11
6
5
5
12
6
11
5
106
2
1
1
1
2
6
127

125
Table 9. cont.
01 en,,,r I 16tera.ZIon mart lx foe (1'4a
I. 1 ' .t I
r. r I
'I!, r11 Ih
if( gl,t t
7
9
litin,w,lon I Lategolle,,
1 i 4 S 6 7 8 9 IU
XO 0 0 0 0 0 071-0
U. U 0 0 0 0 0 U
A
O U it& 0 0 0 0 0 0
II ek 0 0 a 0 0
\-7--000\0010O 0000\00u
\ 0O 0000U\OUU 0 0 0 0 0 0 0
0 0 0 0 U 0 0 0
10 U U 1 U 1 0 0 4 0
znte,:s,ttol. ,,.trix toz 1.1
Dillensiu6 2 iJtegories
I i I 5 6
1 6,71 A 6T00050G 0 0 0 0 0
0 0fi ti 0 0 0
4 1 u 0 0 0 U 0
U 0 0 1) V U
G I 4 0 0 I) U 0
0 0 0 0 0 0 0,
0
0
0
0
0
Dimx.,01, I intexa,tix.., matrix !of CP46
Bimea.166 1
UatlgUl 1T'5
3
4
5
8
9
10
l'Imen,,Ion I (xtegories
1 : 3 4 5 6 7 8 9 10
I
0 0 0 0 0 0 0 010
O 0 0 0 0 0 0 1
A0 0 0 0 0 0 0
0 0 0' 0 0 0 0 0 1
0 0 0 0 0 0 1 0 1 0
0 0 0 0 0 "0 0 0\ B0 0 0 0 0 0 0
010
0100 0 0 0 0 0 0 0
O 0 0 0 0 0 0 0\\
0 0 0 1 1 0 0 0 0
Dimension 2 interaction matrix for ,21)46.
Dimenslom 2
Lategorivs
Dimen.106 2 (Jtegoxiet,
1 2 3 4 S o 7
I %Ity\A s 0 0 4 0 1
2 5 N01000003 0 0 0 0 0 0
4 0 0 0"V
0 0 0B
5 4 0 0 0 4'i 0
6 0 0 0 0 ()NB 0
0 0 0 0 0 0 11,

126
Table 9. cont.
- - ---------- ---- - TBetween Dimension interaction matrix for CP4a. Between Dimension interaction matrix for LP4b.
Dimension 1
Iategories
Dimension 2 Categories
1 2 3 4 5 6 7
1 0 0 0 0 0 0 0
2 0 0 LI il U 0 0
A3 27 4 0 U U 0 0
4 U 0 0 0 U 0 0
5 4 C 0 0 0 0 0
6 0 0 0 0 0 0 0
B
7 0 0 0 0 0 0 0
8 40 2 0 0 0 0 0
9 0 0 0 U 0 0 0
10 3 0 0 0 0 57 0
Dimension 1
lategories
Dimension 2 Categories
1 2 3 4 5 6 7
1 0 0 0 0 0 0 0
2 0 0 0 0 0 0 0
A3 0 0 0 0 0 0 0
4 27, 3 0 0 0 0 0
5 4 0 0 0 0 0 0
6 0 0 0 0 0 0 0
B
7 0 0 0 0 0 0 0
8 40 2 0 0 45 0 12
9 0 0 0 0 0 0 0
10 3 0 0 0 0 0 0
CMM[ Proportions
Proportion of blank space in total passage
Proportion of each category in non-blank material.
lategoly
1
2
3
4
s6
8
9
10
Passage CP4a Passage CP4b
.33 .33
Dim 1 Dim. 2
.U0 54
.00 .04
.23 .0000 .00
.03 00
.00 .41
.00 .00
.31
.00
.43
Dim. 1 Dim. 2
.00 55
.00 .04
.00 .00
.22 .00
.03 .33
.00 .00
.00 .08
.73 -
.00
.02
Proportion of exposition in non-blank material
Proportion of content development in non-blank material
Proportion of exercises to content development
Proportion of exposition in content development
Proportion requiring responses in non-blank material
Proportion of mathematics illustration in non-blank material
Proportion of illustration in non-blank material
.23
.23
.00
1.00
.34
.00
.41
.22
.22
.00
1.00
.76
.42
.42

127
The CMMT lists for contrived passages CP4a and CP4b
revealed the similar sequential nature of the two passages.
These lists were almost identical with dimension 1 cate-
gories 3 and 10 and dimension 2 category 6 in passage CP4a
replaced by dimension 1 categories 4 and 8 and dimension 2
categories 5 and 7 in passage CP4b. The interaction
matrices revealed little difference between the two passages
on either dimension with the exception of nine interactions
between the exercises and motivational illustrations on
dimension 1 in passage CP4a.
The major differences between these passages were
reflected by the CMMT proportions. Passage CP4a contained
about 22 percent examples and no general explanation,
while passage CP4b contained no examples and about 22
percent general explanation. The dimension 1 proportions
also showed that in passage CP4a about 33 percent of the
messages required responses, while in passage CP4b about
75 percent of the messages required responses. This
difference was a result of the fact that the illustrations
were of a non-mathematical nature in passage CP4a, but
contained mathematical information which could be used in
the solution of the problems in passage CP4b. The dimen-
sion 2 proportions revealed that word and symbol content
were nearly the same for both passages. Both passages
consisted of about 40 percent illustration, but in

128
passage CP4a these illustrations were motivational while
in passage CP4b 33 percent were illustrations of physical
situations and about 8 percent were tables.
f:ontrived Passages CP6a and CP6b. These passages
were based on focus passage FP6 which was a junior high
treatment of the probability of the event A or B where
events A and B have given probabilities. Dimension 1
categories were held constant in the construction of
these passages. Passage CP6a was constructed to contain
high proportions of symbols and illustrations and low
proportions of words,. Passage CP6b was constructed to
contain high proportions of words and few symbols or
illustrations. The CMMT analyses for these contrived
passages is given in Table 10.

129
Table 10
CMMT Analyses of Contrived Passages CP6a and CP6b.
Ht td,ag
its: for I P6,1
DIM 1 D:11 _2
10
r 3
1
o I- hords1
0 0
3 S Illustration0 0
3
O 03
fi 2
Weilht1
0 0
3 1
3 2 - Words Symbol s3 1
3
0 t/
3 I
1 1
0 0
3 1
3 5 Illustration0 0
3
0 (1
<, 2
0 03
3
1
-
3 I
1
,
0
3
0
1
lAplanati41 --- 4 1
0 0
fa sit tali: it 100 11
2.2
0 0Ixridndtlufl -- 4 1
0 0
1,eh11jIlIat1( 1 11
, llittn1
1
20 n o
II
2{
(a.,,er,lization f 2.
1
lb .:ding --- 100 0
8
aL II
8 i
b
8
o tr;
Npvio.ati.ns 8 I
0 0
bi I
8 2
8 I
0 08
0 0
8 1_
0 0
8 1
Woids, Symbols
3
4
5
s6
1
1
6
4
3
3
8
G
4
ss2
si
3
s3
1
2
2
8
s3
3
3
s3
1
3
1
1
I
3
1
1
Illustration 16
8
hords, Symbols
5
Illustration 4
14
1
Words, Symbols 3
3
8
19Illustration 14
4
10Words, Symbols 10
4
- . - - , -- ---1ist fol CP6b.
Dim I in
Heading
Ixamplef
9uestion
Ixamples
tDelinItIon
Ixample .......
Ixplanation
GeneralizatIonlAplanation
LineializatfunDetinition ---ftneraIizationHeading --
Appl1LatIolls
L
/'el/.1.kt
10 1 1
0
3
1
0
]2
Words
symbols
3
12
1
0 11
3 1 ._2
0 0
3 1 9
1 1 6
0 0 1
3 1 484 1 5
0 0 3
2 I 8
4 1 5
0 0 3
2 1 3
1 1 4
- I 9
10 1 1
0 0 3
8 1 24o 0 168 1 130 0 118 I ,- Wards 11
0 0 9
8 1 G
0 0
8 I 100 0a 1 150 0 1
8 1 3
0 0 3
8 1 3
0 0 3
8 1 3
0 0 1
8 A 3
0 0 1
8 I 3
0 0 1
8 i 4

130
Table 10. cont.
lumens Ion 1 interaction matrix for CP6a.
I) 1 11R n%lun I
1 a (461 lc,
1
2
3
4
5
6
7
8
9
10
Dimension 1 Categories
1 2 I 4 5 6 7 8 9 10
1 1 0 0 0 0 0 0 0
1 1 0 1 0 0 0 0 01 1
A1 0 1 0 2 0 1 0 0
0 2 0 0 0 0 0 0 0
0 0 0 0 0 0 0 0 0
0 0 2 0 0 0 0 0 0
13
0 0 0 0 0 0 0 0 0
0 0 1 0 0 0 0 0 0
0 0 0 0 0 U 0 0 0
0 0 1 0 0 0 0 1 0
DI iliCIIN I 011 2 interaction matrix for CP6a
Pit HR ny 1011 2
( .tcgt.: les
1
2
3
4
5
6
7
Diniension 2 Categories
1 2 I 4 5 6 7
' A 12 0 0 4 0 0
15 0 0 1 0 0
0
0 0
1 4
U 0
0 0
14 0 0 0 0
0 '..4.t,, 0 0 U
U 0 \11( 0 0
0 0 U 14, 0
U U U 0 \Q,
Dimension 1 interaction matrix for CP6b.
Dimension 1
Categories
Dimension 1 Categories
1 2 3 4 5 6 7 8 9 10
1 1 1 0 0 0
2 1 1 0 1 0 0A
3 1 U 1 0 1
4 0 2 0 0 0
0 0 0
0 0 0
0 0 0
0 0 0
5 0 0 0 0 0 0 0 0
6 0 0 1 0 0 0 0 0
B7 0 0 0 0 0 0 0 0
8 0 0 0 0 0 0 0 0
9 0 0 0 0 0 0 0 U
10 0 0 1 0 0 0 0 1 0
Dimension 2 interaction matrix for CP6b.
Dimension 2 Categories
1
2
1 2
2 A l
3 0 0Dimension 2
4 0 0Categories
5 0 0
6 0 0
7 0 0
3 4 5 6 7
0 0 0 0 0
0 0 0 0
0 0 0 0
0 0 U 0B
0 0 1, 0 0
0 0
0 0 0 0
0
1
U
0
0
0
0
0
0

131
Table 10. cont.
11t$.«.11 Dimersion interartion matrix fot (P6a
I) I bo n, inn 1
ategoltrs
D Imens n (ategoric
1 2 i 4 5 6 7
1 8 0 0 0 U U
2 7 6 0 0 U 0 0
A3 36 18 0 0 10 0 0
4 10 0 0 0 I) 0 0
5 0 0 0 0 0 0 0
6 0 2 0 0 0 0 0
7 U 0 0 0 0 U 0
8 16 27 0 0 3.1 0 U
9 UOUUOUU10 2 0 0 0 U 0 0
Between Dimension Interaction motrix tot (PO,
Dimension 1
Categolles
INth11 Plopoltlkol.- - -*-
Pt po t 1 on of blank spa.r in total passage
Piupoition of eaxh category in non-blank mateilal
lategoly
3
4
5
7
910
1
3
4
5
6
7
9
10
Dimension 2 Cat,g,ries
1 2 1 4
10 0 0 0 0 0 U
20 U 0 0 0 0 0
A
91 1 U 0 0 0 0
10 0 0 0 0 0 U
0 U 0 0 0 0 0
3 0 0
0 0 0
98 0 0
B
0 0 0 U
0 0 0 U
0 0 0 0
0 0 0 0 0 0 0
2 0 0 0 0 U
Passage LP6a
.39
Dm 1 Dim. 2
06 .4407 31
.36 .0006 .0000 .2501 .U000 .00.41
00.01
Passage CP66
30
Dim. 1 DIni 2
,0408.39.04.0J.0100.41
.00
.01
Plopoitiun of exposition in non blank material
Ploportion of content development in non-blank material
Piopoition of exercises in content detlopment
PiopolliOn of exposition In ,Ontent development
riopoition re.foiring responses in nun blank matelial
riopwftion of m,,thematirs Illustration in non-blank material
Viopultion of illustiation in nun blank material
.55
.56
02
.98
.44
25
.25
.56
.58
.02
.98
.43
.00
.00
.9901
20
000000.00

132
The CMMT lists for contrived passages CP6a and CP6b
demonstrated that the two passages followed almost iden-
tical sequences on dimension 1. The lists showed that
passage CP6a consisted of combinations of words, symbols,
and illustrations on dimension 2, while passage CP6b was
almost entirely words.
The interaction matrices for the two passages supported
the contention that the passages are similar sequentially
on dimension 1. The larger entries on the diagonal of the
dimension 1 matrix for passage CP6b indicated that the
passage with high word representation took up more area
than the passage in which symbols were used. The dimension
2 interaction matrices demonstrated the differences
between the representational natures of the two passages.
In passage CP6b there were only two interactions between
words and symbols. The between dimension interaction
matrices also showed these representational differences
between the two passages.
The CMMT proportions for the two passages demonstrated
that the passages are very similar on dimension 1. On
dimension 2, passage CP6a was about 44 percent words,
31 percent symbols, and 2S percent illustration. Passage
CP6b was over 99 percent words.

133
Contrived Passages CP7a and CP7b. In these passages
an attempt was made to vary the dimension 1 sequence and
hold all other aspects of the CMMT analyses constant.
The passages were based on focus passage FP7 which was
concerned with the development of some consequences of
the axioms of affine geometry. In passage CP7a proofs
preceeded statements of the theorems, resulting in a
series of 4,2 sequences. In passage CP7b statements of
the theorems preceeded the proofs, resulting in a series
of 2,4 sequences. The CMMT analyses of these passages
are given in Table 11.

134
Table 11
CMMT Analyses of Contrived Passages CP7a and CP/b.
I 1 ( i .1 ( r).1).1
Dm I Om Z WkliOlt
IA;Imiatlun
10
0
1
4
1
1
1
5
1
2
I
Kurds
1110,1rJtion,
2
114
4
1
61 2 Woids, Symbols 1
4 1 5
0 0 1
2 1 Wozds 4
0 0 4
4
4
1
1
1 Illw,tralion,1 Woids
1012
0 0 2
: 1 Words 4
4
4
4
3
1
2
Illostiation,r1 Woids, Symbols
107
2
4 1 j 100 0 3
2 1 Wu I ds 4
4 3 164 1 8
4 2 Illustration, 2
4 1 holds, Symbols 1
4 2 1
4 I 84 2 2
4 1 2
4 2 1
4 1 S
0 0 2
2 1 holds 60 0 2
10 1 Words 1
0 0 3
, I 20 0 29 1 00 0 2
9 1 Words 100 0 2Q 1 6
0 0 2
9 1 60 0 2
List for (l'7b.
Dim 1 Dim 2
litading 100 0
6snelalization 2
0 0
!:'!"1,111
1 Words 2
2
1 Woids 5
34 3 10
1
4 1 Illustiation, 4
Igplanatiun4
4
-
1
1
Words, Symbols1
64 2 1
4 5
0 0 1
6eneralization 1 Words2 4
1 xplanat Ion 3 1 IllustrJtion, 10
i
4
4 1 Words 110 0 3
GeneializatIon 1 1 Words 4
4
an
{
4
4
} Illustration,
2
1
Words, Symbols
10
Ixplation4
7
2
10U 0 3
6enelalizatiun 2 1 5
0 0 3
4
4 3Illustration, 16
1 11Isplanation 4
4
2Words, Symbols 2
1 1
4 2
Heading Words
1
4 1 131 1
0 0 35 1 2
0 0 2
9 1 60 0 2
1'1°61(4ns 9 1Words 10
0 0 2
9 1 00 U 2
9 1 60 0 2
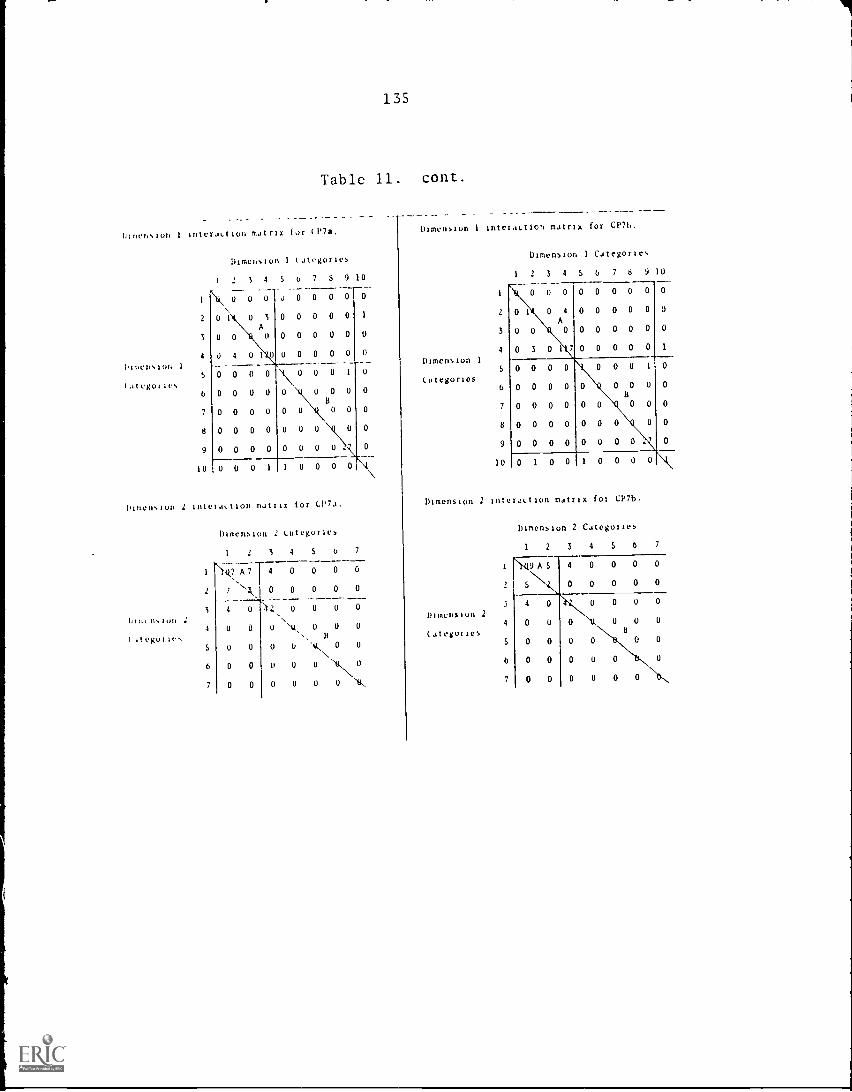
135
Table 11. cont.
Dinwhsion 1interation m.itrix for 1P7a.
Dimension 1
(Ategosies
Dimension 1 iaiegories
1 2 3 4 S 6 7 8 9 10
1 Ib, U U U J 0 0 0 0 0
2 1 D 1 II 3 1
A
3 1 0 0 0 0
0 0 0 0 0
0 0 0 0 0
0 0 0 0 0
0 0 0 1
4 U 4 0 1
5 0 0 0 0
0 0 0 0
7 0 0 0
8 0 0 0 0
9 0 0 0 0
0 0 0
B
0 0
0
0
0
0
0
10 1 0 0 0 1 1 0 0 0 0
Dimension 2 inteiattion matrix for CP73.
111111l n 1011 2
ilegutivs
3
4
5
6
Dimension 2
1 2 3
Cutegottes
4 5 6 7
q7 A7 4 0 0 0 0
Nk 0 0 0 0 0
4 0 ,s1. 0 0 0 0
0 0 0 0 U
0 0 0 U
N., If
0 U
0 0 '0 0
0 0 0 0 II U
Dimension 1 interaction matrix for CP7b.
Dimension I
tategOrlOS
Dimension 1 Categories
1 2 3 4 5 6 7 8 9 10
1 0 0 0 0 0 0 0 0 0
2 0 1 0 4 0 0 0 0 0 0
A
3 0 0 0 0 0 0 0 0 0
4 0 3 0 1 7 0 0 0 0 0 1
5 0 0 0 0 0 0 0 1 0
6 0 0 0 0 0 0 0 0 0B
7 0 0 0 0 0 0 1 0 0 0
8 0 0 0 0 0 0 0 1 0 0
9 0 0 0 0 0 0 0 0 0
10 0 1 0 0 1 0 0 0 0
Dimension 2 interaction matrix for CP7b.
Dimension 2
letegottes
Dimension 2 Ciitegolies
1 2 3 4 5 6 7
1 \l'A9 A 5 4 0 0 0 0
2 5\2, 0 0 0 0 0
3 4 0 0 0 0 0
4 0 0 0 \11, 0 0 0
5 0 0 0 0 0 0
6 0 0 0 0
7 0 0 1 0 0 0 0

136
Table 11. cont.
hih,11,160 inte1.1.11on 1: IP7d
Innis UN I oil 1
1,all gui It,
111t. II> ON 2 I ti gui It
I S 1 S
I U U u U u 0 U
2 18 U U U U U
ASUCuUUUU4 68 lu 16 t1 U U u
2 U u U 0 0 0
U 0 U U U U U
7 UU U U tl U U
SUUUUUU09 2.8 0 0 U U U U
IU 3 0 U U U U 0
I tt It u1,01 t I LAIN
Pinpultom ul blank ,pa,, In tutal pa,,age
Plopectton ul eALli Lati.gyty an HUH btank mitctial
1
4
lattguly5
6
7
9
1U
Olmen5lon
(ateguliv,
Clupottlun 01 exp05itlun in hull blank mater;d1
Plopoitlun ul tuntent Jevelopment In nun blank MJtellai
Ptupurti,n ut exetLises In Lonteit development
I Input hull UI expuSi t uh ut tuiltviLt development
Pruputtiun requiting respunse5 In nunblank mdtetlal
Pluputtion ul mathematiL, Illu,tratlun In nunblank material
ptuputtlun ul illubtratiun In hVb-blunt. mJterial
3
4
7
9
IU
inttiaLt!on motrIx tut trb.
Ditlitn,lun 2 lat,golles
1 2 i 4 C 6 7
0 0 0 0 0 U 0
18 U U 0 U 0 0
AOUOUOU68 7 40 0 U U U
2 U 0 0 U 0 U
U U U U U U U
8OU 0 0 0 UUO 1 0 0 U 0 U
211 0 0 0 U U U
3 0 U 0 0 0 U
Pa8Ndge C[
P7d l'a,,age 076
14 .14-
lIla> I qim 2
OU 6810 .06UO 26.71 UU
.U1 UUUU UU00 .UUU0l5
02
DIM I l2±12.1.
,UU .69.1U .U4
.00 .27.71 .U0.UI .00.00 .OU.00 .OUOU
.16
.U2
82
.82
U0
1.00
17
.26
.26
.81
81
.00
1.00
.17
,27
.27

137
!'he CMMT lists for contrived passages CP7a and CP7b
showed the sequential nature of the two passages was as
planned. The matrices and the CMMT proportions for both
passages were very similar in each case. This demon-
strates that the sequential natures of these passages were
different but other aspects of the presentation were the
same.
Contrived Passages CP9a and CP9b. These passages
were contrived from focus passage FP9 which concerned the
development of the definitions of cartesian products and
relations at the high school level. Passage CP9a was
const.ucted to contain high proportions of definition,
generalization, and general explanation and a low propor-
tion of examples. Passage CP9b was constructed to contain
low proportions of definition, generalization, and general
explanation and a high proportion of examples. In passage
CPila, exercises were integrated with exposition. In
passage CP9b, all exercises followed the exposition.
Dimension 2 was held constant over both passages. The
CMMT analyses for these passages is given in Table 12.

138
Table 12
CMMT Analyses of Contrived Passages CP9a and CP9b.
Iist
Dim
fit .iding 10
0
f 3
3
Ixamplts 3
3
3
Deflnition ---- 1
1 3
3
3
3
3
3
txamples 3
3
3
3
3
3
0
IAILISt! 1s
L0
3
1xdmples 4 0
l3
Definition ---- 1
Iii acting1
3
3
0
1xerxtses I,
, 0L 7
0r 3
0
3
3
i ',amid es C
3
3
3
3
3
3
0
3
L 316 111,1E106 --- 1
!xeR isrs
htselopr,ntal:xercises
ix,1,1ss
0
7
7
3
0
3
0
3
3
1
3
3
3
0
7
fol LP9a. List
Dim 1
for CP9b.
Dim 2 height
1 ' heading - - -10 1 1 20 o 0 2
2 LxplandtIon -- 4 1 151 o 0 I2
1
2
1
r 1I
De f int t ton 1 1
1
2
2
2
2
1 4L 1
o1
o4
81 2 Lxplanation 4 1 4
Lenerdlizatton 22 2 2 3
1 0 0 1
2 4 2 51 Ixplandtion j 0 0 3
2 2 L 4 2 4
1 1 1 2
2 Definition i 1 2 1
1 1 1 1 2
2 o o 7
1 1 4 1 7
2 1 Lxplanation 4 2 I0i 4 Definition --
4
1
1
1
2
2
2 9 4 1 10o 11 0 0 22 4 4 1 1
0 4 4 2 1
2 1 4 1 5
1 3 lxpldndtio 4 2
2 3 1Words, Symbols
1 2 4 2 1
0 4 1 1
1 4 2 1
0 3 : 1 2
1 5 o 0 30 3 Wedding 10 1 1
2 4 0 0 3
0 4 5 1 4
2 1 7 2 91 3 0 0 72 1 7 1 51 0 0 0 3
0 Words, 1.,,,nbols 1 7 1 5
2 I 1 0 0 31 1 , 1 3
1 IXerelSCS 0 0 .1 2 7 1 30 3 0 0 1
2 1 5 1 61 0 0 2
1 2 90 0 0 111 6
6
0Dexclopmental0Ixen.ises
L 6
1
2
1
9
5
2 9 I
7
7
1
2
3
1
151xer.ises i
. 1 31
i
i 0 0 1
0
2 3
0 1
2 1
1
3
1 1
2 1
1
1
2
1
3
1

139
Table 12. cont.
1 iwon,10n 1 intelJ,tion m,1110 !of (P9a
1)1.1.11' Ion
(,11. go.
0imens:vn 1 lategurle9
1 2 3 4 5 6 7 8 9 10
0 3 0 0 010 0 0
2 0 6 0 0 0 0 0 0 0 U\ A3 4 0 HT U 1 1 1 0 0 0
4 0 0 0 11, 0 U 0 0 0 0.,._
5 0 0 0 0 \ 0 2 0 0 0
6 0 0 0 0 0 11 1 0 U 0
7 0 0 3 0 1 0 l'hB
0 0 0
8 0 0 0 0 U 0 011U 09 0 0 0 0 0 0 0 0 1,k 0
10 0 0 1 0i 0 0 0 0 0 1\1\
Dinension 1 intelat_tion nwtrix for LP96
DImen106 1
(a1c101115
1
2
4
5
7
8
9
10
DImension 1 (ategorles
1 2 3 4
0 0 3
0 0 1
A0 0 0
3 1 0
0 0 0 0
0 0 0 0
0 0 0 0
0 0 0 0
0 0 0 0
S 6 7 8 9 10
0 0 0 0 0 0
0 0 0 0 0
0 0 0 0 0
0 : 0 0 0
0 2 0 0
01 1001 01
0 0 0 0
0 0 0 0
0 0 0 1 1 0 0 0 0
Jnsloh ,rIter.ILtlun rmtrIx tor LP9a Pimenstun 2 interaction matrix for CP9b
111'aen.104 2 Categorles
1 2 3 4 5
A2 22 40\ 0 0 0
3 0 0 0 0 0!,111:,,lov 2
4 0 0 J .i1 0
14.+0111,
5 0 J u 0 0
6 6 0 0 0
0 0 0 0 0
6 7
0 0
0 0
0 0
U 0
11.
0 N18,
Olmension 2
Latugo:its
1
3
4
7
DirnensiGn 2 Categories
1 2 3 4 5 6 7
0 0 0
0 0 0
0 0 0
0 0 0, B
0 0 '11 0
0 0 0 0
0 0
0
0
1
0
0
0
0
ti

140
Table 12. cont.
btrween Dimension interaction matrix for CP9a
Dimension 2 Categories
between Dimension interaction
Dimension 2
matrix
Categories
for CP96
1 2 3 4 5 6 7 1 2 3 4 5 6 7
12 0 0 0 0 0 0 1 12 3 0 0 0 0 0
0 0 0 0 0 0 0 2 0 3 0 0 0 0 U
A A
3 49 41 0 0 0 0 0 3 0 0 0 0 0 0 0
4 0 0 0 0 0 0 0 4 51 14 0 0 0 0 0
DIMPDSIon Dimension 1
10 0 0 0 0 10 0 0 0 0 0 00 0 5
Categories Categories6 10 2 0 0 0 0 0 6 14 2 0 0 0 0 0
B B
7 22 19 0 0 0 0 0 22 19 0 0 0 0 0
8 0 0 0 0 0 0 0 8 0 0 0 0 0 0 0
9 0 0 0 0 C 0 0 9 0 0 0 0 0 0 0
10 2 0 0 0 0 0 0 10 3 0 0 0 0 0 0
CMM1 Proportions Passage CP9a Passage CP9b
Proportion of blank space in total passage .33 .28
Proportion of each category in non-blank material. /Jim._ 1 Dim. 2 Dim. 1 Dim. 2
1 .07 .63 .10 .73
2 .00 .37 .02 .27
3 .54 .00 .00 .00
4 00 .00 .43 .00
Category5
6
.06
.07.00.00
.0711
.00
.00
7 .24 .00 .26 .00
8 .00 -- .00
7 .00 .00 -10 .01 .02
Proportion of exposition in non-blank material .61 .55
Proportion of content development in non-blank material .69 .65
Proportion of exercises in content development 10 .16
Proportion of exposition in content development .90 .84
Proportion requiring responses in non-blank material .37 .43
Proportion of mathematics illustration in non-blank material .00 .00
Proportion of illustration in non-blank material .00 .00

141
The CMMT lists for contrived passages CP9a and CP9b
revealed that exercises were interspersed throughout passage
CP9a while they all came at the end of passage CP9b. The
lists showed that passage CP9a was high in example content
while passage CP9b was high in other types of exposition.
The CMMT lists for both passages showed a mixture of word
and symbol representation with no illustration.
The dimension 1 interaction matrices showed that
passage CP9a contained seven interactions between exposition
and exercises while passage CP9b contained only one such
interaction. This reflected the plan to integrate exercises
with exposition in passage CP9b. The dimension 2 interaction
matrices showed the passages were somewhat similar on dimen-
sion 2. Only regions A in these two matrices contained
entries. Passage CP9a appeared to have more 'nteractions
between words and symbols than passage CP9b. This resulted
from the integration of the exercises with the exposition
in passage CP9a. Regions A of the between dimension
matrices also revealed the planned differences in types of
exposition between the two passages.
The CMMT proportions shoed that passage CP9a contained
about 61 percent exposition while passage CP9b contained
about 5S percent exposition. Passage CP9a was over 50
percent examples while the exposition in passage CP9b
contained no examples. Passage CP9b had 43 percent of its

142
messages requiring responses while passage CP9a had 37
percent of its messages requiring responses. This slight
difference resulted from the fact that there was more space
devoted to exposition in passage CP9b and not to an absolute
difference in the quantities of exercises.
Contrived Passages CP10a and CP10b. These passages
were based on focus passage FP10 which was a development
of the concept of the mean proportional and the Pythagorean
Theorem. Contrived passage CP10a was constructed to contain
a high proportion of exposition and a low proportion of
exercises and problems. In this passage illustrations were
grouped separate from the written text. Contrived passage
CP1Ob was constructed to contain a low proportion of exposi-
tion and a high proportion of exercises and problems.
Illustrations were integrated with written text. Other
aspects were held constant between the two passages. The
CMMT analyses of these passages is given in Table 13.

143
Table 13
CMMT Analyses of Contrived Passages CP10a and CP10b.
Heading
Ixplanatton
Duttnttiun
txplanation
List for CP10a. LiNt for CP10b.
Dim. 1 Dim 2
- 100
4
4
4
4
4
0
1
1
4
4
4
1
0
2
1
2
1
2
01
2
1
2
1
0 0
1
0
1
2
1
2
1
2
1
2
0
1
2
1
Gtoeraltzation - 2
0
4
4
4
4
4
1xplanation 4
4
4
o4
4
4
0 0Generalization-- 2 1
0 0
4 1
0 0
4 1
1xplanatiun 0 0
4 1
4 2
4 I
4 2
4 1
3 1
3 1
3 1
3 2
0 03 1
Ixample, 3 2
3 1
3 2
0 0
3 1
3 2
3 1
3 2
0 0
txplanatiun 4 3
4 3
Heading ---- 1 10 1
0 0
7 1
7 2
txercises 0 0
7 1
0 0
7 3
Weight
3 Heading1
1
5
1Definition
1
3
1
4
1
5
1
2
3
9
3
i
1
1
2
1
6
2
4
1
2
3
2
7 Heading1
231
17
3
6
5
1
4
8
2
1
1
4
4
2
1
1
3
5
5
2
1
3
9
24
601
3
5
5
18
8
4
36
Words, Symbols
1 Illustration
Words, Symbols
Illustzation
Dim. Weight
1
0
1
2
1
2
1
2
0 0
Ceneralization- 2 1
0 0
4 3
4 1
Explanation 4 2
4 1
4 2
4 1
0 0
Generalization- 2 1
0 0
4 3
4 1
4 2
Explanation 4 1
4 2
4 1
4
Lxercises
Applit.ation
Analysis
1
L
4
0
9
9
0
9
e9
0
9
0
9
0
9
9
9
9
3
0
C 90
2
1
0
1
0
1
2
Words, Symbols
3
1
2
1
2
1
1
1
4
9
4
Illustration 11
1
1
2
Words, Symbols 1
2
S
7
2
Illustration 11
1
3
1
- Words, Symbols 1
1
S
S
3
Words 3
1
S
1
0 6
2 - Symbols 4
0 12
2 1-0 4
3 - Illustration 100 S
2 - Symbols 1
0 2
3 - Illustration 8
0 5
2 Symbo-s 1
3 - Illustration 7
0 8
1 - Words S
0 3
3 - Illustration 4
0 8
1 - Words 3
0 3
3 - Illustration 4
1 S
0 Words S
1 4
0 4
3 - Illustration 4
0 8
1 - Words 4
0 4
3 - Illustration 4
0 8
1 - Words 7
2 - Symbols 1
3 - Illustration 8
o
I
1Words
9
8
1 3
0 1

144
Table 13. cont.
Dimension 1 interaition matrix for (PlOa
D.mew,iun I
talt.gorict,
Dimension 1 (ategories
7 8 9 10
0 0 0 0
0 0 0 0
0 0 0 0
0 0 0 1
1 2 3 4 5 6
1 \\O 0 1 0 0
2 0 A\ 0 2 0 0
A3 0 0 2 1 0 0
4 1 2 1 1 4 0 0
5 0 0 0 0
6 0 0 0 0 0
7 0 0 0 0 0 0 5
8 0 0 J 0 0 0
9 0 0 0 0 0 0
0 0 1 0 0
00000 0 U 0
8
0 0 0
0 0 U
0 0 9. 0
1 0 0
DImen,lon 2 tntLraLttun matrix tul C910,1.
Dimension 2
lAtvgollet,
1
2
3
4
6
7
Dimension 2 Categories
1 2 3 4 S 6 7--___ ----A 19 11 0 0 0 0
1 0 0 0 0
0
0
U 0 0 0
0 0 0
8
U V , 0
0 0 V.,
0 0 0\\!,
Dimension I interaction matrix for C1'10
Dimension 1
Categories
Dimension 1 Categories
123 456789 101 1 0 0 0 .0 0 0 0
0 1 0 2 0 0 0 0 0A
3 0 0 0 0 0 0 0 1
4 0 1 0 0 0 0 0 0
S
6
7
8
9
10 1
0
0
0
0
0
0 0 0
0 0 0
0 0 0
0 0 0
0 1 0
0 0 0 U
0 0 0 0\B
0 U 1 0
0 0 0 ..itt 1
0 0 0 0 8s..
0 0 0 0 0 1 0 0
Dimension 2 interaLtion matrix for LP106.
Dimension 2
(ategories
Dimension 2 Categoric
1 2 3 4 5 6
0
5 0 0 0 0
6 0 0 0 0
0 0 0 0 0
7
0 0
0 0
0 0 0
0 0 011
0
0
0
0
0
0

145
Table 13. cont.
Between Dimension interaction matrix for
1
2
3
4
DILit 1.15 I oil I
5
tategoties6
7
8
9
10
-'_
Dimension 2 Lategories
I 2 1 4 5 6
4 1 0 0 0 0
I6 0 0 0 0 0A
12 14 0 0 0 0
83 22 84 0 0 0
0 0 0 0 0 0
0 0 0 0 0 0B
S 36 0 0 0
0 0 0 0 0 0
0 0 0 0 0 0---------4 0 0 0 0 0
1P10a Between Dimension interaction matrix for
Dimension 2 fategories
(PlOb.
7 1 1 3 4 5 6 7
0 1 5 3 0 0 0 0 0
0 2 16 0 0 0 0 0 0A
0 3 8 0 0 0 0 0 0
0 4 13 11 22 0 0 0 0Dimension 1
0 0 0 0 0 00 5 0
Categories0 6 0 0 0 0 0 0 0
B0 7 5 5 0 0 0 0 0
0 8 5 3 29 0 0 0 0
0 9 35 1 20 0 0 0 0
0 10 4 0 0 0 0 0 0
CM Proportions L_Passage CP10a
Proportion of blank space in total passage
Proportion of each category In non-blank material.
Category
1
2
3
4
5
6
8
9
10
Passage CP106
.17
Dim 1 Dim. 2
.02 45
.05 14
.09 41
.65 00
.00 00
.00 00
.18 .00
.00 -.0001
37
Dim. 1 Dim. 2
.04.09.04
.25
.00
.00
.05
.20
.30
.02
.49.1239
.00
.00
.00
.00
Proportion of exposition ill nonblank material
Proportion of content development in non-blank material
Proportion of exercises in content development
Proportion of exposition in content development
Proportion requiring responses in nonblank material
Proportion of mathematics illustration In non-blink material
Proportion of illustration in non-blank material
.81
81
.00
1.00
.18
.41
.41
.42
.42
.00
1 00
55
39
.39

146
The CMMT lists for contrived passages CP10a and CP1Ob
demonstrated that passage CP10a contained more exposition
than CP1Ob and that CP10a contained fewer exercises and
problems than CP10b. The lists also revealed that illus-
trations were segregated from the written material in
passage CP10a while they were interspersed throughout the
written material in passage CP10b.
The dimension 1 interaction matrices also showed the
planned differences in quantities of exposition and exer-
cises between the two passages. Region A of the passage
CP10a matrix contained 233 entries while region A of the
passage CP10b matrix contained 76 entries. Region B of
the passage CP10a matrix contained 53 entries all for
category 7 while region B of the passage CP10b matrix
contained 111 entries of types 7, 8 and 9. The difference
between the passages in the placement of the illustrations
was shown by the dimension 2 matrices. Passage CP10a con-
tained three interactions between written material and
illustration while passage CP10b contained 20 such inter-
actions. The between dimension matrices also showed that
passage CP10a contained much more explanation than passage
CP10b while passage CP10b contained more and various types
of exercises and problems.
The CMMT proportions showed that passage CP10a con-
sisted of 80 percent exposition while passage CP10b con-
sisted of 42 percent exposition. Passage CP10a contained

147
about 18 percent messages requiring responses while passage
CP1Ob contained about SS percent of such messages. Each
passage contained about 40 percent illustration.
Statistical Results
The statistical results of the validity study concern
the problem of the number of passages to sample from a
section of a textbook, correlational comparisons of passages
within and between textbooks, and the identification of
presentation variables on which textbooks differ. These
results are discussed in this section.
The Sampling Problem. In order to determine if CMMT
analyses of entire sections of textbooks can be closely
approximated by sampling a small number of CMMT sample
passages, successive correlations were made between each
entire experimental section and increasingly larger random
samples of passages from the section. For these correla-
tions 2S items of data readily available from the CMMT
analyses of the passages were used. The items of data and
sampling procedure used were detailed in Chapter 4.
Purdue Statistical Program BMD3D (Dixon, 1970) was
used to compute the correlations for the sampling problem.
These correlations are given in Table 14.

Table 14
Correlations between Increasing Samples and Entire Experimental Sections.
Number of Passages in Sample
12
34
56
78
9or more
ES1
.86
.64
.98
.98
.98
.97
.97
.98
>.98
ES2
.81
.89
.91
.96
.97
.98
.99
.99
1.00
ES3
.97
.9S
.97
.97
.99
.99
.99
.99
>.99
ES4
.81
.93
.94
.98
.98
.99
.99
.99
>.99
Experimental
ESS
.94
.96
.98
.96
.99
.99
.99
-9
1.00
1-,
4:z.
CO
Section
ES6
.99
.98
.99
.99
.99
1.00
ES7
.94
.99
.98
.99
.99
1.00
ES8
.92
.96
.98
.99
.99
.99
.99
.99
>.99
ES9
.89
.91
.99
1.00
ES10
.93
.96
.92
.98
1.00
ES11
.98
.98
.98
.99
.99
.99
.99
.99
>.99
ES12
.94
.98
.99
.99
.99
.99
1.00

149
The correlations given in Table 14 revealed that for
all experimental sections high correlations were obtained
by sampling only one, two, or three passages. The number
of passages it was necessary to sample in order to reach
and maintain correlations of .90 and .95 between the samples
and their sections is given in Table 15.
Table 15
Number of Passages Necessary to Sample to Reach and Maintain
Correlations of .90 and .95 with Entire Sections.
Experimental
Section
Total Numberof Passagesin Section
Sample SizeRequired forCorrelations
Sample SizeRequired forCorrelations
> .90 > .95
ES1 13 3 3
ES2 9 3 4
ES3 11 1 1
LS4 11 2 4
LS5 9 1 2
LS6 6 1 1
ES7 6 1 2
ES8 11 1 2
ES9 4 2 3
ES10 5 1 2
ES11 10 1 1
ES12 7 1

1S0
The results given in Table IS showed that fairly high
stable correlations were obtained between the CMMT analyses
of entire sections and a sample of only one or two passages.
In order to determine more precisely what these correlations
mean, further correlational analysis was carried out. The
results of this analysis are discussed next.
Correlational Comparisons of Passages. Correlational
analysis was used to determine if the CMMT analyses of
passages sampled within the same textbook were more closely
related than passages sampled from different textbooks.
An average within-textbook correlation for each textbook
studied was determined by computing the average correlation
of all pairs of passages from each experimental section
using the same 2S items of CMMT data used in the sampling
problem. The average between-textbook correlation was
computed by randomly selecting one passage from each of
the twelve experimental sections and computing thu average
correlation between all possible pairs of these passages.
The correlations were computed using Purdue Statistical
Program BMD3D (Dixon, 1970). Each average correlation was
determined by taking the Z transformations of the correla-
tions, computing the mean of these transformed scores, and
then taking the inverse Z transformation of the mean (Hays,
1963, p. 608). These average correlations are given in
Table 16.

Table 16
Average Correlation of Passages within and between Textbooks.
Average within-Book Correlaticris
Experimental Section Average Correlations (TO
ES1 .66
':S2 .61
ES3 .64
ES4 .71
ES5 .88
ES6 .95
ES7 .90
ES8 .85
ES9 .78
ES10 .69
ES11 .93
1:S12 .75
Average between-Book Correlation .53 (rb)
The results given in Table 16 indicated that for pas-
sages sampled within textbooks, avera,;. correlations were
consistently higher than for passages sampled from different
textbooks. To investigate the significance of this apparent
difference a number of statistical tests were performed.
First, a A2 test suggested by Ostle (1963, p. 227) was used
to test for differences among the twelve average within-
textbook correlations. The result of this test is given in
the first line of Table 17. Next, the test was also used to
determine if each average within-textbook correlation differed

152
significantly from the average between-textbook correlation.
The results of these tests are also given in Table 17.
Table 17
Results of A2 Tests for Comparing Average Correlations
between Textbooks.
Hypotheses cif Observed A2Probability
Level
Ho: r1 = =riz 11 83.89 p
110 : r1 = rb 1 2.07 p
110 : r2 = rb 1 .65 p
Ho : r3 = rb 1 1.56 p
110: r:, = rb 1 4.14 p
H0: r5 = rb 1 28.79 p
Ho: r6 = rb 1 70.72 p
110: r7 = rb 1 35.52 p
Ho: 1 20.76 p
Ho: r-.. = r.131
1 9.86 n.
____lic : r 10= rb 1 3.32 p
ho : = rb1.i. 52.66 pril
Ho:1'12= rb 4. 7.17 p
< .01
< .25
> .25
< .25
< .05
< .001
< .001
< .001
< .001
,
< ol
< .25
< .001
< .01
ri = average within-book correlation for book i, i = 1, 12.
__rb= average between-book correlation.
A20 o 1
(11).
A22c
(1).
)201
(1)
= 31.264
= 1.32330 )2 (1) = 3.84146.05
= 6.63490A2001(1)o 1
(1).
= 10.828

- _
Table 17 indicates that tht. average within-textbook
correlations differed at the 01 probability level. This
suggests that some textbooks investigated contained more
highly similar passages as measured by CMMT analysis than
other textbooks. For seven of ti.e textbooks investigated
tho average within-textbook correlation was significantly
different from the between-textbook correlation at the .01
probability level. For the remaining experimental sections
the within-textbook correlation did not differ significantly
from the between-textbook correlation at the .01 probability
level.
Identifying Presentation Variables. In order to deter-
mine if the data obtained from CMMT analysis could be used
to identify significant differences among the experimental
sections, analysis of variance was used. The sixteen vari-
ables investigated in this manner were variables which could
be readily obtained from the CMMT analyses of the passages
in the sections. These variables and the analysis of vari-
ance design were detailed in Chapter 4.
For each of the sixteen presentation variables investi-
gated, three statistical tests were performed. First,
Bartlett's X2 test was used to test for hcnogeneity of vari-
ance (Winer, 1962, p. 95). The test was performed using
Purdue Statistical Program DATASUM (Dixon, 1970). The
results for each variable are summarized in Table 18.

T
154
Table 18
Homogeneity of Variance Tests for Presentation Variables.
Variable Observed X2
1 67.5753
2 12.5753
3 20.8815
4 15.5859
5 35.5128
6 37.6567
7 135.6895
8 11.1110
9 21.1336
10 18.0601
11 21.4017
12 80.5406
13 112.8360
14 19.5321
15 81.2449
16 56.8875
Probability Level
p < .001
p > .25
p < .05
p < .25
p < .001
p < .001
p < .001
p < .25
p > .05
p > .1
p > .05
p > .001
p > .001
p > .1
p > .001
p > .001
df = 11 for each variable.
A2.25(11) = 13.7007 X2.1 (11) = 17.2750 X2.05(11)=19.6751
A2.025(11) = 21.9200 X2.01 (11) = 24.7250 X2.001(11) = 31.264

155
The results summarized in Table 18 indicate that on a
number of the presentation variables, homogeneity of variance
can not be assumed. If the arbitrary significance level of
.05 is used then homogeneity of variance can be assumed for
only five of the sixteen variables. If the .01 level is
used then homogeneity of variance can be assumed for eight
of the variables. These results merely show that on a
number of the variables investigated there was greater
variation among the passages within some books than in others.
The second test performed on each presentation variable
was analysis of variance. Even though homogeneity of vari-
ance was not found for all of the variables, Winer (1962,
p, 920) and Hays (1963, p. 381) indicate that analysis of
variance can be performed under these conditions. To per-
form the analyses, Purdue EDSTAT program ANOVAR (Feldman,
1967) was used. The results for each variable are summarized
in Table 19.
The analyses of variance summarized in Table 19 showed
that for all of the variables investigated there were sig-
nificant differences among the means for the twelve books.
These results showed that CMMT analysis statistically differ-
entiated among the textbooks on each of the sixteen variables.
In order to determine the extent of the differences
among the textbooks, a third test was performed on each
variable. The Newman-Keuls Sequential Range Test (Winer,
1962, p. 80) was used to obtain an ordering of the textbooks
on each variable and to find how many pails of means differed

Table 19
Analysis of Variance Tests for Presentation Variables
Variable MSbetween MSwithin F-ratio Probability
1 602375.3920 13315.3501 45.24 <.0001
2 260.9897 31.8325 8.20 <.0001
3 47.8005 4.3781 10.92 <.0001
4 19.3675 1.4032 13.80 <.0001
5 24.0855 6.9682 3.46 <.0001
6 157.6088 15.7752 9.99 <.0001
7 54.4608 5.9115 9.21 <.0001
8 73.7919 7.4488 9.77 <.0001
9 428.9311 34.1462 12.56 <.0001
10 2799.2132 238.8240 11.72 <.0001
11 3105.0151 286.4841 10.84 <.0001
12 2408.5381 219.7256 10.96 <.0001
13 3234.0415 409.7675 7.89 <.0001
14 2289.6925 236.2882 9.69 <.0001
15 1099.0162 126.0162 8.72 <.0001
16 1216.9134 171.9584 7.08 <.0001
dfbetween = 11 for each variable.
dfwithin = 90 for each variable.

157
statistically. For these tests Purdue Statistical Program
NKTEST (Dixon, 1970) was used. The results of these tests
are summarized in Table 20.
Table 20
Summary of Newman-Keuls Tests for Presentation Variables.
Variable
Number of Pairsof Means
Differing at.05 Level.
Number of Pairsof Means
Differing at.01 Level.
1 44 40
2 23 20
3 28 26
4 24 20
5 4 2
6 28 20
7 14 11
8 28 18
9 29 24
10 31 25
11 22 18
12 19 18
13 11 11
14 25 20
15 13 11
16 17 10

158
The Newman-Keuls tests summarized in Table 20 show
that on most variables differences were found between many
pairs of the twelve books. These results indicate that
CMMT analysis could be a powerful tool for differentiating
among a number of textbooks on a number of variables.
Results of the Reliability Study
Both between- and within-rater reliability of subjects
trained in the use of the CMMT technique were investigated
in this study. Three groups of subjects were trained
individually and on two occasions coded a set of six CMMT
criterion passages. These data were analyzed to determine
between- and within-rater differences among the groups and
rating difficulties of the criterion passages. The five
highest scoring subjects in each group were defined as
experts for which between- and within-rater reliability
coefficients were determined. The between- and within-
rater results are presented below.
Between-Rater Results
Criterion ratings for each message of each passage were
determined by computing the most frequent coding of each
message by all subjects. The computer program which was
used for determining these scores is included in Apperdix H.
Between-rater scores for each subject on each passage were
then computed using the program given in Appendix G. These
scores were based on the proportion of agreement between a

159
subject and the criterion ratings of the messages in each
passage. Scores for each CMMT dimension were determined in
this way. These between-rater scores were used in all
analyses of variance presented in this section.
Since the criterion passage scores were used as test
scores for analysis of variance it was appropriate to
investigate the internal consistency reliability for these
scores. To obtain these estimates, Kuder-Richardson Formula
20 coefficients (Nunnally, 1967, pp. 196-197) were computed
for each passage on each CMMT dimension. The computer
program given in Appendix G was used to compute these
coefficients in addition to scoring the passages. These
reliability estimates of the between-rater scores are
given in Table 21.
Table 21
Internal Consistency Estimates for between-Rater Scores.
Passage DimensionEstimate
1 Dimension 2Estimate
FPI .91 .77
CP2b .83 .73
FP8 .84 .82
CP6a .79 .81
FP12 .71 .65
CP1Ob .88 .89

t
160
Before performing repeated measures analysis of vari-
ance on the two sets of between-rater scores, two checks or
homogeneity of variance suggested by Winer (1962, pp. 304-
305) were made. First, homogeneity of variance of subjects
within the three groups was checked. Second, homogeneity
of variance of treatment by subjects within groups was
checked. The results of these tests are given in Table 22.
Table 22
Homogeneity of Variance Tests for between-Rater Scores.
Homogeneity of variance of subjects within groups.
Observed Fmax
Probability
Dimension 1 Dimension 2
1.58217 6.90149
> .05 < .01
Homogeneity of variance of treatmentby subjects within groups.
Observed Fmax
Probability
Dimension 1 Dimension 2
1.37293 1.22812
> .05 > .05
Fmax(.01) (3,14) = 5.3
Fmax(.o5)
(3,14) = 3.71
Fmax(.01) (3'70)2.1
Fmax(.o5)
(3,70) = 1.78
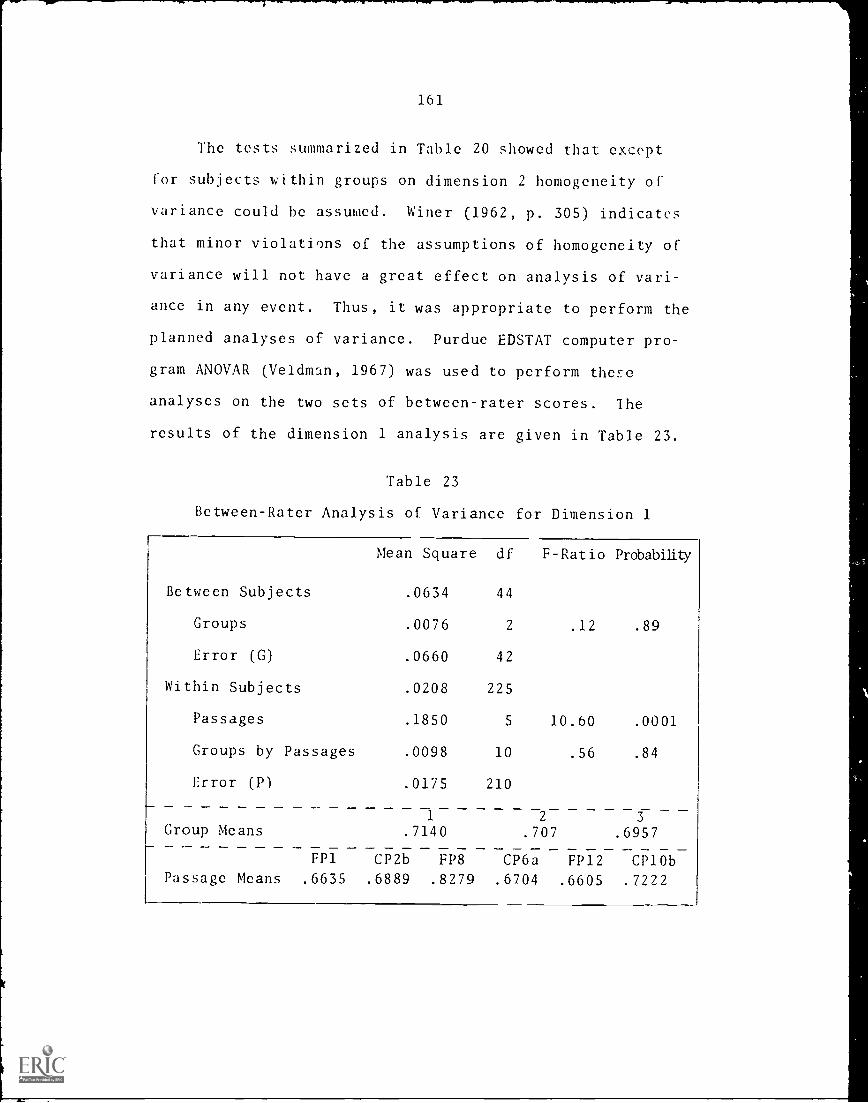
.11W,M111111111MMOIIIMMIllr
161
The teststests summarized in Table 20 showed that except
for subjects within groups on dimension 2 homogeneity of
variance could be assumed. Winer (1962, p. 305) indicates
that minor violations of the assumptions of homogeneity of
variance will not have a great effect on analysis of vari-
ance in any event. Thus, it was appropriate to perform the
planned analyses of variance. Purdue EDSTAT computer pro-
gram ANOVAR (Veldman, 1967) was used to perform these
analyses on the two sets of between-rater scores. The
results of the dimension 1 analysis are given in Table 23.
Table 23
Between-Rater Analysis of Variance for Dimension 1
Between Subjects
Mean Square
.0634
df
44
F-Ratio Probability
Groups .0076 2 .12 .89
Error (G) .0660 42
Within Subjects .0208 225
Passages .1850 5 10.60 .0001
Groups by Passages .0098 10 .56 .84
Error (P) .0175 210
1 2 3
Group Means .7140 .707 .6957
FP1 CP2b FP8 CP6a FP12 CP10bPassage Means .6635 .6889 .8279 .6704 .6605 .7222

162
The between-rater analysis of variance summarized in
Table 23 shows that on dimension 1 there were no significant
differences between groups of raters and no significant
interactions between groups and passages. There were, how-
ever, significant differences between rating difficulties
of the passages. In order to determine which passages
differed, the Newman-Keuls procedure suggested by Winer
(1962, p. 309) was used. The results of this test are
summarized in Table 24.
Table 24
Between-Rater Differences among Passages on Dimension 1.
FP12 FP1 CP6a CP2b CP1Ob FP8RankedPassages
.0030 .0099
.0069
.0284
.0254
.0185
.0617*
.0587
.0518
.0333
.1674**
.1644**
.1575**
.1390**
.1057**
FP12
FP1
CP6a
CP2b
CP1Ob
FP8
** Significant at .01 level.
* Significant at .05 level.

163
The results of the Newman-Keuls test summarized in
Table 24 show that criterion passage FP8 was easier to code
on dimension 1 than any other passage at the .01 level of
significance. Criterion passage CP1Ob was easier to rate
on dimension 1 than passage FP12 at the .05 level of sig-
nificance. No other significant differences between the
rating difficulties of the passages was shown. The results
of the dimension 2 between-rater analysis of variance are
summarized in Table 25.
Table 25
Between-Rater Analysis of Variance for Dimension 2.
Between Subjects
Mean Square
.0153
df
44
F-Ratio Probability
Groups .0003 2 .02 .98
Error (G) .0161 42
Within Subjects .0056 225
Passages .0327 5 6.66 <.0001
Groups by Passages .0058 10 1.19 ,30
Error (P) .0049 210
1 2 3
Group Means: .9175 .9175 .9142
FP1 CP2b FP8 CP6a FP12 CP10b
Passage Means: .9000 .8822 .9623 .9107 .9206 .9226

164
the between-rateranalysis of variance summarized in
Table 25 shows that on dimension 2 there were no significant
differences between grou:-, of raters and no significant
interactions between groups and passages. There were, how-
ever, significant differences in rating difficulty among
the passages. The results of the Newman-Keuls test (Winer,
1962, p. 309) to determine which passages differed are
given in Table 26.
Table 26
Between-Rater Differences among Passages on Dimension 2.
CP2b FP1 CP6a FP12 CP1Ob FP8RankedPassa.es
.0178 .0285
.0107
.0384**
.0206
.0099
.0404**
.0226
.0119
.0020
.0801**
.0623**
.0516**
.0417
.0397
CP2b
FP1
CP6a
FP12
CP1Ob
FP8
** Significant at .01 level.

165
The results of the Newman-Keuls test summarized in
Table 26 show that criterion passage FP8 was easier to rate
on dimension 2 than passages CP2b, FP1, and CP6a at the
.01 level of significance. The results also show that
passages FP12 and CP1Ob were easier to rate on dimension 2
than passage CP2b at the .01 significance level.
Tle five subjects in each group who received the
highest overall average between-rater scores were defined
to be experts. The data from the experts were used to
determine between-rater reliability coefficients. These
reliability coefficients are based on the average Scott
reliability coefficient for all pairs of experts in each
group on each passage. The Scott coefficient whi0 was
described in Chapter 3 can be interpreted as the proportion
of agreement between subjects with an adjustment for chance
agreement. The computer program included in Appendix F was
used to compute the between rater reliabilities which are
given in Table 27.
Table 27 revealed somewhat higher between-rater
reliabilities on dimension 2 than on dimension 1 of the
CMMT system. The table also showed that there was some
variation between passages on both dimensions. This
variability roughly reflects the results of the analyses
of variance.

166
Table 27
Between-Rater Reliability Coefficients.
Passage Dimension 1 Dimension
FP1
CP2b
FP8
.42
.63
.84
.76
.89
.98Group 1
CP6a .55 .86
FP12 .40 .85
CP1Ob .72 .94
FP1 .58 .73
CP2b .52 .77
FP8 .78 .93Group 2
CP6a .57 .74
FP12 .55 .96
CP10b .45 .91
FP1 .55 .93
CP2b .63 .74
FP8 .81 1.00Group 3
CP6a .56 .74
FP12 .52 .83
CP10b .60 .81
2

167
Within-Rz.ter Results
Since only thirteen of the ,riginal fifteen subjects
in groups 1 and 2 completed the second coding of the
criterion passages, within-rater results are based on
groups of size thirteen. In order to make group i of
size thirteen, two of the original subjLLts in group 3
were selected at random and dropped from the within-rater
analysis.
Within-rater scores were determined for each subject
by computing the proportion of agreement between each
subject's first and second codings of the criterion passages.
The computer program included in Appendix S was used to
determine within-rater scores. The internal consistency
estimates for the within-rater scores, which were also com-
puted by the program ,n Appendix G, are given in Table 28.
Table 28
Internal Consistent: Lstiglates for Within-Rater Sccres.
Passage mensionEstimate
1 Dimension 2Estimate
FP1 .87 .80
CP2b .88 .72
FP8 .90 ,83
CP6a .84 .78
FP12 .91 .84
CP1Oh .)0 .83

X68
The two checks of homogeneity of variance which were
made for the between-rater scores were also made for the
within-rater scores before the analyses of variance were
performed. The results of these tests are given in
Table 29.
Table 29
Homogeneity of Variance Tests for within-Rater Scores.
Homogeneity or variance of subjects within groups.
Observed Fmax
Probability
Dimension 1 Dimension 2
1.4945 5.1813
> .05 > .01
L
Homogeneity of variance of treatmentby subjects within groups.
Observed Fmax
Probability
Dimension I
1.1946
> .05
Dimension 2
1.6207
> .05
Fmax(.00 (3,12) = 6.1
Fmax(.o5)
(3,12) = 4.16
rmax(.00 (3,60) = 2.2
Fmax(.00 (3,60) = 1.85

169
The tests summarized in Table 29 indicated that
homogeneity of variance was a safe assumption in this case.
Thus, as in the case of the between-rat3r data, it was
appropriate to perform the planned analyses of variance.
Again, Purdue EDSTAT computer program ANOVAR (Veldman, 1967)
was used to perform these analyses. Results of the dimen-
sion 1 analysis are summarized in Table 30.
Table 30
Within-Rater Analysis of Variance for Dimension 1.
Mean Square df F-Ratio Probabilityi
Between Subjects .0889 3S
Groups .0561 2 .62 .55
Error (G) .0907 36
Within Subje:As .0290 195
Passages .1377 5 5.29 .0003
Groups by Pa sages .0271 10 1.04 .-11
Error (P) ._260 180
Group Means:
1 2 3
.6971 .6811 .6447
FP1 CP2b FP8 CP5a FP12 CP10bPassage Means: .6636 .6550 .7913 .6338 6315 6706

170
The analysis of variance summarized in Table 30 for
within-rater scores was quite similar to the dimension 1
between-rater analysis of variance. Again, no significant
differences were found between groups of raters and there
were no significant interactions between groups and
passages. As in the case of the between-rater results
there were significant differences between passages. To
determine which passages differed significantly in rating
difficulty, the Newman-Keuls test suggested by Winer
(1962, p. 309) was used. The results of this test are
sumn..?rized in Table 31.
Table 31
Within-Rater Differences among Passages on Dimension 1.
FP12 CP6a CP2b FP; CP1Ob FP8RankedPassa es
.0023 .0735 .3_1 .0391 .1598** FP12
J212 .0298 .0368 .1575** CP6a
.0086 .0156 .1363** CP2b
.0070 .1277** FP1
.1207** C',110b
FP8
** Significant at .01 level,
1

1- -
171
As with the between-rater scores, the within-rater
results give.1 in Table 31 showed that focus passage FP8
was significantly easici to code on dimension 1 than the
other passages. The results of the dimension 2 within-
rater analysis of variance which also parallel the between-
rater results are given in Table 32.
Table 32
Within-Rater Analysis of Variance for Dimension 2.
Between Subjects
Mean Square df F-Ratio
.0226 38
Probability
Groups .0015 2 .06 .94
Error ',G) .0237 56
Within Subjects .0071 195
Passages .0481 S 7.96 < .0001
Groups by Passages .0957 10 .94 .50
Error (P) .0060 180
1 2 3
Group Means: .8940 .8903 .8989
FP1 CP ?b FP8 CP6a FP12 CP10b
Passage Means: .8791 .8467 .9415 .8713 .9224 .9054
1

172
The within-rater analysis of variance summarized in
Table 32 showed that on dimension 2 there were no signifi-
cant differences between groups and no significant inter-
actions. There were differences in the rating difficulty
of the passages. The results of the Newman-Keals test
(Winer, 1962, p. 309) to determine which passages differed
are given in Table 33.
Table 33
Within-Rater Differences among Passages on Dimension 2.
h32b CP6a FP1 CP1Ob FP12 FP8RankedPassages
.0246 .0324*
.0078
.0587**
.0311*
.0263
.0757**
.0511**
.0433*
.0107
.0948**
.0702**
.0624**
.0361
.0191
CP2b
CP6a
FP1
CP1.,o
FP12
FP8
** Significant at .01 level.
* Significant at .05 level.

173
The results of the test summarized in T. ',, 33 are
similar to the corresponding between-rater reslts. Again,
passage FP8 appeared to be the easiest passage to code.
Passages CP1Gb and FP12 were easier to code on dimension 2
than passages CP2b, CP6a, and FP1.
Within-rater reliability estimates were determined for
the experts in each group using the computer program included
in Appendix F. These within-rater coefficients are given
in Table 34.
As in the case of the between-rater reliability esti-
mates, the within-rater coefficients tended to bjhigher
on dimension 2 than on dimension 1. Also, a comparison of
the between-rater coefficients given in Table 27 with the
within-rater coefficients in Table 34 reveals that the
within-rater coefficients tended to be slightly higher.
Of the eighteen dimension 1 coefficients, fifteen of the
within-rater estimates were higher than their correspond-
ing between-rater estimates. On dimension 2 the within-
rater and between-rater coefficients appeared to be quite
similar. The within-rater coefficients in Table 34
reflected the variation among passages shown in the
analyses of variance.

174
Table 34
Within-Rater Reliability Coefficients.
Passage Dimension 1 Dimension 2
FP1
CP2b
FP8
.62
.79
.90
.87
.79
.95Croup 1
CP6a .67 .88
FP12 .77 .96
CP1Ob .71 .91
FP1 .68 .81
CP2b .79 .83
FP8 .83 .90Group 2
CP6a .69 .82
FP12 .61 .88
CP1Ob .78 .88
FP1 .66 .99
CP2b .58 .72
FP8 .69 .99Group 3
CP6a .61 .81
FP12 .78 .89
Ci-'10b .61 .84

175
Investigator Reliability
To complete the study of reliability a check was made
of the reliability of the investigator. This was done by
computing the proportion of agreement between the investi-
gator and the between-rater criterion ratings on each
criterion passage. In addition a Scott reliability coeffi-
cient was computed between the investigator and the criterion
ratings on each criterion passages. These proportions and
coefficients which were computed using the program in
Appendix F are given in Table 35.
Table 35
Investigator Reliabilities.
Passage
Proportion ofAgreement
Dimension 1 Dimension 2
ReliabilityCoefficients
Dimension 1 Dimension 2
FP1 .74 1.00 .61 1.00
CP2b .90 1.00 .88 1.00
FP8 .92 1.00 .88 1.00
CP6a .70 .96 .61 .93
FP] 2 .85 1.00 .81 1.00
CP1Ob .87 1.00 .83 1.00
Averages .83 .99 .77 .99

176
CHAPTER VI
,SUMMARY, CONCLUSIONS, AND DISCUSSION
Summary of the Research
In this research a technique for identifying and study-
ing presentation variables in mathematics text was developed
and investigated. These presentation variables concern the
manner in which authors attempt to communicate mathematics
in printed form. The variables were studied in terms of
content and representational structures in mathematics text.
The research had purposes which were both developmentally
and empirically oriented. -rom a developmental point of view
the purpose of the research was to develop a technique of
studying presentation variables in mathematics text. From an
empirical point cf view the purpose of the research was to
investigate the validity and reliability of the technique.
The developed technique has three basic components.
The first component consists of a two dimensional system of
categories for classifying messages in mathematics text.
This category system is called the CMMT category system.
Dimension 1 of the CMMT category system which is used to
classify messages in terms of mathematical content and
process provides subclassifications of the exposition and
exercises or problems appearing in mathematics text.

177
Dimension 2 of the CMMT category system provides a means of
classifying the mode of representation used in mathematics
text in terms of word, symbol, and illustration classifica-
tions.
The second component of the developed technique has to
do with procedures for applying the CMMT category system to
actual text passages. The basic unit of measure used is
one-fourth of a line of print. To apply the category system,
a page of text is partitioned into sections conforming to
the format of the page. A category number for each dimension
of the CMMT system i: recorded for each section of this par-
tition and each section is weighted in terms of the unit of
measure. Category numbers are recorded following a set of
precise definition3 and procedures which have been developed.
The third component of the technique developed in this
study concerns a method of analyzing the information collected
by applying the CMMT categories to mathematics passages.
This method of analysis which is called CMMT analysis con-
sists of a sequential listing of categories, a set of ma.trices
for analy.:ing interactions among categories, and a number of
proportions based on the unit of measure. A computer program
is used to determine the CMMT analysiL of a passage of
mathematics text from a rater's codirgs.
The union of the three Lasic components of the technique
developed in the study is called the CMMT technique. The
development of the CMMT technique was an evolutionary process

178
based on practical experience and theoretical considerations.
A number of existing mathematics textbooks was examined and
tentative category systems were developed, tested, submitted
to critical discussion, and revised. As the CMMT technique
was being developed a theoretical rationale for the choice
of the categories and procedures evolved
The empirical research consisted of two related _tudies.
The validity study was undertaken to gather evidence of the
validity of the CMMT technique as a means of studying presen-
tation variables in mathematics text. The reliability study
was undertaken to determine if raters could use the CMMT
technique in a consistent and reliable manner.
In the validity study twelve mathematics textbooks from
grade four through twelve were investigated. The passages
in one section of each of these books were submitted to CMMT
analysis. A focus passage was chosen from each section for
in depth study. Certain focus passages were used to provide
descriptive evidence of the validity of CMMT analysis for
describing p ;ages. Other focus passages were used to
construct pairs of contrived passages with common content
but contrasting forms of organization or presentation.
These contrived passages were used to provide further
descriptive evidence of the validity of CMMT analysis.
Validity was also studied in a statistical manner.
Correlational analysis was used to determine what constituted
an adequate sample of passages from textbook sections.

179
Correlations or passages within textbooks were compared
with correlations between passages taken from different
textbooks, For all correlations made in the study a set of
25 items of data readily available from the CMMT analyses of
investigated passages was used.
To determine if CMMT analysis has validity for identify-
ing presentation variables on which textbooks differ, an
analysis 01 variancc model was used. The twelve text.ccolcs
investigate({ were compared on lb variables readily available
from CMMT analyses.
In the reliability study three groups of subjects were
investigated. These groups consisted of mathematics educa-
tion specialists, secondary mathematics teachers, and student
teachers of secondary mathematics. The subjects in each
group studied a training booklet to learn the CMMT technit'ue
and then rated six criterion passages on two obcasions
separated by a period of a minimum of four weeks. "sepeated
measures analysis of variance was used to determine if
within- and between-rater differences existed between groups
of subjects and to determine if differences existed in the
rating difficulty of the criterion pac,sages.
To complete the reliability study a number of relia-
bility coefficients were computed. These included within-
and between-rater coefficients for each CMMT dimension and
each group as well as reliability estimates for the investi-
gator.

180
Conclusions and Discussion
In this section conclusions and discussi..n concerning
the developmental, validity, and reliability aspects of
the research are given.
Developmental Aspects
The development of the CMMT technique must be viewed
with two limitations in mind. First, the technique is
essentially new. Although similar instruments have been
used to study classroom interaction, no other researcher
has attempted to use such a technique in a setting similar
to this study. Thus, the CMMT technique is not directly a
part of any existing theory or body of research. Second,
the technique is largely the work of a single researcher.
While the investigator did discuss the technique with a
number of researchers as it was being developed, the tech-
nique does not represent the combined efforts of several
equally contributing and involved researchers. To overcome
these limitations, a number of other researchers will have
to become involved in studying and further developing the
technique. A solid theoretical rationale on which to base
the technique will have to be established.
Before the CMMT technique can be regarded as a practi-
cal and usable technique, researchers must deal with several
developmental issues. These issues concern the CMMT category
system itself, the procedures for applying the system to text
materials, and CMMT analysis. Developmental issues related

181
to the category system concern the problems of the frequency
with which the CMMT categories appear in actual text mate-
rials, the continuous nature of some of the classifications,
and the mutual exclusiveness of the categories.
The problem of the frequency with which classifications
appear in actual mathematics textbooks is illustrated by
dimension 1 of the CMMT system. By far the most numerous
categorizations of the text materials investigated consisted
of specific a:sd general explanation (categories 3 and 4) and
exercises (category 7). The other categories tended to
appear relatively infrequently. The possibility of combin-
ing some of the rarely occurring categories such as defini-
tion (category 1) and generalization (category 2) needs to
be investigated. Perhaps some of the most frequently
occurring categories need to be further subdivided. This
may be particularly true of general explanation (category 4)
which seemed to become a catchall for expository material.
The continuous nature of the dichotomy between some of
the pairs of categories presents another problem on which
more developmental effort is needed. The categories of
specific and general explanation (categories 3 and 4 of
dimension 1) illustrate this problem. It is difficult to
determine at what point something is no longer specific and
becomes general. Other categories presenting this problem
include the exercise and problem classifications on dimension
1 and the illustration classifications on dimension 2.

Effort is needed in the development of more precise defini-
tions of the categories to overcome this problem.
Mutual exclusiveness also appears as a possible problem
in the exercise and problem categories on dimension I. For
example real world problems can be of a rote or practice
nature and thus classifiable as both exercises (category 7)
and application (category 8). Such problems could also play
a role in the development of the material and thus be
classified in category 6. Further developmental effort is
needed to insure the mutual exclusiveness of the categories.
A developmental issue related to the procedures used in
applying the category system to actual text materials concerns
the time required to code a page. The investigator found the
task of subdividing a page, weighting the partitions, coding
the material, and transferring the data to computer cards for
analysis to be an extremely time consuming process. Although
researchers may be willing to spend such amounts of time, it
is doubtful that anyone else would. Thus, the technique as
it now stands is limited in this respect. Further develop-
mental effort could be directed toward reducing the time
requirement.
CMMT analysis also needs further developmental attention.
The meaningfulness of the area unit is questionable. Some
types of messages such as problems may pack much more into
a unit of measure than other messages such as general ,explanation. A symbolically written message ordinarily uses

133
1,ss space than the same message written out in words.
illustrations tend to take up large areas. The same illus-
tration could exist in two passages but be of vastly differ-
ent sizes thus yielding different CMMT proportions. In
light of this the sequential and interaction aspects of CMMT
analysis appear to be more meaningful than the CMMT propor-
tions. In any event, future research may lead to the
development of some other unit of measure.
There is much developmental work still to be done if
the CMMT technique is to become widely used. Whether or not
this work should be done will depend on researchers' judge-
ments of the potential of the technique. These judgements
should be made in terms of the empirical evidence supplied
by the validity and reliability studies. The conclusions
which can be drawn from these studies are discussed in the
following sections.
The Validity Study
The following conclusions may be drawn from the results
of the validity study.
1. CMMT analysis can be used to describe the organiza-
tion of mathematics text passages.
2. CMMT analysis reflects similarities and differences
between pairs of passages with known organizational
makeups.
3. CMMT analyses of entire sections of mathematics
textbooks correlate highly with the CMMT analyses

1
184
of random samples of two or three passages from the
sections.
4. CMMT analyses of passages sampled within textbooks
tend to correlate slightly higher than CMMT analyses
of passages sampled from different textbooks.
5. CMMT analyses of textbooks measure variables which
statistically differentiate among textbooks.
The above conclusions should be viewed within the
bounds of certain limitations. Conclusions 1 and 2 are
based only on descriptive information. It is the investi-
gator's opinion that the descriptive results given in
Chapter 5 support these conclusions.
It is not entirely clear what the correlational conclu-
sions drawn in 3 means in terms of sampling passages from
textbook sections for CMMT analysis. While the correlations
of sections with two 07 three sampled passages tend to be
above .90 it is difficult to say if this is high enough.
Conclusion 4 indicates that caution should be exercised in
using a small sample of passages to represent sections of
textbooks. While correlations among passages within text-
books tend to be fairly high in some cases, these correla-
tions do not seem to be a great deal higher than correlations
among passages from different textbooks.
Certain types of passages within some of the textbooks
investigated tended to correlate lowly with other passages
in the same book. For example, review passages or passages

185
consisting only of verbal problems had very low or even
negative correlations with the majority of passages within
some texts. Perhaps the average within-textbook correlations
for the different textbooks serve only to give an indication
of the consistency of presentation in the books. Whether
this level consistency is important must be determined by
further research.
Conclusion 5 may be the most important conclusion drawn
from the validity study. Any valid measurement instrument
must be able to differentiate among the things it measures,
if it is to have any use. CMMT analysis did differentiate
among the textbooks in this study on all sixteen variables
investigated. It remains for further research to determine
if these differences have meaning in terms of any learner
variables.
In view of the limitations discussed above it is the
opinion of the investigator that the conclusions of the
validity study support the contention that the CMMT technique
has potential for becoming a valid means of studying mathe-
matics text.
The Reliability Study
The following conclusions may be drawn from the results
of the reliability study.
1. In terms of both between- and within-rater scores,
groups were statistically equivalent on both
dimensions of the CMMT category system.

186
2. In terms of both between- and within-rater scores,
some passages were significantly more difficult
to code than other passages on both CMMT dimensions.
3. Most between-rater reliability coefficients on
dimension 1 ranged between .50 and .80.
4. Most between-rater reliability coefficients on
dimension 2 ranged between .75 and 1.00.
5. Most within-rater reliability coefficients on
dimension 1 ranged between .60 and .90.
6. Most within-rater reliability coefficients on
dimension 2 ranged between .75 and 1.00.
7. Investigator reliability measured in terms of
codings of the subjects averaged about .77 on
dimension 1 and .99 on dimension 2.
These conclusions must also be viewed within the limita-
tions of the reliability study. It should be kept in mind
that subjects in this study trained themselves in the use of
the CMMT technique and were not requested to spend large
amounts of time on the project. With improved training
techniques it would not be unreasonable to expect raters to
achieve higher levels of reliability. The slightly higher
within-rater reliabilities achieved on dimension 1 seem to
support this.
The lack of differences between groups may also be a
reflection of the individualized training and the short
training period. Possibly no group of subjects was trained

187
long enough for the differences in experience and education
among the groups to have any effect. It is also a possibil-
ity that a lack of motivation on the part of all subjects to
spend five or six hours on the required task had a leveling
effect on the results.
The reliability coefficients of the investigator's
codings must be interpreted cautiously. It is the feeling
of the investigator that the dimension 1 average estimate
of .77 is low. This coefficient was computed in terms of
the most frequent ratings made by the subjects in the experi-
ment. Some of these ratings were not based on an overwhelm-
ing concensus of the subjects. In fact, many were based on
a minority opinion. It is the opinion of the investigator
that in most cases where he disagreed with the most frequent
ratings he was right and the subjects were wrong.
It remains for further research to determine what
levels of reliability can be obtaThed by subjects with
improved and prolonged training. It also remains for
research to determine what levels of reliability are neces-
sary for the technique to be of practical value. It is the
opinion of the investigator that the conclusions drawn from
the results of the reliability study indicate that the CMMT
technique has potential for becoming a reliable technique
for studying mathematics text.

188
Recommendations for Further Research
There is a clear need for research which systematically
studies mathematics text. Techniques for doing this in a
meaningful way are not plentiful. The CMMT technique repre-
sents an attempt to develop one technique for studying
presentation variables in mathematics text. The potential
of the technique as a useful means for studying mathematics
text is the crucial factor. Further reserach will have to
determine if its potential will be realized. Recommendations
for the directions such research should take are given in
this section.
Before the CMMT technique can be used to undertake
studies of mathematics text, the developmental and reliability
problems discussed in the previous section should be resolved.
Studies investigating these problems should involve a number
of researchers and subjects over a period of time. In these
studies developmental problems could be investigated in con-
junction with investigations of reliability. Researchers
should work directly with subjects to determine where coding
difficulties are encountered. Training procedures should be
investigated in terms of what levels of reliability can be
obtained in given time intervals.
After the developmental and reliability issues have
been satisfactorily settled, researchers will be able to
undertake actual studies of mathematics text. These studies
could take a number' of forms. Descriptive studies could be

189
carried out in which the nature of the presentation in vari-
ous textbooks is merely described in terms of CMMT analysis.
Comparative studies of the presentation in various textbooks
in terms of CMMT analysis could also be carried out. These
descriptive and comparative studies, while providing informa-
tion about the presentation in particular textbooks, could
also seek to operationalize in terms of CMMT analysis the
meaning of such terms as "discovery" or "conventional"
approaches to presenting mathematics text.
Studies in which connections between learner variables
and CMMT analysis patterns are investigated will need to be
undertaken. Such studies could attempt to explain some of
the results of existing comparative studies of mathematics
text, such as the National Longitudinal Study, in terms of
CMMT analysis. A regression analysis model could be used in
an attempt to identify certain CMMT patterns which produced
superior achievement or attitudinal results in existing
studies.
Experimental studies could compare learner outcomes on
text passages which are constructed to have given CMMT
analysis patterns. These studies could search for patterns
of presentation which produce specific learner outcomes such
as superior performance of basic skills, superior problem
solving, positive attitudes toward studying mathematics
textbooks, etc. The patterns investigated in these studies
will have to be chosen on some theoretical basis and/or in

190
terms of the outcomes of the types of studies described in
the previous two paragraphs.
Finally, educators may wish to put a fully developed
CMMT technique to practical use. Textbook authors may wish
to use CMMT analysis as a tool in the construction of
mathematics text materials. Publishers may wish to use
CMMT analysis information to help in describing their text-
books to educators. Textbook selection committees may wish
to use the CMMT analyses of the textbooks they are consider-
ing to aid them in their decisions. Teacher education
programs in mathematics may wish to make use of the CMMT
technique in training teachers in the evaluation of mathe-
matics text materials. These practical applications should
he mace only after positive results of further research on
the CMMT technique have been received.

191
BIBUOGRAPUY
Amidon, E. J., f Hough, J. B. (Eds.) Interaction analysis;Theory, research and application. Readinj, Mass.:Addison-Wesley Publishing Company, Inc., 1967.
Ausubel, D. P., Robbins, L. C., Blake, E. J. Retroactiveinhibition and facilitation in the learning of schoolmaterials. Journal of Educational Psychology, 1957, 48,334-343.
Ausubel, D. P. The pfycholou of meaningful verbal learning.New York: Grune and Stratton, 1963.-
Beberman, M.matics.19ST.
Bloom, B. S.book I:1.
An emerging program of secondary school mathe-mbridge, Mass.: Harvard UniverTMTFress,
(Ed.) Taxonomy of educational objectives hand-Cognitive domain. New YofF7 David McKay Co.,
Briggs, L. J. Sequencing of instruction in relation tohierarchies of competence. Pittsburgh: AmericanInstitute for .search, 1968.
Bruner, J. S. Toward a theory of instruction. Cambridge,Mass.: HarvarrUniversityTress, 1967:
Byrne, M. A. The development of a measure of the familiarityof mathemTcal to -,s and symbols. Doctoral dissert:.-.--iron, DepartmentBYEducation, Purdue University, 1970.
Chall, J. S. Readability: An appraisal of research andapplication. Ohio State University Bureau of Educa-tional Monographs, 1958, No. 34.
Comprehensive School Mathematics Program. Book six, rela-tions. St. Ann, Missouri: CEMREL, Inc., 1971.
Cramer, W., & Dorsey, S. Science textbooks how readableare they? Elementary School Journal, 1969, 70, 28-33.
Deans, E., et al. Learning mathematics. New York: Ameri-can Book Company, 1968.

192
Dixon, W. J. (Ed.) BMD biomedical computer programs (2ndEd.). Berkeley, California: University of CaliforniaPress, 1970.
Duncan, E. R., et al. Six, modern school mathematics N-ns-,
York: Houghton Mifflin Company, 1967.
Eicholz, R. E., & O'Duffer, P. G. Elementary school mathematics, book four. Reading, Mass.: Addison-Vesley,1968.
Fehr, H. F., et al. Algebra with trigonometry. Boston:D. C. Heath and Company,W63.
Flanders, N. A. (1950) The problems of observer trainingand reliability. In Amidon and Hough (Eds.), Inter-action Analysis: Theor , research and application.Reading, Mass.: A ison-Wesley PubMIing Company,Inc. , 1967.
Flanders, N. A. Analyzing teaching behavior. Reading,Mass.: Addison-Wesley Publishing Company Inc., 1970.
Gagne, R. M., & Paradise, N. E. Abilities and learning setsin knowledge acquisition. Psychological Monographs:General and Applied, 1961, 75(14).
Gagne, R. M. The acquisition of knowledge. PsychologicalReview, 1962, 69, 355-365.
Gagne, R. M., et al. Factors in acquiring knowledge of amathematical task. Psychological Monographs: Generaland Applied, 1962, 76(7)
Gagne, R. M. Learning hierarchies. Educational Psychologist,1968, 6(1), 3-6.
Hater, M. A. The cloze procedure as a measure of the read-ing compraTnsibility and difficulty of mathematicalEn lish. Doctoral dissertation, Department of Educa-tion, urdue University, 1969.
Hays, W. L. Statistics. New York: Holt, Rinehart, andWinston, 1963.
Reddens, J. W., & Smith, K. J. The readability of elementarymathematics books. The Arithmetic Teacher, 1964a, 11,466-468.
Reddens, J. W., & Smith, K. J. The readability of experi-mental mathematics materials. The Arithmetic Teacher1964b, 11, 391-394.

193
Helmer, R. T. Condi-:ions of learning in mathematicssequence theory development. Review of EducationalReseerch, 1969, 39(4), 493-507.
Hickey, A. E., f Newton, J. M. The logical basis of teach-ing: I. The elfect of subconcept sequence on learn-ing. Newburypoit, Mass.: ENTELEK Inc., 19617
Kane, R. B. The reacability of mathematical English..Journal of Research in Science Teaching, 1968; 5,296-298.
Kane, R. B. The readability of mathematics textbooksrevisited. The Mathematics Teacher, 1970, 63(7),579-581.
Kane, R. B., Hater, M. A., E Byrne, M. A. A readabilityformula for the language of mathematics. Paperpresented at the meeting of the National Council -rTeachers of Mathematics, Anaheim, California, 1970.
Keedy, M. E., et al. Exploring elementary mathematics, five.New York: Holt, Rinehart, and Winston, 1970.
Kieren, T. E. Activity learning. Review of EducationalResearch, 1969, 39(4), 509-522.
Kuim, G. The readability of elementary al ebra textualmateri. Doctoral dissertation, Teachers College,Columbia University, 1971.
Mayor, J. R. , & Wilcox, M. S. Contemporary al ebra secondcourse. Englewood Cliffs, N. J.: Prentice- all, 1965.
Merrill, M. D. Correction and review on successive partsin learning a hierarchical task. Journal of Educa-tional Psychology, 1965, 56, 225-234.
Merrill, M. D., & Stolurow, L. M. Hierarchical previewversus pi:71blem oriented -review in learning an imaginaryscience. American Educational Research Journal, 1966,3, 251-261.
Newton, J. M., & Hickey, A. E. Sequence effects in pro-grammed learning of a verbal concept. Journal ofEducational Psychology, 1965, 56, 140-147.
Nunnally, J. C. Psychometric theory. New York: McGrawHill Book Company, 1967.
Ostle, B. Statistics in research: Basic concepts andtechniques for research workers. Ames, Iowa: 'MeIowa State University Press, 1963.

Payne, D. A., Krathwohl, D. R., el Gordon, J. The effect ofsequence on programmed instruction. American Educa-tional Research Journal, 1967, 4, 125-132.
Pyatte, J. A. Some effects of unit structure of achievementand transfer. American Educational Research Journal,1969, 6, 241-261.
Reynolds, J. F!., et al. Repetition and spaced review inErogrammed instruction. Wright-Patterson Air ForceBase, Ohio: Behavioral Sciences Laboratory, December,1964.
Roc, A. Comparison of branching methods for programmedlearning. Journal of Educational Research, 1962, 55,407-416.
Roc, K. V., Case, H. W., & Roe, A. Scrambled versus orderedsequence in auto-instructional programs. Journal ofEducational Psychology, 1962, 53, 101-104.
Romberg, T. A. Current research in mathematics education.Review of Educational Research, 1969, 39(4), 473-491.
Scandura, J. M. Algorithm learning and problem solving.Journal of Experimental Education, 1966a, 34(4), 1-6.
Scandura, J. M. Prior learning, presentati-- -der, andprerequisite practice in problem sc ..g. Journal ofExperimental Education, 1966b, 34(4), 12-18.
Scandura, J. M. Problem solving and prior learning.Journal of Experimental Education, 1966c, 34(4), 7-11.
Scandura, J. M., & Wells, J. N. Advance organizers inlearning abstract mathematics. American EducationalResearch Journal, 1967, 4
,295-301.
Secondary School Mathematics Curriculum Improvement Study.Unified modern mathematics, course 2, part 1. NewYork: Teachers College, ColUiFTUniversity, 1969.
School Mathematics Study Group. Mathematic for junior high,volume 2, part 2. New Haven, Connecticut: YaleUniversity Press, 1961.
Scott, W. A. Reliability of content analysis: The case ofnominal coding. Public Opinion Quarterly, 1955, 19,321-325.

Short, J., ri Haughey, B. Study of sequencing st:ltegies.proceedings of the 75th Annual Convention of the Ameri-can Psychological AssociaTion, 1967, 2, 17-18.
Smith, F. The readability of junior high school mathematicstextbooks. The Mathematics Teacher, 1969, 62, 289-291.
Smith, R. R., et al. Contemporary al ebra, book one. NewYork: Harcourt, Brace, and World, Inc., 1965.
Suppes, P. Some theoretical models for mathematic.; learning.Journal of Research and Development in Education, 1967,1, 5-22.
University of Illinois Committee on School Mathematics.High school mathematics, unit 6, geometry. Urbana,Illinois: University of Illinois Press, 1960.
Van Engen, H., et al. Seeing throw h mathematics, book one.Chicago: Scott, Foresman an Company, 1962.
Veldman, D. J. Fortran programming for the behavioralsciences. New York: Holt, Rinehart, and Winston,1967.
Wiegand, R. B. Pittsburgh looks at the readability of mathe-matics textbooks. Journal of Reading, 1967, 2, 201-204.
Wilson, J. W., Cahen, L. W., & Begle, E. G. (Eds.) NLSMAreport: The development of tests, No 7, SMSG.Stanford, California: Stanford University Press, 1969.
Winer, B. J. Statistical Principles of Experimental Design.New York: McGraw-Hill Boo Company, 1962.
Woodward, E. L. Comparative study of teaching stragetiesinvolving advance organizers aiia post organizers anddiscovery and non-discovery teEIniques where theinstructioris mediated la computer. DoctoraTTisserta-tion, Florida State University, Tallahassee, 1966.
Wooten, W. SMSG: The making of a curriculum. New Haven,Connect-n-5T: Yale UniverTity Press, 1965.

196
APPENDIX A
RATER TRAINING BOOKLET
Content
I. Introduction to the CMMT Categories. . . 197
II. Description of Dimension 1 Categories . . 205
III. Notes on Using Dimension 1 Categories . . 210
IV. Description of Dimension 2 Categories . . . 212
V. Notes on Using Dimension 2 Categories . . . 213
VI. Procedural Suggestions for Rating Passages. . . 214
VII. Practice Passages and Keys . . . . . 215

197
I. Introduction to the CMMT Categories
The CMMT category system is a system of categories for
classifying messages which appear in mathematics text. CMMT
stands for "Classification of Messages in Mathematics Text."
The CMMT category system which is two dimensional is given
below.
CMMT Category System
Dimension 1: Content Mode
0. Blank Space
1Messagesrequiring
onlyreception.
1. Definition (Meanings ofwords or symbols.)
2. Generalizations (Importantrules, axioms, theorems,formulas, etc.)
3. Specific Explanation(Concrete examples anddiscussion in specificterms.)
4. General Explanation(Proofs of propositions,general discussion, etc.)
Messagescalling
forresponsesotherthan
reception.
> Exposition
S. Procedural Instructions(Directions.)
6. Developing Content(Questions in exposition,developmental activities,guided discovery exer-cises, etc.)
7. Understanding DevelopedContent (Exercises involv-ing routine computations,practice, identification,etc.)
8. Applying Developed Content(Real world problems,applications of generaliza-tions in concrete situa-tions, etc.)
9. Analyzing and SynthesizingDeveloped Content (Provingpropositions, finding newrelationships in developedcontent, unguided dis-covery, etc.)
Subclassi-ficationsof questions,exercises,problems,activities,etc.
10. Other Material (Headings, non-mathematicalmaterials, etc.)

198
Dimension 2: Presentation Mode
0. Blank Space
Writtentext.
1. Words2. Mathematical Symbols
illustration
3. Representations of Abstract Ideas (Venndiagrams, geometric diagrams, mappingpictures, etc.)
4. Graphs (Number lines, coordinate graphs,bar graphs, etc.)
S. Representations of Physical Objects orSituations (Plans, maps, crosssectional drawings, photographs, etc.)
6. Non-mathematical Illustrations(Motivational photographs, cartoons,etc.)
7. Combinations of Illustrations withWritten Text (Flow charts, mathematicaltables, tree diagrams, etc.)
The CMMT category system is used to classify messages in
mathematical passages. To do this, the passage is parti-
tioned into units determined by a set of rules and the format
of the passage. Each unit is then classified with respect
to both dimensions of the CMMT category system. The follow-
ing page is an example of a page of text which has been
rated using the CMMT technique. The symbol m-n recorded in
a given unit indicates that the message in that unit is
classified as category m on dimension 1 and category n on
dimension 2.

J99
order principle for additioli(iive ti,! ,,ms ni 1htis J icineinher the
t ,
; 1.)rinciple for (-)chiltion..0
otermmotwa. ,wr .8 I 5,1we + 8 0,, 7-2 ,.)ih(:! r -1-
Since 324 f 2 ()t 589, iwc, L N that 1265 32/ .Since 523/ -1 (3435 -_ 161c,:.v th7435+When we clvinf;e the orair.i2 of the addenda, we k;et the same sum. 1
iCISES
I. Fach exercise c',Lwr),ests an example of the I,t order principle, Give the ex,,inple.40 f
1A1A. A
AAA
A
0
if I. 4 [n] Start-at 9. Count forward 4.
A A Start at 4. Count forward 9.A ;0-4ten, eleven,(Answer: 4 1- 2 + 4)..wft
i--/ cJ Jump 3 feet. Then Runt) 4 feet.
7- 5-
.reala
..---- -A A"I te 4 feet
7-/ Jump 4 feet. Then jump 3 feet.
.7 -5'4feet
..1.111."11.
1(!et
twelve,thirteen
2. Write on your paper the equations that are exzo hples of the order principle., metwielm......wmerowmama......,
1......./1 --Z.[A] 0+6=6+0 [.-ilc.j°2-',
1- .i6----.46+23 / 1.r..127 -35:--72+53,,--2.1n1 23+45=43+251 loiy..1.!,1 :'6 -,---., 15 + 36 ) ri:/mi -i.,..,1 + 35 = 53 + 42wart441,4101%.11.01,111. IL-14 es01/1 =1,01,
.),. Villich7e-Fitations in exercise 2 are true? jr ....ewe* , 1111. .....11,....allaa.n.-IMMINO311.0....111.111111..11111
01, Sol ve Toe q ua Wins . 0
A 13 -I- P 1- 1.3 V- '1. 1,,, 52;r: i =3292 +1% -I ';r) . i 1 I
(cl 364-1- ,ii-21 !;-1 :) 1) 4+ 263)IMI 1(Reprinted by permission.1:1 ementary. School :2!:l.t IICh t i , Boo!: 4,Li-Ch61z and O'1Jaffer,AddisOflOSICYPublishing Company, 1968.)

200
When the CMMT classification of all messages in a
passage is completed the information may be analyzed in ways
which reflect both sequential and quantitative aspects of
the organization of the passage. Sequential aspects are
represented by making an ordered list of the classifications
following the natural flow of the printed material. A
matrix similar to those used in Flanders' interaction
analysis is used to analyze the nature of the interactions
among CMMT categories. Quantitative aspects of a passage
are described by determining the proportion of messages in
the various categories and in logical combinations of
categories. All of the descriptive information for a given
passage is called the CMMT analysis for that passage. The
CMMT analysis for the passage on page 3 follows.

201
List of Messages in Order of Occurrence
Dim. 1 Dim. 2 Weight
(The weight indicatesthe number of areaunits of approximately1/4 of a line of printdevoted to eachmessage recorded in
100
5
4
0
6
1
0
1
1
0
2
3
1
2
3
3
1
6 1 1 the list.)6 2 2
6 1 1
6 2 2
6 1 1
6 2 36 1 1
6 2 1
0 0 32 1 40 0 4
10 1 1
0 0 34 1 35 1 1
0 0 43 3 63 2 2
7 1 410 6 127 1 2
7 5 4
7 1 2
7 5 40 0 45 1 47 2 8
7 1 2
0 0 2
5 1 1
0 0 37 2 12
End

202
Frequency Matrix for Dimension 1
0 0 0 0 0 0 0 0 0 0
0 3 0 0 0 0 0 0 0 1
0 0 7 0 0 0 1 0 0 0
0 0 0 4 1 1 0 0 0 0
0 0 1 1 4 0 2 0 0 0
0 1 0 0 0 12 0 0 0 0
0 0 0 0 2 0 34 0 0 1
0 0 0 0 0 0 0 0 0 0
0 0 0 0 0 0 0 0 0 0
0 0 0 1 1 0 1 0 0 13
Proportion in Each Category for Dimension 1
(The entry n inrow i and columnj indicatesmessage type iwas followed bymessage type j,n times in thepassage. Blankspace is ignoredin this matrix.)
Category Proportion
0 .2251 0
2 .0433 .0874 .0655 .0876 .1417 .4028 09 0
10 .174
Proportion Exposition .196
Proportion Content Development (1 thru 4 plus 6) .537
Proportion Requiring Responses in Content Development .419
Proportion of Exposition in Content Development .581
Proportion Requiring Responses .630

203
1requency Matrix for Dimension 2
25 7 1 0 2 1 0
7 23 0 0 0 0 0
0 1 5 0 0 0 0
0 0 0 0 0 0 0
2 0 0 0 6 0 0
1 0 0 Q 0 11 0
0 0 0 0 0 0 0
Proportion in Each Category for Dimension 2
Category Proportion
0 .2251 .3912 .3263 .0654 05 .0876 .1307 0
Proportion Mathematics Illustration .152
Proportion Illustration .283
Interaction Matrix Dimension 1 and 2
0 0 0 0 0 0 0 (The entry n in row i andcolumn j indicates message4
0
6
0
2
0
0
6
0
0
0
0
0
0
0
0
0
0
0
0
0
type i on dimension 1 wasof type j on dimension 2,n times in the passage.)
8 0 0 0 0 0 0
4 9 0 0 0 0 0
10 20 0 0 8 0 0
0 0 0 0 0 0 0
0 0 0 0 0 0 0
4 0 0 0 0 12 0

204
The information about a mathematics passage which is
provided by CMMT analysis could be used fcr a number of
purposes inv.,lving both practical application and research
in mathematics education.
1. CMMT provides a means for describing mathematics
text in specific terms. Such information could be
useful to textbook authors, publishers, and text-
book selection committees.
2. CMMT provides a means of manipulating and control-
"ng textual variables in experimental studies
using printed mathematics material. Thus it could
be a useful instrument for researchers studying
mathematics text materials.
The purpose of subsequent sections of this booklet is
to provide the reader training in the use of the CMMT tech-
nique for classifying messages in mathematics text. Complete
descriptions of all of the categories with examples and
general procedural techniques are given in the following
sections of the booklet. The final section includes numerous
keyed practice passages which the reader may use in training
himself in the use of the CMMT technique.

Description of Dimension 1 Categories
0. Blank Space: Any unit which is completely blank.
1. Definition (Meanings of words or symbols.): Messages
whose primary purpose is to give the mathematical
meanings of words, symbols, or phrases. Any statement
of a definition or any description of a mathematical
term. May be integrated into the written text or set
off as a formal definition.
2. Generalization (Important rules, axioms, theorems,
formulas, etc.): Messages whose primary purpose is to
give important general mathematical concepts, ideas, or
procedures. Any statement of an axiom or theorem. May
be integrated into the written text or formally set off
as a rule, formula, principle, etc.
3. pecific Explanation (Concrete examples and discussion
in specific terms.): Messages whose primary purpose is
to give specific or concrete instances of general
concepts, ideas, or procedures. Specific, examples of
general definitions, axioms, or theorems. Any discus-
sion or explanation of concrete examples. May be
integrated into written text or specifically set off
as formal examples.
4. General Explanation (Proofs of propositions, general
discussion, etc.): Messages whose primary purpose is
to explain or discuss general concepts, ideas or pro-
cedures. Any proof of a formal proposition. General

206
statements which seek to clarify, justify, show how or
why, etc. May be used to introducJ, relate, or sum-
marize aspects of a passage. Expository statements
with mathematical content which are not clearly classi-
fiable as 1 through 3.
S. Procedural Instructions (Directions.): Procedural
directions appearing anywhere in a text passage. May
indicate to the reader what he is to do with a set of
exercises or problems. May be stated in the form of a
question. Does not apply to directive statements con-
taining substantial mathematical information.
Typical examples:
a. Solve the following equations.
b. Complete.
c. Look at Figure 7.
d. What are the solution sets for the open sentences
belch'?
6. Developing Content (Questions in exposition, develop-
mental activities, guided discovery exercises, etc.):
Questions, activities, or exercises designed to help
develop content. May call for verbal discussion,
physical activity, or thought or written responses.
May be designed to guide the student to dis,over some
mathematical concept. Exercises or problems whose
primary purpose is to develop or present new content.
Questions, activities, or exercises integrated into the

207
exposition which are designed to make the reader
participate in the development of the content.
7. Understanding Developed Content (Exercises involving
routine computation, practice, identification, etc.):
Exercises which are clearly on the knowledg' or compre-
hension level of Bloom's Taxonomy. May involve lowest
level of application where a generalization is used in
a situation essentially identical to the situation in
which the generalization was presented in the text.
The emphasis here is on understanding the content which
was presented in the text. May involve the recall of
specific information and procedures or the understanding
of presented content with only routine alterations of
material. May involve the use of material without
relating it to other materials or situations or seeing
its broader implications.
Typical examples:
a. Exercises of a purely computational nature.
b. Exercises intended to give practice in a skill or
procedure.
c. Exercises which are essentially the same as
examples given in the text. That is, exercises
whose solutions depend on the imitation of
examples worked out in the text.
d. Problems which require only a direct routine
application of a definition or generalization.

208
Such as finding the circumference of a circle
with a given radius. (Where the emphasis is on
understanding the generalization rather than on
using it to find solutions to problems.)
8. Applying Developed Content (Real world problems, appli-
cations of generalizations in concrete situations, etc.):
Exercises or problems which are on the application level
of Bloom's Taxonomy. The emphasis here is on using the
content presented in the text in a new or different
situation. The new situation may be mathematical or a
real life or physical situation. May involve the use
of an abstraction in a concrete situation which the
student has not seen before. Involves the recall and
uliderstanding of information and in addition the
utilization of the content in a non-routine manner to
find the answer to a problem.
Typical examples:
a. Using general formulas or procedures to solve
mathematical problems.
b. Using general mathematical principles developed
in the text to find solutions to real life
problems. (Word problems.)
c. Applying general definitions, axioms, and theorems
in concrete situations or to specific mathematical
models.
d. Interpreting concrete examples in terms of general
structures.
i

209
9. Analyzing and Synthesizing Developed Content (Proving
propositions, finding new relationships in developed
content, unguided discovery, etc.): Problems which are
on the analysis or synthesis level of Bloom's Taxonomy.
May involve the breakdown of content into its basic
elements so that relationships between ideas are made
more explicit.
Typical examples:
a. Problems requiring the proof or disproof of a
proposition.
b. Problems requiring the discovery of new relation-
ships between elements of developed content.10. Other Material (Headings, non-mathematical materials,
etc.): Messages not fitting categories 0 through 9.
May be headings of sections, exercises, etc. May be
motivational or historical material. Messages which
are non-mathematical in character.

III. Notes on Using Dimension 1 Categories
A. Begin by ment y delineating between the blank space
(0), exposition (1 4), messages requiring responses
(5 9), and other material (10). This will make the
task of making finer distinctions easier.
B. To rate exposition (1 4):
1. First eliminate definitions (1) and generaliza-
tions (2) .
2. Of the remaining exposition, classify all messages
giving specific instances of more general content
as specific explanation (3).
3. Classify the remaining exposition as general
explanation (4).
C. To rate messages requiring responses (5 9):
1. First eliminate procedural instructions (5).
2. Base decisions involving exercises and problems
(6 9) on the processes involved. Do not base
these decisions on the difficulty of the problem
or exercise.
D. Illustrations as well as written messages must be
classified on dimension 1. The classification of an
illustrative message is determined by the same rules
as the classification of written messages. If a
diagram illustrates a definition it is classified as
a definition, if it illustrates a proof it is classi-
fied as general explanation, etc.

211
E. When in doubt about how to classify a message reread
the descriptions of the appropriate categories.

--111,-
212
IV. Description of Dimension 2 Categories
0. Blank Space: Any unit which is completely blank.
1. Words: Messages which are made up predominately of
ordinary English words.
2. Mathematical Symbols: Messages which are made up
predominately of mathematical symbols.
3. Representations of Abstract Ideas: May be drawings to
illustrate abstract sets, Venn diagrams, mapping pic-
tures, geometric diagrams, etc.
4. Graphs: May be bar graphs, line graphs, circle graphs,
etc. Or, may be number lines or various types of
coordinate system graphs.
5. Representations of Physical Objects or Situations:
Must have some mathematical content. May be drawings
or photographs of real objects or living things which
illustrate mathematical content. Could be cross sec-
tional diagrams, maps, plans, charts, etc.
6. Non-mathematical Illustrations: Non-mathematical in
nature and not illustrating any mathematical content
being considered. May be motivational or historical
cartoons, photographs, or drawings.
7. Combinations of Illustrations with Written Text: May
be some sort of diagram which contains substantial
mathematical information in the form of words or
symbols. Includes all mathematical tables, flow charts,
tree diagrams, etc.

213
V. Notes on Using Dimension 2 Categories
A. To decide if a written message in a unit is predominately
words or symbols, count the words necessary to say the
message. If the symbols account for more than or the
same number of these words as the ordinary English then
classify the message as symbols (2). Otherwise, classify
the message as words (1).
B. When classifying messages (3 7) eliminate the non-
mathematical illustrations (6) first. Then make the
remaining classifications. When in doubt reread the
appropriate category descriptions.
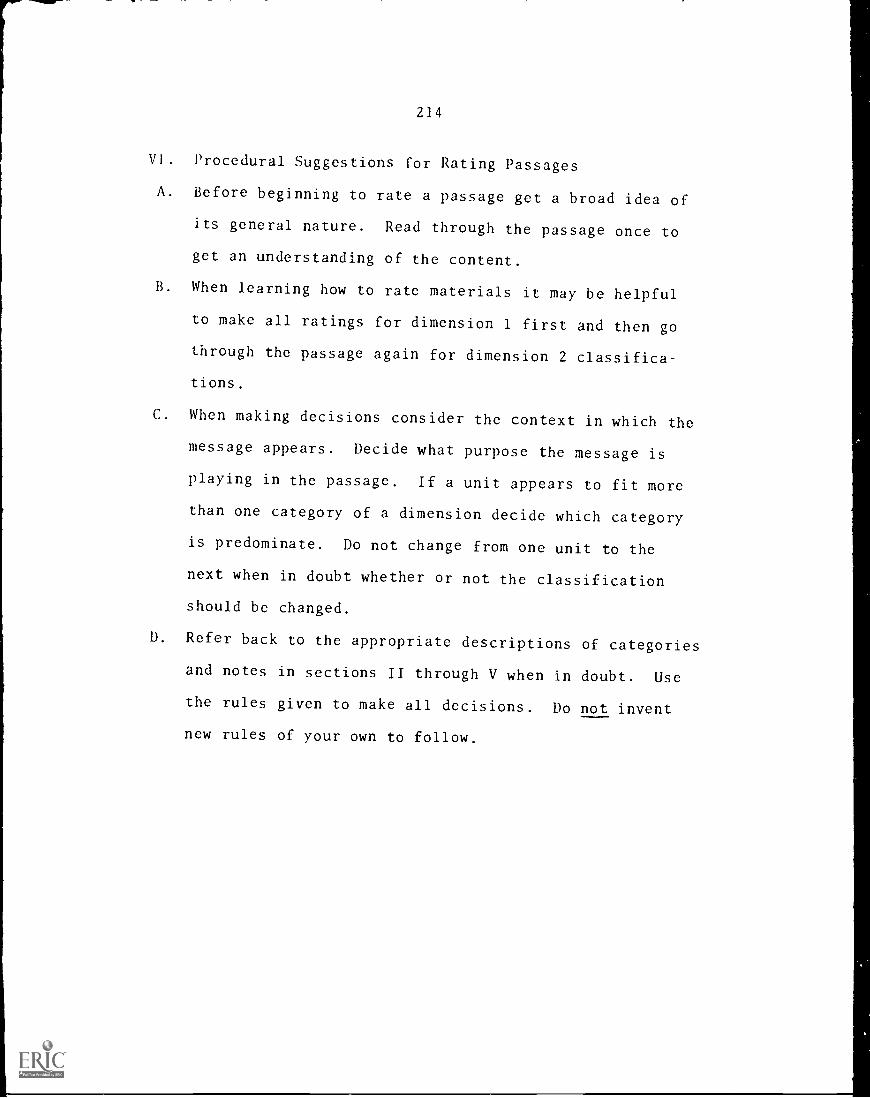
214
VI. Procedural Suggestions for Rating Passages
A. Before beginning to rate a passage get a broad idea of
its general nature. Read through the passage once to
get an understanding of the content.
B. When learning how to rate materials it may be helpful
to make all ratings for dimension 1 first and then go
through the passage again for dimension 2 classifica-
tions.
C. When making decisions consider the context in which the
message appears. Decide what purpose the message is
playing in the passage. If a unit appears to fit more
than one category of a dimension decide which category
is predominate. Do not change from one unit to the
next when in doubt whether or not the classification
should be changed.
D. Refer back to the appropriate descriptions of categories
and notes in sections II through V when in doubt. Use
the rules given to make all decisions. Do not invent
new rules of your own to follow.

215
VII. Practice Passages and Keys
Instructions for Using Practice Passages
A. Rate each practice passage in this section by classify-
ing each unit with respect to both dimensions of the
CMMT category system as in the example passage in
section I. Record the appropriate symbol of the form
m-n in each unit. Refer back to any materials in this
booklet as needed.
B. When you have completed rating a practice passage
check your ratings against the keyed passage on the
page following the practice passage.
C. Rate practice passages until you feel you have mastered
the CMMT technique. If you agree with the key more
than 90% of the time you should feel fairly comfort-
able. Rate practice passages until you have achieved
the 900 level.
D. When you have mastered the CMMT technique rate the
passages in the CMMT Technique: Experimental Passage
Booklet.

216
Practice Passage 1
Using the order and grouping principles. --1--------1
order,Change theb"4 and the product is the same.
groupinii--'1.
These examples help show how order and grouping changesaffect the product,12 X 10 X 3 X 6.
--We could group these: We could group these:
. IWO
We could group these:----,,--
,1
2 xl0x3x1020x 3 x 10
60x10600
2 xl0x3x1030X 2 x 10
60x10600
.t ,
2x10 x3 x1030x 2 x 10
60 x 10
600....,
We could group thcze: I.....
We could group these: We could group these:---11 tr
2 x 10 x 3 x 10
6x 10X 10
6x 100600.
2 x10 x 3x10
100X 2 X 3
100x6600
2,00 x3 x1020x 10X3200x3600
Because of the order and grouping principles, you canI multiply any two factors first and et the same I roduct,......1 Study this example.
'1')ISCUSSION EXERCISES. .
20 °X 30'_
® (2 X 10) ). (3-.0.0)
8 (2 X 3) x (19)00)
® 6 X 100
0 600j
i1 l. Explain step 1. 1
f
rWhiGh two factors were choser212multiply first in step 2?
J.:
3. Explain steps 3 and 4.
4. Solve: 20 x30..1111
EXERCISES
'4. Solve the equations.
= [A] 40><60=.4 x10 X 8X 10==p1 (E] 8ox9o=sxioxgxio=in!i Fs] 50x60=5x 10 x 6x10=0 [r] 30 x50=3 X1OX 5 X10 ----Inl_
Id I GO x 70 -,..,. 3' r. 10 X 7 X 10= ;r11 l fol 90 X 600 ,:, 9 >4 10 x (: x 100= !ii
i IA 70 X 80 =,. 7 x10 x 8x 10 .,.. LT',
I [n] 800 X CO= Z.; X 100 X q ;< . , -- L
(Reprinted by permiss ion.Elementary. School Mathematics, Book 4,KTEE077, and O'DTfer, Addison-WesleyPublishing Company, 1968.)

217
Iwy to Practice Passage 1
Usi-------- --- -------.-..-,,.n-i, the orcier'ind grouping principles 0
,order, 2. -./Change the '`
oi.-1 and the product is the same. 0
These examples help show how order and grouping changesaffect the product,-2
S-1X 10 X 3 X 10.
3-2-{ qo could group; h!so:.........__, We could grot113411ese:"'"'T''j"--
2x10X3X1030x 2X 10
60 X 10 3 -'t600
We could grouf.!..;!!e.se:,4 er
2)<10x 3X 1020x3 x10
60 x 10 -FL600
21
2x10x3x1030x 2 x10
60 x 10 3-7-600
\ie.! could group7f.!;.ose: We could groukAese: We could groue."1;;ese:
2 X10x3 X106X 10X 10
6x 100 3-1.600
2 X10x3X10100X2X3 / ..
100 X 6 "'"600
2 X10X3X 1020X 10X3
200 x 3 3-7.600
9-Because of the order and grouping principles, you can
multiply any two factors first and ,et the samezoduct.a
Study this example .t, oniscussioni ExErt..;..;13
'",a.)' 30'. 3-2.0 (2 x 10) )( (3'x.1:0)
C) (2.X 3) x (1.0x ,10)C)) 6X 100j0 600j
, Explain stec:ze.c.1 012. Which two fr.ctr,rs were chaentol
multiply firms; ilia step 2? .,
k Explain steps 3t:Inti 4.
1,1. Solve: 20 X 30 :=--- jrijk.)14.
iF;;EI;c:',Tr-, 0: `,-;n1v2 the cdtr.ta7.1
1,, I .10 x 60 :--- 4 X 10 X 6 5V.1077: 'in 1 (al 80 X 90= 8 x 10 >; -:,;;;10 ,---. in!
I e d -,0 X 60 ... 5 X 10 X 6 ;.1ri, :, !ill I i f l 30 X 50 = 3 X 10X --...10=1111113.,112ANO
I I ' , f ) X 10 sx ): . [id 1G) 90 ); 60:) = 9 X 10 '; 100=4. new.
b;i 70 ,< ,;() 7 x10 3 :; [id [H] 800 x E0 8 x 10= in
(Reprinted by permission.Elementary School Mathematics, Book 4,hicholz and O'llaffer, iVddison- WesleyPublishing Company, 1968.)

PlActice Passage 2
213
_I%_ 'rrY iindiiii: ,ts, -: ...,.1-1;:zta \:ithout, rnicil and paper..... .
a. 4 X 50 G b. 3 X 800 J c. 9 X 30d. 3 x 40 e. 7 X 600 1 f. 8 X 7,000g. 4 x 3,000 b. 5 z 80,000 1 i. 4 X 60,000_____ .......... N..... . "roe. ..............................".1.
2. I low doe:3 IL: df.:11.ibutive property help us find..,.. .1.11. °dila N .1 ;: 0 and complete.
5 X 4,683 X ( i,00(i GOO + CO + 3)(5 X 4,000) -F (5 X 600) + (5 X ____)
+ (5 x 3).-.. 20,000 + +
3. a. Explain how ;;,,ch partial prod-uct
h. Add to tin:1 i 1 product.
e. Find the pariial prodneta in6 x IMMO.
d. Add to (MA (he product. I
6,294x832
7201,600
48,000
4. In the !liort ndd nrcthiets as we multi-ply.1Copy an:t c;.hwlete th4 n;,nit fort-i.
4 1 0*N.L. oMMOM.
1 3 4 1
i 2,5 8 3 4 2,5 8 3 4:2,5 8 3X 6 X 6 X '6:98 498 .5,4 9 8
4 2,5 8 3X6
8 .
Multiply.
1. 3,6',/i 7,029><5 X3
5. 34,000 t:. 59,W2
,11.11.1.11110A
...____
V. 9!i,374 8. 40,608
(Reprinted by permission.Jemeiltitry_ , Five,
heedy,, et at. , Holt, Rinehart andWinston, Inc., 1970.)

219
Kcv to Practice Passage 2
MULTIPLICAajii
1. Try finding these products without pencil ancf"paper.
a: 4 X 50 e>.-2. b. 3 X 800 .6-L C. 9 X 30 64d. 3 X 40 15-1- e. 7 X 600 6-.2 f. 8 X 7,0000.g. 4 X 3,000641 h. 5 X 80,0000-11 i. 4 X 60,000S-7
2. I-bw does the distributive property help us find% product lilccF37A,683? Copy and complete. c
5 X 4,683 = 5 X (4,000 + 600 + 80 + 3)
0 .
= (5 X A.,,000) + (5 X 602) + X )6'1' I.* + (5 X 3)
= 20,000 + + _ +_= 0
3. a. Explain how each partial prod- 6-I 61.94
X8uct was found. 0
b. Add to find the prods 't. 0* 32
7201,600
. c. Find the partial products in 6-16 x 42,583 G-1, o
48,000d. Add to find the prgluft. 04. In the short form we add partial nrodgeas we multi-
ply. (.121y,..2nd complete the short form.5-1 0.1
4 2,5 8 30.X6
4 1
4 2,5 8 364,X6
3 4 14 2,5 8 364
X6.
1 3 4 142,5 8 34,.
X6,8 98 498 5 4 9 8f
0 /0°4EXERCISES
0Multiply.7-/1. 3,391 7_1
X62. 7,0297
. X33. 5,497.,..%
X7 1-44. 9,902
7-Z X8
5. 34,0007..zx4
G. 59,1027X6
7. 95,374.,..rx9" 8. 40,608
7-2 X7
(Reprinted by permission.Lxplorino hlementag Mathematics, Five,Keedy,, et al. , Ifolc, Rinehart andWinston, Inc. , 1970.)

220
Practice Passage 3
sing iv_iwtti,,I,:, 1 luol,laiLies
IA 12 fool Lo-rd is cut into 3 Acces of eqaal length. To find
the length of each piece, consider thn equation
3 . x = 12 .
Solving this equation we find, x = 4, Hence, each piece is 4 feet
long.
Five girls Lint to tth;ru 23 apples evenly.' To find the greatest
number of whole apples each girl can get, consider the inequality
5 4:23 .
Using the replacement set of whole numbers, the solution sot is
1 0, 1, 2, 3, 4' .1 So the greatest number of apples each girl
can iet is 4. I
bxercises1
Write and solve equations or inequalities to answer the problems.
1. In 3 dz.ys the liner on which Carol was traveling steamed 1536
miles. If it stowed the samo distance ea:11 day than how far
(lid it go each day?
e rs
..........., . ---7-7,-.----.::>, -_...---.......
' ...1
k.;.--4,r,;;. '...4-.6"......'.. ....e- '''.: . ,r,....
"%-........ ...---.. -- \'' ...,...at .40°-""'41::::,-me**".""':,...-e:. Z.... .......
........... ...--.........,...... ................
---.....
2. How many tile would it take to cover th9 floor of a rectangular
room with length 20 foot and width 13 feet if the tile are
square with 12 inch sides? i 1
Id .
,,..----
.. .
!
kth,----,...i
..41 ....,..-
'3'
.-' i '.11;
,-----
.....
..,

Key to PrActice Passogd 3221
U :u.,)zz . ;uations .,1 ithi i. :A ) . i ...;.) -1 I 0A 12 root. ho i(i -i:i cut..:,i:ito 3 deces of equal length.
._ eTo find
',he 1,:ngth oijetly.L ,Loco, 1:4).1:,i:a the equation 0
0 -/-2.
3 .. x --: 12 :1 0..olving thisvpation .,...e -;;),..)Lz x = 4. Her.ce, vac piece is 4 feet
../TIT 01.'ive girls t4L:-.t. to-33-.1.re 23 apples evenly. To find the greatest
3-/number of whole a,,ples each girl can get, consider the inoqual v
0 .
Using the replacement sot of whole numbers, the solution set is 7-/-.,
0, 1, 2, 3, 41-.21 So the greatest number of apples each girl 3,/cnn ,et if 4.1 0Exercinl
t 0_10 .Write and solve c'inations or inequalities to answer the problems.g/
1. In 3 days the liner on which Carol was traveling steamed 1536-i miles. If it :,teamed the same distance each day than how far
g-'1 did it go each day? [ 0._....4
_............ ____ 4.....,.6...I.7=-., -4=2--....,.----,,,:.............ID- S , 2.....,-.--,.- .......
........... ---.--,,-.--.:-..-.:..,- ..,,,.4.1....
^%....,...... .... -"..-....., '''' :,:-........:.: ,:rv........,..=.,..wes...........
.........
......................,_. .........- -.....
-- ......-
2. Bow many tile would it take to cover the floor of a rectangular
Q ...0/f"
1.30M with 1.(!ngth 20 feet and width 13 feet if the tile areusre with 12 Inch side:;?
N... ogi. . . .......... 1 10-6.... . ...v..",
! _..0... A ( 1/,'. ....
.......::...... . ?. . .4 '.'''' 0'.
1 r-71.7.r1) -'..0-....O.. / 1 /... 0....
i l'i..
1
t.....--
\r.
is

222
Prac t ice Passage 3 (coat .)
3. How ninny
12 feat?
5 foot borIrdo can be made out of 17 boards of length
/.....---v....---'-----;
f'''r...-
=1 `if\s
4.3
,....._----,,,._____,_.--
---,i,:t...,...,
1
4. If you bought 25 hotdogs for a cookout
cookout has to have 3 hotdogs, what is
people you could have at the cookout?
and each person at the
the greatest number of
v.
....
,L
. /
35. Penny scorod 25,
....._ (AKA
scored125, 10, 25, and5. In a dart game Sam
25, 15, and 20. 'rill° won the game and by how much? 1
--.......
--

223
K(), to Practice Passage 3 (cont.)
3. How .iwriy 5 foot 1,,:nrds cvn be made out of 17 boards of length
9-/ 12 feet?
0
10 -
---. r
4. If you bought 25 hotdogs for a cook-out and each person at the
cook-out 11-:s to have 3 hotdogs, what is the greatest number of
people you coul d have at the cook-out? 0
C*7;I 0-6
54.E In a dart Game Sam scorcd1251VN.25, and 35. Penny eared 2
g,1 25, 15, and 20. Who won the Am eland by how much?
10-6
111.

224
Practice Passage 4
,sini; luatious ),iii Inelu7dities I
Lquations :Ind ine,iq.dities cnn be used to solve real world problems.
To do this follow the steps outlined below.
1. Exnress the unknovn quantity or what you want to find as
some cyMeol, sty x.
2. Using the information given write an equation SUCh as
a +x=b1or en inequality such as
x c .4:d
relating x to known quantities a, b, c, and d.
3. Solve the equation or inequality to find the values of x
and thus the answer to the problem.1
Exercises
Writo and solve equations or inequalities to answer the problems.
1. In 3 days the liner on Which Carol was traveling stealed 1536
miles......
If it steamed the same distance each day how far did
it co each day1J
I...4....
..--te;---*--
&Ay, 7 ............-A
NI:' dayX e1/4M5
eit4f.
2. How many tile would it take to cover the floor of a rectangular
room with length 20 feet and width 13 feet if tho the aro
square with 12 inch sides? J 2,0
::.
P

225
Koy to Practice Passage 4
i ;
_: i !I', ivol;ti..)na H 1w:1101:Act)
....,,
0
iHuntions to.d inf-i,,,lities c: n be*r,;;14 to solve real world prouleme.
To do this follow the steps outlic.1(below. 01. Express the unknown quantity or what you want to find as
if-1some symbol, sty x. 0
2. Using the in414tion Liven write an equation 'Etteh as
C) a + x i4.14_ c)
or rn inequagq such ari
i) x c <citi'.1
CMrelathT x o _mown quantities [a, 1)383.11nd d.
3. Solve the equation or inequAity to find the values Of x
--/end thus the
iianswer to the problem. C)
oIExerciises 0
/Write and solve eqdakons or inequalities to answer the problems.
. In 3 days tile liner on which Carol was traveling steamed 1536
8-1 miles. If it steamed the same distance each day how far did
5-/ it go each dp:,1 IT 0.....
V-5- ,?.. dayl 4..............2,......4
Nt ,Ilety 2.
2. How many tile 6ould it Lake to cover the floor of n rectangular
IN room with leni;th .:0 feet and width 13 feet if the tile are
sqwire with 12 inch :Adesd 2.0
0
._....
773-1"r-tr-7
4...1.
t :Ai14JA
I. -5"
,.

226
Practice Passage 4 (cont.)
3. flow many 5 foot .(,.n!s cm uc adc out of 17 bo;.rds of icnbth
12 feet? 1 F-- . D1
1 i
l L... 1
1 %
4 1 1
110
1
1 1
ri r .(
1,..,..........--A.............../
5-, 5"2!
1. If you bought 25 hotdogs for a cook-out and ec.ch person at the
cook-out hits to have 3 hotdogs, what is the greatest number of
new)le you could havo at the cook-out?-----.
o 0
o O o o o
o p p 0 o
0 o
o 0 o
5. In a dart ca-e Sir, scorcd125, 10, 25, .nd 35. 'Pawky scored 25,
5, 15, .nd AO. LLo Lon tnc L;z...iu :..Id oy how :-.uch?)
--------...54.,\ ratiel,
.
ZS-
10
i. 5"
3 5"
I
ZS'
2$
IS2 0

227
key to Practice Passage 4 (cont.)
3. How ,,prn-, 5 fuo.,, .rds c :11 be ;:de out of 17 bords of lcnLth
g'l 12 feet?
6 S
Cj-5-
s'
0
. If ou boucht 15 hoLdol:s for a cookout and et ch person at the
17../ cookout 11.,s to have 3 hotdogs, what is the greatest number of
neolle you could have t the cookout?
0
0
5. ?../1n a dart c. o Se.A. scort6 25, 10, E nd 35.
g 15, O. I bI o
0
Penny sC-cfred
ffr(.1 ty luch?
1*......w.IIINMOIYIMI,Sam
0 ZSa5- I 5'
3 5" z 0
(7.0 5.

Paris is the capital of Spain. 1
228
P r t icc Passage S
30 1 Exploring ideas
Ordered pairs
Er sonic time now You 1 :tve been studyingsets and conditions 1ln this lesson and in sev-eral of the lesions that follow, you will applywhat you have learned to sets and conditionsthat differ in some ways from those you havealready studied.
A Look at DI Think of the capitals whosen;:incs arc listed in n I WI :1 ',et of cities.t ,et of cities set Allabulate A.B Think of the countries who: names are t im is the capital of Spain. Ilisted as a set of counttle., Name this set ofcountries set 1311-abulate
c Is it possible to decide \v1 ether the idea ex-I pressed by the sentence in D2 is true or
fake Explain your answer.o I low many different variables are there inthe condition expressed in D21 I low many dif-ferent variables were there in the conditions H When you replace n by Spain, you obtantthat you studied in previous lessons? r the condition expressed in D4jIs it possible toE You will use the meirfters of set A as re- decide whether the idea expressey the sen-placements for m in the condition expressed tence in D4 is Due or false? [Explain yourin D2 'Why can you us,: Pail., as a replacemen: answer.1
for Why should ...oil not t Spain as a i When a condition contains tw, variables,.-replacement for in? must you make a replacement for each vari-F When you replace fir by Park,_you obtain able in order to obtain a statement ?1_the condition exprer,sed in t22phy is it not J Now replace m by Paris and n by Spain.ID0possible to decide whether the idea expressed you obtain the statement expressed in 1)51 Isby the sentence in D3 is nue or fal252.1 the statement true? IG YOU will use the ntemheis of set R as re- You used Paris as a repI:icement for in andplacements for n in the condition expressed in Spain as a replacement for /1 in the condition
L,,, you u,c :I1,:na as a replacement "in is a capital of n." Note that you used afor n'ffliy should volt not use Park as a re- pair of objects to obtain the statement ex-
Lplaernnent for nif pressed in D5.1
(Reprinted by permission.See_ing Thyoug.h MzI thorna ti cs , Book ,VanEngen et al . , Scott, Forsman andCompany, 1962.)
01
CITII.ti C011N1 ItrI S
Paris NorwayOttawa France
.Madrid Spain
Canada
m is the capital of n.
LParis is the capital of n. I

C t17 is the capitai3g4ipain. 1
229
Key to Practice Passage 5
) 30 lit+plotinfj ideas
Ordered pairs
,2 or some tiInc now VOU have been studyingsets and conditions fin this lesson and in sf.,.v-eral of the Irons that follow, you will applywhat you h; iilt3-7earned to sets and conditionsthat differ in some ways from those you have
CAPITA!. CITII:S
Paris
Ottawa,Madrid
6-7
I
01
COUNTRii S
NorwayFrance
Spam
Canada
D2
I in is the capital te-ri
:IIIC;Idy studied. QA 1-0041( DI hhink pf.-.'heartals whosenames are listed in DI setoT cities tNamethis set of (6:tioS set A.Ilaiqte An hank of thcp-,:ountries whose names arclisted as a set of'counti ies Name t tglset of
Paris is the ca?3fflof a.
countries set BITal.ftrOe B,
C is it possible to decide whether the idea ex-,)pressed by the sentetTcc in D2 is true or
Cake \plain you off1 TF\;cr. ()D I low many different ;variables arc there inthe condition express n D2I I low many dif-ferent variables were tire in the corlditionsthat you studied in m''eTious lessons?! 0E You will use the.inembers of set A as le-
,
placements for in condition expressedin 1)2 1Why can you uTTlk ris as a replacement
for 1,1? Why should ;',mt9 not use Spain as areplacement for in? rF When you repla& M by Paris,you obtainthe condition exprksee(in D3.I Why is it notpossible to dceid;.:wl..,cther the idea expressed
by the sentence inD3'is true or false? noYou will use the,members of set B as re-
(pla(xmcnts for n in-flit `t. ondition expressed inD2,1Why can you a pain as a replacementfor Why shout, ; not uie Paris as a re-
IParis is the capit:TRSNirTl
H When you r ace n by Spain, you obtainthe condition ex ess d in D4. Is it possible todecide whether thejsiea expressed by the sen-tence in D4 is true or false'? lExt6rib youranswer,' 0
When a cond'uion contains two variables,must you make(311placement for each vari-able in order to obtain a statement'? 0
Now replace ni by PI
volt obtain the stat7/Pr.. ,,nt expressed in D5
the statemed trice? e)You used Paris as a replacement for in and
Spain as a replac eta for n in the condition"in is a capital of n."1 Nor pat you used apair of objects to obtain tht statement ex-
4110, n by Spain. Do
Is
placement for n' pressed in D5.1

230
Practice Passage 5 (cont.)
;lc 11:,t ob:CCI p fir, Pais, iti the/int
_I hr e first compo-
t,elt .1 mk.tu,:r ()I \..hI. I he second object of he pair. Sp,un, is thecond c omponew or El he second corn-
,
ponent is a member ,)f ?
In Inc exeicises ab,,vc, you used a city forthe first component ard a country for thesecond component (f a, pair of obil.:ELF\ pair01 ofijc,;ts whose Com; n occur in a specialorder is an ordered pair.
m Look .It iT4Notice mat the names of thecomponents of the ordered pair Paris, Spain.trc itten within parenthesejp6 also shows II
how to icad and write the name of this orderedpair. fN hmk about the condition ',» Is the c1)italof n."1 When you replace in by a member of(Paris, Ottawa, Madrid) and n by a member I.
of (Norway, France, Spam, Canada), doyou I
Obtain a statement?..] Do ilTe sentences in D7cx piess all the statern,:nts you can obtain?
o For each ',mimetic csprcssed in D7, writethe name of the ordored j2air that was used loin;ike re )1acernentsiViludi Co you write first,the name of the replt 1,1ent for in or the name .of the replacement fur III :1
Which of the stakme expressed in 1)7 aretrue?
What oroered pair., %; ere ip:cd to obtain truestatements?R Read the symbol , (Pans, Norway) and
Normal How do the ideas ex-__121 these synth,' Is differ 9,1
yT
Ilqow you will study some conditions that
"The. ordctcd pair
( Paris, Spain )
whose first componsntis Paris and
whose second componentis Spain"'
o6
morsoritwuNiCilliatIlletWaffirmieurmita
A
a
C
0
F
G
H
J
I<
Pans is the capital of Norway.Paris is the capital of France.
Pans is the capital of Spain.Paris is the capital of Canada.
Ottawa is the capital of Norway.Ottawa is the capital of France.Ottawa is the capital of Spain.Ottawa is the capital of Canada.Madrid is the capital of Norway.Madrid is the capital of France.Madrid is the capital of Spain.Madrid is the capital of Canada.
o7asrinoMPIEMINSAUX
03
x < y.A=(I, 2, 3, 4).B = (2, 4, 6).
=:..sorocouralinvineramessav
or dero(laair 6'1.41 -id lir) A pair of ol)-! Jecis )t. Rtii ii the l.Th (,CLor in a spcoal
nr111 "i Ot)ftel, 0,c1 :N hrq is the firstcomponert L! t) t ;/11-olt 1 of :he orderedThe objitt that o.utt, tor.d t5 ti,e secondcomponent of the oldert.t1 pair
::racaratsxmarr oveencot.:". -;.:Llarcscr
eon,:ern tiumb.
:l1.,° Ieai n about or- a Also read the tabulations of .ett, A and B(1,reci npirs , are numbers. i)8.FlOTI will use tilt members of set A as re
in are the x vj You will use thVaC1 ,41.L.: iti ILZ )ti cNi,res.;Ld by t!IC members of set as replacements for y I:.
A
TT RD FROM BERT 4VAIIART F COPY

231
Key to Practice Passage S ;cent.)
K 111e tank on:.cl,ol the pair, Pals, is theconiptwenrul 111.2 011r ri he hi compo-
n.,;nt PI a member of k sir set? r 0-4%
The second Oct of the pair, Spain, is the ;
%crew/ m/pew/a c f the paid fhe second com-ponent is a member 0%; c,' at set? j o
In the exercises ;wove, you used a city forthe first component-Pormit a country for thesecond component (% 12:1 r of objects IA pairocohicck whose occur in .1 specialorder is an a/dem/min% 0M Loo',...}-77q Notice that the names of thecomponents of the ol;',,;(4:d pair Paris, Spainare written within parentheNe_sjD6 all showshow to read and write the name of this?u.cleredpair. oN hank about the coi.:r1j4i "in is the capitalof LiWhen you replace ni by a member of(Paris, Ottawa, Mad; ,.,7j-r(Ild if by a memberof (Norway, France, Spain, Canada), do youobtain a statement Do khti.teniences in D7;2\ press all the statement., fou Lin obtain?O Ior each statement exprstl in D7, writethe name of the ordered taut that was Utied tomake replacemcwsfVhich d(o..yr write first,the name of the replacement 161. in or the nameof the replacement for /II 0P WhICh of the state, 's expressed in D7 arctrue? 0
file of; coed pair 0
( Paris, Spain )
3,whose fist componentis Paris and
whose second componentis Spainl
06 0Ismadosarmsaamonarersimannl,
V 0A Paris is the capital of Norway.c Paris is the capital of France.c Paris is the capital of Spain.co Paris is the capital of Canada.E
F
G
OttawaOttawaOttawaOttawa,'Madrid
MadridK Madrid
Q What ordered pair t.;;; used to obtain truestatements?'R Read the ,...7,..mbols (Pans, Norway) and
( Paris, Nora,i).1 117 do the ideas ex-by the..e symhok.dlazif
0 ii
is the/t', 1pital of Norway.is the of France.is the capital of Spain.is the capital of Canada.is the capital of Norway.is the capital of France.is the capital of Spain.is the capital of Canada.
0,
<A = T, 3, 4).13 = (2, 4, 6),
0P-1or tiered pair ,; )u., j)..r, A paitni on-
v thc in a speolal(ird.111 ohject tr.at nis 7e first(t.oyt,flent rut I ;h` 1:kw ! d }lair
00) hal Uck LI:"S t on,dcomponent ozdcrcd pair.
.xweissrlyiwkipmmtrarimet ="zr.:kt ow you will study soinc1,1T/Clditions that
n numbers (You will in about or-iclered nan-s whose comnonents arc numbers.
A Read the open,.'c.. :ace ire DS.I What are thevariables in the condmc,,,-L. Treszed by theSenter.C(11
00
ti Also read the tabt....,,:ons of sets A and B 11
will use the members of set A as reN
_Lie:mews faire v.jY0,,y sell use the01. Set B as reelaceniems for v

PIACtiCe Pd: .Sage S (cont..)
232
C obtain a niit nom a condition in1,0 111.1111c,, you inn t elnke icplacements for!low mdm., v.mablvsio Do the sentences in 09 express all the state-ments that you can obtain Irom x <y whenyou use thc members of set A and set 13, tabu-lated in 0)Zis replacements for v and y?E Think of the statement expressed by the firstsentence 09. ( I, 2) was used in making re-Hocements to obtain th us statement 1010 showsa short and convcine way to read and writethe name of this ordered pair.'
_A , II, 2, 3. 4),13 = (2, 4, 6).
ot3
A:csicaram-ogralorzrracrit!I < 2, 2 < 2. 3 < 2. 4 < 2.
1' I <4. 2 < 4. 3 < 4. 4 < 4,1 < 6. 2 < 6. 3 < 6. 4 < 6.
I ; 09
:;,Irrmr.v.s..1.-tritittztauaroar-seccr",,M.,..cumai;F 1.cl foul of the' statements expressed in I
Toil or each statement, name the ordered pairthat was used in making replacements for xand t; rG Which statements expressed in o9 are true?What ordered pairs wets used to obtain truestatements? 1
H The sentencesix I v = 4 and x -1- v = 4 ex-,press two conditions! Flow many different
,.0 tables are there in each condition 11 low dothe two conditions tiller? I
"The ordered pair
( 1, 2 )
ione, two"ol0
4-z-srgzosoccrzt.2-rataz. zr..xratnotaxiatirtrom
In this lesson you have learned that orderedpairs are used to make replacements for twovariables.
On your own I
Wnte a name for each of the ordered pairsdese7nbed in exercise', I through 5.
The ordered pair whose first component isMark Twain and whose second component isMtn Sawyer [
2 The ordered pair whosL first component isMaly and whose second component is guitar
3 he ordered pact MIONC first component is
Four conditions ate expressed in exercises 6through 9.17Use the members of set C, tabu-lated below, as replacements for xfUse themembers of set D, tabulated below, as replace-ments for y !For each exercise write sentencesto express all th,.; statements that you can ob-tain from the condition:filen write "T" aftereach sentence that expresses a true statement.. C = (2, 4, 6). U =15, 10, 15).6 6 + y. 8 x + 4 = y.7 X + 5 Ky. 9 1' > X-1- 1
to In each ordered pair expressed below, thetxeond component is 3 tunes the first compo-,:1L01.10n, of the components is missing iCopyeach symbol and supply the name of the miss-ing comnonem. L
(1, ) (4, ) ( (2, ) ( 241
II In each ordered pair expressee below, theI S° and whose second component is 8 P.M. first component is 3 more than t:,... second coin -4 4 'the ordered pair whose first component is ponenti One of the cornponL is missing...__.
Lan y and whose second component is 141 Copy each symbol and supply the name of ther1 r (8, ) ( , 1g) (12, ) ( 29)
5 .1 he ordered pair whose first component is riAs111", tomPouLnt Iand whose second component is 13
, I)t

233
Key to Practice Px,sagc 5 (cont.)
C 111 0.10 1,11 .1 '.1.1!C111, 01.1 l,)Itl!i(1011°Ii %()It 101'
0.1 '11% %'.1'.1.1!)1)." (;D 11,1C ,0:1? tt.0 to i,') .11I 61e
oth.it (.111 0: I I, front .V yyou me the it1iTI nI set n, tabu_
<A r (I, 2. 3.
13 -- 2, 4, 0).
aciru Aginft,..41.1141' tin .fr.e leactiallMns4111SW
1,11c41, ',1S, 1.:1` 1( 011 ie 1, \ :1:1(1 1 < ). 2. < 2. 4 < 2.E 1 ion!, of the sLilei.ono esprsscd 'oy the hest I <4, 2 <4, <4. 4 <4.sen.1, t- I 2 s .1. i!! nt nialsin3 I < U. 2 < O. 3 < 6. 4 < 6.
incnis 0111.111 it 111SIt 11)1().,howsc9.t \holt mid 1...onsehIcot It; read mid 551 Ile
.tas..t-uLtaxisa, Z3.* 4.L aAnts.a.s-...L.mutrmammompoices
. -s L
Co, d , I - he ordenril pair1.2 j1 i -.14.11 'A:lien \Olt, 13,1) hc oidered pair ( 1, 2 )t!iat w.ts used in in.11.1110, 1.:p..iecny:nts for V '
,nd v., .1 DIGG WII,,ch statements :\pr.,,s.:(1 in D9 an: true f "
axamcsoucraugroarr 004e1 J. -.1 4.:,11 &/' rAt....-.14 IIIVIEcrsWh.it ortIone(1 his '... ;:s..,1 to olitam tine
cfle, t
s)......._statcments? i ,) 1::onr,coniiitioniti,:eApressed in exercises 6
-it '1 he...!I-Tic-.11-ceT.--i. ; -71 .1it'r11- 1, -7,1 (.77 thrOin..!1<, 9.j Use II, ii,1.111bas of set C, tabu-.
Lv.,-,, -.11ditt,.n. t 'low/many chit...ie.:it lilted below, as ici-; .:,n,:nts for x-.1 Use thcati.tide, Are Ilk le in ,.,k11 ..,,i,io'illiiin ?El lo;dO niembersof's.:t 13, t '109' ted below, as replace-the Is' s)c-)Ilditi 'tl'i.t.h.,1'. 0 ments for 1,1 1ol c.1( il s,t,ise write sentences, I to express ...II the st,i,'.i.t ..iits that you can ob-
, tain horn In,: Londiiien. 11,Lin \vrite I'T" al.,ht this 1,-.sson you 11...% ., ! atned that ordeied:lc used it iu...1- 1, ol.wvincnts for two 0..., 11 ,cition:c Chit e , pl.': -,,:'. as-1111. statement.
vatiahl,-,..1 (' -12, -i .... 1 1, 15, 10,-15).6 o I e -, v. , - i t.. X -i- 4 v. 7,4...?.
TT,
fo [ i v> -3 2,_I!e. rihed in t)ill"is'.., ! th!oto,h 5, qk n to In e:ielt or,.i::e.ip di expressed below, the
1 I bc orde1/..1 imIr y,..,s. 1.1 -t io:Iiiionclit il; set ,)ild Cotillion 1:i is 1 IIT.Ci the first cornpo-T".aini.:71(ii 1, .:` :. did ...f.)1!)1)1)11c,IV_ V, lien, r()!,t": 11 c.)., liS is mi.,sint.ropy,_._......................_._ . - - --,--- -- - - -
ion? .cent'vec [ ,,,,(11 . yn )1 an.' .roi.ly I. L mm, of the miss-2 I he crder, .1 viii .!.(.,,. Ilya component IN lir' 01111,1),If W.. I ()
. .
, ..;'-M.11." .,i10 \\ iit,' t`I't ,11 : . L, ,/111,11 1) gi,iilr (i. ) (;, ; ' t. (:), ) ( 24)
3 i .1-. ord ..f....! O./ 't ' : III I I. Ii.:'11141114:1I1 IS 11 io, each oi. .,.1 ):III ,...xprei.si:::,' below, the.I SI ;Ind ".'1,10'.e::,.; !is'. ,,,1,!4);;011( v :; I.,M lust Cl/d1r,(1114.!III I') 3 I 1.0IC CLIO 1:' '.eeondcom-j
1 '1 he oid4:;: I r .i. , . 4 ' :11.Nt COI111)Orent IS l'./:: I I CIIII' ()1 Ills : .. III IW:I'''. is Missing......,.._. -..., ! in.. 'sod v.:', , .'t !, I .( :doolon'i I.. !.: I (.);)v 0.1Ch -./..liP. I Itol ,,o,.oll,y the tlatr,L! ()Idle...
1, Li,. :i v :. Iii. : i ,i,( :, i ( I.:. 1,2., ) ( ,29) ( , 1)
2_

234
PraLt ice Pa,sage 6
Graphing Linear Inequalities
.1 he r,:Pli ofFir 4y < 1211s the set of points whose moron-ILL-es:1',,,f'v the Inequahtv.Thelow is a method for graphing an ineq,ality.
-;-,----7-71----7T-7--7--:_-1-1-7 70i-"--t-l-i--i-
EXAMPLE I' --t---,=-,-.Th:!_
_4_1_,_i_11_1 '_l_i_i,-; .-* 1- 1;-j-Fri-Zi-J1-?i _
-!---1-VH'-
lHri;----l--1--!-Ai !
Ti-T1-7 :Li,.-1-"4--1----
Graph :3.r - 4i,, < 12.1
2 Graph the «Fiat ion 3x tn = 12.
"ti2-. _,1-41.1 qtAL(-:-- -,j--1-) 10-1--?-4-1-PVIri-itu ii-74,_ -1-FrilTiz2,154-1 ; (61..-=.4?_.
i
x' 0' 4 I 4l___
y I - 1 0 1 6-1 1 ,i-rt-i II II -11-'"--1 kl f I
Use a dashed line to represent thegrail'" of the line, as shown at theright.1
, Points on one si,le of the line have coordinates 'iat satisfy 3z4i, < 12. I Choose a point on one side of the line and sec if its
coordinate,: satisfy the ineoualita. Do the coordinates of A satisfy_3.r - iiii < 12? 1 Is 3(6) -,4(7 4) < 12? Is 18 + 16 < 12?Then A is rot nn the graph of13z 4n < 12. Do the coordinatesof 13 satisly1:;.r - in < 12? 1 I s 3( - 4 ) - 4( 1) <-4 ( -1 ) < 1 2 ?+ 4 < 12? IThn B is on the graph off 3x - 4y < 12.1
All points on the same side of the line as B have coordinatesthat satisfy! 3r - 411 < 12. 1- Shadethis side of the line, as shown at the Yriljit. f (I )0 ! s are too difficult to do 6
by ha w1.11The portion shown shaded 4 /N)11.'3010', ! he hall- )lam, that is the 2 /1_
:raph of i . . / - .1 !/ < 12. lt extends o 41-1' -'-' X
indefinitely upward to the left.1 The -8 -6 -4 -2 , '1_141_1 I
IT=11Idashed line is not part of the graph L-
of the inequality.. .14-- -H-1-1-1-1-,...il-1-6:/ --r-ri ; 1
:>,,- - 47/ < 14is a linear wequality ,..../..,.
it-L---,
because the boundary of its graph 'is astraight line.[-
(Reprinted by permission.Cop (. ;,11,o zir_y A 1..ge Boo k ,
Smith et al., Harcourt, !irace andWorld, 1962.)

235
Key to Practice Passage 6
Graphing Lineal.::K...luolitiod
.?,-.1 1 he graph of < 121is the set of pDrrA whose commates
-;,-1.:atisfv the ineen::ht \71 i.elow is a method fokivp.p-hiiig an inequality.
0 -j_i_ii-i.:=1:i Y-1-4_,H7T-.:,--+...._,_6- _T-' , -1-1_,
-F'1.-i_t-4.-_-_1=1:::_r_1::_- i
-1-1-1-!-I-tPt, e,tuationkx y = 12 2, -1'14-17L 1-0' -t-i-i-i-e
--:.n---:0-1i-r-i-[ ;., so, 14 1 4...1
y 3 I 0 60 (H4iH-1.-) tq' _i 14,
,- --...--f-17-rii-1-7'°- -1- vi
-r-*--1;'-r-1.47H "(rI4?-1Use a dashed-line to represent the
hgrap of the lin", as shown at theright. 0
-*--> Points on on1'.fide of the line have coordinates that satisfy 3x,< 12.1 hoos-vz anoint on one side of the line and see if its
coordinates s,ilisiTt the zhequality: llo the coordiAr-tes of A satisfy3x 6-1;.,.< 1':? ( is :3(6) 4) < 12? Is 18 + ..162< 12?!Then A 1,, rut )n -raDh of 3x 471-C7L12: Do theeetbrdinatesof li r .1) < 12 ?l Is 12
12? 'Then B is oi;-:010 graph of 3x ,j11,71 12.1
All points on the same s317.7lof thethat sat;,:fv1-3r 12. r ,Shadethis side of 'he liii,Ci.m.t,hown at theright. l (1 ,, are t- :)-ultlicult. to doby hand. II dorcl.:;n :pown shadedrepre(,nt., ?Le that is thegraph of13.f --S4y-,2:: 12.1 It extendsindefinitely u nwar(;'441 the left,J Thedu-,h«1 lrir ,not prt of the graph
0line as 13 have coordinates
0
of the in,,qtrtfity. s 1Z, -4Y! 1 0, 7/ --' 1 ittegrtulity
id:try/hi' its graph 'is a.,traight
Y6
4
20
-8 -6 -4 -2-2
11:173±J._

236
Pract ice Passage 7
.;)...t.: .oGico.1 Cc,n..,,,,i.(.::(;(......., 0... ti .c., ..,,D.,c,:ns
Theore:a 1: If ,-, 1..; a line in plane Tr then there is a poiat in Si'
which is not in in.
Suppose in is a lirie in plane it .
wc I1 ould have ; = nj v.ilich is lot -tno case. I Hence, at least ore of the
iy imioa, 1(a) there is a line n in ST
I with n m. By Axio.a 1(b) there ::re
distinct points A d 3 in line n.
Now if both A and B were in m then
no n :. A or ii is not in m. Thus, we hnve the above theore,n.
Theore; 2: There arc at least three non-collinear points in given pinne.
-01
By Axiom 1(a) there exists a line m
in a planer . I By Axion 1(b) there4,
are distinct points A and B on m.
By Theorem 1 there exists a point C
in planer but not in line rn. Hence,
we have our second theore:n.
Thcorea 3: J.'1o distinct lines can pot have lore than one point in colmon.
A43
(2: by Axiom 1(a). Assume there are two
'----
1 Let in and n be two distinct li-es
a plane ir. We know such li.tes exist
I, t
Axior%
distinct poin..sI A a d d so that AC m n
and B e m A n. 1 Then in and n r. re two
liner., each cont-ining points A c.nd B. But, this is- impossiblc.,
IHence, the :Wove assum,-)tion i.s impossible a'.d we have proven..
1
Lfle'ife :3.

237
Kc'y to Practice Passage 7rio :c Log I (''' ,11 CA(111. A Crt. , 11(:(; .0 rs c' : :lons T,
(I
211,...0:.-1em 1: If ?Inc in plan.3 thcri thcre is a ,L in Cr
which not in NI.
Suppose in is' a li,ie in plane IT .
1(a) there is :. in lir
1,fith11;-,2`;.i. Ii.Sy Axao-, 1(b) there :.,re
A
........Itte
e oula C
distinct points A a d in line n.
Now if both A and B were in m then 9./
n ';ne case. Hence, at one of he
above clf ,$re 0nol.ras A or 3 4,v7i,-:7.ot in m.
Theore.i 2:
Thus, we have the..........1..0,
There arc at lcast three non-collinear points in n given plane.?1""---"' By Axiom 1(a) there exists a line m
d 1
in a plane ir . I t:3;) loci° a 1(b) there
11:A)
are aistinct points A and B on 111.g
By Theorem 1 there exists a point C
in plane 17 but no _al line m. Hence
we have our second tncore.n. OTher.:re31 3: iti.o distinct ii,nes, Cal not have lore than .,ae point in co,runon., 0-4
eet.**44;-., ., Vol it..) ela 1!
j' Let hl and n be two distinct li..es Lr.p.a.,....
We know suct1;?.A.les exd.stt-......i 1 a plano Tr .
.....,, Lis...A by fedora 1(a). Aso.r,le therArA two4--11a.....----,-,:.x--- t ,.-.....------" "'"."" I ii, di:.:1,1'4i poin,s A ;) d 2. so ir..ni. AP. m d n
C, VI
P and B ',., In 0. n. Mel rn and n are tvoel'i..,,,
.....t ..nors . .^ ...".11.,r
di:Jtinct lines cont.-1ring points A , fill U. But, t1Lis 12:; impossicle by
A.:ci.oq 2. l Hence, the above /-.:.1%a )lion is i:znossible 8:.(1 have -proven
Theore;.,V 13, 1

238
Practice Passage 7 (cont.)
',1100re.1 4: If d, :, ,Gi,L 1,, "a pi:Ine Tr ,}on LhLre is :. Line in vr
.Lich does not conta'in A.
Let A oe ar.2 point in Vg". Axiom 1(a),(.......----.........---.....Vi
17. there are two distinct linesmadn
in T/ . If either m or n does not
It
4 c7
contain A then the theorem is true.
Suppose .1 and n both contain A. :hen
there exist points 3 and C with B in m,
C in n: B / A, and C / Alb:, Axiom 1(o).
Furthermore4B / Cfby Theorem 3. Now,
there is a line I containing B and C b;. Axiom 2. This line 1 can not
contain i. since if it did we would nave A, B, and C di on 1 and 1 = . = n
wnich 4s ilpossible. ihus, we have established the above theorem.
Exerc(Bses
:rove the following theorems.
1. Theore 5: If A is a point in planelY then there are at least two
Ilies in Tr each contai,ing point A.I
Theorem 6: There are at least three nonconcurrent lines in plane W.
3. Theorem 7: If each of two lines in,Ir is parallel to the sae line in it
then they are narallel to each other.
Q. Theorem 8: "f m is a',3r line in plane Tr then there are at leact ...c)
ipoi is in Rid which are Df in line m.
5. Theorem 9: If A is any point in plane fr then the2e are at least tvo
line:: in IT which do not contain A.

23)
1,(,)' i !rat Ice l'assaos 7 (cont.)
.'neorc.., /0 if ott .1.,. ;1.1.:tr,L. 1."!:
. ....6..r.:: ,I.:/(.:. .-,i, conL-in 4 ..,, 0-------.--i,....--1.--.-*.--
--i
?itr..sxf..r.a.-.-*......r.-......
Let A .)e :la. -;7. in .1 ...:- .....'.. . h . ,
i
.....,......-.......... >Vi I
4,-. there r.re t,.,,o distinct lines . ,,. 1 n%AA
in ea . if either r. or n C.,0,-:s nc,t
cont:dr. A then th., :.corn 2 s 1..1.:::.
I pose -. and a troth ,-,--):1',..kin A. .'hon ''',L i j
l.7.-there exis1t point;; 3 .n1,1 C with B
n in n, B /- A,4% / A 0;, A.X1:t1(0).-
Furtifti-lore,iii47,Wblby TheorA-i. now2
ri.*......L.................................2::...2.........1j
?..og-hero is a line 1 conLai:linc, B and C b: Axiom 2. Thi.: line 1 can not 44-.1r.on:.:a.Ln since if 't dicAtei would nave A, B, and C all o427...2-h.,d 1 = = a
/....1w.lieh is imn6:-,tiole. 1 ihns, we have established the C...bove theore.a. 411.1
...
.;,..,xercL.i.-r; ° 4,
Prove the follow'inLlieoreins. 01. Theore:I 5: If A is a point n olaneW then there are at least two
'v-I0 1.i-lcs in Tr each contai ing point A. 0i. Theorem 6: There are at4:ittst three non-concurrent lines in plane ir..3. Theorem '7: If each of two lines in .1r is parallel to the sac line in.)
o then they are nrirallel to each other. 0J. Theorem 8: "f :1 Is ay line i.-1 plane It- then there are at least 1..so
'"`alir) I poi ts in '7; iihich are ot in line LI......... ) 0...). Theorem 9: If A 1 3 .rly point .n plane 1 then there are at least two
61 lines in li' whi.ch do not contain A.

et.' ,ige 8
1
2.40
f tne
Jr)
A
Juppn,e l., 1,nc in n]nne V .
1.).1 .44.X.1.07.: 1(a) there is a line n in 7:-1..ith r. rn. By ludom 1(b) ,.here ere
distinct potnl.s A and .3 in line n.
Now if L.,oth A and 3 were in ra thenhz,ve n
A or .s
is not the cane. iiencs:, at leal:t, one of znein m.
11 if m is a line
1,inich IS no!.
Thus, we have the followihG :heorem.
in plane Ti' .hen there is a point inlir?in m.
a
C
Now, by A-ciorn 1(a) there exists a line
in in plane it . 3y Axi.o.t 1(b) there
are distinct points A and B on In.
By 'Theorem 1 there erists a po .t C
.. 1 in plane '7,,e out not in line n. Eenct..,
ve our 2ccond theorcm.
..1:t:0,.,:., [There. ace at least three noncollinear points in a Given plane.
6
Let in < ,d n be two distinct lines ina plane 77. We know such lines exist
b Aki.om 1(a). Assume there are tl,:o
distinct noin.s nr.,1 is so thatjA '2 :n 11 a
and m t n.1 Then clad n are tt.oc(-J )0I.11'..3 A d B. f 'L;ut., i..o.
;acn,:o, ac f,:,:,,umption is ii.lppsinle wo have prov,..r.
^^- ---- ..--,----_,--------) :,ct 1 t C; a pot ore c%)
-J

211
iosty tt, Pract icc P.issagc: 8
"1 L " k. Id n ; ;,
5) C, 1 :',
0Lt:,
1 Li , il...x ); i 1( -_1) ' -.ere ic i-. .I.-:.e . ..n 7:" ,'-'it
...;i.,.-... ,
A.-d.cm, 1(b) ,1-.6re ,re :
t e
1(ii,-2,1.,Inet 0111 .a A -In, ..' in lane n.
Now if zeoh A vrre then 21,1
the ett j T.4.enco, et lea:' ot.e of ,.1'.e,...,?
1 A or L:, t. 1.1. Thus, we h,lvn Lhc followi:scaf-_/
ftienre..- it If n it a tine in plane rtr then there is n point inV
1
I
0 i1i Ch n 'cL jfl fr..
0
Now, e'Lxio:a 1(a) there exist t) : line
rs in )l 02 . oy o 1(b) there1-//
ere disLinct, poinLs A .3 on m.
Unc,ore.a 1 there exists 11 point CII- I
not, )n line in.in pinne ieut
e O..1 nectri11
,_; thrt-.,e
0OIL 1fl021' ,)oints in a Livec. plane.
t 31 Let mndn be two di stinct lines int 9,/
p, tin. NJ-. We know filch lines exict?.....--Anrnre there are two
es- .- ....,-...,,,-.."-.44.ad,1 1
...,..
'.... , .L,
'
...1*. / .... .......
ti:;'n(7.1, nr0-11 -, A t-,n,i is o Liitit. A 'Z'; n A n-....,..
i and ,; '.". "n 5, ril-Then ,. end n are tl..,0 //....// /n, 1, 0.,ci). o,, t : L.,L; ' .); :A, 7 A ;, d Li, Cut., t.1-; : i ..; f. :1 ,). :,1:1,15,
;....nrptIrsn i:i,o ini 1 we hesve proven;
L Ht)r, c, 'Yj

P Jct. ice Passage 8 (cont. )
242
....._ flow let .'. be n, po..nt, In .:L.,:le 11 .
By Axiom 1(n) there arc two distLnc.
V14
.
Trlines i,adnin 1( . if :)othmand
n contain A then we have pointsii ,7,11.! C
1 =NA It.
A
with B in n, C in m, A / 3, and A / C
Dy Axiom 1(b). Furthemore,ld / C
because of Theorem 3.f Therefore, there
is a li.le 1 contai ink; B and C by
anOM .!. 2 i;, 11 e 1 can not contain A since if it did we would haver
i f. ,,w) 0 -I I ,t. 1 ,l(q) 1 = m = n whl.cgh i s j possi IA e. Thus we hnve
. 0,v4, [hat ih , 6oU ;..t. 11;A il then there , e a ling I in Tr with A not on 1.
Clearly, if ; * . /1 m then either 4 or n does not contain A. Thus we
nave estnolished the following theorem.
Theorem 4: If A is 3 point in a plane irthen there is ,a line in ri-,........
which does not contain A.
4.
:z,xerci se s
Prove the followinG theorems.
1. Th,:orem 5: If A is a point in plane Ir then there are at least two
[
lines in 77 each containing point A. rt
, Theorem 6t There are at least throe nonconcurrent lines in planer.
3. Theorem 7: If each of two lines in iris parallel to the sane line its ti
Ithen thy are parallel to each ocher.
4. Theorem 8: If a is an: line in plane 17' then there are at least two
1 points i ; IT which are not in line m.
r.-0y po.Lnt .,.a plane i.:. )1L z.1.% 2c:,.1,
Ilines in 1r w:iich do not contain A.

2.13
R v to Practice Passage S (cont.)i+OW it; L i. DC n no.Ln, 1.11 ;;,
L.,...Tr
iiy Axiom 1(a) chore nro two dict.inctie../
linesmadnin n-. If uothmarld
Lt-1 t,.."C.
% v v % I r
LHn contain A then we have :points 0 and C
with B in n, C 1. 3, and A / C
by Axith-11( b). Furtv,pre d / C tit..7.
because of Thecfrera 3. Therefore, thereit--/
is a 1:. e I contai ing B and C by44.
i'xi.orn ... rh1 2 3 i e 1. ca1 floc c/ontoin A since if it did we would have
A, d, 'Ind C t! I. tfr.7..1 n.'d 1 = m = n which is `.~possible. Thus we htirt
:,..0..... ; :0.. ii:: t ,,:3t.:,--1
4. inA1 n....2.- r
then there ::3 a .. 1 in IT with A not on 1.
61,;e1r1,., 6f.,* ii n (m rther eithe- 71 or n err not contain A. Thus we41-/
,,/"! CM,'.1:iii. 2};(30 t: ^ 7110:An theorem.'3,: 04:1:4.:orem /4 If A i.:: n point in a plane $1(then there is n Line in fir
0VP= I
1,:i'lich tines not contain A. 0
ii` 1
1. 'Llit,orcrn 5: If A is i ooint in planet.' then there are at least twoei.--1
0 linc:-. in 17 each co:Itaining point A. 0.t.4)
.,..-. .2hcore,11 14 There are at least threiilion-concurrent lines in planer.
ii. ":2;:(!orem 7: If ezic:1-: of two lines in it is part:31e3. t,o the sa :e line in 11-,c7,/
, i I n,:i ,,h,:v :ire 1)arnliel to each o cher . r e,.
,.:1 ;L1:-: 8: It' la is n.:.. line i.: ola:.e ':1" then Where ,-..re at _twist. tuc)--.%./...., /
; 1 ,.)1 '.r.F.: i . ';`r ,,::.ich cre not in line m. 0IC ry -:olnt, in 03t,.ne thon zre
1 '1 contnIn A.

214
pi ,p. t IL,(. l'asb,,e 9,. --,..-
1.6. Crorsh (4' ,1 ru Net ioil.1 'Is kit graph of 0. function I, LIMr-I ,
1
., ,: 11, illlt:N ( ',Wit ptit1t, Of \V ;SIC 11.t...., a:-, it fr:-,t, cc,ord;natc ;1:1tilts ,hon. n at,(1::, ii', :,(m1 cn: the. core-, ;).,::::it::; elent
F71)rtting to toe definitton tit a fun( tton, an eh:meritain iN :1 COO: dinat 0, (of ilra: and only one r° nt of t iw
1 (.0011 a tv:pi,, we nmv de-irc to 1110W 'he: h: 1: c0(1 hr 1 hefunokon. 1 if (1Iiv Ihr KL'ai)11 iN giV(.111he gr:ipli deihles the oii and ralipj We. would need to
r---, 10 :N('(' 1vhct her the' graph roido be 1,.ed .t. OW rillil for a;
p.I.,o, given a doimun and range, we mayti , graph could hp reed as I he rule. for a funct
deNn'e to know whetherion. r-Tne such cheek
I. made hN i hp' 11,0 of a ye; ; ical Imp. 1 It Ow number 1 is an elemental.(' nprrs;,10Pd on I hethr dolmon and ripinpio:, of the domain
.1.-..c.1,, plail a vertical lin;.. i,lirough 1 on the _V-a \i:.. 1 if this lineIntel: cot:, incre, I hall one point, of I he. f1. )11, the ,,,;raph i:-, not tho rulefor a function. Fill, ni ;,:ur for any element of ti p (101 000.
b(' it',Lli if the number of point, on theAn alteillatls Chot':% :11:Ly,.:,,ph i., finiteTV; i Ito the coorcitu:Lte:, of the 'poluts on the' ;4r:11)11.ii ally to ,t coorklinzt.tc is..ot th,, ikile for a funetion.1
used for two di rent points, the ,c..,1 is
F.,4a,r.ples 1 A , , . '--Y1i -,- - J.-..- ---4--', 1 ,
t
.. , .,..... _,
; ,:- 0 0 --- --, i .-- -%
- 0 0 0 0 -
i. DOtildill: [1, 2, 3, 4}Ra: { I, 2, 3COil 1 d the graph in .1.'"g. 4.4 be
tle, rule forafunction 1:-intr,±i11i 0; 1 , ; : X, ,, i 1 ; i : : , , .
_i.-.1 i ..i '....!...' _:..1..' .... .* .
(12 nain and t
Fig. 4.4L
(Reprinted by permission.Contemporary AUebra, Second Course,Mayor and Wilcox, Prentice Hall, 1965.)

245
to Practice Pzis,;age 9
I.6. '1.11c graph of a fu:,,.tion is tile, t of points c,i \vine has as it filz, clement'1ti; the doinAin co-, second coordinate tno corroNnondir.,4- ,b'e'nt
:.11,:r,.. 1--,\,.(();'0,111;`, detinIL10144(1).....1 fidt( uon, cic:inc:nt,,; .1 (Me :111(1 01), },' tillt' P,oini Of III(' ',41.:Ls)1,
(111'(.:1 gr;;pii, kr.11411'Ill'i )104' It C(#111(1 hi* I )10,,!.11)11 of a 11,11,111)n. only I Ito graphit tkivoo, %vo %%,00 a..olooI!, :1, 1 t I io thiloain and rail "(', 1110 N% ouli I nood tO
11, 11..,1.1.1\ 10 MI' NVI:C:1;01. r,r.i1)11 ('0111(1 .11."INC(1 he rule' for ai.r,let 11,11. 1 Q
111:,0, gi von a (lowam and ra)go, \VC lieNir(` 11) 111(111' 1111('0101''1,1111) c(1111(1 1)('' .1N III(' 11110 fora in )otion. F5177.3;rrP, ehool:
Ov I lio 144.4.111c:11 lino. 1 If Liu. ntmlbcr I i.. all clomont(i.)m.1111 eleIncifiN 1.11(, doleiLif :m. oil
.14.11' NTS1 li'.11 1111.011',..;11 1 on Ow -a 1 If hl. 11110.,
11101(' )1,11) ()M! i)oint of tho graph, Ow v,rapn IN not t rulea fwa.t is true for any oloment of':-,fritAdoniainAn alternate cilook may bo 1,s111 if ti492'ilinlbor of points on the
Cinite.f the coordin.ites of 4.f.rrj'points on thecoordn.kie is used for two ciii4'hc!it points, the gi-.:751.1 is
the ride for .1 funotiondO
1. 1)oni...1.-j1, 2, 3, 4}!! '
0,
-------fc),:iI the ',rap!: in lig. 4.4 be
1 function using thisar.d ranc2j
Fig. 4.4
0 , . _-PP
0.00 0 0
. . , ; ;
...

,ALtice Passago 9 (cont.)
7.71'ne an,wer is no, I A v.:I-tic:II ',we through 1 on the Ar-axis passes1!1',);1'11 I II:111 011, ;)oint on the ginnh.n-ince there :ueiinite ntioer of p();11t, cm ;Ito v.,;-31)111 wc, could \\rift eoordi-nites of ti;(',,(' o0H:Ji (1,1), (1,2) (1,3),(2,1),(2,2), (3,1), (4,1).[Thenunlhers 1 and 2 :,re ns first coordmate-i of more than one`,mint. I
2. Graph the following function.Domain: 1.0. E Ii', 0 < x < 4)Hauge: { yly E R}.1111e: 0 < x < 1, y :--: 1
1 < x < 2, y = 22 <x < 3, y = 13 < x < 4, y = 2
C;raph the following function.Domain: Rltangc: IZ
y = zaInc complete ;rapt cannot 57shown. j .
1i I
; !11;ii
Which of talc ;r:!1):1!-; in Exercises 1 through 12 cot-177c t Ic ru cfor a function? In ExerciFes i through 6 the domain isf 1, 2, 3, 41and the range is 1, 0, 1, 2} .)
,
.
. .
. i .
o , o0 o .
yi
i .
! ; i iiI 1
!
,
1i
.o o o o ,o o o ,
1 ,
_,
I 1- r1 ;, i
i
-'
..
t _Y 1-
I
; i
i o o o oI I .
1
L.I...
. ,.
,; .
.
I . :
li. . I ,
. .., - - ! -; -,
i t ' ,
1
. .
' ...! i
, . . i

247
:,cy to Pract: i 9 (cont.
;1 n ! A vertica. .,,--,throur,11 I on ,Ics \1414111, on the :-.1q ee there are a
nu,n, 011 t c,o2d \\-1 Il t coonh-
ol i,ow1 ,-,i(1,11. (1,2) (1,3),N,",,,r"...;,:),(:i,l),(.1,1)1The:111d :: ;:re e :Utal (s i of more than one
(:1.11111 the r,ri, funetio.i.1)omally. /1', 0 < z<411;angc: iy;y c R)4Thile: 7 < = 1
I <x < 2, y = 22 <x < 3, y = 1:; <x < 4, y = 2
3. (;r tph the1)0main: ./t),
Itan:;c: :4) urn
:
1110. COTtlPit!t.3
:110Wn.
..AT, :- wannor-omr../,nc... woon.m.
\VhiPia o the r:;.allLis in i.:Neree e,, I Illrol;!,:n 12 couid he the rulefe,r :tl'i-rhil ion91 In Exerek: 1 tlirY6'1',,J,16 the domain iAl I, '51-9-11
__......_
and rt;;(...,Juige isj I 11,Gr'42). 01J o
t,"
0 00 '
()
yilI 1
1 1. 1.. 4 1 - -:
1 1
' 417 ... A I1 '' I ..11; '1.
1 1 I ji '1 ; I 1 i.
oo U o0 0 0 . ' I0 t, ./". .
0 Ell
01 ,
;
' I II ' 1

Z 18
P rac ti cc Passage 10
I ;,ULIVATCAT:ONI OF R:1111.
N, ,... let s :iN 's .. ".'':.% 0:N.7-:.ition on the real nn,....,, %.. ;11.: 0 , .ration multi-Itic.n.r;s1.4::: inuinpeation Is an operat.on, i: :.'ss":.. :o ca.: t l.rdorcd. pr
cis a iot .. rc.': nanther.i Tins third re.:i no...1!-::- is called theA study Of sOnle of t;.e specific factsw-,-,:i r. ; of l'oc' '';',.':1 )..ir tl: f ia: numbers,'
of iou;;:pilcat;on iilica:es C.1.:t multiplication.,'..!nt;',v clement for
is commutative :...-.d associative,multiplication. We rcco:d these dis-
CON CI IQ% in the- !o'fio'votn, postulates:I
(CI ') VrY., Ay - yx f (A PM) V,V,,.V,(xy).: = .x(yz) i (MI) 1 ) Ni: xl = x[1:.c.=.111 that we can indieate a prodnct hv juxtaposition ac well ::s by the use of:. ;.0., -: dot or a tinics siz..;-, 111 he abbreviation, -CPM" re.i.,:rs to tate cm/um/wive,,;(./,.. tor mitivrircarum. [What do the abbreviations "A PM and "PM1___ ...,;e:er to ? 1
_........Prs'ACT:CE CY:I-ROSES L
p,ove the mu:tipfication theorems in Exercises 1-41
1 v ,V ,,N.1 , ( A- y):: (A- 2):I I 2. V.,VV,(xy).-: = (zy).r 1
: 3. v..y v,v..ffm-)A11, (ux)(1'1') . V. lx x I
.; at I:rest:Ise 1 on pane 22 but for multiplication instead of addition.1.__...._O. S. :e and p-:ove. a multiplication theorem analoflous to the one on addition
in Exercise 2 on pa.g..: 23.
(Reprinted by permission.Algebra with Trigonometry,Fehr et al., Heath, 1963.)

2.19
t Prctice PAssage 10
1 ....ul i it .Ai.k.--,..v.iicy.\.! (-4.07,,-,:\,.. N...z........,,,,,.:zs 1 0I 0 iI-----
.. ii..-. ,coe. 0:writ ii, :....4 oh: :cal ith:0:),1., iw orciation multi-; -; e ,:: ,,....] ::-,1:,,. 01.1,::,..alort 1% .1e,......, 1.,c,,,,I, it ,,,,"11, :() i. ic;I orde:cd pair
1 c; i: II -1::::',,:. :: 1.:::0,10' :: ii nuli:117,1. '1 hr, third re.:' i called the(1, I or i 4,4 .4 l:: ''.1:r or 1.7 ,..... :p...i,e,,. A Nt 1,t Iv 91soinc o; the specific facts
1,'i:. .es tii..t multipliemion is ccnumitative .ind a%coative,i
I ...-0: :'...it th,-,,. ts v.r, icn;i:v...e,cme:U for multirilication. We iecoru .'Crt-',.-. dis-1 .i :e'. iii 1.1e to;'A1,,: ; pott.lates] 0ii
1 (CF) `1,`;:-../.....-- y:. ! (,..PM) VxVV,C;;;;t-= a(yz) (PN11) 2/..ri.j, = x-ii:e,...i:: th.:t ....,...;,.......:: indicate a product by Jui. %sa:loit;on as we!: as by the use of.., :a;- :k: (;,-, o. a ...,...1c. ,i..a.1 1. i ne abbreviation "(TN I" relk.,,,K":0 the coo:imitative,....
rill( ,';'c lor tp.:,Inqih.otton. j What do the abbrevi.-:v.r.:, "APM" and "PM1".,er to"
0;
, - ..Prove t.e mu. ,....v110i theorems in Exercises 1-4.1 CI
V V V-CC--. ; (x:),/ I 0 1 2. VrV,',..r1,(,x2.; = (zy)x 1 0i3, ..,./ ..,.., ...,,v, ,....; ,.. .. (1,x)(1:7) 1 4. V, .1..e.?....,.: 1 01 S. Rer,::., t i ! : .: ::,!.-;..:;;;,.t.5 22e,.---4 fe.ifi.ID:r,liPll'itlrir.:4-atde....% If:I-Ars-1M 21-
i 6. zate an,* , 7- 4 ....,fii)::cation theorem analogous to the on on addition- ...., :L....1 in E:-.ci-cir,...i 2 oh pz.,7.c 23. 1 0

250
Pr,ictice Passage 10 (cont.)
A, i':)l.'..: r.:Cdi; AD:ilixr...)- 0 1
The postul.ites and theorems on addition we Live collec;a1 so f.ir deal withthose- prop:rues of dutiition Ulm' concern the oi.l:r in whIclt ric:(,:tion is per-t-0;111:d It 1,,c1 c, 1Ilioll;er oto,s,:i ty of addition, wm,..L 1,, (toile- dilie:ent.
WIIICI: :1'.`1,'.1 .1 1111:(11IC it 11 .111111b,:r le,Kc,.,,ii 111,11 ,,,,,I,iik);1 IN .1;1 01),71,1::011
c1,'!) 01,1,..it'il rdii or ic.11 iiiinin,.: s I Now, there are cei t,lin ornered pairs ol .e !
iiiiiiih:Is to wili:11 :Ridition .,s,, as the first Elul it or the ocd:,ed pdi-.1 L:orto (-9,0), and 7: tO "0.7", 0). [in fact,[ exampie, addition t,ssignsi to (;3, 0), -9
a) matter what real nuini;er you pack, you can always find a second real num-ber to add to it so that the sum is identical with the first real number chosenthat is,
,i Vz4 x -;- y = x.
Moreover, there is a second real number which will work for all cases .
other word, i3,V, x + y :--- x.
This last generalization is a .ho; way of saying that the operation additionhis a. identitv elcm,va. r7%.7.., a; w:- know, 0 is such an ident t element forauLlitiOq We express this p.opzrty of addition in the postulate:
(i)A0) z x ± 0 ... x
which is called the principle for adding 4
PRACT;CE EXERCISES -I.
[ Provo etch of tho lefiow;;::7 theorems.
`9"
1. V.0 --I-x==x12. VV,,(x + 0) ÷ (0 +y) ..-. x ÷ y

251
Key to Practice Passage 10 (cont.)
) 1.-::: P;zr\..c:PLE it,Y.-.1 1,-;:)::'.3 0 0t)
The posnilnies and theorems on addition we hat! ccll.cted so far (lea! withthoe pro:)er ne% or addition that concern th.: ord.--7A %illicit adoition is er-
forinc,1 f i here another pro2...-ty of addition wiii.dz,f-tIctiite. daic,eat.which as,i,;... \ a unique R..:: r,imber toEccai: that addition is4...,:n joi),:ration
c wii o,dc,ed p.iir or real if..iiiilurs.INow, there ii-,0:,ecrifain
the f,rst namhoidered pairs o: ..c:.!
ra1;111), to which nod it ion aw-ns ;cr of thk ord,.:,-.:(1 air. ::or
\ampl,.:,`,1.,i,iton assi,:titsIS to (8,0), 91..4..t.:9, 0), and r to (77 , 0 . In fact,you pick, you caisklwAlys find a sceond real num-
is identical with'ic,:iS first real number chosenno matter what real numberber to add to it so that the sumthat is, I
r .3u '= -xiiMoreover,there is a second real number which willifttik for all cases' $9
1
...---,,..oth,moiprd7,-1
f .... x., x-,1;;;.t
This last generalization is a short way of gl.17i.f,c, that the operation addition
,,,, an identity element And, as we know, 0 is suct,5-41 idcn:. :y element for
addition. We express this property of t;..ittlion in the postulate:
(PAO) V, 2.44,-10 ... x 0whlch is called the pl.r.r4inle for adding 0.1
0P RI, C : 4!'.::-';:r7..-i WES
P.-.7,, 7 VG h of tho following thooroms.....
4. .
0I
....-...........-0-4,....i1= X I
2. V,V1,,,Au.ci)4)) + (0 + y) x-i-y

Pi.totAcc Passage 11
6...r:.es-cto i'rock., t:, : .;.(:1. t...or.:.,
;.,,:t A :7(1, 2, 3. and 1, = ia, bl . Forr:-..int; the set of all ordered
T);...irs whose fir-t, 1.:o-,poncot is from A and
,(2,a),(3,a),(1,b),(2,b),(3,b)1.
whose secon:
j
com-)oncnt is from
This set is denoted.....,
Li we 1,,IvelLt. (10)
2, 31)( ca.A or A 3 I A ils read " A cross B II is called
the orrteg-c:n nr') itict of A ,nd 3. 1;otice that inthir e: :a -.r. ordered
riM101wAils
A Ie; I -
CCttii1C o 3 and6.
if a-.d only ill A: z zl, 4., 33 a -d y 1e, .
N = t..'e have,
= (+,A) (3 7C1") 70) (e4 A) (4,0) (4 ,O) Notice that in t
/ 0 But, if the example above A 3.1; B =
Give the roster olme for each of toe following cortesian products.
1). Z3 X Z
c. X 1 x `Z rtnri X< j< Z z W nod z 54111
d. A X A 1,..here ix1 x 4i X is even, and x < 9)r I
Let A= 1, 2, 31 = fa, b }.
Let it = (2,b), (3,e)),....Then RC AX .3 . :,ie sa:, the set R is n rel:tion fro7,. A to J.
MMIE
;,1.I' ,;se 5- (.(` b\ c;-~ce $ ^ " B-4. a then S is also.a.relation
from A to
L, fro. firci. set to the second set in each p:xt
of 0..ar ii
. .
3. ,I;;;;:e , r.) o,. ffom -..econd set, t.) toe Lirst set in each part
FILMED FROMFROM BEST AVAILABLE COPY

2 S3
t() PrJLticy 1)(1,10 Ii' 4. ri CJ
, [ (14,41 - t a, bj4
Foraing ::t-c:3sf all ;:r4!ci.c.,
`. nt. from A and 141-1oL,-e c,econ, Y..4,,A.Poncnt
, ,k 1 , ,,) , ( .', a) ,( 2,, ai1) , ( 2, b) , (3, b)/ . 1 Th.i s se tSir-53i)klenoted
..,,, read 11 A tct-l!...=is is" ..nd is called ,1. 01...,.... .1..1, 11.1111.111.1111164 104. MLIV....+1, ri,..-1 /.../...../*1,-1...---- ftilipolkimoaaull..1.--.1,.,,i t,'!,, (./.7.1..;;1_:1 ,. ., ',I: .1 ..nd 3. liotice Lhnt in -...,.",...'"uf'li'i -le -.. ordercu i- ,....,.
1i '1, 1
) ;( f c-r!, 1 y x a 1-1, 33J
, t = A (311 I)ve,.> g
.*1 1. We'lr I'm t01.1146.1.atalr .11r.c. .
1; ,". :'.--. -4 effisj (1.,;.), (,:. ,Z3) 1 (A 1.8) , (4,), (4 n) . not' c t in thise
C.A.,2,nole above A g B = 4,;') . (i) c. Ito- I 0,1
t,r,.. ----...........i...............s ...1,11VOW.C1111,,, WU,
I. Give ;r7r,7:%;'%nst,-!r ,Imie for each of tne following cartesian products.
5, 63
1. Z, .x /r,r ztit4 rind Z 56.;11)
lolossammasmedryIrlaillimunonse IMINIMM11.10111..,
,re 5;t x. x is even, and x < 9
1,
. .
0Let i. =
1 1, : d ii r: fa, I))
Let I b ) ( 3 4-1 )..1:110 '11. 4;2 f%. % g vAe et it is re]. -t ion
._......,..r.....K.av,{aAfr xarnualrar...[C,...T......111717.../0,1.1111111,1-
11.1 n
0
frnm A to if,or.13.1 .;
111111.116.111311.11111.11ELMr..1
k , k g 6 AB,lt5hen S 1.12, f.).4., relation
. enaa.s. s.szeliaNronsm INC.. 4..n IT
. 2/......n.ccessroMy
st , s S. 1 t
in each ,;f:ft

2 54
I'r,ILt ICC Z11;(` I I (C011t.)v......rozamowarrrnmananuisclowcx.,,,.- 4/14
1 - ,I
Let k = ix Ix 1. ,,,:u human butrit;
ILet b :: f y I t fu il.,-:1-rtman being)
7:-.. (:.,',, I bis the daughter of a a d a is the fllt,:.er of b}.Let it 1
Then Re A :,:= :_;
''
hence IL ins a relation from A to B. i We might call
this relation the f..thedauc,hter relation.
eLe.L (I - f.:(1.4; s ,... hu.nen beings
....
Let S = 1 1 .,, ' n:,i; s the brother of b3
Then S C U ;' t. t'llid S is a relation from LY to T7. Notice that the
set U is used as L,oth the first a..-:d second set i.; the. cartesian product
tn .i-lis extiT.pl.e. In such a case w© say S is a relation On UbLLLLLL ......,
0 *
Ze List two el e.,unts of the fatherdaughter relation.
5. List two etc q.:.-1,5 of .ne brother relationship.
o. which of the. following sets are relations? Give the roster na,:ies_
of those 14:ach are relations.
a. 2x + 3;, i x f W, y W, x < 5, a ;td y 4 313
b. Z3 K z,
c. (x + 5, 3x) x fi W and x < 3
d. f1, ,.:, (1 l'..:--1, 41 3, 2
e. 0 I. .
;:, * *
Let 4 b2 :. :.:, : u', of whole nurf,uers.
:e.
i
Let I, .:-- ;(,,,.,),.: cEll such thpt x + c = y3 .--.since L C . i,, i'then L is . relation on W. ; ,
iL is such hs i.mr,orta..t.
re LatIcn or .4 I., ::t. ,...: ii,ive it a special name. L is cl, 11 i,d ;e "less t:-.an"
c.,et.ote L f ^ 1.0 indl
; t # .3) '1 of the s'catenents15 L 9 :):1(1 ),9)!:11,1::-,..>0.n the Fa .e

255
K(y to Practice Passage 11 (cont.)1" .....- .
' d.. Let I,. = x i x 1:, i .-sle 'num:In bei:.i3 03-2, Let li = y i y Is a fe,air: havian being)
i? n7.-4 Let R := f (n, ii) / ,- the ciatiLhicrrmt( a a d a is the._ fv.Lher of 1;3',
-2..Then at: A :-: il i and hence R is a3pellation from A to Li. 'e s,2.;:%.t.412,111
this relation the ...1311.1i;r-dauenter relation. 0 ,
.,.."?..Let U = ixi:(1...s a husnan being ils,....:
0S-n,.Let S = i ( a , b) la Its the brother of b-1.3 1
e ...R.3j2...Then SC U '',: U and S is a rdlagion from Z.7 toll. NoticeSt7r4t the
set U is used as both the first a::d second s3r4.-) the cartesian product 1
in ti.,Ea'ix,a-nple. In such a caviebil say S is a relation on U. 0,
* * * 0..,
1. List two elfaeris of the father-daughter relation. 05. List two eyempe4ts of the brother relationship. 06. eil,tc'n of t17.....41lowing sets are relations? Give the i'er na.:ies
of tnose \-4,:..L.2re,',Iire relations.
7. . . " a, i 2x + 3;1 x t i Iti, y a W, x (5, end y < 3.Q
.b. z3 X Z,I 0
.., ..:, -,...-,-c. z(x + 5, 3x) i xfi Wand x< 3__,i-),.,(.1. 1.1, 2, 61 :(of-1, -4, 3, 2 0 ...._
* * * 0.i Lt; ;-. ,,i b-,..the ;;et 01: uhoic nur%oers. r 0
_
.Let L such that x c =
;,N.:,; L C .; .i4::r.C11 L is on on lei. 111, ts such c:t.i.r,ortn..T.
0
L-,l've it a special is "less
u;;;,,-;Lly L by c-4, and 'write) 4 1, 3 jz.,,)
, 5 L 9 ) f,! t-:
if

256
PractiLc Passage 11 (cont.)
4 * *
7.:.....
...................,
a. DefulL t..e rela,ion > on W in terms of ordered pairs.
b. List five ordered pairs in the relation > on W.
c. Rewrite (a,b)/%1> as a: b for each gf your answers to b.
8. Rey 7ite yo .r ansero to exercises 4 and 5 in the fora x R y where
B. represent;; tne relation riven in earn problem.
* * *

257
t() Pas,iago 11 (cant.)v....w...
11Tr)
M1,.***.P.....IMINMAM......,11.11/...MMOON. DINIV...,,,,
7. k4
DIA1.10. " relit ion > on W in ter.lis of ordered pairs.......,....;. List five ordered rairs ir, the relation on W.
tf-;!...- Rewrite (a,b);2). as a > b'for each pe-)n?ir answers to b.
yoir t,:iscro to exercises,1,1C,S41.4M
" It re')recer.t.;; ti.e relation Eiven in ench proulem.
4 and 5 in the form x R where
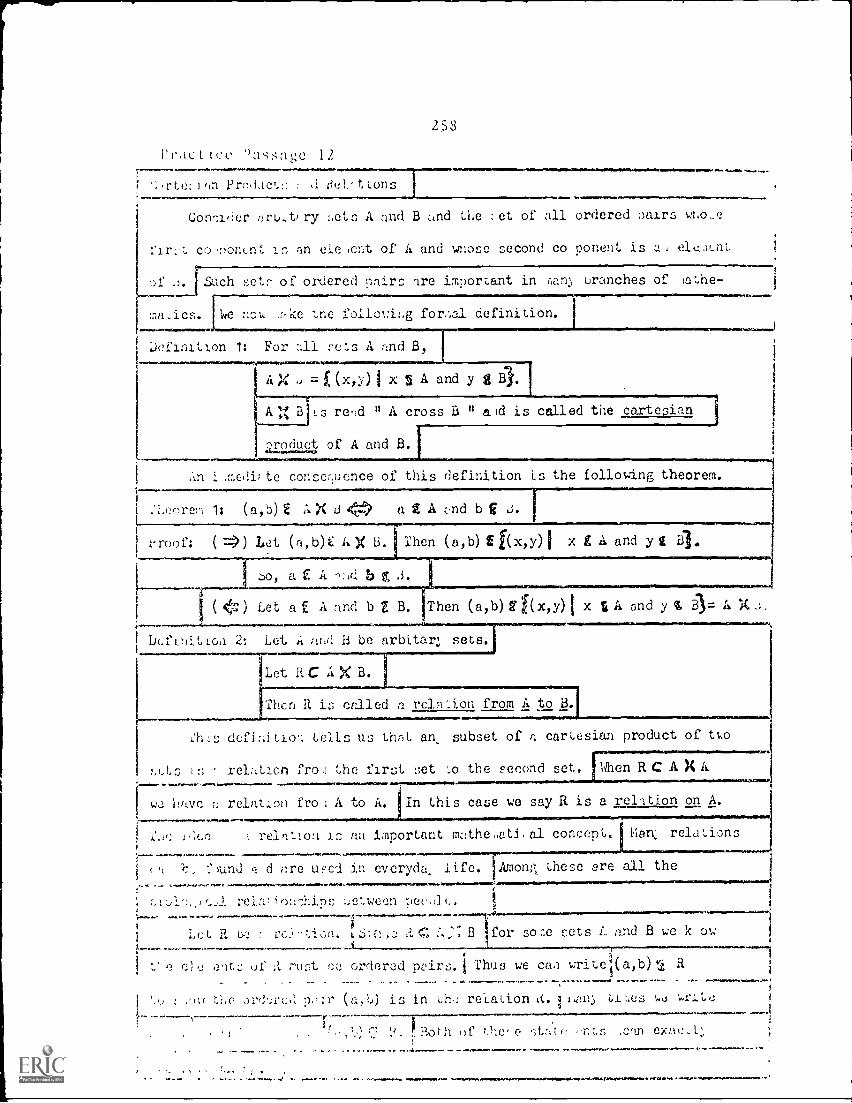
Pr.ic ')n,-;;;:igc. 12
f 1 r t
J Prod.; cr.:: a ,1 r?e t tons
253
Ilimialle1
Consider 7:rb..t+ ry acts A and B and the : et of all ordered nairs k,no c
co ,;,onLnt in an etc icnt of A and wnose second co ponent is a
'..)12 .3. Such set of ordered pairs are important in ilan branches of lathe
Ina,ics. lqe aol: ,...ke tne followi:.g for,-.3.1 definition.1
..........
Definition 1: For all cuts A and B,
--....
77 -=-- 1 (x, y) i x 5 A and y g Bi.
A 1-4 B is re id " A cross B " a Id is called the cartan
roduet of A and B..----...
An i ,::.e.dii to conser,uence of this definition Ls the following theorem.
.'1.enrem 1: (a,b) i A X d <Z." a 2 A ,:,nd b f J.
proof: ( *) Lit. (a,b)t: IOC Li. Then (a,b) f(x,y) 1 x L A and y i B.
so, a k. A -;.(i b g .3.
( <-3) Let a A and b B. Then (a,b) 4(x,Y)111.MMINONMENOIILINER
licanit.Lod 2; Let A ;Ind B be arbitar:, secs.AnNew...11.11.001{.miammooNso
Let It C A X B.
S A end y .33= Aid_:.
Then it is crJ.led a relni,on from A to B.
L'h Ls defi:li Lica tells 1.1:3 thnl. an subset of r. cartesian product of tlso
relation fro .1 the first set o the second set.
w.2 nRvc relation: fro J A to A. In this case we say R is a rel.) tion on A.
1,,Ln reletIon is an important mnthe,,atL al concept.
, lurid d nre tif,c-.1 in everydk life. lAmonr., these are all the
....eg.,.....10.0.0.100.1...1.1.607100.1.0M.M.O.MOIC,IWIMMOWY
C, I reirc ::etween pec.)1(..1.1011411..le
1i
1 Lo, R uc : vc..., '''.1,-)n.
i
k 6:_:!,,, i-', C f.:: B for so ...e sets 1.. and B we it ow
I,. e (31,J .;'it1 of A rust to ordered pairs. I Thus we caa write (a,b) 42 R
i
i '.,J : ')i 1 tlx, oi.',3'.:1.-(.:.', p.,:r (a, ...) is in Lh; reiaLion Lt. ; 1-an; C.1.1,es ,...1 \-,r.1. i
r,5
-........... 1
, (: :1. L; h of r.''.e.' e .-,t;It e ,,r::.s .crtri exItc..1:
......1141,11Nr N.C.,.

259
Key to Practice Passage 12
Cortesian Productsit:;1.:telations
........0
Consider arbitvry sets A and B and the ::et of all ordered pairs wtaose
q -Ifirst co..Iponcnt is an. ale .cnt of A and whose second co ponent is a:i elenent
of b. Such sets St-otdered pairs are important in :nand uranches of .lathe-
raaiLies.j We now .:ake 'rernifollowisg forma:1 ,definition.
- __ Is0
: )
Definition 1: For ali-itets A and B, I 0
0A X 41.../ip(x,Y) I x 2 A and y g BJ.
it.:2.B is r I A cross B " a.id is called the cartesian
nroduct of A and B.1 i
An irzedi; to con.t;rquence of this definition- is the following theorem.
Theorem 1: (a, b) E1:11.3 4 a I A and b E 3. 0ay 1..._
Proof: ( ) Let (3;bir A X B.rThen (WU tx,y)1 x FE A and y si, iii.,
0 So, a S21"'ifh nd b c 8. 00 ( ) Let a 6%11.end b E B. Then (afftig(x,y) i x t A and y 6, iii= G _,
Definition 2: Let a-4d B be arbiter.; sets.
. Let' 'MA X B. r .Then Rift 'called a rein ion from A to B.
This definitiot: tells us that an subset of a cartesian product of two
sets is a relation fron t.,e first set to the second set. !When RCAXA 9- 1.
we have a reilatiion fro.1 A to A. In this case w R is a relation on A.
The idea of a k.ion is an important matheaatical concept. Ken 4Litions
ca . be found IA are usedV.a.pveryda:, life. Among these are all Ifiaej
oiolocical relatia.Alips between people. 0Let R be rAfelltion. Since Yek-x B for so.ne sitic.gand B we k ow
the ele .eats of R must b red peirs. Thus n write (a,b) 2 R se--1..
to show the ordered pair (a,b) is 'lie relation R. 1zni:, titae;, we wrlie/
-1- i,..ca-R1., to ]r,(1.:.6., le :a.,. '(,, b) ,-, R. Both of these slefrttents .-.ean exac.1:,
t '
the 30.7,c`*:r.t.i:. 1____
*0_

260
Practice Passage 12 (cont.)
,.'xcreiseu
1. Give Lhc r()nter :l ic For each of the followini; chrtesinn products.
a. (4, 3, 7IXtO, 2, 3, 5, 61
b. Z2 X Z tr
c. ixixt Wandx<41Xtzlzt Wand z+ 5111)
d. A X A w::ere A = Ix' x 1 W, x is even, aid x < 93
. Eeke up a relLtion from the first to the second set in each part
of exercise 1.j3. Lake up a relation from the second set to the first set in each part
of exercise 1.
Q. List t,..o elements of the fatherdaughter relation,.
5. List two elelents of the brother rely Lion.
6. Which of Lhe following sets are relations? Give the roster names
of those Which are relations. I
a. f'.4x 4 .3 x r 14, Y i W, x < 5, a.9:1 y i 31.1 .
b. Z3 X Zo. I
c. Ex + 5, 341 x 1 W and x 3
d. (1, 4, 3) .r_i, -4, 3, 21
e. 47. a. Define the relation "less than" on W in terns of ordered pairs.
ab. List five ordered -)airs in the relation "less than" on W.
c. Rewrite (a,b) f "less than" as a e. b for each of yo.Ir answers to b.
8. Repeat. exercise 7 for the relation "greater than"f on W.
9. Rewrite ;our a.swers to exercises 4 and 5 in the form x R y where
R reoresents tne relation riven in each Iro.deri.

7-1 261
Key to Practice Passage 12 (cont.)
ax 3r11,L 01. Gave Lht. rw-,I.L.r orifor each of the rollowini; ehrLerann products.
7-1.a. 14, 3, 73Xf.0, 4, 3, 5, 66
7..to. Zz X Lo, 074.c. f x I x 2 ...; and x 4 41 X iz I z I W and z+ 5 1 ill 07-14. a X Is rtnerc A = [xl x2 W, x is even, aid x < 93 0
Ike up a relation fro:a the first to the second se:. in each part
74 of exercise 1. 03. i.axe u? a relation from the second set to the first. set in each part
1-1ofexercise 1. 0
uirl List tii.o elements of the fatherdaughter relation."... 057.1Lis, two ele3ents of the brother rel'ticn. 06. ci.th of the following sets are relations? Give the tipl4,wqr names'
5.t.7hoe 6 Wilich are relations. 07.7a. (4X +..3 1 x£ W, Y£ W, x < 5, and y I 33 I 07...Lb. Z3 X i S I 07.1C. f(X + 5, 341 x 1 W end x 3 07-2.d. {1, 4, 31 x r_1, -4, 3, 23 07-4.e. 07. "fine the relation "less than" on W in terms of ordered pairs.
i6.14st five ordered )airs in the relation "less than" oti W.
Aliewrite (a, b) E "leiritan" as a 4 b for each oforegit answers to b.re. cpap t.. exercise 7 for the relation "greater than"f on hi.
9. 7Zetrite :your answers to exercises I and 5 in the form. Iwher,h-7 ael7i4eoresents the rel .tion riven in each proolem. I 0

262
APPENDIX B
CRITERION PASSAGE BOOKLET
Instructions
1. Use the CMMT technique to rate each of the following
passages. Be sure to record a rating of the form m-n
in each non-blank unit. Record 0 in each completely
blank unit.
2. Rate the passages in the order presented. However,
you may go back and change classifications in rated
passages if you change your mind.
3. Refer to the Rater Training Booklet whenever you wish
while rating the experimental passages.
4. Return this booklet to me in the envelope provided when
you have completed the rating of all passages.

r 0 '' :c
Division and sets I .......
Here is a way to think about uivision.
1-rDThink: Think:
There are 5 setsof 3 in a seT. of. _
_3.
r-') (:) Fil r4:`, ."7,-
I . i . 0 0 I ; ;
I ( )There are 3 sets C .)of 5 ; ,; i 1 :,,..,A).L..)1.1v U
.
,
in a set of 6 .).,15. I
Write: 15 =5 =3 Write: 15 =3 =5
5 is the divisor.
3 is the quotient .
;
I 3 is the dVsor.! 5 is the quotient.
EXFHC3SES
1. Draw a set of 18 dots on your paper.I Ring as many sets cf 6 as you can.1. [A] How many did you tind? [s] Solve the equation, 18= 6= it
2. Dr,-.1w a set 7:2.4 dots on yourTaTrasnisrs(!ts of L ;:s vC,)! can.' Solve the eduation,:24÷ 4=
! ura,v a s-A oi :12 dots on your paper. I Ring as manysets of 8 as you can. iSc) ve the equation:32-i- 8= fre.
4, Study the sets. Then solve the equation.
ILA I ( r3 n E rs c ra )
Ci
(11
[B] * * * * * * ** * * * * *
* * * * * * *
Zom.....Tri":o :P
eyNrIgaa/ fA.w...I ' I 1 s. Thor.: ace ,...;ve;is in 28.
.% 0,,ilm
23 -.--.:'.. I; -r ' ) ===
, ey CLIO..y,
4

;ircumference
26.1
)n trivet', P.N s C b
A circle 1; a ploy, on is a plane closed figure.
1 1 )ie dist:_nce CLrCie iS c :lied its cIrcr;::.ferenc.s.
lismerfis to a circle a: )cri .cter is to a polygon.' You could use a ruler to
find the length of cnch side of a pOlygon :Ind then add these lengths
to find the pert .eter of the polygon. i You could usa a tape ..ensure toNNW
find .he .ircuc.fer:nc ©s and diamPter lengths of the oujects below.
II
I
tinge
MNIIIIRMS1
The t:lule below crives Lhe circumference, diametor length, add
quotient of circumference divided by diameter length of each of those
acts,
, , t..fcrcr. 4
Din act er
Len h
28 inches
CircumfcmnceDixonter Lengl,h
3 1/71.:noel 88 inches
I Can 33 i nchos 12 inches 3 1/6
? Plate...... ....
n31:: i..ches 10 inches 3 7/40
Nol.ic thy t.hilc he circti3fcrec3s differ the du: etcr leng,hs
circul:Xcienco divided by dilacter length do..-
. oCC..,6t. of t-Locui,:cy of
nwai,c1-.: n it -t colur:In differ at ail!
14.

Lt .s true when he circuiference of nn}, circle
.-....1iS k.11V1:1.7.3
the lenG',h of di, .eter of that circle, the quotient is . lv-ys
the sane nulber. j This number is named by the Greek letter .17- (pi).
i
The number1
,11 :s -*out 3- . 1;otice how Close to 3-- etch of the7_ 7
Du=t,ers 1-: the final column of the above table is.
If C stnnds for the circumference of a circle and d st:mds for
the diameter then 14.........1111n.
rand
a. = IT
b. C = d IT
c. d
....M
You c%n use for-.1ula (b) with 3r for rt to find the circumfcrenc-
Icf circle ,fr.cn :,ou know the length of a diameter. You can use formula t
(c) to find ti.e icn6..i: cf n *.i.,,leter of a circle When you k..ow the I
1,
cir-,ulfcrence.
E.-:erciscs
""=7....-
1 :-.,'o .:.1e:.e the ..:tule.
Circit.Lrcaes Dia.:eter Radius
5 inenos
4feet
3)
d
r
.aa

i.': rid the circu .'erence of each circle in 2 through 9. 4,.
-
P
3.
lafq
.
(..). d = 17 ;irds 7. r = -.4̀,- inch
3. d = 7/11 inch 9. r = 3/4 mile
10. .. itinnt I:: the distance ;ion,- the circle from A to B?
7
I,. 1,h:t is the dist,;Inco :long the circle
travel the direction of the ia-roll?
fro.a A to D if you
c. :,fiat is the distance
o 'TO 3 L Le directL
from A to D if you travel in the
_n?
11. A :.arry-to--z)und ..: kes 3C) cor..piete tarns.
Ronald , .3 14- rt .n. each travel if Earthas
ring :.ild Ronald's L 3 '). the outer iag?
How .:;n:, feet will
horse is or the inner
i
I..--------_--
- --..
1 f Ck Wt. 1i 1------i I I
%
\

2 6
Foals Pas:, LC Ft'S
Ly.:Iroions %vim ...:roupic!-/ Symbols I
/3/1474'.1
a
Sur. irwa....In the pt-,(i.w.: exet.cise3 vou t la,v to p.-ct a 1rnr);,,r. -
-- - - :,! 2)- )
- e :i.r..t ' X'ou can ci.dr.ge an ey:,res-ion wta
v.v.aout them by usir..: the distributive
is-7-1
1:ewrite witiurat pareathescs ana combine like terms.]1: 6 -- 4(2x 5) = 6 - 8x + 20 = 26 - 8x12: 8 (3x - 5) Think: 8 - 1(3x - 5)
8 - (1.r - 5) -, 8 - 3x -I- 5 = 13 3x3: 6+ (9 -7) Think: 6 + 1(9 7x)
6 -- (9 - 6 + 9 - 7x ----- 15 'lx. -----i'r-arkot3 :- _:-e u' 'i n:.-,t. ar D-trenta(--. '3 tO gr011r) numbers and i-... -. . .
1. 11,:::: an expres ..-......-,-..........-....-......-,..,-...-.-,-,--....... .,...11f.ion cu.--s two or more pairs ot
to be-in by removing the inner-:'-0::ping sy:a,...,.... It ;nail' -,.i(s,I.- n:,ir FT:i.0 1(wtn!-; 0: ...npie show-, NA; to remove eT)unin
and tilt.: im -,-)mbine like terms.r--1
;..................-4[21 - 5'x 2)] = 3x
.a
4[2x 5x + 10] 1 Removing ( ) i4[- 3x + 10] I Combiningr_.. 3x -
terms in r 1 ii - ,'Removing[ ]!Combining
I-. 3x +LIE2:
:...,----
12x -4040
terms
:1
rife the .1,A-Pr-:,..1g uithout groupi v: symbal and comt;ine /0::? terms:1......................... a morrow..., vt....yoremamaywommwom.
Le-eres.c.:......i.. co......,....., van...1
.
I
.a .7- ,:..a .) 6. in - ( + 2a -- 4)I r-13. 'la -- 0.'.(t s- 3)
..' '. :,/ - '.) :1 s- /
I s :t. 2: 3 +
-
r ,:ted by perinis,-; ion. ConteritioTary Al (.2;ebra . Book One,, 0111 P,r,1C i.torhi, I Oz..)

2C8
Contrived P.Issne CP6 .1
Proonl!illty of A ,-)r R r----,
:, .L n tile 23; nter un Lhe dial below.,
4r1'
R red
= blue
G = Eyeen
= yellow
1(J) = 1/5
P(1) = ?
Phe event iR or ,I) can occu twice out of 5 evally likel: outoo:..cs.
Jo POI or G) = -/5. 1 -o..-,ce LII-It P(R) = 1/5 -uLd P(..1) = 1/5. I ;io in this
P(R or G) = P(3.) +
In tic 0_70 e pointer can not stop on ooth R and G.
is, tnc even..s R G c n not both occur at tlie se ti e.
goommenor
C .
= P( 1 or
A B ore ccJ.ed tly exclusive if ,,:nd only if they
__-:. )1.. ,oth o:.c..ir .a.. !,iv.! -3-1.;.e ti 'e. L
--J1po5e ou -Je pointer on the dial pictured oelow.
..1;
n) =
)r = 3/5.
11.111.................co
, ;L
. % f (1i) L ( :1) I
: .

2.09
In LI de rod :nu -5
:, even ci. o ti:c events 8 v.lid even not ,nt' L.,/
ie t e ,J we 1.1153 .rate the follnk.rin; )rt:.c,Lpie
01'
; d only tfr---
PCA or P(3),1110111.1fil.
s result : en,..r lined to ore trl:,11 two events-.2 :I the
,r43. , G 0 .-re p-d_rw-ise utually exclusive events
d 1,1 . re .t1t11' lly ecclual c or
1 if "',i)( :It or
sCS
;;- or Ell ) = 1)(14) P(E-0
t. a. P(2) =
b. P(7; =
c. P(even) = ?
B. P(odd) =
e. 2(< 3)
f. P(1`7:6) =
z. (<) =2P(between C ';) = 7
)..?Pose (-? roiled.
NI rr 6)

T
1. ,,,'1):) )' tt ( ... 1 , ', .)...,c,i t VICO. I
J. PO:(,) = (Jr = head lnt tons, tall ,2nd toss.)
,
,:. P('.) = e
__.....
c. P(TH) - ?
J. P(TT) n
e. Aril IL: .:':: T1! mutually exclusive events?
f. Are EH .d 'LT :%utually exclusive events?
g. P(at lc- .t .)ne bead) =- ?
h. P(at lea::t one tail) =
/,.n. P(B) = ?
/61 yI0
eo\
27
n
1
t
- '''`4"*". 1
b. P(B) = ?
c. P(Y) = ?
d. P(5) = '
e, P,. even) =
."---..../
, r)a
4
Na6- ''41"."4::4.%;
f. P(odd) = ?
g. P(R or odd) z 2
h. P(2 or even) = ?
i. P(b or 1:7:, 3) = ?
j. P(Y or 4 6) . 2
evanis in a throuc!,11 j are -atually exclusive?

271
Foci:', Pussa:,,e FP12
,r7 :- ) s. I ,Not,(': that t! it mot'on ol the pttrli'l,ct a1on th square is
r by fp) in, ' 1 ' 1 1 : h , i ; 6 'r 1 . 1 Of . 1 1 0, tri ,:1 of non-, ,11. ( iti e,tc.,,1 :10.,.:;0..; 111,1. do:.1.1ins
! ni of 1 tott,..it of then^:tt;,. , to :ttett.dre Cce tame ot vhen the particle
in the c:ttfitercit., ;, 'is.. dr u live numbers to measuretir"e of motion vii-a-n m, in the clockwi:e direction.
counterclockwise cktekwise clockwise
abs (32 V2) = abs ( %/-2)2
(23 \i') ord ( -23 V-2)
2abs (1 4V2) =
2
ord (1 4V2) =
To find the value o' tth, for ordl fur a given argument k, let the particletart at the point (I, 0' .;dd aiono, the squvre at th rate or 1 unit
nn,iW lc Sec, )11,i k oirt_ctl,,:l of motion is eouiltetcle.:1,:vp-.3 if the are.tt-1: ;; add c! t; it ti. .t, ,,imcnt "lit: value of a^s
cc. ; ; .( ,Of ...I C.J.,,(any:-. th.:Ainat position. /
1. Com,s;;tt.
(a) dl)s ( 2) (!t) ore. ( - -v2) (c) abs (-1)((!) ( 1) . Iv) abs PI (1) old (-6\ /2)
2. '11.e:, 1i or.tolis of it., r, I old tur argimrat-interval fl ran 10 to 10.
3. ice a rt.-ztilar lieN.t.(!on with radius 1on a ct.ortImate 1,1,me in such .k Way
colts.r 't' eu('t,lirtatk.,. 10,0)
! Let a t:1; P tittr'et , 't!)n tt`,', ui pti;lort A
t ortit
;,. : tf tit;
. -, c- t;
, 6
n.
(Reprinted bypermission.Algebra withTrigonometry,Fehr, et al.,D. C. 1leat4and Conp:,ny,1963.)

272
Cont v cd Pa oc CP101)
', -r. 1.):.-o,')orLio:: :1 1...d the P;, tha,orean Theorem
1.),,f,. ..it ,..on.11 Given set: ,:ents Aii, 8, and EF.
.hen n is the menn oronortiona_l uetween Aa and E."r"
if o-nd only if-A--'Ll =1
- --CTS .1CD a
Theorem 1: The altitude to the hypotenuse of a right triangle is a
Moan proportional between the segments into which the foot
roC the aLitudc divides the hypotenuse.
Proof: Since ADC 411a.D CDC [is a sidlarity it
0
X
follows 13:7 definition of similarity
r.
N
that -4-P- = 1---2---G
CI LEand the proof is
complete.
A
v c 4
Theorem 2: The .sum of the squares of the meE,sures of the legs of a right
triancle is the v are of the measure of the hypotenuse.
c Proof: Since ACD 44 ADC /is a stailarity we
X
1.1
'1 y
have ...D _ AC x =orAC AB b
So, :-: x.c.Firailarly C3D4:..i) ABC
is a similarity and P1-3 Gil ora--CP
--- = --Q.-- So, h - pc . Thus,a c
_0
as a b = x.c + y.c = (x + y) c =r
Tiv.:-Jrc:, 2. ; m; a:t iri,porLa.A theore,a in Et--.iometry.,....
It is called the,- f-', -.)-( -r, r-corP-1. 1
Lii..f.rc-hie3
,. ..- ,i.E..).,.. i, .,...4... ,,-,.., ,,i,o,..L.c.s,: c bnd icgii Gl ,J.,:d. 1.) find the , ri c3 a .311.2 Ei
.......1f;+. l,i (2 thi rd r,.i.de. 1
s

e. a = 3, b /fa'
1,'Ind BC, ;..D, c1 D. A
J. ?Ind BC ,Ind L.
6
4. -inl AC, JU, ;Ind M.
A
X C
C
5. Find t:e. ratitnde of nn c;qualateral triangLe in terms of the side
lont,Lh 3.
6. Py1,11-.cor,:pa ;n ter:n.3 o.0 arca.1
Lra the area, of L:fillaVOS?
1ie. of I he srtup ce 3 ye) a tal
V

74
7. Use the figure to dive an area proof of the Pythagorean Theorem.
A
PPPPP1b
Ils,... the figure to give an area proof of the Pythagorean Theorem.L
...
6
6 0-
c
9. Let W be thc point of intersection
Allrof the diagonals of the square. 1 Let
(,)'/-2 be parallel to the hypotenuse of bthe right triandlelLet WY-L XL.
411111,a. BOW can svero (6) be disected into
five regions four of which are congruent to (1), (2), (3), z.nd
(4) and one which is congraent to (5). You can cut regions4.---. ....Ewangsrpearn
congruent to (1) through (5) out of some paper and try to fit
them into region (6) if you have trouble)
h. ;plain how this proves the Pythagorean Theorem.

275
A PPEM-.)i.i C
VALIDITY FOCUS PASSAGFS
Division and sets
Focus Passage FPI.
Here is a way to think about division.
Think: ( )There are 3 sets F-7--., I)of 5 in a set of ( )15.
Write: 15+ 5=3
0Think:There are 5 sets . , .1. I; . :
of 3 in a set of 1
,.....,, ,......i. L...., (...,),...,...15.
Write: 15+3=5
5 is the divisor.
3 is the quotient .
3 is the divisor.
5 is the quotient.:
EXERCISES
1. Draw a s't of 18 dots on your paper.Ring as many sets of 6 as you can.[A] How many did you find? [13] Solve the equation, 18 + 6 = .11.
2. Draw a set of 24 dots on your paper. Ring as manysets of 4 as you can. Solve the equation, 24 + 4 = :n:.
3. Draw a set of 32 dots on your paper, Ring as manysets of 8 as you can. Solve the equation, 32 + 8 = :n].
4. Study the s,-..ts. Then solve the equation.
[',.] (till Cl D7-7): [B] * * * * * * *
a-.1ri D Fl D 71D * * * * * * *(n r: r: n n r:;)
* * * * * .`r *a) n n r3 c-: 11)
24+6= n
[C]0 0' 0 0 ei
0 0 0
0 0 0 0
0 0 >
21+ 7= 20+4=
5. Give the missing numbers.
[A] There are I: : sixes in 36. [s] There are ,', ,; sevens in 28.
36 -6= :I 28 + 7= n(Ruprinted by pt=i-7sion. 1.1(:i" c:Itary school '.1athcmatIcs,
'iool< ,, Eichol: and O'Dnfr, ,+daison-;,csicy PublishipgC6:.1' ny, 190S,)

276
Focus Passave FP3
THE COMMUTATIVE PROPERTY OF ADDITION
1. a. How many fingers are shown in A? How manyfingers are shown in B?
11 \11/
) I B \b. A number sentence for A is 2 + 5 = 7. Write a
number sentence for B.
c. Is 2 + 5 = 5 + 2 a true sentence?
2. Solve.
a. 3 + 6 =n b. 6 + 3 =n c. 3 + 6 = n + 3d. 12 + 17 = n e. 17 + 12 = n f. n + 17 = 17 + 12
Twe whole numbers may be added in either orderwithout affecting the sum. This is the commutativeproperty of addition.
3. Add. Why are these sums the 34 25same? We check by adding in the +25 +34opposite direction.
EXERCISESSolve.
I. 7+9=9+ 2. 47+3=n+47 3. +10=10+8
4. n+94=94+38 5. 86+48:- n+86 6. 13+n=29+13
Add. Check by adding in the opposite direction.7. 41 8. 126 9. 34 10. 493
+28 +63 +52 +5
( Reprinted by permission. Five , Ejcploring Elemental"1-:therrnti,:s , Kccdy, ct al. , 761 t, Rinehart and Winston, Inc. ,

277
Focus Passage FPS
1771 Exploring Idoos
Multiplication ofrational numbers
In unit 6 you learned that multiplication ofnatural numbers is a mapping of the set of or-dered pairs of natural numbers onto the set ofnatural numbers. You also learned that theproduct of two natural numbers is a naturalnumber. In this lesson you will learn how tofind the product of two rational numbers.A Look at Dl. What arc the first and secondcomponents of' each ordered pair of rationalnumbers named in the display?B :10 is mapped onto the product X De-scribe the other mappings represented in DI.C Read sentence .A in 02. Sentence A ex-presses a true statement about the product ofthe rational numbers; and 4. The number Pi isthe product of' and Is 6 the product of thenumerators of and i? Is 12 the product ofthe denominators of and i? Remember thatwhen we mention numerators and denomina-tors, we arc referring to the fractions that indi-cate the rational numbers.
D Sentence 13 also expiesses a true statement
about the product of two rational numbers.What ale these numbers'? Is their product?
The product of two rotioncl numbers is arational number indicated by a fraeLon. Thenumerator of the fraction is the product of thetwo numerators, and the denominator is theproduct of the two denominators. The workthat follows will help you use variables to de-velop the definition of the product of two ra-tional numbers.
Pmt10 I .1 fehonal roust.,, closury property ofvII ul$1,,J prow./1,

278
(180 21)
8 X 217) I
ts. 4)
55 4
12 0,3'0t2 n3X8
2 2 AC X =
3 4 3 4'
H X2= H.?M I WVa
E x de=
03
F
Universe for a and c ----- N.
Universe for b and d -= C.
S y S Y. IH 5 8 X 5'
x41C
75 i 75x1H XI 4 1 X 4
X 2 = 7 4 4 3 4G =3 6 X V I4
XA 4 X 3.
product of two rationul numbers. The uni-vvry for a and c is N. The universe for b andd is C For each replacement of a, b, c, and d,
E Look at o3. Does sentence C express a truetdiement? Does sentence I) express a true
statement? Explain your answers.Nov. look at sentence E in 1D3. Think of g
fi a' any o.vo rational numbers. The uni-vei Sc for a and c is N. The universe for b and
I , Ike iumtk..,;;;,,i ()I the pi oduk..t. of
a and < ? Is the denominator of Z5 the productof h and d?
Now we can define the product, g X :I, ofthe rational numbers g and 5. The universe fora and c is N. The universe for b and d . I-oreach replacement of a, h, c, and d, / X 5G Read sentence F in D4. What replacementswere made for the variables in Z X 5= /5 to ob-tain the statement expressed by sentence F?Is the statement true? How do you know?H What replacements were made for the vari-ables in g X = g5 to obtain the statement ex-pressed by sentence G? By scntcnce H? Bysentence I? Is each of the statements true?
Decide whether each of the following sen-tences expresses a true statement or a falsestatement.
X = K h = 18. m 1 =j L x t = N =
(Reprinted by permission.Seeing Through Mathematics,Boa One, Van Engen, et al.,Scott, Foresman and Company.)

t
P.
1.
-.,
279
Focus Passatye FPS
Expressions with Grouping Symbols
In the preceding exercises you used the distributive law to get asimpler algebraic expression. For example, 2x 3(2x + 5) = 2x 6x
15 = 4x 15. The expression 2.c 3(2x + 5) was changed to4x 15. Note that the new expression no longer ec,ntains paren-
theses as grouping symbols. You can change an expression withparentheses to one without them by using the distributive law.
EXAMPLES
Rewrite without parentheses and combine like terms.
1: 6 4(2x 5) = 6 8x + 20 = 26 8x
2: 8 (3x 5) Think: 8 1(3x 5)
8 (3x 5) = 8 3x + 5 = 13 3x
3: 6 + (9 7x) Think: 6 + 1(9 7x)
6 + (9 7x) = 6 + 9 7x = 15 7x
Brackets [ ] are used just as parentheses to group numbers andalgebraic expressions. When an expression has two or more pairs ofgrouping symbols, it is usually easier to begin by removing the inner-most pair., The following example shows how to remove groupingsymbols and then to combine like terms.
4: 3x 4[2x 5(x 2)] = 3.c 4[2x 5x + 10] Removing ( )
= 3x 4[ 3x + 10] Combiningterms in [ ]
= 3x + 12x 40 Removing [ ]= 15x 40 Combining
terms
EXERCISES
grouping symbols and combineRewrite the following without
1. 9 (7a 3) 2. 9 (72 + 3)3. 9 ( 74 3) 4. 9 + (7a 3)
5. 7a 4- (2a 3) 6. 7a (+ 2a 3)
7. 7a (2a 3) 8. 7a (2a + 3)9. 7a ( 2a -F 3) lo. 7a + (-- 2a -f- 3)
n. x (3 + 2x) 12. x ( 3 + 2x)
like terms:
132 Chapter 4

280
13. x- (- 3 2x) 14. (a 4- b) b15. (a b) + b 16. - (a b) b
17. 5 + (2x 3) 18. 2a + (a 7) + 919. 2r + 2[2: + 3(x 5)] 20. 5[x - 8(x 2)] + 10x21. 7Y 41y -I 2(11 8)] 22. - 6[7m 2(6in 9)] 8m23. 8[3x 2(x 5)] 24. 9[3x 7(x 9)] 12x
(Reprinted by permission. Contemporary Algebra, Book One,Smith, et al., Harcourt, Brace and World, Inc., 1962.)

281
Focus Pass:wc FP11
7.6. Frac/1,1J Pponents. Let x be a positive number.To take the V.1", slnadd think, "What is one of the' two equalfactors having a product of x'?"Since
Also
X3 X3 = X6,
x2.x2 = x4
X X = £2
X(?) X = x
To indicate V.X. using an exponent we must find an exponent suchthat when it is added to itself, the sum equals one. This exponentis
= X = X1XiXi.X1 = X AYX xi
=x -YX xlxi.xi.xl = x2 = xi
xi xl.x.xi.xi = X4 vx3 = xlWe sec front these examples that we may define x: as -7i-72, if b 0.
Consider the domain of each of the variables in the followingexamples and exercises as the set of positive real numbers.
Examples
1. Write the following radicals by the use of fractional exponents:(a) NYxy2 (b) 2./yz2 (c) x3V-x-
2. Write with radicals in simplest form:(a) 2xi (b) alb} (c) (ab)-i
Answers:
1. (a) = xlyl (b) 2'/yz2 T 2yizi (e) = xtr
2. (a) 2x 2V7r (b) alb! /Tib5 (c) (ab)-1 = -1 =Yu') ab
Exercises
Write with fralional exponents:
2. -///' ;3. /-;211)
111Jrceliall
. ii 5. 2 V)?

282
6. 5 Vb 7. 7.:y 8. %/a6 9, .V.TeTr' 10. N. 1 x y2
11. - / ;IP 12. \fai 13, x-V7/ 14. a\/-6 15, eV2'-16. a \r(i 17. ../G.i lg. iii
Write with rai:icals:'
19. 2-1 20. y1 21. al 22. c 23. 9a121, 3b1 25. (2x) 26. (3y)1 27. x1y1 28. albl29. 211.1 30. 510 31: xyl 32. abi 33. xiyi
:31. a1b1 35. triy :36. x1y1za
Write with radioals and simplify:
37. x-1 38. a-3 .39, be -1 40, am -1 11. (ab)-142. (xy)-1 43. WO IL 2a-1 45. 5b-1 46. al17. bi 48: a1b1 49, xly1 50. gal 51. 4b152. (a')-1 53 (1)2)-1 54. AO 55., xly-1 56. ceble-1Find the value of the following:
57, 41 o8. 9-1 59. 161 60. 83 61, 25-162. (31)-2 63. (41)_3 64. (0.008)1 65. (0.25)1 66. (1)-467. (A)-1
Simplify:2168. Ran ")(a"1)(an 911 +69. (biu)21, *70. (al)i
(Reprinted by permission. Contemporary Algebra, SecondCourl,e, Mayor and Wilcox, Prentice-Hall, Inc., 196 7)

2 8 3
Focus Passage I:P 12---- --2--
Extending tho abs and ord functions
Notice that since the time of motion of the particle along the square ismemured by nonnegative numbers, the domain of abs and ord is the set of non-negative numbers. We can extend these functions so that their domains willinclude the negative real numbers by considering the direction of motion of theparticle. Use positive numbers to measure the time of motion when the particlemoves in the counterclockwise direction, and use negative numbers to measurethe time of motion when the particle moves in the clockwise direction.
counterclockwise clockwise clockwise
abs (32 Nii) =
ord(3- N/2) = 12 i
1
2abs (-- :32 Nii) = abs (1 4\72) 2
2Nr2
ord ( f2) = 12 2
ord (1 4N/27) = /-22
To find the value of abs [or ord) for a given argument k, let the particlestart at the point (1, 0) and move along the square at the rate of 1 unit persecond for k seconds. The direction of motion is counterclockwise if the argu-ment is pc sitive a-,d clockwise if the argument is negative. The value of abs(or ord] is the first for second] coordinate of the final position.
L

432
PI.ACTICE EX'RCISES
1. Compute.
(a) abs (-0)(d) ord (-1)
284
(b) ord ( /)(e) abs (-50)
(c) abs (I)(f) ord (-60)
2. Sketch graphs of abs and ord for the argument-interval from 10 to 10.
-ww3. Place a regular hexagon with radius 1
on a coordinate plane in such a waythat its center has coordinates (0, 0)and one of its vertices has coordi-nates (1, 0). Lct a particle P move 0 A
on the hexagon starting in position A (0,0) (1,0)
and either counterclockwise or clock-wise at the constant rate of 1 unitper second. Sketch a graph of thefunction which relates the first co-ordinate of each position to thetime of travel to that position. [Use the argument-interval from 12to 12.] Tell the domain and the range of this function. Is the functionperiodic? If so, what is a period of the ft,letion?
4. Repeat Exercise 3 for the regular octagon whose center has coordinates (0, 0)and whose vertex A has coordinates (1, 0).
(Reprinted by permission. Algebra with Trigonometry, Fehr,ct al., D. C. Heath and Company, 19-6377

285
APPENDIX D
CONTRIVED PASSAGES
Contrived Passagcl CP2a
Circus
Is r. circle a closed glare figure? ,iow de you tcno0
The distance around a corcie is called its circumferonce. Circumference
is to , circle as is to a polygon. How would you
use ruler to find the perimeter of a polygon? How would you use a
tape measure to find the circumferences of the objects below? Eow
would you find the dia-leter lengths?
wheel can plate
Copy and complete the table below. For 4 and 5 choose two circular
objects and measure the circumference and diameter of ev..h.
CircumferenceDiameterLength
CircumfcrenceDiameter Length
Wheel 88 inches 28 inches
Can 38 inches 12 inches
Plate 3inches31--4 es 10 inches
(4)
(5)
Are five circumference lencL:as in your tt.ble different? Are
the cli7.;"ctcr lengths diff,rent? How :zuch difference is there between
the numbers in the lnet column: ::^ ::e two numbers which all the numbers

286
in the 1:iht column are between.
It is true that when the circumference of any circle is divided
u, the lencth of a diameter of that circle, the quotient is always the
sa..e number. This number is named b; the Greek letter it (pi). The
nuLler it is about 37 . How near to 3--7
were your answers in the
1-st column of the above table?
If C stands for the circumference of a circle and d stands for
the di .! eter then
a. =
b. C = 2 7
zind c. d =7
7
How cln you use the length of a diameter of a circle to find the
circumference? How car you use the circumference of a circle to find
the len6th of a diameter?
Exercises
Find the circumferences of the circles in 1 4.
1.
3. di:,meter = 17 yards
2.
4. radius = t. inch
5. a. Wi -t is the distance along the circle from A to B?
C)b. What is the dist nce -+:.ong the circle from A to D if you
7.,3-cure in the direction of, the arrow i

c. raot is the dist.nce fro. A to D if ;ou go in tr.e ; ncic
direction?
6. A merry-go-round makes 30 complete tuins. How ;hr:,, feet
a.G.1 id "d e.ch travel if Martha's horse is on the inner
ring and Ronaldts is on the outer ring?
7. a. What fraction of 1800 is x° ?
b. Wirt fraction of one-half of the circumference is the shortest
distance along the circle from A to P?
c. Write a formula finding the shortest disi,:nce nlong the
circle from A to P in terms of x aid the diameter d .
d. Write 1 formula for finding the longest distance along the
circle from A to P in _arms of x and the diwietcr d .
e. If x0= 600 nd d = 5 inches what is the shortest distance
along the circle from A to P? What is the longest such distance?

288
Contrived Passage CP2bGircu.lfcrence
circle l'ke a ploydon is a plane closed figure.
The distance around circle is called its circumference. Circu.ference
is to a circle as peri-,eter is to a polygon. You could use a ruler to
find the length of arch side of a polygon .nd then add these lengths
to the peri .eter of the polygon. You could use - tape :ensure to
find she circumferences and diameter lengths of the objects below.
wheel can )late
The t:.ule below dives ,,he circumference, diameter.leugth, add
quotient of circumference divided oy diameter length of each of these
o,jects.
C;ircuufcrence
Di <, Teter
LengthCircumferenceDiepeter Length
"ihecl 88 inches 28 inches 3 1/7
Can 33 inches 12 inches 3 1/6
Plate inches311T ncnes 10 inches 3 7/40
iloicc that while ,,hc circu3ferences differ diaieter lend.,hs
differ, c que,ients of circumference divided by dialeter leng,h do
1-ffer very .;uch. it !s only bec.use of int..ccur&cy of .0.asurcent
,he numbers in the last column differ at all!
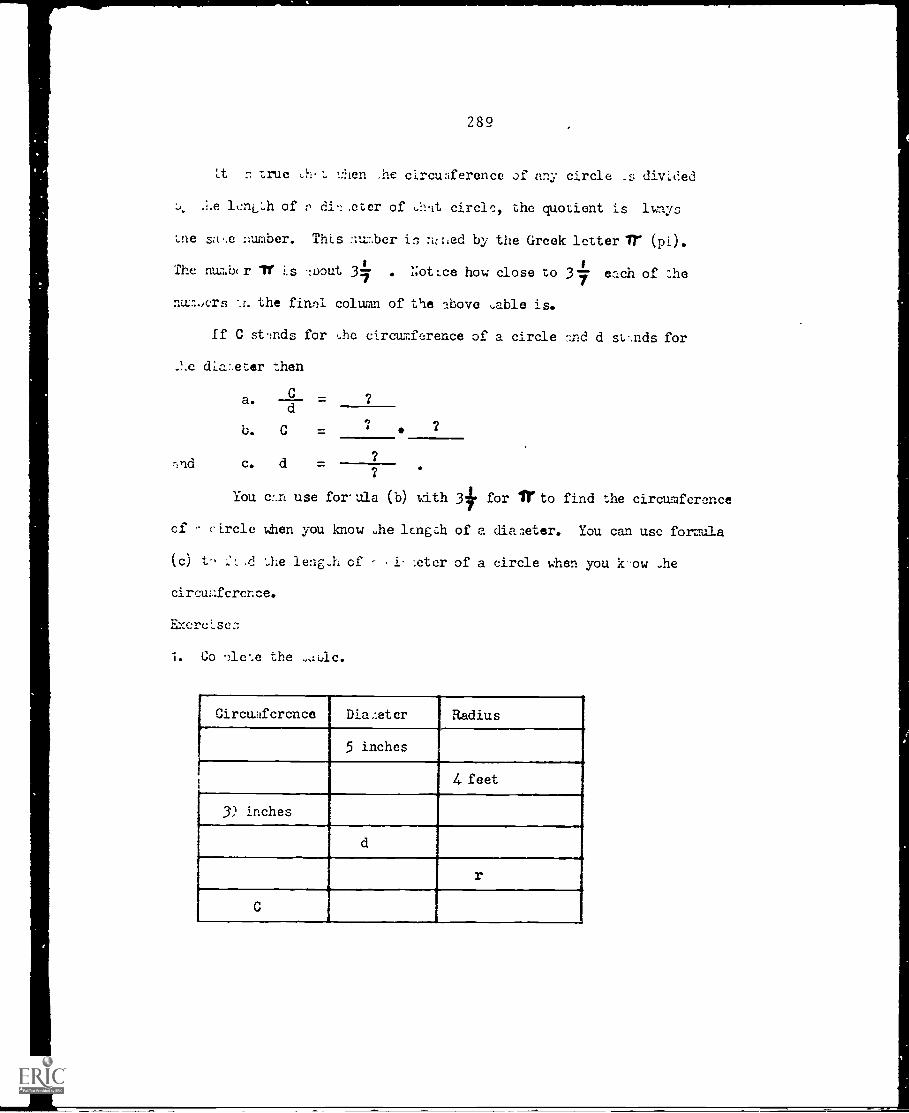
289
it o true ::hen he circuaference of any circle _s dived
lcnc.h of r ,ever of circb, the quotient is lunys
;.ne sa..e number. This nu:-.,ber is n:hed by the Greek letter it (pi).
The nua,b(r 7r is zuout 3--7 . N7
otice how close to 3-- each of :he
raua.,crs the final column of the above ,able is.
If C stnds for the circumference of a circle :r-id d stnds for
diar.e:er then
a.d
b. C =
nnd c. d
You c:.n use forula (b) with 4 for IY to find the circumference
cf circle when you know he length of a diaaeter. You can use formula
(c) t f.d he leng.h of i :eter of a circle when you k-ow he
circuc.fcrenee.
Excrcisco
1. Co )1ee the ..zinc.
Circwtfcrcncc Dia.:eter
I
_
Radius
5 inches
4 feet
3) inches
d
r
C

290
F nd ctrculference of e:h circle in ,hrough 9.
-
4.
6. d = 17 :ards
3. d = 7/11 inch
3.
5.
7. r = 2 inch
9. r = 3/4 mile
10. a. What is the distance done ,he circle from A to B?
b. Whlt is the dislnce along the circle froq A to D if you
travel the direction of the arrow?
c. What is the distance from A to D if you travel in the
o)posite direction?
11. A ,ferry -gc-wound 'Ices 30 complete turns. :low irny feet will
Ron.ld Mrtha each travel if 14arthas horse is o:1 the inner
riLL; hd Ron-adls is ?, the outer riag?

291
Contrived Passage CP4aincw;LdiLics
4 1 foot board is cut into 3 cces of equal length. To find
the IenLth of each piece, consider the equation
3 x= 12 .
Solving this equation we find, x = 4. Hence, each piece is 4 feet
long.
Five girls want to shire 23 apples evenly. To find the greatest
number of whole apples each girl can get, consider the inequality
n 5 4:23 .
Using the replacement set of whole numbers, the solution sot is
0, 1, 2, 3, 41 . So the greatest number of apples each girl
can Let is 4.
Exercises
Write and solve equations or inequalities to answer the problems.
1. In 3 dys the liner on which Carol was traveling steamed 1536
miles. If it steamed the same distance each day then how far
did it go each day?
.....
2. How 'Tiany tile would it take to cover the floor of a rectangular
room with length 20 feet and width 13 feet if the tile are
9,!uLre with 12 inch sides?
I.
00°

292
3. liow Jhny 5 foot boards can be made out of 17 boards of length
12 feet?
4. If you bough': 25 hotdogs for a cookout
1
and each person at the
cook out hrs to have 3 hotd:gs, What is the greatest number of
neople you could have at the cookout?
5. In a dart game Sam scored 25, 10, 25, and 35. Penny scored 25,
45, 15, and 40. Who Ikon the game and by how much?
0,11

293
Contrived Passage CP4bLsLng 1.quations ind IneqLnlities
L':uPtions and inequnlities enn be used to solve real world .roolems.
To do this follow the steps outlined below.
1. Express the unknovn quantity or what you want to find as
some symbol, say x.
2. Using 'the information Liven write an equation mach as
a + x = b
or an inequality such as
x c <:d
relating x to known quantities a, b, c, a..d d.
3. Solve the equ;Ition or inequnlity to find the values of x
nd thus the answer to the problem.
Exerciser
Write a .Al solve equations or inequalities to answer the problems.
1. In 3 clys tic liner on which Carol was traveling stea.ed 1536
Liles. If it steamed the same distance each day how far did
it Lo each ,2ay2
gelHow ,aany tile would iL sake to cover the floor of a rectangular
room with length 20 feet and width 13 feet if tho tile are
1. re with 12 inch sides?
13
2.0
MID
1{ {otitis

294
3. how .ciny 5 foot ,o.rdo c.,n be .ade out of 17 boz.rds of length
12 feet?
3.
I I 1
LIEM110, L-----1
I
I17
I
4. If you bought 25 hotdogs for a cook,-out and each person at the
cook-out hvs to have 3 hotdogs, that is the greatest number of
;)code you could have "t the cook out?
5. In a dart gzae Sam scored 25, 10, 25, nd 35. Penny scored 25,
25, 15, rind 20. WI° on the &,.me by how .auch?
PiNoe y
t2$.
FZ 0

295
Contrived Passage CP6a
fro,dlili L.., of ;i or
,n the pointer on the dial below.
R = red
= ulue
G = Lreen
Y = ; mellow
= white
= 1/5
:(1) =
the event (R or G) can occul twice out of 5 equally outcomes.
So P(R or G) = 2/5. 1:oLice that P(R) = 1/5 tnd P(:i) = 1/5. So in this
( P(R or G) = P(a) P(u) .
P:"Jove cx: ),c poLnter c;:n not stop on both R and G.
Lc, tJe events R nd G c. n not both occur at the sane tiae.
Evc.,nt:; .nd 3 re c lied mutually exclusive if and only if they
(%)t aoth occur same ti le.
Low sui9ose you spin the pOitter on the dial pictured oelow.
J) = P( 1 or 3 or 5) = 3/5.
P(cv,n) =
(B or even) c.n o( ur t,,ice out of five pol,1c1
Al.c-).cs. So i(B or even) = 4/5. Jut, P(J) = 1/5 Pleven) = 4/5.
P(B or oven) P(z) + P(evcn).

296
in the exa.ple just considered the pointer c9n stan ,t ooth B
nd even number. So the events B and even nre not mutl.ally exclusive.
2} lo L.1) expLcs :;)ove illustrate the following 1A)ortant nrinciple
of
A and B are mutually exclusivecv.c.;:its if and only '-':
P(11 or B) = P(A) + P(B),
This result cn ue genclized to 'core :..h n two events as in the
following state ent.
Ei pEx, es. ,E,1 nr1 p-drwise ;autually exclusive events
(i.e. Ei and Ej re uatully ecclusive for i j.)
if and only if P(E1 or Ea, or see E, ) = P(E.) + P(E2) + + P(EA).
EmIrcises
1.
L.;pose single die is rolled.
a. P(1 or 6) = ?
b. F(even) =
c. P(not 1) = ?
d. P;odd) = ?
e. P(not 1 or 6) = 2
a. P(2) = ?
b. P(7) =
c. P(even) =
d. P(odd) =
e. P(( 3) = ?
f. 6) = ?
g. P(4:1) =?
h. P(between C ) = ?

3. = (12 = head 1st tnsn, 4nci 1,oss.)
b. P( =?
c. P('1`:) ?
P(T:) =
e. Are :12 2,',1 T1: Putually exclusive evcx,....7
1. .d Ltur,lly exclusive events?
?(.it 1,...st one head) = ?
h. P(dt 11 east one = ?
4. a. P(R) = ?
b. P(-) = ?
c. P(I) = ?
d. P(5) =
a. e. P(even) =
f. P( odd) = ?
g. P(R or odd)
h. P(i or even) =
i. P(z or 3) = ?
j. or < S) =
k. /Lich ?airs of events in e through j are ..uturlly exclusive?

Probability of A or b
298
Contrived Passage CP6b
The pointer or n circular dial spins aid stops on one of five
sectors of equal area. The sectors are colored red, blue, green,
yellow, and write. The probability that tne pointer stops on olue
is 1/5. What is the probability that the pointer stops on red?
The event the pointer stops on red or green can occur twice
out of five equally likely possible outcomes. So the prooaoility of
red or green is 2/5. Notice that in'this example the probability of
red is 1/5 aic the probability of green is also 1/5. So in this
exa the bro.ability of red or green is equal to the prooability
of red dus he prooaoility of green.
In the above example the poj.nter o.1 the dial can not stop at
,oth red ad green. That is, the events red and green can Lot ooth
occur at the sane time. Two events that can not both occur at the
le time :re called 4utuallv exclusive everts.
Now suppose we number the colored sectors of the dial in the
above exa.tple. Let the red sector be numbered one, blue oe two, green
oe three, yellow be four, a d white i.e five. The event the pointer
stops rt lue or an even number can occur twice out of five possible
outcomes. That is, two out of the five possible sectors would produce
the required event. So the probability of olue or even is 2/5. But,
in this exallple the prooability of blue is 1/5 and the probability of
:pi even number is 2/5. So in tnis exa Iple the proo:l.ilit: of olue or
even is not equal to the sum of the prooabilities of olue and even.
In the cm..-.ple ju: t clven ,,he pointer can stop at oo.h olue and
in even number. .hat is, tile events blue a:.d even can both occur at

299
the same time. So in tnc exa tne event are not uuually exclusive.
2he two examples above illustrate the following i:Tortant prince le
of pro,.;:bility.
Two events are mutuall: exclusive if and onl: if the prooability
of oe oz_t_ile other 13 !..1.e hum of uhc oro.Jabilities of each one,
ThIn result can ue generalized to more than one event as in tie following
state lent.
N events nre poirwilge ,utualiy exclusive (i.e. each pair of
Lee events is a mutually exclusive nnir.) if and only if
the prooability of the first or the second or . the nth event
is the sum of the orom.bilities of each single event,
Exercises
1. A dial is divdied into eiLht sectors of equal area and numbered one
through eight. When the pointer is spun What is the provability of
a. ,etting two?
b. Letting seven?
c. Letting an eve numuer?
d. Letting u . odd number?
e. getting a number less than three?
f. getting a number greater than or equal to sixl
g. getting a number less than one?
h. getting a numoer between zero and nine?
2. Suppose a single die is rolled. What is the provability of
a. Getting one or six?
b. getting an even number?
c. getting an odd number?
d. getting so nething other than one?
e. not getting one or six?

30G
3. Suniose coin is Lonned twice.
a. Wn t is the nro,aLility of Letting two heads?
b. Of getting a Lead z: d then a tail?
c. Of get-ing a tail - d then a head?
d. Of getting two tails?
c. Are getting a head d then a tail a,d getting a tail and then
a head mutually exclusive events?
f. Are getting tl,o heads a d geeing two tails mutually exclusive?
E. Wi, .; is the ,)rdbaoility of getting at least one head?
h. reat is the probability of gettin at least o;,e tail?
4. SulT)ose a circular dial is '3ivided into twelve sectors of equal
area hu,,bered one thro,Igh twelve. Suppose sectors one through six
are red, sectors seven thro,Igh nine are blue, a .d the remaining
sectors are yellow. What is the probability of
a. red?
c. getting yellowq
e. getting an even?
g. uctting red or a odd?
b. getting blue?
d. getting five?
f. getting an odd?
h. mAting olue or an even
i. getting a blue or a number less than or equal to three?
J. getting a yellow or a number less than six?
k. Which pairs of events in e. through j are mutually exclusive?

301
Contrived Passage CP7jSo.,( 1 Conse,,a(nccs of the Axio-s
Suppo-e :n is a line in plane 1r
D. Axiom 1(a) there is n line n in Tr
with n ra. By Axiom 1(b) ..here ',re
distinct points A and 3 in line n.
Now if uoth A and 3 were in ra then
we n vn.ich is not the case. Hence, at least one of he
-)oi ,ts A or 3 is :.ot m. Thus, we have the following theorem,
TheoreL, 1: m is a line in plane Tr then there is point inirwhich is %ot in
Now, by Axiom 1(a) there exists a line
m in rlane lr . 13y Axiom 1(b) there
are distinct points A and 3 on m.
B Theorem 1 there exizts a point C
in plane IT JUt no:, in line in. Hence,
we h ve our second theorem.
Theorem -: There are at least three .,on-collinear points in a given plane.
Let msdn be two distinct lines in
a p.ane IT. We know such lines exist
Axi.om 1(a). Assume there are two
distinct Poin..s A and B so that A f m n
and 3E miNn. Then :-:. and n are two
(istinct lines each co t:.2. ing ioin..s A a (1 B. But, this is im)o':sible
Jy Axiom Hence, the a..ove assumption is imposr;ible and we have proven
our thied tneorern.
Theorem 3: Two disinct li es can not lirve more than one point in corl.on.

302
I4ow let A be n; point in plane .
By AXIOM 1(a) there are two distif.ct
lines m a .d n in TM . If uoth m and
n contain A then we have points 3 and
ir with B in n, C m, A 3, and A C
ry Axiom 1(b). Furthermore, 3 # C
because of Theorem 3. Therefore, there
is a li .e 1 contai ing B and C by
Axiom 2. This li .e 1 can not contain A since if it did we would have
A, 3, rind C all on 1 and 1 = m = n which is impossible. Thus we have
that, in case At mAn then there is a line 1 in n. with A not on 1.
Clearly, if A t n n m then either .1 or n does not contain A. Thus we
r.r:vu esta,lished the following theorem.
Theorem 44 If A is n point in a plane I'then there is a iine in lrwhich does not contain A.
se s
Prove the folic..wiN, theorems.
1. ..heoreu. 5: If A is a point in plane fl' then there are at least two
lines in n each cp:itaining point A.
2. Theorem Eit. There are at leant three nonconcurrent lines in plane'.
3. Theorem 7t If each of two lines in it is parallel to the sa.ne line in
then they are parallel to each ocher.
4. i'lleorem 8t If m is a!:,, line i:. plane irthen '.here are at least two
points i, ir which are not in line m.
5. Theorem 9: If A is any point in plane IT then there are at least two
lines in iT which do not contain A.
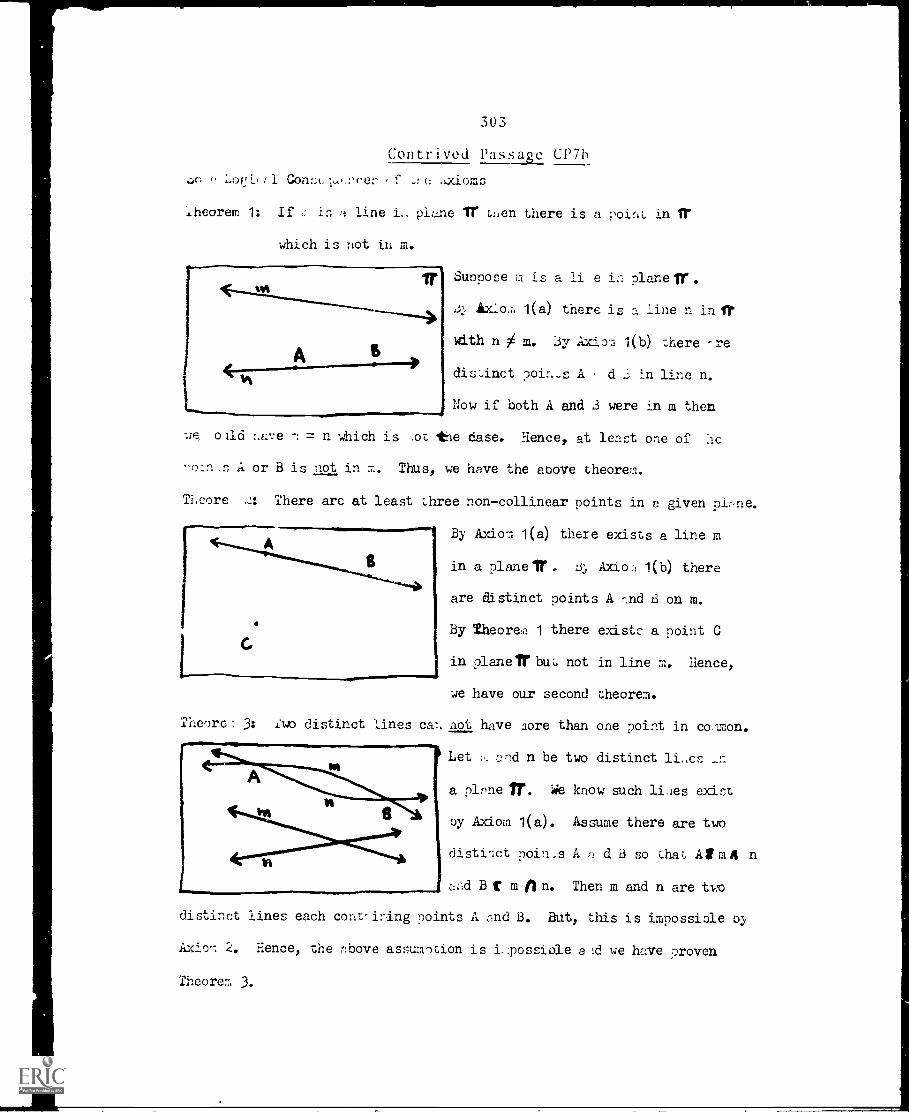
303
Contrived Passage CP7h
Lori, :1 Cori:;t, .0C101:13
Theorem 1: If in line i.. plane /I- tnen there is a point in rr
which is riot in m.
we
s
Suppose n is a ii e in planer.
1(a) there is a line n in ft
with n / m. 3y AXiD71 1(b) ;here -re
distinct poin_s A d 3 in line n.
Now if both A and 3 were in m then
o ild :.Lve = n which is .ot tie ease. Hence, at least one of -ne
-oin.s A or B is not in m. Thus, we have the above theorem.
Theore ..:: There arc at least three non-collinear points in a given pine.
1
(..
By Theorea 1 there exists a point C
By Axiom 1(a) there exists a line m
in a planer,' . Axioa 1(b) there
are distinct points A r.nd 3 on m.
in planer but not in line m. Hence,
we have our second theorem.
Theore: 3; iwo distinct lines ca.% not have core than one point in colmon.
Let and n be two distinct lics _n
a plane Ir. We know such lines exist
oy Axiom 1(a). Assume there are two
distinct poin,s A a d i3 so that Aim* n
and B C m fln. Then m and n are two
distinct lines each cont-irng points A and B. But, this is impossiole oy
2. Hence, the rbove assumption is i.ipossible a:d we have proven
Theorem 3.

acore,l 4: If A .s r point id a plane 1r then there is c. line in V'
which does not cont :in A.
Let A oe an,, point in tr. Axiom 1(a)
fr there are two distinct lines madn
in If . If either m or n does not
contain A then the theorem is true.
Sappose m and n both contain A. Thenfr
there exist points B and C with B in m,
C in n, B A, and C / A by Axiom 1(b).
Furthermore, B # C by Theorem 3. Now,
there is a line 1 containing B and C Axiom 2. This line 1 can not
contain 2. since if it did we would nave A, B, and C all on 1 and 1 = = n
w:Iich is ianossible. Thus, we have established the above theorem.
Exercoses
Prove the following theorems.
1. Theorel 5: If A IS r, ')oint in plane 11' then there are at least two
lines i. Tr each contai ing point A.
Theoren 6t There are at least three nonconcurrent lines in plane Ar.
3. Theorea 7: If each of two lilies in lir is parallel to the same line in 1f
then they are n'irallel to each other.
4. Theorem 8: :f m is aly line i. pla ie 11' then there are at least two
poits in 1r whi_h are of in line m.
5. Theorem 9: If A Ls any point in plane If then there are at least two
lines in It which do not contain A.

305
Contrived Passage CP9a
zrodu ts ..ions
Let = 1, 4, 31 = (a, b3 . Forming the set of all ordered
-Arf. whose first co-Iponent is from A and whose secon component is from
3 we , . , v e ( (1,a) (2,a) (3,a),(1,b) ,(2,b) . This set is denoted
f1, 2, 33X fa,b1 or A X B. A X 3 is read a A cross B" nd is called
the cartesian product of A -nd Notice that in ...hi exa :de -. ordered
fi, 2, .A)( bb if a-s3 onl if x I 11, ,, 33 a d ylf a, b3
,citing _ +, A3 and N = a) we :lave,
= (,6) (,*), (4,0), (4,A), (4,0), (4,0). Notice that in this
e;',.. is 1,1 N = 61 / . But, if the example above A X B = .
1. Give the roster name for each of the following cartesian products.
a. (2, 3, X fo, 2, 3, 5, 63
Z3X Z5.
c. fx1x1W and x< Xf zl ztW nnd z + 11.3
d. A X A where A= xIxL w, x is even, and x (
*
Let = 1.1, 2, 33 a,d = fa, .
Let R = (2,b), (3,a))
Then RC AX 3 . We say the set R is a relation triza A to 13.
Suopose S7-1(1,b), (3,0 . Since S C A X B, then S is al's°. a...relation
from A to B.
*
4. I.-Ike up a relation from the first set to the second set in each part
of exercise 1.
3. ,z,ke uo a relation from the second set to the first set in each part
of exercise 1.

306
Let p. = Ix is r: hale human beings
Let B= fy I y is a fe,ale human being)
Let R = [(a,b) ( b is the daughter of a aNd a is the father of 1.Then RC A X B and hence 8 is a relation from A to B. We might call
thin relation the fatherdaughter relation.
Let U = xix is a human being)
Let 5 = i(a,b) la is the brother of b3
Then SCU X U and S is a relation from ir to V. Notice that the
set U is used as both the first a d second set LI the cartesian product
ire this exmmple. In such a case we say S is a relation on U.
4. List do eleaents of the father daughter relation.
5. List two ele lents of the brother relationship.
6. which of the following sets ore relations? Give the roster na,aes
of tr.ose which are rein Lions.
U2.x+11xtW,y1LW,x<59Pidy4C.31b Z X Z3
c. f(x + 5, 3x) xf Wandx<31
d. 1, 2, 14-1, -4, 3, 21e. 95
Let W Ix the set of whole numuers.
Let L = f(x,y)(3 cf N such that x c = y)
Since LC W X W then L is n relation on W. L is such an important
relation on w that we give it a special name. L is called t!ie "less than"
re! tlon We usually denote L by 4( and write 2 < 3 or 2 L 3 to indicate
th;.t E L. Both of the stai..e.aents 5 L 9 and (5,9)1 L mean the sa.ie
thing.

307
3*
7. a. Define ti,e re14A.on > on W in terms of ordered pairs.
o. List five ordered ;airs in the relation on W.
c. Rewrite (a, b)t10 as a > b for each of your taswers to b.
8. Rewrite your answers to exercises 4 eLd 5 in the form x R y where
R represents the relation riven in each proolem.
*

308
Contrived Passage CP9b
e.rte:3inn Products a .d Rel. tions
Gonr.ii!er arbitary sets A and B and the stet of all ordered lair5.3
co Ponent is an ele lent of A and whose second co ponent is a., eie..ent
of Such sets of ordered pairs are important in nan; branches of :lathe
matics. We now inke the following for,:al definition.
Definition 11 For all sets A and B,
AX.3=1(x,y)lxgAandylB).
A X B is re; d " A cross B" a id is called the Cartesian
product of A and B.
i 'mediate consequence of this definition is the following theorem.
Theorem 1: (alb)1 AX i34A1 a t A and b £ s.Proof: ( Let (a,b)1 AX B. Then (a,b) I f(x,y) I x IA and y I
Sol a A and b
( *) Let a f A and b£ B. Then (alb) ti(xly) ix SA and y C B3= A X J.Defiiition Zs Let A and B be arbitar, sets.
Let RC AX B.
Then R is called a relation from A to B.
Phis definition tells us that an subset of a cartesian product of two
sets is relatio'i from the first set to the second set. When RCAXA
we have a relation fro. A to A. In this case we say R is a relation on A.
she idea of a relation is an important mathemati(:al concept. Man, relations
ca be found a, d are used in everyday life. Among these are all the
oioio,;ical relationships between people.
Let R be a relation. Siege RCAXB for some sets A and B we k.ow
tLe ele c'its of R must be ordered pairs. Thus we ca...1 write (a,b) R
to ;.-.ow tne ordered pair ( ,b) is in the relation R. Man:, tines we write
a n b to indicr,te that (a,b) f, R. Both of these statements mean exactly
the sane thing.

Exerciseo
1. Give the roster na'Ne for each of the following cartesian products.
a. f'4, 3, 71X(0, 2, 3, 5, 6)
Zi X Zg.
c. ixix1Wandx441thizt Wand z+ 5 le 11)
d. A X A vthere A = ix! x W, x is even, and x < 9)
Enke uo a relation from the first to the second set i. each part
of exercise 1.
3. 1,ake un a relation fro. the second set to the first set in each part
of exercise 1.
4. List two elements of the fatherdaughter relation..
5. List two elements of the brother relation.
6. Which of the following sets are relations? Dive the roster names
of those Which are relations.
a. V.x +33' 1 x£ W, yf W, x 5, and y 33b. Z3 X Zs'
C. EX + 5, 3)01 X l W and x 633d. [1 2, Axr_i, 4, 3, 2)
e. 41
7. a. Define the relation "less than on W in terms of ordered pairs.
b. List five ordered 7airs in the relation "less than" od W.
c. Rewrite (a,b) f "less than" as a < b for each of your answers to b.
8. Repeat. exercise 7 for the relation "greater than ".' an W.
"?. iterite your answers to exercises 4 and 5 in the form x R y where
R reoresents the relation given in each problem.

310
Contrived Passage CP10airo)oriond .he P:AhaLorean iheorem
Since AD0114CD., in Figure I t3 si .LI-rity, it fro;
def.:.itlon of si il: rity. That is , it f-)liow: thntCD
x =So, 111 = x.: and h = rcrr
The set; .ent CD is said to ,e a :::can oro')orLiorai bett.een the se,..cntsONO.
AD a A DJ. You can cououte the easure of CD uy just coputing .he
square root of the .roduct of t,.e .eacures of Al) So, we have
f').; .hcore
Theorem 1: The alitude to the hypotenuse of a right trinhgle is a A,ni.
propor io.,n1 ,etween the set; ,tints inLo which he foot of thc
divides the hypo,enuse.
Alrn in Figure t, since 4".CD44./..bC Is n ciAilarity, it follows ,hat
So, AC is a ::een proportio,:al oetween BD nnd 5Z. TheseAC aresuits are useful in establishing one of he L.ost imoor ant theorems in
(no .etry, since fro. ',hem it follows Ghat
b12* = x.c and al = .
Therefore, al' + bs = y.c + x.c = + x).c = Thus we have
proved the Pythagorean Theorem.
Theorem 5LV: of the squares of t.le ,casures of the legs of e right
triangle is the square of the measure of the hypotenuse
The PythoLorean Theora is a surprisig result, especially if :oti
interpret it in er ,s of area. In Figure II, squares aro drawn on each
of the sides ()f a right tria igle. Since the area-neeoure of a square is
the s,4u:.re of t-e 'ensure of oe of i,s sides, the Pythagorean Theorn
tells us that the sum of the area-measures of Lhe squares ol the logs
the area -'ea:ure of '.he square on the kpotenuse.

: '
311
ivc o t. ihec,reT:
4, Lrure ;11 nee hot iosriblc to
d i 2ecl. the 1 r; e:t .:iu.ire i'ito five recions, four of which are co:.grInt
to regions (1), (.4), (3), 'Ind (4) and one of 1..hich is congruent to
s.;utire (5) .
Other n ':irn-c hes to t:Ic P:thagorean Theore rc illustrated by
Fioire IV :,nd Figure V. In Figure IV we have (a + b)1= 4 (-,21 a b) + ci" .
6o, al + ab + bs = ab + ci . Hence, at + bt = c s . In Figure
we have ci = 4 (- ab) + (b = 2 ab + bt ab + ai = al + bt .
Finall: it is porsible to use the Pythagorean Theore., to find unlaiown
icnchts in right triangles as illustrated J: the following exa .ples.
nle 1: Find in Figure VI.
S' :ace at + 71 = 251 , it follows that al + 49 = 625 -IA
th.t. at = 576. Hence, a =1135 = 24. So, BC = 24.
')le Find A3 n Figure VII.
&Li cc c 6 + 101 it follow:- !.),a', et = 136 and that
C = 477 = fre, SO) AJ = 37
3: Find tie .earure of a altitude of the ea.1).11ateral triangle
in Ft gure VIII.
Since (a..'.) (AD) + n , it follows ,,hat.
= 6~ (4)1 = 36 9 = So, h = 1r77 = 3'3
II

312
ICI 1 IV
10
VII VIII
Lacerci2es
1. For right 6ABC with kpoLenuse c legs a e..d b find the measure
of the third side.
a. a= 2, = 5.
J. a = 9, L = 13.
C.
d.
e.
a = 3/L,
b = 2/3,
a = 3,
c = 2.
c = 3/2.
= 17. .
G. Find the indicated measures in Figure X.
0Find the indicated .ensures in Figure XI.
4. Fald the indicated,ensures in Figure XI I.


314
Contrived Passage CP10hV.ear. Pr000rtio:1-1 c the P:fthagorean Theorem
Definition 11 Given set; ents AB, c , nnd FF.
Men 55 is the mean proportional oetween AB and EF
if and o 3 if CD
GD LF
Theorem 1s The altitude to the hypotenuse of a right triangle is a
mean proportional between the segments i)to which the foot
of the al.atude divfdes the hypotenuse.
Proof: Since ADC*, CD,, Is :? sililority it
follows by definition of similarity
AD DCthat = ---- and the proof isCD DB
complete.
Theorem 2s The sum of the squares of the easures of the legs of a right
triangle is the square of the aef,sure of the hypotenuse.
Proof: Since ACD W AUG is a si,ilarity we
r
C
have Aor ------- --
AC AB b 0
So, bi = x c. Similarly, Q3D414ABC
CBis a sililarity and 0CB
orAB
_i_ _A_. So, as = pc . Thus,a c
e 4. 1:;11' = x.c y.c = (x + y),c = el' .
Theore-: 4 is an important theorem in geometry. It called the
Pythagorean Theorem.
Exercises
1. For right 4 ABC with hypotenuse c and legs a and b find the easure
of the third side.
a. a= 2, b = 5.
a.

b. a = 9,
c. a = 3/6
d. b = 2/3,
e. a = 31
L = 134.
c
c = 3/2.
b = ra .
2. Find BC, AD, and BD.
3. Find BC and DE.
A
4. Fild AC, BC, and DB.
315
A ti D 2
5. Find the altitude of an equalateral triangle in terms of the side
length s.
A
6. Interpret the Pythagorean Theorem in terms of area.
What Are the areas of the squares?
How are the areas of the squares related?
Why?

316
7. Use the figure to five an area proof of the Pythagorean Theorem.
b
b
B. Use the figure to give an area proof of the Pythagorean Theorem.
C.
9. Let W be the point of intersection
of the diagonals of the square. Let
4Z be parallel to the hypotenuse of
the right triangle. Let WY .1- XZ.
a. How can square (6 be disected into
five regions four of which are congruent to (1), (2), 0), cnd
(4) and one which is congruent to (5). (You can cut regions
congruent to (1) through (5) out of some paper and try to fit
them into region (6) if you have trouble)
b. Explain how this proves the Pythagorean Theorem.

317
APPENDIX E
CMMT ANALYSIS COMPUTER PROGRAM
I. This program performs the CMMT analysis for mathematics
text passages. Rater codings are punched on data cards.
The output of this program includes the CMMT li
matri'es, and proportions for each passage analyzed.
Any number of passages may be analyzed in a single run.
2. Fortran Program Statements.
--DIMENSION A (10i7)-98(10tIO) 9C1-7171-01(45)----------NO
44 BLANK=000TOTAL=04000 1 1=1,10DO 1 J=1,7
1 = _ _DO 2 1=1,10DO 2 J=1,10
2 8(I.J)=0.0DO 3 1=197DO 3 J=197
JJ2=0N=N4.1
9 REA0(5,4) (M(K),K=1,45)4 FORmAT(15(12,11912))
TF(m(1).EG.99) GO TO 45IF(JJ10Lu.0)WRITE(6,96) N
96 FoRMAT(191-40 LIST FOR PASSAGE 1,14)1=1J= 2K=3

318
8 J1=M(I)-J2=m(J)j3=m(K)
IF(J1.EQ.88) GO TO 5IF(J1.(T.10.0R.J1.LT.0)IF(J2.67.7.0R.J2.LT.0)
---IF(J3.000)-GO TO 46"WRITE (6,60) J1,J2,J3
60 POHMAT(5X9316)IF(J10L000) GO TO 6-A(J19.12)=A(J11J2) + J3IF(JJ19NE.0) B(JJ11J1)=R(JJ19J1)+1.0"IF(JJ2.NE.0) C(JJ29J2)=C(JJ29J2)+I.0---8(J19J1)=8(J19J1)+J31C(J29J2)=C(J29J2)*J3»1JJ1=J1 ___
JJ2=J2GO TO 7
6 -8LANK=bLANK4j3---------7 1=1+3
J=J+3-K=K+3-
TOTAL=TOTAL+J3IF(J.LT.45) GO TO 8IF(J.GT.45)----GO Ta-9-----
5 CONTINUEWRITE(600) TOTAL
70 FORMAT(14H0 TOTAL UNITS IF6,0)PBLNK=EiLANK/TOTALWRITE (6910) NOBLNK
10 FORMAT(31H0 PROPORTION OF BLANKS PASSAGE
WRITE(6950) N50 PORMAT(35H0 FREQUENCY MATRIX MODE 1 PASSAGE ,13)
DO li K=1910
WRITE(6)12)-(B(K,L)IL=1-910)12 FORMAT(2H0 910F6.0)ii CONTINUE
DO 13 1=1910DO 13 J=1,10
13 H(I,J)=B(19J)/(TOTAL -.BLANK-1,0)WRITE(6951) -N
Si FONMAT(36H0 PROPORTION MATRIX MODE 1 PASSAGE 913)DO 14 K=1910
14 WRITE(6915) (B(OL)9L=1,10)15 FoRmAT(?H0 ,10r6.3)
WRITE(6,52) N52 FOHMAT(43H0 PROPORTION EACH CATEGORY MODE 1 PASSAGE 03)
DO 16 1=1910
!3(1,1)=b(1,1)o8(192)+B(1,3)+8(1,4)+B(I,5).8(196)C4(t97)4.1-i(10)oR(T99)+B(1910),,ft, tw2-i) tf(I,I)
17 PORHAT(3X,F6.3)16 CONTINUE
GO TO 46GO TO 46
114,F8,3)

319
P) =13(1,1) +13(2,1)1 3,1) +8(4,1)P2=P10(6,1)P3:11(6,1)/P2P4=P1/P2P5=0(5,1)+8(6,1)+8(7,1).8(8,1)03(911)WRITE(6,61) P1
61 FORMAT(27HO PROPORTION OF EXPOSITION tF6.3)WRITE(b02) P2
62 FORMAT(33H0 PROPORTION CONTENT DEVELOPMENT ,F6,3)WRITE(6,63) P3
63 1:OHMAT(47H0 PROPORTION ACTIVITIES IN CONTENT DEVELOPMENT ,F6.3WRITE(604) P4
64 FORMAT(47H0 PROPORTION EXPOSITION IN CONTENT DEVELOPMENT tF6.3WRITE(b,65) P5
65 FORMAT(39H0 PROPORTION REQUIRING OVERT RESPONSES ,F6,3)WRITE(6,53) N
53 FORMAT(35H0 FREQUENCY MATRIX MODE 2 PASSAGE 913)DO 19 K=197---WRITE(6,20) (C(KtL),L=1,7)
20 FORMAT(2H0 t7F6,0)19 CONTINUE
DO 21 1=197DO 21 J=1,7
-21 C(I,J)=C(1,J)/(TOTAL13LANK-.1.0)WRITE(6,54) N
54 FORMAT(36H0 PROPORTION MATRIX MODE 2 PASSAGE tI3)DO 22 K=197
22 WRITE(6,23) (C(K,L),L=1,7)23 FORMAT(2H0 OF643)
WRITE16955) N55 FORMAT(43H0 PROPORTION EACH CATEGORY MODE 2 PASSAGE 03)
DO 24 I:10C(It1)=C(It1)+C(It2)+C(It3)+C(I,4)C(It5)+C(It6)+C(I,7)WRITE(6,25) C(I,1)
25 FORMAT (3X,F6,3)-24 CONTINUE
P6:4(3,1)C(4,1)4C(5,1)WRITL(6,26) P6
26 FORMAT(31H0 PROPORTION MATH ILLUSTRATION ,F6.3)P7=P64C(6,1) +C(7,11--WRITE(6,27) P7
27 FOHMAT(29H0 PROPORTION OF ILLUSTRATION ,F6.3)WRITL(6,59) N
59 FOHMAT(43H0 INTERACTION MATRIX MODES 1 AND 2 PASSAGE tI3)DO 36 K=1110WRITE(6;37) (A(K-tL),L=16.7)
31 FORMAT(2H0 t7F6.0)35 CONTINUE
00 TO 44415 WRITE(6,47) J1tJ2,J3tf IN 0411' p315)40 STOP
END

320
3. Date Ar-angement on Input Cards for a Given Passage.
Columns 1 and 2: Dimension 1 classi-
fication, right
adjusted.First Message:
Column 3: Dimension 2 classification.
Columns 4 and 5: Weight of the message,
right adjusted.
Second Message: Repeat above for columns 6 through 10.
Continue through the passage using 75 columns of each
card. Columns 76 through 80 may be used for identifi-
cation information. After the last message is punched,
punch 88 in the following two columns. Each passage to
be analyzed starts on a new card.
4 Data Deck Order.
First Passage Cards.
Second Passage Cards.
Last Passage Cards.
Final Card of Data Deck: Punch 99 in columns 1 and 2.

321
APPENDIX F
COMPUTER PROGRAMS FOR SCOTT RELIABILITY GOEFFICILTS
1. These programs compute the Scott reliability coeffici-
ents for each dimension of the CMMT category system.
The programs compute the coefficients for any number of
pairs of subjects.
2. Fortran Statements of the Dimension 1 Program.
OIMFNSION-I11-38)4T2(3Sr9P(10)--NN=0
20 NN=NN+1N=0
21 T=0.0tnO.n00 1 K=I010
I P(K)=403in PEAn(5,2) (I1(K),K=1,38)2 FORpAT(38I2)
IF(T1(1)0E0.-1) Go TO 6IF(T1(1).E0.99) GO TO 2()____________________
_REmO(5,e) (I2(K)+K=I+38)DO 1 K=1,3bIF(T1(K).E(d.0) r,0 TO 33Ir(T100.E.Q.12(K)) A=A+1.0M=11 (K)
P (M)=P(M)41.0_
P (M)=P(P)+1.0T=T+1.0
3 CONTINUEGO To 10
33 PO:A/TDO 4 K=1,10
4 P(K)=IP(K)/(2*T))**2PF=1)(1)+P(2)+P(3)+P(4)+P(5)+P(6)+P(7)+P(8)+P(9)+P(10)P=(PO...PE)/('...PE)
N=N+IwRITP'697) NN9N
7 FORvAT(20HODIMP,'S10N 1 PAIR (+14+214 ++I4+2H ) )
%04ITF(b0P) POA f(MmAT(25HOPROPORTION OF AGREEMENT ,Fn06)
;1?IrF (6,9) Rq i-OPFAAT(22MORELIAHILITY ESTIMATE oFF1.6)
(.= Tr p)6 .)1uP
END

322
3. Fortran Statements of the Dimension 2 Program.
DIMENSION-I1(38).12(38),P(7)-NN=0
20 NN=NN+1N=0
21 T=000A=0.0DO 1 K=17-------------
1 P(K)=0.010 HEAD (5,2) (I1(K),K=1.38)2 FOPMAT(38I2)-
IF(I1(1).E0.-1) GO TO 6IF(1l(1).EO.99) GO TO 20RFAD(502)-(T2(K).K=1.38)DO 3 K=I.38IF(I1(K).E0.0) GO TO 33IF(1100.E0.I2(10) A=A.140--------------M=11(K)P(M)=P(M)+1.0M =12(K)P(M)=P(M)+1.0T=T*1.0
3 CONTINUEGO TO 10
33 PO=A/TDO 4 K=147
4 P(K)=(P(K)/(2*T))**2pEr.p(1).P(2)*P(3)+P(4)0)(5).P(6).P(7)pr. (PO -Pt) / (1-PF:)NIA41WRTTE(6,7) NN,N
7 FORMAT (20HOOIMIINS/ON-2 --P-AIR-11-14.-2Ho-04-i2H )
WRITE(6,8) PO8 FORMAT(25H0PROPORTION OF AGREEMENT .F8.6)
WPTTE (6,9) R9 FORMAT(22PORELIABILITY ESTIMATE ,F8,6)
GO TO 216 STOP
END

323
4 Data Arrangement for Input Cards for a Given Subject
on Dimension n, n = 1,2.
Columns 1 and 2: Subject's dimension n
rating of first message,
right adjusted.
Columns 3 and 4: Subject's dimension n
rating of second message,
right adjusted.First Card:
Repeat for as many columns as necessary
up through column 76.
Columns 77 through 80: Identification
information.
Second Card (If necessary) Continue above.
Continue until all messages are punched.
Note: Messages coded 0 are not punched on the data
cards. Each pair of columns before the end of
the passage must have a positive entry.

5. Data Deck Order.
a. Cards for subject
pair (m,n) :
b. Order
of pairs
in deck:
First
324
First card for subject m.
First card for subject n.
Last card for subject m.
Last card for subject n.
First subject pair cards.
Second subject pair cards.
Subgroup:Last subject pair cards.
End of subgroup card: Punch
99 in columns 1 and 2.
Repeat for as many subgroups as desired.
Last data card in deck: Punch -1 in
columns 1 and 2.

32S
APPENDIX G
COMPUTER PROGRAMS FOR SCORING CRITERION PASSAGES
I. These programs compute between- and within-rater scores
for subjects using the CMMT technique to code a given
passage. The output consists of scores for each dimen-
sion, overall scores, and the KR-20 reliability estimrite
for each CMMT dimension. The programs will score up to
.60 subjects' ratings on a given passage.
2. a. Fortran Program Statements for One Card Passages
and Between-Rater Scores.
101 DTmENSIUN IC1(3s),IC4(38),T1(10),T2(7)102 DTmFKSIoN IS1(3R),I52(38),P1(10),P2(7)103 DTmENSION p1(60),p2(b0) ,PV1(38),PV2(38)201 NN=0202 Do 1 K=1,10
1 7f(K)=0.0204 On 2 K=1,7
2 T2(K)=0.0D0 42 K=1,60PI(K)=0.0
42 P2(K)=0.0104 no 34 K=1,38
Pvl(K)=0.034 Pv?(K)=0.0105 PFAD(5,3) (1C1(0,K=1,38)106 PFAU(5,3) (1C2(K),K=1,3A)
3 FoRmAT(3812)107 on 4 K=1,38
J(IC1(K),E00) IT=K-1IF(IC1(K).E(1.0) GO TO 19m1- 1C1(K)m2=IC2(K)T1 ((1)= T1(1.31) +1,0
4 T7(m4)=7204?)+1.019 X=7,,.(1)+T2(2)+Ie(3) #12(4)4T25)+12(6)+12(7)17 PFA0(513) (IS1(K)K=1,38)
203 IF(IS1(1).F(J.-1)G0 TO 1810?i PrAu(S9i) (IS2(K),K=1,38)
On 5 K=1005 i."(0=C!.
On 6 K=1,7

326
6 P?(K)=0.0109 no 7 K=1,38
IF(ISi(K),F0.0) Go TO 20mmIC1(K)M=ISJ(K)IF(m.LOGN) P1 (m)=P1(M)+101(M.EO.N) PV1(K)=PV1(K)10-m=IC2(K)N=IS2(K)Ir(m.tniiN) FV2(K)=Pv2(K)+1,0
7 IF(M.LO.N) F4(1)=p2(M)1.020 SI=P1(1)+P1(2)+P1(3)+81(4)+P1(5).P1(6)+P1(7).P1(8).P1(9).81(10
53=P2(1)+P2(2)+P2(3)82(4)P2(5)+P2(6)+P2(7)NN=NN.1wtITE (6,8) NN
8 FoRmAT(30R0RET4FEN RATER SCORES SUBJECT rI6)-WRITE(6,9) XoSI,S2
9 FoRmAT(42H0NUMHER OF ITEMS AND NUMBER RIGHT EACH DIM,3F8.2)R1(NN) =S1p3(NN)=S2no 10 K=1,10
IF(T1(10.NE.0.0) P1(K)=P1(K)/T1(K)10 IF(T1(K).E0.0.0.) F1(K)=-1
wRITE(6,11) (Pi(K),K=1,10)
11 FoRMAT(26H0SCORF EACH CATEGORY DIM 1,10F6.3)Si=S1/X4'oTTE(6,12) S1
12 FnRMAT(13H0 SCOPE DIM 1,F8,3)On 13 K=1,71F(T2(K).NE, 0.5) P2(K)=R2(K)/T2(K)
13 IF(T2(K),ED. 04) F2(K)=-1WDITE(6,14)(P2(K),K=1,7)
14 FoRmA1(26HOSCORF EACH CATEGORY DIM 2,7F6,3)sITS2/XWnITE(6,15) S2
15 FoRMAT(13H0 SCORE DIM 2,F8,3)Si=(S1.0S21/2.0WoITE(6,16) SI
16 FORMAT(15H0 OVEpALL SCORE,F8.3)Go TO 17
18 SPO1=0.0Sm0?=0.0On 3e Kr-I,ITPv1(K)=PV1(K)/NN
32 Pa(K)=Pv2(K)/NMOn 3.5 K=1,IT

327
S001=SP01+Pv1(N)*(1-PV1(N))3.3 soo2=sPU2+Pv2()*(1-Pv2(K))
XmIl=t).0
xmI2=0.0Do 30 N=1,NN)0JI1=xt411.R1(K)
30 xmI2=xM12412(K)xPA11=XmI1 /NNXmI2=XMI2/NNVy1=0.0Vy2=°,0Do 36 N=1,NNPi(K)=R1(K)-XMIT
36 7?(K)=R2(K)-Xml?Dv 31 K=1,NNVyl=v11+Pl(K)**p
31 Vy2=VY2+R2(K)**2Vy1=VY1/NNVy2=VY2/NN7=IT
RwK1=(Z/(Z-1))*(1-(SPUI/VY1))Po<2=(//(2-1))*(1-(sP02/VY2))WoITt(693=3)(H1(x),K=1,60)
35 FoRmAT(23HooEvIATION SCORES UIA 1,6(/5X,10F6.2))woITE (6,40)(R2(K),K=1,60)
40 FoRmAT(23HOOLVIATION SCORES UIM 2,6(/5X,10F6.2))wDITE(6937) VY1
37 FnRmAT(16H0vARIANCE DIM 1 ,F8,3)wnITt-(6,38) VY2
38 FeRmAT(16HOVAPIANcE DIM 2 9F8,3)wrITE (6,39) RKK1
39 FoRmAT(12HOKH20 DIM 1 ,F6.4)wvITE(6,41) HKN?
41 FoPmAT(12H0KP2U DIM 2 ,F6.4)STOPEND

328
b. Modifications for Two Cald Passages.
Replace 38 with 76 in program statements numbered
101 through 109 and 17.
c. Modifications for Within-Rater Scores.
Remove statements numbered 17, 203 and 108 from the
positions given above and place them between state-
ments numbered 34 and 105 so that the order of state-
ments is 34, 17, 203, 108, 105.
Remove statements numbered 202, 1, 204, and 2, and
place them between statements numbered 3 and 107 so
that the order is 3, 202, 1, 204, 2, 107.
3. Data Arrangement for Input Cards for a Given Subject
(or Criterion Scores) on Dimension n, n = 1,2.
Columns 1 and 2: Subject's dimension n
rating of first message,
right adjusted.
Columns 3 and 4: Subject's dimension n
rating on second message,
right adjusted.First Card:
Repeat for as many columns as necessary
up through column 76.
Column 77 through 80: Identification
information.
Second Card (If necessary): Continue above.
Note: Messages rated 0 are not entered on the data cards.Each pair of columns before the end of the passagemust have a positive entry.

4. Data Deck Order.
a. Between-Rater
Scores:
b. Within-Rater
Scores:
,
.<
329
Dimension 1 criterion card(s).
Dimension 2 criterion card(s).
Subject 1 dimension 1 card(s).
Subject 1 dimension 2 card(s).
Subject n dimension 1 card(s), n<60.
Subject n dimension 2 card(s), 1.1.60.
Final card in deck: Punch -1 in
columns 1 and 2.
[ Subject 1 dimension 1 card(s),
first rating.
Subject 1 dimension 2 card(s),
first rating.
Subject 1 dimension 1 card(s),
second rating.
Subject 1 dimension 2 card(s),
second rating.
Repeat for each subject up to n, n<60.
Final card in deck: Punch -1 in
columns 1 and 2.

330
APPENDIX H
COMPUTER PROGRAMS FOR DETERMINING CRITERION RATINGS
I. These programs compute the most frequent ratings of
messages on both CMMT dimensions for any number of
raters on any number of passages.
2. a. Fortran Program Statements for One Card Passages.
nimrNSION TA(38),IR(3H),IC(10,3;1) 910(7918)21 n( I J=1939
D, 2 K=1,10Tr(c,J) = /n- 3 L=1,7
3 I i(L9J) = 01 uNTINUL6 PP.-An (5,4) (1A(K), K=1938)4 FPmAT (3Pr2)
I-(14(1).F_0,-1) GO TO 7P(1,1(1),1,70,-2) GO TO 21p7"An(5,4) (11(K),K=193:4),n' i J=3,1BI(1A(J).FQ,)) 60 To 6K = la(J)I = IF' (J)
/r(K,J) = IC (K,J) +'15 T" (1.9J) = TD(L,J)
fx To h7 Pr d K = 10'3
10-111.(' 99) (IC(J,K), J=1+10)O f.(? ;T .10PJ)
lo K=1,3Q11 1',"AlI) Ir_(5,11) mcj,K),J=197)
(1r TO ?CS-OP
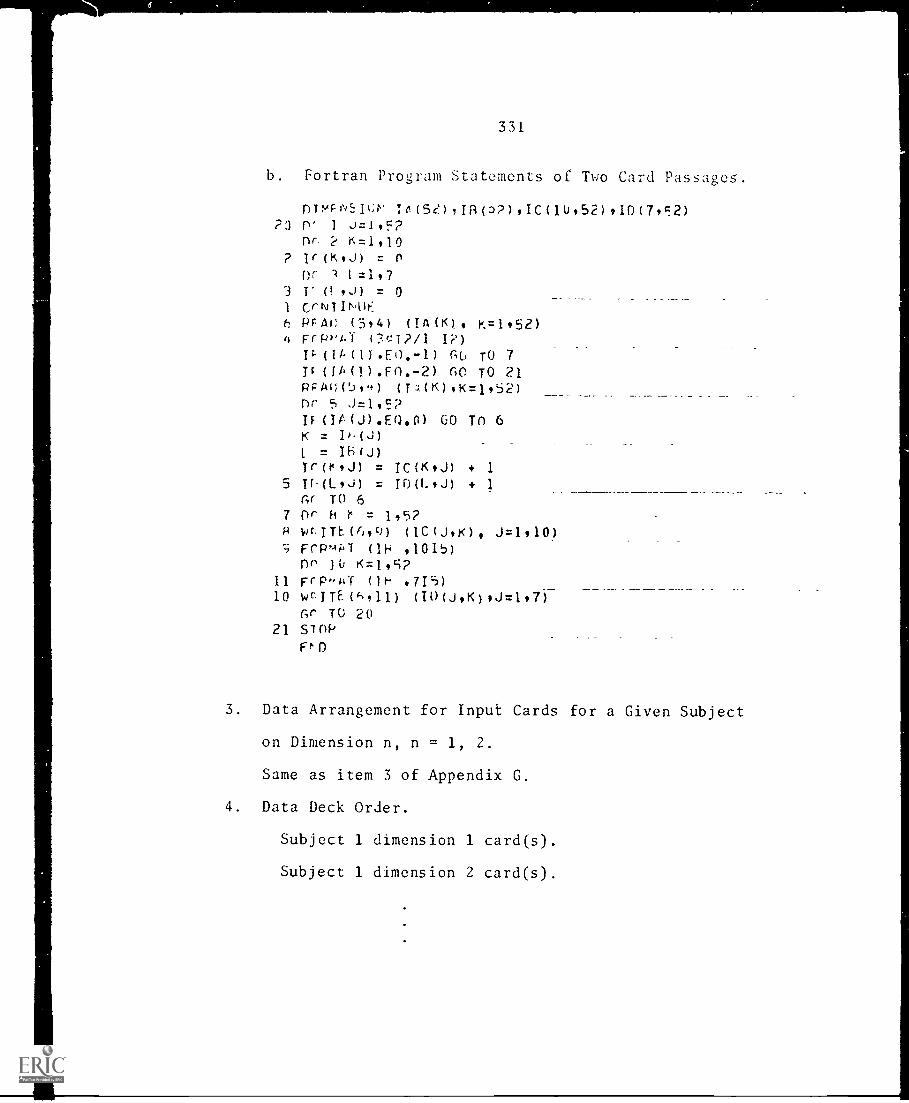
331
b. Fortran Program Statements of Two Card Passages.
riTN'PNSIt:r 16(5e)11[1(0?),IC(1U,52)910(792)?3 n' I J=1,5?
nr. ? K=1,10? If(K,J) = n
Dr 1 ( =1,7
3 1 (( ,J) = 01 CrNTII\44:_
e, PrAG (5,4) (IA(K), K=1+52)4 FrP (?Ci?/1 I?)
F(Ib(11.F.O.'"I) CI() TO 7ir(fA(1).Fn.-2) no TO 21PRA 0(51'+) (Tq(K),K=1,52)nr 5 J=1,5?IF(1t.(J).E0.0) GO T0 6K =
= Ib(J)Tr(e,J) = ICOC,J1 + 1
5 Tr(L,J) = TOO.,J) + 1
Gr TO 6
7 " H = 1,5?H wr,1TE(6,Q1 (1C(J,K), J=1,10)
FrPmP7 (114 ,10Ib)no 1(1 K=1,5?
11 FrPHAT OP))10 wcITE(h/11) (TD(J,K),J=1,7)
Gr TO 2021 STOP
F!'D
3. Data Arrangement for Input Cards for a Given Subject
on Dimension n, n = 1, 2.
Same as item 3 of Appendix G.
4. Data Deck Order.
Subject 1 dimension 1 card(s).
Subject 1 dimension 2 card(s).

332
Subject n dimension 1 card(s).
Subject n dimension 2 card(s).
End card(s) for first passage: Punch -1 in columns
1 and 2. Use two of
these for two card
passages.
Repeat for as many passages as desired.
Last card(s) in deck: Punch -2 in columns 1 and 2.
Use two of these for two card
passages.