DOCUMENT RESUME - ERIC · ed 240 122. author. title. institution spons agency. report no pub date...
68
ED 240 122 AUTHOR TITLE INSTITUTION SPONS AGENCY REPORT NO PUB DATE NOTE AVAILABLE FROM PUB TYPE EDRS PRICE DESCRIPTORS DOCUMENT RESUME TM 830 107 Wilson, Kenneth M. A Study of the Validity of the Restructured GRE Aptitude Test for Predicting First-Year Performance in Graduate Study. Educational Testing Service, Princeton, N.J. Graduate Record Examinations Board, Princeton, N.J. ETS-RR-P2-34; GREB-RR-78-6R Oct 82 69p. EducatiOnai Testing Service, c/o Virginia Cox, Graduate Record Eicamination Program, Princeton, NJ 08541 (Sing. copies free). Reports ReL,arch/Technical (143) MF01/PC03 Plus Postage. *College Entrance Examinations; *Data Analytis; Grade Point Average; Graduate Study; Higher Education; Performance Factors; *Predictive Validity; *Scores; Test Interpretation; Test Validity IDENTIFIERS Test Revision; *Validity Research ABSTRACT Initiated in 1979, this study obtained empirical evidence regarding the predictive validity of the restructured Graduate Record Examination (GRE) Aptitude Test. Of special concern were the questions regarding the contribution of the analytical section, as well as obtaining evidence of the correlational validity of scores on the restructured verbal and quantitative sections. The reported results are based on analyses of data for 100 small departmental samples '(36 graduate schools) from the fields of English, education, history, economics, chemistry, mathematics, computer science, and economics. Following the descriptions of analytical rationale and assumptions, assessments of validity are based on samples of departmental data pooled by field. The results provide preliminary evidence of the validity of the restructured GRE aptitude Test (and selected other predictors) for predicting first-year graduate grade-point average in samples of first-time graduate students entering in fall 1978, in subgroups defined in terms of sex, and in samples of self-identified minority students. (PN) *******************************************************************ft** * Reproductions supplied by EDRS are the best that can be made .* * from the original document. * , ***********************************************************************
Transcript of DOCUMENT RESUME - ERIC · ed 240 122. author. title. institution spons agency. report no pub date...
ED 240 122
AUTHORTITLE
INSTITUTIONSPONS AGENCY
REPORT NOPUB DATENOTEAVAILABLE FROM
PUB TYPE
EDRS PRICEDESCRIPTORS
DOCUMENT RESUME
TM 830 107
Wilson, Kenneth M.A Study of the Validity of the Restructured GREAptitude Test for Predicting First-Year Performancein Graduate Study.Educational Testing Service, Princeton, N.J.Graduate Record Examinations Board, Princeton,N.J.ETS-RR-P2-34; GREB-RR-78-6ROct 8269p.EducatiOnai Testing Service, c/o Virginia Cox,Graduate Record Eicamination Program, Princeton, NJ08541 (Sing. copies free).Reports ReL,arch/Technical (143)
MF01/PC03 Plus Postage.*College Entrance Examinations; *Data Analytis; GradePoint Average; Graduate Study; Higher Education;Performance Factors; *Predictive Validity; *Scores;Test Interpretation; Test Validity
IDENTIFIERS Test Revision; *Validity Research
ABSTRACTInitiated in 1979, this study obtained empirical
evidence regarding the predictive validity of the restructuredGraduate Record Examination (GRE) Aptitude Test. Of special concernwere the questions regarding the contribution of the analyticalsection, as well as obtaining evidence of the correlational validityof scores on the restructured verbal and quantitative sections. Thereported results are based on analyses of data for 100 smalldepartmental samples '(36 graduate schools) from the fields ofEnglish, education, history, economics, chemistry, mathematics,computer science, and economics. Following the descriptions ofanalytical rationale and assumptions, assessments of validity arebased on samples of departmental data pooled by field. The resultsprovide preliminary evidence of the validity of the restructured GREaptitude Test (and selected other predictors) for predictingfirst-year graduate grade-point average in samples of first-timegraduate students entering in fall 1978, in subgroups defined interms of sex, and in samples of self-identified minority students.
(PN)
*******************************************************************ft*** Reproductions supplied by EDRS are the best that can be made .*
* from the original document. * ,
***********************************************************************
U.S. DEPAKMENT OF EDUCATIONNATIONAL INSTITUTE OF EDUCATION
EDUCATIONAL RESOURCES INFORMATIONCENTER (ERIC I
Thrs document has been reproduced asreceived from ',he parson or organizationOriginating it.Minor changes have been made to improvereproduction quality.
Points of view or opinions stated in this docu-ment do not necessarily represent official NIE
r4- position or policy.
"PERMISSION TO REPRODUCE THISMATERIAL HAS BEEN GRANTED BY
11( VV. ison.r.)
. TO THE EDUCATIONAL RESOURCESINFORMATION CENTER (ERIC)."
41;t11:19,.....WIRCIPM:20:31.L.Mtry,
5e,
Imisms....1341133.1121212
A STUDY OF THE VALIDITY OF THERESTRUCTURED GRE APTITUDE TEST
FOR PREDICTING FIRST-YEARPERFORMANCE IN GRADUATE STUDY
0,
I
Kenneth M. Wilson
Gre Board Research Report GREB No. 78-6RETS Research Report 82-34
October 1982
This report presents the finding of a re-search project funded by and carriedout under the auspices of the GraduateRecord Examinations Board.
EDUCATIONAL TESTING SERVICE, PRINCETON, NJ
UKt OUAKD KLJLAA411 Kt1UK1JFUR GENERAL AUDIENCE
Altman, R. A. and Walimark, M. M. A Summary
of Data from the Graduate Programs andAdmissions Manual. GREB No. 74-1R,January 1975.
Baird, L. L. An Inventory of DocumentedAccomplishments. GREB No. 77 -3K, June
1979,
Baird, L. L. Cooperative Student Survey(The Graduates L$2.50 eachi, andCareers rnd Curricula). GREB No.
70-4R, Ma:r.h 1973.
Baird, L. L. ,e Relationship BetweenRatings of Graduate Departments andFaculty Publication Rates. GREB No.
77-2aR, NoveL'ir 1980.
Baird, L. L. and'Knapp, J. E. The Inventory
c.f Documented Accomplishments forGraduate Admissions: Results of aField Trial Study of Its Reliability,Short-Term Correlates, and Evaluation.GREB No. 78-3R, August 1981.
R. L. Graduate Admissions andFeilow,ship Selection Policies andProcedures (Part I and II). GREH No.
69-5R, July 1970.
Centra, J. A. How Universities EvaluateFaculty Performance: A Surveyof Department Heads. GREB No. 75-5bR,
July 1977. ($1.50 each)
Centra, J. A. Women, Men and the Doctorate.GREB No. 71-10R, September 1974.($3.50 each)
Clark, M. J: The Assessment of Quality inPh.D. Programs' A ?reliminaryReport on Judgm. ..s by GraduateDeans. GREB No. -7,31i, October
1974.
Clark, M. J. Program Review Fractices ,ofl'niv,ersity Departments. GRE:B No.
7 5-5aR, July 19-7. ($1.00 each)
DeVore, R. and McPeek, M. A Study of theContent of Three GRE Advanced Tests.GREB No. 78-4R, March 1982.
Dcnion, T. F. Annotated Bibliography ofTest Speededness. GREB.No. 76 -9K, June
1979. .
Flaugher, R. L. The New Definitions of T stFairness Ir, Selection: Developments
and Impl'.73tions. GREB Nu. 72-4R, May
1974.
Fcrtna, R. O. Annotated bibliography of theGraduate Record Examinations. July
1979.
Frederiksen, N. and Ward, W. C. Measures
for the Study of Creativity inScientific Problem-Solvin. May
1978.
Haftnett, K. T. Sex Differences in theEnvironments of Graduate Students andFaculty. GREB No. 77-2bR, March1981.
3
Hartnett, R. T. The Intormation Needs ofProspective Graduate Students. GREB
NG. 77-8R, October 1979.
Hartnett, R. T. and Willingham, W. W. The
Criterion Problem: What Measure ofSuccess in G:aduate Education? GREB
No. 77-4R, March 1979.
Knapp, J. and Hamilton, I. B. The Effect of
Nonstandard Undergraduate Assessmentand Reporting Practices on the GraduateSchool Admissions Process. GREB No.
76-14R, July 1978.
Lannholm, C. V. and Parry, M. E: Programs
for Disadvantaged Students in GraduateSchools. GREB No. 9-1R, January1970.
Miller, R. and Wild, C. L. 'Restructuring
the Graduate Record ExaminationsAptitude Test. GRE Board TechnicalReport, June 1979.
Reilly, Kr R. Critical Incidents ofGraduae Student Performance.GREB No. 7U-5R, June 1974.
Rock, D., Werts, C. An'Analysis of TimeRelated Score Increments and/or Decre-ments for GRE Repeaters across Abilityand Sex Groups. GREB No. 779R, April1979.
Rock, D. A. The Prediction of DoctorateAttainment in Psychology, MathematicSand Chedistry. GREB No. 69-6aR, June1974.
Schrader, W. B. GRE Scores as Predictors ofCareer Achievement in History. GREBNo. 76-1bR, November 1980.
Schrader, W. B. Admissions Test Scores a;Predictors of Career Achievement inPsychology. GREB No. 76-1aR, Septembet1978.
Swinton, S. S. and Powers, D. E. A Studyof the Effects of Special Preparationon GRE Analytical Scores and Item Types.GREB No. 78-2R, January 1982.
Wild, C. L. Summary of Resea_rch onRestructuring the Graduate RecordExaminations Aptitude Test. February
1979.
Wild, C. L. and Durso, R. Effect ofIncreased Test-Taking Time on TestScores. by Ethnic Group, Age, andSex. GREB No. 76 -6R, Jtine 1979:
Wilson, K. M. The GRE Cooperative Validity.Studies Project. GREB No. 75-8R, June1979.
Wiltsey, R. G. Doctoral Use of ForeignLanguages: A Survey. GREB No. 7U -14R,
1972. (Highlights $1.00, part 1 S2.00,
Part II $1.50).
Witkin, H. A.; Moore, C. A.; Oltman, P. K.;Goodenough, D. R.; Friedman, F.; andOwen, D. R. A Longitudinal Studyof the Role, of Cognitive Styles inAcademic Evolution During the CollegeYeats. GREB No. 76-10R, February 1977(.$5.00 each).
A Study of the Validity of the Restructured GRE Aptitude Test
for Predicting First-Year Performance in Graduate StuAy
Kenneth M. Wilson
GRE'Board Research Report GREB No. 78-6R
October 1982
Copyright ©1982 by Educational Testing Service. All rights reserved.

1
Acknowledgments
This study was conducted under the auspices of the Graduate Record Ex'aMinations
Board whose sustaining support of validation research attests to a continuing interest
in assuring that the interpretation of GRE scores can bc based upon uptodate and
reliable information regarding their predictive validity. That this interest is
shared by the graduate school community is indicated by the participation of over 100
graduate departments from 36 graduate schools in this study. Without such shared
interest, concern, and support, this 'study would not have been possible.
At Educational Testing Service, Neal Kingston, Foster Schoenthaler, Frans Van
Der Lee, and Cheryl Wild made it possible to collect, process, and, analyze data using
the GRE Program data'files and validitystudy routine-s; Richard Harrison and Lucy
Mitchell programmed additional analytical routines needed for the study; Mary Jo
Clark facilitated communication among parties concerned with the study; Rodney
Hartnett reviewed the'initiai draft of this report and provided numerous helpful
suggeitions; Ruth Miller provided valuable editorial assistance; Frances Livingston
provided secretarial assistance throughout; Christine Sansone and her. - associates in
the manuseriptprocessing unit of the Division of Educational Research and Development
prepared final copy for-the manuscript.
_These contributions are acknowledged with appreciation.
Kenneth M. Wilson
iii
The Study in Brief
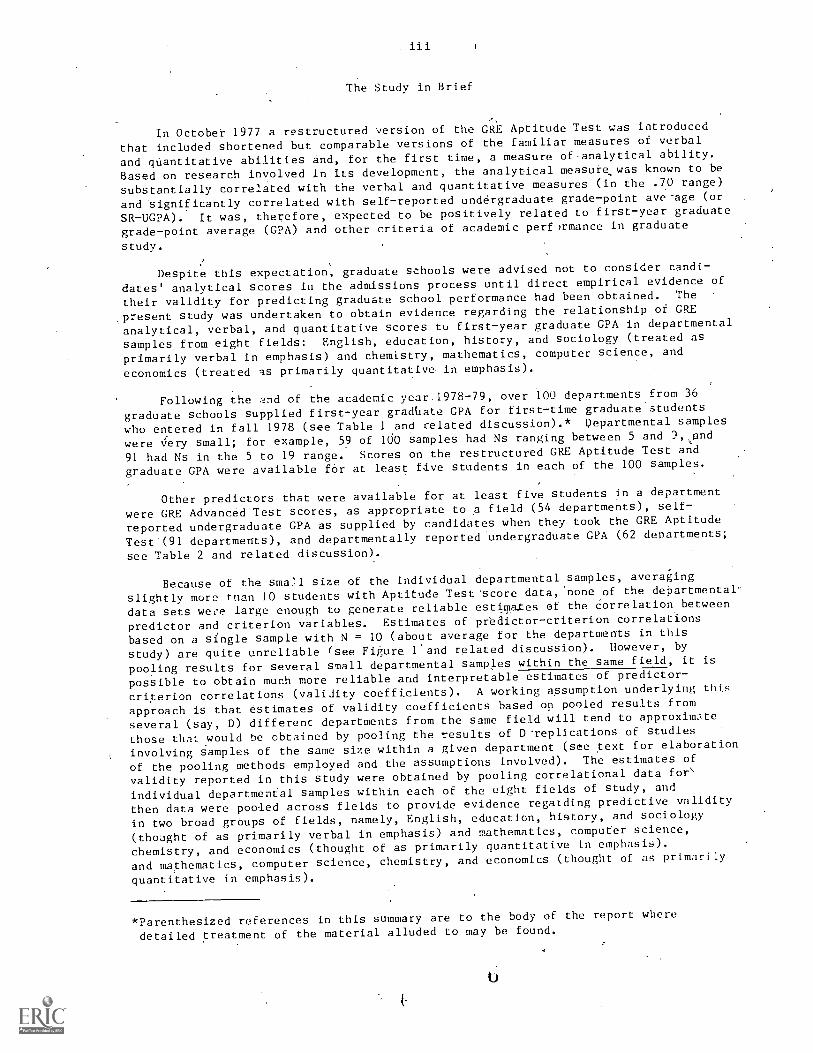
In October 1977 a restructured version of the GRE Aptitude Test was introduced
that included shortened but comparable versions of the familiar measures of verbal
and quantitative abilities and, for the first time, a measure of,analytical ability.
Based on research involved in its development, the analytical measure.was known to be
substantially correlated with the verbal and quantitative measures (in the .70 range)
and 'significantly correlated with self-reported undergraduate grade-point average (or
SR-UGPA). It was, therefore, expected to be positively related to first-year graduate
grade-point average (GPA) and other criteria of academic performance in graduate
study.
Despite this expectation, graduate schools were advised not to consider candi-
dates' analytical scores in the admissions process until direct empirical evidence of
their validity for predicting graduate school performance had been obtained. The
present study was undertaken to obtain evidence regarding the relationship of GRE
analytical, verbal, and quantitative scores to first-year graduate GPA in departmental
samples from eight fields: English, education, history, and sociology (treated as
primarily verbal in emphasis) and chemistry, mathematics, computer science, and
economics (treated as primarily quantitative in emphasis).
Following the and of the academic year. 1978-79, over 100 departments from 36
graduate schools supplied first-year gradbate GPA for first-time graduate students
who entered in fall 1978 (see Table 1 and celated discussion).* Departmental samples
were very small; for example, 59 of 100 samples had Ns ranging between 5 and 3,,and
91 had Ns in the 5 to 19 range. Scores on the restructured GRE Aptitude Test and
graduate GPA were available fOr at least five students in each of the 100 samples.
Other predictors that were available for at least five students in a department
were GRE Advanced Test scores, as appropriate to a field (54 departments), self-
reported undergraduate GPA as 'supplied by candidates when they took the GRE Aptitude
Test (91 departments), and departmentally reported undergraduate GPA (62 departments;
see Table 2 and related discussion).
Because of the sma.71 size of the individual departmental samples, averaging
slightly more rnan 10 students with Aptitude Test'score data,'none of the departmental-
data sets wee large enough to generate reliable estimates of the correlation between
predictor and criterion variables. Estimates of predictor-criterion correlations
based on a single sample with N = 10 (about average for the departments in this
study) are quite unreliable (see Figure rand related discussion). However, by
pooling results for several small departmental samples within the same field, it is
possible to obtain much more reliable and interpretable estimates of predictor-
criterion correlations ( validity coeffixients). A working assumption underlying this
approach is that estimates of validity coefficients based on pooled results from
several (say, D) different departments from the same field will tend to approximate
those that would be obtained by pooling the results of D.replications of studies
involving samples of the same size within a given department (see text for elaboration
of the pooling methods employed and the assumptions involved). The estimates of
validity reported in this study were obtained by pooling correlational data for'
individual departmental samples within each of the eight fields of study, and
then data were pooled across fields to provide evidence regarding predictive validity
in two broad groups of fields, namely, English, education, history, and sociology
(thought of as primarily verbal in emphasis) and mathematics, computer science,
chemistry, and economics (thought of as primarily quantitative in emphasis).
and mathematics, computer science, chemistry, and economics (thought of as primarily
quantitative in emphasis).
*Parenthesized references in this summary are to the body of the report where
detailed treatment of the material alluded to may be found.
iv
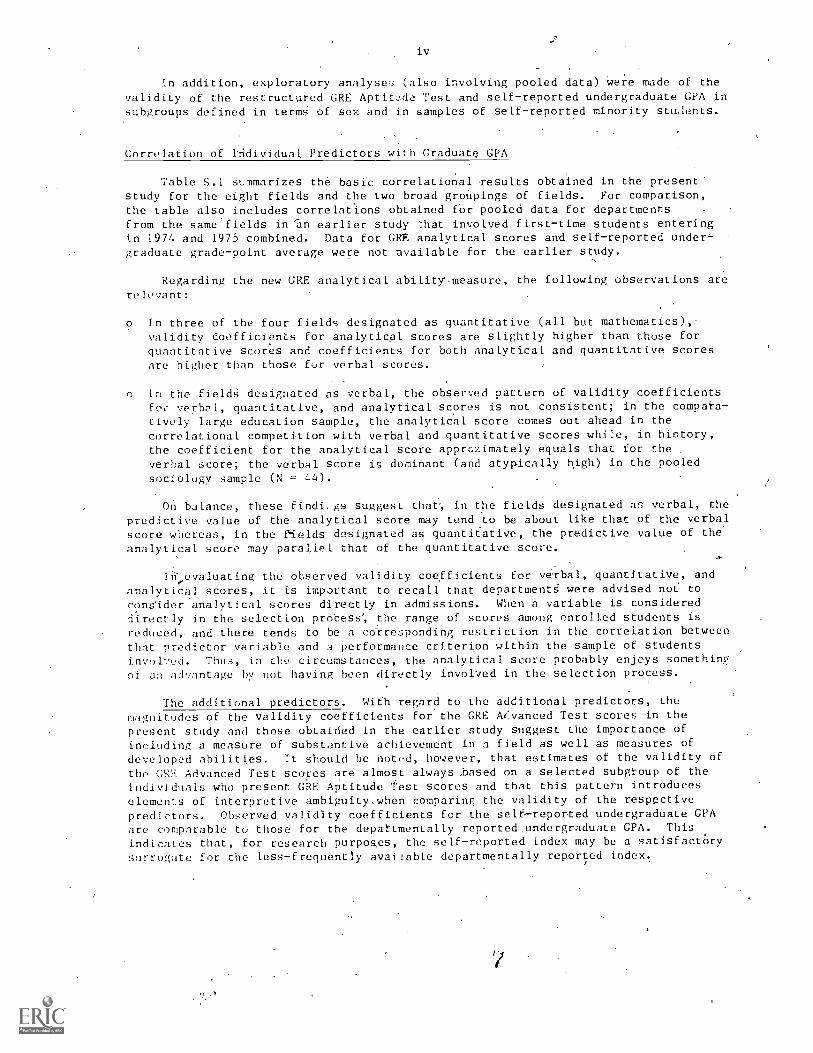
In addition, exploratory analyser; (also involving pooled data) were made of thevalidity of the restructured GRE AptitAa Test and self-reported undergraduate GPA insubgroups defined in terms of sex and in samples of self-reported minority stutlents.
Correlation of Individual Predictors with Graduate GPA
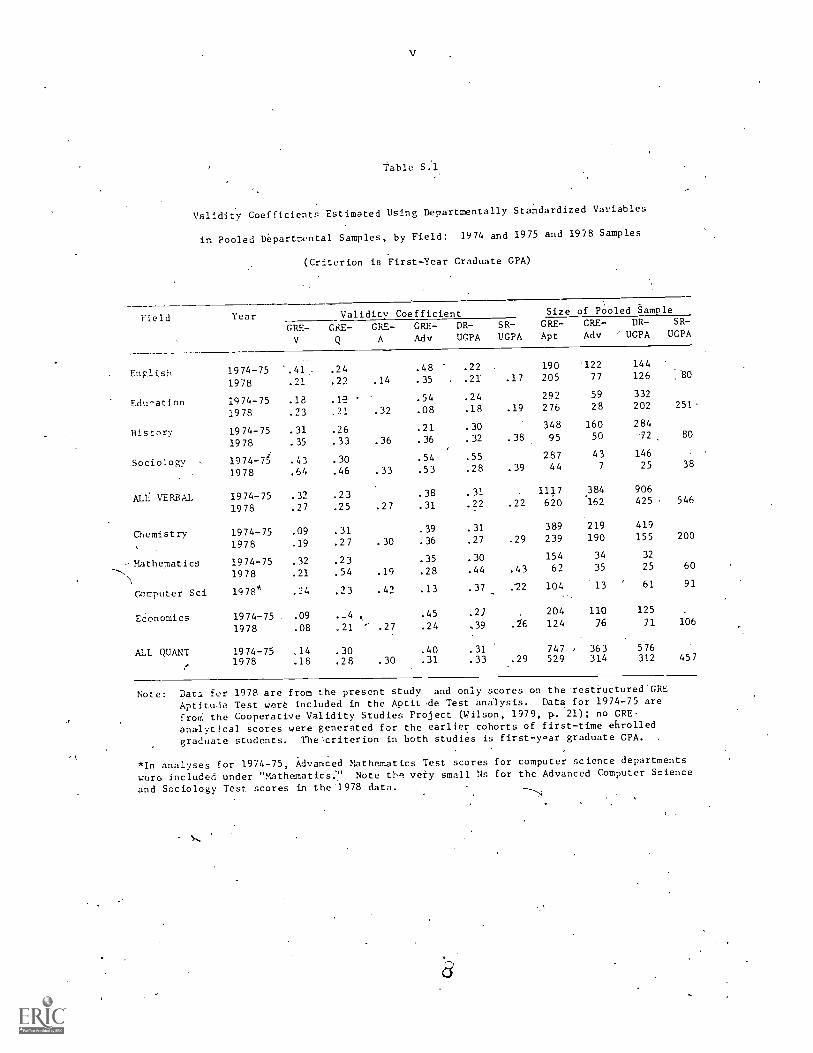
. Table S.1 sLTImarizes the basic correlational results obtained in the present'study for the eight fields and the two broad groUpings of fields. For comparison,the table also includes correlations obtained for pooled data for departmentsfrom the same fields in "an earlier study That involved first-time students enteringin 1974 and 1975 combined. Data for GRE, analytical scores and self-reported under-graduate grade-point average were not available for the earlier 'study.
Regarding the new GRE analytical ability measure, the following observations arerelevant:
o In three of the four fields designated as quantitative (all but mathematics),validity 0.oefficients for analytical scores are slightly higher than those forquantitative scores and coefficients for both analytical and quantitative scoresare higher than those for verbal scores.
o In the fieldg designated as verbal, the observed pattern of validity coefficientsfoe verbal, quantitative, and analytical scores is not consistent; in the compara-tively large education sample, the analytical score comes out ahead in thecorrelational competition with verbal and quantitative scores while, in history,the coefficient for the analytical score apprcximately equals that for theverbal score; the verbal score is dominant (and atypically high) in the pooledsociology sample (N = 44).
On balance, these findi,gs suggest that', in the fields designated as verbal, thepredictive value of the analytical score may tend to be about like that of the verbalscore whereas, in the fields designated as quantitative, the predictive value of theanalytical score may parallel that of the quantitative score.
Iii-,evaluating the observed validity coefficients for verbal, quantitative, andanalytical scores, it is important to recall that departmentg were advised not toconsider analytical scores directly in admissions. When a variable is considereddirectly in the selection protess% the range of scores among enrolled students isreduced,. and there tends to be a corresponding restriction fn the correlation betweenthat predictor variable and a performance criterion within the sample of studentsinvolved. Thus, in the circumstances, the analytical score probably enjoys somethingof an advantage by not having been directly involved in the selection process.
The additional predictors. With regard to the additional predictors, themagnitudes of the validity coefficients for the GRE Advanced Test scores in thepresent study and those obtained in the earlier study suggest the importance ofincluding a measure of substantive achievement in a field as well as measures of
developed abilities. It should he noted, however, that estimates of the validity ofthe GRP. Advanced Test scores are almost always based on a selected subgroup of theindividuals who present GRE. Aptitude Test scores and that this pattern introduceselements of interpretive ambiguity,when comparing the validity of the respective
predictors. Observed validity coefficients for the self--reported undergradUate GPAare comparable to those for the departmentally reported. undergraduate GPA. Thisindicates that, for research purpoges, the self-reported index may be a satisfactorysurrogate for the less-frequently available departmentally reported index.
V
table S:1
Validity Coefficients Estimated Using Departmentally Standardized Variables
in Pooled Departmental Samples, by Field: 1974 and 1975 and 1978 Samples
(Criterion is First-Year Graduate GPA)
Field Year Validity Coefficient Size of Pooled Sample
CRE- CRE- GRE- GRE- DR- SR- GRE- GRE- DR- SR-
V Q A Adv UGPA UGPA Apt Adv ' UGPA UGPA
English 1974-75 .41 .24 .48 .22 190 '122 144
1978 .21 .22 .14 .35 .21 .17 205 77 126 .80
Education 1974-75 .18 .54 .24 292 59 332
1978 .23 .21 .32 .08 .18 .19 276 28 202 251
History 1974-75 .31 .26 .21 .30 348 160 284
1978 .35 .33 .36 .36 .32 .38 95 50 72 80
Sociology 1974-7 .43 .30 .54 .55 287 43 146
1978 .64 .46 .33 .53 :28 .39 44 7 25 38
ALL VERBAL. 1974-75 .32 .23 .38 .31 , 1117 384 906
1978 .27 .25 .27 .31 .22 .22 620 162 425 - 546
Chemistry 1974-75 .09 .31 .39 .31 389 219 419
1978 .19 .27 .30 .36 .27 .29 239 190 155 200
-Mathematics 1974-75 .32 .23 .35 .30 154 34 32
'----,
11978 .21 .54 .19 .28 .44 .43 62 35 25 60
Computer Sci 1978* .24 .23 .42 .13 .37 .22 104 '13 61 91
Economics 1974-75 .09 .-4 .45 .27 204 110 125
1978 .08 .21 .27 .24 ,39 .26 124 76 71 106
ALL QUANT 1974-75 ,14 .30 .40 .31 747 , 363 576
1978 .18 .28 .30 .31 .33 .29 529 314 312 457
Note: Dac.:, for 1978 are from the present study and only scores on the 'restructured'GRE
Aptitude Test were included in the Aptit Ae Test analysis. Data for 1974-75 are
from the Cooperative Validity Studies Project (Wilson, 1979, p. 21); no GRE.
analytical scores were generated for the earlier cohorts of first-time ehrolled
graduate students. The criterion in both studies is first -year graduate GPA.
*In analyses for 1974-75, Advanced Mathematics Test scores for computer science departments
wur6 included under "Mathematics." Note th' very small Ns for the Advanced Computer Science
and Sociology Test scores in the 1978 data.
vi
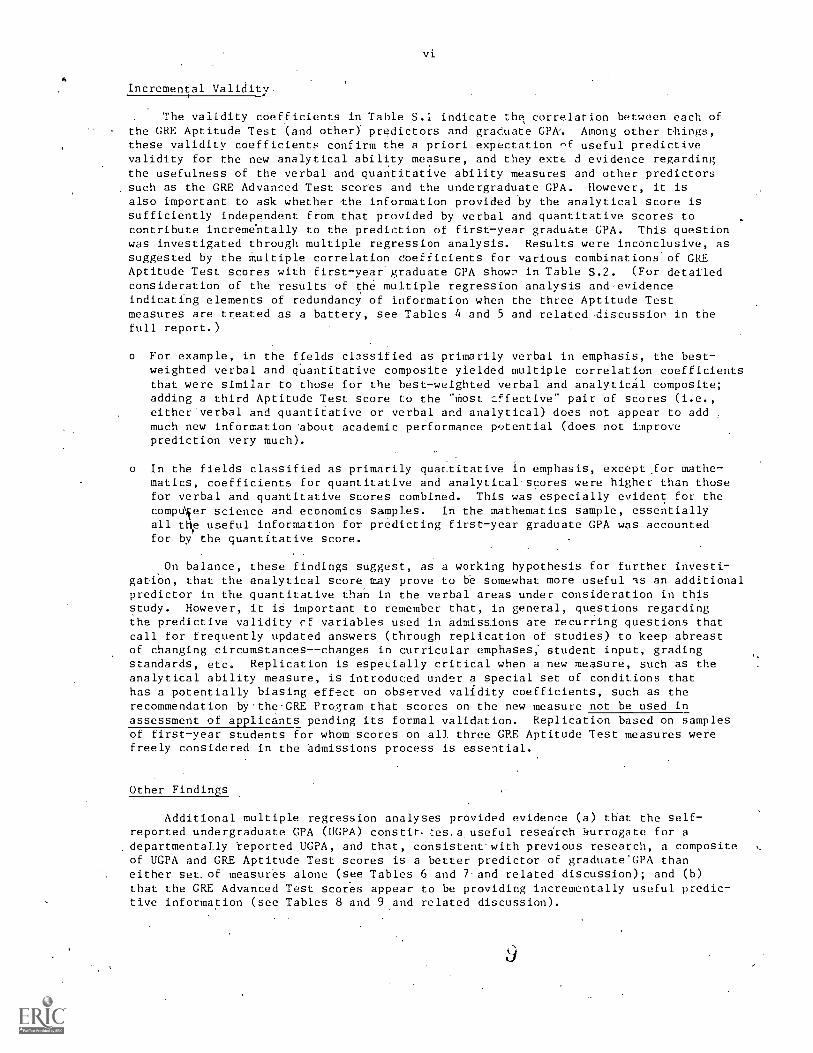
Incremental Validity
The validity coefficients in Table S.1 indicate the correlation between each ofthe GRE Aptitude Test (and other). predictors and graduate CPA. Among other things,these validity coefficients confirm the a priori expectation rsf useful predictivevalidity for the new analytical ability measure, and they extc d evidence regardingthe usefulness of the verbal and quantitative ability measures and other predictorssuch as the GRE Advanced Test scores and the undergraduate GPA. However, it isalso important to ask whether the information provided by the analytical score issufficiently independent from that provided by verbal and quantitative scores tocontribute incrementally to the prediction of first-year graduate GPA. This questionwas investigated through multiple regression analysis. Results were inconclusive, assuggested by the multiple correlation coefficients for various combinations'of GREAptitude Test scores with first -year graduate GPA show, in Table S.2. (For detailedconsideration of the results of the multiple regression analysis and - evidenceindicating elements of redundancy of information when the three Aptitude Testmeasures are treated as a battery, see Tables 4 and 5 and related -discussion in thefull report.)
o For example, in the fields classified as primarily verbal in emphasis, the best-weighted verbal and quantitative composite yielded multiple correlation coefficientsthat were similar to those for the best-weighted verbal and analytical composite;adding a third Aptitude Test score to the "Most zffective" pair of scores (i.e.,either'verbal and quantitative or verbal and analytical) does not appear to addmuch new information .about academic performance potential (does not improveprediction very much).
o In the fields classified as primarily quartitative in emphasis, except _for mathe-matics, coefficients for quantitative and analytical scores were higher than thosefor verbal and quantitative scores combined. This was especially evident for thecompAer science and economics samples. In the mathematics sample, essentiallyall the useful information for predicting first-year graduate GPA was accountedfor by the quantitative score.
,On balance, these findings suggest, as a working hypothesis for further investi-gatd.on, that the analytical score may prove to be somewhat more useful as an additionalpredictor in the quantitative than in the verbal areas under consideration in thisstudy. However, it is important to remember that, in general, questions regardingthe predictive validity rf variables used in admissions are recurring questions thatcall for frequently updated answers (through replication of studies) to keep abreastof changing circumstances--changes in curricular emphases; student input, gradingstandards, etc. Replication is especially critical when a new measure, such as theanalytical ability measure, is introduced under a special set of conditions thathas a potentially biasing effect on observed validity coefficients, such as therecommendation bythe-GRE Program that scores on the new measure not be used inassessment of applicants pending its formal validation. Replication based on samplesof first-year students for whom scores on all three GRE Aptitude Test measures werefreely considered in the admissions process is essential.
Other Findings
Additional multiple regression analyses provided evidence (a) that the self-reported undergraduate GPA (UGPA) constir. :-.es,a useful research Lirrogate for adepartmentally reported UGPA, and that, consistent' with previous research, a compositeof UGPA and GRE Aptitude Test scores is a better predictor of graduate'GPA thaneither set. of measures alone (see Tables 6 and 7and related discussion); and (b)that the GRE Advanced Test scores appear to be providing incrementally useful predic-tive information (see Tables 8 and 9 and related discussion).
vii
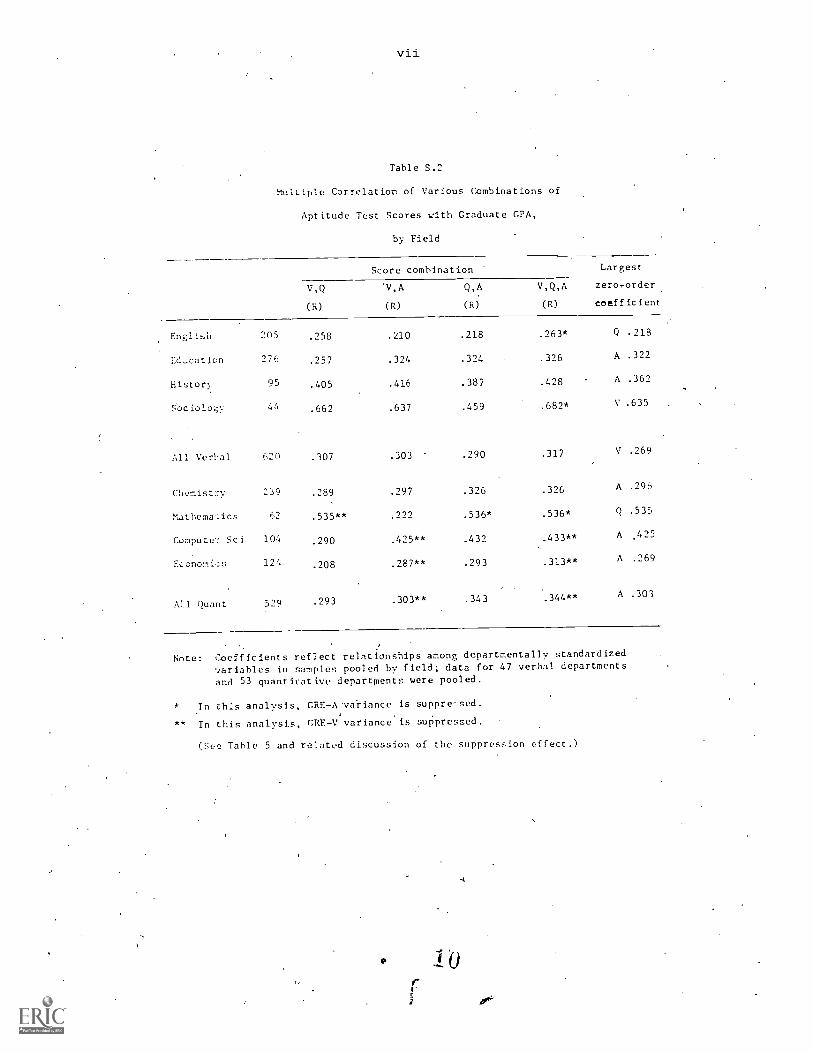
Table S.2
Correlation of Various Combinations of
Aptitude Test Scores with Graduate CPA,
by Field
Score combination Largest
zero order
coefficient
V,Q
(R)
'V,A
(R)
Q,A
(R)
V,Q,A
(R)
Englibli 205 .258 .210 .218 .263* Q .218
Ed-cation 276 .257 .324 .324 .326 A .322
History 95 .405 .416 .387 .428 A .362
SOciolo;;y ' .662 .637 .459 .682* V .635
All Verbal 62n .307 .303 .290 .317 V .269
Chemisty 239 .289 .297 .326 . .326 A .296
Mathemaics 62 .535** .222 .536* .536* Q .535
Computer Sci 104 .290 .425** .432 .433** A .425
Economics 124 .208 .287** .293 .313** A .269
All Quant 529 .293 .303** .343 .344** A .303
Note: Coefficients reflect relationships among departmentally standardized
variables in samples pooled by field; data for 47 verbal departments
and 53 quantitative departpents were pooled.
*
* *
In th:s analysis, GRE-A:vaiiance is suppre-sed.
In this analysis, GRE-V variance is suppressed.
(See Table 5 and related discussion of the suppression effect.)
1
Exploratory analyses of the predictive validity of the Aptitude Test measures insamples of minority students, and in samples grouped by sex, provided evidencesuggesting that the predictive validity of the restructured GRE Aptitude Test is asgreat for minority as for nonminority students and is comparable for men and women(see Tables 10, 11, l2, 13, and 14 and related discussion).
Methodological Considerations
The subgroup analyses, as well as the basic,analyses involving samples undifferentiated'with respect' to subgroup membership, were based on pooled samples acrossdepartments within field's. From a methodological point of view, the use of poolingprocedures made'it possible to generate estimates of validity by employing datafrom a relatively large number of departmental samples, no one of- which was largeenough to generate meaningful estimates of validitY,coefficients when consideredindependently. As indicated earlier, the coefficients analyzed in this study wereestimated from intercorrelation matrices reflecting'the relationships among pooled,departmentally standardized predictor and criterion variables for several verysmall departmental samples: within the respective academic disciplines or fields.
For the individual departments involved in the study, these estimates arepresumed to provide general guidance with respect to the validity of GRE AptitudeTest scores for predicting firstyear graduate GPA. However, it is importantto reiterate certain assumptions upon which the presumed translatability of thepooled findings into departmental use contexts rests, namely:
a) that the variability in observed coefficients from several small departmental samples within a given discipline reflects primarily sampling fluctuationaround common population values, an assumption for which some supportiveevidence has been provided elsewhere (Wilson, 1979); and
b) that estimates of relationships based on pooled data from a number ofsmall departmental samples within a given field provide reasonable (useful,practically significant) approximations to estimates that, theoretically,might be generated by pooling results of a similar number of replicationsinvolving successive samples of the same size within the respective departments(see Table 2, Figures 1, 2;' and 3, and related discussion).
FUithet research bearing on these assumptions s needed. However, they have provideda useful operational rationale for generating information regarding the correlationalvalidity of.GRE scores by employing data from very small samples, none of which'individually could support an interpretable validity study. It is important to keepin mind that the findings reported in the study are based on data for a particularset of departmental samples. The departments participating in the study are notnecessarily representacive.of the population of departments within the respectivefields. Accordingly, eVep'granted the tenability of the pooling assumptions, theestimates of validity involved are not necessarily generalizable to other departments.The joint participation' in GRE validity studies of a representative sample k(or ofsamples representative of groups of departments classified according to a priorirules regarding similarity) would provide data that would be useful for the purposeof testing the validity of pooling assumptions, per se, and findings that are generalizable to clearly defined populations.
CONTENTS
Acknowledgment
The Study in Brief
Pape
iii
Section I. background of the Study1
Objectives of the Study1
Section Ii. Sample and Basic Data3
Additional Predictors5
Section 111. Analytical Methods7
Pooling Rationale.7
Assumptions and Limitations11
Procedures .
12
Subgroup Analyses13
Section IV. basic Study Findings,15
Estimates cf Validity for the Predictors 15
Predictive Validity of the Restructured Aptitude TesZ:
A Multivariate Assessment17
The Suppression Phenomenon21
SelfReported UGPA and Its Contribution to Prediction 22
'GRE Advanced Test Validity: Limited Perspective 24
Section V. Analyses for Subgroups31
Correlational Results:33
Minor- ity /Nonminority33
Women/Men35
Incremental Validity in Broad GroUpings by Field 35
Performance Relative to Expectation Based on GREScores:
An Exploratory Analysis
Section VI. Concluding Observations6 . 41
References43
Appendix A. Study Materials45
Appendix B. Preliminary Report to Participating Graduate
SChools53
12
Section Background of the Study
Following several years of research and development activity, supported by the
Graduate Record Examinations (GRE) Board, the restructured. GRE Aptitude Test was
introduced in October 1977. As described in detail by Miller and Wild (1979), the
restructuring process involved the development of shortened but comparable versions
of the familiar measures of verbal and quantitative abilities and the introduction of
a measure of analytical ability.
IteMs making up the analytical ability section that was introduced in 1977 are
described as measuring such components of analytical ability as drawing conclusions
from a complex series of statements, using a sequential procedure to eliminate
incorrect choices in order to reach a conclusion, making inferences from statements
expressing relationships among abstract entities (such as nonverbal or nonquantita-
tive symbols), etc. Successful performance on the analytical ability measure'is
thought to be independent of formal training in logic or methods of analysis (ETS,
1977). The aim of the GRE Board in encouraging and supporting the introduction of
a third ability measure was to broaden the widely used GRE Aptitude Test and enable
students to demonstrate a wider array of academic talent than that tapped by the
traditional verbal and quantitative ability measures.
According to the 1977-78 Guide to the Use of the Graduate Record Examinations
the analytical score correlates about .70 with. both verbal and quantitative scores.
This .is somewhat higher than the correlation between verbal and quantitative scores
(in the .50 to .60 range,' depending upon population), but lower than would be expected
(e.g.,..90 +) for two tests measuring the same underlying abilities. Hence it was
believed that the new measure should supplement the traditional verbal and quantita-
tive measures.
On the strength of its relationship with verbal and quantitative scores, which
have known utility for predicting performance in graduate.study (Willingham, 1974;
Wilson, 1979), the analytical score was expected to have utility for predicting
typical criteria of performance in graduate study. The expectation of utility for
prediction in the analytical score, per se, was further buttressed by evidence
of its relationship to self-reported undergraduate grade-point average (UGPA). As
reported by Miller and Wild (1979), evidence gathered during the development of the
analytical measure indiCated that correlations between analytical scores and
candidates' self-reported UGPA paralleled those for verbal and
quantitative scores.
Despite the presumption of utility inherent in the foregoing lines of reasoning
and evidence,.when therestructured,GRE test was introduced gradilate schools were
advised not to consider the analytical scores in appraising the academic qualifica-
tions of applicants for admission pending the establishment of empirical evidence
regarding the relationship between the score and performance in graduate study.
Objectives of the Study
The study reported herein, conducted with the encouragement and support of the
GRE Board, was initiated early in 1979 for the purpose of obtaining empirical evidence
regarding the predictive validity of the restructured GRE Aptitude Test. Questions
regarding the contribution of the analytical measure were of special concern, of
course, but it was also considered important to obtain evidence of the correlational
validity of scores on the restructured verbal and quantitative sections.
Though the need for empirical evidence of predictive validity for the analytical
score, per se, was basic to the study, other questions about the role of this measure
were also of interest. For example:
-2
o Does the analytical score,' which correlates in the .70 range with verbal andquantitative scores, tap an ability component that is sufficiently independent ofverbal and quantitative ability to improve the overall validity anti utility of theGIE Aptitude Test?
o Does the information provided by the analytical score supplement that provided bythe verbal score and/or the quantitative score? For example, will an AptitudeTest composite that includes an analytical ability score prove to be mere usefulfor prediction of typical graduate school-performance criteria than a compositethat includes only verbal and quantitative ability scores?
o If so, does the supplementary contribution of the analytial score appear to begeneral (leading, for example, to incremental validity without regard to field) orfield specific (contributing added predictive information only in certain fields)?
In January 1979graduate schools receiving a large number of GRE score reportswere invited to participate in a study designed to provide evidence bearing on thesegeneral questions. The results reported herein are based on analyses of data for100 small departmental samples (36 graduate schools) from the fields of English,education, history, economics, chemistry, mathematics, computer science, and economics.Following the analytical rationale and assumptions described herein, assessments ofvalidity are based on samples of departmental data pooled by field.
The results provide preliminary evidence of the validity of the restructured GREAptitude Test (and selected other predictors) for predicting firstyear graduategradepoint average in samples of firsttime graduate students entering in Jail 1978,in subgroups defined in terms of sex, and in samples of selfidentifiea mini itystudents. The results reported augment a growing body of research evidence regardingthe validity of GRE t-ests and measures of undergraduate achievement (such as undergraduate GPA) for forecasting first year performance in graduate school settings.
Section II: Sample and Basic Data
In the absence of a firm rationale for identifying fields or disciplines for
which the type of ability represented by the analytical score might be especially
relevant or irrelevant, choice of fields for the validity study was based on a desire
to obtain a representative array with respect to traditional verbal versus quantita-
tive emphases. Accordingly, a decision was made to focus the analysis primarily on
the following fields: English, education, history, and sociology (thought of
as primarily verbal),.and chemistry, mathematics, computer science, and economics
(thought of as primarily'quantitative).
Based on experience gained during the Cooperative Validity Studies Project
(Wilson, 1979), it was considered important to have departmental samples that were
homogeneous with respeCt to educational status at point of entry. It was decided,
accordingly, that data would be sought only for students who entered a department as
first-time graduate students.
Because of the urgent need for empirical evidence bearing on the predictive
validity of the analytical score in graduate-school settings, it was decided to base
the study on data for only one entering cohort of first-time enrolled students,
namely, that entering in fall 1978, rather than delay data collection until criterion
data for two cohorts could be obtained. It was recognized that this decision would
result in a rather severe restriction of the size of samples available for individual
departments. Accordingly, 10 first -time graduate students with necessary data (i.e.,
scores on,the restructured Aptitude Test and a first-.year graduate CPA) was tenta-
tively set as the minimum N expected for participation.
In January 1979 a letter of invitation to participate in the.study was sent over
the signature of the GRE Board chairman to graduate deans representing about 100
schools receiving the largest rumber of GRE score reports annually. An overview of
the definitions, procedures,and proposed activities of the study was enclosed along
with a Participation Reply Form.*
A total of .50 graduate schools expressed an interest in the study and some 250
departments were designated as prospective participants. They were distributed
rather evenly over the eight basic fields. Following initiation of data-collection
procedures, it became apparent that most of the designated departments could not meet
the suggested minimum sample size of 10 oases (with scores on the restructured GRE
Aptitude Test and a graduate GPA); in many departments fewer than five cases with
these data were available.Accordingly, a decision was made to include in the basic
analysis all departments with at least five first-time enrolled full-time students
who had scores on the restructured GRE Aptitude Test and a first-year graduate
GPA.**
After all screening criteria had been applied, 100 departmental samples from the
eight basic study fields were identified. These departments were from the 36 graduate
schools listed in Table 1.
*Copies of the invitational letter and selected accompanying materials are provided
in Appendix A. ,Two different data-collection procedures were employed, primarily to
provide a basis for assessing the relative utility of alternative approaches to
facilitating the validity process by employing the GRE history file to generate GRE
scores and other relevant data on candidates rather than relying on participants to
provide all needed study data.
`**Because of the potentially confounding effect of including foreign students who
were not natively fluent in English, a decision was made to exclude. such students.
This additional constraint eliminated several departments.
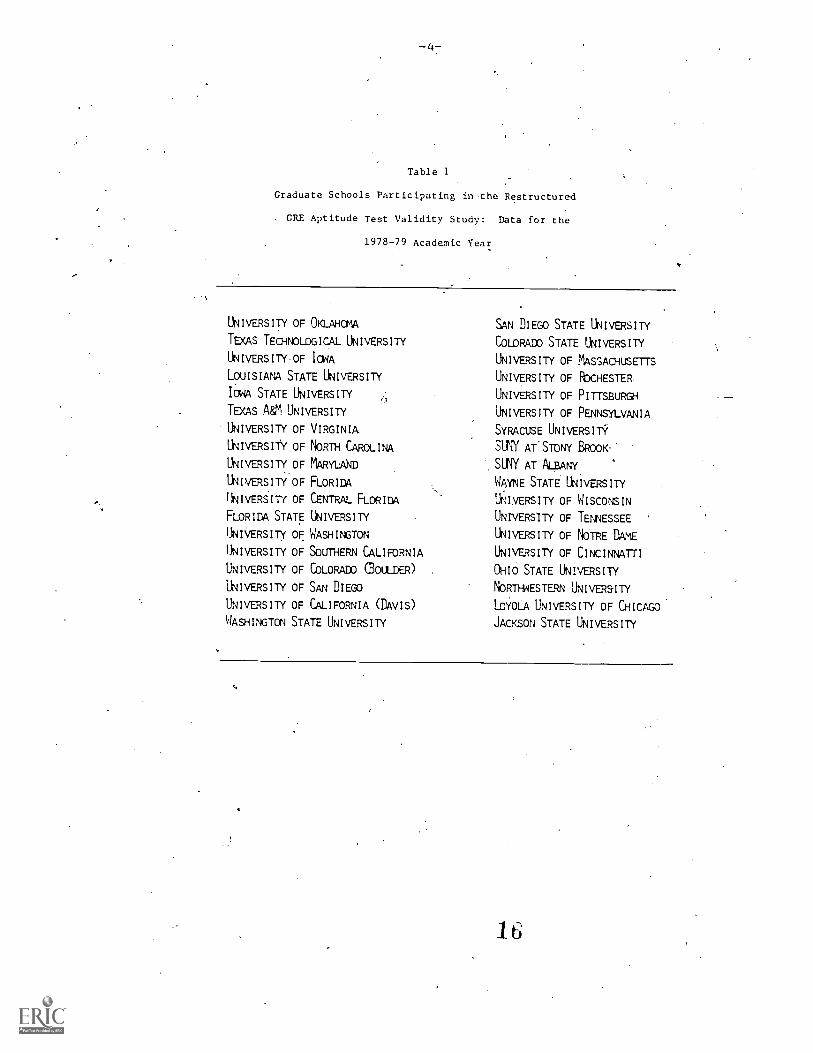
Table 1
Graduate Schools Participating in the Restructured
. GRE Aptitude Test Validity Study: Data for the
1978-79 Academic Year
UNIVERSITY OF OKLAHOMA
TEXAS TECHNOLOGICAL UNIVERSITY
UNIVERSITY.OF IOWA
LOUISIANA STATE UNIVERSITY
IOWA STATE UNIVERSITY
TEXAS AV UNIVERSITY
UNIVERSITY OF VIRGINIA
UNIVERSITY OF NORTH CAROLINA
UNIVERSITY OF MARYLAND
UNIVERSITY OF FLORIDA
UNIVERSITY OF CENTRAL FLORIDA
FLORIDA STATE UNIVERSITY
UNIVERSITY OF WASHINGTON
UNIVERSITY OF SOUTHERN CALIFORNIA
UNIVERSITY OF COLORADO BOULDER)
UNIVERSITY OF SAN DIEGO
UNIVERSITY OF CALIFORNIA (DAVIS)
WASHINGTON STATE UNIVERSITY
SAN DIEGO STATE UNIVERSITY
COLORADO STATE UNIVERSITY
UNIVERSITY OF MASSACHUSEIIS
UNIVERSITY OF ROCHESTER
UNIVERSITY OF PITTSBURGH
UNIVERSITY OF PENNSYLVANIA
SYRACUSE UNIVERSITY
SWY AT STONY BROOK-'
SUNY AT ALBANY,
WAYNE STATE UNIVERSITY
UNIVERSITY OF WISCONSIN
UNIVERSITY OF TENNESSEE
UNIVERSITY OF NOTRE DAME
UNIVERSITY OF CINCINNATTI
OHIO STATE UNIVERSITY
NORTHWESTERN UNIVERSITY
LOYOLA UNIVERSITY OF CHICAGO
JACKSON STATE UNIVERSITY
Additional Predictors
In addition to scores on the restructured Aptitude Test and first-year graduate
GPA, other relevant predictor variables were selected for analysis, as follows:
1)' departmentally reported undergraduate GPA (DR-UGPA) if supplied by a partici-
pating department;
2) self-reported undergraduate GPA (SR-UGPA) in the undergraduate major field,
if repOrted by a candidate when registering for the GRE Aptitude Test; and
3) GRE Advanced Test score as appropriate to field (from the GRE history file if
available for a candidate).
The minimum-of-five-cases rule, applied for GRE Aptitude Test scores and graduate
GPA,, was also applied in the decision to include each of these additional predictors ,
as part of a particular departmental data set. Table 2 shows the number of departmental
samples from the eight basic study fields. having data for at least five students who
earned a first-year graduate GPA and who had (a) scores on, the restructured GRE
Aptitude Test, (b) a self-reported UGPA in 'the major field, (c) a departmentally
reported UGPA, and (d) a GRE Advanced Test score appropriate to the field. Also
shown is the mean size of the departmental samples.
It may be seen that scores on the GRE Aptitude Test and graduate GPA were
available for a total of 100 samples, 47 from departments in the fields characterized
as primarily verbal and 53 from fields characterized as primarily quantitative. The
self-reported UGPA (major field), or SR-UGPA, was available for five or more students
in 91 of the 100 samples, but a departmentally reported UGPA (DR-UGPA) was available
in only 62 samples; only 54 samples had at least five students with an appropriate
GRE Advanced Test score.
On the average, departmental samples, in analyses involving only the restructured
GRE Aptitude Test included about 13 cases in the primarily verbal fields and 10 cases
--in the primarily quantitative fields. Variation in mean departmental sample size by
field clearly-was not great--the mean for education was elevated by the inclusion of
one or two relatively large departmental samples. Data not reported in the table
indicate that 59 of the 100 samples involved in the basic GRE Aptitude Test analysis
had Ns in the 5 - 9 range, and 91 out of 100 had fewer than 20 cases.
1 '7
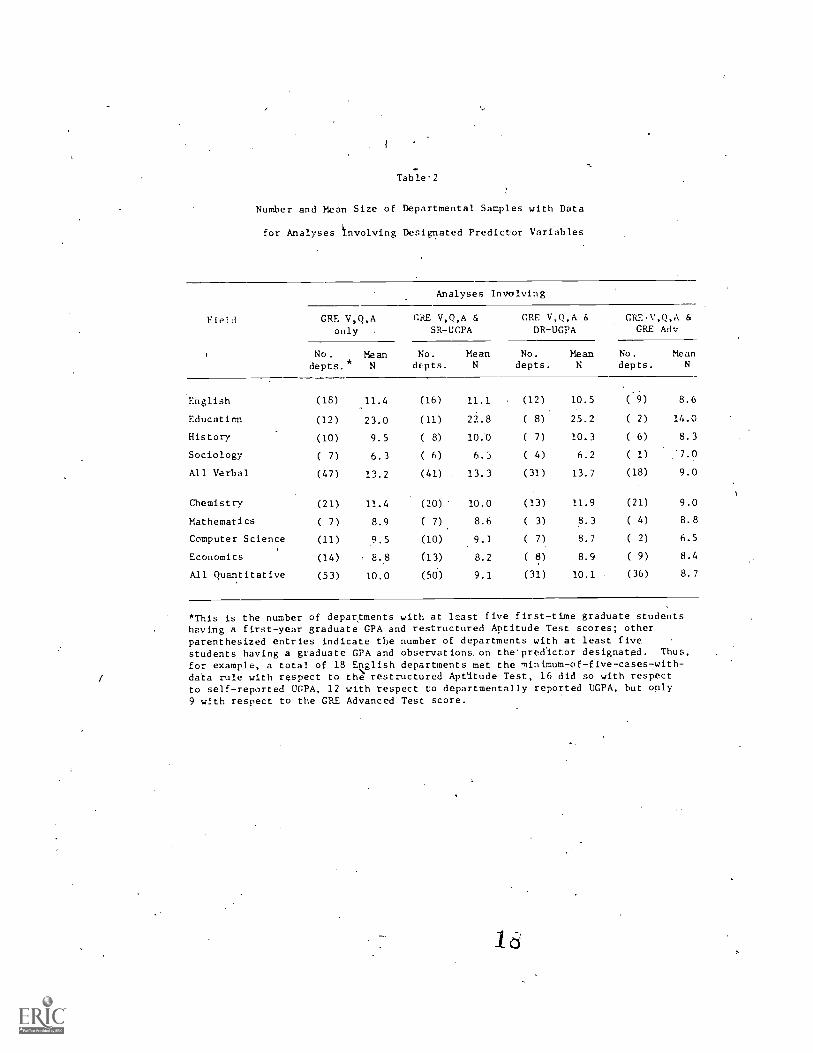
Table2
Number and Mean Size of Departmental Samples with Data
for Analyses nvoiving Designated Predictor Variables
Field
Analyses Involving
GRE V,Q,A CRE V,Q,A & CRE V,Q,A & CRE,V,Q,A &
only , SR -UCPA DR-UGPA GRE Adv
No.depts.*
MeanN
No.
depts.MeanN
No.depts.
MeanN
No.
depts.Mean
English (18) 11.4 (16) 11.1 (12) 10.5 (9) 8.6
Education (12) 23.0 (11) 22.8 ( 8) 25.2 ( 2) 14.0
History (10) 9.5 ( 8) 10.0 ( 7) 10.3 ( 6) 8.3
Sociology ( 7) 6.3 ( 6) 6.3 ( 4) 6.2 ( 1) ..7.0
All Verbal (47) 13.2 (41) 13.3 (31) 13.7 (18) 9.0
Chemistry (21) 11.4 (20) 10.0 (13) 11.9 (21) 9.0
Mathematics ( 7) 8.9 ( 7) 8.6 ( 3) 8.3 ( 4) 8.8
Computer Science (11) 9.5 (10) 9.1 ( 7) 8.7 ( 2) 6.5
Economics (14) 8.8 (13) 8.2 ( 8) 8.9 ( 9) 8.4
All Quantitative (53) 10.0 (50) 9.1 (31) 10.1 (36) 8.7
*This is the number of departments with at least five first-time graduate studentshaving a first-year graduate GPA and restructured Aptitude Test scores; otherparenthesized entries indicate the number of departments with at least fivestudents having a graduate GPA and observations. on the'predictor designated. Thus,
for example, a total of 18 Eulish departments met the minimum-of-five-cases-with-data rule with respect to the restructured Aptitude Test, 16 did so with respectto self-reported UCPA, 12 with respect to departmentally reported UCPA, but only9 with respect to the GRE Advanced Test score.
Section III. Analytical Methods
Given the very small samples availableAkfor analysis, the results of analysTs.for
a given department cannot proyide estimates of relationships among the variables that
are sufficiently reliable Co permit inferences regarding the predictive valiaiO'of
the variables under consideration'in that departmental context. Generally illust
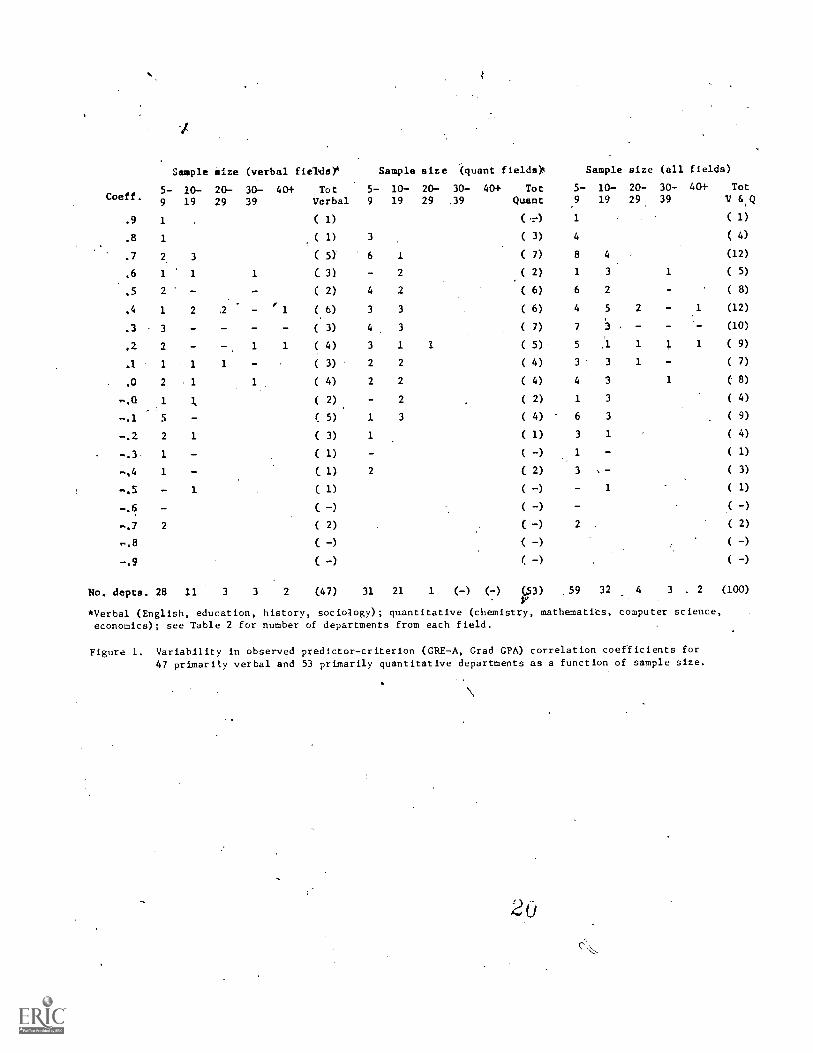
tive of this point is evidence, summarized in Figure 1, of the degree of observed
variability in distributions of zero-order correlation coeffitients reflecting
the relationship between the analytical ability score and graduate GPA as a function
of sample size the,100 departylental samples available for analysis. (Similar
patterns obtain, of course, in distributions of observed coefficients for the
verbal score,the quantitative score, and other predictors in these" samples.) To
proceed with an analysis designed to yield interpretable information regarding
within-department predictor-criterion relationships in these circumstances, data from
several departments must be pooled.
Pooling Rationale
Unfortunately from the point of view of assessing the predictive validity of
scores on a standardized admission test, the criterion variable under consideration,
namely, first-year graduate GPA, is context-specific in both metric and meaning.
Even when grade-point averages are computed in a comparable Way (e.g., on a scale
such that A = 4, B 3, C = 2, etc.) in several different departments, .comparisons
based on mean GPA do not permit inferences regarding average performance differentials
for students in the departments involved.
Useful perspective on this line of reasoning is provided in Figure 2, which
reflects the relationship between departmental GPA means and mean GRE Aptitude Test
scores for 76 of the departmental samples available for the present study--that is
those with GPA scales that assign 4 points to an A, 3 to a B, 2 to a C, etc. It is
apparent that mean GPA ddes not vary in-a systematic way with mean GRE Aptitude Test
scores across the departments. In the 35 verbal departments, for example:
o Grade-point averages /of 3.8 or higher are registered by departments differing by.
some 300 points with regard to mean GRE verbal score; the highest mean GPA is
associated with the lowest verbal mean score.
o Departments with similar GPA means differ widely in mean verbal scores; the lowest
mean GPA (less than 3.1) and one of the highest GPA means (over 3.8) are associated
with two English departments, both of which have mean verbal' scores in the 57b -600
range.
In the circumstances, lacking a context-free estimate of performance for. each
individual, the only useful comparisons for purposes of validation become those
involving relative standing within departmental samples--for example, z-scaled
transformations of the GPA criterion as well as the standard predictor variables.
'Given such transformations, data for several small departmental samples can be
pooled, and analyses can be'.based on the larger pooled Samples. These analyses will
yield more reliable estimates of within-group (within-department) relationships among
the variables under consideration.
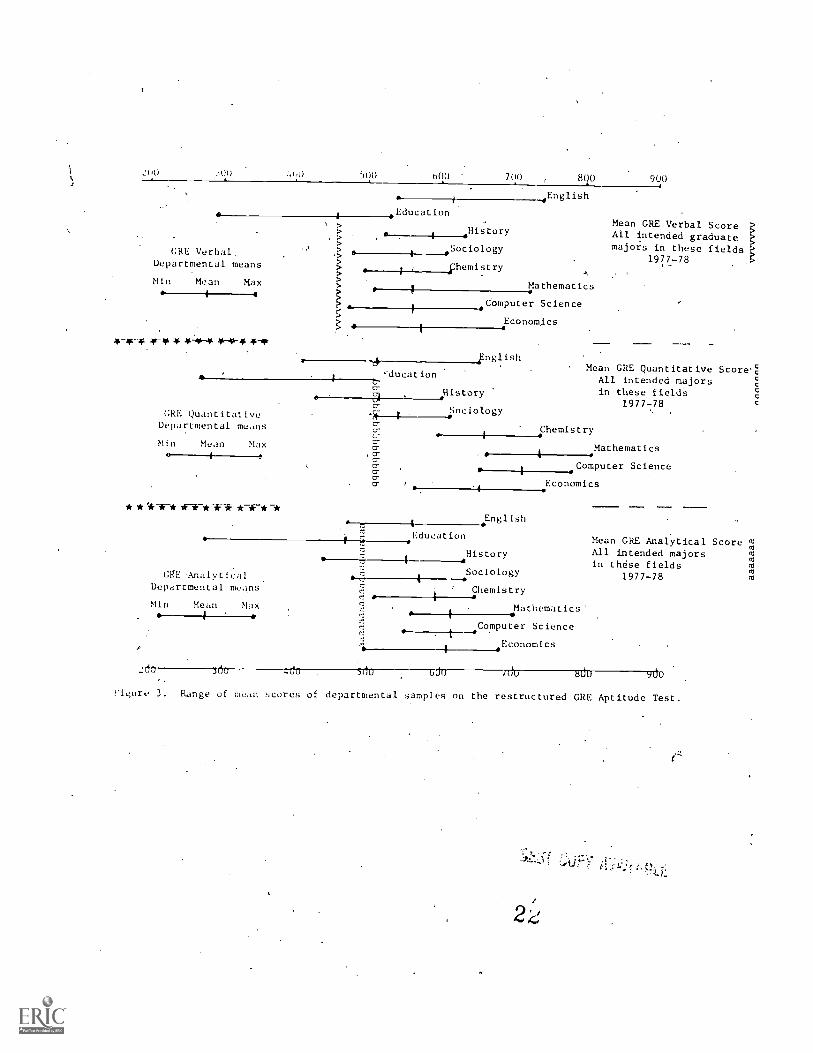
Given the marked variability in GRE Aptitude Test score means among the depart-
mental samples within each field (see Figure 3), and the well-established expectation
of positive covariation between GRE scores and performance within departments,
pooling procedures that require us to ignore marked among-department differences in
GRE Aptitude Test scores clearly may be expected to yield attenuated estimates of
validity for the predictors under consideration. However, the estimates involved
are assumed'to be realistic from the point of view of individual graduate departments.
1
Coeff.5-9
Sample size (verbal fielda)k
10- 20- 30- 40+ Tot
19 29 39 Verbal5-9
Sample size
10- 20-19 29
(quant field0
30- 40+ Tot.39 Quant
Sample size
5- 10- 20-9 19 29.
(all fields)
30- 40+ Tot
39 V f.()
.9 1 ( 1) ( -..-) 1 ( 1)
.8 1 ( 1) 3 ( 3) 4 ( 4)
.7 2 3 C 5) 6 1 ( 7) 8 4 (12)
.6 1 1 1 (_ 3) 2 ( 2) 1 3 1 ( 5)
.5 2 - ( 2) 4 2 ( 6) 6 2 ( 8)
.4 1 2 2 - 1 ( 6) 3 3 ( 6) 4 5 2 1 (12)
.3 3 - - ( 3) 4 3 ( 7) 7 3 . - - (10)
.2 2 1 1 ( 4) 3 1. 1 ( 5) 5 .1 1 1 1 ( 9)
.1 1 1 1 - ( 3) 2 2 ( 4) 3 3 1 - ( 7)
.0 2 1 1, ( 4) 2 2 ( 4) 4 3 1 ( 8)
....0 1 k ( 2) - 2 ( 2) 1 3 ( 4)
-.1 5 ( 5) 1 3 ( 4) 6 3 ( 9)
-.2 2 1 ( 3) 1 ( 1) 3 1 ( 4)
-.3 1 ( 1) ( -) l - ( 1)
-,4 1 ( 1) 2 ( 2) 3 . - ( 3)
-.5 - 1 ( 1) ( -) 1 ( 1)
-.6 C -) ( -) ( -)
-.7 2 ( '2) ( -) 2 .( 2)
...8 C -) { -) ( -)
-.9 C -) ( -) ( -)
No. depts. 28 11 3 3 2 (47) 31 21 1 (-) (-)(3)
.59 32 4 3 . 2 (100)
*Verbal (English, education, history, sociology); qUantitative (chemistry, mathematics, computer science,economics); see Table 2 for number of departments from each field.
Figure 1. Variability in observed predictor-criterion (GRE-A, Grad GPA) correlation coefficients for47 primarily verbal and 53 primarily quantitative departments as a function of sample size.
N

Ftrat -year
Grad CPA(mama)
"A" 3.9001- 4.0
3.8001-3.9
326- 351- 376- 401-
350 375 400 425426- 451-450 475
CIE Quantitative
476- 501- 526- 551-
500 525 550 575
(depart.ent mean)
576- 601- 626- 651- 676-
600 625 650 675 700701-725
726-750 Total
0
0
3.7001- 3.8
'Csacs
2
3.6001- 3.7C C
E .1
GC
3.5001- 3.6
3.4001- 3.5
'CS
ar
tC S
f S
E10
3.3001- 3.42 4
3.2001- 3.3ct E.4 is c 10
C Chemistry
3.1001- 3.2
CS Co-puter ScienceE Economic,'
.c
sc2
M Mathematic.
C"8" 3:0001- 3.1
Total 0 0 0 0 0 0 0 1 2 2 A 0 7 6 7 41
CIE Verbal (department I...)
First-ear 326- 351- 376- 401- 426- 451- 476- 501- 526- 551- 576- 601- 626- 651- 676- 701- 726 -
CPA 350 )75 400 425 450 475 500 525 550 515 6110 625 650 675 700 725 750 Tdtal
(mean)
"15".1.901- 4.0 Ed
3.801- 3.9Et4 i5° .r,
3.7C1- 3.A1. En En En .
3.601- 3.7 Ed 1.3 Ed En A En En En
. Ed
3.501- 3:6 Ed A *s Er: Eri 7
3.401- 3.5 'Edo, aH
3.301- 3.4Ed
3.201- 3.3En = English s S
S2
Ed = Education
3.101- 3.2H = HistoryS = Sociology
, t,
"8"=3 on- 3.1En
Total 0 0 1 2 1 3 3 4 5 3 3 1 2 0 .35
Figure 2. Mean GRE Aptitude Test score (GRE-V or GRE-Q as appropriate to afield) in relation to mean Year 1 graduate GPA for 35 departmentalsamples from primarily verbal fields and 41 samples from primarilyquantitative fields_
nrevr rinr,t,uti rn! E
2.
800 700 800 900
Education
SociologyGRE Verbal.Departmental means ihemistryMin Mean Max tpthematics
_English
*-*-* *- sok * *-** *-*-* *--d
Computer Science
4''ducation
L.
pistory
SociologyGRE QuantitativeDepartmental means
Economics
*English
Min Mean Max,
* * *-*-* -*-* *-*-*-*
m
8^
c^cr
GKE 'Analytical
Departmental means
Min Mean Max
Education
4
Mean GRE Verbal ScoreAll intended graduatemajors in these fields
1977-78
Mean GRE Quantitative Score,All intended majorsin these fields
1977 -78
Chemistry
English
History
Sociology
Chemistry
Mathematics
Computer Science
Economics
Mathematics'
Computer Science
Economics
Mean GRE Analytical Score %All intended majors m
in these fields mm
m1977-78 m
it n4011- 4 u . Sduj 8 U 9U0
Figure 3. Range of mean scores of departmental samples on the restructured GRE Aptitude Test.
Assuming that the predictor and criterion data for each of the 100 departmental
samples in the basic study have been converted to a common metric, with mean = zero
and sigma (standard deviation) = unity [(X -X) /sigma], within departments, a
decision must be made regarding pooling criteria: Which samples will be grouped for
purposes 0 pooling? At the graduate level, validity studies have tended to focus on
the department as theThasic'context for analysis and discipline or field of study as
the primary taxonomic variable for purposes of classifying departments. Thus,
pooling data for departments according to discipline is consistent with the functional
or disciplinary structure of the graduate school.
With field, or discipline, as the primary criterion for grouping departments
whose dataare to be pooled,. the use of pooled within-group (within-department) data
to arrive at estimates of validity that are meaningful for individual departments
rests on certain assumptions. One assumption underlying this approach is that the
variability in observed coefficients in very small samples from several departments
withithe same field reflects primarily sampling fluctuation around a common popu-
lation value.
Given standardized data sets (predictor/criterion observations) for comparable f
samples (e.g., firsttime enrolled graduate students) from, say, 18 English depart-
ments (each very small), a working corollary of the foregoing assumption is-that the
estimate of relationships based on the pooled within-department data provide's a
reasonable ('useful, practically significant) approXimation to an estimate that,
theoretically, might be generated by pooling results of a comparable number of
replications involving successive samples of comparable size within each department- -
a remote possibility' in practice.
Evidence generally, supportive of such assumptions is provided by the results of
a GRE validity study (Wilson, 1979) that indicated that observed regresSion weights
for verbal and quantitative scores and undergraduate GPA did not tend to vary signif-
icantly from weights estimated from pooled within-group departmental data;* the
individual departmental samples involved, though small by usual validity-study
standards, were, functionally, considerably larger than the samples available for
the present study. Because of the extremely small size of the samples available
for the present study, and the correspondingly very substantial sampling error for
each observed coefficient, a direct test of the common weights hypothesis was not
undertaken.
All the analyses in this study that are concerned with estimating relationships
of predictors or combinations of predictors with performance are based on pooled,
departmentally standardized data. Data have been pooled by field, and two clusters
of fields have been desighated, on the basis of judgment, as being either primarily
verbal (English, education, history, and sociology) or primarily quantitative
(chemistry, mathematics, computer science, and economics). The arbitrary nature of
th'iS classification is recognized.
In4considering results of the pooled-data analyses, it is important. to note that
the participating departments cannot be assumed to be representative of the population
of departments in the respective fields. If, for each discipline under consideration
here, the departments involved were a random or stratified random sample, stronger
inferences could be made regarding field differences in the observed patterns of
relationships for a common set of predictor-criterion variables. In our sample. of
voluntary participants, we find considerable unevenness across fields in the number
of departments (ranging from 7 in sociology and mathematics, for example, to 21 in
chemistry).
*Evidence of a very substantial amount of validity generalization across 726 law-school
validity studies has been reported by Linn, Harnisch, and Dunbar (1981).
2
special circumstancesinyolved in the introduction of the GRE analytical abilitymeasure reported scores were to be ignored in screening applicants during theadmissions period covered by this study), inferences regarding the comparative and/orincremental validity of this ability measure with respect to the traditional verbaland quantitative ability scores should be thought of as quite tentative in nature.Verbal and quantitat-ive scores suffer in this particular withingroup correlationalcompetition from attentuatlon through restriction due to direct selection whereas anyattenuation for analytical scores is the result of restriction due to indirectselection only.
I
Procedures
Intercorrelation matrices, means, and standard deviations of variables (asavailable) in their normal (nonstandardized) metric were first computed for each ofthe available departmental data sets. Within each of the eight fields (and the twobroad classificaticns of fields--i.e., verbal or quantitative), weighted means of theelements of the respective departmental intercorrelation matrices were then computedto construct several field matrices reflecting interrelationships among pooleddepartmentally standardized variables.
It is important to note in this connection that a pooled field matrix whoseelements are weighted means of the corresponding elements of the several departmeritalmatrices is identical to the field matrix that would be determined by computingintercorrelations using variables all of which had been subjected to a zscaletransformation (mean = zero and standard deviation = unity within each department)prior to pooling.
Each of the pooled field matrices involved a different combination of departmentsand variables, depending upon data availability, as follows:
I. an Aptitude Test matrix (GRE V, GREQ, GREA, and graduate GPA) based ondata for all samples;
II. a Selfreported UGPA or SRUGPA matrix (as for I, plus SRUGPA) based ondata for all samples in which at least five (but not necessarily all)students had a SRUGPA;
IIA. a departmentally reported UGPA or DRUGPA matrix based on data for allsamples in which at least five (but not necessarily all) students had aDRUGPA and a SRUGPA.
III. An Advanced Test matrix (as for I, plus GRE Advanced Test score) based ondata for all samples in which at least five (but not necessarily all)students presented a GRE Advanced Test score.
These field matrices provided estimates of the,,zeroorder validity coefficientsfor the respective predictors, based on the:total. number of individuals with data ona predictor, and were also employed for multivariate analyses as follows:
o Questions regarding the-regression oc graduate CPA on the restructured GRE AptitudeTest battery, especially questions regarding the 'role of the analytical abilityScore relative to' the traditional,verbal and quantitative scores, were'addressedmost directly and basically through multiple regression-analyses using the AptitudeTest matrix.
o Questions regarding the contribution of the undergraduate gradepoint average wereaddressed in multiple regression analyses using the SRUGPA matrix (which reflectedpooled data for a total of ql of the 100 departmens), rather than the DRUGPAmatrix (reflecting pooled data for only 62 departments); results of comparative
2
that, for research purposes, the more widely available seit-reportec uura consti-
toted a credible surrogate, for the more-or-less official UGPA index (as reported
by a department), which had only limited availability.
o The Advanced Test matrix was employed in multiple regression analyses designed to
assess the contribution of GRE. Advanced Test scores when used in conjunction with
the restructured GRE Aptitude Test battery.; this matrix, reflected pooled-data
for only slightly more than one-half. mf the 'departments in the stud) (54 of 100).
Subgroup Analyses
Consideration of questions"regarding the predictive validity of the restructured
Aptitude Test for subgroups iefined in terms of sex or for minority students was not
a part of the basic design of the present study. However, the importance of obtaining
empirical evidence regarding the patterns of validity for predictors in such subgroups
is evident. Accordingly, information regarding the comparative validity of ;.he
restructured Aptitude Test (for men and women and for minority and nonminority
students) was sought in a set of exploratory analyses involving pooled departmentally
standardized (z-scaled) verbal; quantitative, and analytical scores, and SR-UGPA and
graduate GPA, iespectively.*
In these. analyses, each variable was z-scaled within each department using the
estimates of the mean and standard deviation for each within- department total sample.
Following this scale transformation, the z- scores for individuals in the respective
subgroups were pooled for analysis by field. These analyses provide insight into (a)
the average deviation of the means for subgroups on the predictor and criterion
variables under consideration froM their respective departmental means, in departmental
standard deviation units, and (b) the correlation of z-scores on the predictors with
z-scores on the graduate GPA criterion in each of the subgroups.
*Classificaton of students according to sex and "minority vs "nonminority" status
was based on information in the GRE history file. Detailed consideration of the
classification process is provided in the subsequent section of this report that
treats findings for subgroups.
Presentation and discussion of findings in this section follows the generalsequence of analysis outlined in the previous section, namely:
1) estimation-of validity coefficients for the restructured Aptitude Test andselected additional predictors with respect to graduate GPA;.
2) analysis of the regression of graduate GPA on the'restructured GRE AptitudeTest;
3) analysis of the role of the undergraduate gradepoint average when added tothe restructured Aptitude Test;
4) analysis of the contribution'of the GRE Advanced Test score to predictionWhen added to the Aptitude Test battery; and
5) analysis of the predictive validity of the restructured Aptitude. Test forsubgroups defined in terms of sex and selfreported ethnic status (minority vs.nonminority).
Estimates of Validity for the Predictors*
Table 3 provides two sets of estimates of validity coefficients based on pooleddepartmentally standardized variables, namely, (a) estimates derived in the presentstudy using data for firsttime students entering in 1978 who presented scoreson the restructured GRE Aptitude Test and (b) estimates from the Cooperative ValidityStudies Project (Wilson, 1979) for firsttime atudents entering in.1974and 1975,
combined, who presented scores on the traditional GRE Aptitude Test. Also shown for
each coefficient reported is the number of cases on which it is based.
Regarding the analytical ability measure, the following observations are relevant:
In threedf the four fields designated as quantitative (all but mathematics),
validity coefficients for the analytical score are slightly higher than those for
the quantitative score and coefficients fOr both quantitative- and analytical
scores are higher than those for the verbal score.
o In the so galled verbal fields, the observed pattern of coefficients for the three
scores is not a consistent one; in the comparatively large, pooled education
sample the analytical score comes out ahead in the correlational competition withverbal and quantitative scores and in-history the coefficient for the analyticalscore parallels that for the verbal score. The verbal score is dominant (andatypically high) in the sociology sample (N = 44).
o If attention is focussed on findings for the two broad field classifications, it
is evident that the coefficient for the analytical score tends to parallel those
for the verbal and quantitative scores in the all verbal sample'and that for thequantitative score in the all quantitative sample.
With regard to GRE Advanced Test scores, the observed coefficients from thecurrent study, and those from the earlier study suggest the importance of including in
an admissions appraisal a measure that reflects achievement in a content area.
*The findings summarized in this section were included in a preliminary reportsubmitted ro participants in the study. A copy of that report is attached as
Appendix B.
2b
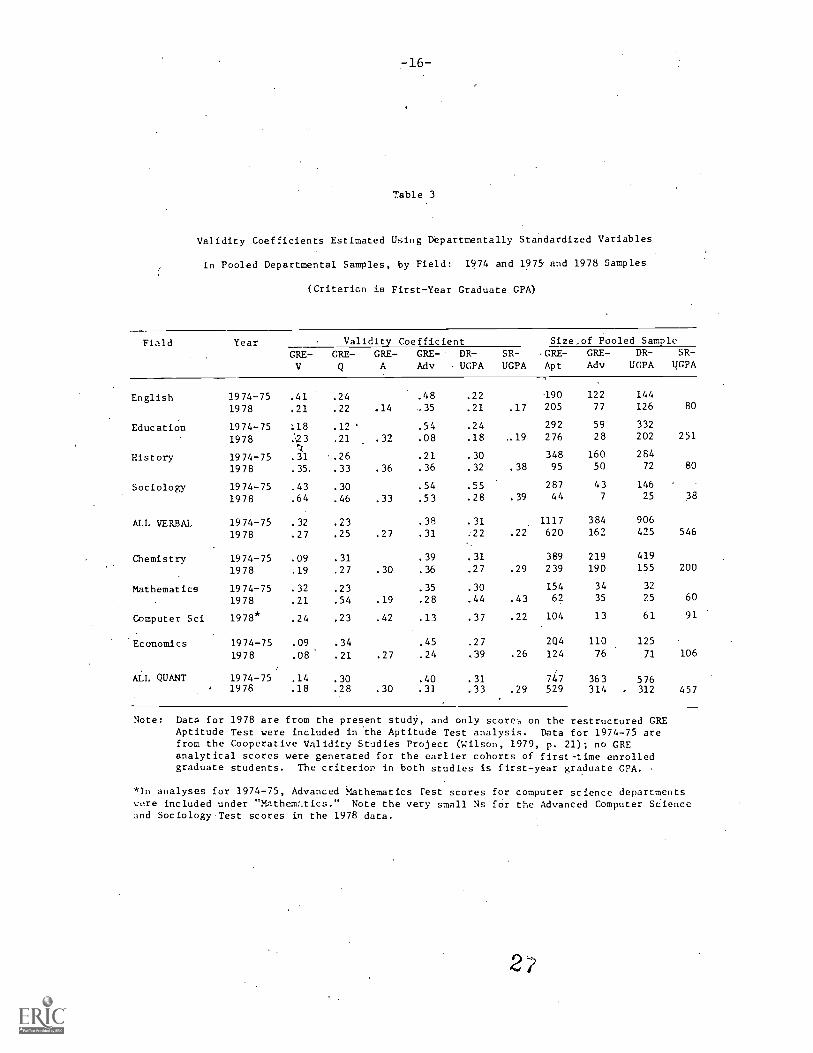
Table 3
Validity Coefficients Estimated Using Departmentally Standardized Variables
in Pooled Departmental Samples, by Field: 1974 and 1975 and 1978 Samples
(Criterion is First-Year Graduate GPA)
Field Year Validity Coefficient Size.of Pooled Sample
GRE-V
GRE-Q
GRE-A
GRE- DR-
Adv UGPASR-
UGPAGRE- GRE- DR- SR-
Apt Adv UGPA UGPA
English 1974-75 .41 .24 .48 .22 90 122 144
1978 .21 .22 .14 .35 .21 .17 205 77 126 80
Education 1974-75 118 .12 ' .54 .24 292 59 332
1978 .23 .21 .32 .08 .18 -19 276 28 202 251
History 1974-75 .31 '.26 .21 .30 348 160 284
1978 .35. .33 .36 .36 .32 .38 95 50 72 80
Sociology 1974-75 .43 .30 .54 .55 287 43 146
1978 .64 .46 .33 .53 .28 .39 44 7 25 38
ALL VERBAL 1974-75 .32 .23 .38 .31 1117 384 906
1978 .27 .25 .27 .31 :22 .22 620 162 425 546
Chemistry 1974-75 .09 .31 .39 .31 389 219 419
1978 .19 .27 .30 .36 .27 .29 239 190 155 200
Mathematics 1974-75 .32 .23 .35 .30 154 34 32
1978 .21 .54 .19 .28 .44 .43 62 35 25 60
Computer Sci 1978* .24 .23 .42 .13 .37 .22 104 13 61 91
Economics 1974-75 .09 .34 .45 .27 204 110 125
1978 .08 .21 .27 .24 .39 .26 124 76 71 106
ALL QUANT 1974-75 .14 .30 .40 .31 747 363 5761978 .18 .28 .30 .31 .33 .29 529 314 , 312 457
Note: Data for 1978 are from the present study, and only score., on the restructured GREAptitude Test were included in the Aptitude Test analysis. Data for 1974-75 arefrom the Cooperative Validity Studies Project (Wilson, 1979, p. 21); no GREanalytical scores were generated for the earlier cohorts of first-time enrolledgraduate students. The criteriop in both studies is first-year graduate CPA.
*In analyses for 1974-75, Advanced Mathematics rest scores for computer science departmentswere included under "Mathemr.tics." Note the very small Ns fOr the Advanced Computer Scienceand SociologyTest scores in the 1978 data.
However, the fact that these and other estimates of the validity of Advanced Test
scores are almost always based on, a selected subgroup of individuals who present GRE
Aptitude Test scores introduces elements of interpretive ambiguity in comparative
assessment.
Finally, validity coefficients for the selfreported UGPA parallel those for the
departmentally reported UGPA, for the most part, suggesting that this selfreport
index may be a satisfactory research surrogate for the departmentally reported
index.
In all the foregoing,-attention has been focused on the validity of each of the
restructured Aptitude Test scores and selected additional predictors. In the sections
that follow, attention is focussed primarily on questions regarding the relative
contribution of scores on the restructured AptltUde Test to prediction of graduate
GPA.
Predictive Validity of the Restructured Aptitude Test: A Multivariate Assessment
\K,able 4 provides evidence regarding the correlation- of the verbal, quantitative,
and analytical scores, separately pnd in bestweighted and equally weighted composites,.
with firstyear graduate GPA.
As previously noted, during the period in which the students in this study were
applicants for admission, schools and departments were advised by the GRE Program not
to consider the analytical score pending collection of empirical data bearing on its
predictive validity. Assuming this advice was followed, the coefficients for verbal
and quantitative scores would be attentuated due to direct selection, whereas the
coefficient for the analytical score would be affected by indirect select!.on only.
This set of circumstances should be kept in mind in evaluating the findings. The
comments that follow regarding, for example, the relative magnitudes of zeroorder
and/or regression coefficients for the three Aptitude Test scores should be thought
of primarily as descriptive of trends in the particular set of data at hand and
suggestive of interpretive rationales.
With respect to zeroorder coefficients:
o The analytical score, like the verbal and. quantitative scores, is positively
associated with graduate GPA in every analysis.
o In three of the four quantitative fields (all but mathematics), the zeroorder
coefficient for the analytical score is higher than that for either the verbal or
the quantitative score, especially so in computer science; in the comparatively
small mathematics sample, the quantitative score is dominant and the coefficient
(r = .535) is atypically high.
o No particular pattern is evident n the several verbal fields--in the small
sociology sample, the verbal score is dominant and the coefficient (r = .635) is
atypically high; in the English sample, the verbal score is noticeably less
closely associated with graduate GPA than either the verbal or quantitative score,
but it is the best single predictor in education; and in history, the coefficients
for the three scores are quite similar.
o In the two larger p6oled samples (i.e., the all verbal and all quantitatiVe
samples), the pattern for the all quantitative sample is one of higher coefficients
for the quantitative and analytical scores than for the verbal score while, for
the all verbal sample,the verbal and analytical scores tend to hi.ve slightly.
higher validity coefficients than the quantitative score, but differences in
magnitude are very slight.,
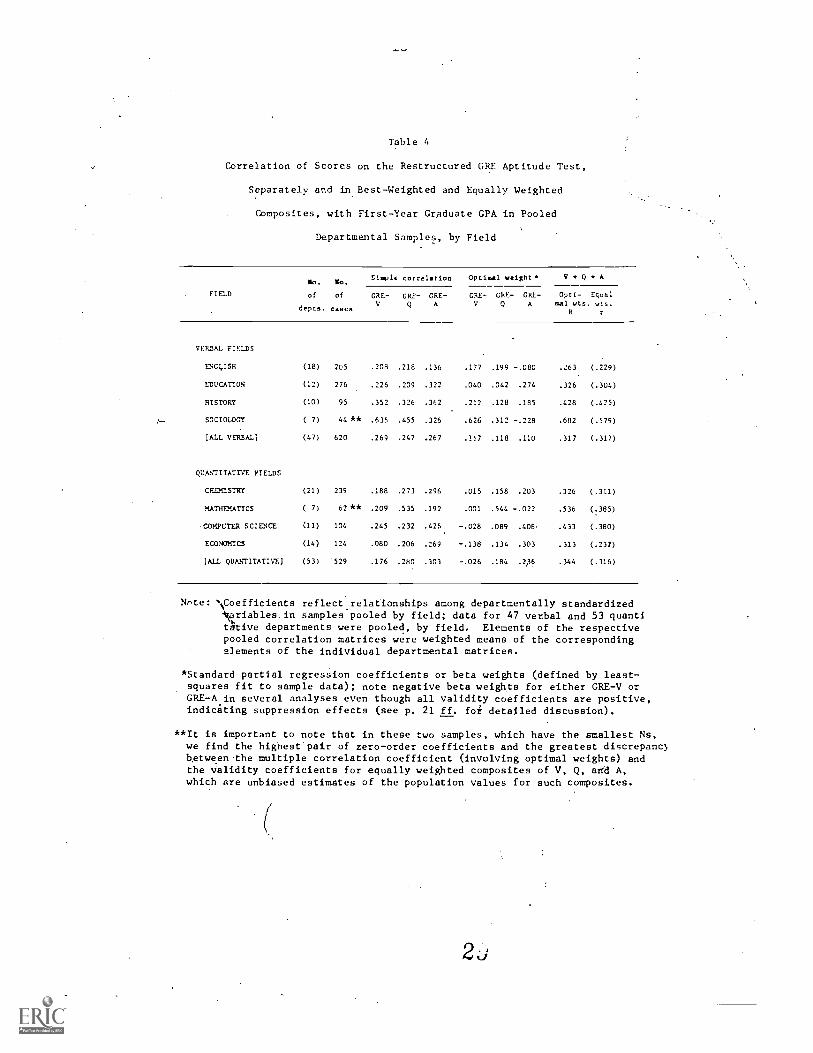
Table 4
Correlation of Scores on the Restructured GRE Aptitude Test,
Separately and in Best-Weighted and Equally Weighted
Composites, with First-Year Graduate GPA in Pooled
Departmental Samples, by Field
FIELD
no. O.
of of
depts. cases
Simple correlation Optimal weight. V + Q + A
GRE- GRE- GRE- GRE- GRE- GRE- °pct.- Equal
V Q A V Q A mal vts. wts.R r
VERBAL FIELDS
ENGLISH (18) 205 .208 .218 .136 .177 .199 -.080 .263 (.229)
EDUCATION (12) 276 .226 .209 .322 .040 .042 .274 .326 (.304)
HISTORY (10) 95 .352 .326 .362 .212 .128 .185 .428 (.425)
SOCIOLOGY ( 7) 44 ** .635 .455 .326 .626 .312 -.22B .682 (.579)
CALL VERBAL) (47) 620 .269 .247 .267 .157 .118 .110 .317 (.317)
QUANTITATIVE FIELDS
CHEMISTRY (21) 239 .188 .273 .296 .015 .158 .203 .326 (.311)
MATHEMATICS ( 7) 62 ** .209 .535 .192 .001 .544 -.022 .536 (.385)
COMPUTER SCIENCE (11) 104 .245 .232 .425: -.028 .089 .408 .433 (.380)
ECONOMICS (14) 124 .080 .206 .269 -.138 .134 .303 .313 (.237)
)ALL QUANTITATIVE) (53) '529 .176 .2b0 .303 -.026 .184 .2.36 .344 (.316)
Nrste: \Coefficients reflect relationships among departmentally standardizedAikariables in samples pooled by field; data for 47 verbal and 53 quantitAtive departments were pooled, by field. Elements of the respectiyepooled correlation matrices were weighted means of the correspondingelements of the individual departmental matrices.
*Standard partial regression coefficients or beta weights (defined by least-squares fit to sample data); note negative beta weights for either GRE-V orGRE-A in several analyses even though all validity coefficients are positive,indicating suppression effects (see p. 21 ff. foi detailed discussion).
**It is important to note that in these two samples, which have the smallest Ns,we find the highest'pair of zero-order coefficients and the greatest digcrepanc)between the multiple correlation coefficient (involving optimal weights) andthe Validity coefficients for equally weighted composites of V, Q, and A,which are unbiased estimates of the population values for such composites.
Also shown in Table 4 for each sample are (a) the coefficient of multiple
correlation for a weighted composite of verbal, quantitative and analytical scores
versus graduate GPA, (b) the standard partial regression (optimal) weights defined
by least squares with analysis for each sample, and (c) a coefficient reflecting the
correlation with graduate GPA of an equally weighted composite of the three scores
(which provides an unbiased estimate of the population value for-such a composite).
One of the more interesting and potentially important messages being transmitted
by these data would seem to be that, in certain of the analyses, each of the three
Aptitude Test scores appears to contribute some unique information regarding perform-
ance potential as reflected in graduate GPA; in others, two of the Aptitude Test
scores seem to be carrying most of the load; in still others, a single Aptitude Test
score seems to be dominant and perhaps sufficient. At the same time, in several of
the analyses, an equally weighted composite of the three scores yields a coefficient
whose value approximates that of the (unshrunken) multiple correlation coefficient.
With these themes in mind, let's take a closer at the results of multi-
variate analysis.
In the primarily quantitative fields, it appears that the contribution to
prediction being made by the verbal score is slight and/or indirect (i.e., through
suppression)* when it is combined with the analytical and' quantitative scores 'except
in mathematics, for which the quantitative score is dominant (and in this sample, as
effective for prediction as the entire Aptitude Test oattery). ,Generally speaking,
the quantitative and analytical scores appear to be operating as a team in the
quantitative fields (although in computer science the analytical score is carrying
most of the load).
In the verbal fields, the patterning of relative weights does not suggest a
comparable, relatively consistent teaming of the analytical score with the theoreti-
cally dominant verbal score. The contribution of the analytical score is indirect
(i.e., through suppression) in two analyses (English and sociology); in eduCation, it
actually carries most of the load, while in the history and all verbal analyses, the
three Aptitude Test scores appear to be sharing the predictive load equally.
It is of interest Co note, however, that the weight distribution dictated by
best-fit regression, as compared with the.relative value of the observed 'Zero-order
validity coefficients, tends to-reflect a shifting (albeit slight) of the load
from the analytical to the verbal score. For example, in the history sample, the
analytical score has a slightly higher Zero-order coefficient than the verbal score,
but the opposite is true of the regression weights; similarly, in the all verbal
analysis, the quantitative score (with a lower zero-order coefficient than the
analytical score) comes out with a slightly higher share of the total load as
reflected in the regression coefficients.
Thus, to summarize briefly from the data in Table 4, in the several quantitative-
field samples, the analytical and quantitative scores appear to. be carrying most of
the load; the pattern in the several verbal-field samples is not similarly consistent-
that is, a consistent pairing of the analytical score with the theoretically dominant
verbal score does not appear.
Further evidence bearing on these patterns is provided in Table 5.
In the several quantitativefields,-the quantitative and analytical score
composite yields a higher multiple correlation with graduate GPA than the verbal
and quantitative composite, and the multiple correlation for the quantitative and
analytical composite tends to be about as great as that for all three scores.
*See the next subsection for a detailed examination of the suppression phenomenon.
30
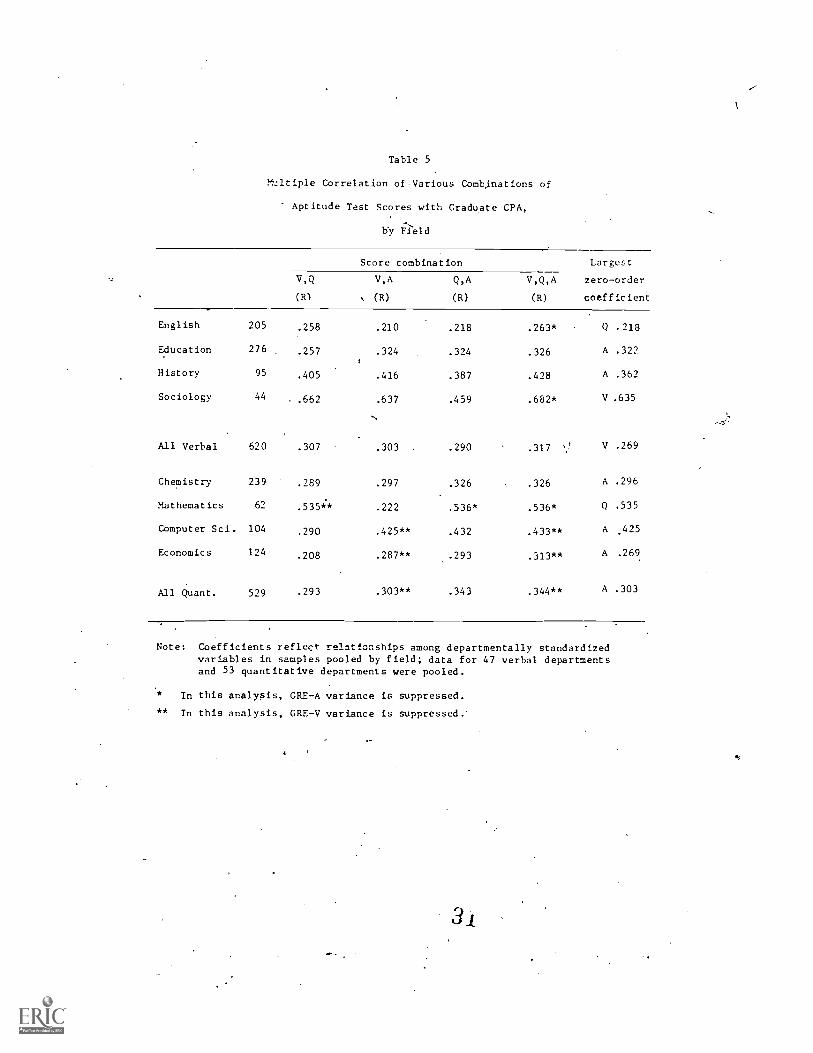
Table 5
M.2.1tiple Correlation of-Various Combinations of
Aptitude Test Scores with Graduate CPA,
by Field
Score combination Largest
zero-order
coefficient
V,Q
(R)
V,A
N (R)
Q,A
(R)
V,Q,A
(R)
English 205 .258 .210 .218 .263* Q .218
Education 276 .257 .324 .324 .326 A .322
History 95 .405 .416 .387 .428 A .362
Sociology 44,- .662 .637 .459 .682* V .635
All Verbal 620 .307 .303 .290 .317 V .269
Chemistry 239 .289 .297 .326 .326 A .296
Mathematics 62 .535" .222 .536* .536* Q .535
Computer Sci. 104 .290 .425** .432 .433** A .425
Economics 124 .208 .287** .293 .313** A .269
All Quant. 529 .293 .303** .343 .344** A .303
Note: Coefficients reflect relationships among departmentally standardizedvariables in samples pooled by field; data for 47 verbal departmentsand 53 quantitative departments were pooled.
* *
In this analysis, GRE-A variance is suppressed.
In this analysis, GRE-V variance is suppressed.
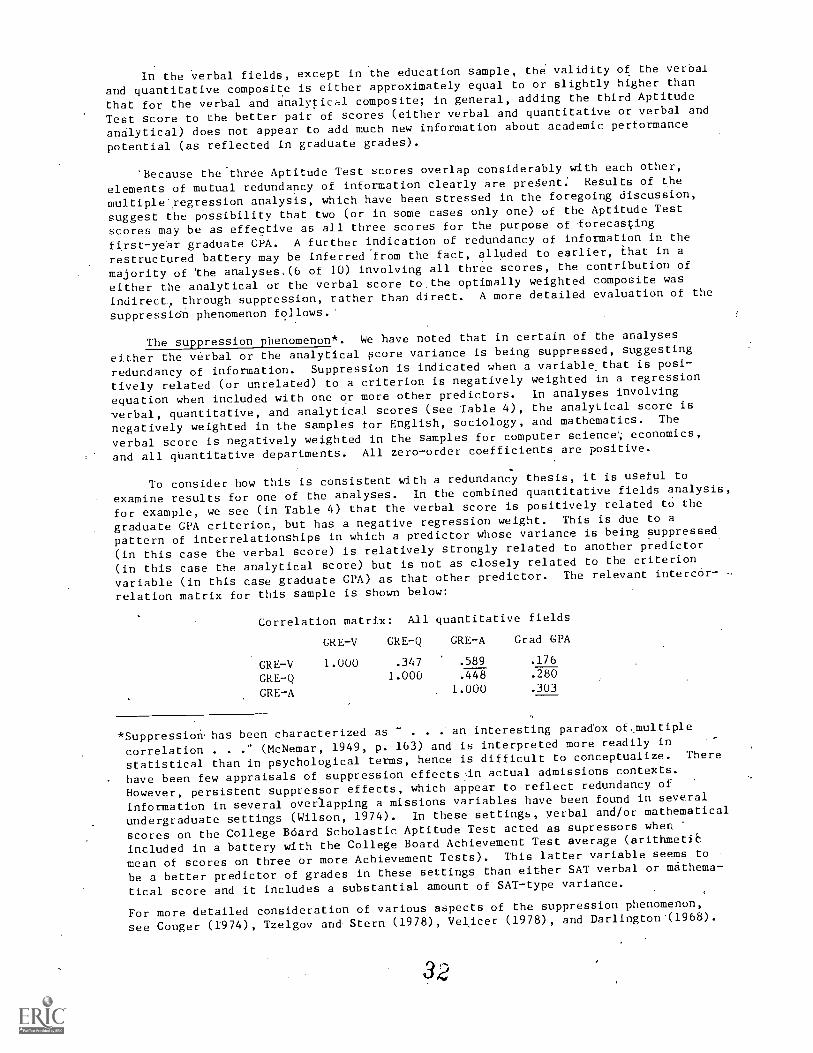
In the verbal fields, except in the education sample, the validity of the verbal
and quantitative composite is either approximately equal to or slightly higher than
that for the verbal and analytical composite; in general, adding the third Aptitude
Test score to the better pair of scores (either verbal and quantitative or verbal and
analytical) does not appear to add much new information about academic performance
potential (as reflected in graduate grades).
'Because the-three Aptitude Test scores overlap considerably with each other,
elements of mutual redundancy of information clearly are present: Results of the
multiple regression analysis, which have been stressed in the foregoing discussion,
suggest the possibility that two (or in some cases only one) of the Aptitude Test
scores may be as effective as all three scores for the purpose of forecasting
first-year graduate CPA. A further indication of redundancy of information in the
restructured battery may be inferred from the fact, alluded to earlier, that in a
majority of 'the analyses,(6 of 10) involving all three scores, the contribution of
either the analytical or the verbal score to.the optimally weighted composite was
indirect, through suppression, rather than direct. A more detailed evaluation of the
suppressidn phenomenon follows.'
The suppression phenomenon*. We have noted that in certain of the analyses
either the verbal or the analytical pcore variance is being suppressed, suggesting
redundancy of information. Suppression is indicated when a variable that is posi-
tively related (or unrelated) to a criterion is negatively weighted in a regression
equation when included with one or more other predictors. In analyses involving
verbal, quantitative, and analytical scores (see Table 4), the analytical score is
negatively weighted in the samples for English, sociology, and mathematics. The
verbal score is negatively weighted in the samples for computer science'; economics,
and all qbantitative departments. All zero-order coefficients are positive.
To consider how this is consistent with a redundancy thesis, it is useful to
examine results for one of the analyses. In the combined quantitative fields analysis,
for example, we see (in Table 4) that the verbal score is positively related to the
graduate CPA criterion, but has a negative regression weight. This is due to a
pattern of interrelationships in which a predictor whose variance is being suppressed
(in this case the verbal score) is relatively strongly related to another predictor
(in this case the analytical score) but is not as closely related to the criterion
variable (in this case graduate GFA) as that other predictor. The relevant intercor- -
relation matrix for this sample is shown below:
Correlation matrix: All quantitative fields
GRE-V GRE-Q GRE-A Grad CPA
GRE-V 1.000 .347 .589 .176
GRE-Q 1.000 .448 .280
GRE-A 1.000 .303
*Suppression. has been characterized as . . . an interesting paradox of,multiple
correlation . .." (McNemar, 1949, p. 163) and is interpreted more readily in
statistical than in psychological terms, hence is difficult to conceptualize. There
have been few appraisals of suppression effects in actual admissions contexts.
However, persistent suppressor effects, which appear to reflect redundancy of
information in several overlapping a. missions variables have been found in several
undergraduate settings (Wilson, 1974). In these settings, verbal and/or mathematical
scores on the College Board Scholastic Aptitude Test acted as supressors whet;
included in a battery with the College Board Achievement Test average (arithmeti6
mean of scores on three or more Achievement Tests). This latter variable seems to
be a better predictor of grades in these settings than either SAT verbal or mathema-
tical score and it includes a substantial amount of SAT-type variance.
For more detailed consideration of various aspects of the suppression phenomenon,
see Conger (1974), Tzelgov and Stern (1978), Velicer (1978), and Darlington'(1968).
32
The verbal score relates relatively, closely to the analytical score (r = .589)but is less closely "related to grdduate GPA (r = .176) than the analytical score(r = .303). Some of the verbal score variance in the analytical score is actuallyredundant, even dysfunctional--a composite obtained by simply adding the verbal andanalytical scores would yield a lower coefficient than that for the analyticalscore alone. Accordingly, elimination or suppression of an appropriate portion ofthe verbal related variance in the analytical. score (by negatively weighting theverbal score in the regression equation) should result in increased correlationof the total composite with graduate GPA.
The negative beta weight of a suppressor variable typically is relatively smalland the incremental validity associated with the suppressor usually is slight. In
this case, as may be seen in Table 4, for the all quantitative fields analysis,beta weights are -.026, .184, and .236, for the verbal, quantitative, and analyticalscores, respectively; and the multiple correlation for the three-score (V,Q,A)composite (R = .344) is essentially the same as that for the quantitative andanalytical (Q,A) composite (R = .343), as shown in Table 5.
Thus, in this particular sample, it may be inferred that when both the verbaland Analytical'scores are included in the battery of predictors, there is an excessof verbal score variance. Similar inferences might be drawn regarding the analyticalscore, of course, in the English, sociology, and mathematics samples and regardingthe verbal score in the computer science and economics samples.
Self-Reported UGPA and Its Contribution to Prediction
Analyses involving self-reported undergraduate GPA (in the major field), orSR-UGPA, could be carried out using data for 91 of the 100 departments included inthe basic GRE Aptitude Test analysis reported in the previous section. Only 58
departmental samples were available for analyses involving both a self-reported UGPAand an official UGPA (referred to hereafter as a departmentally reported UGPA, orDR-UGPA). If the validity patterns for SR-UGPA approximate those observed for
.DR-UGPA, then the self-reported UGPA may be thought of as a useful research surrogatefor a transcript based UGPA.
Evidence bearing on the interchangeability, for research purposes, of SR-UGPAand DR-UGPA is provided in Table 6.* Shown in the columns headed SR-UGPA are validitycoefficients, coefficients of multiple correlation, and corresponding beta (standardpartial regression) weights for the restructured GRE Aptitude Test and SR-UGPA,generated by using data for 91 departments (41 from verbal and 50 from quantitativefields) having at least five students with a SR-UGPA. In the columns headed DR-UGPA(and SR-UGPA) are comparable statistics, generated by using data for 58 departments(28 verbal and 30 quantitative) for which both an SR-UGPA and I DR-UGPA were available
for at least five students. The following patterns are noteworthy:
o The values of zer0-order coefficients for SR-UGPA and for DR-UGPA in samples whereboth were available are almost identical.
o The pattern of beta weights for GRE Aptitude Test scores and SR-UGPA and thepattern of beta weights for GRE Aptitude Test scores and DR-UGPA in samples whereboth were available are very similar.
*In examining the coefficients for GRE Aptitude Test scores in Table 6, and allsubsequent tables, it is important to keep in mind that they should not be expectedto correspond precisely to those reported in the basic analysis of GRE Aptitude Test
scores only (e.g., Table 4 and Table 5) because of differences in the departmental
composition of the respective data pools.
33
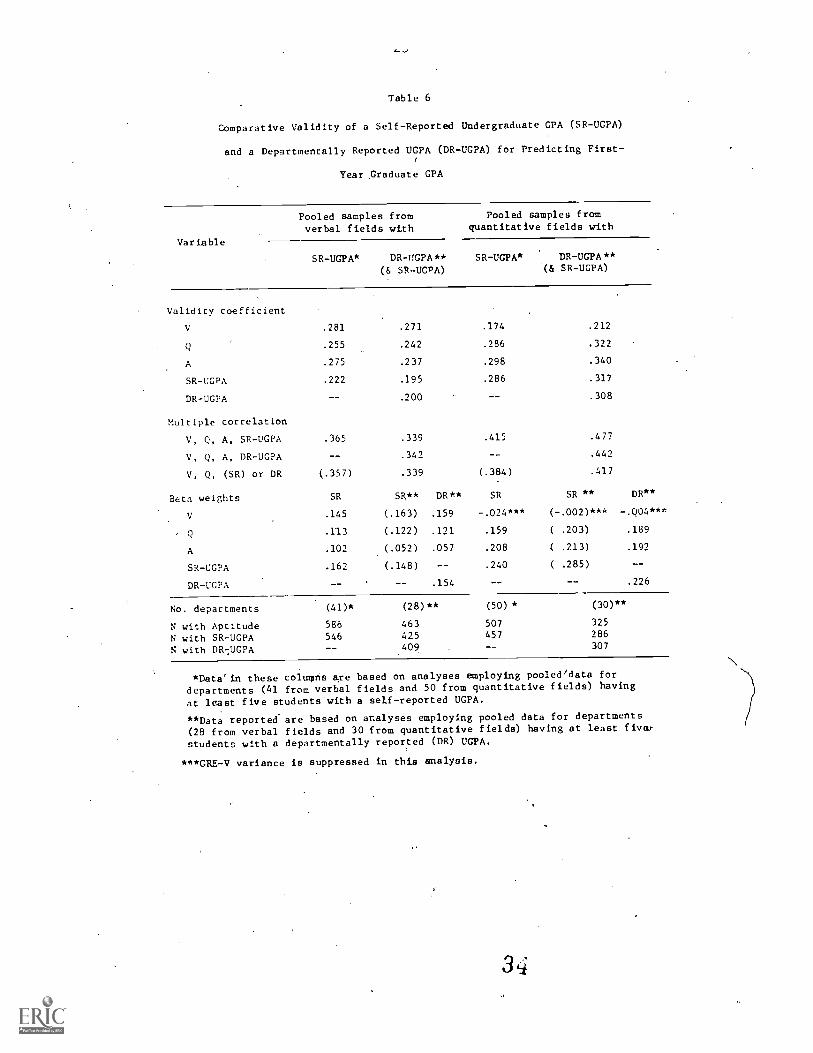
Table 6
Comparative Validity of a Self-Reported Undergraduate GPA (SR-UGPA)
and a Departmentally Reported UGPA (DR-UGPA) for Predicting First-
Year .Graduate GPA
Variable
Pooled samples from Pooled samples from
verbal fields with quantitative fields with
SR-UGPA* DR-TTGPA**
(& SR-UGPA)
SR-UGPA* DR-UGPA**(tg SR-UGPA)
Validity coefficient
V .281 .271 .174 .212
Q .255 .242 .286 .322
A .275 .237 .298 .340
SR-UGPA .222 .195 .286 .317
DR-UGPA .200 .308
Multiple correlation
V, Q, A, SR-UGPA .365 .339 .415 .477
V, Q, A, DR-UGPA .342 .442
V, Q, (SR) or DR (.357) .339 (.384) .417
Beta weights SR SR** DR** SR SR ** DR**
V .145 (.163) .159 -.024*** (-.002)*** -.Q04***
Q .113 (.122) .121 .159 ( .203) .189
A .102 (.052) .057 .208 ( .213) .192
SR-UGPA .162 (.148) -- .240 ( .285)
DR-UGPA .154 .226
No. departments (41)* (28)** (50) * (30)**
N with Aptitude 586 463 507 325
N with SR-UGPA 546 425 457 286
N with DR -UGPA -- 409 -- 307
*Data'in these coluains are based on analyses employing pooled/data fordepartments (41 from verbal fields and 50 from quantitative fields) having
at least five students with a self-reported UGPA.
**Data reported are based on analyses employing pooled data for departments
(28 from verbal fields and 30 from quantitative fields) having at least fiver
students with a departmentally reported (DR) UGPA.
***GRE-V variance is suppressed in this analysis.
o The patterns of beta weights for GRE Aptitude Test scores and SR-UGPA in analysesinvolving data for all departments with at least five students having a SR-UGPA(41 verbal and 50 quantitative) are basically similar to the patterns observed inthe analyses involving only those departments with both DR- and SR-UGPA data.
These results suggest that, for research purposes, the SR-UGPA can be considereda satisfactory surrogate for students' transcript-based UGPA.
Table 7 shows the zero-order correlation of SR-UGPA' with graduate GIA in thepooled departmental samples by field. Also shown are multiple correlation coefficientsfor selected GRE Aptitude Test score and Aptitude Tes,t score/SR-UGPA composites.
Several features of the data in Table 7 are noteworthy; including the following:
o In every analysis but one, the best zero-order validity, coefficient (in the lastcolumn) is, associated with a GRE Aptitude Test score, a pattern'consistent withevidence from studies that have employed transcript-based UGPA indices (e.g.,Wilson, 1979).
o With due,allowance for the potential for shrinkage in the values of the multiplecorrelation coefficients reported, it is evident that GRE Aptitude Test scores areproviding information about academic performance potential that supple,ments the
information provided by the undergraduate grade record and, vice versa.\\
o Illustratively, using results of analyses in Ft he two largest samples, we see forthe all verbal sample a zero -order coefficient, of .222 foc SR-UGPA and a multiplecorrelation of .358 when the Nerbal and quantitative scores (V,Q) are used tosupplement SR-UGPA; for the all quantitative sample, comparable values are .286
(SR-UGPA) and .384 (SR-UGPA,V,Q),
These findings clearly strengthen and extend the general maxim that assessmentof the academic performance potential of applicants should be improved by including
both information regarding past academic performance and information from standardizedadmissions tests.
As for the role of the analytical ability score in strengthening the assessment
process, the evidence in Table 7, like that in the previous analyses, is inconclusive.
Considering, first of all, the two largest samples--in the all verbal sample,the multiple'when the analytical score is added to the battery is .365, some .007
correlation points greater than the multiple for a battery comprised of SR-UGPA, V,and Q only; for the all quantitative sample, the comparable increment in R is .031
(from .384 for the V,Q,SR-UGPA battery to .415 for.the V,Q,A,SR-UGPA combination.
For the individual fields, it may be determined from Table 7 that increments in
multiple correlation when SR-UGPA is added to the three Apptitude Test scoresvary from .000 in mathematics to .117 in computer science.
On balance, these findings, like those reported in the previous section, suggestthe tantalizing possibility of incremental validity for the analytical score in some
situations, but do not provide a basis for arguing the analytical score's case ongeneral incremental validity grounds.
GRE Advanced Test Score validity: Limited Perspective
Only limited evidente bearing on the ole of GRE Advanced Test score variance is
provided by the present 'tudy. The reasons for this are suggested by an examination
Of the general summary reformation provided in Table 8 regarding patterns of data
availability for GRE A vanced Test scores and related sampling considerations.
35

-25-
Table 7
Zero-order Correlation of SR-UGPA with Graduate GPA
and Multiple Corrrelation Coefficients for Selected
Aptitude and/or Aptitude/SR-UGPA Composites,
by Field
Field dNoepts.N
SR-UGPA
(r)
V,Q
(R)
V,Q,
SR
(R)
V,Q, V,Q,A,A
(R)
SR
(R)
etzerBo-sorder
(r)
English (16) 194 .161 .273 .298 .280* .305* V .230
Education (11) 271 .188 .268 .296 .337 .355 A .332
History ( 8) 82 .378 .446 .539 .476 .557 A .411
Sociology ( 6) 39 .394 .657 .723 .699* .778* V .652
All Verbal (41) 58b .222 .318 .358 .329 .365 V .281
Chemistry (20) 280 .288 .280 .390 .324 .415 A .300
Mathematics ( 7) 62 .427 .535** .613 .536* .613** Q .535
Computer Sci.(10) 92 .219 .294 .335 .428** .452*** A .428
Economics (13) 119 .258 .251** .356** .318** .396** SR .258
All Quant. (50) 507 .286 .296 .384 .340** .415 ** A .298
Note: These data reflect relationships in pooled samples of' departmentally
standardized variables. Only 91 of the 100 departments involved in
the basic V,Q,A analysis could be included in the SR-UGPA analysis.
Accordingly, the zero-order and/or multiple correlation coefficients
for the Aptitude Test variables reported in this table are not
expected to coincide exactly with those reported previously (e.g.,
Table 4 and/or Table 5).
*GRE-A variance is suppressed in this analysis.
**GRE-V variance is suppressed in this analysis.
***GRE-Q variance is suppressed in this analysis.
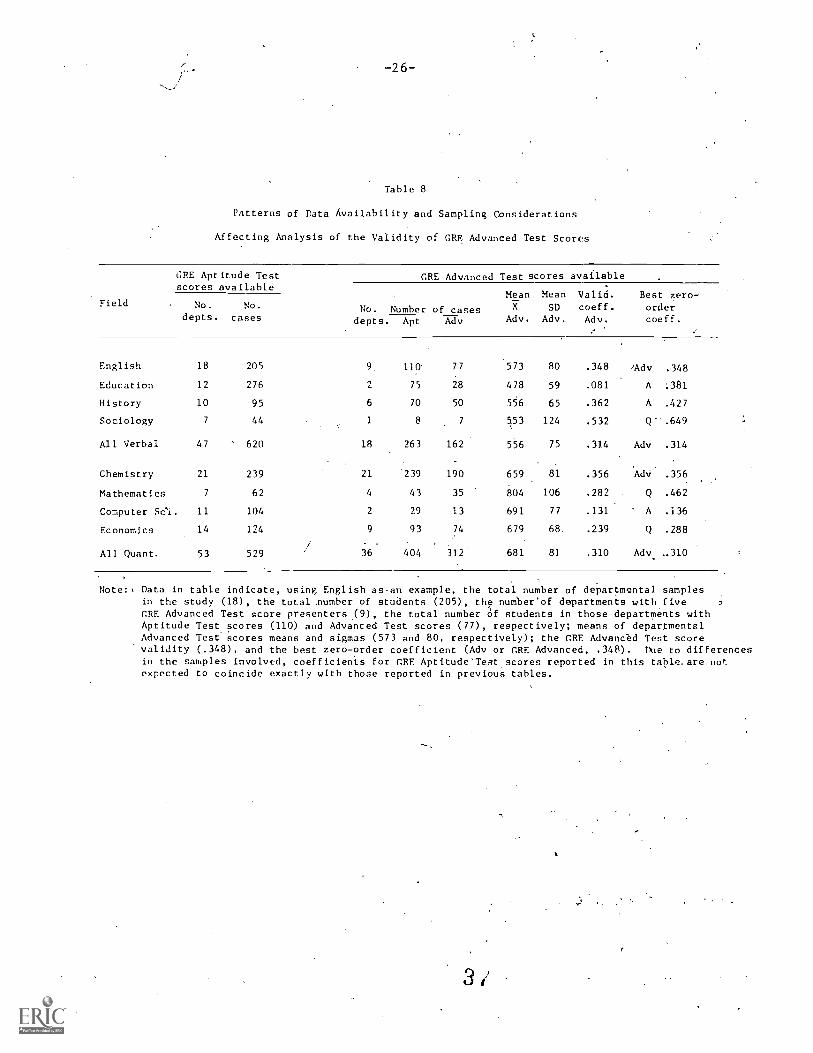
26
Table 8
Patterns of Data Availability and Sampling Considerations
Affecting Analysis of the Validity of GRE Advanced Test Scores
Field
GRE Aptitude Testscores available
No. No.depts. cases
GRE Advanced Test scores available
Mean Mean Valid. Best zero-
No. Number of cases X SD coeff: order
depts. Apt Adv Adv. Adv. Adv. coeff.
English 18 205 9, 110' 77 573 80 .348 ,Adv .348
Education 12 276 2 75 28 478 59 .081 A :381
History 10 95 6 70 50 556 65 .362 A .427
Sociology 7 44 1 8 7 53 124 .532 Q" .649
All Verbal 47 ' 620 18 263 162 556 75 .314 Adv .314
Chemistry 21 239 21 '239 190 659 81 .356 AdV .356
Mathematics 7 62 4 43 35 804 106 .282 Q .462
Computer Sei. 11 104 2 29 13 b91 77 .131 A .i36
Economics 14 124 9 93 74 679 68. .239 Q .288.
All Quant. 53 529 36 404 312 681 81 .310 Adv. -310
Note: Data in table indicate, using English as-an example, the total number of departmental samplesin the study (18), the total mumber of students. (205), the number'of departments with fiveGRE Advanced Test score presenters (9), the total number of students in those departments withAptitude Test scores (110) and Advanced Test scores (77), respectively; means of departmentalAdvanced Test scores means and sigmas (573 and 80, respectively); the GRE Advanc-ed Test scorevalidity (.348), and the best zero-order coefficient (Adv or GRE Advanced, .348). Due to differencesin the samples involved, coefficients for GRE AptitudeTest scores reported in this table. are notexpected to coincide exactly with those reported in previous tables.
-27--
First'of 111, in only one field (chemistry) did all of the participatingdepartments have at least five students with an Advanced Test score. Only 18 of 47
departmentg from theverbal fields had as many as five students with a GRE AdvancedTegt score; 36 of 53 departments from the quantitative fields met. this criterion forinclusion in the Advanced Test score analysis.
Moreover, in the departments with at least five students with GRE Advanced Testscores, the number of'students with Advanced Test ,scores was typically considerably
smaller than the number with Aptitude Test scores. For example, among 263 students
in 18 verbal departments with at least five Advanced Test candidates, only 162 had
GRE Advanced Test scores; only 312 of the 404 students with Aptitude Test scores in
36 quantitative departments had Advanced Test scores.
The. number of cases with Advanced Test scores in the respective pooled samples,by field, was quite small in most instances, ranging from 7 cases (from only one
department) in sociology and 13 from two computer science departments up to the
maximum of 190 students in chemistry.
Also shown in Table 8 are means orthe observed GRE Advanced Test score meansand standard deviations for the departmental samples, by field. For example; thenine English departments whose data were pooled had GRE Advanced Test mean scoreswhose average was 573; the mean of the distribution of nine Advanced Test scorestandard .deviations for the same nine departments was 80.
It is relevant to nGte (although it is not reported in Table 8) that there is amoderate positive relationship between the size of the Advanced Test score validity
coefficient and the mean of the departmental Advanced Test score standard deviations
(rho = .465) for the eight fields. This is consistent with restriction-of-range
theory.*
In the pooled all verbal and all quantitative samples, and in the Englishand chemistry' samples as well, GRE Advanced Test scores emerge as the best single
predictor. Table 9, shows simple correlatiOns for the GRE Aptitude and Advanced Test
scores by field. Also shown for the larger samples are multiple correlations forvarious combinations of GRE Aptitude Test scores and/or GRE Aptitude and AdVanced
Test scores and optimal multiple regression (beta) weights for the restructured
Aptitude and Advanced Test score composites (V,Q,A,Adv).
Judging from results in the all verbal and all quantitative samples, GRE Advanced
Test scores appear to be contributing unique information when added to Aptitude Test
scores. In the all verbal analysis, the V,O,A composite correlated .354 withgraduate GPA as compared with a multiple of .315 for the traditional V,Q composite;
when A is added to the V,Q,Adv battery, the multiple becomes .356. In the all
quantitative analysis, the V,Q,Adv composite correlated .345 with graduate GPA as
.compared to .284 for V,Q; when A is added, the multiple becomes .366.
It is relevant to note in these two samples that when A is added to the tradi-
tional V,Q,Adv battery, incremental validity is limited. A similar observation may
be made for the results in economics; in the chemistry sample, the analytical score
appears to contribute some unique variance. For the English sample, the GRE Advanced
Test score appears to be making a unique contribUtion; however, it is important to
note that the incremental validity observed when A is added to the V,Q,Adv combination
(.414 as opposed to .365) is associated with the quite pronounced suppression of
analytical score variance, especially, but also of GRE variance.
*See Linn, Harnisch and Dunbar (1981a) for empirical evidence of the relationship
between size of validity components and sample standard deviations in a large number
of law school validity-study samples.

-28-
Table 9
Simple and Multiple Correlations of GRE Aptitude and Advanced Test Score,
with First-Year Graduate CPA In Pooled Departmental Samples by Field
VariableEng-
limb
Edu-
cation
Himt-
ory
Sot:-
ology.
All
Verbal
Chem-
tatty
Mathe-.
mat!cm
Compu-
ter Sci.
Econom-
ics
All
(Nam
Simple correlation
GRE-V .207 .258 .385 .619 (.281) .1E8 .056 .048 .049 (.132)
GRE-Q .141 .311 .354 .649 (.262) .273 .462 .067 .288 (.202)
GRE- .074 .381 .427 .517 (.26' .296 -.002 .136 .211 (.233)
GRE-Adv .34e .081 ..362 .532 (.314) .356 .282 .133 .239 (.310)
Multiple correlation
V.Q .715 .426 (.315) .289 .292 (.284)
V,Q.A .239 -- .472 (.320) .326 .317 (.303)
V,Q,A,Adv .414 -- .512 (.356) .420 .345 (.366)
V,Q,Adv .365 .465 (.354) .378 .325 (.345)
Beta weights
V -.130 .061 (.017) -.037 -.155 -.077
Q .189 .075 (.138) .001 .198 .114
A -.292 .292 (.054) .247 -- .155 .161
Ada .554 .242 (.227) .309 -- .154 .238
No. deptrtsents 9 2 6 1 , 18 21 4 2 9 36
N (Aptitude) , 110 75 70 7 263 239 43 29 93 404
N (Advanced) 77 28 50 8 162 190 35 13 74 312
Note: All analyses are based on pooled, departmentally standardized variables.GRE Aptitude Test score coefficients are unique to this particular analysis.
*Although multiple correlations and weights are not shown for the very smallsamples in these fields, data for these samples are reflected in the pooled verbaland quantitative outcomes.
3J

-29--
i
ln
On b lance, these 4ndings tend tc confirm and extend the predictive utility ofthe respe tive GRE Advaned Tests. The data reviewed also point up the interpretivecomplicati s involved Aen data for various predictors are unevenly available.
With respect to the contribution of the analytical score, the observed resultsprovide relatively limited-prespective: Results in the two larger all verbal and allquantitative samples (which would tend to obscure possibly unique relationships inthe respective fields) suggest incremental utility for the GRE Advanced Test score,but essentially none for the analytical score in the all verbal analysis and verylittle for the analytical score in the all quantitative analysis.
-31-
Section V: Analyses for Subgroups*
As indicated at the outset, this study was not designed to deal specifically
with questions regarding the' comparative validity of the restructured GRE Aptitude
Test for subgroups defined in terms of sex or minority versus nonminority status.
The basic analysis was based on pooled data for all first-time students without
regard to subgroup membership. However, in view of the continuing interest in what
has been termed "population validity,-" it was considered desirable to examine
the relationship of the restructured GRE Aptitude Test scores (and SR-UGPA) to
first-year performance in the available subgroup samples. Accordingly, separate
analyses (which should be thought of as exploratory in nature) were made for minority
and nonminority students and for men and women.
Data on GRE Aptitude Test scores and graduate GPA were available for a total
of 103 self-designated minority students (all ethnic groups combined) and 932 self-
designated White students (the nonminority sample). Slightly fewer students (96
minority and 912 nonminority) had a,.selfrreported UGPA. For analyses by sex, GRE
data were available for 757 men and 562 women; the self-reported UGPA was missing for
238 students (136 men and 102 women) who provided sex identification.**
In these subgroup analyses, all variables involved were first standardized
[z-scaled--(X X) /sigma], within department, -based'on data for all individuals with
observations on each variable; z-scale transformations were made for graduate GPA,
GRE Aptitude Test scores, and self-reported UGPA (SR-UGPA). Standardized scores were
aggregated for analysis by field.
Mean z-scores on the variables for minorities and for women, by field, are shown
in Table 10. The tabled values indicate the average amount (in departmental standard
deviation units) by which the scores of the individuals-involved differed from the
all-student within-department means on the respective variables; negative z-score
means indicate typical performance lower than that for-the department as a whole and
positive z-scare means indicate the opposite. For example, in the pooled English.
department sample, the 10 minority students had negative z-score means (indicating
typical standing below the all-student within-department averages) on the criterion
and predictor variables: z-score means were -0.35 for graduate GPA; -0.76, -0.52,
and -0.80 for verbal, quantitative, and analytical scores; and -0.13 for SR-UGPA.
Among women in this field, the overall pattern was similar, but (by inference) the
average difference between men and women on the variables under consideration was
*In the basic analysis, only students identifiable as first-time graduate students
were included. In the data collection process, however, restructured GRE Aptitude
Test scores and graduate GPA data were obtained for about 100 additional individuals
who were first-time enrollees in a given department, but not first7time giaduatd
students in fall 1978. A decision was made to include the additional records in
order to augment sample size for subgroup analyses. This decision resulted in
bringing eight additional departments up to the working minimum of five cases and in
slight increases in the number of cases for some departments.
**The fact that most students who provided an answer to the question on ethnic group
membership also provided a self-reported undergraduate GPA, whereas a relatively
large number of individuals who provided sex identification did not provi'le the
self-reported UGPA, undoubtedly has to do witt the linkage between registration for
inclusion in the Locater Service and answering questions on ethnic identity and
other background questions associated with that service. Sex identification, by
way of contrast, is routinely asked as part of the GRE registration process for all
individuals
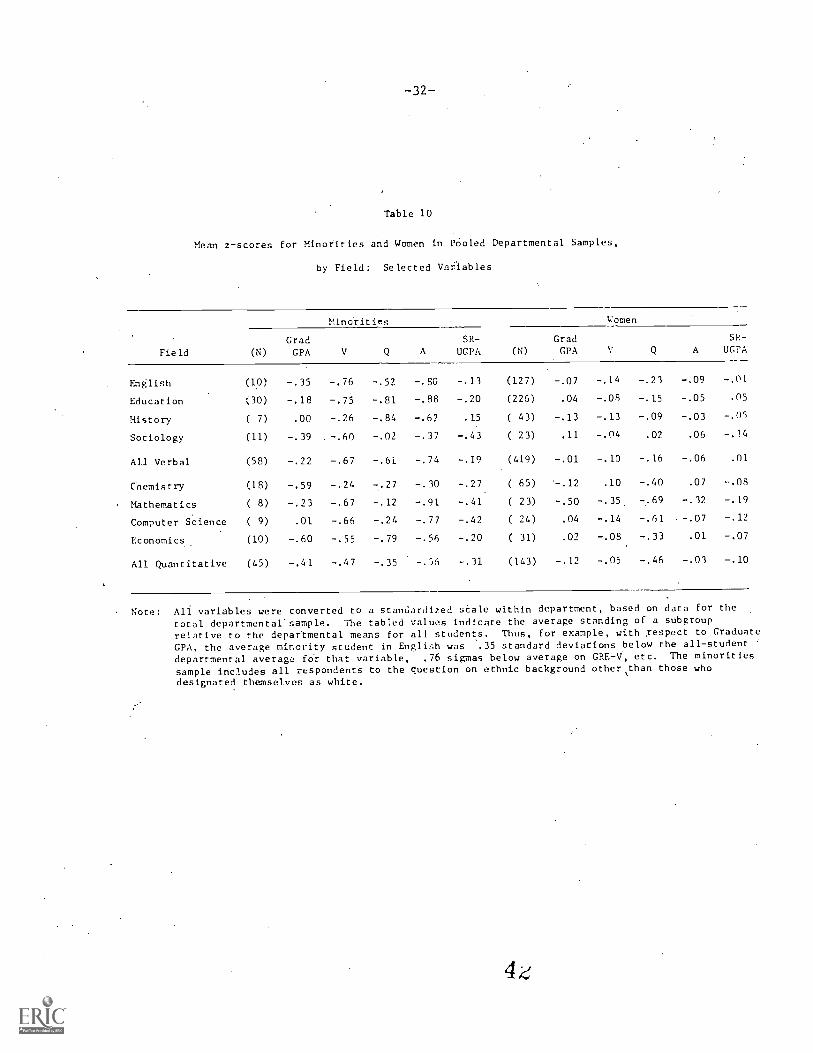
-32-
Table 10
Mean z-scores for Minorities and Women in Pcioled Departmental Samples,
by Field: Selected Variables
Field
Minorities Women
(N)
GradGPA V Q A
SR-
UGPA (N)
GradGPA A
SR-
UGPA
English (10) -.35 -.76 -.52 -.80 -.13 (127) -.07 -.14 -.23 -.09 -.01
Education (30) -.18 -.75 -.81 -.88 -.20 (226) .04 -.08 -.15 -.05 .05
History ( 7) .00 -.26 -.84 -.62 .15 ( 43) -.13 -.13 -.09 -.03 -.OS
Sociology (11) -.39 -.60 -.02 -.37 -.43 ( 23) .11 -.04 .02 .06 -.14
All Verbal (58) -.22 -.67 -.61 -.74 -.19 (419) -.01 -.10 -.16 -.06 .01
Chemistry (18) -.59 -.24 -,27 -.30 -.27 ( 65) '-.12 .10 -.40 .07 -.08
Mathematics ( 8) -.23 -.67 -.12 -.91 -.41 ( 23) -.50 -.35, 7.69 -.32 -.19
Computer Science ( 9) .01 -.66 -.24 -.77 -.42 ( 24) .04 -.14 -.61 -.07 -.12
Economics (10) -.60 -.55 -.79 -.56 -.20 ( 31) .02 -.08 -.33 .01 -.07
All Quantitative (45) -.41 -.47 -.35 -.36 -.31 (143) -.12 -.05 -.46 -.03 -.10
Note: All variables were converted to a standardized scale within department, based on data for the
total departmental sample. The tabled values indicate the average standing of a subgroup
relative to the departmental means for all students. Thus, for example, with respect to Graduate
GPA, the average minority student in English was .35 standard deviations below the all-student
departmental average far that variable, .76 sigmas below average on GRE-V, etc. The minorities
sample includes all respondents to the question on ethnic background other than those who
designated themselves as white.
-33-
considerably lees than the average difference between minority and nonminority
students.*-
Minority students were characterized by low averages,relative to departmental
-norms,- on all predictor variables. In no case involving a GRE Aptitude Test score
did the minority average equal or exceed the departmental average and in only
one case, history, was SR-UGPA higher for minority students than for the department
as a whole. These trends are consistentwith expectations based on evidence of
population differences. It is of some ir&rest that, in two cases (history and
computer science),, the mean graduate GPA for minority students equalled the depart-
mental average, despite rather substantially lower-than-average scores on the
predictors. However, because of very small Ns, the more significant aspect of the
findings is that minority students tended to be below average in performance as
well as on the,admissions variables under consideration. In the all verbal sample,
minority students averaged approximately 0.2 sigmas below the departmental mean on
graduate GPA, and for the all quantitative sample they averaged approximately 0.4
.sigma units below departmental means on the performance variable.
Mean z-scores of minority students tended to be somewhat lower on tLe average
with respect to analytical ability scores than with respect to either verbal or
quantitative scores.
In most instances, the mean z-scores.for women were negative, but only in the
small sample from pooled mathematics departments did the magnitudes of the negative
z-scores for women approach those for minorities. On the performance (graduate GPA)
variable, women did slightly better than the departmental average (and men) in
education, sociology, computer science, and economics. Clearly, the most substantial
difference between women and men occurred in their quantitative scores--women averaged
almost .5 sigma units below the departmental mean on this variable in the quantitative
fields. Among the GRE Aptitude Test' variables, women deviated least from departmental
means in their analytical scores (and, by inference, sex differences are least
pronounced on this variable).
Correlational results
Minority/nonminority. Correlation coefficients for four predictors (V, Q, A,
and SRUGPA) with respect to graduate GPA, all z-scaled prior to pooling, in minority
and nonminority samples are shown'in Table 11. Despite the Fmall NS for minority
samples, it is evident that trends are quite consistent in indicating positive
correlation for the GRE, predictors, with magnitudes equalling or exceeding those for
the nonminority samples. In the all-verbal-fields analysis (involving 58 minority
students), coefficients for Aptitude Test variables were somewhat higher for minority
than for nonminority students; the pattern for SR-UGPA is quite mixed, being systemat-
ically positive in the comparatively, large nonminority samples, by field, but including
some negative coefficients in the much smaller minority samples. Mixed negative and
positive coefficients for SR-UGPA were also present in the quantitative fields for
minority students, whereas all coefficients were positive for this variable in the
nonminority sample.**
*Data for the nonminority sample and for men are not shown. However, by virtue of
the nature of the standardization process, it may be inferred that, if the mean
deviation for a subgroup is negative, the mean deviation of its opposite in the
analysis is positive, and vice versa.
**There is no reason to believe that these negative coefficients reflect other than
the types of anomalies to'be expected in very small samples where one aberrant
(outlying) data set can drastically alter both the sign and the magnitude of an
observed coefficient. Given larger minority samples, the expectation would be that
SR-UGPA should behave in about the same way as is indicated in the present data for
"Iraor nnnminnritV samples.
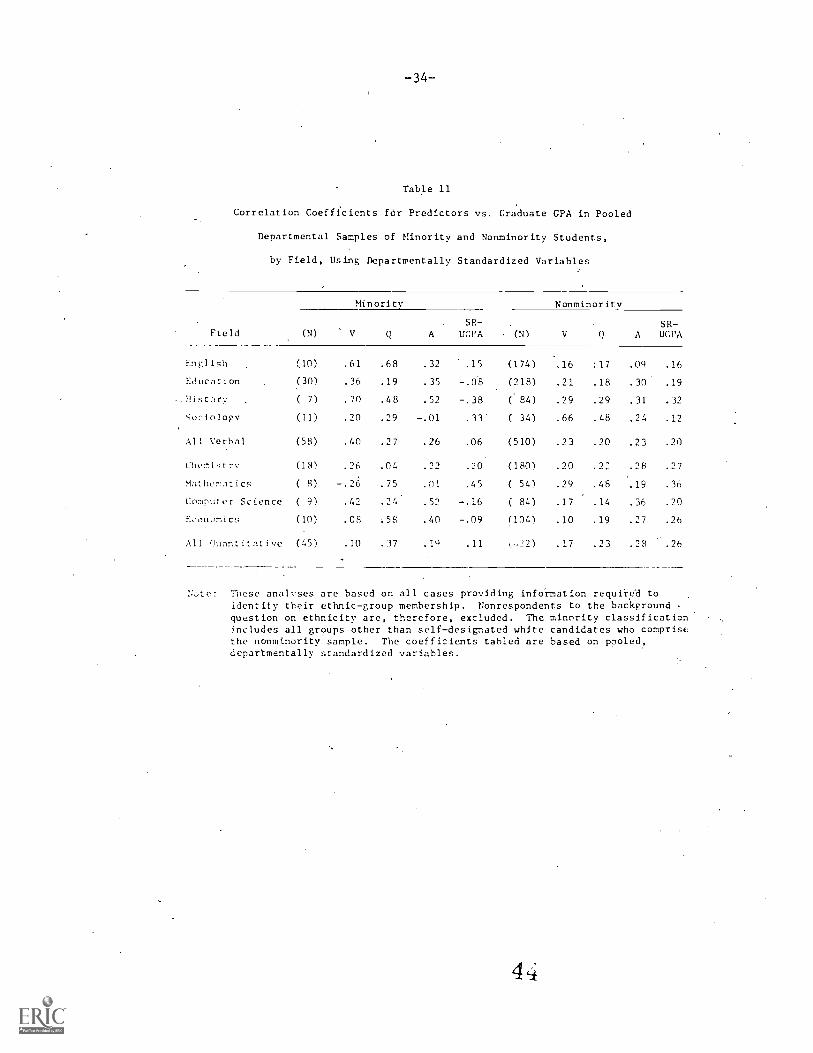
-34-
Table 11
Correlation Coefficients for Predictors vs. Graduate CPA in Pooled
Departmental Samples of Minority and Nonminority Students,
by Field, Using Departmentally Standardized Variables
Field
Minority Nonminoritv
(N) Q A
SR-UGPA (N) V Q A
SR-UGPA
English (10) .61 .68 .32 .15 (174) .16 :17 .09 .16
Education (30) .36 .19 .35 -.08 (218) .21 .18 .30 .19
Histor: ( 7) .70 .48 .52 -.38 84) .29 .29 .31 .32
Sociology (11) .20 .29 -.01 .33 ( 34) .66 .48 .24 .12
All Verbal (58) .40 .27 .26 .06 (510) .23 .20 .23 .20
Chemistry (18) .26 .04 .22 .20 (180) .20 .2 .28 .27
Mathematics ( 8) -.26 .75 .01 .45 ( 54) .29 .48 .19 .36
Computer Science ( 9) .42 .24 .52 -.16 ( 84) .17 .14 .36 .20
Economics (10) .OS .58 .40 -.09 (104) .10 .19 .27 .26
All Quantitative (45) .10 .37 .10 .11 i,22) .17 .23 .28 .26
Nc,te: These anal,ses are based on all cases providing information required toidentify their ethnic-group membership. Nonrespondents to the backgroundquestion on ethnicity are, therefore, excluded. The minority classificationincludes all groups other than self-designated white candidates who comprisethe nonminority sample. The coefficients tabled are based on pooled,departmentally standardized variables.

The GRE verbal score appears to be particularly effective in the minority samplein the all verbal analysis as does the GRE quantitative score in the all quantitativeanalysis. In five of the eight analyses by field, the coefficient for the GREanalytical score was somewhat higher in the minority than in the nonminority sample;the same was true in six of the eight analyses for the quantitative score and in fiveof the eight for the verbal.score. It seems reasonable to infer that the analytical
score works in about the same way for Minority as for nonminority students and moregenerally that the several predictors are certainly no less effective as potentialforecasters of performance for minorities than for nonminority students.
Women/Men. Correlational results by sex are shown in Table 12. Perhaps themost noteworthy observation regarding the data is that the patterns of coefficientsappear to be remarkably similar for the two sex groups. In the,all verbal analyses,
coefficients for verbal and analytical scores are slightly higher than the coefficientfor quantitative scores in both sex groups; in the all quantitative analysis, coeffi-cients for quantitative and analytical scores tend to be slightly higher than the.coefficient for verbal scores in both groups. With respect to SR-UGPA, the coefficientfor women is somewhat higher than that for men in six of the eight analyses by field,and this trend.holds in the pooled verbal and quantitative analyses as well.
Incremental Validity in Broad Groupings by Field
It would be desirable to examine the interrelationships of the variables byfield of study for each of the subgroups under consideration. However, it is vident'
that consideration of subgroups automatically results in a reduction of sampl,. sizeand increases the amount of,sampling error in the observed outcomes. Accordingly,
even though some potentially meaningful variation may be obscured when analyses are
based on broad groups of fields,, it was nonetheless considered desirable to restrictmultiple regression analyses of the data for subgroups to the broad verbal andquantitative classifications that have been used throughout the study.
Table 13 shows multiple correlation coefficients for selected combinations ofpredictors with respect to the graduate GPA criterion for (a) nonminority students,(b) minority students, (c) men, (d) women, and (e) for all students in pooledsamples from departments in the four verbal fields and the four quantitative fields,
respectively. Also shown is the variable with the highest zero-order coefficient.Data are presented in such a way as to indicate the change in multiple correlationwhen the analytical 'score is added to the traditional verbal and quantitative combina-tion as well as the contribution of the self-reported undergraduate'GRA when added
to the restructured battery.
First of all, for minorities the data suggest relatively little incrementalvalidity after taking into account the variable with the highest simple correlation-in these broad-field categories, either the verbal or the quantitative score wouldappear to be as effective as the entire set of predictors. For nonminority students,
however, some evidence of incremental validity may be seen: in verbal fields,
primarily for the SR-UGPA when added to the complete Aptitude Test battery, and inquantitative fields, bckth the analytical score and SR-UGPA appear to be contributinguniquely to the improvement of validity when added successively to the traditional.6rbai and quantitative combination. Among.men in verbal fields, adding the analyticalscore to the verbal and quantitative combination does not lead to a notable increase
in multiple correlation, and the further addition of SR-UGPA contributes only slightly.For women in verbal fields, the verbal, quantitative, and analytical combination is abit better than verbal alid quantitative scores; SR-UGPA appears to be contributingpotentially useful unique information regarding performance potential when added to
the restructured battery.
In the quantitative fields, for both sex groups, the multiple correlation (R)
increases with the addition of the anlytical,score and again with the addition of
SR-UGPA. It is of incidental interest to note that the multiples for women tend to
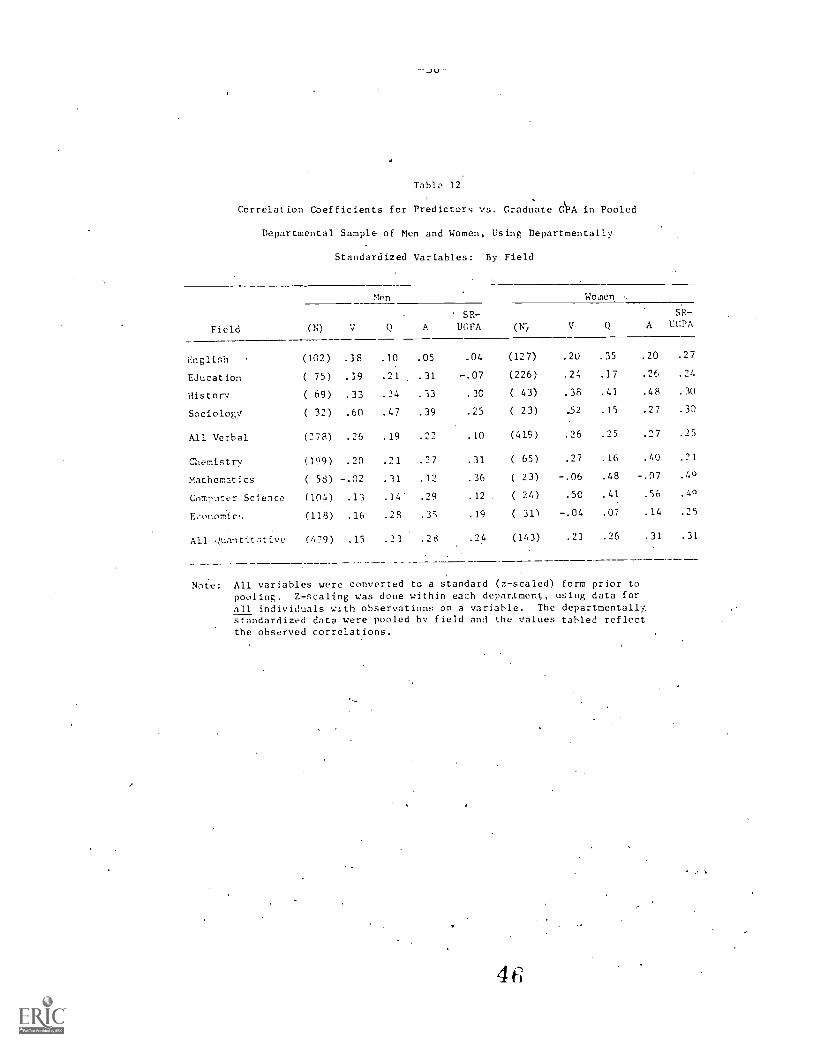
Table 12
Correlation Coefficients for Predictors vs. Graduate GPA in Pooled
Departmental Sample of Men and Women, Using Departmentally
Standardized Variables: By Field
Field
Men Women
(N) A
SR-
UGPA A
SR-UGPA
English (102) .18 .]0 .05 .04 (127) .20 .35 .20 .27
Education ( 75) .19 .21 .31 -.07 (226) .24 .17 .26 .24
History ( 69) .33 .24 .33 .30 ( 43) .38 .41 .48 .30
Sociology ( 32) .60 .47 .39 .25 ( 23) .52 .15 .27 .30
All Verbal (278) .26 .19 .22 .10 (419) .26 .25 .27 .25
Chemistry (199) .20 .21 .27 .31 ( 65) .27 .16 .40 .21
Mathematics ( 58) -.02 .31 .12 .36 ( 23) -.06 .48 -.07 .4,)
Comrater Science (104) .13 .14' .29 .12 ( 24) .50 .41 .56 .4q
Economics (118) .16 .28 .3i .19 ( 311 -.04 .07 .14 .25
All quantittive (479) .15 .23 .28 .24 (143) .2] .26 .31 .31
Note: All variables were converted to a standard (z-scaled) form prior to
pooling. Z-scaling I.:as done within each depar,tment, using data forall individuals with observations on a variable. The departmentally.standardized data were pooled by field and the values tabled reflectthe observed correlations.

Table 13
Multiple Correlatioa for Selected Combinations of Predictors
With Respect to Graduate GPA for Subgroups in
Primarily Verbal and Primarily Quantitative Fields
Group : Field
Combination of predictors
V,0 V,Q,A V,Q,A &SR-UGPA
(R) (R) (R)
Highest
zero-order
coefficient
NonMipority: Verbal .260 .270 .307 V ,228
Minority : Verbal .414 .416* .417* V .401
Nonminority: Quant .246 .302 .175 A .283
Quant .368 .372** .373** Q .366
Men : Verbal
Women : Verbal
.271 .274 V .259
.306 .315 .365 A .267
Men : Quant .239 .302** , 51*. A .281
Women : Quant .301 .348 :439** A .311
v,..
-..
All students: Verbal .284 .2n V .254
All students: Quant .260 .316** A .285
Note: These analyses are based on combined samples from verbal fields(English, education, history, soc;.c,logy) and quantitative fields(chemistry, mathematics, computer is c e, economic.:,). All arebased on z-scaled variables (within depa.7:t:nent) pr5.or to pooling.
* GRE -A variance is suppressed in this combinatlo:-_.
** GRE-V variance is suppressed in this comnacion.
-38
.be higher than those for met and that those for minorities (represented, it should beremembered, by very small samples from the respective fields) tend to be somewhathigher than those for nonminorities, especially in the verbal fields.*
On balance, incremental validity appears to be associated with the analyticalscore and SRUGPA in quantitative fields; but primarily with SRUGPA in verbal
fields. Obviously it must be remembered that verbal and quantitative scores and verylikely an actual UGPA were employed in screening whereas analytical scores (ifinstructions were followed) were not directly evaluated in screening candidates for
admission. Thus, the analytical score enjoys a potential advantage in any analysisof this type because its range has not been restricted due to direct selection. It
is also important to keep in mind, as suggested earlier, that the broad field classifications tend to obscure potential effects that might .be observed given adequatedata for individual fields of study.
Performance Relative to Expectation Based on GRE Scores: An Exploratory Analysis
It is believed that the correlational results that have been reviewed permit arather strong inference that the correlational validity of the GRE Aptitude Testprobably is quite comparable for minority and nonminority students, and for men
and women. These correlational results, derived from pooled data samples for therespective subgroups, are consistent with evidence/generated in numerous studies inundergraduate and professional school settings (e.g., Breland, 1978; Linn, 1975;
Schrader and Pitcher, 1976; Wilson, 1980, 1981).
Using data from relatively large samples of entering students in each of severalcolleges or law schools, investigators in these settings have been able to answerquestions regarding not only the correlational validity of a set of standard admi87sions measures for various subgroups, but also the extent to which the observed
average level of academic performance of members' of a subgroup is consistent withexpectation based on scores on the admissions measures. ,Results of these studies.,:kiggest that a defensible procedure for generating estimates of expected performance
is to use a regression equation based on data for all students. However, investigations
of the comparative performance of subgroups in these settings have been-contextspecific: that is, they have. not used pooled data.
It should be apparnt that the data at hand for these subgroups of graduatestuderols do not permit contcxtspecific comparisons and thus provide only a verylimited b6.:tis for examirig questions of comparative performance (e.g., gradesrelative ro expectacion b;:sA on GRE scores). "However, an assessment of observedtrends in these data may svggest directions for future investigation and provide some
basis for inf:;rmeo specion about how subgroups may be performing relative toexpectation base:1 on (.;:iE Aptitude Test results.
By inspecting the zscore means in Table 10, for example, it is possible toidentify samples of minorities or women in which observed performance (zscaled GPAmean indicating deviation,from departmental GPA means in departmental standarddeviation units) appears to be inconsistent with expectation (given the averagedeviation in sigma units from departmental means on the Aptitude Test).
In the comparatively large sample of women in education, for example, despite,negative zscore means on the GRE Aptitude Test variables, the mean zscore for
graduate GPA is slightly above average (.04 sigma units); similarly, though the
sample is much smaller, women in computer science with a mean graduate GPA zscore of
*It is important to note that either analytical or verbal variance is being suppressedin several of these subgroup analyses, a pattern that was obseilyed in the basic
analyses based on data for all students (see Table 5 and, related discussion).
-39-
0.04 appearto be performing better than expected, given their consistently negative
z-scores on the Aptitude Test variables.
For minority students in two very small pooled samples (seven in history, and
nine in computer science), the observed mean graduate GPA z-scores of 0.00 and 0.01,
reflecting essentially average performance, are associated with rather markedly
negative standings on the respective GRE predictors.
These particular instances of observed-performance that is not consistent with
standing on GRE scores reflect trends in very limited samples, and the results should
not be overemphasized. By looking a bit more systematically at trends for the
two broad classifications of fields (i.e., the all verbal and the all quantitative
samples, however, it may be possible to obtain a somewhat better,,but obviously still
quite limited, perspective on. the question of performance relative to expectation
based on GRE scores.
The data provided in Table 14 reflect the results of a comparison of observed
z-score means for graduate GPA with expected z-score means for minorities, women, and
men in the all verbal and all quantitative samples. Expected z-score graduate GPA
means for subgroups in the all verbal sample were based on a regression equation
developed by using data for all students in verbal fields'(including students who
couA not be classified with respect to subgroup membership) and in the quantitative
f{elds analyses a similarly developed regression equation for combining GRE Aptitude
Test scores was used.
For the minority sample in verbal fields, the observed graduate GPA z-score mean
of -0.22 was essentially consistent with the mean expected z-score of -0.24; however,
in quantitative fields, minority students averaged more than four-tenths of a standard
deviation below departmental CPA means (mean z-score = -0.41), while on the basis of
their GRE scores (using the general quantitative-sample equation) their expected
standing was considerably higher (mean z-score = -0.17).
For women in verbal fields, observed standing was slightly higher than expected,
while the opposite was true for them in the quantitative fields. For men in verbal
fields, observed GPA standing was slightly lower than expected, while, they did
slightly better than expected in the quantitative fields.
The only discrepancy that appears to be relatively pronounced is that observed
for minority students in the quantitative fields. ;The observed z-scaled graduate
GPA mean (-0.41) was considerably lower than the estimate (-0.17) based on GRE scores
as combined, using the total sample, all-quantitative-fields regression equation
applicable to z-scaled GRE scores.
These findings suggest possible directions for inquiry but they clearly do not
provide a basis for conclusions. They point to the urgent need for the development
of studies designed to deal specifically with questions regarding the comparative
performance of subgroups.
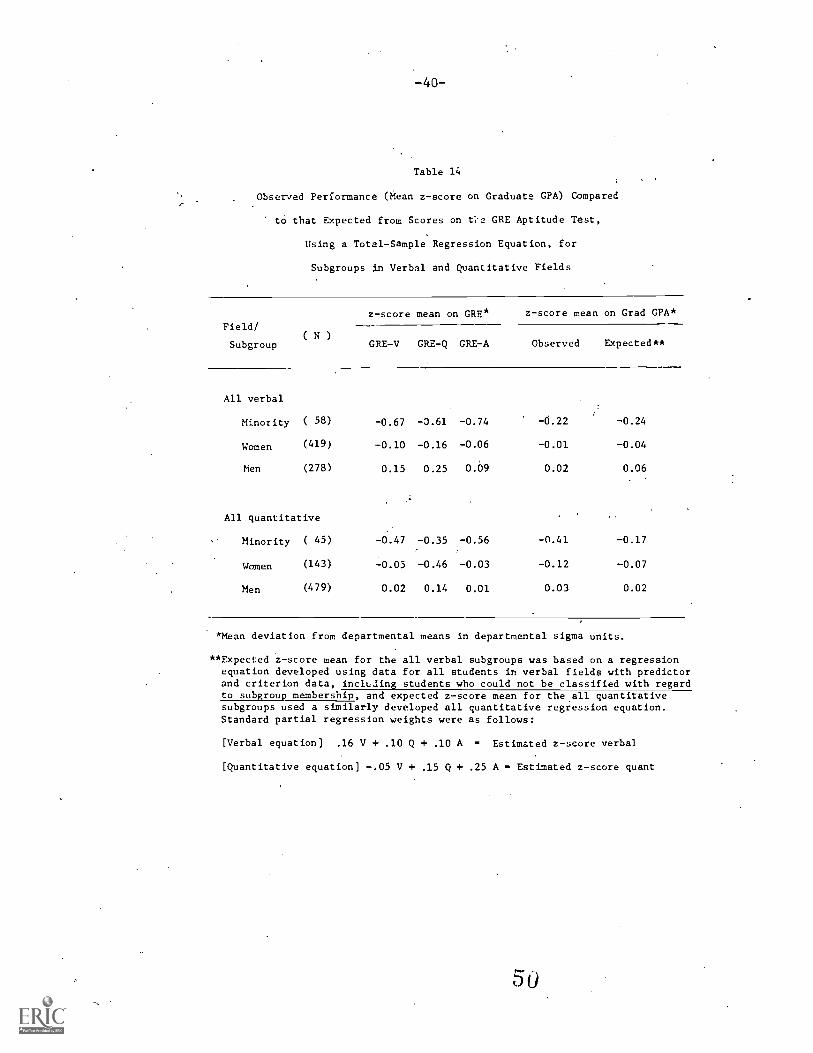
-40--
Table 14
Observed Performance (Mean z-score on Graduate CPA) Compared
to that Expected from Scores on t;.a GRE Aptitude Test,
Using a Total-Sample Regression Equation, for
Subgroups in Verbal and Quantitative Fields
Field/
z-score mean on GRE* z-score mean on Grad GPA*
Subgroup( N )
GRE-V GRE-Q GRE-A Observed Expected**
All verbal
Minority ( 58) -0.67 -0.61 -0.74 -0.22 -0.24
Women (419) -0.10 -0.16 -0.06 -0.01 -0.04
Men (278) 0.15 0.25 0.09 0.02 0.06
All quantitative
Minority ( 45) -0.47 -0.35 -0.56 -0.41 -0.17
Women (143) -0.03 -0.46 -0.03 -0.12 -0.07
Men (479) 0.02 0.14 0.01 0.03 0.02
*Mean deviation from departmental means in departmental sigma units.
**Expected z-score mean for the all verbal subgroups was based on a regressionequation developed using data for all students in verbal fields with predictorand criterion data, inchiing students who could not be classified with regardto subgroup membership, and expected z-score mean for the all quantitativesubgroups used a similarly developed all quantitative regression equation.Standard partial regression weights were as follows:
[Verbal equation] .16 V + .10 Q + .10 A = Estimated z-score verbal
[Quantitative equation] -.05 V + .15 Q + .25 A - Estimated z-score quant
-41-
Section VI. Concluding Observations
The evidence that has been, reviewed indicates clearly that the restructured GRE
Aptitude Test, 'like its predecessor, provides information of value for predicting
first-yea performance in graduate,study'and that this information usefully supple-
ments that provided by the undergraduate academic record.
Because of (a) its relatively close relationship (correlations at the .7 level)
with the verbal and quantitative measures, whose' predictive value had been firmly
established, and (b) its demonstrated relationship with self-reported undergraduate
grade-point average, the analytical score was expected from the outset 'to have
predictive validity resembling that of the verbal and quantitative scores (ETS,'
1977). The evidence provided by this study suggestS strongly that this particular
expectation was well grounded. For example (from Table 3):
o In three of four fields designated as quantitative (all but mathematics), obServed
validity coefficients for'the analytical score were slightly higher than thosefor
the quantitative score (and values for both quantitative and analytical scores
were higher than those for the verbal score.
o In the verbal fields, the observed pattern of coefficients for Aptitude Test
scores was not consistent. In the comparatively largepooled education sample,
The analytical score came out ahead in the correlational. competition with the
verbal and quantitative scores GRE-Q; in history, the value for analytical paralled
that for verbal (in the .30 range); in sociology the analytical coefficient (in
the .30 range) was substantially' overshadowed by an atypically. high verbal coeffi-
cient (in the .6. range); and, in English, the analytical score was only weakly
associated with first-year GPA (in the .10 range) but so was the verbal score (in
the .20 range, a value considerably lower than that estimated for pooled English
samples in the Cooperative Validity Studies Project [Wilson, 1979].
o Findings for the two broad classifications of fields suggeSt that, in the all
verbal fields analyses, the validity coefficient for the analytical score tended
to parallel those for the verbal and quantitative scores, and in the all quanti-
tative fields analyses validities for the analytical and quantitative scores were
comparable.
While the evidence reviewed in this study confirms rather clearly the a priori
expectation of predictive utility for the analytical measure, per se, it must be
characterized as quite inconclusive with respect to questions regarding the extent to
which information provided by the analytical score might supplement that provided by
the verbal and quantitative scores, and/or whether the analytical measure might prove
to be of supplemental value generally or only in specific fields of study.
First, to iterate for the last time a point that has been made repeatedly
throughout this report because of its importance, during the period in which the
students in this study were applying for admission to graduate school, schools and
departments were advised by the GRE Program not to consider analytical scores pending
the collection of evidence regarding their predictive validity in graduate school
settings. Assuming that this advice was followed, observed coefficients for verbal
and quantitative scores would be attenuated due to direct selection whereas the
coefficients for analytical scores would be affected by indirect selection only.
Thus, analytical scores entered this particular postselection correlational competi-
tion with something of an advantage; and all comparative analyses are to some extent
biased in favor of this new measure.
Second, elements of mutual redundancy of information are introduced when the
three Aptitude Test scores are treated as a battery (see Table 5 and related discus-
sion). For example, in 6 of 10 regression analyses involving various combinations of
Aptitude Test scores, the contribution of either the verbal or the - analytical score
-42-
to the optimally weighted composite was indirect, through suppression, rather than
direct. In three of the analyses (English, sociology, mathematics), analyticalvariance was suppressed, while in the three others (computer science, economics, andthe all quantitatiVe fields sample), verbal variance was suppressed.
Given these circumstances, the evidence regarding incremental validity associatedwith the new analytical score and evidence regarding the relative contribution toprediction of the three Aptitude Test scores when they are treated as a battery does
not provide a basis for firm conclusions.
Generally speaking, in the primarily quantitative fields, a quantitative-analytical composite appeared to be better than a verbal-quantitative composite,and the multiple correlation (with graduate grades) of quantitative and analyticalscores only tended to be about as great as the multiple for all three Aptitude Test
scores. On the ether hand, in the verbal fields, except for education, validities ofverbal - quantitative composites were either approximately equal to or slightly higherthan those for combined verbal and analytical scores.
On balance, findings of this nature suggest that the analytical score may tendto be more effective in the quantitative than in the verbal areas under consideration.
However, it is perhaps most useful to consider the observed findings as an initialreference point whose interpretive value will be enhanced when viewed in the light of
subsequent validation research. Replication involving samples from the same set of
fields as that involved in the present study would be highly useful. Would we.see,
for example, in a second set of chemistry, computer science, and economics samples,the predictive advantage observed for the analytical measure in the present samples?
It seems quite important to make an active effort to encourage the early partici-
pation of departments from the eight fields involved in the present study in the
regularly scheduled GRE Validity Study Service in order to facilitate replication.
In general, it is important to recognize the analytic potential, especially in
graduate level validation research, of pooled within-group (within-department)
matrices of predictor-criterion ,intercorrelations. Given procedures that generate
comparable data sets from a representative sample of small departments within each of
the major disciplinary groupings on a planned, systematic basis, marked progressmight be made in resolving questions such as those under consideration in this
study.
The value of such pooling procedures has been demonstrated in a variety of ways
in this study. Further exploration of the assumptions underlying these proceduresclearly is in order, but they have provided a basis for generating useful information
regarding the correlational validity Gf GRE scores by employing data for a large
number of samples, no one of which individually could support an "interpretable"
validity study.
Finally, results of the exploratory subgroup analyses provide evidence suggestingthat the correlational validity of GRE Aptitude Test scores is at least as great for
minority as for nonminority students and is comparable for men and for women.Limited evidence has been provided regarding the performance of subgroups relative to
expectation based on GRE scores using a general equation in analyses clearly thought
of as exploratory in nature. Additional studies involving subgroup prediction are
needed.
-43
References
Breland, H. M. Population validity and college entrance measures (ETS RB-78-6).
Princeton, NJ: Educational Testing Service, 1978.
Conger, A. A revised definition for suppressor variables A guide to their inter-
pretation and interprediction. Educational and Psychological Measurement, 1974,
34, 35-46.
Darlington, R. B. Multiple regression in psychological research and practice.Psychological Bulletin, 1968, 69, 161-182.
Educational Testing Service. 1977-78 Guide to the use of the Graduate Record
Examinations. Princeton, NJ: Author,'1977.
Linn, R. L., Harnisch, De L., & Dunbar, S. B. Validity generalization and situational
specificity: An analysis of the prediction of.first-year grades in law school.
Applied Psychological Measurement, 1981, 5, 281-289.
Linn, R. L., Harnisch, D. L., & Dunbar, S. B. Corrections for range restriction: An
empirical investigation of conditions resulting in conservative corrections.
Journal of Applied Psycltill2gx, 1981a, 66, 655-663.
Linn, R. L. Test bias and the prediction of grades in law school. Journal of Legal
Education, 1975, 27,:293-323.
McNOmar, Q. Psychological statistics. New York: John Wiley, 1949.
Miller, R., &Wild, C, L. (Eds.). Restructuring the Graduate Record Examinations
Aptitude Test (GRE Board Technical Report). Princeton, NJ: Educational Testing
Service, 1979.
Schrader, W. B., & Pitcher, B. The interpretation of Law School Admission Test
scores for culturally deprived candidates. Report #LSAC -72 -4. In Law School
Admission Council Reports of LSAC Sponsored Research: Volume II, 1970-74.
Princeton, NJ: Law School Admission Council, 1976.
Tzelgov, J. T., & Stern, I. Relationships between variables in three variable
linear regression and the concept of suppressor. Educational and Psychological
Measurement, 1978, 38, 325-335.
Velicer, W. F. Suppressor variables and the semipartial correlation coefficient.
Educational and Psychological Measurement, 1978, 38, 953-958.
Willingham, W. W. Predicting success in graduate education, Science, 1974, 183,
273-278.
Wilson, K. M. The contribution of measures of aptitude (SAT) and achievement (CEEB
achievement average), respectively, in forecasting college grades in several
liberal arts colleges (RB-74-36). Prindeton, Educational Testing Service,
1974.
Wilson, K. M. The validation of GRE scores as predictors of' first-year performance
in graduate study: Report of the GRE Cooperative Validity Studies Project
(GRE-GRES No. 75-8R). Princeton, NJ: Educational Testing Service, 1979.
Wilsbn, K. M. The performance of minority students beyond the freshman year:
Testing a "late bloomer" hypothesis in one state university setting. Research
in Hi her 1980, 13, 23-47.

-44-
Wilson, K. M. Analyzing the long-term performance of minority and nonminoritystudents: A tale of two studies. Research in Higher Education, 1981, 11,
351-375.'

A-1
APPENDIX A.
Letter of invitation Co participate in. the study
A-2 Overview of study procedures
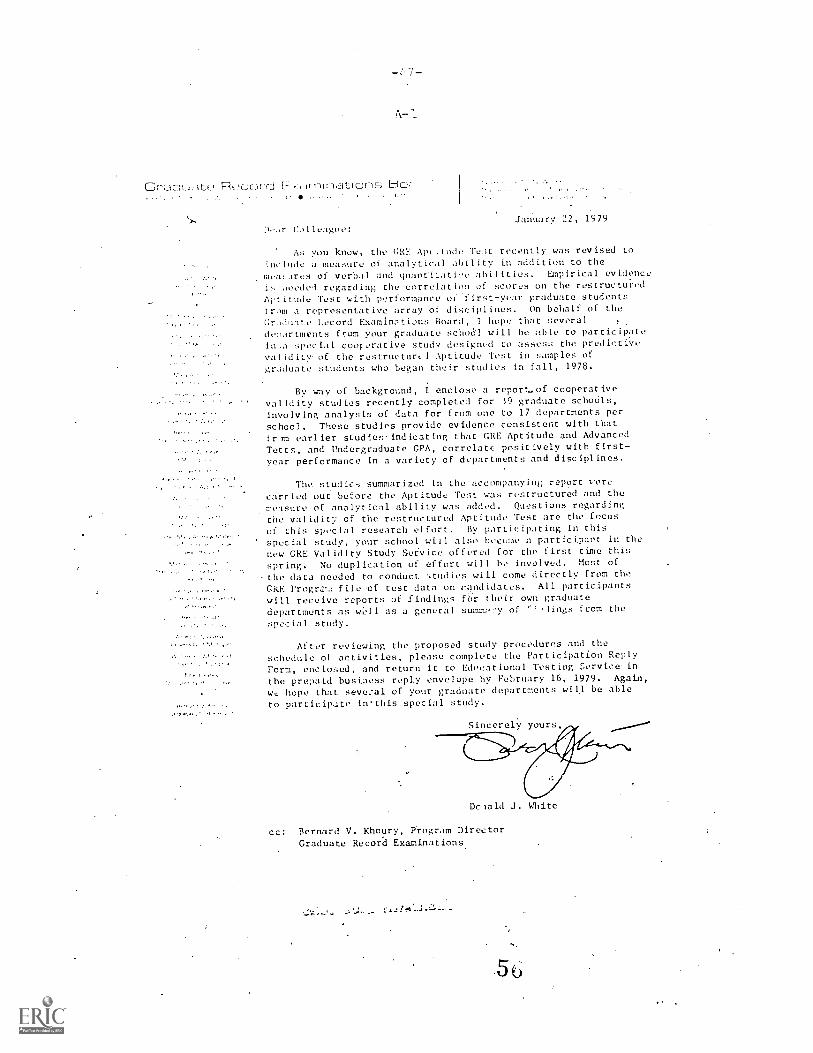
Er E rue e_Itions Edo;.
Dear Colleague:January 22, 1979
As you know, the GRE ApL.tude Test recently was revised totnclude a measure of analytical ability in addition to themeasares of verbal and quantitative abilities. Empirical evidence
is ueeded regarding the correlation of scores on the restructured
Aptitude Test with performance oi first-year graduate studentstram a representative array of disciplines. On behalf of the
Graduate lecord Examinations Board, I hope that severaldepartments from your graduate schoill will be able to participatein.a special cootarative study designed to assess the predictivevalidity of the restructure) Aptitude Test in samples ofgraduate students who began their studies in fall, 1978.
By way of background, I enclose a report, of cooperativevalidity studies recently completed for 39 graduate schocils,involving analysis of data for from one to 17 departments per
school. These studies provide evidence consistent with thatfrom earlier studies indicating that GRE Aptitude and AdvancedTetts, and Undergraduate GPA, correlate positively with first-year performance in a variety of departments and disciplines.
The studicu summarized in the accompanying report verecarried out before the Aptitude Test was restructured and themeasure of analytical ability was added. Questions regarding
the validity of the restructured Aptitude Test are the focusof this special research effort. By participating in thisspecial study, your school will also become a participant in thenew GRE Validity Study Service offered for the first time this
spring. No duplication of effort will be involved. Most of
the data needed to conduct. ',tudies will come directly from theGRE Progra'a file of test data on candidates. All participantswill receive reports of findings fO'r their own graduatedepartments as well as a general summary of `t-Aings from thespecial study.
After reviewing the proposed study procedures and theschedule of activities, please complete the Participation ReplyForm, enclosed, and return it to Educational Testing Service inthe prepaid busiaess reply envelope by February 16, 1979. Again,
we hope that several of your graduate departments will be able
to participate in'this special study.
Sincerely yours,
Dclald J. White
cc: Bernard V. Khoury, Program DirectorGraduate Record Examinations
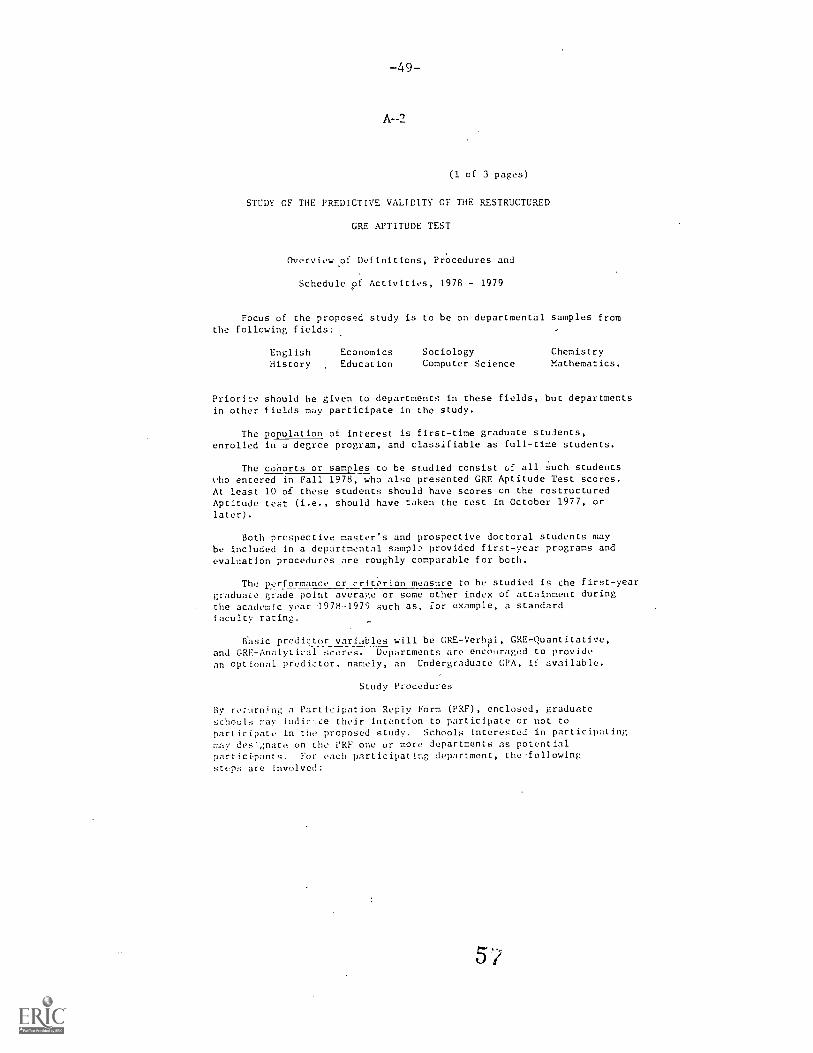
-49-
A-2
(1 of 3 pages)
STUDY OF THE PREDICTIVE VALIDITY OF THE RESTRUCTURED
GRE APTITUDE TEST
Overview of Definitions, Procedures and
Schedule of Activities, 1978 - 1979
Focus of the proposed study is to be on departmental samples fromthe following fields:
English Economics Sociology ChemistryHistory Education Computer Science Mathematics.
Priority should he given to departments in these fields, but departmentsin other fields may participate in the study.
The population of interest is first-time graduate students,enrolled in a degree program, and classifiable as full-time students.
The cohorts or samples to be studied consist of all such students;'ho entered in Fall 1978, who also presented GRE Aptitude Test scores.At least 10 of these students should have scores on the restructuredAptitude test (i.e., should have taken the test in October 1977, orlater).
Both prospective master's and prospective doctoral students maybe included in a departmental sampl: provided first-year programs andevaluation procedures are roughly comparable for both.
The p.,_?rformance or criterion measure to he studied is the first-yeargraduate grade point average or some other index of attainment duringthe academic year 1978-1979 such as, for example, a standardfaculty rating.
Basic predictor variables will be ORE-VerhO, GRE-Quantitative,and GRE-Analytical scores. Departments are encouraged to providean optional predictor, namely, an Undergraduate CPA, if available.
Study Procedures
By rerarning a Participation Reply Form (PRP), enclosed, graduateschools may indicce their intention to participate or not toparticipate in the proposed study. Schools interested in participatingmay des:4nate on the PRP one or more departments as potentialparticIpants. For each participating department, the-followingsteps are involved:
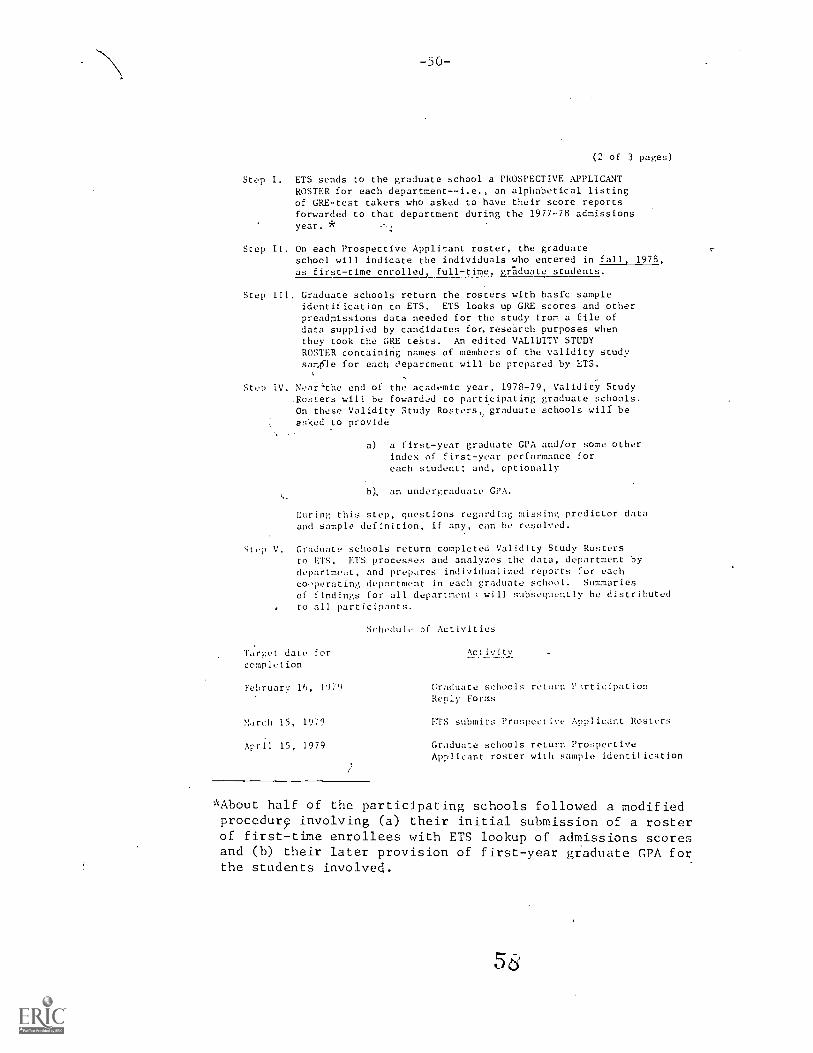
-50-
(2 of 3 pages)
Step I. ETS sends to the graduate school a PROSPECTIVE APPLICANTROSTER for each department--i.e., an alphabetical listingof GRE-test takers who asked to have their score reportsforwarded to that department during the 197778 admissionsyear. *
Step II. On each Prospective Applicant roster, the graduateschool will indicate the individuals who entered in fall, 1978,as first-time enrolled, full-time, graduate students.
Step II1. Graduate schools return the rosters with basic sampleidentification to ETS. ETS looks up GRE scores and otherpreadmissions data needed for the study from a file ofdata supplied by candidates for, research purposes whenthey took the GRE tests. An edited VALIDITY STUDYROSTER containing names of members of the validity studysam0-le for each department will be prepared by ETS.
Step IV. Near''the end of the academic year, 1978-79, Validity StudyRosters will be foward,?d to participating graduate schools.On these Validity Study Rosters graduate schools will beasked to provide
a) a first-year graduate GPA and/or some otherindex of first-year performance foreach student; and, optionally
b), an undergraduate GPA.
During this step, questions regarding missing predictor dataand sample definition, if any, can be resolved.
Step V. Graduate schools return completed Validity Study Rostersto US. ETS processes and analyzes the data, department bydepartmeut, and prepares individualized reports for eachcooperating department in each graduate school. Summaries
of findings for all department.: will subsequently be distributedto all participants.
Schedule 3f Activities
Target date for Activity
completion
February 16, 1979 Graduate schools return ParticipationReply Forms
March 15, 19;9
April 15, 1979
ETS submits Prospective Applicant Rosters
Graduate schools return ProspectiveApplicant roster with sample identification
*About half of the participating schools followed a modifiedprocedur9 involving (a) their initial submission of a rosterof first-time enrollees with ETS lookup of admissions scoresand (b) their later provision of first-year graduate CPA forthe students involved.
June 1, 1979
August 6-; 1979
-51-
(3 of 3 pages)
ETS sends Validity Study Rosters tograduate schools for collectionof first-year grade point averageplus (optional) predictor and/orcriterion data on each student.
Graduate schools return completedValidity Study Roster to ETS.
If there are questions about the study procedures, please write
or call collect, as follows:
Kenneth M. Wilson 609-921-9000, extension 2391R-208Educational Testing ServicePrinceton, NJ 08541
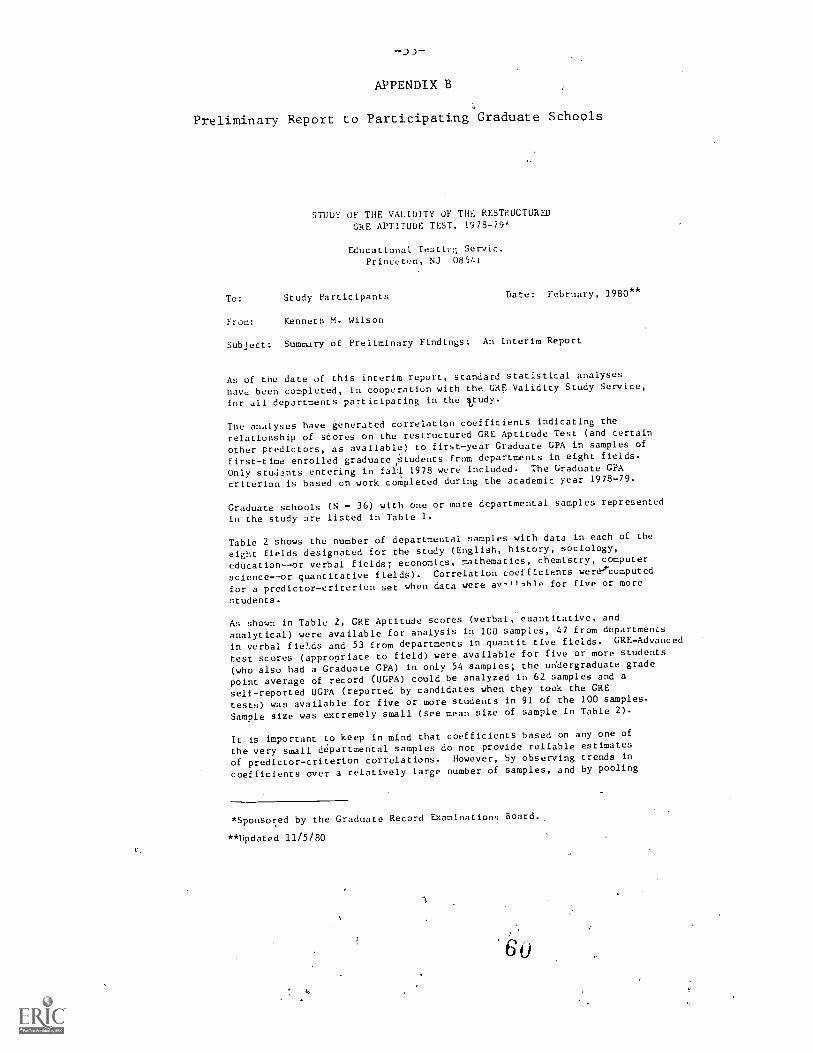
APPENDIX B
Preliminary Report to Participating Graduate Schools
To:
From:
STUDY OF THE VALIDITY OF THE RESTRUCTUREDGRE APTITUDE. TEST, 1978-79*
Educational Testiv;; Servic:Princeton, NJ 0854i
Study Participants Date: February, 1980**
Kenneth M. Wilson
Subject: Summary of Preliminary Findings: An Interim Report
As of the date of this interim report, standard statistical analyses
have been completed, in cooperation with the, GRE Validity Study Service,
for all departments participating in the Study.
The analyses have generated correlation coefficients indicating the
relationship of scores on the restructured GRE Aptitude Test (and certain
other predictors, as available) to first-year Graduate GPA in samples of
first-time enrolled graduate students from departments in eight fields.
Only studants entering in fall 1978 were included. The Graduate GPA
criterion is based on work completed during the academic year 1978-79.
Graduate schools (N a 36) with one or more departmental samples represented
in the study are listed in Table 1.
Table 2 shows the number of departmental samples with data in each of the
eight fields designated for the study (English, history, sociology,
educationor verbal fields; economics, mathematics, chemistry, computer
science - -or quantitative fields). Correlation coefficients were'.'computed
for a predictor-criterion set when data were av- '' -nhle for five or more
students.
As shown in Table 2, GRE Aptitude scores (verbal, cuantitative, and
analytical) were available for analysis in 100 samples, 47 from departments
in verbal fieds and 53 from departments in quantit tive fields. GRE-Advanced
test scores (appropriate to field) were available for five or more students
(who also had a Graduate GPA) in only 54 samples; the undergraduate grade
point average of record (UGPA) could be analyzed in 62 samples and a
self-reported UGPA (reported by candidates when they tack the GRE
tests) was available for five or more students in 91 of the 100 samples.
Sample size was extremely small (see mean size of sample in Table 2).
It is important to keep in mind that coefficients based on any one of
the very small departmental samples do not provide reliable estimates
of predictor-criterion correlations. However, by observing trends in
coefficients over a relatively large number of samples, and by pooling
Sponsored by the Graduate Record Examinations Board.,
**Updated 11/5/80
Go
-2-
data from departments in the same field, meaningful infcrences,regardingpredictor-criterion relationships can be drawn (Wilson, 1979).'
In this-context, we are now able to provide preliminary estimates ofcorrelational validity coefficients for the respective predictors' withregard to a common, first-year CPA criterion based on pooled data.' Motespecifically, the pooled estimates shown in Table 3 indicate the predictor-criterion correlation obtained for the total lumber of students inseveral similar departments fe.g., several English departments) when2allvariables were standardized within each department ;riot to pooling.
In evaluating the estimated coefficients for the three aptitude scores in
Table 3, it is important to note that all graduate schools and departmentrwere asked by the GRE program not to consider the CAE-Analytical scoee inadmissions, pending the collection of empirical evidence regarding itsvalidity. When a variable is considered directly in the selectionprocess, -the range of, scores among enrolled students is reduced andthere tends tc be a corresponding restriction on the correlation betweenthat variable and a performance criterion. 'Thus, CRE-Analytical enjoyssoMe "advantage" by not having been directly involved in the selection
process.
Data for the restructured CRE,Verbal and GRE-Quantitative, GRE-Advanced,and UCPA, shown in Table 3, were combined with data for these predictorsas developed during the GRE Cooperative Validity Studies Project. The
resulting pooled estimates of validity shown in Table 4, like those in
Table 3, are based on variables standardized within department.
Multiple regression analyses based on pooled data haVe not been completed.Accordingly, questions regarding the relative weighting of GRE-V, GRE-Q,and GRE-A cennot he addressed directly at this time. 'Analyses concernedwith incremental correlational validity, relative weighting, and suppression
'Wilson, K. M. The validation of GRE scores as predictors of first-yearperformance in graduate study: ,Report of the GRE Cooperative Validity
Studies Project, GREG No. 75-8R. Princeton, N.1.: Educational Testing
Service, 1979.
2 Since the relationship between GRE scores and grades tends to bepositive in samples differing markedly in mean level of GRE scores,Jc may be inferred that these coefficients are lower than would beobserved if all students in the pooled samples were "competing" for
grades in one large department.
3GRE-A scores, cf coarse, were not available for students includedin toe earlier studies, since this test was first administered in October
1977.
3effects (e.g., negative multiple regr.!!-.ion weight for a predictor with apositive correlation with the critetionwill shed useful light on therote of GRE - Analytical ability score:: relative to the other measures.
It is of incidental interest to note that the correlational validitycoefficients for self-reported UGPA tend to parallel, roughly', those forthe university repor.tod UGPA, suggesting a potentially useful researchrole for the self-report variable. Evidence generated in analysesinvolving the self-reported UGPA may provide a basis for inferences aboutthe "official" UGPA (which may not be computed systematically in alladmissions contexts).
Departmental Findings
Findings for your graduate school are attache as Exhibit 1.4-
Findings reported for each departmental sample include (a) the correlationbetween each predictor and the Graduate GPA criterion (and other criterionvariables, if provided), (b) the minimum and maximum value for each variable,(c) the arithmetic mean and the standard deviation for each variable, and
r(d) the number of studentS' with observations on each variable. The N
reported for the Graduate GPA (or other criterion variable) representsthe maximum frfnr any correlation coefficient reported. In assessingfindings for the department(s) from your graduate school, it is quiteimportant to keep the following considerations in mind:
0 The predictor- criterion correlation coefficients reported in thecolumn headed "r" (handwritten) may be based on as few as fivecases, and simply describe thb nature of covariation betweenpairs of observations in a very small sample.
o The underlying relationship between GRE scores or undergraduategrades and first-year graduate grades (or other criteria of successful performance in graduate study) is expected to be positive. Th
is supported by the summary findings in Tables 3 and,4, evidencefrom previous correlational validity 'studies in academic settings,and evidence of the positivtily interrelated organization of humanabilities generally.
o Negatrve correlations between academic predictors and academiccriterion variables may occur due to sampling fluctuation in verysmall sampleg such as those involved in these studies.
4For departments with Ns greater than 10 for any predictor-criterion
set, the GRE Validity Study' Service i9 preparing a detailed report of
findings.
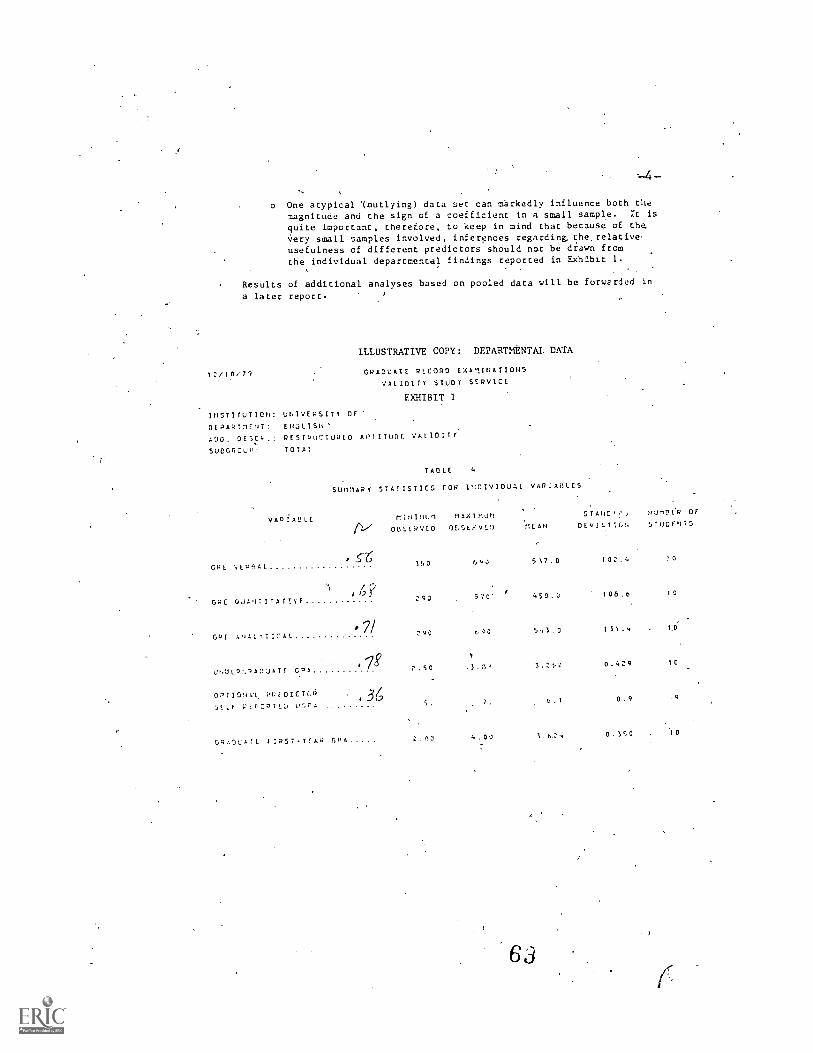
o One atypical '(outlying) data set can markedly influence both themagnitude and the sign of a coefficient in a small sample. rt is
quite important, therefore, to keep in mind that because of the,Very small samples involved, inferences regarding. the, relative.usefulness of different predictors should not be drawn fromthe individual departmental findings reported in Exhibit 1.
Results of additional analyses based on pooled data will be forwarded in
a later report.
ILLUSTRATIVE COPY: DEPARTMENTAL. DATA
12/10/79 GRADUATE RECORD EXAnINATIONSVALIDITY STUDY SERVICE
EXHIBIT 1
INSTITUTION: UNIVERSITY OF'
DEPARTT1TNT: EN3LIS11'
ADO. DESET,.: RESTRUCTURED APIITUDE VALIDITY
SUBGROUP: TOTAL
VAS AO Li
TABLE 4
SUNMAPY STATISTIC; FOR INDIVIDUAL VAREABLES
rf:NINU1 MAXIMUM STAND' d UUMPCP OF
OBSERVED OLSLPVLD MEAN DEvIATIGI: STUDENTS
.5-6 353 540 517.0 102,4001 ,ir.pnt.t
/6?290 570' 458.0 108.6 10
GRE OUANTITATTVE
G "E ANALYTICAL
Or,L1TPT..A3UATE DPA
?I 290 690 543.0 131,4
eILO 2.50 3.DA 3,2t.0 0.429 10
OPTIONAl. p0EDICTC
'I LT PLPORTETJ LIPA, 3,6
f:PSY-Y:AW GPA ,53
0.1 0 . 9
4.00 3.6.24 0.150 10

TABLE 1
GRADUATE SCHOOLS PARTICIPATING IN THE RESTRUCTURED APTITUDE
VALIDITY STUDY: DATA FOR THE ACADEMIC YEAR 1978-79
UNIVERSITY OF.OKLAHOMA
TEXAS TECHNOLOGICAL UNIVERSITY
UNIVERSITY OF IC WA
LOUISIANA STATE UNIVERSITY
IOWA STATE UNIVERSITY
TEXAS AgM UNIVERSITY
UNIVERSITY OF VIRGINIA
UNIVERSITY OF NORTH CAROLINA
UNIVERSITY OF MARYLAND
UNIVERSITY OF FLORIDA
UNIVERSITY OF CENTRAL FLORIDA
FLORIDA STATE UNIVERSITY
UNIVERSITY OF WASHINGTON
UNIVERSITY OF SOUTHERN CALIFORNIA
UNIVERSITY OF COLORADO (BOULDER)
UNIVERSITY OF SAN DIEGO
UNIVERSITY OF CALIFORNIA (DAVIS)
WASHINGTON STATE UNIVERSITY
SAN DIEGO STATE UNIVERSITY
COLORADO STATE UNIVERSITY
. UNIVERSITY OF MASSACHUSETTS
UNIVERSITY OF ROCHESTER
'UNIVERSITY OF PITTSBURGH
UNIVERSITY OF PENNSYLVANIA
SYRACUSE UNIVERSITY
SLNY AT STONY BROOK
SLNY AT ALBANY
WAYNE STATE UNIVERSITY' .
UNIVERSITY OF WISCONSIN
UNIVERSITY OF TENNESSEE
UNIVERSITY OF NOTRE DAME
UNIVERSITY OF CINCINNATTI
OHIO STATE UNIVERSITY
NORTHWESTERN UNIVERSITY
LOYOLA UNIVERSITY OF CHICAGO
JACKSON STATE UNIVERSITY
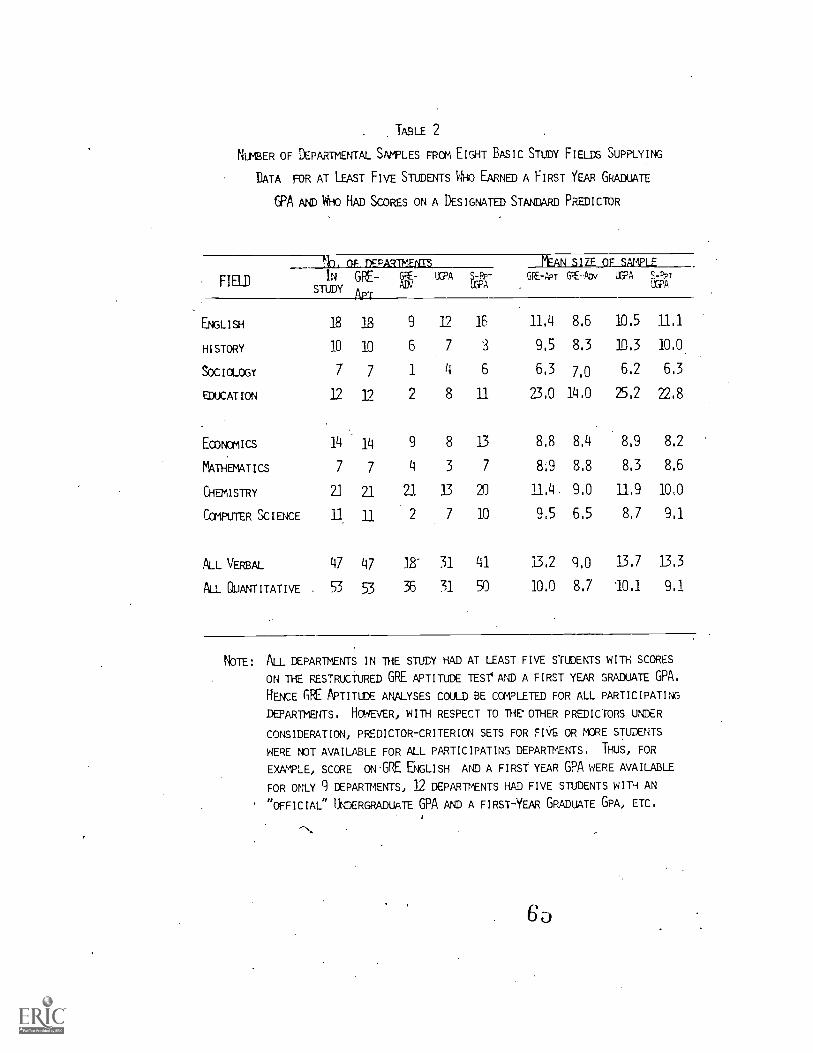
TABLE 2
NUMBER OF DEPARTMENTAL SAMPLES FROM EIGHT BASIC STUDY FIELDS SUPPLYING
DATA FOR AT LEAST FIVE STUDENTS WHO EARNED A FIRST YEAR GRADUATE
GPA AND WHO HAD SCORES ON A DESIGNATED STANDARD PREDICTOR
1-ELESEPAEMESIL__FIELD
IN GRE- a- IIPA
STUDYAPT
c-Pp7
riPAGfE-ApT GFEAN LeA SAT
IRA
ENGLISH 18 18 9 12 16 11,4 8.6 10,5 11,1
HISTORY 10 10 6 7 3 9,5 8.3 113 10.0
SOCIOLOGY 7 7 1 4 6 6.3 7,0 6.2 6.3
EDUCATION 12 12 2 8 11 23.0 14,0 25,2 22.8
ECONOMICS 14 14 9 8 13 8.8 8,4 8,9 8.2
MATHEMATICS 7 7 4 3 7 8,9 8.8 8.3 8.6
CHEMISTRY 21 21 21 13 20 11.4 9.0 11.9 10,0
COMPUTER SCIENCE 11 11 2 7 10 9,5 6.5 8,7 9.1
ALL VERBAL 47 47 18- 31 41 13.2 9,0 13.7 13.3
ALL QUANTITATIVE 53 53 36 31 50 10,0 8.7 10.1 9.1
NOTE: ALL DEPARTMENTS IN THE STUDY HAD AT LEAST FIVE STUDENTS WITH SCORES
ON THE RESTRUCTURED GRE APTITUDE TEST' AND A FIRST YEAR GRADUATE GPA,
HENCE GRE APTITUDE ANALYSES COULD BE COMPLETED FOR ALL PARTICIPATING
DEPARTMENTS. HOWEVER, WITH RESPECT TO THEOTHER PREDICTORS UNDER
CONSIDERATION, PREDICTOR-CRITERION SETS FOR FIVE OR MORE STUDENTS
WERE NOT AVAILABLE FOR ALL PARTICIPATING DEPARTMENTS, THUS, FOR
EXAMPLE, SCORE ON'GRE ENGLISH AND A FIRST YEAR GPA WERE AVAILABLE
FOR ONLY q DEPARTMENTS, 12 DEPARTMENTS HAD FIVE STUDENTS WIT-1 AN
"OFFICIAL" UNDERGRADUATE GPA AND A FIRST-YEAR GRADUATE GPA, ETC,1
6o
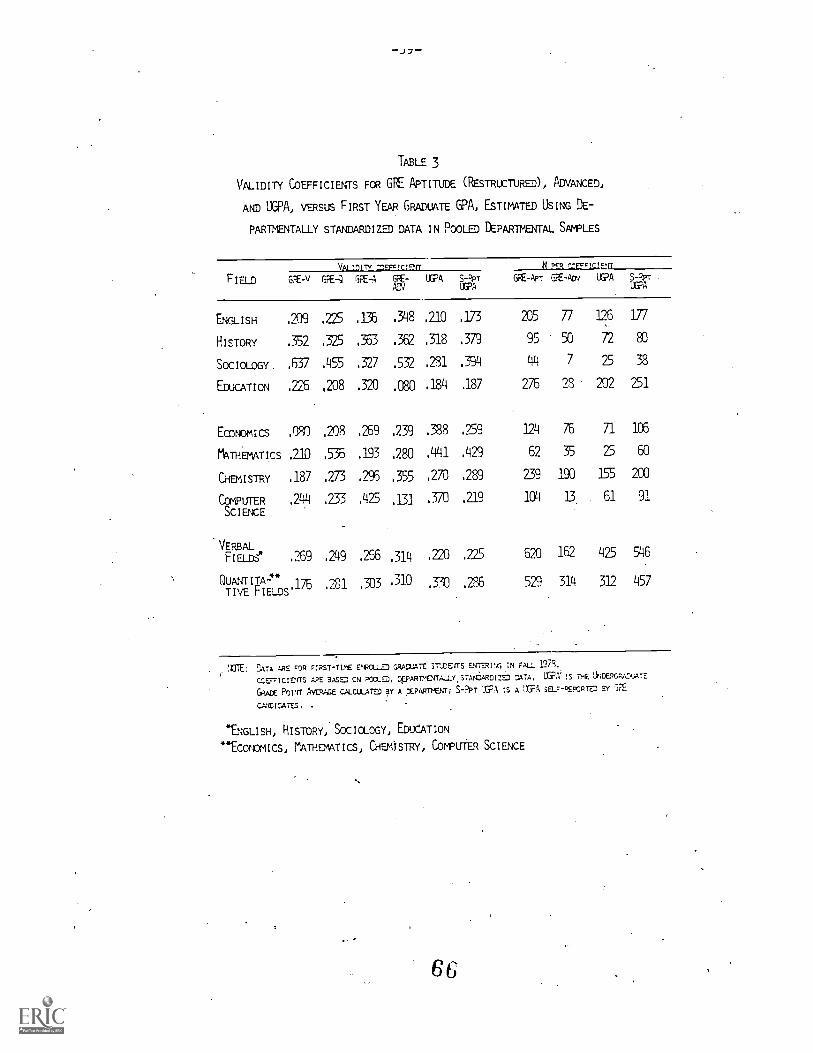
TABLE 3
VALIDITY COEFFICIENTS FOR GRE APTITUDE (RESTRUCTURED), ADVANCED,
AND TIPP, VERSUS FIRST YEAR GRADUATE GPA, ESTIMATED USING DE-
PARTMENTALLY STANDARDIZED DATA IN POOLED DEPARTMENTAL SAMPLES
FIELD
VALIDITY =EFFICIENT
PE- LOA SAFI'UYA
GRE-APT GRE*N USPA S-271.LGA
ENGLISH .209
HISTORY .352
SOCIOLOGY ,E37
EDUCATION .226
Economics .7)
MATHEMATICS .710
CHEMISTRY .187
COMPUTER .244
SCIENCE
VERBALFIELDS* .269
QUANT ITA-** 176FIELDS'FIELDS'
.225
.325
.455
,208
.208
.536
.273
.233
.249
-81'Z
.136
,363
.327
.320
.269
.193
.296
.425
.266
'133
.348
.362
.532
.080
.239
.280
.355
.131
.314
.310
.210
.318
.281
.184
.338
.441
.270
.370
.220
.370
.173
:319
.394
.187
.259
.429
.289
.219
.725
.286
205
95
44
276
124
62
239
104
620
529
77
50
7
28
76
35
190
13
162
314
126
72
25
202
71
25
155
61
425
312
177
83
38
251
106
60
200
91
546
457
1/TE: t"...ATA ARE FOR FIRST-TIME EN3CL.LD GRAM:ATE 3TLEENTS ENTERING IN FALL. 1.9.7,
CCEFFICIETTS APE BASED CN ROCCM, DPARTME[TALLY sTAt6aRotz lriPX :s THE Or:DVT,..C.A..ATE
. GRADE Pow AvtRAGE cALcu_ATs BY A pEPARTNENT: i-?PT :s A UGPA sELF-Pipcvm BY
C.ANCI5ATES. .
*ENGLISH, HISTORY, SOCIOLOGY, EDUCATION
**ECONOMICS, MATHEMATICS, CHEMISTRY, COMPUTER SCIENCE
ti
66
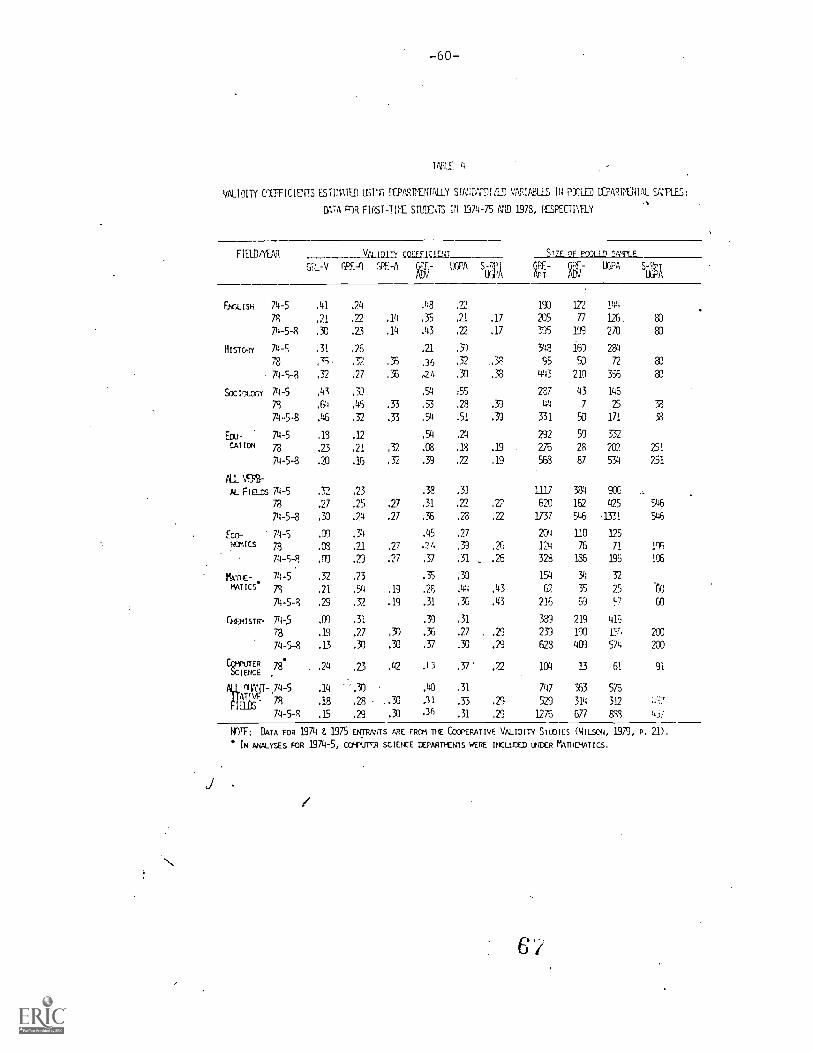
-60-
TARE 4
VALIDITY CITEICIENTS ESTIWITED USI5 ECPARMUITALLY S1A;;D22)IZ11) VARIABLES IN POOLED CUARP31TAL SA:PLES:
DATA P3R STIMTS IN 1_974-75 N1D 1978, RESPECTIVELY
FIELD/YEAR SQUIACILUT
g-Si 7r nF P2OLLD 2',MPLP
G1L-V GP -0 GPE-A UGPA S-RNUGI'A
FE-JP T
6RE-./
992AUCPA
FNGLISH 74-5 .41 .24 .48 .71 193 122 144
78 .21 ,22 .14 .35 .21 .17 235 77 126. 80
74-5-8 .30 .23 .14 ,43 .22 .17 395 199 270 80
HISTORY 74-5 .31 .26 .21 .3) 342 160 231
78 ,15-.7.,/" . 3 .36 .32 ,38 95 50 72 2
74-5-8 .32 .27 ,3 2 4 .30 .33 443 210 356 80
SOCICtO5Y 74-5 ,41 .30 .94 ;55 287 43 146
79 .64 .45 .33 .53 .28 .39 44 7 25 33
74-5-8 .46 .32 .33 .54 .51 .39 331 50 171 33
Ear 74-5 .18 .12 .51 .24 292 59 332CATICN 78
.23 .21 .32 .08 .18 .19 276 28 202 251
74-5-8 .20 .16 .32 .39 .72 .19 568 87 531 751
C. VERB-
AL F t r nc 74-5 .32
.27
.23
.25 .27
.38
.31
.31
.22 .22
1117
620
331
162
9Y3
425
74-5-8 .30 .24 .27 .36 .28 .22 1737 546 1331
Eco- 74 -5 ,09 .54 .45 .27 204 110 125
NOMICS 78 .C8 ,21 .27 .24 .39 ,K 124 76 71 105
79-5-1? .1'13 .29 .27 .37 .31 .26 328 136 196 106
PIAT1-E- 74-5 .32 .23 .35 .30 154 34 32
MATICS79 .21 .54 .19 .28 ,44 .43 62 35 25 6)
74-5-8 ,23 .32 .19 .31 .36 .43 216 69 57 60
CKMISTRY 74-5 .09 .31 .39 .31 389 219 419
7a .19 .27 .3) .36 .27 .29 239 190 17. 209
74-5-8 .13 .30 .30 .37 .30 .29 628 409 574 200
ER78
CMF1TICE.
.24 .23 .42 J 3 .37 . 22 104 13 61 91
fli.V)- ,74-5 .14 '.30 .40 .31 747 363 576E&
78 .18 .28 .30 .31 .33 .29 529 314 312 :,57
74-5-8 .15 .29 .30 .36 .31 .29 127G 677 898 (6%
NOIF: DATA FOR 1974 F. 1975 ENTRANTS ARE FROM TISE COOPERATIVE VALIDITY STUDIES (WILSON, 1979, P. 21),
IN ANALYSES FOR 1974-5, COMPUTRR SCIENCE tEPARTKN1S WERE acurcED UNDER MATHEMATICS.
Ktrunis OF A W.:FINICAL NATURE
Bo ldt, R. R. Comparison of a Bayesian and aLeast Squares Method of EducationalPrediction. GREB No. 70-3P, June1975.
Campbell, '..1. T. and Belcher, L. H.Word Associations of Students atPredominantly White and PredominantlyBlack Colleges. GREB No. 71 -6P,December 1975.
Campbell, J. T. and Donlon, T. F. Relation-ship of the Figure Location .Test toChoice of,,,Graduate Major. GREB No.75-7P, November 1980.
Carlson, A. B.; Reilly, R. R.; Mahoney, M.H.; and Casserly, P. L. TheDevelopment and Pilot Testing ofCriterion Rating Scales. GREE -No.73-1P, October 1976.
Carlson, A. B.; Evans, F.R.; and Kuykendall,N. M. The Feasibility of CommonCriterion Validity Studies of the GRE.GREB No. 71-1P, July 1974.
Donlon, T. F. An Exploratory Study of theImplications' of Test Speededness.GREB No. 76-9P, March 1980.
Donlon, 1. F.; Reilly, R. R.; and McKee, J.D. Development of a Test of Globalvs. Articulated Thinking: The FigureLocation Test. GREB No. 74-9P, June1978.
Echternacht, G. Alternate Methods ofEquating GRE Advanced Tests. GREB No.69 -2 ?, June 19/4.
Echternacht, G. A Cumparison of VariousItem Option Wei.;,hting Schemes/ANote on the Variances of EmpiricallyDerived Option Scoring Weights.GREB N. 71-17P, February 1975.
Echternacht, G. A c.1,ick Method. forDetermicIng Test Bids. CREB No. 7n-RP,July 07/.
Evans, F. The GRE-Q Coaching /instructionStudy. GREB No. 71-5aP, September1977.
Eredericksc71, N. and Ward, W. C. Develop-me:; of Measures for the Study of
GREB No. 72-2P, June1975.
Levine, M. V. and Drasgow, F. Appropriate-ness Meastenent with Aptitude TestData and Esimated Parameters.GREB !'o. 75-3P, March 1980.
McPeek, M..; Altman, R. A.; Wallmark, M.; andt'ingersky, B. C. An Investigation ofthe Feasibility of Obtaining AdditionalSubscores on the GRE AdvancedPsychology Test. GREB No. 74-4F, April1976.
Pike, L. Implicit Guessing Strategies of GREAptitude Examinees Classified by Ethni.Group and Sex. GREB No. ,75-10P, June1980.
Powers, D. E.; S..inton, S.; Thayer, D.;and Yates,, A. A Factor AnalyticInvestigation of Seven ExperimentalAnalytical Item Types. GREB No.77-1P, dune 1978.
Powers, D. E.; Swinton, S. S.; and Carlson,A. B. A Fa c't or Analytic Study ofthe GRE Aptitude Test. G112B No.75-11P, September 1977.
Reilly, R. R. and Jackson, R. Effectsof Empirical Option Weighting onReliability and Validity of the GRE.
GREB No. 71-9P, July 1974.
Reilly, R. R. Factors in graduate StudentPerformance. 'GRF3 No. 71-2P, July197A.
Rock, D. A. The Identification cfPopulation Mode.,Itccs and TheirEffect on the Prediction of, DoctorateAt tai nrient GREB No. b9 -6bP, February
Rock, D. A. The -Test Chooser": P. DifferertApproach to a Prediction WeightingScheme. GREB No. 70 -2P, November1974.
Sharon, A. T. Test of English as 3 ForeignLanguage as a Moderator of GraduateRecord Examinations Scores in thePrediction of Foreign Students' Gradesin Graduate School. GREB No. 70-1P,June 1974.
Stricker, L. J. A New Index of DifferentialSubgroup Performance: Application tothe GRE Aptitude Test. GREB No. 78-7P,June 1981.
Swinton, S. S. and Powers, 'J. E. A FactorAnalytic Study of the RestructuredGRE. Aptitude Test. GREB No. 77-0P,February 1980.
Ward, W. C. A Comparison of Free-Responseand Multiple-Choice Forms of VerbalAptitude Tests. GREB No. 79-81',January 1982.
Ward, W. C.; Frederiksen, N.; and Carlson,S. B. Construct Validity of Free-Response and Machine - Storable Versionsof a Test of Scientific Thinking.GREB No. 74-8P, November 1978.
Ward, W. C. and Frederiksen, N. A Study ofthe Predictive Validity of the Testsof Scientific Thinking. GREB No.74-6P, October 1977.
4


![DOCUMENT RESUME ED 075 617 PUB LATE [72] NOTE 39p.](https://static.fdocuments.in/doc/165x107/61bdbe7c1a77b7585230541f/document-resume-ed-075-617-pub-late-72-note-39p.jpg)


