DOCUMENT RESUME ED 364 242 AUTHOR Roche, Marilyn M ... - ERIC · DOCUMENT RESUME ED 364 242 IR 054...
68
DOCUMENT RESUME ED 364 242 IR 054 742 AUTHOR Roche, Marilyn M. TITLE ARL/RLG Interlibrary Loan Cost Study. INSTITUTION Association of Research Libraries, Washington, D.C.; Research Libraries Group, Inc., Mountain View, CA. REPORT NO ISBN-0-918006-70-8 PUB DATE Jun 93 NOTE 73p. PUB TYPE Reports Research/Technical (143) Tests/Evaluation Instruments (160) EDRS PRICE MF01/PC03 Plus Postage. nESCRIPTORS *Academic Libraries; *Costs; Equipment; Graphs; Higher Education; *Interlibrary Loans; Library Administration; Library Personnel; Library Research; Library Surveys; Reprography; *Research Libraries; Tables (Data); Telecommunications ABSTRACT The purpose of this study is to provide data for making decisions on whether to buy or borrow research materials and whether to use fee-based suppliers or interlibrary loan for obtaining photocopied materials. The study is based on 1991 information collected in a survey of 76 U.S. and Canadian research libraries. The cost per transaction is broken down into the following categories: staff; networks and communications; materials delivery; photocopying; supplies; equipment and software purchase, rental, and maintenance; and direct and indirect charges for borrowing. The study highlights cost differences among geographic regions and between private and public institutions, which are due to variations in staff deployment and salaries, service levels, and numbers of borrowing and lending transactions. Analysis of the data shows that a research library spends on average $18.62 to borrow a research document or article or to purchase a photocopy of the item and $10.93 to lend a document. Staff costs represent about 777. of the cost for borrowing and lending; 16% of the total is for supervisory staff and 61% 2or nonsupervisory staff. A copy of the survey instrument is appended. (KRN) *********************************************************************** Reproductions supplied by EDRS are the best that can be made from the original document. ***********************************************************************
Transcript of DOCUMENT RESUME ED 364 242 AUTHOR Roche, Marilyn M ... - ERIC · DOCUMENT RESUME ED 364 242 IR 054...
DOCUMENT RESUME
ED 364 242 IR 054 742
AUTHOR Roche, Marilyn M.TITLE ARL/RLG Interlibrary Loan Cost Study.INSTITUTION Association of Research Libraries, Washington, D.C.;
Research Libraries Group, Inc., Mountain View, CA.REPORT NO ISBN-0-918006-70-8PUB DATE Jun 93NOTE 73p.PUB TYPE Reports Research/Technical (143)
Tests/Evaluation Instruments (160)
EDRS PRICE MF01/PC03 Plus Postage.nESCRIPTORS *Academic Libraries; *Costs; Equipment; Graphs;
Higher Education; *Interlibrary Loans; LibraryAdministration; Library Personnel; Library Research;Library Surveys; Reprography; *Research Libraries;Tables (Data); Telecommunications
ABSTRACTThe purpose of this study is to provide data for
making decisions on whether to buy or borrow research materials andwhether to use fee-based suppliers or interlibrary loan for obtainingphotocopied materials. The study is based on 1991 informationcollected in a survey of 76 U.S. and Canadian research libraries. Thecost per transaction is broken down into the following categories:staff; networks and communications; materials delivery; photocopying;supplies; equipment and software purchase, rental, and maintenance;and direct and indirect charges for borrowing. The study highlightscost differences among geographic regions and between private andpublic institutions, which are due to variations in staff deploymentand salaries, service levels, and numbers of borrowing and lendingtransactions. Analysis of the data shows that a research libraryspends on average $18.62 to borrow a research document or article orto purchase a photocopy of the item and $10.93 to lend a document.Staff costs represent about 777. of the cost for borrowing andlending; 16% of the total is for supervisory staff and 61% 2ornonsupervisory staff. A copy of the survey instrument is appended.(KRN)
***********************************************************************
Reproductions supplied by EDRS are the best that can be madefrom the original document.
***********************************************************************

ARL/RLG INTERLIBRARY LOAN COST STUDY
A Joint Effort by the Association of Research Libraries andthe Research Libraries Group
by Marilyn M. RocheResearch Libraries Group
U.S. DEPARTMENT OF EDUCATIONOffice of Educational Research and Improvement
EDUCATIONAL RESOURCES INFORMATIONCENTER (ERIC)
0 This document has been reproduced asreceived from the person or organizationo(ginafing
0 Minor changes have been made lo improvereproduction quality
Points of view or opinions stated in this dour.ment do not necessanly represent officialOEM position or policy
Association of Research Libraries4.0rp June 1993
1.4
BEST COPY MULE
-PERMISSION TO REPRODUCE THISMATERIAL HAS BEEN GRANTED BY
C.A. Mandel
TO THE EDUCATIONAL RESOURCESINFORMATION CENTER (ERIC)"

ARL/RLG INTERLIBRARY LOAN COST STUDY
A Joint Effort by the Association of Research Libraries andthe Research Libraries Group
by Marilyn M. RocheResearch Libraries Group
June 1993
Association of Research Libraries
3

Pu,:lished by theAssociation of Research Libraries21 Dupont CircleWashington, DC 20036(202)296-2296Fax (202)872-0884
Copyright 61993 by the Association of Research Libraries and theResearch Libraries Group
ISBN 0-918006-70-8
ARL and RLG grant blanket permission to reproduce this report for educationaluse as long as complete attribution is given. For commercial use, requestsshould be sent to C. Brigid Welch, Senior Program Officer for InformationServices, Association of Research Libraries, 21 Dupont Circle, Washington, DC20036.
0 The paper used in this publication meets the minimum requirements ofAmerican National Standard for Information SciencesPerformance of Paper forPrinted Library Materials, ANSI Z39.48-1984.
4

ARL/RLG Interlibrary Loan Cost Study
Table of Contents
Foreword ii
Acknowledgementsiii
Executive Summary iv
Introduction 1
Project Goals 2
Findings 4
Unit Costs 4
Public/Private Subsets 8
Cost by Categories of ILL Activity 10
Staff Costs 19
Total Expenditures 31
Photocopy Activity and Cost 32
Conclusions 34
AppendicesA. Cost Category Summary Table 38
B. Methodology 40
C. Project Cost Categories 40
D. Data Collection and Analysis 41
E. All Participating Institutions,Big Eight, Big Ten Consortia 42
F. Additional Cost Components of the Unit Costper Borrow 44
G. RLG ILL Cost Study Task Force 44
H. ARIALG Interlibrary Loan Cost StudySurvey Instrument 45
5

Foreword
This report on the ARL/RLG Interlibrary Loan Cost Study is the culmination of a jointeffort by the Association of Research Libraries and the Research Libraries Group on behalf ofresearch libraries. With assistance from the Council on Library Resources, a survey of ARLmember libraries was undertaken that provides the most extensive data available on the costsincurred by libraries in interlibrary lending and borrowing operations.
Special recognition is due to the staff members in 76 libraries who found time to collectand submit the data that is the foundation for this project. The survey instrument iscomprehensive and the data difficult to gather. The collection efforts of these staff have madepossible a detailed and credible picture of the costs of ILL.
The ARL-RLG partnership in this project illustrates the potential of joint initiatives thatsimultaneously focus the energy and expertise of two organizations toward a common goal.We look forward to other opportunities for cooperative ventures.
James Michalko, President, RLG
Duane Webster, Executive Director, ARL
ii 6
June 1993

Acknowledgements
Marilyn M. Roche, Consultant to RLG, undertook the central role in the conduct of theILL Cost Study, assuming responsibilities for the survey instrument, data verification, analysis,and this report. Valuable assistance was provided in the presentation of the data contained inthis report by Stacey T. Carpenter and Nicola Daval of ARL, and James W. Coleman, JonathanLavigne, and Stephen Sage of RLG. Jaia Barrett, Jutta Reed-Scott, Annette Verna, and PatriciaBrennan of ARL assisted in communication components.
The project benefitted from guidance by an advisory committee who promoted libraryparticipation in the study, consulted on data presentation, and commented on a draft of thereport. Members were: Joan Chambers, Chair, Colorado State University; Dale Cane las,University of Florida; William Crowe, University of Kansas; David Ferriero, MassachusettsInstitute of Technology; and Malcolm Getz, Vanderbilt University.
Other colleagues who assisted in a review of the report were: Shirley Baker,Washington University at St. Louis; Mary Jackson, University of Pennsylvania; Ann Okerson,ARL Office of Scientific and Academic Publishing; Martin Runkle, University of Chicago; andKendon Stubbs, University of Virginia.
iii
I

ARL/RLG Interlibrary Loan Cost Study
Executive Summary
The Interlibrary Loan Cost Study survey instrument, developed by the Rese.nchLibraries Group and distributed by the Association of Research Libraries, was used byseventy-six U.S. and Canadian research libraries to collect cost information for 1991 ILL
borrowing and lending operations.
The purpose of the ILL Cost Study was to provide valuable benchmark data and amanagement tool to research libraries for informing the following decisions:
whether to buy, catalog, and hold; or to borrow research materials,
whether to use fee-based suppliers or interlibrary loan for obtaining photocopiedmaterials.
Analysis of the data provided custom benchmark data for each participating institutionand shows that a research library spends an average of $18.62 to borrow a researchdocumeatiarticle or to purchase a photocopy of the item for a patron, and $10.93 to lend adocument to another library. Therefore, the cost for a completed ILL transaction (combiningborrowing and lending components) averages $29.55.
As a management tool, the survey allows each institution to evaluate its cost pertransaction for each ILL cost category relative to the average and range of costs within eachcategory for comparable institutions. Cost categories include staff; networks andcommynicationE; materials delivery; photocopying; supplies; equipment and softwarepurchase, rental, and maintenance; and direct and indirect charges for borrowing.
Staff costs represent about 77% of the cost for borrowing and lending, while 23%
covers the remaining cost categories. Further review of st;...f costs illustrates that supervisorystaff averages 16% and nonsupervisory 61% of the cost.
The study highlights cost differences among geographic regions and between privateand public institutions, which are due to variations in staff deployment and salaries, servicelevels, and numbers of borrowing and lending transactions.
Among the libraries studied, 60% of all filled transactions were completed by supplyingphotocopies of materials rather than by sending the original item. On average, 49% of allborrowing requests made by these libraries and 64% of all lending requests received by theselibraries, were filled with photocopies.
Institufional members of ARL and RLG supported the project with a supplementarygrant from the Council on Library Resources.
June 1993
iv

ARURLG INTERLIBRARY LOANCOST STUDY
by Marilyn M. Roche
9
Introduction
The changing landscape of information delivery dictates that traditional interlibraryloan (ILL) costs be analyzed to determine what role ILL should play in light of the growingnumber of available alternatives.
Institutions have shifted their focus from dependence on locally-owned collections toan ownership base complemented by resource sharing interdependence among researchlibraries, and an emerging reliance in the 1990's upon fee-based or commercial suppliers toprocure research materials needed by patrons.
The number of interlibrary loan transactions among ARL libraries has increasedsteadily in the last decade. Lending grew by 52%, borrowing by 108%. Among RLGmembers, interlibrary loan traffic expanded by 10% in FY 92, and 5% for several yearsprevious. Three converging trends offer a rationale for these increases:
more accessible and easy-to-use bibliographic tools, including on-line library catalogsand other electronic indexes and access tools;
a growing universe of published items; and,
reduced buying power for libraries as a result of increased acquisition costs formost research resources combined with constrained budgets.
In 1992, the Association of Research Libraries (ARL) and the Research Libraries Group(RLG) collaborated in a joint project to collect detailed information on 1991 costs incurred byresearch libraries for interlibrary loan transactions, including both the borrowing and thelending components. RLG provided the survey instrument, data entry, result analyses, andfinal report, while ARL provided experience with surveys, contact with research librarydirectors to ensure survey participation, survey distribution, and report publication.Seventy-six (76) research libraries from institutions in the United States and Canada completedthe survey (Appendix E).
The survey instrument (Appendix H), developed by an RLG Public Services Committeetask force of librarians (Appendix G) familiar with ILL operations, focuses exclusively on thosecosts directly associated with interlibrary borrowing and lending, and provides a cost"snapshot" of these ILL activities. Captured in the survey are costs for:
StaffNetwork and Comm-nicationsDeliveryPhotocopySuppliesEquipment and SoftwareRental and MaintenanceDirect and Indirect Borrowing Charges
Costs of major library functions such as collection development, acquisitions,cataloging, general circulation, and preservation are not included, nor is general overhead.Although all of these factors are necessary preconditions for an ILL service, their costs do notcontribute directly to the "snapshot" of ILL borrowing or lending activities covered in thissurvey. (See Appendix B for Methodology and Appendix C for definitions of cost categories.)
The study produced two major reports: the first, distributed in December 1992, was aseries of customized institutional reports. The second, the report in hand, provides analyses ofaggregated data and subsets for all cost categories and component parts.
Institutional members of ARL and RL,..; supported the project with a supplementarygrant from the Council on Library Resources.
Project Goals
The purpose of the study was twofold: to produce substantive Benchmark Data oncosts of interlibrary lending and borrowing, which are key components of resource sharingprograms, and to provide a Management Tool that would enable participating libraries to makepreliminary cost comparisons between ILL and alternative methods of obtaining materials forpatrons.
Benchmark DataSince interlibrary loan is a major activity of the North American research libraries
programs, the results of this joint project provide important benchmark cost informationnecessary for meaningful discussions of the economic implications of resource sharing anddocument delivery.
Data collected by the joint project was analyzed to produce the following information:
ILL borrowing costs - mean, median and rangesILL lending costs - mean, median and rangesILL cost categories - mean, median and ranges?ublic/private institutions ILL borrowing costsPublic/private institutions ILL lending costsILL professional, nonprofessional, and student staff costsILL photocopy activity and costs
Although the ILL Cost Study includes the major costs for ILL activities, it does notdelineate several categories that may contribute additional cost to the unit cost for eachborrowing transaction. These include subscription, per search, telecommunications, anddocument delivery fees for services such as CARL UnCover, Cita Del, and First Search, andsuch Center for Research Libraries fees as may be attributed to ILL. These costs may befactored in when using this benchmark data (see Appendix F for instructions).
Management ToolSeventy-six research libraries participated in the study. Each received a customized ILL
cost analysis report illustrating its individual unit costs for lending and borrowing, along withthe mean, median, and ranges of aggregated unit costs at a wide variety of research libraries.
2
This management planning tool allows each institution to assess costs associated withspecific ILL operations. The cost study results assist libraries in making preliminary costcomparisons between traditional ILL borrowing and lending and alternative methods ofobtaining materials and photocopies for their patrons.
An important caveat: performance was not measured in this survey. The results ofthe survey, examined in isolation from other local factors, are not a measure of theeffectiveness of the ILL services provided by a participating library. Hence, a high or low unitcost is not necessarily indicative of high or low quality service. Low costs may reflectefficiency, or may result from a lower standard of service. High costs may reflect inefficiency,commitment to a higher standard of service (such as fast turnaround), or regional salary orinstitutional staffing level differences.
As a management tool, the individual and aggregate ILL cost study results should beevaluated along with other local measures such as:
individual institutional policies regarding the extent of ILL provision for variouscategories of patrons;response time to fill ILL requests (internal and external); andpercent of requests filled.
The following scenarios illustrate the effect of local policies and practices on ILL costs.
Scenario 1: Institution A provides unlimited kinds and numbers of ILL borrowingtransactions for all categories of student, staff, and faculty. Institution B limits the number oftransactions for faculty, and provides no ILL for students and staff. The sheer number oftransactions processed by Institution A may produce a lower unit borrowing cost than wouldexist for Institution B with no difference in quality or efficiency.
Scenario 2: Institution A provides ILL lending access to materials housed in remotebranch libraries or storage facilities, while Institution B provides ILL access only to materialsavailable in the "main" library. The extra staff and delivery costs incurred in lending materialsfrom Institution A will be reflected in its higher unit lending costs.
Scenario 3. Institution A cancels subscriptions to many popular, easily obtainedjournals while Institution B cancels only arcane, esoteric, or expensive journals. Each obtainscopies of these materials through ILL. The extra staff and network time necessary atInstitution B to locate difficult-to-obtain materials may result in a higher unit borrowing cost.
32
Findings
Unit Costs
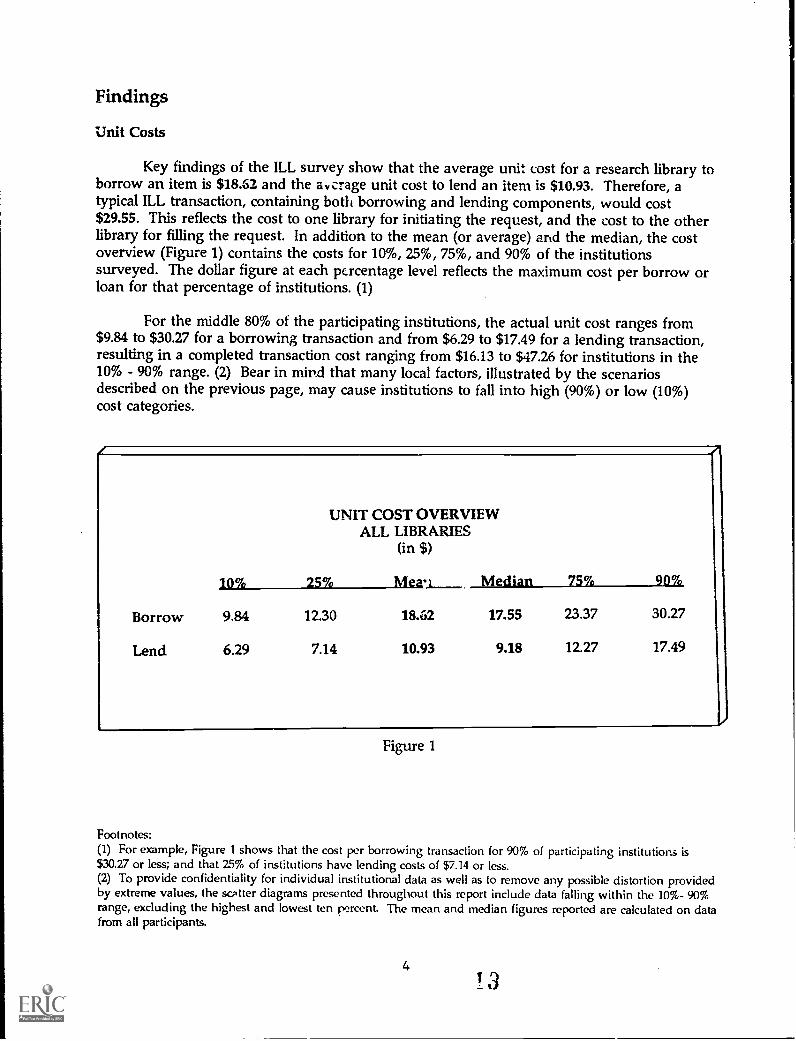
Key findings of the ILL survey show that the average unit cost for a research library toborrow an item is $18.62 and the av crage unit cost to lend an item is $10.93. Therefore, atypical ILL transaction, containing both borrowing and lending components, would cost$29.55. This reflects the cost to one library for initiating the request, and the cost to the otherlibrary for filling the request. In addition to the mean (or average) and the median, the costoverview (Figure 1) contains the costs for 10%, 25%, 75%, and 90% of the institutionssurveyed. The dollar figure at each percentage level reflects the maximum cost per borrow orloan for that percentage of institutions. (1)
For the middle 80% of the participating institutions, the actual unit cost ranges from$9.84 to $30.27 for a borrowing transaction and from $6.29 to $17.49 for a lending transaction,resulting in a completed transaction cost ranging from $16.13 to $47.26 for institutions in the10% - 90% range. (2) Bear in mind that many local factors, illustrated by the scenariosdescribed on the previous page, may cause institutions to fall into high (90%) or low (10%)cost categories.
UNIT COST OVERVIEWALL LIBRARIES
(in $)
10% 25% Merl_ Median 75% 90%
Borrow 9.84 12.30 18.62 17.55 23.37 30.27
Lend 6.29 7.14 10.93 9.18 12.27 17.49
Figure 1
Footnotes:(1) For example, Figure 1 shows that the cost per borrowing transaction for 90% of participating institutions is$30.27 or less; and that 25% of institutions have lending costs of $7.14 or less.(2) To provide confidentiality for individual institutional data as well as to remove any possible distortion providedby extreme values, the scatter diagrams presented throughout this report include data falling within the 10%- 90%range, excluding the highest and lowest ten cw2rcent. The mean and median figures reported are calculated on datafrom all participants.
43

Two consortia responded to the ARURLG offer to provide custom analysis.Institutional data from the Big Ten and the Big Eight consortia (defined in Appendices E2 andE3) were aggregated separately to illustrate additional analyses available using the cost studysurvey instrument. Comparing the mean, median, and range for the entire survey sample(All) with the mean, median, and range for these two subsets illustrates differences that mayresult from regional cost, staff deployment, delivery, or service level differentials.
ILL UNIT COST
TO BORROW(in $)
10% 25% Mean Median 75% 90%
ALL 9.84 12.30 18.62 17.55 23.37 30.27
BIG TEN 8.93 18.54 20.01 18.54 28.20 34.10
BIG EIGFIT 9.82 10.76 14.88 12.72 19.61 23.05
TO LEND(in $)
10% 25% Mean Median 75% 90%
ALL 6.29 7.14 10.93 9.18 12.27 17.49
BIG TEN 6.55 7.57 12.35 10.75 12.75 32.99
BIG ET:MT 4.75 6.59 8 24 7.81 9.12 14.64
Figure 2
While the average cost per borrow for All participating institutions is $18.62, cost for theBig Ten institutions is $20.01, and for the Big Eight only $14.88. The average cost per loan forAll institutions is $10.93, with the Big Ten recording $12.35, and the Big Eight, $8.24.
Cost for a completed transaction averages $29.55 overall, $33.50 in the Big Ten, and $23.12in the Big Eight.
5
4
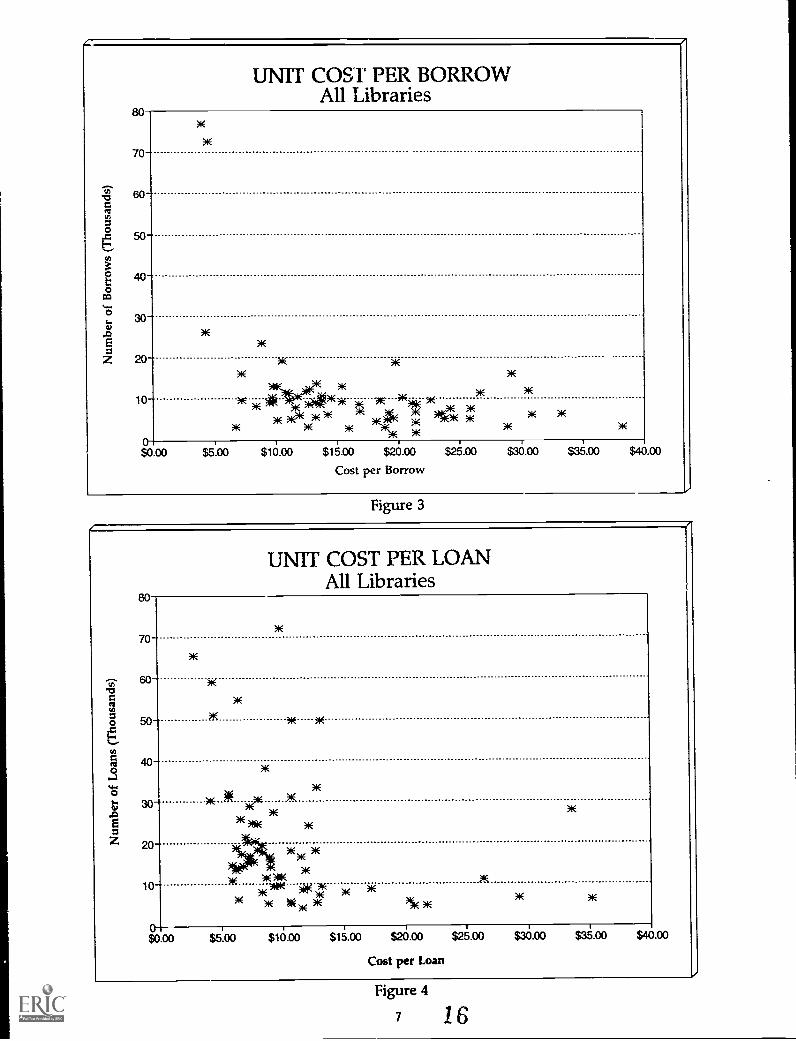
The following scatter diagrams illustrate the range of unit costs for ILL borrowing andlending. Since the level of ILL activity, that is, the Invnber of filled transactions (3), is avariable considered in this study, the scatter diagrams that follow L'eflect the unit cost toborrow and to lend based on the number of transactions at each survey site (in most cases,the main ILL operation). The scatter diagrams illustrate however, that the sheer number oftransactions is not the only factor moderating the unit cost. Some low volume institutionshave relatively low per unit costs while some high volume institutions have relatively highper unit costs, reflecting institutional differences in resource sharing philosophy, ILL servicelevel and quality, deployment of staff, salary levels, and other variables.
Reviewing the scatter diagrams for borrowing transactions (Figures 3, 5, and 6), andlending transactions (Figures 4, 7, and 8), one can test the hypothesis that institutions with ahigh number of transactions have relatively lower costs per transaction and institutions withlow numbers of transactions have relatively higher costs. In the scatter diagrams for alllibraries, as well as for subsets of public and private institutions, this tendency is morediscernable in lending than in borrowing activity.
Note the greater clustering for unit lending cost as compared to unit borrowing cost.This suggests a more uniform institutional approach to the lending process and highlightsfurther the differences in service and staffing levels between the borrowing and lendingtransactions.
Footnote:(3) The study considered only Tilled Transactions: since these are the actual products of the ILL operation.
6 15
ao
UNIT COST PER BORROWAll Libraries
70
ch 60-Es
eiu)
g
e 5°
g0
40co
Z3 30AE=Z 20
10
o
N:
)4(
NE *)r< w
)4(
)4(
)1 )4( Pk(NWPE)1( 1 "Ak- °4),1(
NE NE )f(NSS4E )4(
* NE
NE
*
NE NE
$0 00 $5.004 ,
$10.00 $15.00 $20.00
Cost per Borrow
$25.00 $30.00 $35.00 $40.00
Figure 3
UNIT COST PER LOANAll Libraries
70
so
)0E
50 *
ao
20
10
)16 mek
$0 00
316)4E
NOE
)1( N( )11()16
KAK * AE *)0(
W NE* )1(AE )1(* YiE NENE
$5:00 $10.00 $15.00 $20.00 $25.00
Cost per Loan
$30.00 $40.00
Figure 4
7 16

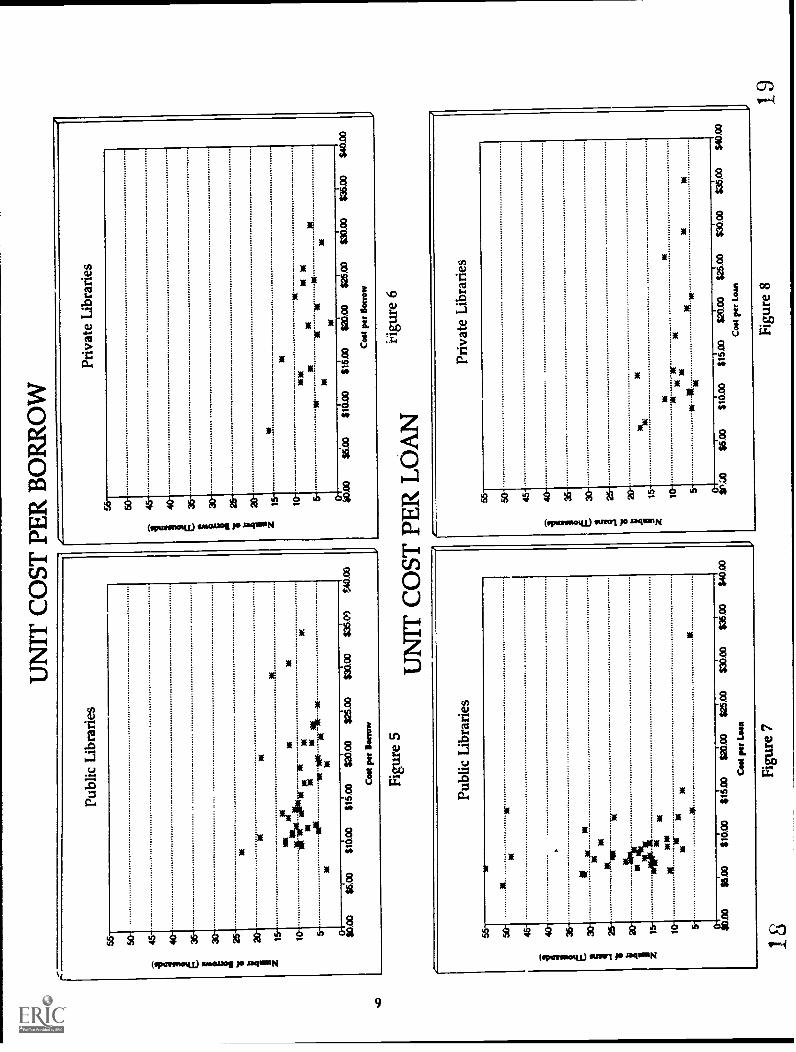
Public/Private Subsets
The following scatter diagrams (Figures 5-8) display cost data for public and for privateinstitutions. Public/private displays include only U.S. institutions because of the difficultyascribing public/private status to Canadian institutions.
Figures 5-8 show that public institutions process more loans than private institutions.This may be due to state mandates requiring public research universities to provide researchmaterials to other state-funded institutions such as high school, community college, otherfour-year college, and public libraries.
In addition, the unit costs for lending are generally lower and have a narrower rangeamong public than among private universities/institutions. Differences in level of ILL activitymay account for some of these cost and range differences. However, underreporting of costsby public institutions may also contribute to the public/private differences. The costs oftelecommunications, delivery, supplies, and even staff are often difficult to determineaccurately for public institutions because of intricate state budgeting, accounting, and fundingprocedures. For example, delineating accurate costs for state shuttles for transportingmaterials or for state-supported electronic networks was onerous. Private institutions also hadsome difficulty estimating costs for services, such as telecommunications, delivery, or staff, thatare not specifically itemized by department.
17
8
UN
IT C
OST
PE
R B
OR
RO
W
Publ
ic L
ibra
ries
*$it
1 1N
E*
Xim
le3a
am
31-4
4/L4
1)1*
W*
WW
.W
W:
mg,
-1*
-161
*lir
me
"WW
W
$0 0
0$5
.00
$10.
00$1
5.00
$20.
00$2
5.00
$30.
00$3
5.09
40.0
0
CO
M p
et .0
1111
11V
Figu
re 5
50-
45-
40-
35-
30-
254
20-
Priv
ate
Lib
rari
es
15'
10- 5- WO
O
is(
o-m
it)0
( *
)0(
11(
$63
$16.
03$1
.00
$20
CO
$2i 0
000
.00
Cos
t per
Bor
row
135.
00$4
0.00
UN
IT C
OST
PE
R L
OA
N
)8(
Publ
ic L
ibra
ries
)1, 3/
1
$5.0
0$1
0.00
$15.
00$2
0.00
$25.
00$3
0.00
$35.
00$4
0.00
Coo
t per
Loa
n
18Fi
gure
7
iigur
e 6
Priv
ate
Lib
rari
es
$5.0
0$1
0.00
$15.
00$2
0.00
$25.
00$3
0.00
Coo
t per
Loa
n
Figu
re 8
19

Cost by Categories of ILL Activity
Average Costs by CategoryThe cost data was also broken down into major cost categories for participating
institutions as a whole and for the Big Ten and Big Eight consortia institutions separately. Thefirst bar graph (Figure 9) illustrates the average borrowing, lending, and combined transactionunit costs for these various ILL cost categories for all participants.
AVERAGE COST PER ILL CATEGORY
All Libraries
Figure 9
'Professional, nonprofessional, and student staff including staff from other departmentsproviding ILL support, (e.g. reference, photoduplication, mailroom)
2Telephone, electronic mail and network fees3Postage, parcel delivery, fax and other delivery systems4For borrowing only, fees paid by library to suppliers (fee-based or commercial document
delivery services)5Equipment and software (purchase, rental and maintenance), supplies, and photocopy
expenses (excluding staff)
2010
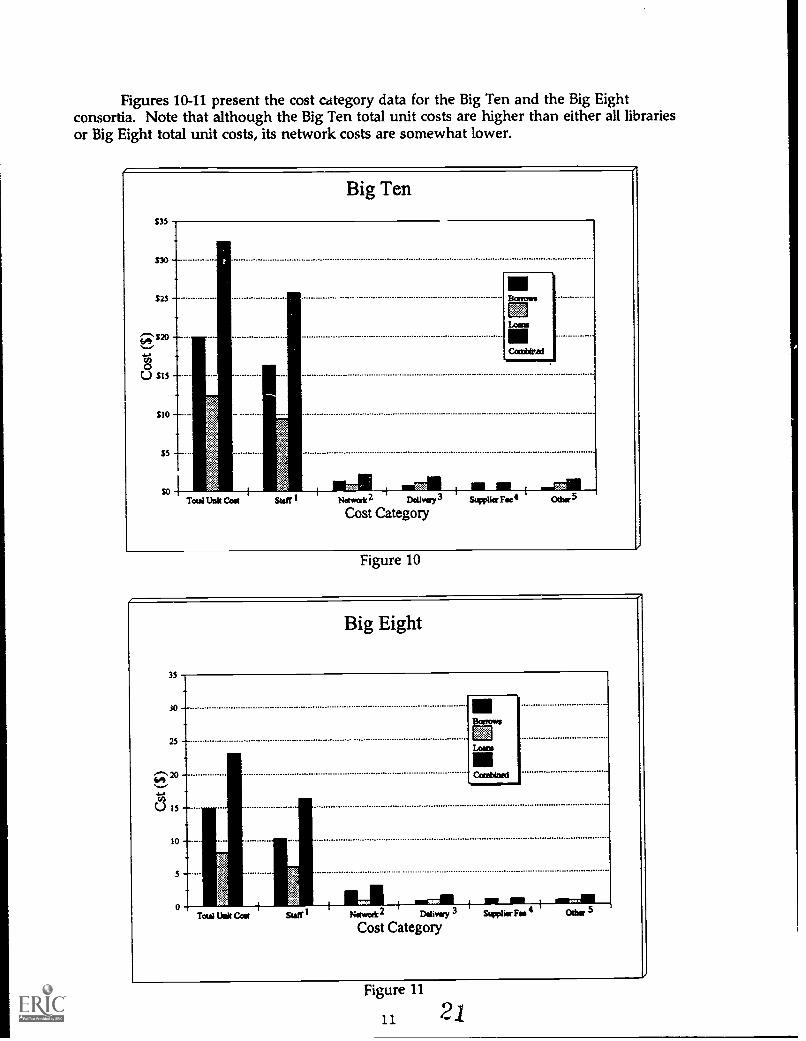
Figures 10-11 present the cost category data for the Big Ten and the Big Eightconsortia. Note that although the Big Ten total unit costs are higher than either all librariesor Big Eight total unit costs, its network costs are somewhat lower.
Big Ten
Borrow
Combired
, I MilNetwork 2 DetIvery 3 supplier Fee4 Other 5
Cost Category
Figure 10
MAI5 I , A I
Nowa Doiivory ' Supplier Fos
Cost Category
Figure 11
11 21
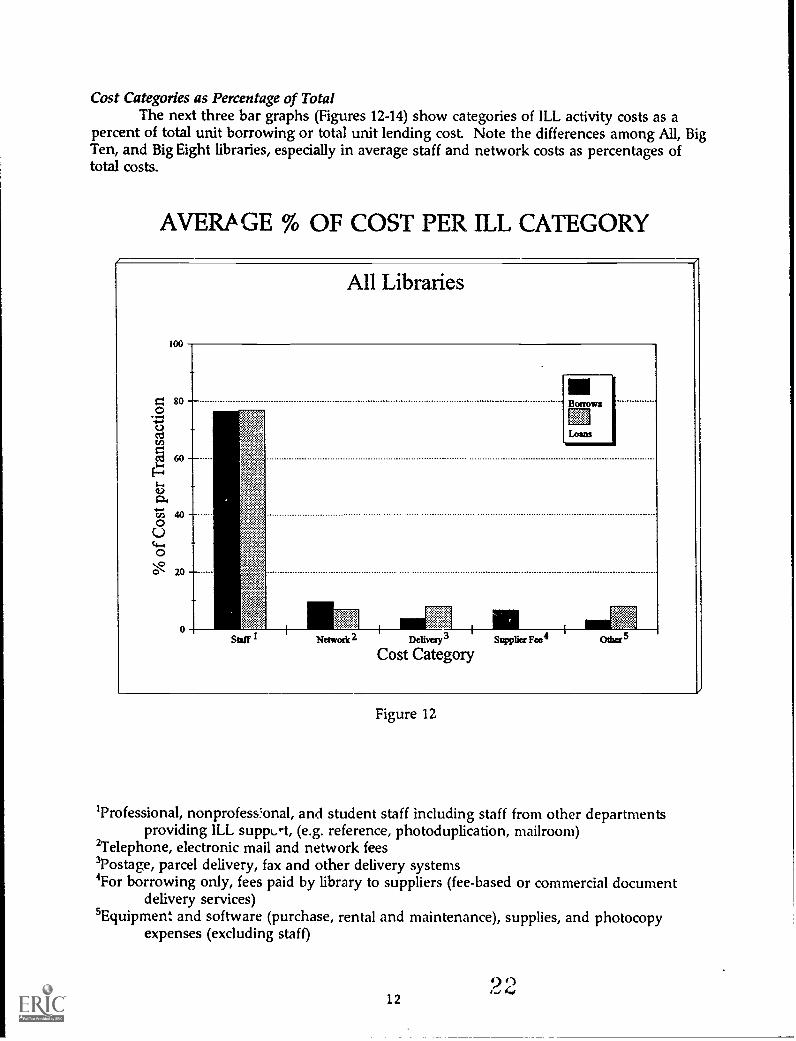
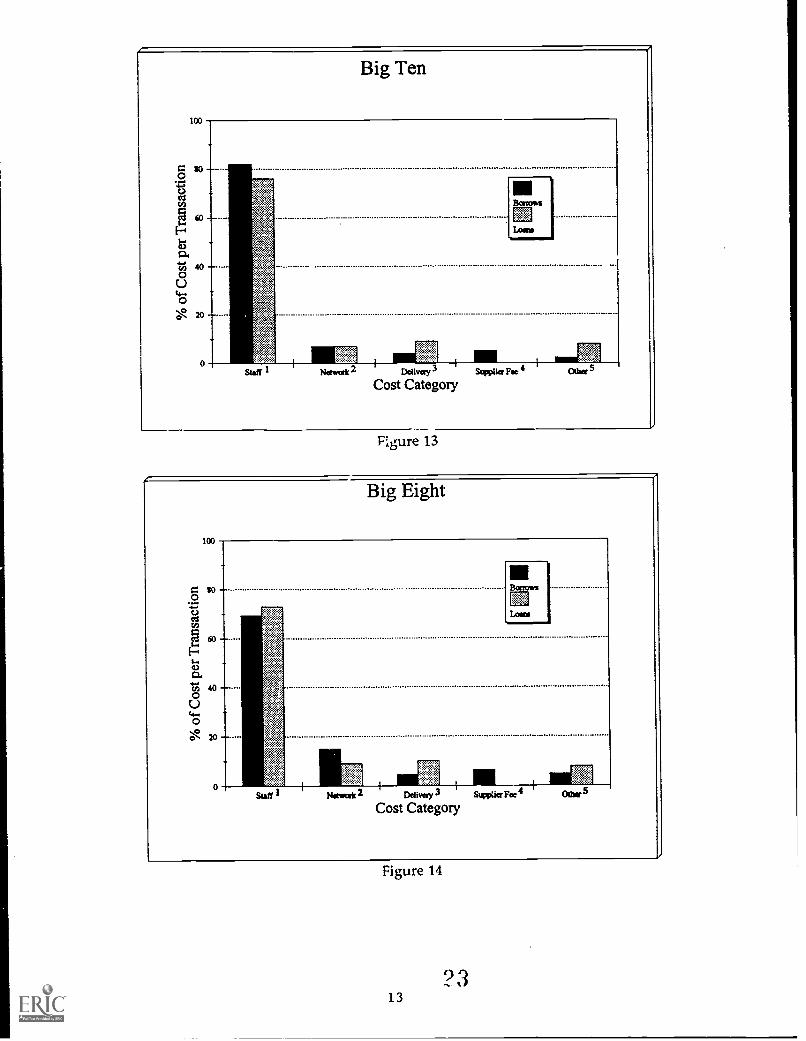
Cost Categories as Percentage of TotalThe next three bar graphs (Figures 12-14) show categories of ILL activity costs as a
percent of total unit borrowing or total unit lending cost. Note the differences among All, BigTen, and Big Eight libraries, especially in average staff and network costs as percentages oftotal costs.
AVERA GE % OF COST PER ILL CATEGORY
100
g 800-10
g 60
4.)
Cn 400c4-1
Ot"? 20
All Libraries
s"
staff'
1111Borrows
BM
MENetwork 2 Delivery 3
Cost Category
111Supplier Fee 4 Other 5
Figure 12
'Professional, nonprofess:onal, and student staff including staff from other departmentsproviding ILL suppuq, (e.g. reference, photoduplication, mailroom)
2Telephone, electronic mail and network fees3Postage, parcel delivery, fax and other delivery systems4For borrowing only, fees paid by library to suppliers (fee-based or commercial document
delivery services)'Equipment and software (purchase, rental and maintenance), supplies, and photocopy
expenses (excluding staff)
1212 2
Big Ten
100
0-§ 601...04.co 40oC.)
0Os"Z 20 ----
0
v.-....., ,
..- ...,
--... .,
Mr71:
$.
Lome
Staff 1 Nowa 2 Delivery 3 Supplier Fee 4 Othee 5
Cost Category
Egure 13
100
SO
Big Eight
0
oS
Clt
Cn0
....II,'
4 0
20
0
>
/4,,
.7f
4 ,4
Lowe
Staff 1 Network 2I
Num,-Cost Category
Swig* Fee -A
able 5
Figure 14
13

Unit Costs by CategoryThe following charts (Figures 15-20) display actual unit dollar figures for each ILL cost
category. Figure 15 illustrates the mean, median, and range for each cost component forborrowing for all libraries. For example, of the $18.62 spent on an average borrow, networkscost $1.79 and delivery costs $0.71. The sum of the mean costs for each category equals themean Total Unit Cost (4).
UNIT COST TO BORROWALL LIBRARIES
(in S)
23% Mon Median 79% 901
TOTAL Unit Cost 9.84 12.30 16.62 17.55 23.37 30.27
Stafh General SupervisoryProfessional .28 .77 1.62 1.03 2.12 3.77
Non Professional .00 .03 1.05 .63 1.33 2.18
Staff: Non SupervisoryProfessional .00 .00 1.39 .43 2.31 553Non Professional 2.95 4.37 9.23 7.69 13.71 1554Student Staff .00 .34 .93 .80 1.34 2.22
Networks .66 1.04 1.79 1.53 2.13 3.00
Delivery .11 .36 .71 .69 1.03 1.27
Photocopy .00 .00 .07 .02 .05 .14
Supplies .04 .07 .20 .17 .27 .43
Other* .01 .46 1.63 1.06 2.21 3.91
includes costs for equipment and software; rental and maintenance; and borrow-related purchasing fees
Figure 15
Footnote(4) In Figure 16, there is a .01 discrepancy in the sum of the mean costs for each category and the mean Total UnitCost due to rounding. In Figures 15 and 16, the sum of costs at the 10% level for each category will not equal theTotal Unit Cost at the 10% level. This is because a different institution may fall at the 10% level for each of theseven categories, while the Total Unit Cost represents a single institution whose Total Unit Cost falls at the 10%level. For example, institution A could represent the 10% level for staff, institution B for networks, and institutionC for delivery. And, institution D, whose costs may fall at the 10%, 25%, or other levels for each of the seven costcategories, could have a Total Unit Cost which falls at the 10% level. Thus, Total Unit Cost reflects the sum ofinstitution D's individual costs, not a composite of the costs at the 10% level incurred by institutions A, B, C, asnoted above. This caveat applies to the median, and to the 25%, 75%, and 90% levels, as well.
2414
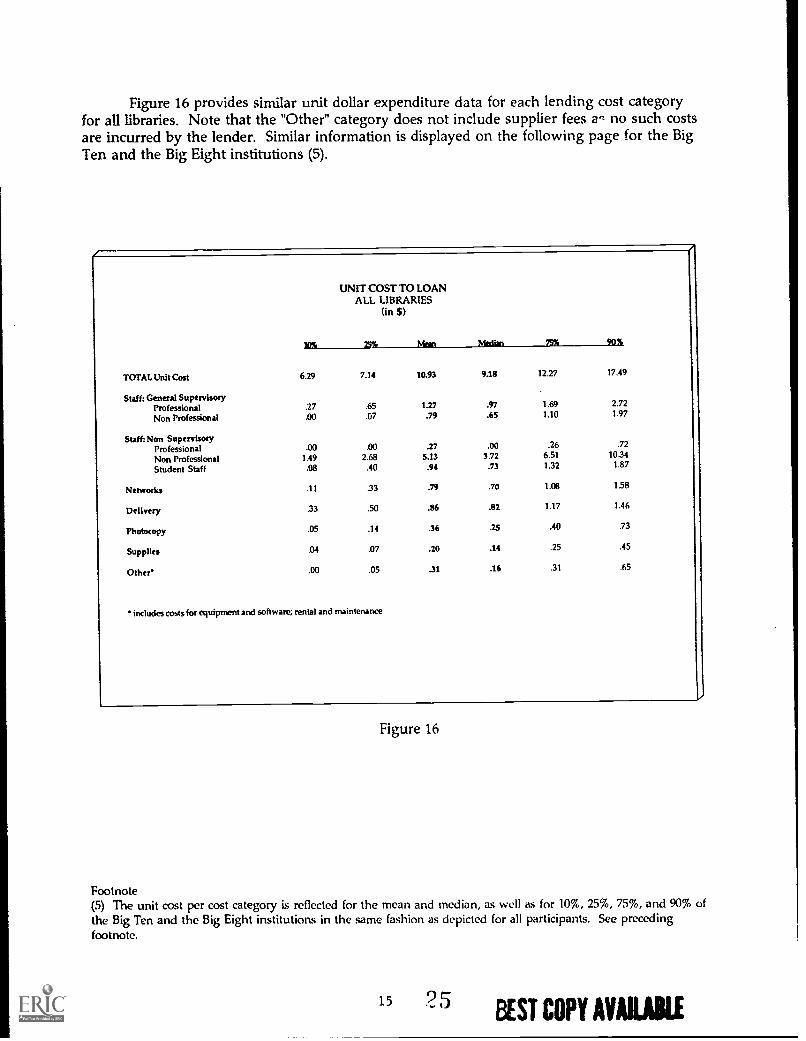
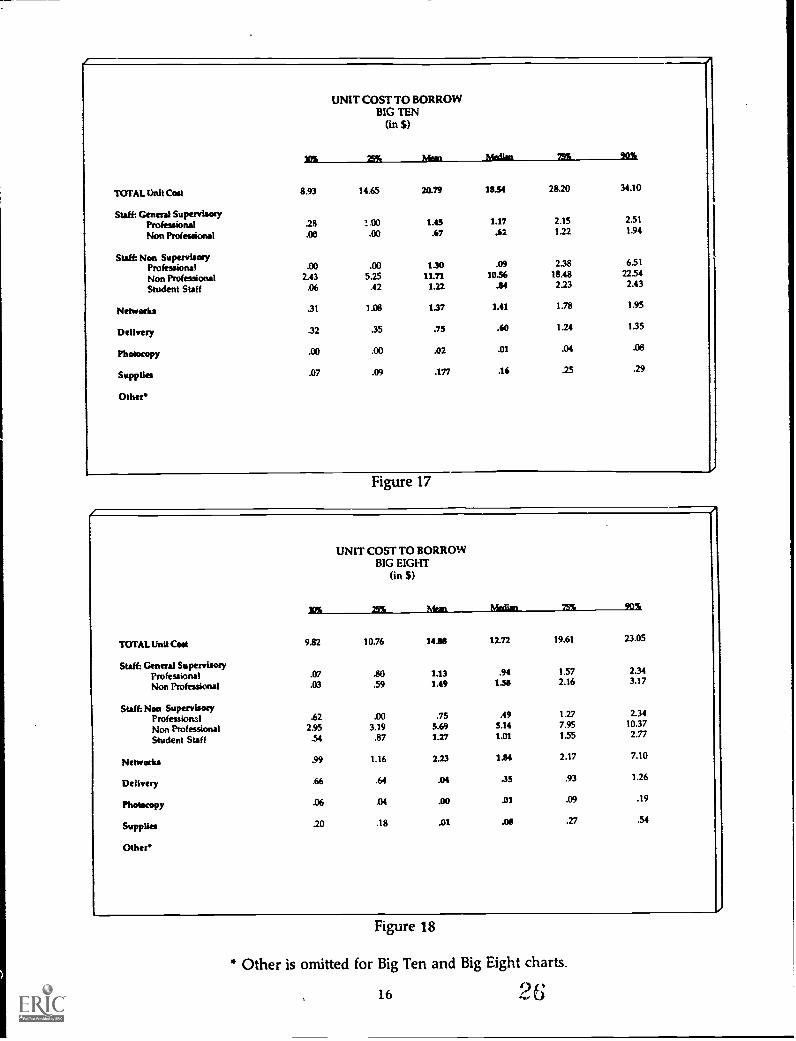
Figure 16 provides similar unit dollar expenditure data for each lending cost categoryfor all libraries. Note that the "Other" category does not include supplier fees ac no such costsare incurred by the lender. Similar information is displayed on the following page for the BigTen and the Big Eight institutions (5).
UNIT COST TO LOANALL LIBRARIES
(in $)
30% 25% Mein 99%
TOTAL Unit Cost 6.29 7.14 10.93 9.18 12.27 17.49
Staff: General SupervisoryProfessional .27 .65 1.27 .97 1.69 2.72
Non Professional .00 .07 .79 .65 1.10 1.97
Staff:Non SupervisoryProfessional .00 .00 .27 .00 .26 .72
Non Professional 1.49 2.68 5.13 3.72 6.51 10.34
Student Staff .08 .40 .94 .73 1.32 1.87
Networks .11 .33 .79 .70 1.08 158
Delivery .33 .50 .86 .82 1.17 1.46
Photocopy .05 .14 .36 .25 .40 .73
Supplies .04 .07 .20 .14 .25 .45
Other .00 .05 .31 .16 .31 .65
includes costs for equipment and software; rental and maintenance
Figure 16
Footnote(5) The unit cost per cost category is reflected for the mean and median, as well as for 10%, 25%, 75%, and 90% ofthe Big Ten and the Big Eight institutions in the same fashion as depicted for all participants. See precedingfootnote.
1525 BEST COPY AURAE
UNIT COST TO BORROWBIG TEN
15%
$)
Mean Malan 19% 90%
TOTAL Unit Cost 8.93 14.65 20.79 18.54 28.20 34.10
Staff: General SupervisoryProfessional .28 1.00 1.45 1.17 2.15 2.51
Non Professional .00 .00 .67 .62 1.22 1.94
Staffi Non SupemisoryProfessional .00 .00 130 .09 238 651
Non Professional 2.43 5.25 11.71 10.56 18.48 2254
Student Staff .06 .42 1.22 .04 2.23 2.43
Networks .31 1.08 1.37 1.41 1.78 1.95
Delivery .32 .35 .75 .60 1.24 135
Photocopy .00 .00 .02 .01 .04 .08
Supplies .07 .09 .177 .16 .25 .29
other*
Figure 17
UNIT COST TO BORROWBIG EIGHT
(in $)
21/5 29% Mem Median 75% 90%
TOTAL Unit Cost 9.82 10.76 14.03 12.72 19.61 23.05
Staff: General SupervisoryProfessional .07 .80 1.13 .94 1.57 2.34
Non Professional .03 .59 1.49 1.58 2.16 3.17
Staff: Non SupervisoryProfessional .62 .00 .75 .49 1.27 2.34
Non Professional 2.95 3.19 5.69 5.14 7.95 1037
Student Staff 54 .87 1.27 1.01 1.55 2.77
Networks .99 1.16 2.23 1.84 2.17 7.10
Delivery .66 .64 .04 .35 .93 1.26
Tholocopy .06 .04 .00 .01 .09 .19
Supplies .20 .18 .01 .os .27 .54
Other'
Figure 18
* Other is omitted for Big Ten and Big Eight charts.
16
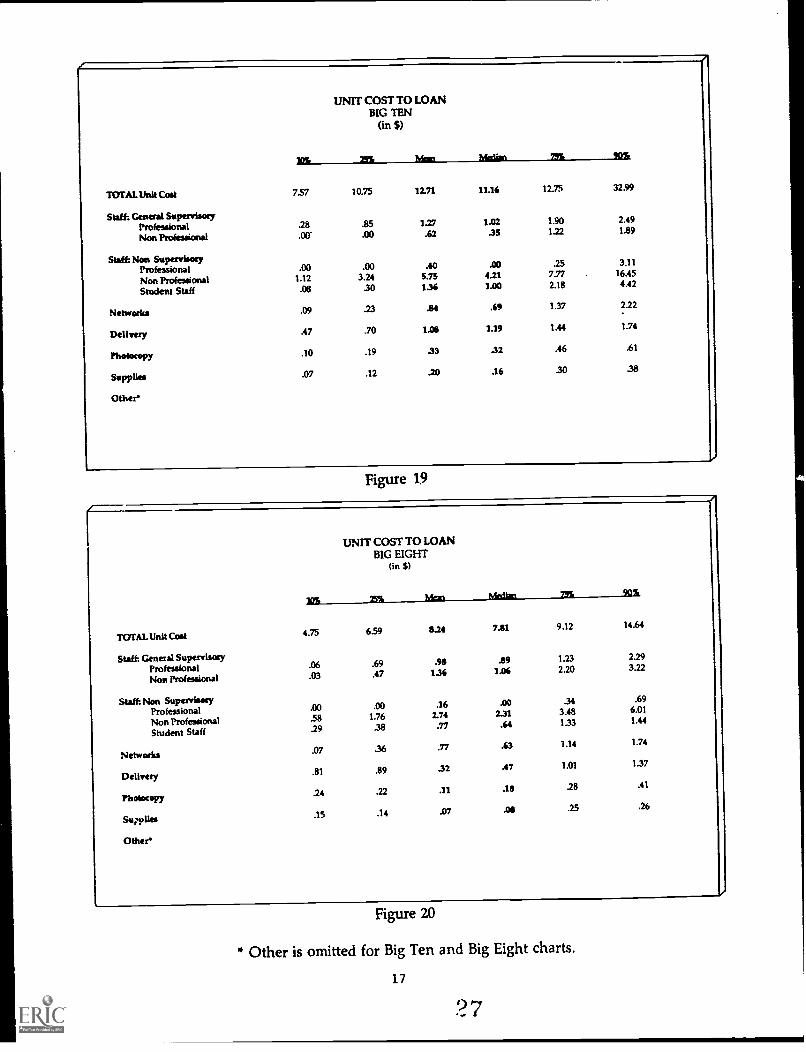
/UMT COST TO LOAN
BIG TEN(in S)
12I 291 Mean Medlin 7911 80%
TOTAL Unit Coot 7.57 10.75 12.71 11.16 12.75 32.99
Staff: General SupervisoeyProfessional .28 .85 1.27 1.02 1.90 2.49
Non Professional Da' .00 .62 .35 1.22 1.89
Stafh Non SupemisoeyProfessional .00 .00 .40 .00 .25 3.11
Non Professional 1.12 3.24 5.75 4.21 7.77 16.45
Student Staff .08 .30 1.36 1.00 2.18 4.42
Networks .09 .23 .84 .69 1.37 222
Delivery .47 .70 1.08 1.19 1.44 1.74
Phohicopy .10 .19 .33 .32 .46 .61
Supplies .07 .12 .20 .16 .30 38
Other'
Figure 19
UNIT COST TO LOANBIG EIGHT
(in $)
311% 25% Mums Median 79% 90%
TOTAL Unit Cost 4.75 6.59 824 7.81 9.12 14.64
Staff: General SupervisoryProfessional .06 .69 .98 .89 1.23 229
Non Professional .03 .47 1.36 1.06 2.20 3.22
Staff:Non SupervisoeyProfessional .00 .00 .16 .00 .34 .69
Non Professional .58 1.76 2.74 2.31 3.48 6.01
Student Staff .29 .38 .77 .64 1.33 1.44
Networks .07 .36 .77 .63 1.14 1.74
Delivery .81 .89 .32 .47 1.01 1.37
Photocopy .24 .22 .11 .18 .28 .41
Soli:Tiles .15 .14 .07 .08 .25 .26
Other*
Figure 20
* Other is omitted for Big Ten and Big Eight charts.
17
27
Staff Costs
As illustrated, the major cost component of ILL operations is staff, representing 77% ofthe cost for borrowing and lending. Cost study participants may use their local cost data toreview current staffing patterns and compare them to alternative staffing options possiblewith different methods of resource sharing and information delivery.
Figures 21-38 display staff costs by professional, nonprofessional, and student staffcategories.
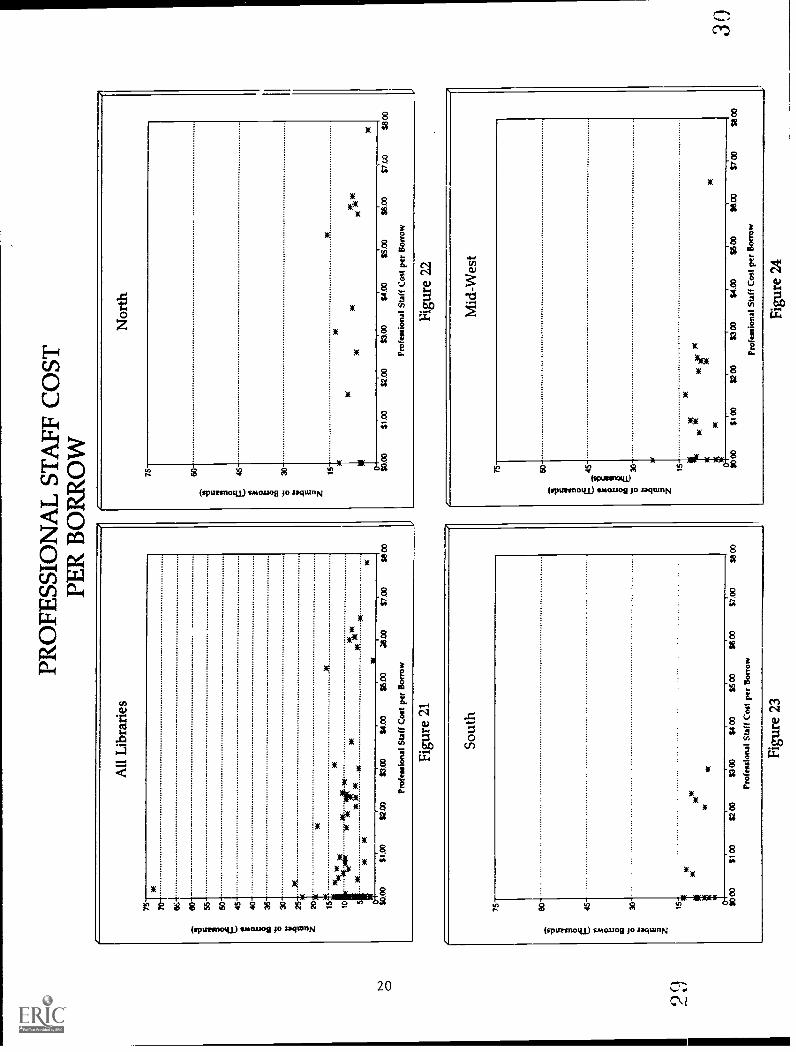
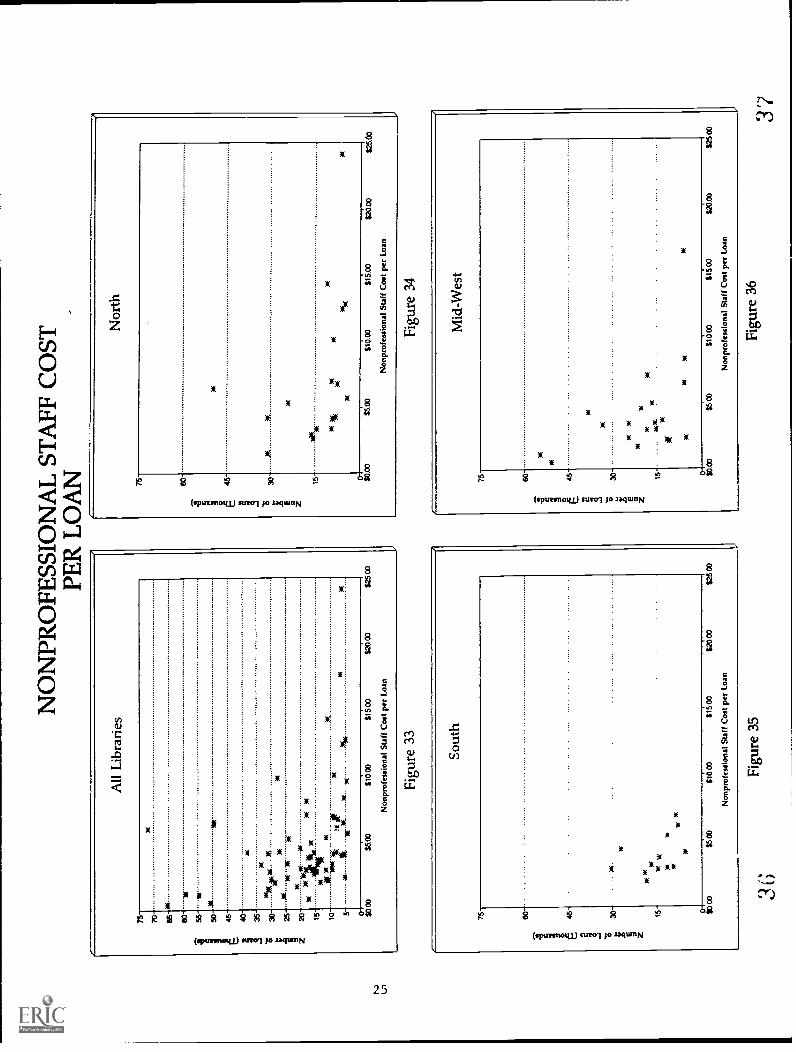
Professional StaffFigures 21-28, showing professional staff costs for all libraries and for three regions (6),
indicate that many institutions use no professional staff in either the borrowing or the lendingoperations. (Note the number of institutions with scatter marks at $0.00 for professional staffcost per transaction.) However for complete accounting of ILL costs, staff in the ILL coststudy includes staff in the ILL department as well as in other departments providing ILLsupport services such as reference, photoduplication and mailroom. Costs for staff from theseother departments were prorated based on time spent on ILL transactions.
Comparing the professional staff cost for borrowing to the professional staff cost forlending illustrates that inatitutions that do utilize professional staff do so more for borrowingtransactions than for lending. This is consistent with the traditional philosophy of ILL staffdeployment to use professional staff to provide bibliographic verification of the requests fromlocal patrons. The borrowing process, which also includes assessing patron's research needsand deciding location choice by evaluating consortial agreements, costs, turnaround time, etc.,is usually more challenging than the lending process.
Footnote:(6) Regional data for Canada and the West omitted because of small number of institutions reporting and need toprotect confidentiality of data.
19
15-
PRO
FESS
ION
AL
ST
AFF
CO
STPE
R B
OR
RO
W
.8 1 t. k g si 15.. 1 Z
751
All
Lib
rari
es
co
70 65 so 55 45 40 35 33 20w
151.
10N
:00
NE
SE
SE
Iii
XN
E
,00(
St
liok
3K
0 WO
O$1
.03
1203
$3.0
3$4
.00
$6;0
0
Prof
essi
onal
Sta
ff C
ost p
er B
orro
w
:i.co
$ite
$e
Figu
re 2
1
75
Sout
h
15 $O 0
0
new
$i 0
0$2
2 00
$300
$00
S500
$a o
o
Prof
essi
onal
Sta
ff C
ost p
er B
OIT
OW
$7.0
3$e
OD
75
Nor
th
60-
$1.0
3$2
.00
$300
$4.0
3$5
.03
$6.0
0
Prof
essi
onal
Sta
ff C
ost p
er B
orro
w
$8 0
0
Figu
re 2
2
75
Mid
-Wes
t
15 SO C
O$1
03$2
00$3
60$4
.03
$500
16.0
0$7
00
Prof
essi
onal
Sta
ff C
ost p
er B
orro
w
$8 O
D
Figu
re 2
3Fi
gure
24

PRO
FESS
ION
AL
ST
AFF
CO
STPE
R L
OA
N
All
Lib
rari
es
S000
S 1
03S2
.00
13.0
0$4
.00
$5.0
0
Prof
euio
nal S
taff
Cos
t per
Loa
n
$800
$700
$9 0
3
Figu
re 2
5
3 1
75 eo-
Sout
h
45-
SI.C
O52
.18)
Woo
*too
woo
sic°
S100
Prof
esol
onal
Saa
ff C
oot p
er L
oan
$S 0
3
75
Nor
th
to 30x
g
45
it-it
51 .0
0ti2
.00
$11.
03S5
.00
S8.0
0
Prof
essi
onal
Sta
ff C
ost p
er L
oan
$700
Sa 0
0
Figu
re 2
6
Mid
-Wes
t
$O 0
0S
1 00
$200
$3 0
0$4
$5.0
0$6
00
Prof
essi
onal
Sta
ff C
ost p
er L
oan
$7 0
3$8
00
Figu
re 2
7Fi
gure
28
Nonprofessional StaffScatter diagrams (Figures 29-36) for nonprofessional staff costs show that the average
cost for nonprofessional staff per borrow is higher than the average cost for nonprofessionalstaff per loan. The scatter patterns also suggest a more similar use of nonprofessional staffbetween the borrowing and lending operations than was found for professional staff.
Regional illustrations reflect higher staff costs in the North, lower in other regions.
23 3

Nor
th
75 60-
g.45
;
30 1536
.S
ES
E
SE
tor
NE
wP
cw
SE
SE
$oo
$100
0$1
500
Non
prof
essi
onal
Sta
ff C
ost p
er B
orro
w
$260
0$2
500
Figu
re 3
0
75 60-
41.1
.
45-
; 5
15- 0 SO
00
Mid
-Wes
t
NO
NPR
OFE
SSIO
NA
L S
TA
FF C
OST
PER
BO
RR
OW
Figu
re 2
9
Sout
h
Non
prof
essi
onal
Sta
ff C
ost p
er B
orro
w
Figu
re 3
1
SE
stle
ww
SE
OK
SE
$5 0
0$1
0 00
$400
$20
00
Non
prof
essi
onal
Sta
ff C
ost p
er B
orro
w
$25
00
Figu
re 3
2
35
75
Sout
h
60-
as -
oo -
Is -
75
Mid
-Wes
t
60-
15-
NO
NPR
OFE
SSIO
NA
L S
TA
FF C
OST
PER
LO
AN
All
Lib
rari
es
75 70-
)4(
es.
la
eo-
-)1(
56to
50 45 40 35 30W
Ato
w.
25.1
1E
201'
4
15W
kW
10°E 3/
1""i
31(
IE)1
(
5-11
w.
w
0 WO
O55
.00
5100
061
5.00
Non
prof
essi
onal
Sta
ff C
ost p
er L
oan
$20
0062
5 O
D
Figu
re 3
3
0
1000
$5 0
0$1
0 00
$lio
o$z
ico
Non
prok
ssio
nal S
taff
Cos
t per
Loa
n
$25
03
Figu
re 3
5
75
Nor
th
60-
45-
30-
15-
15-
6500
610.
0061
5.00
Non
prof
essi
onal
Sta
ff C
ost p
er L
oan
$25.
03
Figu
re 3
4
)1(
640
$10
$15
00$2
000
Non
prof
essi
onal
Sta
ff C
ost p
er L
oan
$25
00
Figu
re 3
6
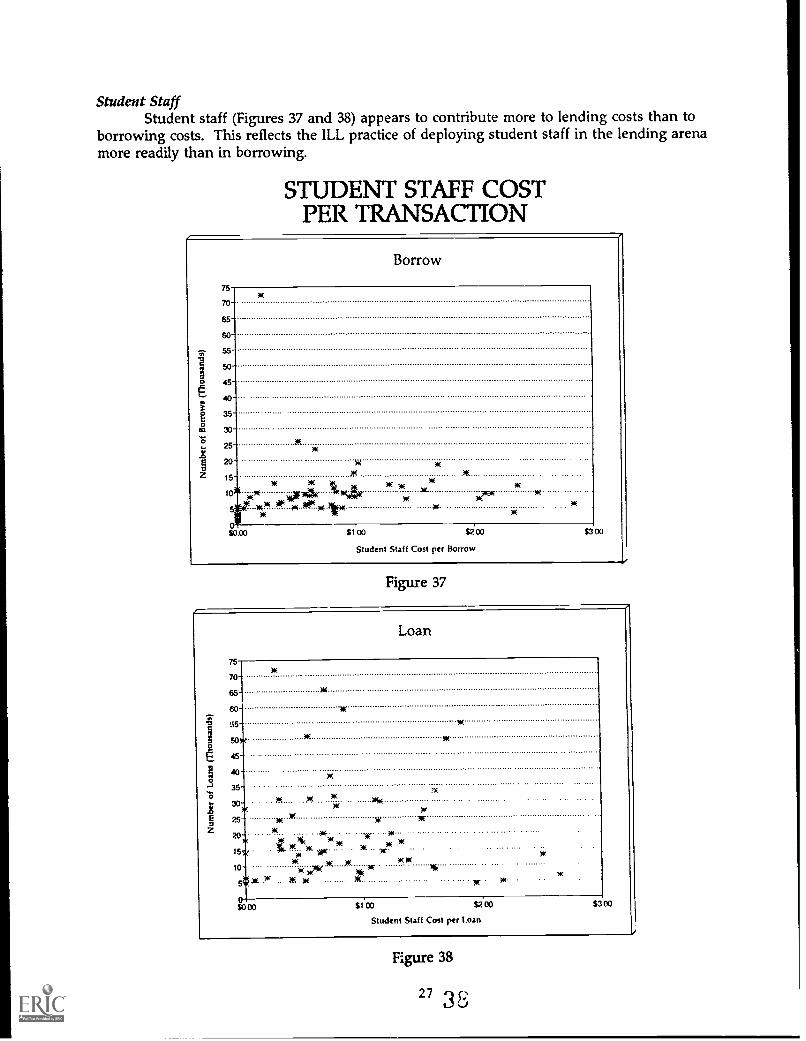
Student StaffStudent staff (Figures 37 and 38) appears to contribute more to lending costs than to
borrowing costs. This reflects the ILL practice of deploying student staff in the lending arenamore readily than in borrowing.
STUDENT STAFF COSTPER TRANSACTION
Borrow
75
70
65
60
55
50
45
40-
35-
30-
25
20
15
1 0
at
NE
311
NE.NE
301
ver4K1,1,.
111
11( )1(
111
)4(
)11
1$C
1e3"at
)1(
at
$0 00 $100 $2133 $3 00
Student Staff Cost per Borrow
Figure 37
Loan
75
70
65
so
lit
50 31( at
45
40 at
at
35
30 A X . )°ENE
/*W
25 NE 31( liE 11F
20 W' w
15 t 34(*X W NrW 34(
1034()4( X X wr
voxYil(
at
$O 03 $1 00 $2 CA
Student Staff Cost per Loan
$3 00
Figure 38
27 3 8
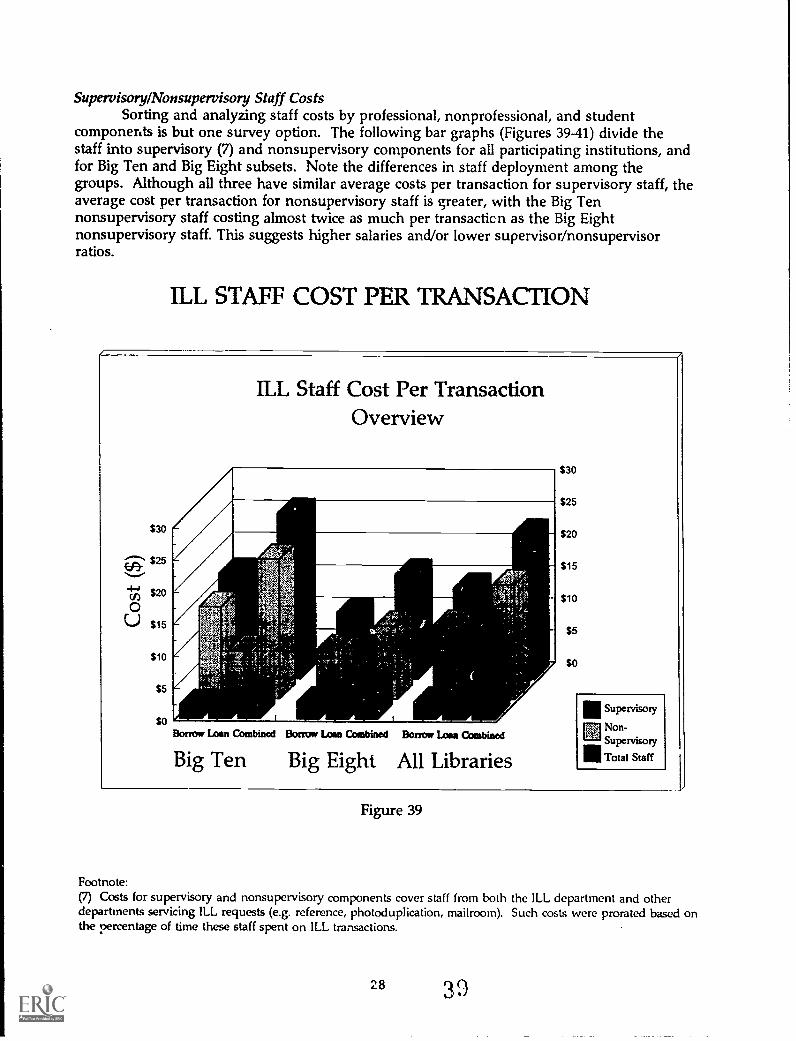
Supervisory/Nonsupavisory Staff CostsSorting and analyzing staff costs by professional, nonprofessional, and student
components is but one survey option. The following bar graphs (Figures 39-41) divide thestaff into supervisory (7) and nonsupervisory components for all participating institutions, andfor Big Ten and Big Eight subsets. Note the differences in staff deployment among thegroups. Although all three have similar average costs per transaction for supervisory staff, theaverage cost per transaction for nonsupervisory staff is greater, with the Big Tennonsupervisory staff costing almost twice as much per transacticn as the Big Eightnonsupervisory staff. This suggests higher salaries and/or lower supervisor/nonsupervisorratios.
ILL STAFF COST PER TRANSACTION
ILL Staff Cost Per TransactionOverview
AIIMMt
$5
$0
A11
$30
$25
$20
IlAttalM $15
Bormw Loan Combined Borrow Loon Combined Borrow Lona Combined
Big Ten Big Eight All Libraries
$10
$5
$0
III Supervisory
Non-Supervisory
III Total Staff
Figure 39
Footnote:(7) Costs for supervisory and nonsupervisory components cover staff from both the ILL department and otherdepartments servicing ILL requests (e.g. reference, photoduplication, mailroom). Such costs were prorated based onthe percentage of time these staff spent on ILL transactions.
28 3

ILL STAFF COST PER TRANSACTION
IN
Loos,........
SO I I i i
Sup. Now*. Total Staff
Big Ten
Figure 40
Supervisory vs. Nonsupervisory Staff
Figure 41
294 9

Total Expenditures
Figures 42 and 43 present the actual gross dollars expended by all libraries in the studyfor borrowing and lending operations. As before, the mean and median are displayed as wellas data on institutions at the 10%, 25%, 75%, and 90% levels.
10%
COST TO BORROWALL LIBRARIES
(in $)
75% Mon Median 75% 90%
Staff: General SupervisoryProfessional 657 3,030 11,510 9440 17,235 24,995
Non Professional 0 0 8,080 3,484 10,832 23,390
Staff:Non SupervisoryProfessional 0 0 10,699 407 18,083 32,709
Non Professional 15,057 30,350 68,349 59,179 84,649 150,050
Student Staff 0 1437 8,079 5,112 14,584 19,968
Networks 31,81 5,788 13,642 12,867 17,436 25,414
Delivery 227 2,495 5,229 5,105 6,900 10,452
Photocopy 0 0 378 100 384 1,105
Supplies 41 463 1458 1,115 1,930 3,065
Other* 0 2,496 11,969 6457 19,428 31,159
includes costs for equipment and software; rental and maintenance; andborrow-related purchasing fees
Figure 42
10%
COST TO LOANALL LIBRARIES
(in $)
25% Mein 90%
Staff: General SupervisoryProfessional 99,914 10,079 27,580 18,514 27,033 50,511
Non Professional o 454 21,542 9,234 24,680 52,379
Staff: Non SupervisoryProfessional 0 0 5,206 0 5,440 13,659
Non Professional 24,494 36,795 106,554 53,808 92,201 158,167
Student Staff 2231 5,554 17,148 10,500 21,738 34,180
Networkt 2,083 4,690 24,066 7,984 19,765 30,607
Delivery 4,838 7247 18,034 11,462 19,451 28,797
Photocopy 459 1,781 8,151 3,299 8,536 24,138
Supplies 408 940 4,386 2,222 4,507 12,156
Other* 0 656 6,004 2,492 5,017 18,864
includes costs for equipment and software; rental and maintenance
Figure 4331
DEST COPY AVAILABLE

Photocopy Activity and Cost
Figures 44-46 display photocopy activity within ILL. The study confirms that amongthe libraries studied, 60% of completed ILL transactions were filled by supplying photocopiesof materials rather than by sending the original item. On average, 49% of all borrowingrequests made by the libraries studied and 64% of the ILL lending requests received by theselibraries were fulfilled with photocopies rather than original materials (see Figure 44).
100
au
so
40
20
0
Original Items vs. Photocopies(Percent of ILL Transactions)
.
:
..;
,
- ,
5114
,......
,..y ,
, ,
'," -
,
....,
3604'
,
.,
,.:, :,,y.....
,s;. ;.. , ;,-;.;''.(V.,";
;.".:.';,5:,,,,..
-', `c,';',14 ',',,
4., e
60%64%49%
Borrows Loans Combined
Original
I i
Photocopks
Figure 44
4°32
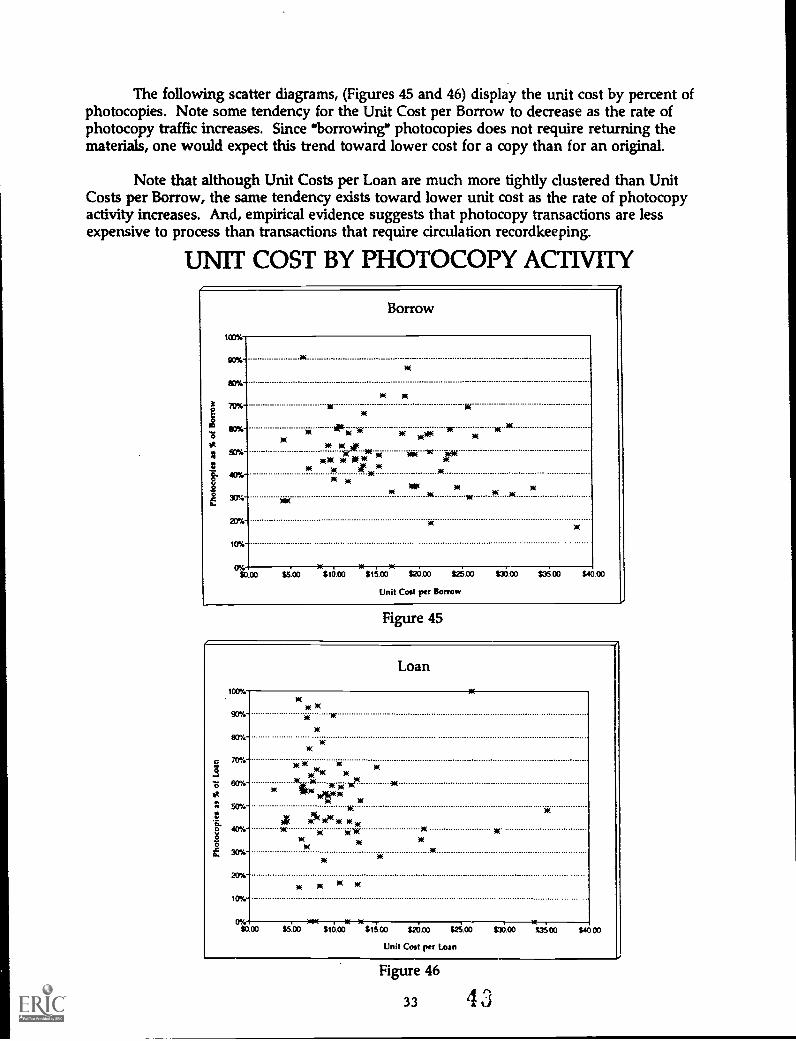
The following scatter diagrams, (Figures 45 and 46) display the unit cost by percent ofphotocopies. Note some tendency for the Unit Cost per Borrow to decrease as the rate ofphotocopy traffic increases. Since "borrowing° photocopies does not require returning thematerials, one would expect this trend toward lower cost for a copy than for an original.
Note that although Unit Costs per Loan are much more tightly clustered than UnitCosts per Borrow, the same tendency exists toward lower unit cost as the rate of photocopyactivity increases. And, empirical evidence suggests that photocopy transactions are lessexpensive to process than transactions that require circulation recordkeeping.
UNTIT COST BY PHOTOCOPY ACTIVITY
Borrow
100%
70%
60%
50%
.E. 40%-
30%-
20%-
10%-
0%$0
sit
AI-, ler
340k W
W 3K
W
ssENW
3:9k
31(
sosof
00 $5.03 $10.06W
$15.00W $20.00 $2500 $3i00 $35.00 $40.00
Un it Cost por Borrow
Figure 45
Loan
100%
90%-
60%
70%
60%
50%
40%-
30%-
20%-
10%-
jiiw.
w )11)4( W
SE
W
leIf"
mc
w
>(wow w.w ww., ww
WW yr
SE
SE
SE
ww
w
w
w
0%$0 00
sow$s:co $10.00 $15.00 s20.00 $25.00
Unit Cost per Loan
$30.00 935 00 PO 00
Figure 46
33 4 3

Conclusions
The study yielded a range of data useful to participating research libraries. Eachparticipating institution received a customized analysis of its ILL "snapshot" costs. Thisanalysis included each research library's unit (per item) cost for borrowing and for lendingand the component cost for each contributing cost category (e.g. staff). In addition, the mean,median, and range for all participating libraries unit and component costs for borrowing andlending were provided.
The aggregate data for the 76 participating libraries showed the mean unit cost forborrowing to be $18.62, and the mean unit cost for lending, $10.93. Combining these twocomponents results in a mean cost per filled ILL transaction of $29.55.
Processing an ILL transaction requires two major parts, the borrowing or requestingeffort, and the lending or filling effort. Therefore, in order to determine the total cost involvedin filling an ILL request, the costs incurred by the borrower must be added to the costsincurred by the lender. As noted before, this study indicates that the average cost for acomplete transaction is $29.55 for the sample population.
Average cost for borrowing = $18.62Average cost for lending = $10.93
Total average transaction cost = $29.55
An individual institution can determine its own unit transaction cost by adding its unitcost for borrowing to the average cost for lending.
Figures from ARL Statistics 1991-92, indicate that a total of 4.1 million items were loanedand 1.4 million items were borrowed by 120 research libraries in North America. Projectingthe cost study results to these figures suggests that in 1991-92 all ARL libraries spent $71million on interlibrary loan operations; $26 million to borrow materials for local users and $45million to loan materials to other libraries.
The most significant cost for ILL operations is staff. Of the $29.55 average cost perfilled ILL transaction, $22.62 may be attributed to staff costs. Staff costs for all participatinginstitutions represent 77% of the cost of an average ILL transaction, with general supervisorystaff costs averaging 16% of the total cost, and nonsupervisory costs averaging about 61%.Further analysis shows that the professional staff component is 15% of the total unit cost,nonprofessional staff is 56%, and student staff is 6%.
For the Big Ten and the Big Eight consortia, staff costs for an average ILL transactionrepresent 80% and 74% of the total cost with general supervisory costs averaging about 12%and 14% and nonsupervisory costs averaging about 68% and 60%, respectively.
34
4 4
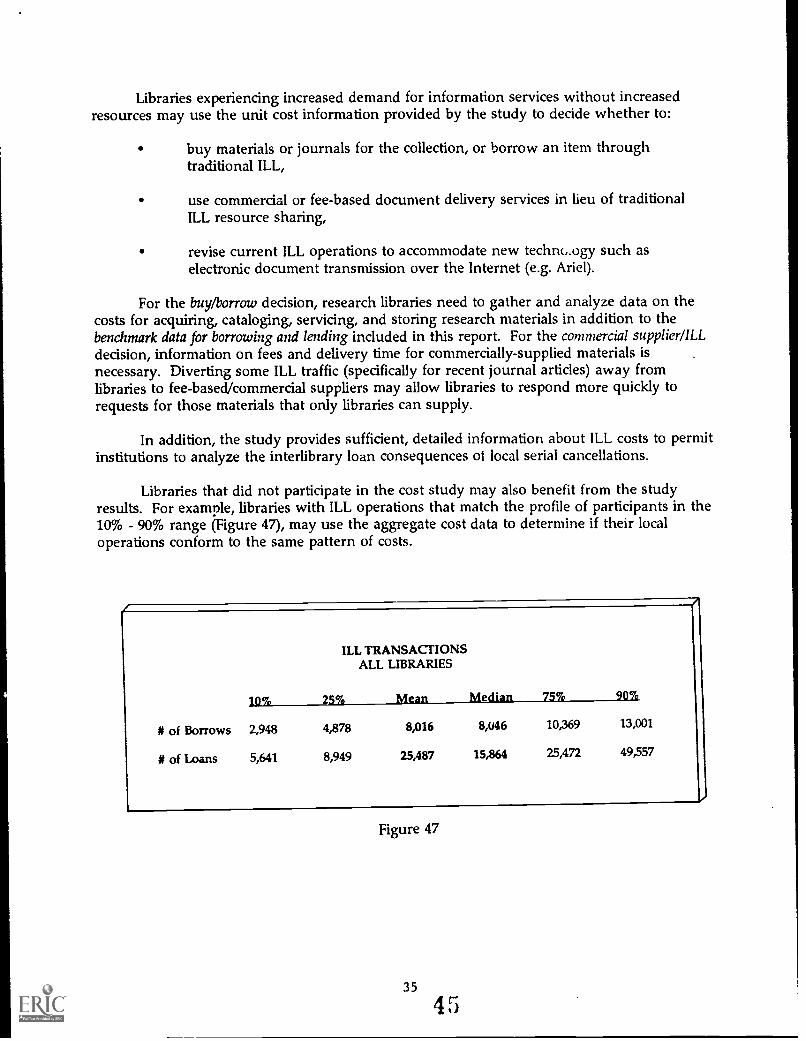
Libraries experiencing increased demand for information services without increasedresources may use the unit cost information provided by the study to decide whether to:
buy materials or journals for the collection, or borrow an item throughtraditional ILL,
use commercial or fee-based document delivery services in lieu of traditionalILL resource sharing,
revise current ILL operations to accommodate new technusogy such aselectronic document transmission over the Internet (e.g. Ariel).
For the buy/borrow decision, research libraries need to gather and analyze data on thecosts for acquiring, cataloging, servicing, and storing research materials in addition to thebenchmark data for borrowing and lending included in this report. For the commercial supplier/ILLdecision, information on fees and delivery time for commercially-supplied materials is .
necessary. Diverting some ILL traffic (specifically for recent journal articles) away fromlibraries to fee-based/commercial suppliers may allow libraries to respond more quickly torequests for those materials that only libraries can supply.
In addition, the study provides sufficient, detailed information about ILL costs to permitinstitutions to analyze the interlibrary loan consequences ot local serial cancellations.
Libraries that did not participate in the cost study may also benefit from the studyresults. For example, libraries with ILL operations that match the profile of participants in the10% - 90% range (Figure 47), may use the aggregate cost data to determine if their localoperations conform to the same pattern of costs.
/
ILL TRANSACTIONSALL LIBRARIES
10% 25% Mean Median 75% 90%
# of Borrows 2,948 4,878 8,016 8,U46 10,369 13,001
# of Loans 5,641 8,949 25,487 15,864 25,472 49,557
Figure 47

APPENDICES
41;
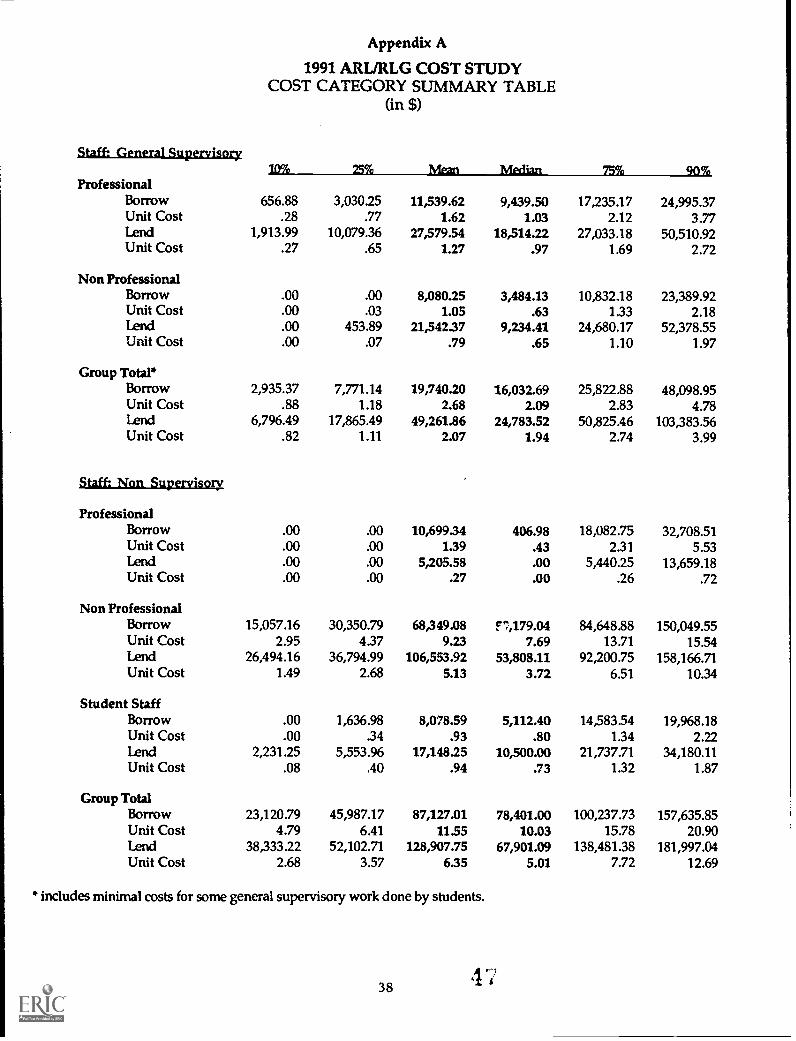
Appendix A
1991 ARL/RLG COST STUDYCOST CATEGORY SUMMARY TABLE
(in $)
Staff-General Supervisory
Professional10% 25% Mean Median 75% 90%
Borrow 656.88 3,030.25 11,539.62 9,439.50 17,235.17 24,995.37Unit Cost .28 .77 1.62 1.03 2.12 3.77Lend 1,913.99 10,079.36 27,579.54 18,514.22 27,033.18 50,510.92Unit Cost .27 .65 1.27 .97 1.69 2.72
Non ProfessionalBorrow .00 .00 8,080.25 3,484.13 10,832.18 23,389.92Unit Cost .00 .03 1.05 .63 1.33 2.18Lend .00 453.89 21,542.37 9,234.41 24,680.17 52,378.55Unit Cost .00 .07 .79 .65 1.10 1.97
Group Total*Borrow 2,935.37 7,771.14 19,740.20 16,032.69 25,822.88 48,098.95Unit Cost .88 1.18 2.68 2.09 2.83 4.78Lend 6,796.49 17,865.49 49,261.86 24,783.52 50,825.46 103,383.56Unit Cost .82 1.11 2.07 1.94 2.74 3.99
Staff: Non Supervisory
ProfessionalBorrow .00 .00 10,699.34 406.98 18,082.75 32,708.51Unit Cost .00 .00 1.39 .43 2.31 5.53Lend .00 .00 5,205.58 .00 5,440.25 13,659.18Unit Cost .00 .00 .27 .00 .26 .72
Non ProfessionalBorrow 15,057.16 30,350.79 68,349.08 F":,179.04 84,648.88 150,049.55Unit Cost 2.95 4.37 9.23 7.69 13.71 15.54Lend 26,494.16 36,794.99 106,553.92 53,808.11 92,200.75 158,166.71Unit Cost 1.49 2.68 5.13 3.72 6.51 10.34
Student StaffBorrow .00 1,636.98 8,078.59 5,112.40 14,583.54 19,968.18Unit Cost .00 .34 .93 .80 1.34 2.22Lend 2,231.25 5,553.96 17,148.25 10,500.00 21,737.71 34,180.11Unit Cost .08 .40 .94 .73 1.32 1.87
Group TotalBorrow 23,120.79 45,987.17 87,127.01 78,401.00 100,237.73 157,635.85Unit Cost 4.79 6.41 11.55 10.03 15.78 20.90Lend 38,333.22 52,102.71 128,907.75 67,901.09 138,481.38 181,997.04Unit Cost 2.68 3.57 6.35 5.01 7.72 12.69
" includes minimal costs for some general supervisory work done by students.
38

Networks
RLIN10% 25% Mean Media 75% 90%
Borrow .00 .00 2,752.74 245.50 3,646.50 11,028.60
Unit Cost .00 .00 .39 .05 .54 1.20
Lend .00 .00 2,378.57 .00 3,883.50 9,074.90
Unit Cost .00 .00 .16 ,00 .25 .54
OCLCBorrow .00 2,433.50 7,445.03 5,671.50 10,550.25 17,883.30
Unit Cost .18 .43 .96 .77 1.40 1.98
Lend .00 2,355.75 8,258.65 5,248.50 11,054.75 19,899.20
Unit Cost .00 .12 .45 .38 .67 .99
Group Total*Borrow 3,181.15 5,787.56 13,642.46 12,867.39 17,435.75 25,413.72
Unit Cost .66 1.04 1.79 1.53 2.13 3.00
Lend 2,083.20 4,689.75 24,065.50 7,983.50 19,765.00 30,606.70
Unit Cost .11 .33 .79 .70 1.08 1.58
DeliveryBorrow 227.10 2,494.50 5,229.37 5,104.50 6,899.75 10,452.31
Unit Cost .11 .36 .71 .69 1.03 1.27
Lend 4,838.40 7,246.50 18,033.85 11,462.00 19,450.75 28,797.40
Unit Cost .33 .50 .86 .82 1.17 1.46
PhotocopyBorrow .00 .00 377.59 100.00 384.00 1,104.83
Unit Cost .00 .00 .07 .02 .05 .14
Lend 459.00 1,780.75 8,150.96 3,299.00 8,536.00 24,137.90
Unit Cost .05 .14 .36 .25 .40 .73
SuppliesBorrow 41.40 462.50 1,657.62 1,115.00 1,930.05 3,065.20
Unit Cost .04 .07 .20 .17 .27 .43
Lend 408.10 940.25 4,386.32 2,221.50 4,506.75 12,155.70
Unit Cost
equipment ISK Software
.04 .07 .20 .14 .25 .45
Borrow .00 584.25 2,107.29 1,404.50 2,467.75 6,233.00
Unit Cost .00 .09 .30 .18 .32 .89
Lend .00 656.25 3,518.79 1,985.00 3,691.50 12,997.50
Unit Cost .00 .05 .23 .13 .23 .43
RentaLiallaintenanstBorrow .00 .00 469.10 98.50 578.00 919.80
Unit Cost .00 .00 .06 .02 .07 .16
Lend .00 .00 2,485.31 507.00 1,354.75 5,866.00
Unit Cost .00 .00 .08 .03 .08 .22
PurthasinglemCharged"Borrow .00 1,912.27 9,392.91 5,153.00 16,381.55 24,005.60
Unit Cost .01 .37 1.27 .86 1.82 2.86
* includes the sum of all reported networks* * addresses only borrow-related fees
39

Appendix B
Methodology
The methodology for this study was adapted from the cost model published by StephenDickson and Virginia Boucher in Research Access Through New Technology, edited Mary E.Jackson, AMS, 1989. The model employed in the current study covers both borrowing andlending costs whereas the original dealt exclusively with lending costs.
Appendix C
Project Cost Categories
The ILL cost study focused exclusively on costs directly associated with interlibraryborrowing and lending activities. Costs captured by the survey have been grouped into thefollowing cost categories:
Staff - Two major categories, Supervisory and Nonsupervisory; within thesecategories, staff were divided into three levels, Professional, Nonprofessionaland Student.
Network and Communications - Telephone (local and long distance),electronic mail, and network services (dial-up and leased lines, searching fees,and terminal maintenance).
Delivery - Postage, parcel delivery service, fax, courier/shuttle, other deliveryoptions.
Photocopy - Copying for filling ILL requests and for other ILL purposes. Someinstitutions were unable to separate out staff and paper costs for photocopy;these costs are included in the Staff and Supplies cost categories.
Supplies - Paper for printer, fax, and photocopy, printer cartridges, mailinglabels, imprinted envelopes, special wrapping supplies.
Equipment and Software - Annual use charges (25% of purchase price forequipment less than five years old) for equipment; purchase price for software.
Rental and Maintenance - Equipment rental and maintenance, annual softwareleasing.
Direct and Indirect Borrowing Charges Coupons, debit accounts, chargesfrom suppliers, including copyright fees.
Borrowing Cost Recovery - Reimbursement/income recovered from borrowingactivity. (See point 4 in Appendix D)
Lending Cost Recovery - Reimbursement/income recovered from lendingactivity. (See point 4 in Appendix D)
40 4 a

Appendix D
Data Collection and Analysis
1. Filled transactions - Since filled transactions are the "products" of interlibrary loan, onlyfilled transactions are used to produce unit costs. One could compare this to a companydetermining unit cost of manufacturing based on finished goods.
2. Network costs - Network costs represent the costs for various telecommunicationsalternatives, including fees for Internet; RLIN, OCLC, and other leased or dial-up connections;and telephone (local and long distance). The unit costs for all networking componentsindicate that part of the unit borrowing or lending cost that can be ascribed totelecommurdcations. The unit costs listed under RLIN or OCLC reflect the cost per unitattributed to these particular services.
3. Center for Research Libraries fees - ARL/ELG decided not to include CRL fees whenproducing the Unit Cost per Borrow because the focus of CRL is cooperative collectiondevelopment, not document delivery. Cost Study participants were referred to theinstructions contained in Appendix F to determine how to allocate any ILL-related portion oftheir CRL fees to their Unit Cost per Borrow.
4. Reimbursements/cost recovery - Because no standard reimbursement or cost recoverymodel for all participating institutions exists, the analysis does not include the reimbursementsreceived by the individual institutions and focuses only on the gross rather than net costs forborrowing or lending. To include these reimbursements would artificially reduce the truecosts for borrowing or lending, and would disallow cost comparisons across institutions.These cost recoveries could be in the form of direct revenues for services rendered, such asuser fees, state subsidies for document delivery and student aid, or free state shuttle ornetworking services.
5. Normalization of salaries Resources did not permit the normalization of salaries to beincluded in this analysis of cost study data.
6. Confidentiality of data - Participants in this study data were guaranteed confidentialityof their data. However, many have agreed to consider requests from researchers for access tothe data specific to their library. ARL maintains a list of contacts for such requests.
41 5
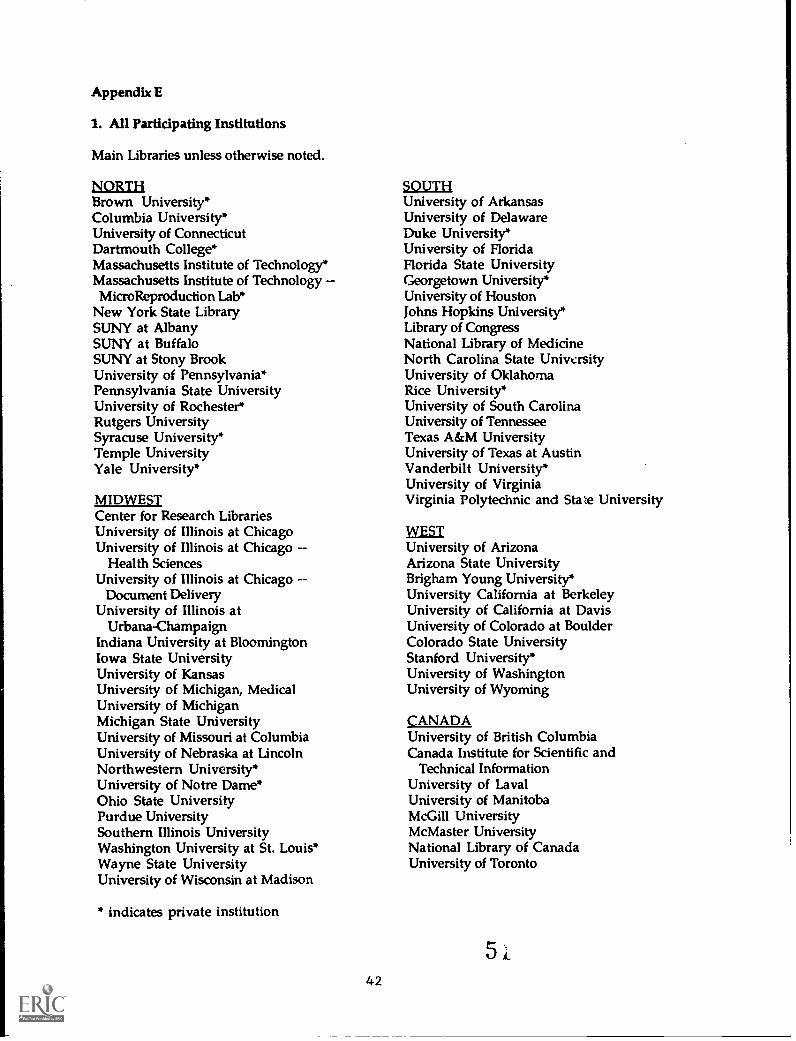
Appendix E
1. All Participating Institutions
Main Libraries unless otherwise noted.
NORTHBrown University*Columbia University*University of ConnecticutDartmouth College*Massachusetts Institute of Technology*Massachusetts Institute of TechnologyMicro Reproduction Lab*
New York State LibrarySUNY at AlbanySUNY at BuffaloSUNY at Stony BrookUniversity of Pennsylvania*Pennsylvania State UniversityUniversity of Rochester*Rutgers UniversitySyracuse University*Temple UniversityYale University*
MIDWESTCenter for Research LibrariesUniversity of Illinois at ChicagoUniversity of Illinois at Chicago --
Health SciencesUniversity of Illinois at Chicago --
Document DeliveryUniversity of Illinois at
Urbana-ChampaignIndiana University at BloomingtonIowa State UniversityUniversity of KansasUniversity of Michigan, MedicalUniversity of MichiganMichigan State UniversityUniversity of Missouri at ColumbiaUniversity of Nebraska at LincolnNorthwestern University*University of Notre Dame*Ohio State UniversityPurdue UniversitySouthern Illinois UniversityWashington University at St. Louis*Wayne State UniversityUniversity of Wisconsin at Madison
* indicates private institution
42
SOUTHUniversity of ArkansasUniversity of DelawareDuke University*University of FloridaFlorida State UniversityGeorgetown University*University of HoustonJohns Hopkins University*Library of CongressNational Library of MedicineNorth Carolina State UniversityUniversity of OklahomaRice University*University of South CarolinaUniversity of TennesseeTexas A&M UniversityUniversity of Texas at AustinVanderbilt UniversitrUniversity of VirginiaVirginia Polytechnic and State University
WESTUniversity of ArizonaArizona State UniversityBrigham Young University*University California at BerkeleyUniversity of California at DavisUniversity of Colorado at BoulderColorado State UniversityStanford University*University of WashingtonUniversity of Wyoming
CANADAUniversity of British ColumbiaCanada Institute for Scientific and
Technical InformationUniversity of LavalUniversity of ManitobaMcGill UniversityMcMaster UniversityNational Library of CanadaUniversity of Toronto

2. Big Ten Consortuim
University of Illinois at ChicagoUniversity of Illinois at
Urbana- ChampaignIndiana University at BloomingtonUniversity of MichiganMichigan State UniversityNorthwestern UniversityOhio State UniversityPennsylvania State UniversityPurdue UniversityUniversity of Wisconsin at Madison
3. Big Eight Consortium
University of Arkansas*Colorado State UniversityIowa State UniversitySouthern Illinois UniversityUniversity of ColoradoUniversity of KansasUniversity of MissouriUniversity of NebraskaUniversity of OklahomaUniversity of Wyoming*
* consortial partners of the Big Eight
43
5
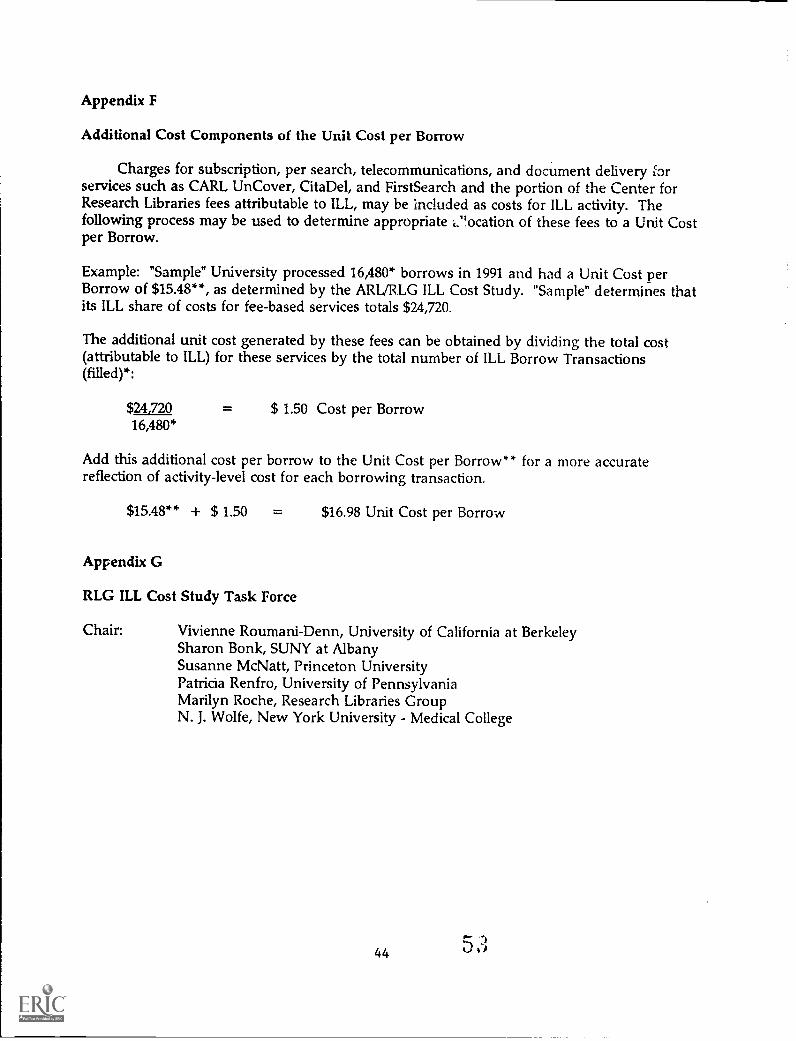
Appendix F
Additional Cost Components of the Unit Cost per Borrow
Charges for subscription, per search, telecommunications, and document delivery forservices such as CARL UnCover, Cita Del, and First Search and the portion of the Center forResearch Libraries fees attributable to ILL, may be included as costs for ILL activity. Thefollowing process may be used to determine appropriate i.".ocation of these fees to a Unit Costper Borrow.
Example: "Sample" University processed 16,480* borrows in 1991 and had a Unit Cost perBorrow of $15.48**, as determined by the ARL/RLG ILL Cost Study. "Sample" determines thatits ILL share of costs for fee-based services totals $24,720.
The additional unit cost generated by these fees can be obtained by dividing the total cost(attributable to ILL) for these services by the total number of ILL Borrow Transactions(filled)*:
$24,720 = $ 1.50 Cost per Borrow16,480*
Add this additional cost per borrow to the Unit Cost per Borrow** for a more accuratereflection of activity-level cost for each borrowing transaction.
$15.48** + $ 1.50 = $16.98 Unit Cost per Borrow
Appendix G
RLG ILL Cost Study Task Force
Chair: Vivienne Roumani-Denn, University of California at BerkeleySharon Bonk, SUNY at AlbanySusanne McNatt, Princeton UniversityPatricia Renfro, University of PennsylvaniaMarilyn Roche, Research Libraries GroupN. J. Wolfe, New York University - Medical College
44 53

Appendix HSurvey Instrument
ARL/RLG INTERLIBRARY LOAN COST STUDY
INTRODUCTION
The purpose of this joint ARL/RLG Interlibrary Loan Cost Study is to establish benchmark datafor discussion within the ARL corn i.nity of the economics of document delivery.
The RLG Public Services Committee developed the draft interlibrary loan (ILL) cost study in spring1991 to identify the unit cost of an ILL transaction for use in making preliminary comparisons withthe cost of alternative methods of obtaining information and documents for the patrons of itsmember institutions. In the fall of 1991, RLG approached ARL to suggest that the ILL study beundertaken jointly so as to assure a larger number of participating institutions that would yielduseful aggregate data and provide benchmark data for ILL costs in North American researchlibraries. In October, the ARL Board endorsed the joint project. The work plan for the projectanticipates that each organization will contribute expertise in its areas of strength: RLG its dataanalysis capabilities, and ARL its experience with survey instruments and techniques, and its directties to directors of 119 research libraries.
Libraries experiencing increased demand for information services without increased resources,may use unit cost information:
1. to decide whether to borrow an item through ILL or acquire it for the collection;
2. to decide when to use a commercial document delivery service in lieu of traditional ILLprocedures; and
3. to study the impact of serial cancellations.
This study focuses exclusively on costs directly associated with interlibrary borrowing and lendingactivities. Costs of major library functions such as collection development, acquisitions, catalcging,and general circulation are not included, nor are any factors representing general overhead. All ofthese activities are necessary preconditions for an ILL service but are viewed as indirect costs andare not included in this study. Obvious exceptions to these guidelines include non-circulatinglibraries where the entire circulation function exists primarily for the purpose of interlibrary loan.
The methodology is adapted from the cost study model published by Stephen Dickson and VirginiaBoucher in Research Access Through New Technology, edited by Mary Jackson, NY: AMS, 1989. Themajor difference is that our model deals with both borrowing and lentling costs whereas the originaldealt exclusively with lending costs.
Although this present study should yield wide ranges of data useful to participating institutions,the chief goal is to determine unit borrowing and lending cost information for ILL transactions.Care should be exercised when comparing this unit cost information with that from other ILL coststudies which may or may not include indirect and /or overhead costs.
Note: The data collected in this survey will be reported in the aggregate only. Data will not be madeavailable for comparison on a library-by-library basis.
4554
Page 1-2 ILL Cost Stud.,
INSTRUCTIONS
DEFINITIONS AND GENERAL INSTRUCTIONS
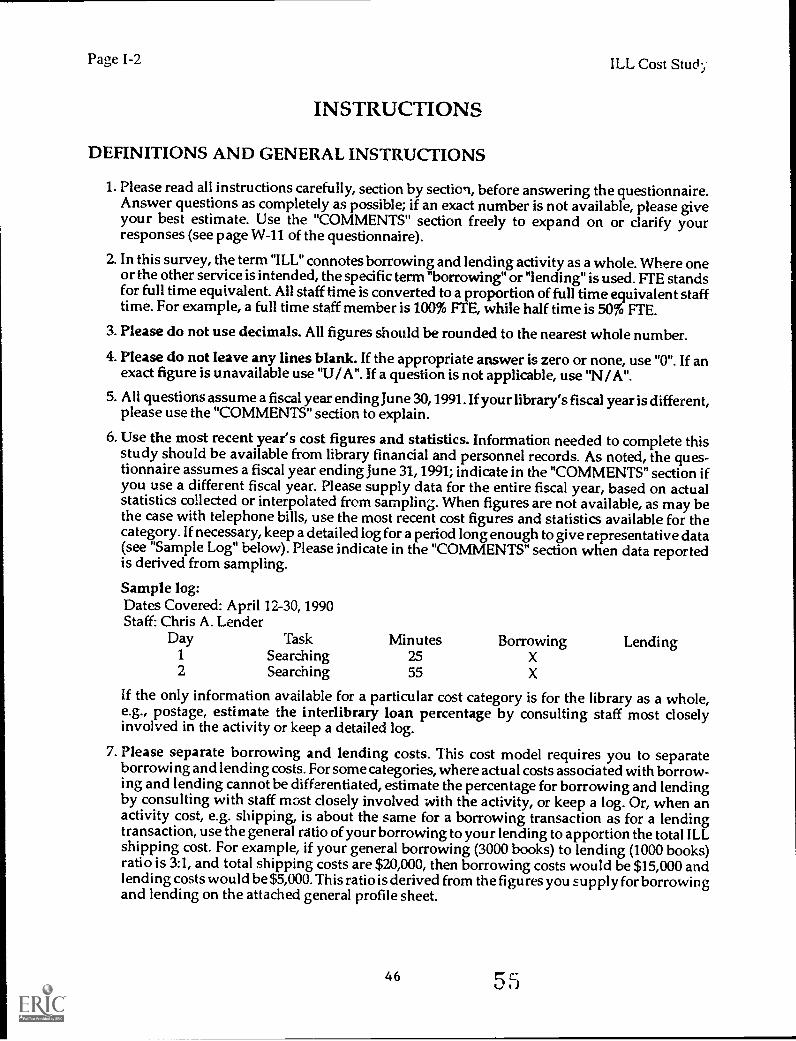
1. Please read all instructions carefully, section by section, before answering the questionnaire.Answer questions as completely as possible; if an exact number is not available, please giveyour best estimate. Use the "COMMENTS" section freely to expand on or clarify yourresponses (see page W-11 of the questionnaire).
2. In this survey, the term "ILL" connotes borrowing and lending activity as a whole. Where oneor the other service is intended, the specific term "borrowing" or "lending" is used. FTE standsfor full time equivalent. All staff time is converted to a proportion of full time equivalent stafftime. For example, a full time staff member is 100% FTE, while half time is 50% FTE.
3. Please do not use decimals. All figures should be rounded to the nearest whole number.
4. Please do not leave any lines blank. If the appropriate answer is zero or none, use "0". If anexact figure is unavailable use "U/ A". If a question is not applicable, use "N/ A".
5. All questions assume a fiscal year ending June 30, 1991. Ifyour library's fiscal year is different,please use the "COMMENTS" section to explain.
6. Use the most recent year's cost figures and statistics. Information needed to complete thisstudy should be available from library financial and personnel records. As noted, the ques-tionnaire assumes a fiscal year ending June 31, 1991; indicate in the "COMMENTS" section ifyou use a different fiscal year. Please supply data for the entire fiscal year, based on actualstatistics collected or interpolated from sampling. When figures are not available, as may bethe case with telephone bills, use the most recent cost figures and statistics available for thecategory. If necessary, keep a detailed log for a period long enough to give representative data(see "Sample Log" below). Please indicate in the "COMMENTS" section when data reportedis derived from sampling.
Sample log:Dates Covered: April 12-30, 1990Staff: Chris A. Lender
Day Task Minutes Borrowing Lending1 Searching 25 X2 Searching 55 X
If the only information available for a particular cost category is for the library as a whole,e.g., postage, estimate the interlibrary loan percentage by consulting staff most closelyinvolved in the activity or keep a detailed log.
7. Please separate borrowing and lending costs. This cost model requires you to separateborrowing and lending costs. For some categories, where actual costs associated with borrow-ing and lending cannot be differentiated, estimate the percentage for borrowing and lendingby consulting with staff most closely involved with the activity, or keep a log. Or, when anactivity cost, e.g. shipping, is about the same for a borrowing transaction as for a lendingtransaction, use the general ratio of your borrowing to your lending to apportion the total ILLshipping cost. For example, if your general borrowing (3000 books) to lending (1000 books)ratio is 3:1, and total shipping costs are $20,000, then borrowing costs would be $15,000 andlending costs would be $5,000. This ratio is derived from the figures you supply for borrowingand lending on the attached general profile sheet.
46 5,5
ILL Cost Study Page 1-3
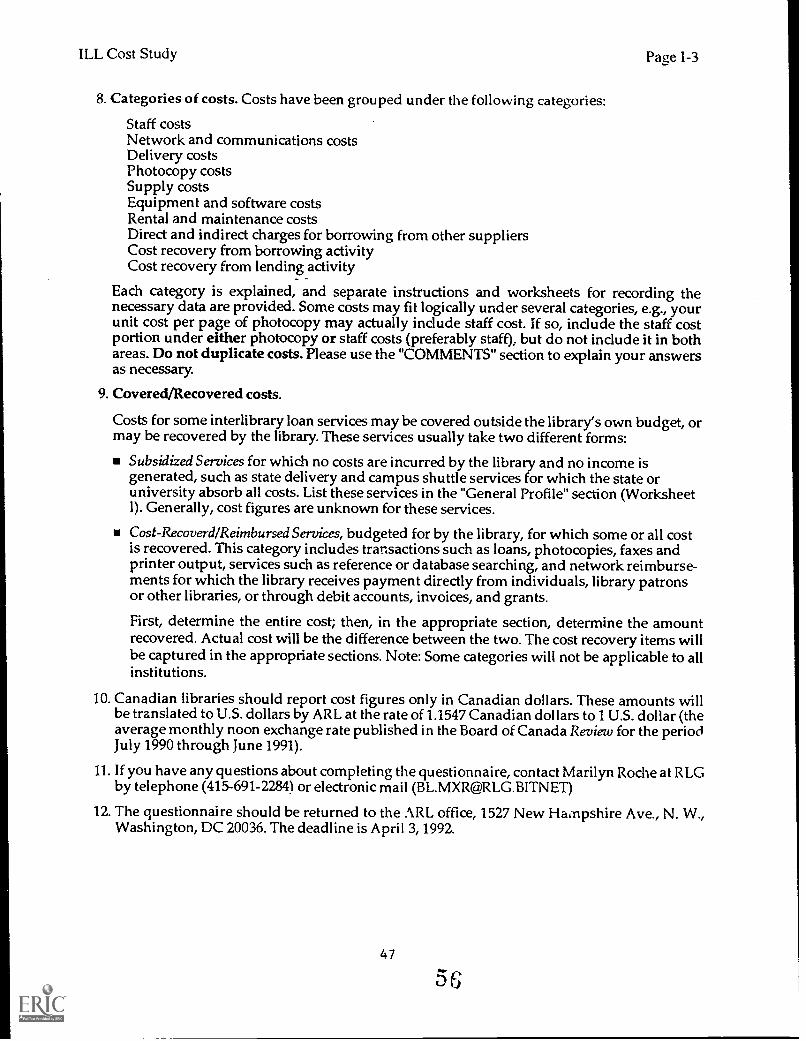
8. Categories of costs. Costs have been grouped under the following categories:
Staff costsNetwork and communications costsDelivery costsPhotocopy costsSupply costsEquipment and software costsRental and maintenance costsDirect and indirect charges for borrowing from other suppliersCost recovery from borrowing activityCost recovery from lending activity
Each category is explained, and separate instructions and worksheets for recording thenecessary data are provided. Some costs may fit logically under several categories, e.g., yourunit cost per page of photocopy may actually include staff cost. If so, include the staff costportion under either photocopy or staff costs (preferably staff), but do not include it in bothareas. Do not duplicate costs. Please use the "COMMENTS" section to explain your answersas necessary
9. Covered/Recovered costs.
Costs for some interlibrary loan services may be covered outside the library's own budget, ormay be recovered by the library. These services usually take two different forms:
Subsidized Services for which no costs are incurred by the library and no income isgenerated, such as state delivery and campus shuttle services for which the state oruniversity absorb all costs. List these services in the "General Profile" section (WorksheetI). Generally, cost figures are unknown for these services.
Cost-Recoverd/ Reimbursed Services, budgeted for by the library, for which some or all costis recovered. This category includes transactions such as loans, photocopies, faxes andprinter output, services such as reference or database searching, and network reimburse-ments for which the library receives payment directly from individuals, library patronsor other libraries, or through debit accounts, invoices, and grants.
First, determine the entire cost; then, in the appropriate section, determine the amountrecovered. Actual cost will be the difference between the two. The cost recovery items willbe captured in the appropriate sections. Note: Some categories will not be applicable to allinstitutions.
10. Canadian libraries should report cost figures only in Canadian dollars. These amounts willbe translated to U.S. dollars by ARL at the rate of 1.1547 Canadian dollars to 1 U.S. dollar (theaverage monthly noon exchange rate published in the Board of Canada Review for the periodJuly 1990 through June 1991).
11. If you have any questions about completing the questionnaire, contact Marilyn Roche at RLGby telephone (415-691-2284) or electronic mail ([email protected])
12. The questionnaire should be returned to the ARL office, 1527 New Hampshire Ave., N. W.,Washington, DC 20036. The deadline is April 3, 1992.
47
5 6

Page 1-4
SPECIFIC INSTRUCTIONS
ILL Cost Study
WORKS KEET I: GENERAL PROFILE OF ILL UNIT COMPLETING THISSTUDY (see p. W-1)
Collect data only from the central ILL unit or, in the case of decentralized ILL operations, from themain library or largest ILL service unit. Please be sure to indicate the name of this unit.
WORKSHEETS II: NON-SUPERVISORY STAFF COSTS (see p. W-3)
When identifying staff, include all those employed in other library operations services, or brancheswho spend part time or sporadic amounts of time processing or servicing ILL requests at the mainILL unit only. The aim is to be comprehensive in accounting for staff time for processing ILLrequests. In some instances, a central service unit providing a direct service for ILL requests, suchas photocopying, may charge interlibrary loan a flat fee or a unit cost per request that includesnotonly staff costs but also machine and supplies costs. If you are unable to separate out staff costs,include these comprehensive charges in total under another heading (e.g. deliverycosts, photocopycosts). Please do not duplicate staff costs here if you are including them in another category.
Only aggregate staffing cost data is to be reported in this survey. To assist in the calculation of totalcosts, a worksheet for individual staff members is included with the instructions (see page 1-5). DONOT INCLUDE THIS WORKSHEET WITH YOUR COMPLETED QUESTIONNAIRE.
1. Identify all staff members who assist in processing ILL requests. Fill outa separate section onthe worksheet for each one, recording separately the percentage of time for borrowing andfor lending activities.
2. Determine the salary of each staff member. Convert hourly or monthly salary to an annual rate.
3. Record the institutional fringe benefit rate for individuals who receive fringe benefits.
4. Determine the percentages of time spent on borrowing and lending. If the total amount, orthe percentage for borrowing and lending, is not known, have someone close to the activityestimate, or keep a detailed log long enough to provide representative data. Since staff timeaccounts for a major proportion of costs, make these numbers as accurate as possible.
5. Include staff for whom you get partial or full reimbursement from a source other than thelibrary budget, or for whom there is no cost (e.g. students on financial aid). State the salaryequivalent for such staff, and the percentage of reimbursement, if any.
6. Add costs together and report only the total for each group: professional, nonprofessional,and student FTE. Also, please indicate the number of staff in each category.
48 57

ILL Cost Study Page 1-5
WORKSHEET FOR CALCULATING STAFF COSTS
(1) Staff membera. Professionalb. Nonprofessionalc. Studentd. Annual salarye. (%) Fringe benefit ratef. Percent of time in borrowing
g. Percent of time in lendingh. Percent (if any) reimbursed
(2) Staff membera. Professionalb. Nonprofessionalc. Studentd. Annual salarye. (%) Fringe benefit ratef. Percent of time in borrowingg. Percent of time in lendingh. Percent (if any) reimbursed
(3) Staff membera. Professionalb. Nonprofessionalc. Studentd. Annual salarye. (%) Fringe benefit ratef. Percent of time in borrowing
g. Percent of time in lendingh. Percent (if any) reimbursed
(4) Staff membera. Professionalb. Nonprofessionalc. Studentd. Annual salarye. (%) Fringe benefit ratef. Percent of time in borrowing
g. Percent of time in lendingh. Percent (if any) reimbursed
Do not return this worksheet. Report total staff costs in Worksheet II.
49
53

Page 1-6 ILL Cost Study
WORKSHEET III: GENERAL SUPERVISORY STAFF COSTS (see p. W-3)
Supervisory and managerial staff costs, which are to be included here, may be difficult to collectfor this study. Identify and include only those costs directly associated with ILL operations. SinceILL supervision and management responsibilities may be spread among several persons bothwithin and outside the ILL department (e.g. circulation supervisor---see items 6 and 7), please usethe list of activities below to decide the appropriate staff member and the proportion of his/hertime that should be included on "WORKSHEET III: GENERAL SUPERVISORY STAFF COSTS".
1. Daily supervising and coordinating the processing of ILL requests2. Training ILL staff3. Hiring decisions for ILL staff4. Preparing budget information for ILL.5. Drafting ILL reports, for example, contract activity.6. Resolving ILL problems, induding bibliographic and patron-related problems.7. Coordinating regularly the ILL-related activity carried out by staff in several library units.8. Interpreting policy to ILL patrons.9. Performing general ILL duties not directly attributed to either borrowing or lending
10. Participating in other library or professional activities, such as committee work, by anyonewho is substantially involved in any of the above activities.
To compute the cost of each general supervisory staff member, use the following formula:
Supervisory CostT x (S + (SxF))
Time Salary Fringe Benefits
G = General Supervisory Staff CostS = Average salary for rank or rang::F = Fringe benefit rateT = % of time spent in general supervisory activity
Report only the total supervisory staff costs in each category (professional, nonprofe33ional, andstudent FTE).
WORKSHEET IV: NETWORK AND COMMUNICATIONS COSTS (see p. W-4)
Included here are applicable costs of telephone, electronic mail, network fees (e.g. RLIN, OCLC).
Telephone services
Calculate total cost for borrowing and for lending, or estimate percentages for borrowing andlending, or keep a log. Include:
1. Local service cost, that is, flat rate phone fees, and local area message unit costs. Include hereonly desk phones. Telecommunications charges for other equipment, such as RLIN, FAX,OCLC, DOBIS, UTLAS, E-Mail systems, are captured elsewhere in the survey.
2. Long distance. If sped fic long distance charges are not available, estimate the total ILL portionof the phone bill.
505 9
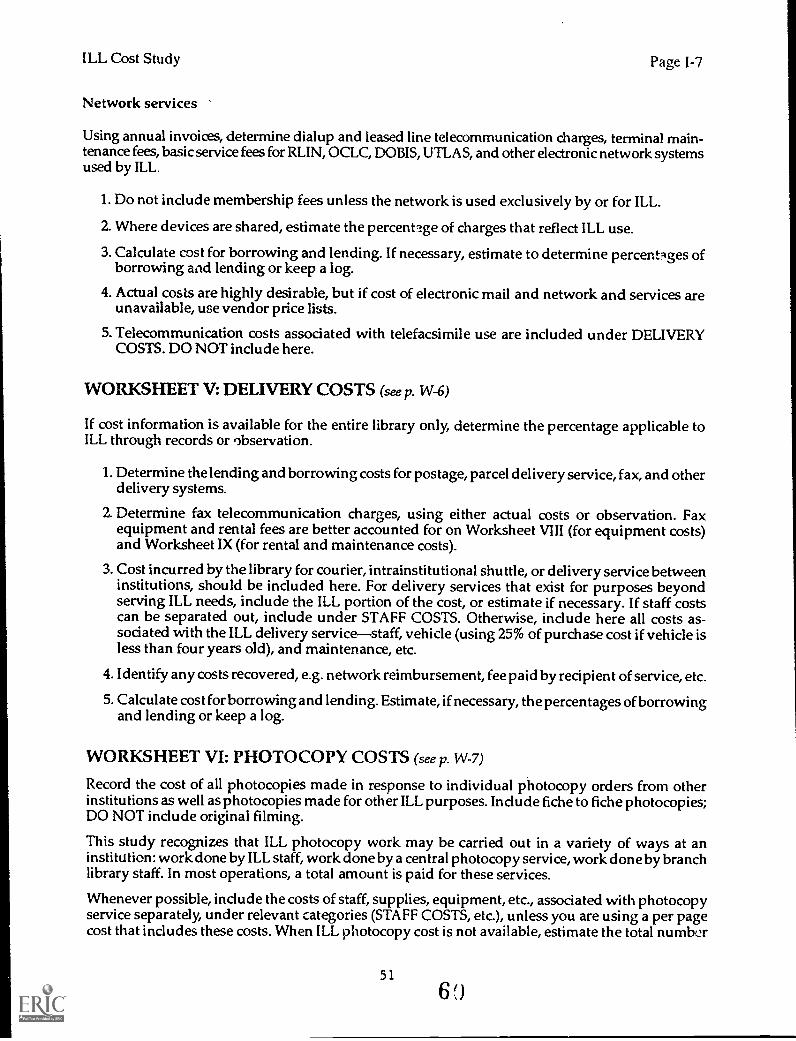
ILL Cost Study Page 1-7
Network services
Using annual invoices, determine dialup and leased line telecommunication charges, terminal main-tenance fees, basic service fees for RLIN, OCLC, DOBIS, UTLAS, and other electronic network systemsused by ILL.
I. Do not include membership fees unless the network is used exclusively by or for ILL.
2. Where devices are shared, estimate the percentage of charges that reflect ILL use.
3. Calculate cost for borrowing and lending. If necessary, estimate to determine percentges ofborrowing and lending or keep a log.
4. Actual costs are highly desirable, but if cost of electronic mail and network and services areunavailable, use vendor price lists.
5. Telecommunication costs associated with telefacsimile use are included under DELIVERYCOSTS. DO NOT include here.
WORKSHEET V: DELIVERY COSTS (see p. W-6)
If cost information is available for the entire library only, determine the percentage applicable toILL through records or observation.
1. Determine the lending and borrowing costs for postage, parcel delivery service, fax, and otherdelivery systems.
2. Determine fax telecommunication charges, using either actual costs or observation. Faxequipment and rental fees are better accounted for on Worksheet VIII (for equipment costs)and Worksheet IX (for rental and maintenance costs).
3. Cost incurred by the library for courier, intrainstitutional shuttle, or delivery service betweeninstitutions, should be included here. For delivery services that exist for purposes beyondserving ILL needs, include the ILL portion of the cost, or estimate if necessary. If staff costscan be separated out, include under STAFF COSTS. Otherwise, include here all costs as-sociated with the ILL delivery servicestaff, vehicle (using 25% of purchase cost if vehicle isless than four years old), and maintenance, etc.
4. Identify any costs recovered, e.g. network reimbursement, fee paid by red pient of service, etc.
5. Calculate cost for borrowing and lending. Estimate, if necessary, the percentages of borrowingand lending or keep a log.
WORKSHEET VI: PHOTOCOPY COSTS (see p. W-7)
Record the cost of all photocopies made in response to individual photocopy orders from otherinstitutions as well as photocopies made for other ILL purposes. Include fiche to fiche photocopies;DO NOT include original filming.
This study recognizes that ILL photocopy work may be carried out in a variety of ways at aninstitution: work done by ILL staff, work done by a central photocopy service, work done by branchlibrary staff. In most operations, a total amount is paid for these services.
Whenever possible, include the costs of staff, supplies, equipment, etc., associated with photocopyservice separately, under relevant categories (STAFF COSTS, etc.), unless you are using a per pagecost that includes these costs. When ILL photocopy cost is not available, estimate the total number
51
6

Page 1-8 ILL Cost Study
of pages photocopied for lending and borrowing per year, and apply your institutional per pagecost. If you do not have an institutional per page photocopy cost, use $.07 per page as a standard.
Any photocopy paper costs for forms reproduced by in-house photocopy methods should becovered here, NOT under SUPPLY COSTS.
Revenue or reimbursement recovered by charging for photocopies on a per transaction basis,should be entered on Worksheet XI and Worksheet XII.
WORKSHEET VII: SUPPLY COSTS (see p. W-7)
Record costs for specialized supplies that are used primarily for ILL, including printer, facsimile,or photocopy paper used for ILL operations, printer ribbon or ink cartridges, mailing labels,imprinted envelopes or other films such as ILL notices, specials wrapping supplies, and ALAforms. Cost for general office supplies, such as pencils and paperclips, are minimal; do not calculate.
Estimate annual borrowing and lending costs for supplies for which actual costs are not known.
Do not include photocopy paper costs for forms reproduced by in-house photocopy methods andcovered above under PHOTOCOPY COSTS.
WORKSHEET VIII: EQUIPMENT AND SOFTWARE COSTS (see p. W-8)
This model employs the concept of annual use charges, widely used in government contracts, toassign an estimated cost for equipment even in periods when no new equipment is purchased.
1. On the data sheet list separately each piece of equipment and software used in ILL activity.
Do not include here photocopy equipment for which a factor was included in the per pagecost used above under PHOTOCOPY COSTS. When use of a photocopy machine for ILLpurposes is very light or sporadic, exdude it from this list.
Include costs for all terminals or computers used, that are not already counted under networkcosts, etc. List separately any software not included in the computer purchase price.
General office equipment, such as desks, and file cabinets, for which the number of usefulyears cannot be estimated (twenty years or more), is not included since the proportional costswould be such a small component of overall costs.
2. Determine the purchase price of each of these items using invoices and price lists.
This model assumes an average "life" for equipment or software to be four years. Annual costis th2refore 25% of purchase price. Estimate for all equipment regardless of age. If an item isused both for ILL work and other work, enter a percentage of the cost equivalent to thepercentage of ILL use. (Note: Purchase price for items more than four years old is 0.)
3. For each piece of equipment calculate the cost for borrowing and lending based uponpercentage of use. If equipment is used equally for borrowing and lending, then you maywant to apportion the total ILL cost to borrowing and lending using the general ratio ofyourborrowing activity to your lending activity. This ratio will be derived from the figures yousupply for borrowing and lending on the attached general profile sheet.
4. In the spaces showing percentages of reimbursement and under "Donated /Locally developedequipment and software", include the value of any equipment and software for which thelibrary was totally or partially reimbursed. Remember to include equipment covered by a grant,such as telefacsimile.
52 6 A.

ILL Cost Study Page 1-9
WORKSHEET IX: RENTAL AND MAINTENANCE COSTS (see p. W-9)
Equipment rental, maintenance, and annual software licensing costs that have not already beenincluded in other cost categories (such as network costs) should be included here.
1. Find the rental, maintenance, and annual software licensing costs for each piece of equipmentused by Borrowing and Lending.
Vendor invoices, rental and maintenance contracts should be used as the source of data, andmonthly charges converted to annual ones as necessary.
2. Indicate the percent of use by borrowing and lending.
WORKSHEET X: FEES CHARGED FOR PURCHASING FROM OTHERSUPPLIERS (see p. W-10)
Determine the annual costs for each type itemized on the worksheet. Where costs are not incurredon an annual basis (such as a block of coupons bought in advance, for example, from NTIS or theAmerican Chemical Society), estimate annual usage. Add additional types if necessary.
WORKSHEET XI: BORROWING ACTIVITY - INCOME RECOVERED (see p.W-10)
Any reimbursement or cost recovery not covered under other categories Cor borrowing should beincluded here. This section may be primarily, but not exclusively, money recovered from localpatrons.
WORKSHEET XII:. LENDING ACTIVITY - INCOME RECOVERED (see p. W-11)
Any reimbursement or cost recovery not covered under other categories should be included here.This section covers money recovered from other sources.
53
62

ARL/RLG INTERLIBRARY LOAN COST STUDYReporting institution Date returned to ARLQuestionnaire completed by (name)Position PhoneContact person (if different)Position PhoneTotal number of ILL service points in library system
WORKSHEET I: GENERAL PROFILE FOR ILL UNIT COMPLETING THISSTUDY (see p. 1-4)
ILL unit responding located in:Campus libraries served by this unit
Borrowing Activity
Total requests per yearNumber of loan requestsNumber of photocopy requestsRequests per system:
RLIN
OCLC
DOBIS
UTLAS
Other automated (please specify)Other not automated (e.g., mail)
Lending Activity
Total requests per yearNumber of loan requestsNumber of photocopy requestsRequests per system
RLIN
OCLC
DOBIS
UTLAS
Other automated (please specify)Other not automated (e.g., mail)
54
Filled Unfilled Total
Filled Unfilled Total
63

ILL Cost Study Page W-2
Number of paid staff
SupervisoryProfessionalNonprofessionalStudent FTE
NonsupervisoryProfessionalNonprofessionalStudent FTE
Number of non-paid staff:
FTEs, volunteers or students not paid through library budget
Major ILL tasks carried out by staff in this and other units (indicate number of full timeequivalent staff, e.g., 2.5 FTE, .4 FIE, etc.):
Check all that apply This ILL Unit Other Units (e.g. Unit Namemail room) (specify)
Receiving requests FTE FTESearching local holdings (borrowing) FTE FTEVerification/location information search FTE FTE(borrowing)Searching for call number information FTE FTE(lending)Responding to requests FTE FTERetrieving volumes (stacks) FTE FTEReshelving in stacks FTE FTE
Wrapping and packaging FTE FTEReceiving/Shipping FTE FTEMaking photocopies FTE FTESending online requests FTE FTE
Creating circulation records FTE FTEInvoicing/billing FTE FTECollection of fines FTE FTE
Subsidized services
I. Networks, including state-wide nnworks, etc. (specify):2. Delivery services (specify):3. Other (specify):
556 4

Page W-3 ILL Cost Study
WORKSHEET II: NON-SUPERVISORY STAFF COSTS (see p. 14)
(1) Professional Staff:
a. Number of FTE Professionalsb. Average Annual SalaryC. (%) Fringe benefit rated. Percent of time in borrowinge. Percent of time in lendingf. Total amount ($) reimbursed
(2) Nonprofessional Staff
a. Number of FIE Nonprofessionalsb. Average Annual SalaryC. (%) Fringe benefit rated. Percent of time in borrowinge. Percent of time in lendingf. Total amount ($) reimbursed
(3) Student Staff
a. Number of FTE Studentsb. Average Annual SalaryC. (%) Fringe benefit rated. Percent of time in borrowinge. Percent of time in lendingf. Total amount ($) reimbursed
WORKSHEET III: GENERAL SUPERVISORY STAFF COSTS (see p. 1-6 )
Su pervisory staffprofessi onal:Supervisory staffnonprofessional:Supervisory staffstudent FTE:
Total cost for supervisory staff:
5613)

ILL Cost Study Page W-4
WORKSHEET IV: NETWORK AND COMMUNICATIONS COSTS (see p. 1-6)
Telephone services
a. Local cost for basic fees and area message units $1. Local cost for borrowing $2. Local cost for lending $3. Cost recovered for borrowing $4. Cost recovered for lending $
b. Long Distance calls $1. Long distance cost for borrowing $2. Long distance cost for lending $3. Cost recovered for borrowing $4. Cost recovered for lending $
Network services
RUNa. Dialup telecommunication charges $b. Leased line telecommunication charges $c. Terminal maintenance $
d. Searching fees $e. Lending cost (based on % of use) $f. Borrowing cost (based on % of use) $g. Cost recovered for borrowing $h. Cost recovered for lending $
OCLCa. ILL transaction records charge $b. OCLC lending credit $
c. Dedicated access $d. Tel ecommu ni cati on equipment $f. Dialup telecommunication charges $
g. Display holdings $h. Billed searches $
i. Regional net administration fee $
j. Other membership fees $
k. Borrowing cost (based on % of use) $
I. Lending cost (based on % of use) $m. Cost recovered for borrowing $n. Cost recovered for lending $
o. ILL tape-loading charge $
5 7
6 6
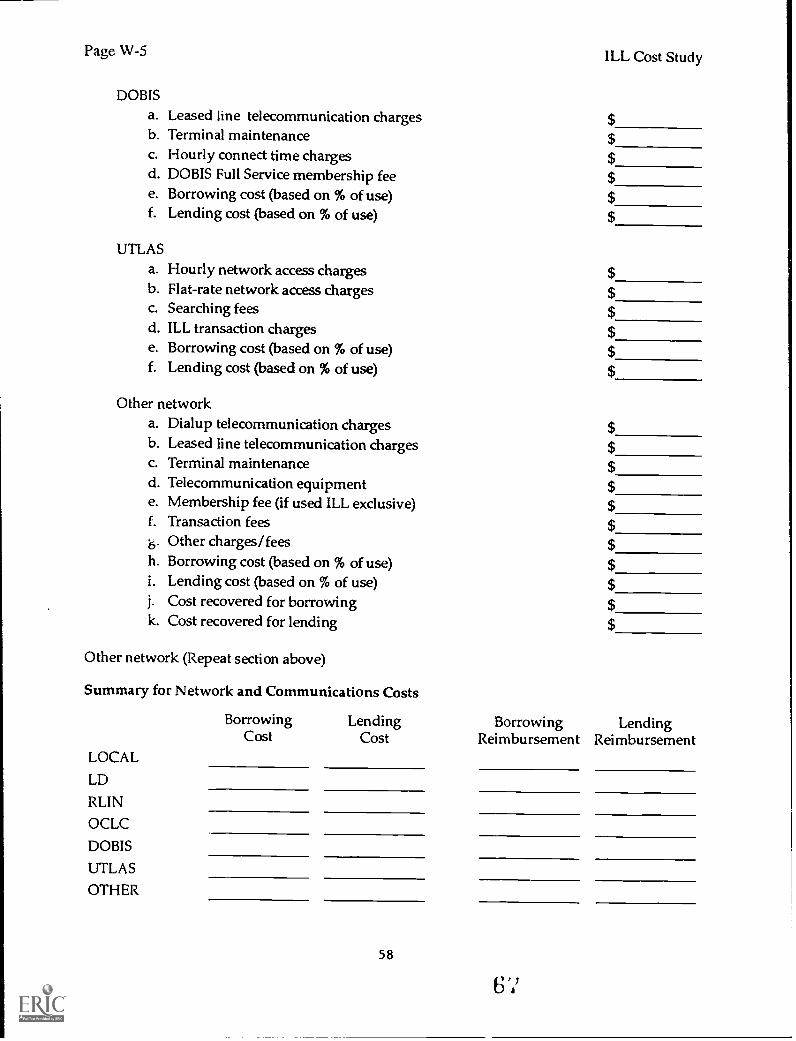
Page W-5 ILL Cost Study
DOBIS
a. Leased line telecommunication chargesb. Terminal maintenancec. Hourly connect time chargesd. DOBIS Full Service membership feee. Borrowing cost (based on % of use)f. Lending cost (based on % of use)
UTLAS
a. Hourly network access chargesb. Flat-rate network access chargesc. Searching feesd. ILL transaction chargese. Borrowing cost (based on % of use)1. Lending cost (based on % of use)
Other networka. Dialup telecommunication chargesb. Leased line telecommunication chargesc. Terminal maintenanced. Telecommunication equipmente. Membership fee (if used ILL exclusive)f. Transaction fees8. Other charges/feesh. Borrowing cost (based on % of use)i. Lending cost (based on % of use)j. Cost recovered for borrowingk. Cost recovered for lending
Other network (Repeat section above)
Summary for Network and Communications Costs
Borrowing Lending Borrowing LendingCost Cost Reimbursement Reimbursement
LOCAL
LD
RLIN
OCLC
DOBIS
UTLAS
OTHER
58
6' '
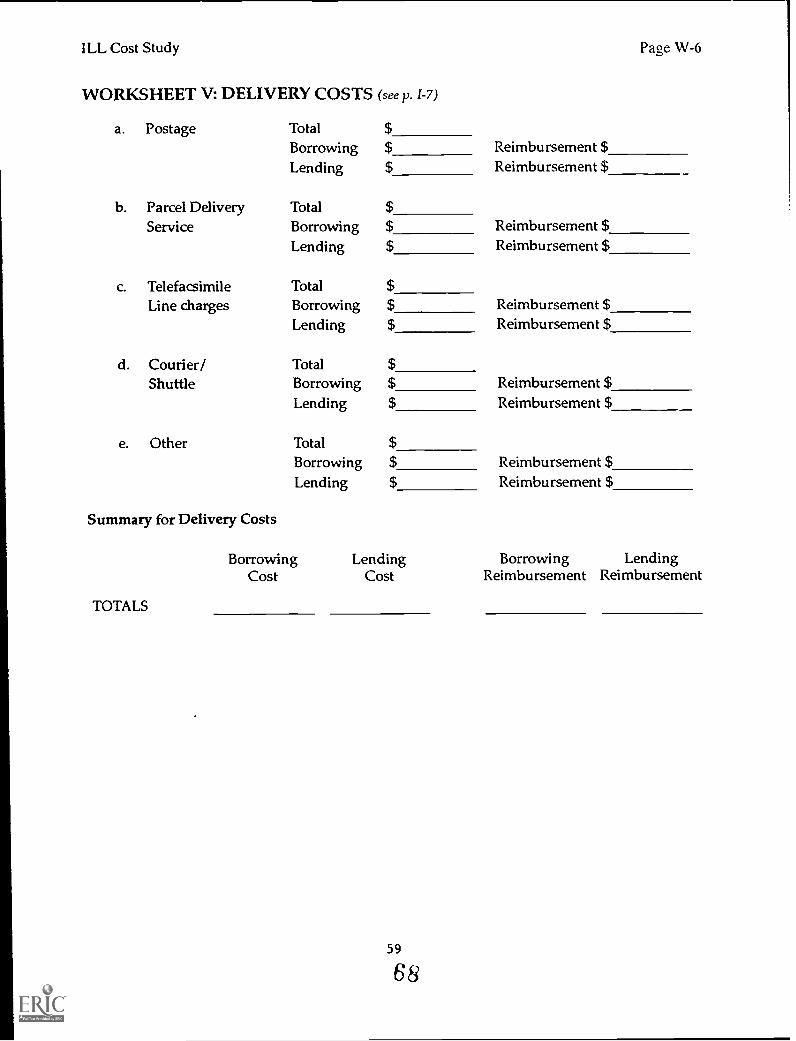
ILL Cost Study Paee W-6
WORKSHEET V: DELIVERY COSTS (see p. 1-7)
a. Postage Total $Borrowing $ Reimbursement $Lending $ Reimbursement $
b. Parcel Delivery Total $
Service Borrowing $ Reimbursement $Lending $ Reimbursement $
c. Telefacsimile Total $Line charges Borrowing $ Reimbursement $
Lending $ Reimbursement $
d. Courier/ Total $Shuttle Borrowing $ Reimbursement $
Lending $ Reimbursement $
e. Other Total $Borrowing $ Reimbursement $Lending $ Reimbursement $
Summary for Delivery Costs
TOTALS
Borrowing Lending Borrowing LendingCost Cost Reimbursement Reimbursement

Page W-7 ILL Cost Study
WORKSHEET VI: PHOTOCOPY COSTS (see p. 1-7)
1. Photocopy costs for filling ILL requests (lender ) ((e.g., copying documents, articles)
2. Photocopy costs for other purposes(e.g., copying ILL forms)
Summary for Photocopy Costs
TOTALS
Borrowing LendingCost Cost
WORKSHEET VII: SUPPLY COSTS (see p. 1-8)
Summary for Supply Costs
TOTALS
Borrowing LendingCost Cost
60
6
Borrowing $Lending $
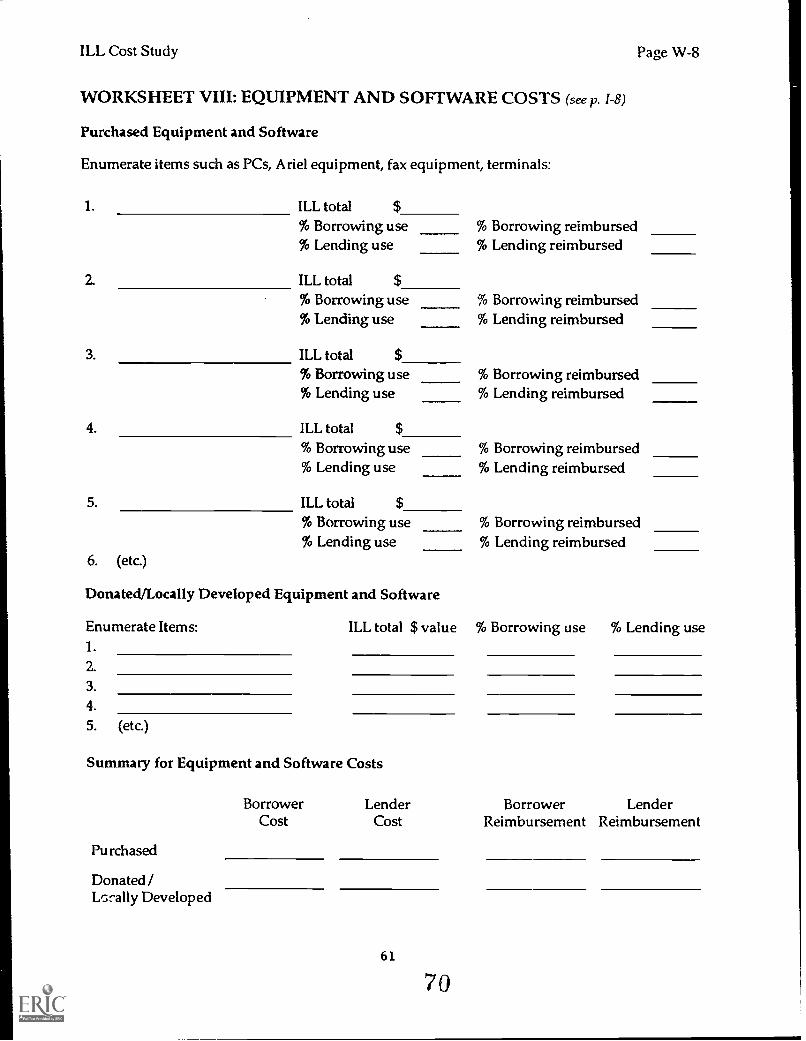
ILL Cost Study Page W-8
WORKSHEET VIII: EQUIPMENT AND SOFTWARE COSTS (see p. 1-8)
Purchased Equipment and Software
Enumerate items such as PCs, Ariel equipment, fax equipment, terminals:
1. ILL total $% Borrowing use% Lending use
2. ILL total $% Borrowing use% Lending use
% Borrowing reimbursed% Lending reimbursed
% Borrowing reimbursed% Lending reimbursed
3. ILL total $% Borrowing use % Borrowing reimbursed% Lending use % Lending reimbursed
4.
5.
6. (etc.)
ILL total $
% Borrowing use% Lending use
ILL total $
% Borrowing use% Lending use
Donated/Locally Developed Equipment and Software
% Borrowing reimbursed% Lending reimbursed
% Borrowing reimbursed% Lending reimbursed
Enumerate Items: ILL total $ value % Borrowing use % Lending use1.
2.
3.
4.
5. (etc.)
Summary for Equipment and Software Costs
Purchased
Donated/Izrally Developed
Borrower Lender Borrower LenderCost Cost Reimbursement Reimbursement
61
70
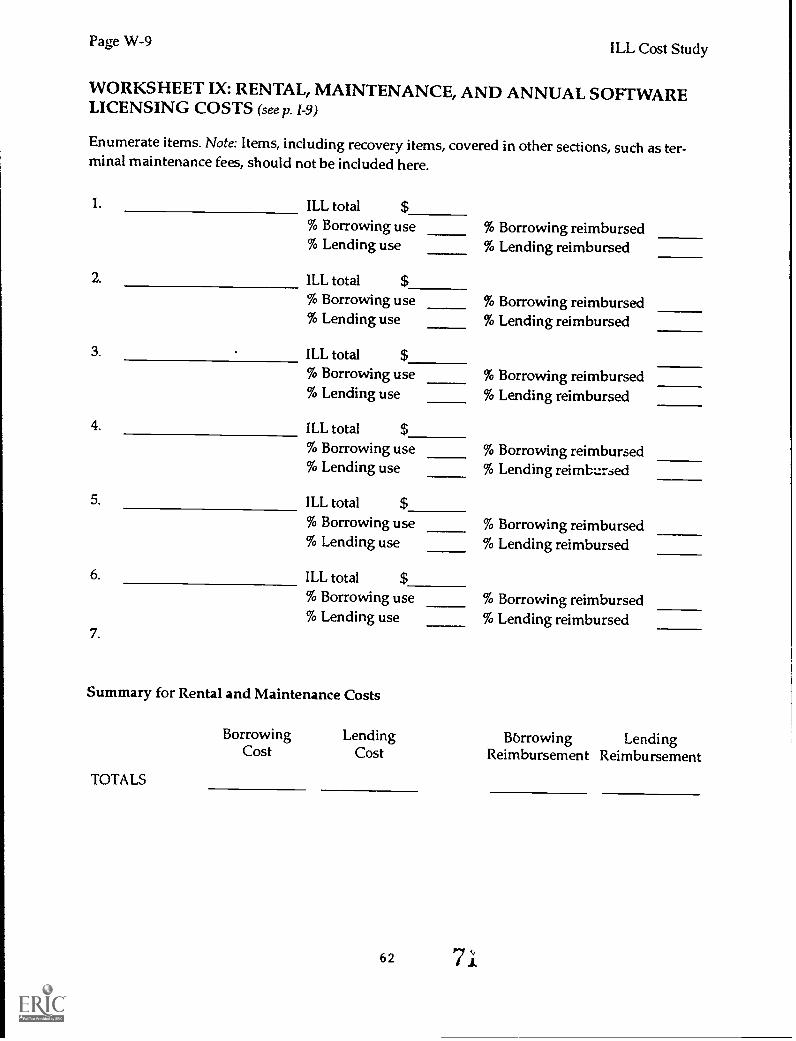
Page W-9 ILL Cost Study
WORKSHEET IX: RENTAL, MAINTENANCE, AND ANNUAL SOFTWARELICENSING COSTS (see p. 1-9)
Enumerate items. Note: Items, including recovery items, covered in other sections, such as ter-minal maintenance fees, should not be included here.
1.
2.
3.
4.
ILL total $% Borrowing use% Lending use
% Borrowing reimbursed% Lending reimbursed
ILL total $% Borrowing use % Borrowing reimbursed% Lending use % Lending reimbursed
ILL total $% Borrowing use % Borrowing reimbursed% Lending use % Lending reimbursed
ILL total $% Borrowing use % Borrowing reimbursed% Lending use % Lending reimhmsed
5. ILL total $% Borrowing use % Borrowing reimbursed% Lending use % Lending reimbursed
6. ILL total $% Borrowing use % Borrowing reimbursed% Lending use % Lending reimbursed
7.
Summary for Rental and Maintenance Costs
TOTALS
Borrowing Lending BOrrowing LendingCost Cost Reimbursement Reimbursement
62 71
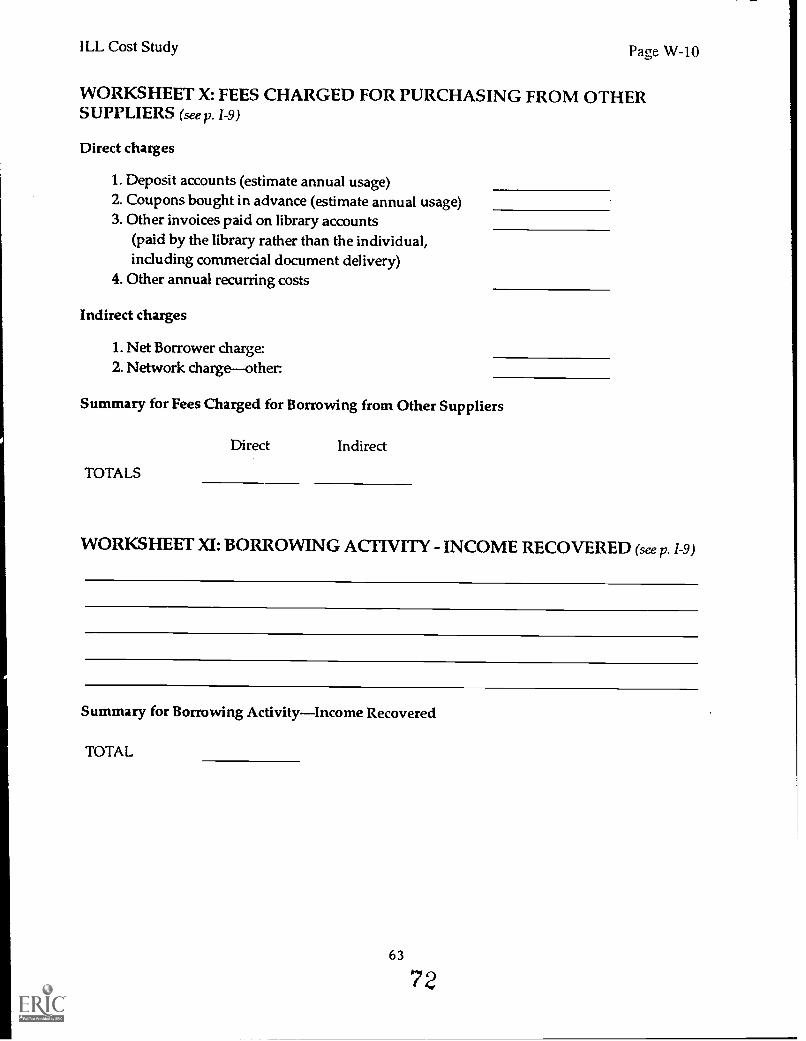
ILL Cost Study Page W-10
WORKSHEET X: FEES CHARGED FOR PURCHASING FROM OTHERSUPPLIERS (see p. 1-9)
Direct charges
1. Deposit accounts (estimate annual usage)2. Coupons bought in advance (estimate annual usage)3. Other invoices paid on library accounts
(paid by the library rather than the individual,including commercial document delivery)
4. Other annual recurring costs
Indirect charges
1. Net Borrower charge:2. Network chargeother:
Summary for Fees Charged for Borrowing from Other Suppliers
TOTALS
Direct Indirect
WORKSHEET XI: BORROWING ACTIVITY - INCOME RECOVERED (see p. 1-9)
Summary for Borrowing ActivityIncome Recovered
TOTAL
63
7 2

Page W-11 ILL Cost Study
WORKSHEET XII:. LENDING ACTIVITY - INCOME RECOVERED (see p. 1-9)
1. Net Lender reimbursementRLG:2. Network reirnbursementOCLC:3. Network reimbursementDOBIS:4. Network reimbursementother:5. State reimbursemen t:6. Direct per transaction reimbursementTotal:7. Other (please specify)
Summary for Len ling ActivityIncome Recovered
TCTAL
COMMENTS
Please return by April 3, 1992 to:
Association of Research Libraries
64
73