DOCUMENT RESUME ED 280 177 - ERIC · DOCUMENT RESUME ED 280 177 EA 019 ... blocks of state-level...
526
DOCUMENT RESUME ED 280 177 EA 019 287 AUTHOR Mitchell, Douglas E.; And Others TITLE Alternative State Policy Mechanisms for Pursuing Educational Quality, Equity, Efficiency and Choice Goals. Final Report. SPONS AGENCY Office of Educational Research and Improvement (ED), Washington, DC. PUB DATE Oct 86 GRANT NIE-G-83-0138 NOTE, 523p. PUB ArYPE Reports - Research/Technical (143) EDRS PRICE MF02/PC21 Plus Postage. DESCRIPTORS *Board of Education Policy; Curriculum Development; Educational Facilities; Educational Finance; Educational Improvement; Educational Legislation; *Educational Objectives; *Educational Policy; Educational Quality; Educational Testing; Elementary Secondary Education; Equal Education; Federal State Relationship; Government School Relationship; Ideology; *Policy Formation; *Politics of Education; Program Development; Program Effectiveness; Public Opinion; School Organization; School Personnel; *State Boards of Education; State Government; State Legislation; State School District Relationship; Tax Allocation ABSTRACT This paper reports a 2-year study of education policy that sought to identify, describe, and analyze the essential building blocks of state-level education policy and to discover the factors responsible for creating differences among states in their use of these elements to construct an overall framework for school regulation and support. Sample selection for the study involved two analytical levels: identification of a sample of six state policy systems, and selection of 140 key actors within those states for interview and survey data collection. The six states are: Arizona, California, Illinois, Pennsylvania, West Virginia and Wisconsin. After an executive summary, chapter 1 outlines the background for the study of state education policy systems and lists 26 references. Chapter 2 describes the research design and methodology for the study and lists 18 references. Chapter 3 examines the state policy mechanisms of ranking, attention, and knowledgeability. Chapter 4 looks at competing approaches to seven alternative state policy mechanisms. The fifth chaper explores values in legislative codes and cites nine references. Chapter 6 examines political culture values of state education policymakers and cites 32 references. Chapter 7 looks at state statistical profiles that illuminate educational policy in the six sample states. The eighth chapter describes public values as origins of policy actions. Chapter 9 explores the,influence, power, and policymaking processes and lists nine references. The final chapter examines assumptive worlds and education policymakers and cites 37 references. A total of 65 tables, 40 figures, and 10 appendices containing the study instruments and data collection forms are included. (WTH)
Transcript of DOCUMENT RESUME ED 280 177 - ERIC · DOCUMENT RESUME ED 280 177 EA 019 ... blocks of state-level...
DOCUMENT RESUME
ED 280 177 EA 019 287
AUTHOR Mitchell, Douglas E.; And OthersTITLE Alternative State Policy Mechanisms for Pursuing
Educational Quality, Equity, Efficiency and ChoiceGoals. Final Report.
SPONS AGENCY Office of Educational Research and Improvement (ED),Washington, DC.
PUB DATE Oct 86GRANT NIE-G-83-0138NOTE, 523p.PUB ArYPE Reports - Research/Technical (143)
EDRS PRICE MF02/PC21 Plus Postage.DESCRIPTORS *Board of Education Policy; Curriculum Development;
Educational Facilities; Educational Finance;Educational Improvement; Educational Legislation;*Educational Objectives; *Educational Policy;Educational Quality; Educational Testing; ElementarySecondary Education; Equal Education; Federal StateRelationship; Government School Relationship;Ideology; *Policy Formation; *Politics of Education;Program Development; Program Effectiveness; PublicOpinion; School Organization; School Personnel;*State Boards of Education; State Government; StateLegislation; State School District Relationship; TaxAllocation
ABSTRACTThis paper reports a 2-year study of education policy
that sought to identify, describe, and analyze the essential buildingblocks of state-level education policy and to discover the factorsresponsible for creating differences among states in their use ofthese elements to construct an overall framework for schoolregulation and support. Sample selection for the study involved twoanalytical levels: identification of a sample of six state policysystems, and selection of 140 key actors within those states forinterview and survey data collection. The six states are: Arizona,California, Illinois, Pennsylvania, West Virginia and Wisconsin.After an executive summary, chapter 1 outlines the background for thestudy of state education policy systems and lists 26 references.Chapter 2 describes the research design and methodology for the studyand lists 18 references. Chapter 3 examines the state policymechanisms of ranking, attention, and knowledgeability. Chapter 4looks at competing approaches to seven alternative state policymechanisms. The fifth chaper explores values in legislative codes andcites nine references. Chapter 6 examines political culture values ofstate education policymakers and cites 32 references. Chapter 7 looksat state statistical profiles that illuminate educational policy inthe six sample states. The eighth chapter describes public values asorigins of policy actions. Chapter 9 explores the,influence, power,and policymaking processes and lists nine references. The finalchapter examines assumptive worlds and education policymakers andcites 37 references. A total of 65 tables, 40 figures, and 10appendices containing the study instruments and data collection formsare included. (WTH)
U.3 DEPARTMENT OF (OUCATIONDuce ot Educasonm Resesvh afts Imomvsmem
EDUCATIONAL RESOURCES INFORMATIONCENTER IMO
61Ms (10CumOnt htbS peen I epeasusso aseceoveo kern POI 001300 OP 011:111oPtabOnn9.0611119 ot
0 Mew, changes hays been mliGle 10 POPOroverep1000C1.00 QI/ahly
P0 ents 01 IIIW 04 00411*n 511140mr. tlIPa 00C u(Plant 00 AO nesessaef meoreseM (NicolOERP p0s.1.0n Or pato
FINAL REPORT
ALTERNATIVE STATE POLICY MECHANISMS
FOR PURSUING
EDUCATIONAL QUALITY, EQUITY, EFFICIENCY AND CHOICE GOALS
Douglas E. MitchellUniversity of California, Riverside
Frederick M. WirtUniversity of Illinois, Urbana
Catherine MarshallPeabody College, Vanderbilt University
October, 1986
ri- The research reported herein was performed pursuant to agrant from the Department of Education, Office of Educational
rN6Research and Improvement (formerly the National Institute ofEducation) under grant number NIE-G -83 -0138). Points of view oropinions stated, however, do not necessarily represent official
fb"* OERI position or policy.
BEST COPY AVAILABLE
2
E.A
4
CONTENTSPage
Executive Summary Ex-I
Chapter I - BACKGROUND FOR THE STUDY OF STATE EDUCATIONPOLICY SYSTEMS I-1
Similarities and Contrasts in the American Culture . . 1-2
Common elementsDifferentiating ElementsRelevance to this Study
The American and the Educational Cultures 1-7
ValuesInstitutionsState Vulnerabilities
Background of Values and Policy Change 1-14
Economic Institutions
Policymakers' Roles and Motivation 1-17
The Breadth StimulusThe Intensive StimulusCultural Effects
Background of Structural Uniformity and Variation . . . 1-21
Multiple Values, Multiple Understandings 1-23
Quantitative ComparisonsExplicit Values in Official ActionsThe Policymaking Process
Summary 1-30
References 1-32
Chapter II - RESEARCH DESIGN AND METHODOLOGY
The Nature of the Research
Conduct of the Research 11-5
The Research Design
Sample 11-9
Selecting StatesRound One Sample
32.
.3
Round Two Sample
Instrument Construction II-11
The Qualitative InstrumentsThe Quantitative InstrumentsContent Analysis of the Education Codes
Data Reduction Procedures 11-18
Transcription of Audio TapesDocument AnalysisCase StudiesDissertationsQualitative Data Analysis TechniquesAnalysis of Education CodesAnalysis of the 50-State Data FileAnalysis of Qualitative Data
Validity Checking 11-22
Summary 11-24
References 11-25
Chapter III - STATE POLICY MECHANISMS: RANKING,ATTENTION, KNOWLEDGEABILITY III-1
Definina Education Policy Mechanisms 111-6
Assessing Policy Makers Views III-8
Inter-State Differences in Policy Profiles ..... 111-15
Multivariate Tests of State Differences 111-18
Discriminant Analysis: Levels of AttentionDiscriminant Analysis: Desire for More AttentionDiscriminant Analysis: Knowledge of Mechanisms
Conclusion 111-28
Chapter IV - COMPETING APPROACHES TO THE SEVENALTERNATIVE STATE POLICY MECHANISMS
Alternative Policy Approaches IV-4
Approaches to School FinanceApproaches to Personnel PolicyApproaches to Student Testing and AssessmentApproaches to Program DefinitionApproaches to School governanceApproaches to Curriculum MaterialsApproaches to School Buildings
4
t
Summary IV-9
Inter-State Differences in Policy Approach IV-10
Contrasting Approaches toContrasting Approaches toContrasting Approaches toContrasting Approaches toContrasting Approaches toContrasting Approaches toContrasting Approaches to
School FinancePersonnel PolicyStudent TestingProgram DefinitionOrganization & GovernanceCurriculum MaterialsBuilding Policy
Conclusion IV-27
Chapter V - VALUES IN LEGISLATIVE CODES V-1
Introduction V-1
Definition of Major Values V-1
ChoiceEfficiencyEquityQuality.
Conceptual Aspects of Policy Values
The Iterative Process of Definition
V-5
Dimensions of Values V-10
The Quality-Equity DimensionThe Quality-Efficiency DimensionThe Quality-Choice DimensionThe Chcice-Equity DimensionThe Choice-Efficiency DimensionThe E:ficiency-Equity Dimension
Actor Inflaence on Values V-16
The Sequencing of Values in Policymaking V-18
Issue CreationWhy Quality Comes FirstWhy Efficiency Comes SecondWhy Equity Comes ThirdWhy Chcice Pervades the Sequence
Summary
Methodology of Content Analysis
The /tem of Analysis
iiir0
V-24
V-25
The iresence of Values
The Distribution of Values: Introduction V-28
Educational Values and Political CultureThe Distribution of Values Within SPMsPolitical Culture InfluenceWithin State Dissributions
Summary V-36
The Weight of Values Within SPMs V-37
The Overall PictureState Profile of Values with SPMs
Summary V-41
Exhibit 5-1 V-44
References V-49
Chapter VI - POLITICAL CULTURE VALUES OF STATEEDUCATION POLICYMAKERS VI-1
Political Culture and the American States VI-2
The Elazar Model of Political Culture VI-4
Traditionalistic Political CulturesIndividualistic Political CulturesMoralistic Political Cultures
Are Differences in Culture and Policy Related . . . . V/-9
The Measurement of Political Culture Linkages . . . . VI-11
Measuring Cultural Clusters
Aggregate Findings by States VI-15
Discriminant ResultsThe Fit to State CulturesHistory and the Statistical Fit
Political Culture and SPM Approach Differences . . . . VI-20
Between State DifferencesFindingsCulture and the Alternative Policy ApproachesWithin State DifferencesLimitation of Cultural ExplanationComparative Influence of Culture
iv
6
SummaryVI-31
Appendix 6-A: Refining the Instrument VI-33
ReferencesVI-38
Chapter VII - STATE STATISTICAL PROFILES VII-1
IntroductionVII-1
Educational ProductivityVII-3
Standardized Test Score DataPercentage of Students Taking TestsGraduation RatesStudent Attendance at School
Human Resource Inputs to Education VII-7
Teacher SalariesPupil/Teacher RatiosPupil/Staff natios
Fiscal Resource Inputs to Education VII-10
Per Pupil LapendituresExpenditure as a Percent of Per Capita IncomeEducation's Share of State & Local ExpendituresFederal Spending as Percent of Local Budgets
Indicators of Children's Educationa' Needs VII-13
Poverty Among 5-17 Year-oldsChildren Identified as HandicappedMinority EnrollmentLimited English Proficient Students
Indicators of Community Education Needs VII-16
Adults Not Completing High schoolLive Births per 1,000Adult PovertyPercentage of Minority Citizens
Measures of State Fiscal Capacity
Per Capita Income in 1984Budget Surplus/Deficit in 1984Representative Tax System Index Values
State Policies Defining School Programs V/I-21
Length of School YearUnits Required for Graduation
7
High School Graduation TestSchool Centralization Index
State Social Demography VII-23
UrbanizationForeign Born and Recent ImmigrantsProjected Population Change 1960 to 1990Traditional And Moralistic Political Cultures
Demographic Characteristics of School Children . . . VII-26
School Age Population IndexEnrollment Change 1961-63Racial IsolationStudent Transportation
Political Power Distribution VII-29
Governor's Formal PowersInterest Group StrengthParty Competition
Levels of Political Activity VII-32
Voter RegistrationVoter Turnout as Percentage of Voting Age Pop.Index of School Reform activity
Economic Context Factors VII-34
Tax EffortPer Capita ExpendituresEducation's Share of State & Local ExpendituresProgressivity of State Taxes
Conclusion VII-37
Chapter VIII - PUBLIC VALUES AS ORYGINS OFpoucy ACTIONS VIII-1
Choice VIII-1
Quality VIII-2
Efficiency VIII-3
Equity VIII-4
Measuring Values VIII-6
Averaging Across the Four Domains VIII-10
Comparison Among the States VIII-11
vi
Discriminant Analysis of State Variations VIII-12
Policy values and Political Cultures VIII-14
Value Preferences and State Policy Mechanisms . . V/II-15
Values and Policy Approaches VIII-20
Conclusion VI/I-24
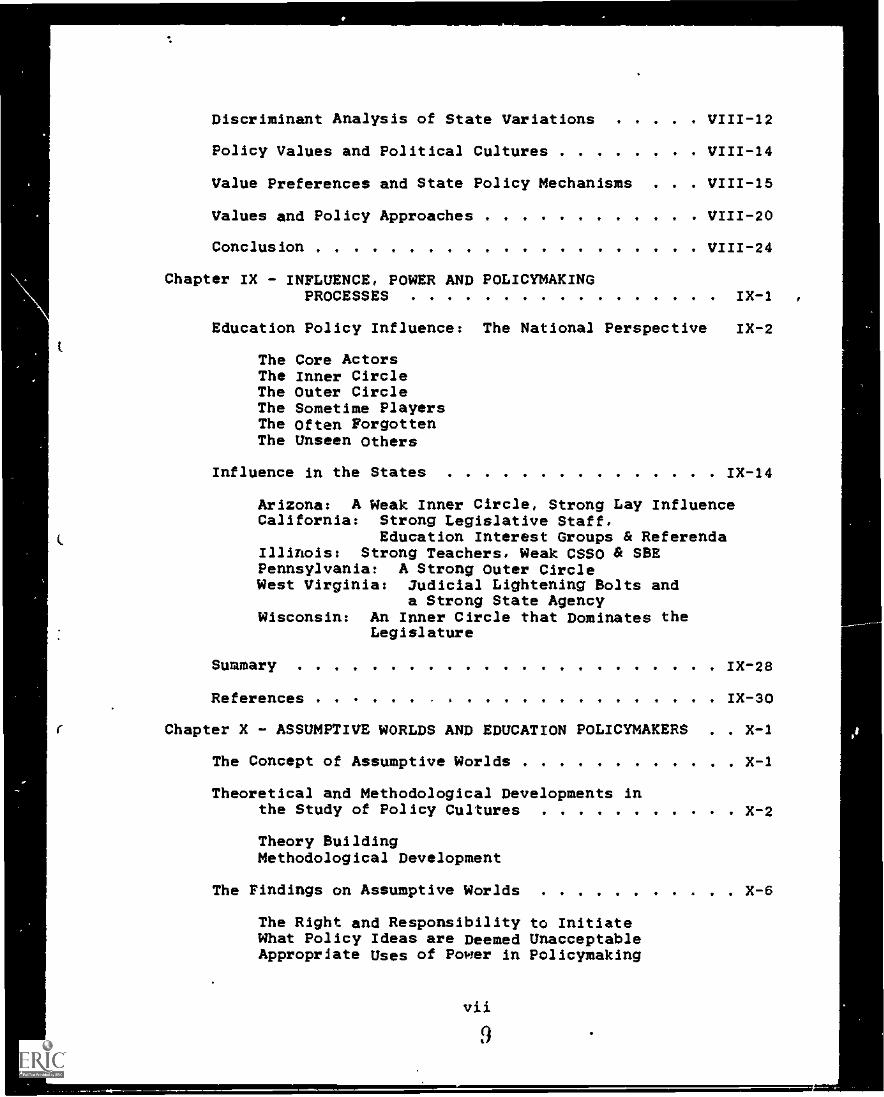
Chapter IX - INFLUENCE, POWER AND POLICYMAKINGPROCESSES ,
Education Policy Influence: The National Perspective IX-2
The Core ActorsThe Inner CircleThe Outer CircleThe Sometime PlayersThe Often ForgottenThe Unseen others
Influence in the States IX-14
Arizona: A Weak Inner Circle, Strong Lay InfluenceCalifornia: Strong Legislative Staff,
Education Interest Groups & ReferendaIllinois: Strong Teachers, Weak CSSO & SBEPennsylvania: A Strong Outer CircleWest Virginia: Judicial Lightening Bolts and
a Strong State AgencyWisconsin: An Inner Circle that Dominates the
Legislature
Summary IX-28
References IX-30
Chapter X - ASSUMPTIVE WORLDS AND EDUCATION POLICYMAKERS . X-1
The Concept of Assumptive Worlds X-1
Theoretical and Methodological Developments inthe Study of Policy Cultures X-2
Theory BuildingMethodological Development
The Findings on Assumptive Worlds X-6
The Right and Responsibility to InitiateWhat Policy Ideas are Deemed UnacceptableAppropriate Uses of Power in Policymaking
vii
9
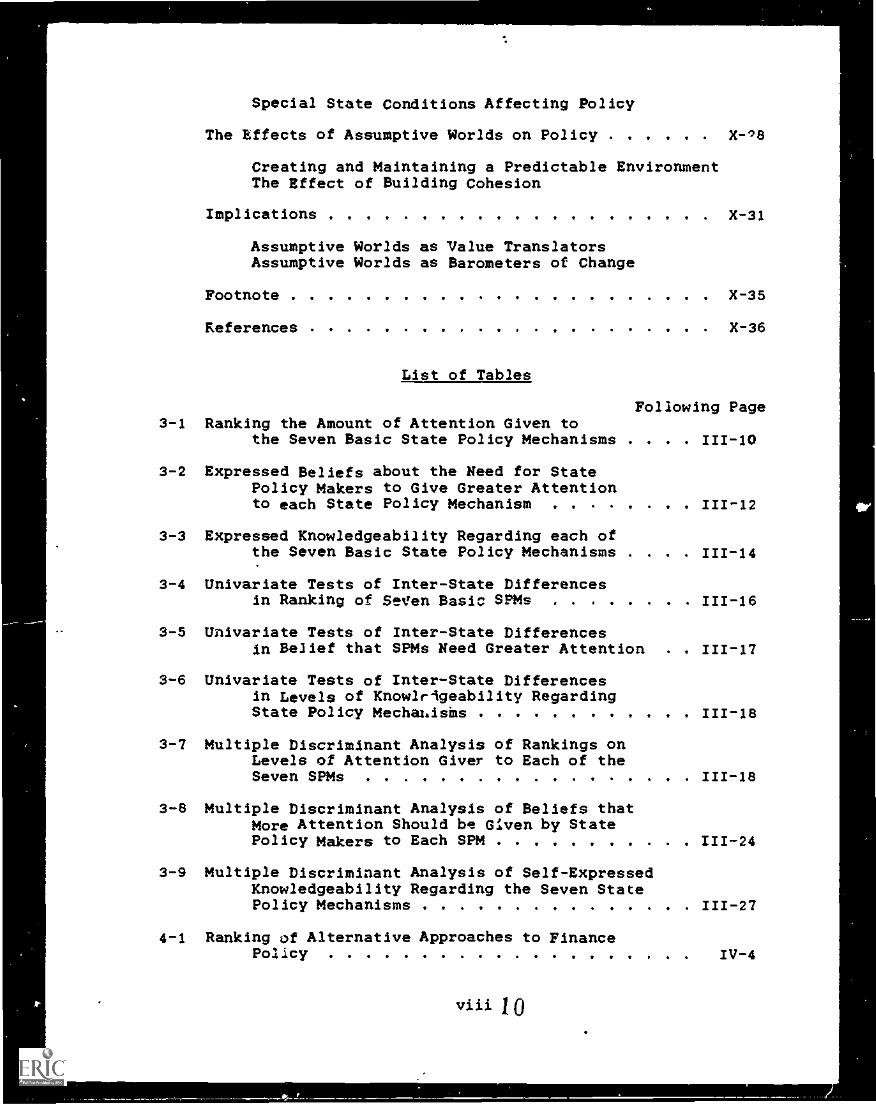
Special State Conditions Affecting Policy
The Effects of Assumptive Worlds on Policy
Creating and Maintaining a Predictable EnvironmentThe Effect of Building Cohesion
Implications
Assumptive Worlds as Value TranslatorsAssumptive Worlds as Barometers of Change
Footnote
References
List of Tables
X-98
X-31
X-35
X-36
Following Page3-1 Ranking the Amount of Attention Given to
the Seven Basic State Policy Mechanisms . . . . III-10
3-2 Expressed Beliefs about the Need for StatePolicy Makers to Give Greater Attentionto each State Policy Mechanism
3-3 Expressed Knowledgeability Regarding each ofthe Seven Basic State Policy Mechanisms . . . . 111-14
3-4 Univariate Tests of Inter-State Differencesin Ranking of Seven Basic SPMs 111-16
3-5 Univariate Tests of Inter-State Differencesin Belief that SPMs Need Greater Attention . . 111-17
3-6 Univariate Tests of Inter-State Differencesin Levels of Knowlrigeability RegardingState Policy Mechahisins
3-7 Multiple Discriminant Analysis of Rankings onLevels of Attention Giver to Each of theSeven SPMs
3-8 Multiple Discriminant Analysis of Beliefs thatMore Attention Should be Given by StatePolicy Makers to Each SPM 111-24
3-9 Multiple Discriminant Analysis of Self-ExpressedKnowledgeability Regarding the Seven StatePolicy Mechanisms 111-27
4-1 Ranking of Alternative Approaches to FinancePolicy IV-4
viii 10
or
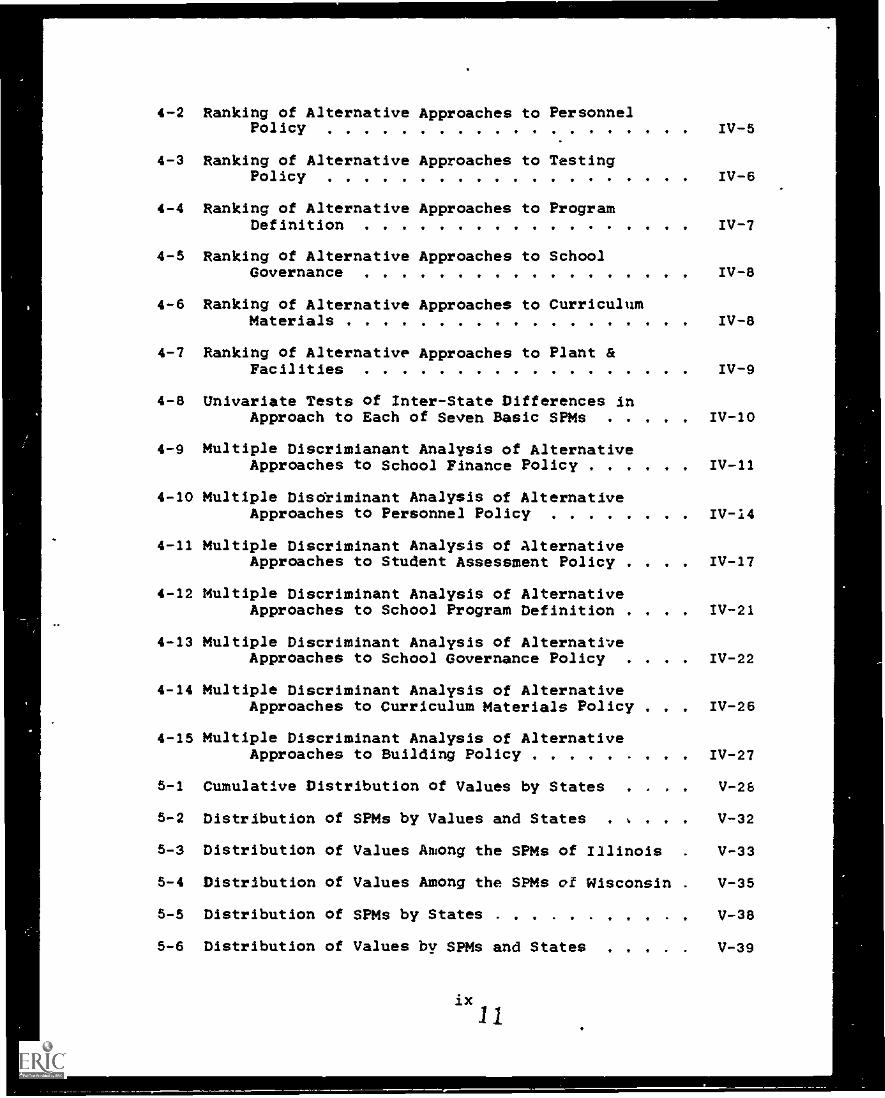
4-2 Ranking of Alternative Approaches to PersonnelPolicy IV-5
4-3 Ranking of Alternative Approaches to TestingPolicy IV-6
4-4 Ranking of Alternative Approaches to ProgramDefinition IV-7
4-5 Ranking of Alternative Approaches to SchoolGovernance IV-8
4-6 Ranking of Alternative Approaches to CurriculumMaterials IV-8
4-7 Ranking of Alternative Approaches to Plant &Facilities IV-9
4-8 Univariate Tests of Inter-State Differences inApproach to Each of Seven Basic SPMs IV-10
4-9 Multiple Discrimianant Analysis of AlternativeApproaches to School Finance Policy IV-11
4-10 Multiple Dis6riminant Analysis of AlternativeApproaches to Personnel Policy IV-I4
4-11 Multiple Discriminant Analysis of AlternativeApproaches to Student Assessment Policy . . . . IV-17
4-12 Multiple Discriminant Analysis of AlternativeApproaches to School Program Definition . . . . IV-21
4-13 Multiple Discriminant Analysis of AlternativeApproaches to School Governance Policy . . . . IV-22
4-14 Multiple Discriminant Analysis of AlternativeApproaches to Curriculum Materials Policy . . . IV-26
4-15 Multiple Discriminant Analysis of AlternativeApproaches to Building Policy IV-27
5-1 Cumulative Distribution of Values by States . . . . V-26
5-2 Distribution of SPMs by Values and States y V-32
5-3 Distribution of Values Among the SPMs of Illinois V-33
5-4 Distribution of Values Among the SPMs of Wisconsin . V-35
5-5 Distribution of SPMs by States ........... V-38
5-6 Distribution of Values by SPMs and States ..... V-39
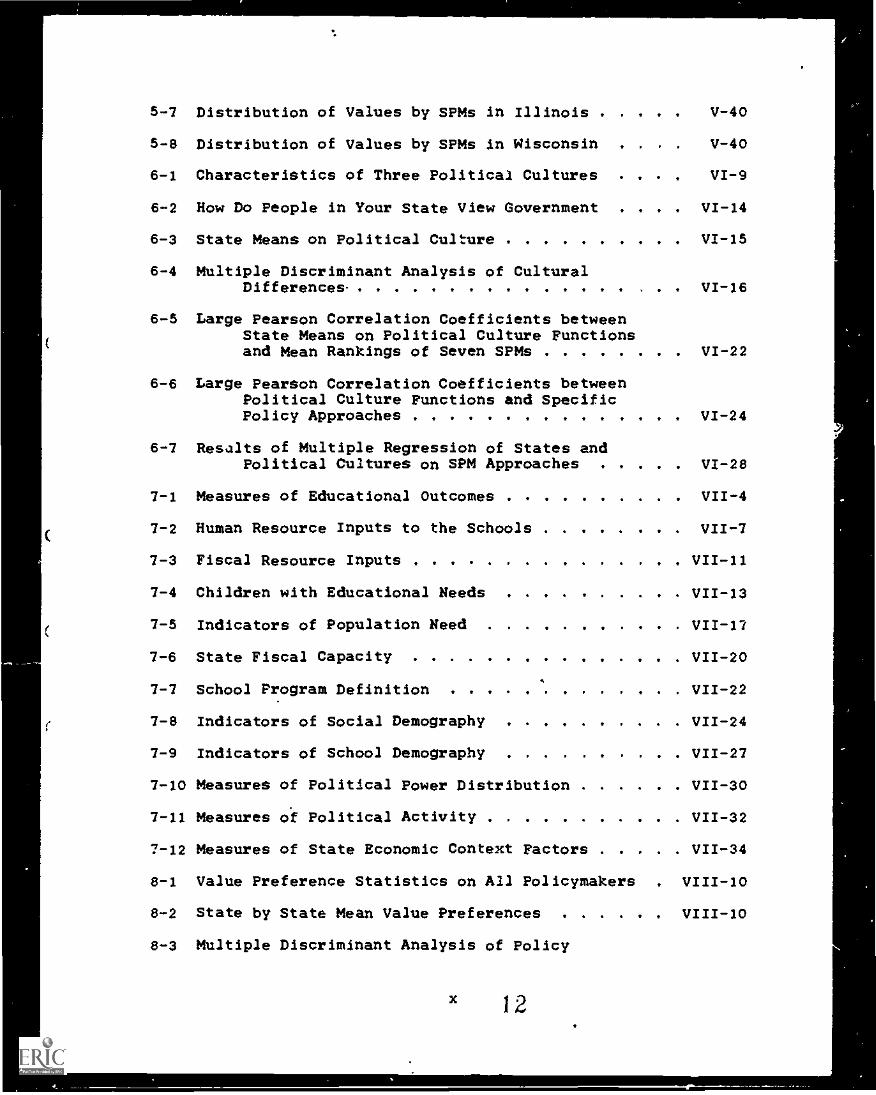
5-7 Distribution of Values by sPMs in Illinois ..... V-40
5-8 Distribution of Values by SPMs in Wisconsin . . . . V-40
6-1 Characteristics of Three Political Cultures VI-9
6-2 How Do People in Your State View Government . . . . VI-14
6-3 State Means on Political Culture VI-15
6-4 Multiple Discriminant Analysis of CulturalDifferences . -VI16
6-5 Large Pearson Correlation Coefficients between
(State Means on Political Culture Functionsand Mean Rankings of Seven SPMs VI-22
6-6 Large Pearson Correlation Coefficients betweenPolitical Culture Functions and SpecificPolicy Approaches VI-24
6-7 Resalts of Multiple Regression of States andPolitical Cultures on 8PM Approaches VI-28
7-1 Measures of Educational Outcomes VII-4
( 7-2 Human Resource Inputs to the Schools VII-7
7-3 Fiscal Resource Inputs VII-11
7-4 Children with Educational Needs VII-13
1 7-5 Indicators of Population Need VII-17\
7-6 State Fiscal Capacity VII-20
,
7-7 School Program Definition VII-22
7-8 Indicators of Social Demography VII-24
7-9 Indicators of School Demography .......... VII-27
7-10 Measures of Political Power Distribution VII-30
7-11 Measures of Political Activity VII-32
7-12 Measures of State Economic Context Factors VII-34
8-1 Value Preference Statistics on All Policymakers . VIII-10
8-2 State by State Mean Value Preferences VIII-10
8-3 Multiple Discriminant Analysis of Policy
x 1 2
/
Problem Perceptions VIII-12
8-4 Correlations between Political Culture andPublic Values VIII-15
8-5 Correlations between State Policy Mechanismsand Education Policy Goals V111-16
8-6 Correlations between Alternative PolicyApproaches and Education Policy goals . . . . V111-20
9-1 Ranking of Policy Influentials in Six States . . . . 1X-2
9-2 Ranking of Arizona Policy Influentials /X-14
9-3 Ranking of California Policy Influentials 1X-17
9-4 Ranking of Illinois Policy Influentials IX-20
9-5 Ranking of Pennsylvania Policy Influentials . . . . 1X-22
9-6 Ranking of West Virginia Policy Influentials . . . . IX-23
9-7 Ranking of Wisconsin Policy Influentials 1X-26
Figures
Following Page
2-1 Background Characteristics of the AverageRespondent /1-23
2-2 Crosstabulation of Respondent Roles andState of Residence 11-23
3-1 Discriminant Centroids: Ranking of All SPMsFunctions *1 and *2 111-22
3-2 Discriminant Centroids: Ranking of All SPMsFunctions *1 and *3 111-23
3-3 Discriminant Centroids: Ranking of All SPMsFunctions *2 and *3 111-23
3-4 Discriminant Centroids: Desired Level ofAttention to SPMs -- Functions *1 and *2 . . . 111-23
3-5 Discriminant Centroids: Knowledge of variousSPMs -- Functions *1 and *2 111-27
4-1 Discriminant Centroids: Alternative FinancePolicy Approaches -- Functions *1 and *2 . . . IV-12
xi1 3
4-2 Discriminant Centrolds: Alternative PersonnelPolicy Approaches -- Functions *1 and *2 . . .
4-3 Discriminant Centrolds: Alternative TestingPolicy Approaches -- Functions *1 and *2 . . .
6-1 Political Culture Discriminant FunctionCentrolds
6-2 Scatterplot of State CurriculumCultural Moralism
6-3 Scatterplot of State GovernanceCultural Moralism
Policy vs.
Policy vs.
6-4 Scatterplot of State Testing Policy vsCultural Traditionalism
6-5 Scatterplot of State Program Definition Policy vsCultural Traditionalism
6-6 Scatterplot of State Building Policy vsCultural Traditionalism
7-1 Measures of Educational Outcomes
7-2 Human Resource Inputs to the Schools
7-3 Fiscal Resource Inputs
7-4 Children with Educational Needs
7-5 Indicators of Population Need
7-6 State Fiscal Capacity
7-7 School Program Definition
7-8 Indicators of Social Demography
7-9 Indicators of School Demography
7-10 Measures of Political Power Distribution
7-11 Measures of Political Activity
7-12 Measures of State Economic Context Factors
8-1 Public Values Instrument Items
8-2 State Policy Value Preferences
8-3 Discriminant Centrolds: State Policy GoalPreferences -- Functions *1 and *2
xii
1 4
IV-16
IV-18
VI-18
VI-23
VI-23
VI-23
VI-23
VI-23
VII-4
VII-7
VII-11
VII-13
VII-17
VII-20
VII-22
VII-24
VII-27
VII-30
VII-32
VII-34
VIII-7
VIII-11
VIII-14
6-4 Taxonomic Framework for Education Policy VIII-21
9-1 Relative Influence of Key Policy Actors IX-3
9-2 Arizona Policy Influence Patterns IX-14
9-3 California Policy Influene Patterns IX-17
9-4 Illinois Policy Influene Patterns IX-20
9-5 Pennsylvania Policy Influene Patterns IX-22
9-6 West Virginia Policy Influene Patterns IX-23
9-7 Wisconsin Policy Influene Patterns IX-26
10-1 Functions of the Operational Principles ofAssumptive Worlds
Appendices
X-28
Page
1. First Round Interview Prntocol Ap-Z
2. Second Round Interview Protocol Ap-4
3. Data Recording Form for Final Interviews Ap-7
4. Nation at Risk Report Card Ap-12
5. Political Values Instrument Ap-14
6. Comparative Influence Ranking Instrument Ap-16
7. Political Culture Assessment Instrument Ap-17
8. Personal Data Collection Form Ap-20
9. Data Recording Form for State Education Codes . . Ap-22
10. Sample Selection Matrix Ap-23
15
EXECUTIVE SUMMARY
ALTERNATIVE STATE POLICY MECHANISMS
FOR PURSUING
EDUCATIONAL QUALITY, EQUITY, EFFICIENCY AND CHOICE GOALS
16
EDUCATION POLICY IN THE STATES
Overview
Education is on the minds of state level policy makers
throughout the nation. A broad array of social, economic and
political forces has encouraged a substantial shift lb education
policy initiative away from federal and local actors into the
hands of state officials. Changes are particularly evident in
ideological debates, financial arrangements, litigation,
legislation and changing norms of professional practice.
Some changes have altered the balance of power within the
states, expanding the capacity of state policy systems and
redirecting their efforts. Reapportionment elevated urban and
suburban political interests overall rural. Larger professional
staffs in most state capitals have enhanced the capacity of
legislative and executive agencies to initiate policy and
encouraged the belief that reform can be accurately targeted on
needed school improvements (Sharkansky, 1972; Murphy, 1982). And
weakening of party discipline in many states has encouraged
reform oriented political change.
At the federal level, education policy has been undergoing
both ideological and fiscal retrenchment and reorganization.
Reduced spending, consolidation and deregulation of programs, and
public declarations of the lack of efficacy of federal action
have all contributed to reducing the federal presence in the
schools.
Page Ex-2
17
Local school districts, long the primary agencies of
education policy making and program development, have also lost
substantial power and initiative to state level actors. The
combination of property taxpayer revolts and school finance
system reforms enacted during the last decade has produced a
system of inflexible, formula driven, local taxes in many
states. National concerns about school program effectiveness,
especially when couched in the shrill rhetoric of the National
Commission on Excellence's A Nation at Risk report, has made it
all but Impossible for local educators to draw attention to local
educational problems or issues. A quarter of a century of (only
partially successful) efforts devoted to expanding educational
equity for racial and linguistic minority groups, the poor,
women, and children with various handicapping conditions have
left a legacy of labyrinthine regulations and legalistic
approaches to policy that tend to reduce innovation and
initiative in local school districts. At the same time, social
and demographic changes in families and communities has meant
that schools face new and different demands for service --
demands which they do not always know how to identify, much less
to serve adequately.
State PolicY_is Complex
Though it is increasingly the primary source of educational
innovation and change, state level policy is complicated and
uncertain in its effects. State decisionmakers have a broad
range of policy options available to them -- options that are
only poorly understood and uncertain in their effects on school
Page Ex-3
J8
programs and practices. The fact that state policymakers.are
visibly more active than in the past does not mean that their
actions are either potent Instruments for shaping school
performance or adequately linked to their Intended goals.
Indeed, vitriolic critics In every state have charged that the
new state activism Is misguided, hampering school performance as
much as helping It.
Many of the alleged shortcomings of state policy are, of
course, the natural consequence of ordinary political problems --
scarce resources, conflicting Interests, divergent goals, or
Snequitable distributions of political power. Especially In
education, however, policy problems are compounded by weak
conceptualization and Inadequate analysis.
Appreciating these problems, the National Institute of
Education funded a two year study of education policy in a
representative group of states. That study, summarized briefly
here and reported In full In the accompanying final report,
sought to identify, describe and analyze the essential building
blocks of state level education policy, and to discover the
factors responsible for creating differences among states In
their use of these basic policy elements In constructing an
overall framework for school regulation and support.
Page Ex-4
1 9
Study DesIgn and Data Collection
Major data collection.for this research was undertaken
through interviews with key participants in six state education
policy systems. Two separate rounds of interviews were
conducted. During the first round open-ended questions were used
to secure information about the distribution of policy influence,
the availability of documentary evidence, and the nature of
recent policy issues and actions within the state.
Second round interviews used structured questions
accompanied by five quantitative survey instruments covering: a)
the distribution of influence among key actors in the state, b)
state responses to the Nation at Risk report, c) policymaker
value preferences, d) state political culture orientations, and
e) personal background and demographic variables.
In addition to the interview and survey data, state
education codes were subjected to an exhaustive content analysis
in two states, and a collection of some 44 key variables
reflecting social, economic, political and educational conditions
in all 50 states were reviewed.
sampling
Sample selection for the study involved two distinct
analytic levels: identification of a sample of six state policy
systems, and selection of 140 key actors within those states for
interview and survey data collection. The six states studied
were selected by stratifying all SO states on three variables and
then selecting an opportunity sample that maximized state
Page Ex-5
20
,_
4r,
distribution across these three variable's. The three selection
variables were: a) degree of urbanization, b) degree of fiscal
stress, and c) political culture. High, medium and low scores on
each of the first two variables were assigned and states selected
to insure that all three levels on each variable were included.
Additionally, two States were taten from each of Elazar's
political culture types (Moralistic, Individualistic, and
Traditionalistic). The resulting sample included: Arizona.
California, Illinois, Pennsylvania, West Virginia and Wisconsin.
Individuals were selected within each state for first round
interviews based on the following criteria:
1. An education advisor to the governor,
2. Education policy committee chairs in the legislatures,
3. Fiscal committee chairs in the legislatures,
4. Key staffers for both education and fiscal committees,
5. The chief state school officer or deputy,
6. Top executives of the state school boards association,
7. Top executives of the state administrators association,
6. Top executives of the state teacher organizations
9. One or more state board of education members, and
10. Key informants outside government.
Second round interviewees were seleGted from among those
identified as influential during the first round. More than 95%
of all those asked to participate agreed to be interviewed.
Page Ex-6
21
MultiPle Paths to Understanding
The maj..$r research question around which this project is
centered is: How do we understand the role of values in state
education policy? The is, of course, no single way of answering
this central question. Rather than trying tn force all data into
a single explanatory or descriptive mold, this study draws upon
multiple frameworks and relies on multiple methods for
comprehending and interpreting the operation of social values
within the policy arena.
Different ways of posing the question of values rely on
different methods of data collection and interpretation. As a
result, this research project Is best seen as a collection of
seven distinct, but Interrelated, studies. Each study approaches
the core question differently, each uses a difflrent set of data,
and each makes a unique contribution to our understanding of the
relation between educational policy and public values. Taken
separately, each of the studies makes a significant contribution
to a growing body of research on state levol decisionmaking.
Together, they provide a powerful comprehensive view of the new
role of the states in guiding and supporting public education.
MAJOR FINDINGS FROM SEVER SUB-STUD/ES
A State Policy Taxonomy (see Chapters /:/ & /V)
The first of the seven constituent studies in this research
project involved the development and clarification of a
theoretically consistent and operationallY powerful taxonomy of
Page Ex-7
22
state policy mechanisms (SPMs). The development of this taxonomy
Is Important to research and practice as well as policymaking in
public education. From a research perspective, identification of
an empirically reliable taxonomy is an essential pre-requisite to
tracing the decisionmaking process from initial sense of problem,
through policy formation and adoption, to program implementation
and evaluation. That is, in order to know how policies are being
shaped by various social forces or affected by organizational
parameters or political structures they must be accurately
classified. Similar and dissimilar types of action have to be
identified before systematic regularities associated with each
can be studied.
From m practical perspective, the dramatic outpouring of
recent state policy initiatives is experienced as threatening and
confusing to many educators. It is equally confusing to many
state policy makers who, whether they wish to or not, must
resolve numerous issues and decide what proposals to give the
force of law and the power of public tax money. In the absence
of a basic policy taxonomy, however, neither policy sponsors nor
the school systems toward which they are directed can predict the
effects of state :ctions.
DeveloPing the TaxonomY
Development of a state policy taxonomy began with the
recognition that state systems are complex and their decisions
varied. A number of states have adopted broad ranging
"comprehensive" school improvement programs that include various
combinations of fiscal, organizational, staff development,
Page Ex-8
23
curriculum enhancement and student assessment elements. Others
have taken a much narrower and less vigorous appoach to school
improvement. It is fairly easy to recognize common themes and
issues in many different policy actions, but it has proven far
from easy to develop a classification scheme that meets the twin
requirements of a taxonomy -- exhaustive and mutually exclusive
classification for all policy actions.
Previous rese-xch on state level policymaking was reviewed
to identify possible theoretical frameworks to serve as the basis
for the needed taxonomy. Three different approaches were
identified. The first distinguished policy actions on the basis
of their support for one or more competing public values. A
second distinguishes the economic consequences of various policy
alternatives, and the third approaches the problem by identifying
the control mechanisms available to states.
Field work in this research project began by adopting the
third approach to taxonomy development -- the identification of
alternative mechanisms available to states for controlling and
guiding school performance. As the research project developed,
however, it became clear that the concept of competing public
values had to be combined with the notion of control mechanisms
to fully describe the policy alternatives being used in various
states.
The State Policy Mechanisms tSPMs)
Following extensive early field work, seven basic state
policy mechanisms were identified and defined. They include:
Page Ex-9
24
1.1
1. School Finance -- controlling who pays for education,
how these costs are distributed, and how human and
fiscal resources are allocated to the schools.
2. School Persqnnel Trainjg and Certification --
controlling the conditions for getting or keeping
various jobs in the school system.
3. Student Testing and Assessment -- fixing the timing and
consequences of teesting, including subjects covered and
the distribution of test data.
4. School Program Definition -- controlling program
planning and accreditation, or otherwise specifying
what schools Must teach, how long they must teach it,
or how students are to be grouped for learning.
5. School Organization and Governance -- the assignment of
authority and responsibility to various groups and
individuals to control or direct school operations and
programs,
6. Curriculum Materials Development and Specification --
controlling the development and/or selection of
textbooks and other instructional materials.
7. School Buildings and Facilities -- determination of the
architecture, p1acement and maintenance for buildings
and other school facilities.
The 140 key policymakers in this study were asked three
questions about these seven alternative state policy mechanisms:
A. How much attention is being given to each mechanism in
your state?
Page Ex-10
25
4
B. Are the various mechanisms beinci given too much or too
little rttention?
C. Which mechanisms to you feel most knowledgeable about?
Responses to these three questions verified the adequacy of these
concepts to classify virtually all recent policy activity, and
provided a robust meAns for distinguishing among individual
policymakers and between states. As detailed in Chapter III of
the final report, we found a remarkably high level of agreement
among respondents in all six states regarding the most prominent
and least prominent educational policy mechanisms. Fully 46% of
the variance in all individual responses regarding the level of
attention being given to various policy mechanisms is reflected
in a general agreement, placing allocation of fiscal resources to
the schools at the top of the list, and ranking school building
and facilities policies as the least frequently utilized
mechanism.
Across the sample states, the seven policy mechanisms were
seen as involving four distinct levels of state action. School
finance, by itself, was number one by a wide margin. Following
finance, personnel policies, student testing and school program
definition were ranked very much alike. At the third level of
state action were school governance and curriculum materials
policies. Respondents reported substantially lower levels of
state interest and action in the area of building and facilities
policy.
Page Ex -11
26
By and large, state policy makers feel that significantly
greater state level attention needs to be given to all seven
policy domains. Personnel training and certification headed the
list of mechanisms whict, were thought to need more attention --
more than a third of all respondents urged greater attention in
this area. Interest in expanding state involvement in education
policy varies from state to state, but with only two exceptions
respondents felt that greater attention was needed to all policy
domains in each state. The exceptions were student assessment
policy in Arizona where about 40% of the respondents thought this
issue was getting too much attention, and school finance in
California where about 10% of those interviewed favored giving
less attention to this mechanism.
The policy makers interviewed felt most knowledgeable about
school finance policy matters (about 80% felt comfortable with
finance questions). They w're least comfortable with building
and curriculum materials policies (less than 20% claimed
knowledge of these policy domains).
Alternative Approaches within each Policy Domain
In addition to reviewing the seven policy mechanisms
described above, respondents were asked to indicate which of
several alternative approaches within each domain were receiving
the most attention. The alternative approaches which they were
asked to characterize were identified during first round
interviews with policymakers in each state. The number of
alternatives presented for comment varied, ranging from as few as
three (in the curriculum materials domain) to as many as eight
Page Ex-12
27
(in the organization anegovernance arena). Most policy
mechanisms wpre found to involve either four or five different
approaches.
Typically, respondents did not discuss competing approaches
to each of the seven basic policy domains. Rather. respondents
were asked to report first on the three mechanisms with which
they were most familiar. Then, if interview time permitted, less
familiar domains were covered. As a result, only 38 respondents
evaluated school building and facilities options while 118
discussed alternative finance approaches.
As with the basic mechanisms, we found broad agreement about
the relative importance of various approaches in ar3st domains and
significant differences in approach priority among the six sample
states. Shared variance on the competing policy approaches
ranged from a high of 40% on the various approaches to student
assessment to a statistically insignificant low of only 2% in the
area of organization and governance. Equalization and
establishment of overall funding levels dominated school finance
policy concerns. Pre-service certification and training was
viewed as the most important personnel policy approach. Testing
policy is dominated by state concern about specifying the format
and content of tests. Program policy is pre-eminently concerned
with setting higher standards while curriculum materials policy
concern is focused on the scope and sequence of instruction.
Building policy is dominated by remediation of identified
architectural problems.
Page Ex-13
28
Despite the broad consensus, interstate differences in
approach were also found to quite strong in all policy domains
except curriculum materials. Especially strong interstate
differences were found in the domains of school governance,
fAnance and student testing. Each of these policy mechanisms
produced three strong, statistically independent, and
substantively meaningful multiple discriminant functions which
distinguish among alternative state approaches.
The most powerful differences among the states in the school
finance area involve a tension between fiscal equalization and
determining the total amount of money to be made available to the
schools. Equalization was the dominant concern in West Virginia
which is now under court order to equalize school facilities, but
it was far behind concern the aggregate level of funding in
California (California had just been released by the trial court
from the Serrano judgment by a declaration that effective
equalization had been achieved).
Redefinition of teacher work roleJ produced the most
divergent ratings in the personnel policy area. California and
Arizona identified this approach as receiving a lot more
attention than did respondents in the other states (especially in
West Virginia where this approach was ranked last among the four
alternatives discussed).
Enhancing the authority of local districts and strengthening
the hand of teacher organizations were given the most divergent
scores in the organization and governance area. Illinois gave a
very high rating to the teacher organization approach, reflecting
Page Ex-14
29
their recent victory ln securing collective bargaining
legislation. -, Wisconsin joined Illinois in reporting strong
support for enhancing the influence of local districts.
The Legal Structure of Policy Values (see Chapter V)
Comprehensive content analysis of state codes is not often
used to examine the character of state action in a particular
policy area. We carefully reviewed the education codes in two of
our states, however, in order to test the utility of this
approach to examining the embodiment of public values in specific
education policies.
Analysis of education codes in Illinois and Wisconsin
proceeded by tallying all items within the published code. An
"item," the object of the tallying, was defined as any unit of
the code (sentence, paragraph, group of paragraphs or numbered
section) that expressed a state action regarding one of the seven
basic state policy mechanisms described above. Each code section
was read and cross-classified on the basis of the specific policy
embodied within it and on the basis of whether it gave expression
to one or more of four fundamental public values: choice,
quality, efficiency and equity.
The states studied differed substantially in their expressed
preference for the various policy values. In Illinois,
efficiency dominates the code, with the other three valw.s about
equally distributed. This dominance clearly rests on the
Page Ex-15
30
prevalence of state accountability provisions designed to control
the use of political power throughout the school system. In
Illinois, power granted means power checked.
Political history helps account for this distribution.
Illinois has a deeply individualistic political culture, an
environment which encourages fragmentation of power, regional
conflict, and political corruption. The traditionalistic
cultural elements in the southern part of the state have
influenced state action to some degree, however, encouraging
careful scrutiny of all resource and power distribution policies.
Wisconsin, by contrast, has a moralistic political culture
and a very different pattern of values expressed in its education
code provisions. While efficiency leads other values, its
proportion in the Wisconsin code is considerably less than in
Illinois. Much more expression is given to equity and somewhat
more to choice in this state.
We can infer that efficiency and equity are responses to
rather different influences in Wisconsin's history. Efficiency
reflects more the need to insure that policies are administered
in an accountable fashion than that political interests are kept
in check. .And Equity responds to a special theme in Wisconsin's
political culture -- the use of political power to improve all
citizen's lives by redistributing wealth and opening up
opportunities for all. This state's "squeaky clean" reputation,
often cited in other research, was evident in our field
Page Ex-16
31
interviews as well as in the larger role played by equity and
choice values in its statutes.
Political Culture and Policy Values (see Chapter VI)
Daniel Elazar has identified three broad political culture
orientations within the United States. Rooted in the colonial
period of nation building, and extended by patterns of migration
and immigration, Elazar found distinctive patterns of bel1ef
about government which he labeled: Moralist, Individualist and
Traditionalist. He defined political culture as simply, "the
particular pattern of orientation to political action in which
each political system is embedded (Elazar, 1984, p. 109). The
operational elements embedded in this concept include: 1)
perceptions about what politics is and what can be expected from
government, 2) notions about the kinds of people who become
active in the political process and become governmental
officials, and 3) beliefs about how the art of government is
actually practiced. Based on his pioneering work, we developed a
survey instrument aimed at probing culture variations in the six
sample states under study and examined whether culture differ-
ences measured in this way would predict orientation toward
educational policy mechanisms and approaches.
Multiple discriminant analysis of the data collected using
the political culture survey instrument identified a very
powerful set of differences among the six sample states.
Moralistic culture orientations dominated the discriminant
Page Ex-17
32
analysis, but a less distinctive Traditionalistic culture
function was also helpful in distinguishing among the six
states. As predicted by Elazar's early work, Wisconsin was
identified as the most Moralistic state in the sample. Calif-
ornia had the second highest score on the Moralistic culture
function, reflecting its more heterogeneous population and
diverse political traditions. Arizona and West Virginia
displayed the strongest Traditionalistic culture orientations, as
predicted by Elazar. And, as expected, Pennsylvania topped the
Individualistic culture scale. Illinois rejected the Moralistic
view while embracing both Individualistic and Traditionalistic
norms, again reflecting Elazar's data on the differences between
migration into the northern and southern parts of the state.
Differences in the culture orientations across the states
erved as strong indicators of attention to some, but not all,
policy mechanisms and approaches. Moralistic culture scores were
particularly powerful predictors of differences in state level
attention to curriculum, governance and testing policies.
Traditionalistic culture orientations were strongly related to
program definition and building policy interest. Culture was
helpful in predicting eleven of the 33 identified approaches to
various policy domains.
Page Ex-18
33
The Demographic origins of Policy (see Chapter VII)
Policy.is, of course, grounded in the overall condition of
state social, political, economic and educational systems. Hence
we felt it important to review the genere. status of these
systems in each of our six sample states. The analysis of these
systems was descriptive, however, rather than predictive. Our
aim was to illuminate the unique character of each state studied,
and to demonstrate that the six sample states were, as a group,
broadly representative of the country as a whole.
Forty-four variables were examined. They were grouped into
twelve clusters reflecting the performance of various state
subsystems. The twelve clusters included:
I. Educational Productivity
Among the sample states, West Virginia was below the
national average on all four of the measures used (standardized
test scores, percent of students taking the test, rate of
graduation from high school, and rate of pupil attendance).
Illinois was at or above the national average on all measures.
Wisconsin has the overall best productivity record, low only on
the percentage of students taking the standardized college
admission tests.
2. Human Resource Inputs to Education
California has the highest teacher salaries, but has paid
for those salaries by allowing pupil/teacher ratios to slip to
23.3:1, just above last place Utah. Illinois also has teacher
salaries well above the national average, but has kept pupil/
Page Ex-19
34
teacher ratios much closer to the national average of 17.71.
Rural West Virginia has very low teacher salaries, but also has
the lowest pupil/teacher staffing ratio in the sample.
3. Fiscal Resource Inputs
Pennsylvania makes the greatest per pupil investment in
education and also takes the largest percentage of personal
income for education.
4. Indicators of Children's Educational Need
Arizona has more than average need in the areas of poverty,
minority enrollment and number of children with limited English
language skill. Illinois reports the highest number of
handicapped children. Wisconsin is below national averages on
all indicators of child need.
5. Community Indicators of Educational Need
West Virginia has the lowest level of adult achievement;
California the largest number on non-whites in the adult
population. wisconsin has below national rates of educational
need on all four measures used.
6. State Fiscal Capacity
California is the richest state in the sample, with the best
budget surplus in 1984 and the best yield from a representative
tax system. West Virginia is the poorest state, but Wisconsin
had the greatest problem with debt at the end of FY '84.
7. School Program Definition
Arizona had the shortest school year of the sample states,
well belcw the national average of 178.4 days. Nevertheless,
this state had higher than average graduation unit requirements
Page Ex-20
35
and was among the minority of states requiring a test for
graduation from high school. The decentralized governance system
in Illinois has led to a short school year, a low number of units
for graduation, and no school leaving test.
8. Social Demography of the States
California, Arizona and Illinois are among the naticns
highly urbanized states. West Virginia, with just 36.2% of its
population in urban centers, ranks just above last place
Vermont. Arizona is expecting a very rapid 46.5% growth in its
population between 1980 and 1990.
9. School Demography
Illinois and Pennsylvania are notable for the degree of
racial isolation in their schools. As the nation's most
urbanized state, California also transports the smallest
percentage.of students.
10. Political Power Context for Po.licy Development
Pennsylvania is notable as the state granting the broadest
array of powers to its governor. West Virginia has the strongest
interest groups, Wisconsin the weakest. Arizona has the lowest
level of political party competition in the sample.
11. Levels of Political Activity
Arizona is notably low in its rate of voter registration
(57.3% compared with the nationa) average of 73.5%). Generally
speaking, voter turnout rates follow registration rates. In
1980, Wisconsin, with no statewide registration requirement, had
the third highest turnout in the nation (67.2%). Arizona was
fifth from the bottom with 44.7%. Following publication of the
Page Ex-21
3 6
Nation at Risk report, California was the most active in adopting
new policies, while Pennsylvania made the fewest changes of any
state in our sample.
12. The Economic Context of Policy Formation
California and Illinois have relatively low state tax
rates. California, however, combines its low rate with a
relatively high degree of progressivity. Illinois and West
Virginia have relatively regressive tax systems, while
Wisconsin's is the third most progressive one in the nation.
Even with its low rate, California manages above average
expenditure per capita. Education's share of the California tax
pie is quite low, however.
Taken together, the 44 variables reviewed show that the six
states in our sample are representative of the full range and
mixture of social, economic and political conditions across the
nation.
Value Preferences in State Policy . . . . . (see Chapter VIII)
Among the brief written questionnaires given to all
respondents was one designed to assess their preferences
regarding four competing public values. The four values
presented in the instrument included: 1) choice or liberty,
arguably the most basic of all American public values, 2)
quality, the value used to defend governmental action in any
Page Ex-22
37
domain, 3) efficiency, the value underlying debates over economic
worth and performance accountability, and 4) equity, a "self-
evident" value articulated in the Declaration of Independence.
Analysis of the value preference data indicates that, for
the mid-1980s at least, educational quality considerations
substantially outweigh all other values. Among the policy makers
we interviewed, the issue of choice in education policy comes far
behind that of the other values. Efficiency and equity were
given nearly identical weight, about half way between the
enthusiasm for quality education and the lackluster showing of
public choice.
We found significant interstate differences in the value
preferences of key policy actors. All six states gave quality
first place by a substantial margin, but Illinois and California
pelicymakers were especially committed to this value. Equity had
the greatest range in values -- scoring highest in West Virginia
(with its recent equity court order) and lowest in Arizona.
Efficiency made its best showing in Arizona, and was most
energetically rejected by Californians. Though it was last in
every state, choice was given its strongest support in California
and Arizona.
Political Influence in the States (see Chapter IX)
Since policy emerges through the efforts of various actors
to incorporate specific values into authoritative state action,
pelicymaking is better understood if the distribution of power
Page Ex-23
38
and influence within each state policy system is closely
examined. Influence distribution is complex, of course. Some
individuals and groups strongly influence a few decisions.
Others have less influence on any particular decision, but are
routinely involved across a broad range of issues. Nevertheless,
the distribution of influence within each state is a matter of
intense interest for all key policymakers. Nearly everyone
interviewed for this study was able to comfortably discuss the
relative influence of a wide range of key actors. Hence it was
relatively easy to take a straightforward approach to assessing
policy influence distribution by simply asking respondents to
rate various actor groups within their respective states.
Each respondent was asked to report the relative influence
of some seVenteen different elements in the state policy system
on a one to seven scale. There were sharp differences in the
overall rating given to the various groups, confirming the common
sense perception that policymakers have little difficulty
assessing the relative influence of other actors.
Sy grouping actor groups with similar overall mean influence
ratings together, we were able to identify six meaningful
clusters of actors. The members of each cluster have comparable
levels of overall involvement in education policy development.
While influence patterns varied from state to state, the
following overall pattern was apparent:
Page Ex-24
39
_Group 1: The Core Actors
State legislators, individually and taken as an
organizational unit, were recognized as the ultimate insiders in
education policy. With a mean rank of 5.82 on the seven point
scale used to rate all groups, individual members of the
legislature were reported to have the strongest voice in
policymaking. The legislature as a whole was also very
important, frequently called a "super school board" by
respondents who felt it was more influential than appropriate.
Group 2: The Inner Circle
Three actor groups constitute a powerful "inner circle" that
regularly interacts with the legislature. With mean ratings that
average about a half point below those for the legislative
actors, these groups generate most of the substantive proposals
presented for legislative action. This group consists of the
chief state school officers, the major teacher organizations, and
a coalition of "all Iducation interest groups combined." Not all
states give each actor group the same rating, of course.
Illinois ranked the teacher group above all other groups, while
Arizona placed the teachers 11th, well below the mid-point on the
influzbnce scale.
Group 3: The Outer Circle
The next three policy groups make up an "outer circle" that
has frequent but typically somewhat less powerful access to the
policy system. The governors and their education advisors are
the most influential members of this outer circle. Of course,
Page Ex-25
40
governors are not in the outer circle for lack of resources to
influence policy. It is just that they frequently ignore
education questions and leave the field to others.
Also found in the outer circle are legislative staff members
and state boards of education. The relative distance of the
state boards from the center of policy was not news, it confirms
what others have long recognized -- full-time, politically savvy
bureaucrats and elected public officials can more readily
influence basic education policy decisions than the occasional
and politically disinterested members of a lay school board.
Groug 4: The Sometime Players
Separated from the outer circle by a statistically
significant gap in their overall in:luence level are five policy
actor groups we called the "sometime players." These groups were
quite effective on some issues and in some states, but were
noticeably weak in others. State associations of local school
boards were the most frequently noticed of these actors. They
ranked ninth in overall influence -- putting them in the middle
of the 17 groups ranked. Associations of school administrators
came next with an overall rating of 3.97 on the seven point
scale. This group was noticeably strong in California and
Pennsylvania, but even at their strongest administrators were
rated as less powerful than teacher organizations. The courts
and federal policy mandates were ranked eleventh and twelfth,
respectively. Finally, non-educator groups (taxpayer
associations, business roundtables, etc.) round out the cast of
sometime players.
Page Ex-26
41
Group 4: The Often Forgotten
Often forgotten in the press of time and political conflict
are lay groups (PTAs, advisory councils, etc.) and research
organizations (universities, regional laboratories, etc.).
Group 6: Unseen Others
The last two sources of educational policy influence are
popular referenda and the activities of educational product
manufacturers (e.g. textbook publishers). While these are
generally not recognized as critical elements in the overall
process of policy formation, Californians gave referenda
moderately high marks and Arizona respondents reportec
substantial influence from educational product producers.
Policvmakers' Assumptive Worlds (see Chapter X)
While state political cultures were successfully measured
using the concepts developed by Elazar, a richer understanding of
the relationship between culture and policymaking can be garnered
from close study of data collected in the course of interviewing
policymakers. /n describing the policy system within which they
operate, pctlicymakers provide clues to the common understandings
and accepted rituals which they encounter in the system and which
they rely on for judging the feasibility of various policy
proposals and options. These cultural elements produce
perceptual screens which were described by Young (1977) as
policymakers' "assumptive worlds." Young argued that these
assumptive worlds provide policymakers with "subjective
Page Ex-27
4 2
r
understandings of the environment In which they operate,"
incorporating "several intermingled elements of belief,
perception, evaluation, and intention as responses to the reality
'out there.'"
The interview data collected during this study revealed
definite rules for the exercise of influence within each policy
system -- rules that define the rights and responsibilities of
various policy groups. Various key actors' stories demonstrated
that specific activities enable particular groups to gain (or
)ose) power. They also revealed the existence of state-specific
understandings about cultural constraints on policy behavior and
choice. Each state, In short, has a distinctive set of
assumptive worlds.. Actors share more or less common language
systems tor describing the process, constraints, and rituals that
must be observed In policymaking. This common language ref?ects
a taken-for-granted framework within which policy actions occur.
Four dimensions of the assumptive worlds of policymakers In
West Virginia and Pennsylvania were examined In detail. These
four dimensions include: 1) determination of who has the right
or responsibility of initiating policy action, 2) specification
of what policy Ideas are acceptable or unacceptable, 3) identi-
fication of appropriate means for mobilizing action within the
policy system, and 4) highlighting of special conditions within
the state that must be accommodated In any policy action.
Determination of rights and responsibilities for policy
initiation Is an essential ingredient In framing the distribution
of political power within each policy system. Interview language
Page Ex-28
4 3
411
became especially vivid when policymakers sought to describe
events which reveal that some individual or group has overstepped
its proper role. Despite his reliance on extensive research
data, for example, a Chief State School Officer In Pennsylvania
lost influence because he misjudged the determination of key
legislators to control their right to initiate policy change.
The boundary between acceptable and unacceptable policy
options is crossed when policymakers ignore common wisdom about
powerful interest groups or entrenched traditional values.
Acceptable methods for exercising influence within the policy
process can be expressed as a series of aphorisms about the
exercise of power, such as:
Know your place
Cooperate with those in power
Touch all the bases
Something for everyone
Bet on a winner
Don't trade too much on social relationships
Staffers have limited roles
Know the influence network
Use interstate comparisons to justify action
Limit experimentation with untested policies
Policy makers also hold strong views about the special economic,
social and political conditions operative within their states
that are believed to limit policy options.
Page Ex-29
44
In the final analysis, the data indicate, the assumptive
worlds with which policymakers approach their work make two basic
contributions to the process of incorporating values into
education policy. First, these cognitive and emotional
assumptions have the effect of creating and maintaining a stable
and predictable decisionmaking environment. Second, they build
cohesion among decisionmakers, facilitate coalition formation,
and therefore help channel power and influence toward specific
issues and decision options.
IMPLICATIONS FOR POLICY AND RESEARCH
Strengthening State Policvmakinq
Among the many ways in which findings from this study could
be utilized to guide state level policymaking, seven are worthy
of special note here. First, this research has demonstrated
that: there is an underlying taxonomic structure to state level
education policy. Despite the vicissitudes of political Interest
and pressure for school reform, policy in all states relies on
the same fundamental mechanisms of control -- finance, personnel,
student assessment, program definition, governance, curriculum
materials development and regulation of school fachities
construction. While there is still much to be learned about how
each of these mechanisms actually impacts on school performance,
the framework developed here does provide a starting point for
systematic review of policy actions and proposals. By getting a
clear idea of the repertoire of policy mechanisms at their
Page Ex-30
45
disposal, policymakers can resist the tendency to rely on narrow,
single mechanism strategies to handle all school improvement
'problems. Awareness of the complex, multi-faceted structure of
education policy may also assist policymakers In resisting the
"band-wagon" approach that so often characterizes school
improvement efforts. When confronted with political pressures
for reform It Is appropriate for decisionmakers to survey the
full range of control mechanisms available to them and to select
the one or ones best suited to ameliorating particular problems.
Second, this research demonstrates that: the most serious
policy debates are likely to arise when basic Public value
commitments intersect with the control mechanisms to create
alternative approaches to Policy. Conflict and disagreement do
not arise simply from the availability of alternative control
mechanisms: tension arises when key actors with divergent value
preferences adopt incompatible or competing approaches within
various domains. While public value commitments certainly
contribute to the preference for reliance on one or another
mechanism, tensions lead primarily to competition for scarce time
and resources rather than direct conflict over policy direction.
As with the policy mechanisms, however, we noted the
existence of a rather limited set of alternative policy
approaches within each of the seven broad domains of control.
Development of support for the various competing approaches,
while Influenced by value commitments, Is a very complex matter.
Differing value commitments generally do not lead to direct
competition for control over particular approaches, rather they
Page Ex-31
46
produce divergent thinking about which approaches are likely to
be most appropriate. The result is a complex system of
coalitions and cleavages within the policy system. Managing
coalition formation is, of course, one of the critical talents of
successful policy leadership. The research work presented here
provides in opportunities for policymakers to interpret their own
interests and respond to those of others in more productive ways.
Third, the data gathered for this study reveals that: there
is a broad national consensus on the most ImPortant mechanisms of
Policy control and on the most aPProPriate amoroaches to be taken
within each control domain. This broad consensus is far from
universally supported, of course, leaving ample room for debate
and disagreement. Nevertheless, it is possible for state policy
makers to measure their own proposals for policy change against
this national consensus In order to get a pretty good idea of how
much support or resistance they are likely to encounter.
Fourth, as the study of state political cultures
demonstrated: longstanding cultural values and norms play a
significant role in shaping each state's overall_pclicv
framework. As a result, policies which are identical in form
will have very different meanings in states with differing
political cultures. The differences between Moralistic,
Individualistic and Traditionalistic political cultures are not
merely interesting historical artifacts, they structure social
norms about the processes of policy formation and create strong
pressure for the support of some options and resistance to
others.
Page Ex-32
4
Fifth, while personal background and experience appears to
have only a very modest impact on policymakers' orientations and
preferences, the public value preferences held by key actors
within the policv_sYstem significantly shape their Perception of
Policy approach. The real impact of these value preferences does
not arise primarily from individual differences, however. The
strongest effect of public value preferences among key actors is
found wlien they are aggregated across a state or a policy making
coalition. .Individual policy actors are not likely to have a
major impact on policy by stressing the differences between their
own values and those of other actors with whom they must work to
produce decisions. Rather, the evidence in this study suggest
that effective value pursuit involves getting others to join in
the value consensus -- that is by persuading them of the
appropriateness of your values -- not by confronting them with
the intensity of your commitments.
Sixth, while influence patterns vary considerably from one
state to the next, statelegislators are the core actors in
education policy formation on most issues and in most states.
For the present at least, state policy systems are definitely not
inclined ta leave education policy formation to professional
educators -- not to the state departments of education,
professP:nal associations, or local school districts. There are
exceptions to this generalization -- teacher organizations in
Illinois and the chief state school officer in Wisconsin, for
example -- but it is safe in most places to assume that
educational policy change means legislatUre action.
Page Ex-33
48
Seventh, while policy systems differ, every state policy
system Prescribes normative rules for interaction among
policvmakers -- violation of these rules sharplY limits one's
capacity to Influence decisions. These rules are embedded in the
"assumptive worlds" with whinh policy makers routinely orient
themselves to the policy system. They specify who has the right
to initiate policy actions and they limit the range of acceptable
proposals. Self-conscious knowledge of these rules would enables
individuals to position themselves for the greatest Impact on
decisions In which they have an interest and minimizes the
likelihood that they will be disabled by an Inadvertent violation
of established norms.
Eighth and finally, statutory law does not give equal
expression to all compltingsublic values. In part this
Imbalance Is the result of differences In emphasis over time and
In different policy systems. In part, however, it Is also the
result of the fact that statutory law Is not equally well suited
to the expression of all four of the basic public values. Law Is
best suited to the regulatory and accountability dimensions of
the public Interest In efficiency. Legal language Is not
inimical to the pursuit of quality, but it Is also true that many
dimensions of quality education cannot be easily formulated as
legal requirements. Formulating effective policies to assure
quality educational services requires careful thought and great
diligence. It Is easy to legislate accountability If policy
makers can specify precisely what behavior Is required, but when
it comes to requiring the production of specific outcomes,.the
Page Ex-34
4 9
law becomes an imperfect instrument at best. The equity value
which has received so much attention in the last quarter of a
century of education policy development is even more difficult to
embed in legal language.
Equity, from a legal standpoint, is an issue of redress, not
one of address. That as, equity laws can only be written to
cover situations where inequities have already been identified.
As a result, truly equitable policy systems would probably have
very little equity language embedded within their legal codes.
As a public value, choice is even harder to embed in legal
codes. Choice, at least in the American system of law, is a
residual category -- it is what citizens have If no law is
written at all. Hence choice comes to be embedded in statutes
only when laws are returning limited freedom in situations where,
for other reasons, policies have already intruded upon basic
liberties.
In sum, the tendency of education policymakers to see the
legislature, and hence the statutes, as the center of the
decisionmaking procesa has a natural tendency to bias policy
debates toward effIcAency and quality, the values best suited to
statutory _language development.
Future Directions in Statto Policy Research
As outlined in this summary and elaborated in the body of
our Final Report, this research project has made 4 number of
specific and detailed contributions to the growing body of
Page Ex-35
50
knowledge about state level education policy and politics. We
conclude this summary by highlighting five of its most important
contributions -- ones which can be expected to guide future
research and analysis.
1. The taxonomy of mechanisms and approaches developed in
the course of this research project makes it possible
to approach the definition of state policy research
variables in a new way.
Until now, state level education policy research has lacked a
clear framework for defining its central variables. Most
research defines its central variables in terms of controversial
political "issues" or formally defined governmental "programs.°
The use of issues to define policy variables subordinates
reseatz:h to the political process which it is tryiag to explain.
Tnat is, analysis cannot begin until some set of political
interests have become clearly enough focused and effectively
enough mobilized to create an "issue" and propose one or more
actions to deal with it. The result is an analytical separation
between the origins of political action and its impact. It is
possible to study the origins of various issues (by looking at
the social, economic, political or demographic forces which are
mobilized to produce them). And it is possible to study the
impact of issue formation and resolution (by looking at the
effects of policies or programs resulting from issue formation).
The two processes are necessarily disconnected, however, beacuse
the definition of an issue is itself a political event which must
be empirically identified. Issues are inevitably complex and the
Page Ex-36
3
difficulty of empirically isolating them almost always obscures
the relationship between originating forces and ultimate
consequences.
The use of formal governmental programs to define policy
variables does not pose the same problems of disconnection
between origin and impact, but it does create other problems for
research design. Programs are inevitably complex in character,
affecting a complex array of variables and resulting from a
compromise and accommodation among a variety of policy
interests. As a result. it is frequently difficult to clearly
specify what the defining features of a program may actually be.
Indeed, governmental programs are often seen as notoriously
different events by different audiences and interest groups.
Hence it is extremely difficult to cumulate research insights
across various program focused studies. In fact, research
findings from various program focused studies are frequently
turned into policy proposals or new governmental programs that
incorporate the language of the findings in ways that are almost
totally unrelated to their substantive meaning in the context of
the original research (note, for example, the peculiar ettraction
of state decisionmakers to extending school calendars on the
strength of "time on task" findingi drawn from classroom
observation).
The taxonomic approach developed in this research, if it
proves robust and can be more fully detailed in future research,
will resolve both the longitudinal development problems of issue
based analysis and the cumulative knowledge problems associated
Page Ex-37
52
Q
o
with studies of governmental programs. The taxonomy proposed in
this study is probably not complete, and it certainly lacks the
detail needed for comprehensive research. But it does promise te
provide solid structrral underpinnings to the crucial process ef
defining state policy variables.
2. The demonstration in this research that political
cultures can be measured in ways that can be subjected
to statistical analysis provides a basis for
significant new work on this important dimension of
policy formation and impact.
Most previous measures of political culture orientation have
utilized content analytic techniques that are extremely costly
and of limited use in statistical studies of the relationship
between political culture and policy actions. More work needs to
be done en the culture measurement instrument developed for this
research project. Some items did not produce the expected
results, and there is a bias toward the Individualistic culture
pattern built into some responses. Nevertheless, the instrument
provides an extraordinarily interesting starting point for the
development of a statistically reliable measurement instrument.
3. The conception of state statutes as the record of
ongoing public value choices by state policy systems
provides an important starting point for future
research on foundations of education policy.
The statutory record of state policy decisions is rarely seen in
its totality. Sections are frequently reviewed and compared, but
little work has been done on t...ying to develop a comprehensive
Page EX-38
53
picture of basic policy options through statutory analysis. The
recognition In this study of Inter-state differences In overall
statutory framework, and Insights which analysis of education
codes In Illinois and Wisconsin have provided Into the ways in
which policy values are embedded In law should provide a point of
departure for some very interesting and Important future work.
4. Elaboration of the essential elements of policymakers
"assumptive worlds" which was begun In this project
deserves sustained Interest.
Our work has provided intriguing Insight into the taken-for-
granted worlds within which policymakers operate. We have only
scratched the surface of this line of research, however. The
obvious rules of action found in our data need to be elaborated
and tested In a much wider context. And a theoretical framework
which explains why such rules come into existence and what
functional value they have under differing circumstances needs to
be developed.
5. Above all, the focus of this research on the role of
values In the formation of education policy offers a
much needed basis for future work.
Eventually, of course, policy researchers need to clearly and
convincingly distinguish the role of economics forces, political
Interests, structural arrangements, and a host of other factors
at work In the formation and implementation of education policy.
At the present time, however, we feel that value preferences and
commitments which are the obvious "stuff" of day-to-day
interaction In the political arena have been too little studied
Page Ex-39
and too poorly conceptualized. If there is any one message we
feel this project should give to the research community it is
this: values and value commitments are at the heart of
educational policy formation and implementation -- these values
can and should be measured in order to understand how the policy
system works, how actions in the policy system are linked (or not
linked) to school programs and practices, and why actions that
often seem clear and decisive to policymakers are distorted or
ignored by those toward whom they are directed.
Page Ex-40
55
6
%.*
(
CHAPTER I
BACKGROUND FOR THE STUDY OF
STATE EDUCATION POLICY SYSTEMS
State efforts to control the public schools rely on a wide
variety of political, economic, end social mechanisms. Change
efforts are evident in ideology, finance arrangements, litigation
and legislation, and professional practices. Some changes, such as
judicial intervention and federal involvement, push education
policy initiative away from state decision makers (Wirt and Kirst,
1982). Others create a new power balance within the states
themselves: reapportionment elevated urban-suburban interests over
rural; weakening of party discipline in many states encouraged
reform oriented change; development of new legislative and
educational management capacities in state capitols, gave rise to
the belief that change could be precisely targeted (Sharkansky,
1972; Murphy, 1982). These changes pushed state educational
policymakers to take more of a hand in school systems and resulted
in,broad new state mandates for local education authorities.
To sort out this increasingly turbulent environment of state
education policymaking, we will set a background picture of similar
and unlike features of the contemporary culture, and then set out
the matrix of values within which state policymaking occurs. These
general observations will serve to introduce this project's meth-
Page I-1
56
C.
odology and research design in Chapter II and will emerge
repeatedly in succeeding analytical chapters.
Similarities and Contrasts in the American Culture
An historical impulse of political authorities and leaders of
other institutions has been to resolve differences among a people
of great diversity. Differences in social life are often
distrusted, an emotion which can divide social institutions and a
national culture. This conflict-resolution impulse by leaders has
often resulted in agreements that, over time, led to common beliefs
and practices; The impulse sometimes fails, occasionally on a
disastrous level -- like the Civil War. What, then, is the larger
context of cultural division end unity in which our study is set
and in which government must operate? We can see both common and
differing aspects at any one time, altering the old motto to read,
"From many, both one and many." Our research is a study in both
the unifying and the differentiating elements of state education
policy.
Common Elements
Values. The value context of our society has common elements.
Although Americans lack an ideology, that is, an integrated belief
system which explains normatively past and present events,
observers have long noted the presence of certain coamon, if not
always consistent, social values. Individualism, materialism, and
pragmatism are often cited in this respect, while others would
point to the cooperative, life-affirming values of humanitarianism
and liberalism, progressivism and optimism. Obviously these
Page 1-2
57
contradict, but just as obviously Americans have lived with them,
altering William James' aphorism to read, "Most people live lives
of quiet contradictions." We will return shortly to these values.
Institutions. We share st290 a set of common institutions.
Historical experience and contemporary polls show that we think
very highly of these, although we uspect persons in positions of
authority within them, particularly political officials. We have
inherited and now sustain Constitutions at national and state
levels that constrains abuse of govermental power and guarantee
civil rights and freedoms. There is widespread acceptance of
common principles, such as separation of powers, two-party
competition, and due process of law. Other widely-shared political
practices include: .belief in one's political party; a system for
policymaking widely shared by many groups; and a passion for using
all levels and branches of government -- including the courts -- to
raise and settle political issues.
Certainly we share a general belief in an economic
institution, although, like the political system, it takes
different shapes and practices through time. We have never had a
"free" economy; in its heyday a century ago, government was not
neutral but was used to regulate negative externalities of doing
business while subsidizing the positive externalities. Today,
close observers would term ours a "mixed" economy, which still
means government regulation and subsidy. But the central values of
encouraging citizens to purse economic self-interest through the
interplay of supply and demand, and of maximizing wages and
Page 1-3
58
profits, still motivates much of the economy, despite constrictions
imposed both by the economy and by government. The final common
elements of this economy are its Interdependence nationally, its
vulnerability internationally, and Its impact on all governments.
Vulnerability to Change. One common element of such
Institutions is not simply their stability but their vulnerability
to change in the face of national currents which sweep through
them, instigated by new ideas or grave crises. Some changes are
merely fads, like the current spate of corporate takeovers; in the
longer view, such passions are temporary because they have come and
gone before. But other changes last longer, generated by either a
new idea or a traumatic event. These two Interact, of course, as
witness the Great Depression causing popular beliefs to accept a
more positive role for the national government In managing t-a
economy and providing for the public welfare. Ideas matter, and
they generate institutional change. Keynes noted decades ago that
the accepted Ideas of hard-hez.ded businessmen were actually the
seminal ideas of "scribblers" of an earlier period. Events also
matter, like boom and bust in the economy or world wars. These
traumas change the way that institutions operate and that persons
with authority think about their roles.
Differentiating Elements
Americans clearly and regularly disagree over what values
should prevail and how institutions should operate. Certain forces
in our society account for, indeed encourage, such disagreement.
Institutional leaders kncw, however, that they live In a world of
Page 1-4
59
...Inflict generating difference. Hence, they learn how to survive
and thrive amid that context. Education plays some part in muting,
without abolishing, differences of ethnicity, religion, race, and
status.
Another source of our national differentiation lies in
resources. David Potter pointed out in his classic People of
plenty, (1954) that the mere presence of rich resources in this
nation helped mightily to shape Americans' attitudes about self,
institution, and culture. Others pointed out how differences in
resource distribution have generated differences in policy services
to cope with the social and economic issues of life at any era.
Much social research of two decades ago sought to show that
resource difference s. not political differences, underlay variation
in policy services of state governments (Dye, 1966). Clearly there
are major regional and state differences in physical and economic
resources which account for how people feel about and act toward
. their institutions (Pierce and Hagstrom, 1983).
A further source of difference lies in the mixes of demography.
The people themselves generate different demands upon institutions,
including demands upon institutions for policy services. Moreover,
changes In demography can change these demands, as populations move
restlessly or new populations arrive from outside our borders. The
classic examples are the urban political machine and mass
production. They became possible only when arriving masses of
immigrants 140 years ago and later generated new needs and demands,
Page 1-5
60
while contributing new resources into the political and economic
systems.
Relevance to This Study. These differences and their
underlying causes will be seen in the states of this study. For
example, a rebounding economy in California in the mid-1980's makes
possible a school system better financed to respond to new demands
for quality in school performance; but a still sluggish economy in
Illinois makes such a response much reduced. Or, population gains
in Arizona and losses in West Virginia create new strains upon the
school services; the issue in the first is school growth but in the
second school consolidation. Yet all these differences must filter
through state policymaking systems, and it is here that we find
another differentiation in the national culture.
Overlaying the coamon constitutional structure of the states
have been the effects of differing historical experiences,
population mixes, and leadership. The result has been that the
political system, its leaders, and its policymaking generate
different political judgments across the nation. Each of these
differing judgments constitutes a perspective on what government
and politics, leaders and policies, should be like. These
°political cultures" will be explored more fully in chapter 6, as
will their impact upon our states' educational policies. A major
advantage of a cultural perspective is that it permits a more
patterned view of what seems at first glance fifty states doing
fifty different things. Rather, this perspective permits us to
justify theoretically, and hence to, explain, these limited
iige 1-6
61
'IC
(.
patterns of political and policy behavior. Such an approach helps
us explain, for example, why there has been greater state control
over local districts in West Virginia than in Wisconsin, or how use
of the appointment versus the elected method of selecting the chief
state school officer affects the potential for educational
leadership.
The American and the Educational Cultures
These general cultural considerations, and their similar and
differing features, have application to public schooling. That is,
this larger culture helps shape how educational resources are
employed, what educational goals are pursued, and what the politics
of education in the Aaerican states is like. Let us review again
the role of values, institutions, and vulnerability to change as
they apply to public schooling.
Values
A coamon value, so pervasive as to be almost unnoticed, is
what could be termed the "child benefit" value. That is, education
is such a good thing that one's children should have as much of it
as private and public resources can afford. That value has
underlain the "free public schools" concept that has educated far
more of our children, in absolute or proportional numbers, than
found in any other nation. Pursuit of the child-benefit value for
almost 150 years has engaged faally and government resources in
ever-increasing amounts: school expenditures are the largest for
any service in every one of the fifty states, far out ranking
social welfare costs. This value has been so strong that it could
Page 1-7
62
survive a potentially divisive split over a century ago between
Protestants and Roman Catholics about schooling; both sides agreed
that separate institutions would be acceptable.
But as wlth all coamon values, there arise differences in
values over the regular questions of all policymaking. How much
schooling should be provided, who should pay for it and how, what
should be taught, and who should evaluate the service (Wirt, 1982).
For example, many states agree on the value of teaching American
civics. But what should we teach is the pupil's duty as a citizen:
to accept uncritically what government does or the duty to question
government's use of power (Litt, 1965; Morgan, 1977)? Similarly,
the current conflict over teaching evolution versus creationism is
manifestly rooted 1r value differences. So, given a diverse
citizenry, who view schooling from different normative
perspectives, the value conflict arises episodically in public
schools.
But other roots for differences exist in the different
distributions of resources and the value differences these
generate. A local school public nay agree fully over.the
desirability of a particular school program, but lack the financial
resources to provide it or the expertise professionally to carry it
out. The unequal distribution of resources like money and
knowledge means that pursuit of the child-benefit value necessarily
produces wide differences in what is regarded as desirable policy
and thus ln the quality of schooling. A generation now uf judicial
and legislative attack on such differences has demonstrated
Page 1-8
63
empirically the-gap between desires and results that stem from the
resource problem.
Institutions
We have inherited a set of common institutions, but history
has given them distinctive shapes from place to place. That
applies also to education system and policy.
Political Institutions
The U.S. Constitution's concern for the abuse of political
power is writ large in its many limitations upon authority; in
effect, our founders wrote a document incorporating the secular
version of original sin. For example, while "federalism" was not
mentioned in it, the tenth Amendment's division of powers between
central and state governments laid the basis for the complex
intergovernmental relations of today. One part of that division
has been the state's reserved power to control education, when that
state policy arose a half-century after the Constitution was
written. The result has been the familiar aphorism: education is
a state function administered locally. Recently, however, there
has emerged more control and administration at the state level.
Nevertheless interstate practices show different patterns in
how this institutional arrangement works. Some states have much
more to say in detail about the funding and,administration of local
schools than do other States; analysis of laws on this phenomenon
in the earl. 1970's shows major regional differences in this basic
constitutional matter (Wirt and Hirst, 1982,) History has
accounted for such differences. New England, rooted in fears of
Page 1-9
-
centralized government under the Crown, even today keeps authority
over schools more decentralized. The Confederate states, whose
local resources were destroyed in the Civil War so that communities
needed to rely upon their states, even today has more centralized
state control of schools. So one expects to find among the states
different practices over the state's role, even though all states
place constitutional supremacy over the schooling fully in their
hands.
Economic Institutions
The economic institution also reveals similar and unlike
aspects as applied to education. While there is a national economy
of great interdependence, there are also regional and even state
economies, which vary enormously in their wealth. Of the states in
our sample, West Virginia is among the poorest, ranking about 45
out of 50 on most measures of school services because of its weak
economy. On the other hand, California's wealth, were it a nation,
would make it richer than all but the U.S. and six others; it has
been spurred to greater growth by successive spurts from the gold
to the silicon era (Peirce and Hagstrom, 1983, p. 747). Such
contrasts mean that at any tage of economic boom or bust, the
fifty stateS will differ dramatically in their capacities to
produce public funds for education, with consequences for
differential qualities of educational ervices. For example,
between 1900 and 1966, the 48 states' rankings of the proportion of
state funds given for local school costs had altered remarkably
little (rhcm.60). The period 1963-1973 were filled with dramatic
Page I-10
35
events in school funding and programs; nevertheless, the 50 states'
rankings of average instructional salaries (which accounts for
70-80 percent of school budgets) changed hardly at all (rho.90)
(Wirt, 1976, pp. 326-27).
Furthermore, states of equivalent wealth or economic
development can generate different educational demands because of
differences in their population mix. California has an emerging
schooling issue in Its recent flood of relatively poor, non-English
*peaking minorities; in 1980 about one in four
Californians were minority group members (150% of the national
average), and the rate of increase in this change in the 1970's was
250% of the national rate. On th* other hand, Wisconsin has a much
smaller concentrstiOn of these minorities, even including Native
Americans, which means a smaller proportion of poor. Consequently,
both systems.will make different demands upon schooling as a result
of !Afferent populations.
There is another economic factor affecting education, that is,
whether the economy is controlled by a few or shared among many
interests. For example, the absolute dominance of coal mining in
West Virginia, preoccupied with keeping taxes down, and
constraining government expenditures, is a major reason why that
state's educational services rank so low. While coal is also
important to its neighbor, Pennsylvania, the latter's economy is
shared by steel and railroads, as well as by a huge,
services-oriented economy of metropolitan Philadelphia. While once
dominated by industrial interests and a corrupt Republican party.
Page /-11
66
the state nevertheless provided proportionately more for education
than West Virginia. Even In its industrial decline since 1970,
this educational effort was still stronger; in 1978, Pennsylvania
provided $2,307 per pupil vs. $1,628 in West Virginia, despite the
latter's higher percentage of state contribution and tax effort for
schools (Wirt, 1983, p. 318, from NCES data). This spending gap
helps explain why a year later a state supreme court compelled the
West Virginia legislature to improve state contributions to the
state's schools.
State Vulnerabilities
The national phenomenon of regional and local vulnerability to
currents of social and economic change is also illustrated In
educational matters. Diane Rav!tch (1984) has chronicled how
public education during this century has resonated to successive
waves of reform. Vocational educational, child-centered
curriculum, desegregation -- these and other issues exhibit a cycle
of the new idea sweeping through the many school systems to alter
personnel, finance, and programs. Some changes, once implanted,
cannot be removed (vocational education), other changes are
challenged continuously (desegregation), and yet others lose their
influence over time (child-centered schooling). This system's
vulnerability to change has been used by the networking practices
of school professionals to penetrate the local districts and states
with their reform ideas; that process continues, from making school
administrators "managers of virtue" tTyack and Hansot, 1982)
Page 1-12
beginning a century ago, to the urging of school finance reforms in
recent decades.
Such vulnerability may arise also from alterations in the
national and international economies. Booms or busts obviously
affect school budgets in ways that enhance or constrain educational
programs. A study of nine nations of contrasting political and
economic systems (including the U.S.) showed clearly how the
international recession of the 1970's altered budgets, programs,
and results for their education systems of existing in a "world
village" (Wirt and Harman, 1986). Also, ware can cut the supply of
teachers or building materials, while peacetime will increase them.
The OPEC crisis commencing in 1973 inflated the proportion of
school budgets for energy at a great rate. Moreover, prosperity in
one region can pull teachers and administrators from a declining
regional economy, as the Snowbelt to Sunbelt movement of school
personnel shows.
Underlying this vulnerability is the reality of an inter-
dependent society. States serve a oignificant function of
responding to those realities as their resources, culture, and
leadership deems appropriate. States affirm or deflect these
national currents in distinctive, although patterned, ways. All
states respond to them, but differing circumstances of value, will,
and pcwer cause the response to be refracted through the unique
prlsm of each state's traditions and decision structures.
Historically-given differences generate distinctive adaptation to
change, rather like what one sees in a stream. Not all currents of
Page I-13
68
a stream are moving at the same speed, as some rush down while
other slowly eddy around, preserving much of their content. But
all the water eventually moves downstream, each part at its own
rate.
Background of Values in Policy Change
This larger picture of national and state cultures of values
helps us focus upon the search for particular values amid much
change in educational policy. Most states have changed the overall
direction of their education policy over recent decades in the
pursuit of a few key values. Broadly put, efficiency was the
pre-eminent educational policy goal from the 1920s until the 1950s,
that is, the "cult of efficiency" era (Callahan, 1962; Tyack,
1974); however, at the same time there was a search for quality
that underlay a child-centered, or "progressive," curriculum
(Ravitch, 1983, chapter 2). Even as efficiency was reaching its
apogee, the unique American dedication to social equity continued
to expand the base of the school system bringing mass education to
the great majority of children. Equity emerged as the dominant
issue with the Brown v. Board of Education decisions in the
mid-1950s, and remained the mst important problem facing education
through the 1970s.
But in the wake of the Sputnik launching in 1957, the issue of
Quality began to develop as a major concern of state policymakers
(Mitchell, 1982). During the 1960s and 1970s, declining test
scores, lack of positive findings from major evaluation studies,
Page 1-14
69
concern over declining productivity in American industry, and
criticism of th skill of entering college freshmen and army
recruits -- all combined to raise new Quality terms like
"excellence," "achievement," and "competency" in the policy debate.
Throughout these decades, though, the value of choice persisted it
the form of private school options; experiments with open transfer,
alternative schools and vouchers; election of boards and
superintendents; referenda on bonds and levies, and direct
participation of citizens in school program planning and
accountability schemes.
These four values of efficiency, equity, quality, and choice
are defined quite fully in later chapters (see Chapters VI and
VII). A brief defifiition of each now will set the stage for our
policy discussion, however, by showing how different directions and
preferences for public resources direct policy formation and
implementation.
- Efficiency: the effort by a superior agency to require a
subordinate agency to follow specified and publicized procedures in
order to oversee compliance with the former's goals. Efficiency
may take either an economic form (cost-benefit formulas for
expenditures) or an accountability form (establishing regulations
to control the exercise of authority).
- Equity: the application of public resources to overcome a
deficiency faced by students or school personnel who lack their own
resources for such remedies.
Page 1-15
70

- Quality: requirements and resources aimed at insuring that
school programs attain performance standards determined to be
appropriate by either the profession or the public.
- *Choice: the availability of options for allocating public
resources, shaping school programs, or selecting public officials
that are exercised by non-professionals, such as voters, parents,
or students.
Obviously, there are some tensions among these four values.
Nevertheless states pursue all four simultaneously in a broad array
of policy initiatives. There is great variety in what the states
adopted. However, most policy initiatives of the 1970s were not
comprehensive school Improvement programs, but narrower and less
vigorous actions (Odden and DomghertY, 1981; McLaughlin, 1981).
Responset-: to A Nation at_Risk and other challenges demonstrated an
equal variety of response, blit again, few programs of comprehensive
change (Shinn and Van der Silk, 1985).
This is the valtte background within which this report
proceeds. Each of the chapters examines different ways of
exploring the presence rf these cnd other values in a sample of six
diverse states. We will rind these values latent or manifest in:
the priorities given to different state policy mechanisms; the
approaches to these policy mechanisms currently under dehate; the
state statutes and political cultures; and the personal dimensions
and assumptive worlds by which policy actors make education law.
The result is a theoretical taxonomy of education policies set
Page 1-16
71
within the public values and personal perceptions of policy elites
in these sample states.
Policvmakers' Roles and Motivations
There is an important personal dimension to policymaking in
the states. Because officials with different value orientations
must resolve conflict to produce policy, institutions and values
obtain meaning when processed by officials who can transform
institutional power and resources into policy action. Accordingly,
we conceptualize them as political actors who respond to their own
values and to influences upon them generated by the political
milieu within which they work. Chapters /X-X explore in some
detail the roles and responses of individual policymakers.
At the outset ol this study we expected the four competing
public values to interact with interpretations of alternative state
policy mechanisms (SPMs) to document and describe different
priorities among the sample states. /f not, we reasoned, state
influences have little effect on policy choices; which must
otherwise be the result of nationwide influences which are moving
all states to similar actions. If there are priorities among these
values and SPM choices, however, they suggest two important
political influences operating within state policy systems. First,
citizen groups can influence the policymaker) that is, the latter
do not impose only their values upon policy. Democratic theory
proposes, and historical experience confirms, a complex linkage
between leader and citizen) it is not simply one leading the other,
because the two are highly interactive. A second influence within
Page I-17
72
state policy systems is that elected leaders like to stay elected
and that preference influences their policy behavior.
Congressional research stresses that of all factors possibly
influencing the lawmaker's vote the most significant Is his or her
desire to be re-elected (Mayhew, 1974). The lawmaker may engage in
"position-taking," "credit-claiming," and district "caseworg," but
these actions and the vote-casting are keyed to a common concern to
be re-elected. We are presumIng that state
legislators are shaped also by this central concern, especially the
kin, leaders studied here.
These two influences upon state policy actors point to the
responsive mode that they employ, and that suggests, in turn,
that their decisions among values and SPMs will reflect some sense
of what voters and significant groups want in their states. That
responsiveness affects their policy behavior lrt two ways.
The Breadth Stimulus
First, if a policy problem concerns everyone to some degree,
and that is known, then those in the policy system will be
affected by such a breadth of public concern. This concern may
lack specifics -- "Children should learn more" -- but policymakers
will nevertheless hear about it from different constituencies and
so will feel the pressure to "do something." This popular stimulus
provides them with a quick awareness that the matter must be put on
the policy agenda for some kind of action. It is after getting on
the policy agenda that issue conflict emerges over timing, funding,
and content of programs.
Page I-1S
73
This breadth stimulus explains why school finance became so
salient to so many policy actors in education. The pervasive use
of the local property tax to finance schooling generated a breadth
of concern about its weight as the inflation of the 1970$
increased. We will see later how truly salient it is to our policy
elites. A similar breadth stimulus can be seen in responses to the
A Nation at Risk report. In the first two years after its
issuance, only five states had done nothing, 18 states made 1-10
changes (including Pennsylvania and Wisconsin), 15 made 12-21
changes (including Illinois, West Virginia, and Arizona),
eight did between 23-42, and three (including California) did 48-58
changes (Shinn and Van der Slik, 1985, p. 39). This political
system variation in behavior is explainable by political actors
need to respond to issues that are pressureful; democratic theory
requires it, and officials desire re-election.
The Intensive Stimulus.
But not all policy comes from the breadth stimulus. Rather,
policy priorities can flow from the power of special interest
groups who operate in a milieu normally filled with public
ignorance of, and indifference to, those interests. That Is,
lawmakers respond not simply to mass of numbers but also to focused
articulation and mobilization -- an intensive stimulus. The rich
literature of lobbying activity has caused political scientists to
ascriba most, if not a majority, of lawmaking to this factor, (see
any isJue of Congressional Quarterly). Nevertheless, there is a
surprising congruence between public opinion in general and
Page r-19
7 4
_
national public policies over the last 30 years (Weissberg, 1971;
Page and Shapiro, 1982, 1963). But it is also the case that narrow
group opinion makes itself heard by lawmakers and that its
resources bring a sensitivity to law- makers' campaigns.
This factor helps explain why laws protecting teacher
Interests are strong in states where their organization is larger
and stronger; we will find sharp contrasts in this inf. tnce
between Arizona and Illinois. Nor is it surprising, in states
dominated by a few large economic interests, like West Virginia,
that those interests are more clearly responded to, even at the
expense of educational services.
Cultural Effects
A final and subtle influence upon policymakers' priorities
among values and preferred state policy mechanisms (SPMs) lies in
state or regional political culture (Elazar, 1984, chapter V). We
have noted earlier that this set of expectations about how
government should operate may help explain Interstate
differentiation in policy programs. Such expectations, socialized
through institutions and experiences, shape perceptions of s
problem's existence, the will to do something about it, and the
knowledge of how to do it. In Wisconsin, for example, government
is viewed beneficial, with the result that there are broad based
positive expectations for high quality of government personnel and
services and confidence in government's ability to improve life.
Sy contrast, in Illinois, where government is viewed as lnjuriou.
to the social order, there are fewer such expectations. In these
Page 1-20
75
contrasting milieus, the policymaker's action must be shaped by
what one expects to happen when government action o6curs, and that,
in turn, shapes the selection of values or SPMs.
In short, state variations in value priorities and education
policy preferences arise in part from political influences upon
policymakers. These influences include; the motivations of
lawmakers to survive; the general publics' concern to be heard;
special publics' narrower concerns about group protection; and the
state's political culture.
Background of
LtrgpIpral Uniformity and Variation
We noted earlier the common features of govcrning the American
states -- separation of powers, judicial review, partisan
legislatures, constitutional constraint on power, and so on. But
these commonalities may be used in different ways to create
education policy, for political will and technical competence vary
among the states. This uniformity and variation appear in our
six-state sample.
For example, the governorship might seem a likely fount of
policy initiatives in education. Some governors do indeed have a
strong role (Pennsylvania and Wisconsin), but in the 1980s all of
them took a stronger interest in education as a result of economic
recession and the burgeoning school reform movement. In many
states governors typically exercise only limited influence.
Sometimes that is because of a tradition that policy initiatives
will come from the state school board or from the chief state
Page 1-21
76
school officer (CSSO) (West Virginia); sometimes it is because
gubernatorial leadership Is not the norm (Arizona and Illinois).
The governor's role can alter because of an incumbents's keen
personal interest in education (Pennsylvania). On the other hand,
California's governor in the period of this study seemed more
interested in accepting policy initiative from the state's CSSO,
which has been the West Virginia pattern.
The influence of leaislatures in educational policymaking Is
typically central, especially since all of them were strengthened
during the 1970s by the addition of staff (Fuhrman and Rosenthal,
1981). They all took a much greater interest in reducing schooling
costs in that decade, while in the mid-1980s they focused on
improving school performance. But the legislature's influence on
school policy varies among the states. It is weak in policy
initiative in West Virginia, fully active in California, and much
identified with leadership by individual legislators in Wisconsin.
Decisions may be buffeted by politica: party competition, as in
Pennsylvania and California, or dominated by a single-party system,
as in Wisconsin. Legislative staff are highly important for the
legislature's work in California, and for the individual legislator
in Wisconsin, but of limited influence for West Virginia.
Leadership In policy administration is always the domain of
the CSS0s, recently they have also taken greater interest in policy
innovation. CSSO staffs have expanded everywhere as a result of
the Elementary and Secondary Education Act of 1965, a resource
which strengthened their research and legislative liaison influence
Page 1-22
77
(Murphy, 1973, 1380). Today many of them are regularly in the
news, such as the incumbents In California and Wisconsin. Some
CSSOs are elected, and the legitimacy of their election provides an
independent source of political Influence in negotiating with other
branches. Even In Arizona, a state with little leadership In
education in the past, the CSSO has recently emerged as an
end!rgetic and effective policy advocate. In West Virginia and
Wisconsin, there has been a tradition of strong CSSOs leading
reforms. In both states, however, there are
differences In the vigor of oversight of local districts; Wisconsin
does little and West Virginia much more by tieing oversight to
funding.
As for the state board of education, they reflect much
diversity in Influence. They are relatively strong In Arizona and
West Virginia, but weak In California and Illinois. No SBE even
exists In Wisconsin (where one finds little sense that something is
missed).
This Is a mere sketch of the different shapec that the same
governing structures can take. We will later provide more
patterning of these offices when we examine the perceptions of
their policy Influence within and across the states.
Multiple Values, MultiPle Understandings
The major research question around which this project is
centered is: How do we understand the role of values In state
education policy? There Is, of course, no single way of answering
that central question rather there are multirkle paths to
Page 1-23
7
understanding or recognizing values at work in social institutions.
Rather than trying to force all data into a single explanatory or
descriptive mold, we must recognize and draw upon various
frameworks for comprehending the operation of social values within
public policy.
This multifaceted approach exists because different ways of
posing the question of values imply different data and
methodologies to answer. No one question is the sovereign key to
the kingdom of knowledge because there is no agreed upon universal
perspective and no single method of analysis in the socia....
sciences, just as there is no normative agreement about the
relative importance of the many aspects of a social process.
Consequently, across all state education policy systems what "the"
role of value is depends upon the data and method of analysis.
Therefore, we utilized the different methodological trainings and
normative interests of the research team to explore three
distinctive paths to recognizing and understanding the role of
values in state education policy.
Quantitative Comparisons
Values at work may be recognized and their effects understood
by quantitative comparison that creates empirically measurable
independent and dependent variables to be manipulated
statistically. The purpose of this path is to explain observed
variations in a reality that is described in particular ways. This
path is undertaken in several chapters that follow. Chapter 111
examines variations among our six states in the priorities that
Page 1-24
79
they attach to basic state policy mechanisms (SPMs). Chapter /V
performs the same quantitative comparison of these states'
priorities in different program approaches to these SPMs. Chapter
V/ develops an index of political culture (drawn from policy
elites' judgments of their states' populations) and its policy
consequences. Chapter VI/ examines policymakers' personal value
perceptions and explores the linkage between these value judgments
and state attention to various policy mechanisms and approaches.
The central analytical device employed in these chapters are
statistical in character: correlation, regression and discriminant
analyses.
The limitation of this path to understanding -- as is the case
for other paths -- is that it focuses upon certain aspects of
policy reality, but ignores others. Essentially this path seeks to
answer the question: What accounts for specific, measurable
observed differences among the states in their handling of
particular policy actions? Basically this method eXamines
differences between certain state characteristics and policy
outputs. There is a rich literature sharing this methodology,
beginning with Dye's (1966) pioneering work. When it comes to
education, the greatest weakness in this research strategy lies in
the weakness of its dependent variables. In order to compare
policy system outputs we need a clear, consistent and comprehensive
framework for identifying and measuring policy activity. The
custom in state policy research is to define policies in relation
to issues -- that is to first identify an arena of political
Page 1-25
60
disagreement of conflict (e.g., finance reform, accountability,
equality of educational opportunity, bilingual education,
vocational training, student discipline, etc.) and then try to
measure actions taken to deal with these conflicts. The problem
with this approach is that identical policy actions can be taken to
deal with quite different issues. conversely, actions to deal with
a single issue can vary so greatly as to make it a)most impossible
to det6rmine whether one policy system has, in fact, taken action
on any particular issue that could be functionally compared to
actions taken in other systems.
Recognizing this problem, we devoted a substantial part of our
total research effort to reconstructing the dependent variables in
state education policy research. As detailed in Chapters 111 and
IV, we by-passed the popular issue oriented conception of policy in
favor of an examination of the fundamental mechanisms of control
available to state decisionmakers. Seven basic state policy
mechanisms (SPMs) were delineated (finance, personnel, student
assessment, school program definition, governance, curriculum
materials, and school facilities). Within each domain, a cluster
of alternative approaches to the exercise of state control were
delineated and studied. After reviewing the problems related to
the conceptualization and measurement of education policy outputs,
we became convinced that a major goal of our own work should be the
development of a concise, stable, and easily recognized taxonomy of
state policy alternatives. We expect that future development in
the quantitative study of education policy systems will be greatly
Page 1-26
8 1
facilitated once an appropriate, enduring dependent variable
taxonomy has been developed.
Even if our measurement strategy is completely successful,
however, it represents but one way of viewing reality in state
education policy systems. There will continue to be othe., equally
valid and Important paths to understanding how values operate to
shape education policy formation and implementation.
Explicit Values In Official Actions
Easton's (1965) influential formulation of the political
system as "authoritative allocation of values and resources"
directs attention to what these authoritative values ere. So a
second path to understanding focuses on two other data sets -- the
state statutes on education and direct measurement of policymakers
value preferences.
The primary method utilized to assess the values embedded in
statutory codes is textual content analysis. Content analysis of
the codes enables us to ascertain the presence and interrelations
of our four major values. Content analysis has not been used often
for studying educational policy. There have been a few recent
studies, however (see the American Bar Association study of state
laws on civics curriculum Henning et al., 1979 and analysis of
centralization of control by schools Wirt, 1977). Research alcng
this path assumes that the current mde incorporates past values in
official form, just as our chapters on SPM and approach ratings
tell us about current values at work. We find in these
"authoritative allocations" the results of past value conflicts.
Page 1-27
82
In short, the official language of statutory codes
institutionalizes the dominant values of each state's policy
system. By comparing states with different political cu3tures and
socio-economic qualities, we can determine not merely intrastate
qualitieJ of values, but how interstate differences may be
accounted for by historical and structural conditions of state
life. Chapter V employs this path.
Chapter VIII details a second approach to the direct measurement
of policy values. It covers the data generated when policymakers
were asked to assess the relative importance of various value laden
policy problems in education. This pathway to understanding takes
us Into the subjective preferences and beliefs of key policy
actors. The data is quantitative and amenable to statistical
analysis, but it leaves behind the objective world of social
conditions and concrete actions.
The value preferences expressed in data of this type can be
interpreted in two different ways. First, it could be used to
analyze or predict the behavior of individual policymakers --
establishing links between their expressed values and their
concrete actions. Our study produced little systematic data on
individual actions, however. Hence, this line of inquiry could not
be pursued in depth.
A second way of using the data was available, however. We
aggregated the views of individuals within each state, and tested
whether this collective expression of the value preferences of each
state's policy elite would help to interpret the priorities and
Page 1-28
83
preferences assigned to various state policy mechanisms and/or
alternative policy approaches. As detailed in Chapter VIII, this
path leads to considerable insight into the origins of state policy
action.
The PolicVmaking Process
The first tslo paths to recognizing and understanding the role
of values in state education look at substantive matters, but a
third path focuses upon process -- the process by which policy is
made. Education policymaking 1s purposive, that is
value-motivated, activity. Hence, actions taken by policymakers,
and their interpretations of those actions, can provide data that
reveal latent velues. The data for this approach are drawn from
interview transcripts and case reports in our six states. Several
questions provide the research focus. How do political actors
interpret and use their institutional roles or bases? Who
influences the process and its outcomes? What perceptions by the
policy actors shape the process and their own roles? Do basic
state differenceF, give rise to different kinds of process?
There are two ways by which this process-oriented path are
studied. One deals with the perceived influence upon educational
policy by the individual members of these state elites --
legislators, governor, CSSO, SEA, lobbies, public opinion, and so
on. The data are the responses to influence scales about a set of
18 officials, organizations, and carriers of opinion. Such
influence assessment on a comparative state basis for educat.4on was
pioneered for New England by Stephen Bailey and his associates
Page 1-29
(1962) and a subsequent 12-state study by Campbell and Mazzoni
(1976). chapter /X explores the dynamics of these interactions
among and within our six sample states.
A second way of examining process is to reveal the "assumptive
worlds" of the policymakers which act as a filter of external
policy demands. This concept is drawn from parallel work by Young
(1977). The method involves deducing from transcribed interviews
the political actors' dominant orientation symbols -- the
perceptions that create a game governing successful participation
in education policymaking. This path instructs us about how the
policymaking world socializes new members to adopt and follow these
informal rules. Members do this in order to maximize their own
values -- political advancement, constituency satisfaction,
responding to party ideology, penalizing out-groups or deviant game
players. The intensive analysis needed to deduce these perceptions
and judgments is illustrated in a study of two states in Chapter X.
Summary
This zhapter sets the background for approaching the study of
state educational pollcy values. We find that the American states
share much in common in values, institutions, and vulnerability to
change; yet the states also generate differentiated responses to
these common elements of national life. Both the common and
dissimilar elements are focused in some basic concepts. One focus
is upon four values in education policy -- efficiency, equity,
quality, and choice. These appear as having been filtered through
the personal element of policymaking that is found in lawmakers who
Page 1-30
85
must provide state policy mechanisms in response both to broad
demands frrr action from the genera/ public and narrow demands from
interest groups. The great diversity of the 50 states is
constrained in this research by focusing upon a sample of six
states and by rejecting any single way of comprehending the role of
values. Rather, the following analysis utilizes multiple paths for
recognizing and understanding the multiple roles for these values.
The methodology and research design which focuses the
conceptualizations of this chapter are addressed In Chapter II.
Page 1-31
8 6
REFERENCES
Bailey, S. et al. (1962). Schoolmen and politics. New York:
Syracuse University Press.
Callahan, R. (1962). Education and ale cult of efficienc .
Chicago: University of Chicago Press.
Campbell, R. & Mazzoni, Jr., T. (1976). State_policymaking for the
public schools. Berkeley, CA: McCutchan.
Dye, T. (1966). Politics, economicsjmluemblic. Chicago:
Rand-McNally.
Easton, D. (1965). A sYstems analysis of_political life. New
York: Wiley.
Elazar, D. (1984). 'American federalism, (3rd ed.). New York:
Harper & Row.
Henning, J. et al., (1979). Mandate jor change. Chicago:
Lmerican Bar Association.
Litt, E. (1965). Education and political enlightenment in
America. Annals of the American Academy of Political and Social
Sciences, 361, 35-45.
McLaughlin, M. (1981). State involvement in local education
quality issues. Santa Monica, CA: Rand Corporation.
Mayhew, D. (1974). Congress: The electoral connection. New
Haven: Yale University Press.
Mitchell, D. (1982). Governance of schools. In H. Mitzel (Ed.),
Page 1-32
87
Encyclopedia of Educational Research. Washington, DC: American
Educational Research Association.
Morgan, E. (1c77). Inequality in classroom learning. New York:
Praeger.
Murphy, J. (1980). State leadership in education. Washington, DC:
George Washington University.
Odden, A. & Dougherty, V. (1982). State ProArams of school
improvement. Denver: Education Commmision of the States.
Page, B. & Shapiro, R. (1983). Effects of public opinion on policy.
American Political Science Review, 77, 175-90.
Potter, D. (1954). People of_PlentY. Chicago: University of
Chicago Press.
Ravitch, D. (1983). 'lie troubled crusade. New York: Basic.
Rosenthal, A. & Fuhrman, S. (1982, Fall). State legislatures
and education policy: An Overview. Education Horizons, pp.
70-76.
Sharkansky, I. (1978). The maligned states, (2nd ed.). New York:
McGraw-Hill.
Shinn, D. & Van Der Slik, J. (1985). Legislative efforts to improve
a%e quality of Public education in the American states: A
comparative analysis. Paper prepared for the annual meeting of
the American Political Science Association, New Orleans.
Tyack, D. (1974). The one best system. Cambridge, MA: Harvard
University Press.
Basic.
& Hansot, E. (1982). Managers of virtue. New York:
Page T-33
88
Weissberg, R. (196 ). Public opinion and popular goJernment.
Englewood Cliffs, NJ: Prentice-Hall.
Wirt, P. (1977). State policy culture and state decentra-
lization. In J. Scribner, (Ed.), Politics of education.
Chicago: University of Chicago Press. Yearbook of the National
Society for the Study of Education.
. (1973). Institutionalization: Prison and school. In
V. Gray, H. Jacob, & K. Vines (Eds.), Politics in the American
states (4th ed.). Boston: Little, Brown.
& Harman, G. (Eds.). (19E6). Education, recession and
the world village. Ph!ladelphia: Palmer.
. Kirst, M. (1982). schools in conflict. Berkeley, CA:
McCutchan.
Young, K. (1977, March). Values in policy progress. Policy and
Politics, 5 (3), 1-22.
Page 1-34
89
,
CHAPTER II
RESEARCH DESIGN AND METHODOLOGY
The Nature of the Research
The research questions guiding development of theAlternative State Policy mechanisms (ASPM) project centered aroundthe search for modes of understanding
or recognizing values at workin education policymak:Ing. This chapter describes the design weused to explore questions about the embodiment of values in policyand the structural and procedural context for policymaking.Because there are many different paths to understanding the processof values embodiment. Nine data sets were collected, representingthree distinct methods for discovering and interpreting theincorporation of values into policy. In the first method data onthe character of embodied policy values are analyzed to determinewhether current state policy attention, and previous policy choicesembedded in education codes, reveal distinctive value patterns(displayed in Chapters III, IV, and V). Knowledge about, andattention given to, specific policy mechanisms and approaches, likethe policy choices expressed in state education codes, variessystematically from state to state. A second methodology was usedto explore policy values -- demonstrating the explanatory power ofstate political cultures, the political, economic and demographiccontext of state policy, and the views of knowledgeable elites
Page II-1
9 0
regarding the importance of various public of state policy goals.
These values influence policymaking and help explain differences
among states (displayed in Chapters VI, VII, and VIII). Third, the
dynamics of value embodiment are examined (in Chapters IX and X).
The perceptions and preferences of elites, the influence and power
system, and the assumptive worlds are ways of viewing the dynahic
system through which values are interpreted and incorporated into
policy.
ThP research quest for ways of understanding the embodiment of
values is distinctive. Using Easton's (1965) definition of
politics as the "authoritative allocation of values", it focuses on
the value of identification and legitimation function of state
education policymaking. This focus builds on but differs from,
previous research on education policy (e.g. Bailey et al. 1962, and
Masters, Salisbury, and Eliot, 1964). It ventures beyond earlier
work rIn legislative structures (e.g. Rosenthal and Fuhrman, 1981),
relative resources of policymaking bodies (e.g. Campbell and
Mazzoni, 1976), CSSOs and SDEs (e.g. Murphy, 1976 and 1980), and
interest group coalitions (e.g. Iannaccone, 1967). And it
distinguishes its systems from models of policymaking which analyze
policy by tracing the linkage between inputs (such as pressures and
demands) and outputs (resource or regulating decisions) (e.g.
Easton, 1965, Wirt and Kirst, 1982). To some extent our work
builds on Milstein and Jennings' (1973) analysis of the dynamics of
the thruput process in state policymakIng, but with much stronger
Page 11-2
91
emphasis on the concrete structural elements of educating policy
decisions.
The focus on where values originate, how they are transformed
in response to the current dynamics of the state policy system, and
how they can be identified in policy and organized into a
systematic taxonomy is a new approach. Its various paths for
understanding values embodiment do, however clearly, benefit from
the work of these previous researchers who have identified specific
actors and explored models of decisionmaking processes, ctructures,
and dynam..cs. Finally, our research is distinctive in being a
study of the most appropriate way to identifY and conceptually
organize value embodiment in public policy. This study is not
primarily an attempt to test a theory. Rather, it is research
designed to create theory -- to clarify the process and
significance of values embodiment in education policy and, through
comparative analysis, show the meaning and explanatory power of
several approaches to understanding the.t embodiment.
The research was conducted in six states, using common data
collection strategies, to allow comparative analysis. Such a
comparative study of state policy allows for examimation of
similarities and differences in the common elements in all state
policy systems. Comparative analysis among the six sample states
identified differences in political culture, revealed patterns in
the distribution of power and Influence, described the core values
of key decisionmakers, and elaborated their assumptions about how
policymaking occurs. It also facilitated understanding of how
Page 1I-3
92
these variables are related to values-embodiment in particular
policy and choices.
The study relies entirely on state-level data, with most data
collected through interviews and survey responses from 140 key
participants in six state education policymaking systems. The data
collection and analysis operated at two analytic levels -- the
individual policymakers and the state policy system level.
Individuals were used as the unit of analysis for some data
sets because:
1. policymakers occupying positions of influence haveintimate knowledge of the interworkings of each statepolicy system and are in the best position to judgethe values which guide their operation;
2. these policymakers' own values and preferonces affectstate policy eolces; and
3. policymakers' work as sensors of state problems and o:'popular values which help to translate these problemsinto policies, hence they have specialized informationregarding the origins and meanirj of key policychoices.
In this connection, our study examines how key individuals
come to take up a position within the policy system and how
individuals account for the transformation of beliefs and problems
into specific policy choices.
The aggregate behavior of the six policy systems under study
represented another level of analysis. The system level analysIs
was performed by pooling individual data and interpreting the
pattern of average or typical individual responses. Key policy
actors individually reported their sense of policy priorities and
choices as well as the dynamics and background variables affecting
Page 11-4
93
C_
policymaking in their states. The collectivity of their responses
served as our "best estimate" of the objective rgality of
policymaking in each state. These estimates were the basis for
description of the actual context of policy within each state and
thc basia for identifying the similarities and differences in the
policy contexts among the six states.
The research was designed to discover and tewc relationships
among pervasive beliefs aitd perceptions in the policy systems.
Therefore, multiple sets of data, both qualitative and
quantitative, were collected in each state. The design built upon
the strength of qualitative data for discovering subjective
meanings and perceptions about relationships. We were also
attracted to the strengths of statistical analysis for uncovering
the reliability and generalizability of quantified responses to
questions about perceptions and beliefs about policy.
An analysis of qualitative data collected during preliminary
interviews with key policy actors provided the basis for the design
of instruments for collecting quantitative data and, in the
analysis of findings, the various sets and tYPes of data were used
to check validity. to scirch for deeper meaning and com,ections in
irterpretation and to ider tfy a model of the process of policy
choice. Case studies for each state were prepared to facilitate
the discovery of links between statistical analyses of quantitative
survey responses and qualitative concepts emerging from interview
and document analysis.
Conduct of the Research
Page 11-5
91
The research design. Major data collection for this research
was undertaken through interviewing key participants in slx state
edncation policymaking systems. Two separate rounds of
interviewing were done. Round One data were used to develop
structured instruments for Round Two.
Round One. In addition to seeking information about
influential actors and the best sources of documenting data, the
first interviews with key policy actors were designed to elicit
data regarding the "overall framework" of one particular State
Policy Mechanism (SPM) -- a description of the major goals An that
SPM, a recounting of any major changes in the last few years and an
assessment of how well that SPM was working. First round
interviewees (described in more detail below) responded to the slx
open-ended questions shown on the protocol in appendix B.
The same procedures and questions were used with all the
interviewees to assure comparability. They were asked to focus on
a policy area with which they were most involved and knowledgeable.
Generally, we had sufficient information prior to the interviews to
ensure that all of the State Policy Mechanisms were discussed in
this round of interviewing. Interviewees were provided with
general information regarding the purpose of the research; they
were assured that we would handle the data ethically. Interviewees
were encouraged to offer description and insights, focused by the
open-enued questions. These interviews were audiotaped and
avciraged about 45 minutes in length. The audiotapes and field
notes from Round One were important for refining the taxonomy, for
Page 11-6
95
i,
de:eloping research instruments for Round TWO, and for discovering
patterns in the context of policymaking.
Follow-up to Round One. Following Round One, the research
team met to discuss similarities and differences among the sample
states and to develop formal instruments for collection of
quantifiable data during Round Two. Site summaries and other
devices were used to compare the states policymaking processes and
approaches in each SPM. This cross-state comparison provided the
insights that helped focus on the elements to be Incorporated in
Round Two data collection instruments, described below. From this
analysis emerged the refinement of the seven SPMs and the
identification of the general approaches within each SPM.
Questions about ranMings, knowledgeability, preferences and
processes in the SPMs and their approaches were to be the principal
focus In Round Two. The follow-up analysis of Round One data also
showed the wide variation In context in the six states and,
therefore, reemphasized the importance of gathering more data on
values, political culture, and the relative power of various groups
and individuals involved in policymaking. The instruments
developed for Round Tw c. data collection are presented in Appendices
2 through 8.
Round Two. In contrast to Round Ono's rather loosely
structured interviewing, Round Two interviews were closely
structured. Interviewees wc..re asked to.provide their perceptions
of education policy priorities (organized by SPM) in their state
and then to discuss the alternat!.ve approaches to policy formation
Page II-7
98
,
,
4
,
in the domains where they were most knowledgeable. Along with the
interview, respondents were asked to fill out the five survey
instruments in Appendices 4 through 8. Round Two interviews were
also audiotaped. The interviewers, while collecting quantifiable
data regarding policy priorities, also took field notes,
particularly where respondents offered detail and interpretation.
Thus, Round Two yielded extensive quantitative and qualitative data
on policy processes, priorities, and goals.
Additional data sets. The education codes of each of the
sample states were viewed as key documents that could be analyzed
to identify patterns of past policymaking priorities. Therefore, a
content analysis of the codes of each state was conducted,
organized by the SPM framework.
/n addition, a compilation was made of all the 50 states
providing baseline information on the political, economic, social,
and educational conditions. The extent to which the sample states
face special conditions and the ways in which they are
representative of the nation as a whole were examined by comparing
these states with each other and with all other states on 44
selcted variables.
Documents, including annual reports on school systems and
student performance, agency policy proposals, budgets, memoranda,
dissertations, and other previous research, were collected and
analyzed in order to (a) prepare for interviewing, (b) check
unclear data, and (c) establish historical conditions of
policymaking in each state.
Page /1-8
97
The Sample
Sampling occurred at both of the analytical levels--the states
and the individuals.
Selecting the states. The six sample states were selected
with the aim of securing maximum variation on the following
variables:
1. Political Culture as measured by Elazor (1972). Culturevariations are related to both geographic region and degreeof centralization of state policy control. Two statesrepresenting each of the three political culture types("moralistic", "individualistic", and "traditionalistic")were chosen, using Elazar's calculations of the culturewithin each state.
2. Urbanization,proportion ofwidely viewedpolicymaking,action withinfor political
as measured by the 1978 U.S. Census. Thethe population living in urban areas has beenas an important mediating role ininfluencing both the processes ef politicalvarious states and the socio-economic basispower and influence distribution.
Degree of fiscal stress as reported by Adams (1982).Availability (or scarcity) of fiscal resources plays a majorrole in shaping state-level policy options. Adams' data onstates fiscal status was used to select states with high,medium, and relatively low fiscal stress.
For economic reasons, sample states from among those with the
greatest variance on these three basic variables were chosen to
include the home states of the three researchers (California,
Illinois, and Pennsylvania) and three other states, Wisconsin, West
Virginia, and Arizona. A sampling matrix showing the distribution
of all states on the three selectSon variables is shown in Appendix
10.
Round One sample. In Round One a sample of interviewees (at
Page 11-9
98
least 12 in each state) were selected to represent the following
types:
1. a education advisor to the governor;
2. legislative education policy committee chairs;
3. legislative fiscal (both revenue and appropriations)committee chairs;
4. key staff members serving education and financecommittees;
5, the chief state school officer, or a top staffassociate;
6. top officials in the States School Boards Association;
7. top officials in the school administrators association;
8. top officials in the teachers' associations;
9. key informants who were long-time cbservers ofeducation policymaking, e.g., education reporters,educational administration professors, and people whowere in policy positions in the past; and
10, one or more state board of education members.
This sampling was based on assumptions about who were
"obviously" involved and had important insights regarding education
policymaking. Ninety-five percent of those asked agreed to be
interviewed.
Round Two sample. During Round One, interviewees were asked
to identify key actors who were Involved and knowledgeable in
education policymaking. Round Two's sample in each state was drawn
from this insider-based list. Approximately 70 percent of Round
Two interviewees were drawn from individuals interviewed in the
Round One sample. Ip addition to being in "obvious" positions of
influence, they were identified by insiders as being knowledgeable
Page II-10
99
and involved in policymaking for education. The remaining 30
percent of the Ronnd TWo sample were new to the study, having been
Identified by first round participants. They included large city
schools' lobbyists, other special interest group lobbyists,
legislative staff, and SDE staff. Round Two interviews and data
collection lasted from 30 minutes to more than two hours. The
sessions were audiotaped.
Instrument Construction
This research design required two different types of data and
two different types of data collection instruments.
The gualitative instruments. The interviewing procedures and
instruments for this study were designed with the recognition that
policymakers' have their own language, meanings systems, and
motivations (Marshall, 1984). The instruments and approaches were
designed to motivate them to participate openly and to understand
enough our intent so that their responses would be ri,levant to the
research questions. The protocol for Round One interviewing was
designed to ensure that interviewees had information about the
purpose of the research and assurances of confidentiality, and that
each Interviewee In each state would be asked the same questions.
Through this instrument, entry and receptivity of interviewees
would be facilitated, and comparability of data would be assured.
A letter of Introduction requesting Round One interviews Is
included in Appendix 1. The instrument itself can be found in
Appendix 2.
The protocol had the following core questions:
Page II-11
I CO
1. Who are the key education policy people?
2. Are there any good reports, summaries, or crucia:documents that descrioe policy in the SPMs?
3. What is the overall framework of policy in (the SPMarea which is most familiar to the interviewee)?Specifically:
a. What are the most important goals or objectives?b. Have there been majcr changes in the last few
years?c. Are you happy with the way these policies are
working?
This interview was developed to be conducted as a "conversation" so
the interviewees were encouraged to expand on their ree;ponses.
In Round Two, a two-part interview instrument was deve2oped
for the portion of the data collection that followed the interview
format. The questions were framed by an emerging taxonomy of SPMs
and competing approaches; the purpose was to collect individuals'
perceptions of the prioritiles in their states' educational
policymaking. The protocol focused on eight main questions, guided
by the protocol shown in Appendix 3. A notebook containing a
listing and definitions of ihe SPMs and of the various approaches
to the SPMs was prepared as a guide for the interviewee's
responses. A different notebook, containing forms to fill with the
interviewee responses, was prepared for compiling the responses in
a systematic and easily retrievable manner. These instruments were
designed to collect both qua:Atative interview data and
quantitative data. The data recording instrument is shown in
Appendix 4.
Page 11-12
101
The Round Two interview protocols were pilot tested with five
interviewees in Arizona by Mitchell, who trained the other two
researchers to anticipate certain questions and to provide standard
responses to those questions.
lhe instrument was designed to ensure a collection of
comparable data. Interviewees were told (or reminded) of the
purpose and procedures of the study and were directed to the list
of the seven SPMs in the notebook. The questioning centered around
the following core information sought:
1. ranking of SPMs with regard to the amount of attentionin the last few years.
2. perception of whether any SPM should be receiving mere,or less attention.
3. ranking 'of the SPMs in order of individual'sknowiedgeability. Responses were elicited verbally andrecorded in the interviewer's notebook.
The instrument was designed so that interviewees were informed
that, within each SPM domain, a variety of competing policy
approaches are found -- principal alternate approaches were
displayed in the notebool.z.s. Respondents were asked to respond to
questions about competing approaches related to tilt:: three SPMs
about which they were most knowledgeable. The questioning centered
around the following core questions:
1. a ranking of which approaches have been receiving the mostattention and an example os: a specific policy incorporatingthe most popular approach.
2. personal preferences of the most promising approaches, howthe state incorporates this preferred way of approaching anSPM and an asseSsment of how likely the state was to followthe respondent's policy preferences in the particular SPM,domain under discussion over the next few years.
Page I1-13
11,2
_
"It
The responses were recorded in the interviewer's notebook
which was organized, as were the questions, to facilitate
quantification of these responses while, at the same time,
collecting rich qualitative data as interviewees expanded on their
responses.
The quantitative instruments. In order to compile
quantitative data that would facilitate cross-case comparison on
key variables, structured instruments were devised to accompany
interviewing. Five instruments were developed to collect
quantitative data in Round Two along with the recorded interview
data described above. Several were pilot tested in university
classes. All of these instruments were pilot tested in Arizona.
They were compiled in the same notebook which interviewees received
(as described above) so that they would be filled out as a second
portion of the Round Two interview, with -he interviewer present to
direct and to answer questions, tc continue the "conversational"
tone of interviewing, and to continue audiotaping.
One instrument was developed to assess the states'responses to
a major national report on the status of education systems. This
instrument, shown in Appendix 5, solicited information on each
sthte's response to A Nation at Risk recommendations. Unlike the
SPM taxonomy, the recommendations were not organized by a framework
designed to capture the range of policy mechanism options for
education. The instrument was to yie:d data that could be used to
compare an empirical descriptive analysis of policy action with the
?age 11-14
1 63
"
analysis based nn the taxonomy of SPMs. The instrument listed 00
specific recommendations found in the A Nation At Risk report, and
asked respondents to circle, on a scale of 1 - 5, where their state
stood in taking action based on the recommendations (1 = no action
or serious dismission; 5 = implementation under way).
A second instrument was developed to uncover individual value
systems as they apply to education policymaking. The instrument,
developed with a format similar to the semantic differential
developed by Osgood, Suci, and Tannenbaum (1957) and refined by
Mitchell (1981), was entitled "What Do You Peel Are the Important
Policy Problems in Your State?" See Appendix 6 for full display of
the instrument.
The instrument linked particular SPM-based options with
fundamental values of equity, choice, efficiency, or quality. It
consisted of 18 pairs of phrases. Respondents were presented with
the task of making choices between particular policy/value
combinations, indicating which combiaation more closely fit with
their values and policy preferences when paired witn one other
policy/value option.
Prior research on goals and fundamental values (e.g., Garms
and Guthrie, 1978) and on recent state policymaking (e.g., Odden
Doherty, 1982; McLaughlin, 1981) provided the logic for matching
particular values with particular policy options. So, for example,
respondents were presented with items such as this one:
Page II-15
11)4

DEVELOPING QUALITY BROADER PARTICIPATIONCONSCIOUS LEADERSHIP --:--:--::--:--:-- IN DECISIONMAKING
Respondents' forced choices would be an indication of the
value/preference used to select particular policy options. Marking
closer to the left reflected that the respondent, prefers an
educational gualitv policy approach to one emphasizing a democratic
choice value. Instructions directed respondents to place an "X" on
the line dividing these items -- closest to the phrase most closely
representing their own views regarding which of the problems is
most in need of attention in their state.
A third 'instrument was developed to elicit individual
respondents' perceptions of the relative influence of the various
groups and key actors in state policymaking. This instrument
(presented in Appendix 7) was aimed at eliciting a numerical scale
of the power ranking of policy groups -- one way of creating
individual models of the policy world of each state.
Xt was developed from A review of previous research, (e.g.,
Fuhrman and Rosenthal, 1981; Campbell and Mazzoni, 1976; Mitchell,
1981) on state policy systems as well as from Round One findings.
The relevant policy groups were identified and informants were
asked to give their perception of the power and influence in
education policymaking of each group, on a scale of 1 - 7.
The fourth instrument was developed to elicit the individual
respondents' perceptions of the political culture of their states.
The Political Culture Instrument"was a questionnaire designed to
test the cultural labels of our states assigned by Elazar (1984)
Page 11-16
105
r
against the judgment of educational policy makers in the states.
The object was to tap "the set of perceptions of what politics is
and what can be expected from government, held by both the general
public and the politicians" (Elazar, 1964, p. 112). The first
requirement was that informants give not their views of a cultural
object, such as party competition, but their perception of how
people in the state generally feel about the matter. The cultural
objects explored were those set out by Elazar (see Chapter 6) --
government, political parties, bureaucracy. Eleven such objects
were derived. Respondents were asked to rank order three possible
characterizations for each object. One characterization was
written to fit each of the three Elazar culture types --
Traditionalist, Moralist and Individualist. Elazar's wording was
followed as closely as possible.
This measurement device is displayed in Appendix 6. It was
Intended to check whether, states which Elazar labelled,
Moralistic, Tradionalistic or Individualistic could also be so
labelled by key state decisionmakers.
Finally, in order to desc:ibe our sample and ensure that it
was not skewed, an instrument was developed to collect data on the
education, experience and other background characteristics of
interviewees. It required them to check or fill in blanks to
provide data about age, professional training, number of years in
position, political party affiliation, overall political
orientation, and income -- variables representative of the broad
array of factors typically found to influence social behavior
Page 11-17
Or'
\
,
(
(Mitchell, 1981). This instrument, the "Personal Data Form," is
shown in Appendix 9.
Content Analysis of the Education Codes
Discussion of the document data led to the development of a
process for analyzing the education codes of the six states to
examine how each state used the State Policy Mechanisms to
implement certain values. For example, the codes analysis might
reveal that State X's equity values showed up primarily in school
finance codes, but seldom in the other State Policy Mechanisms,
while State Y exhibited equity values in curriculum materials and
school personnel as well as in school finance State Policy
Mechanisms.
The analysis of codes was viewed as another way of testing the
viability of the taxonomy. The taxonomy was used to organize units
in the codes according to the State Policy Mechanism in which they
fit, to the approaches they exemplified, and the dominant value
evidenced. The assumption was that, while codes may not reflect
current values, they do represent a compilation of values that have
been predominant in the past. Common operational definitions of
units of analysis, State Policy Mechanisms, approaches, and value.D
were developed to conduct the content analysis of the codes. An
example of the forms created for this content analysis is shown in
Appendix 4.
Data Reduction and Analysis Procedures
The data, -both qualitative and quantitative, were analyzed
twice -- once using the individual policy actors as the unit of
Page 1/-18
107
, ...
analysis in order to understand the diversity of their perceptions
of policymaking in all states. In a second analysis the data were
aggregated within the states to describe the unique characteristics
of states, to identify differences by comparing state averages, and
to identify national trends as evidenced by the six states. This
section recounts the methods of analysis.
Transcription of Audiotapes. Selected interview tapes were
transcribed, verbatim. Tapes that were illuminating to the
research questions, that were particularly comprehensive, and tapes
of interviews of people from different policy groups were selected.
These transcriptions were used as aids to making cross-state
comparisons and as data sources for discovering differences and
similarities in language and stories in the six states.
Document analysis. Documents collected during field work were
filed and were treated as data sources, as checks for accuracy,
meaning, and validity in interpreting other data. They were
particularly useful in the construction of the case studies.
Case studies. AS an aid in cross-case analysis and as a
display of the various data regarding the background, processes,
and context of policymaking, case studies of each state were
compiled following a common outline. The common case study themes
regarding background conditions, structures, and current education
policymaking, in rich description, showed ways in which our states
were importantly different.
Dissertations. Two of the research assistants in the project
were doctoral students, who used the data some of the analytic
Page 11-19
ITS
methods in their dissertations. The f.tudies focused on
Pennsylvania and California education po.licymak:ng.
Quantitative data analysis techniques. There were seven sets
of data analyzed by statistical methods appropriate to the research
questions. In addition to descriptive statistics on all of the
relevant variables, L-tests of group differences, discriminant
analysis of state differences, analysis of variance and correlation
analysis were utilized where appropriate to illuminate the level of
significance and substantiate meaning of the data collected.
Details of each analytic technique employed are described as the
findings are presented.
Analysis of the Education Codes.
The content analysis of the six states' education codes
revealed problems in analysis. First, comparison of all six states
was not possible. The codes were organized very differently. The
agreement to focus on the smallest code-numbered subsection in the
code as the unit of analysis, to analyze according to SPM,
approach, and dominant value did not overcome the analysis problems
in states like West Virginia whose code section encompasses several
SPMs and values in page-long sections. The range in the volume of
the codes in the sample states undermined cross-case comparison.
In the end comparable code analyses were completed on only two of
the six states.
Problems in analysis occurred because of the following:
1. Governance and finance State Policy Mechanisms in thecodes cut across the other five State Policy Mechanismsin the codes.
Page /1-20
109
.,
2. Codes sections frequently contained more than onevalue.
3. Classification required unreliable judgment calls aboutlegislative intent. For example, when a code sectionstipulates that vocational education program plant$should be on view, it was unclear whether thisrepresents a governance policy because it provides forcommunity access to plans or a program definitionpolicy because it limits program options. Nor is itclear whether this code section is to assure highquality, choice, or perhaps even efficiency, because itkeeps decisionmaking accountable?
4. Codes were not written in equal units, either withinstate or among states, so comparisons within and amongstates were necessarily uneven.
In two states, however, (Illinois and Wisconsin) these problems
were overcome by counting all references to any value within a code
section, rather than one value only. Moreover, inter-code
reliability for these two states was high. Hence, Chapter V
reports the findings from code analyses in Illinois and Wisconsin.
Analysis of the 50-State Data File
Data were gathered describing key input, output, and
structural variables in all 50 states for two reasons: (a) in
order to compare the sample states with eacti other, and (b) in
order to test the extent to which they are representative of the
nation as a whole. Therefore, a posteriori analysis was conducted
using 44 variables. A matrix was compiled of all 50 states on
education policy inputs and outputs. Analysis of these variables
is discussed in Chapter VII.
Analysis of Qualitative Data
Page 11-21
no
Interview data from one state (Pennsylvania) were analyzed and
filed by micro-computer. Although the process of coding and filing
data electronically is laborious, it provides a means for calling
up data in many forms and discovering patter4s from qualitative
data. The Pennsylvania data were filed according to informant,
date, position, and major categories which a datum represents. The
categories were derived from the p(Ilicy mechanism taxonomy,
policymaker assumptions about policy formation, relations among
state level agencies, and so on. Thus a paTticular quote would be
filed under "Governor's Influence Jn Polit:y Formulation"; an
illustrative quote, plus the identify and position of the
informant, and the date of the data collection would be readily
available. (Marshall and Lynch, 1985).
Field notes, documents, and transcribed interviews from all
six sample states were examined for details in order to complete
case studies for each state. These qualitative data sources were
examined for the insights they could provide to clarify or expand
on findings resulting from statistical analyses. Taken together,
word usage and the social interaction framework displayed in the
language of the interviewees were used to construct a picture of
the "assumptive worlds" used by key actors in state policy systems
to orient themselves to the decisionmaking process (See Glaser and
Strauss, 1967).
Validity Checking
Before beginning to interpret the substantive meaning of the data
collected our sampling strategy was subjected to a validity check.
Page 11-22
11 1
N
..,...,.,,-
Validity checking procedures were developed at both levels of
analysis--the individual and the state. The characteristics of the
respondents showed a distribution of background and orientationc
that reflect the general characteristics of education policymakertl
among the states, as shown in Figure 2-1.
There is no indication in their demographic profiles to
suggest that the sample of individuals was skewed or
non-representative of state education policy actors. The
distribution of respondents across the six sample states,
classifi,ed according to their formal roles within the policy
system, is shown in Figure 2-2. As indicated by the modest
variation in cell values within the table, and the nonsignificant
chi-square value shown below the table, our respondents were well
distributed. The largest number (31.9%) were representatives of
various statewide interest groups (primarily professional educator
groups, but a sprinkling of taxpayer groups and otber noneducator
groups were included). A similar number (30.4%) were drawn from
the ranks of the executive branch of government. Legislators were
the third largest group (21.5% and legislative staff consultants
the smallest group (16.3%).
Within the sample, the full range of the seven SPMs were
represented in respondents, self-reported knowledge, although
self-reported knowledge in finance (the most reported) far
outweighed self-reported knowledge in Curriculum Materials and
Buildings In the sample.
Page 11-23
112
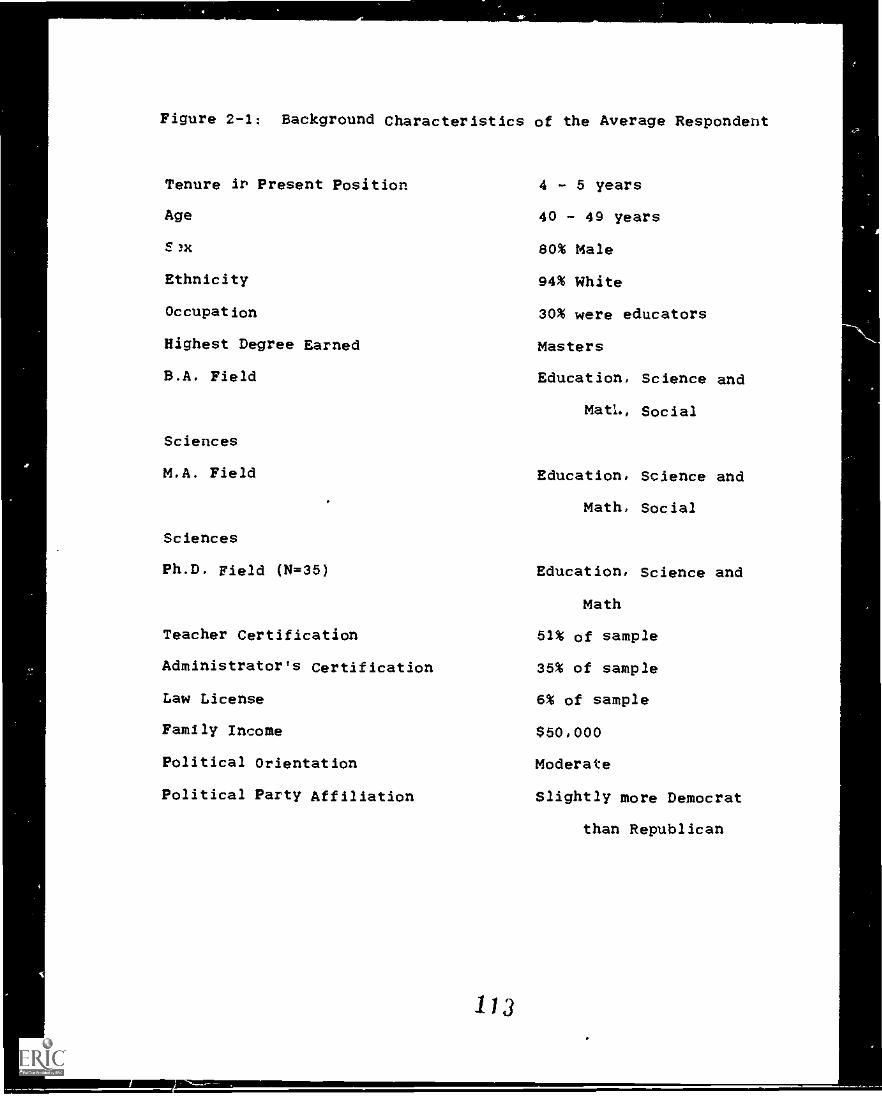
Figure 2-1: Background Characteristics cf the Average Respondent
Tenure ir Present Position 4 - 5 years
Age 40 - 49 years
ElX 80% Male
Ethnicity 94% White
Occupation 30% were educators
Highest Degree Earned Masters
B.A. Field Education, Science and
Math, Social
Sciences
M.A. Field Education, Science and
Math, Social
Sciences
Ph.D. Field (N=35) Education, Science and
Math
Teacher Certification 51% of sample
Administrator's Certification 35% of sample
Law License 6% of sample
Family Income 650,000
Political Orientation Moderate
Political Party Affiliation Slightly more Democrat
than Republican
113
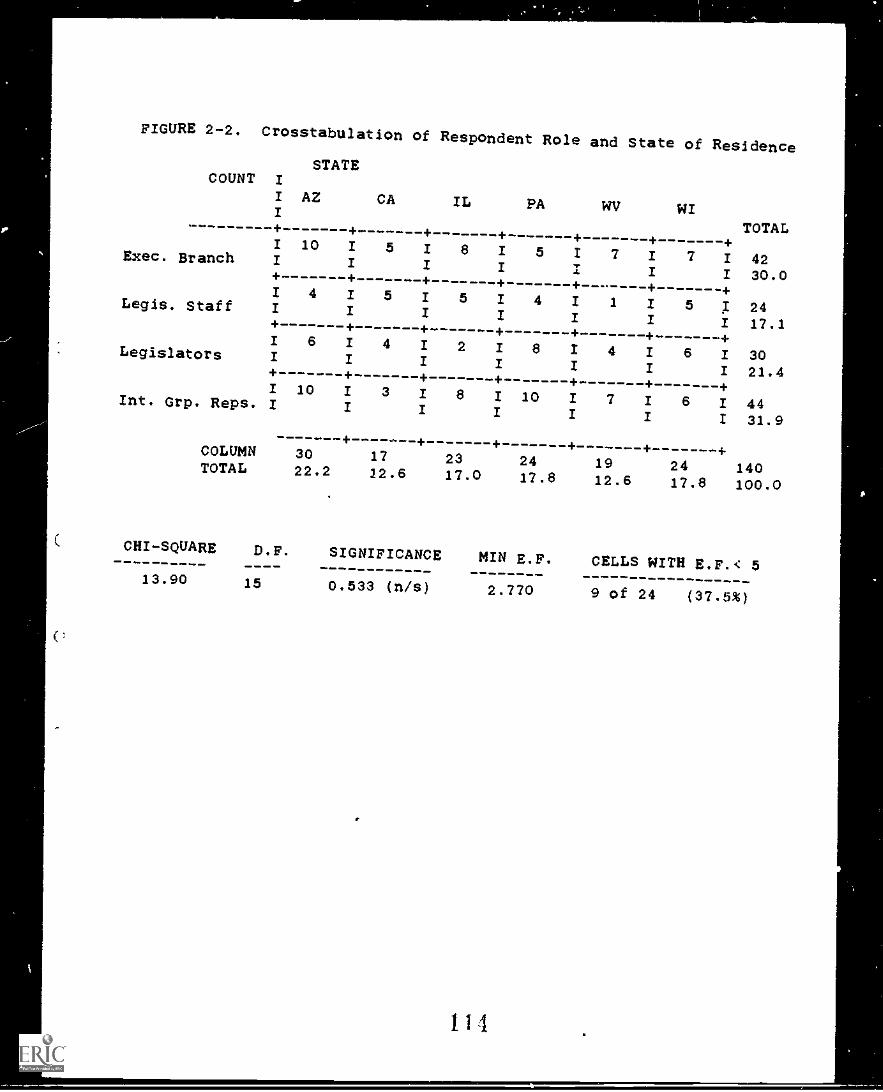
FIGURE 2-2. Crosstabulation of Respondent Role and State of Residence
COUNT I
I
I
STATE
AZ CA IL PA WV WITOTAL+ + + + + + +I 10 I 5 I 8 I 5 1 7 1 7 I 42Exec. Branch I 1 I I ,
4 I I 30.0+ + + + + -4. -+I 4 I 515141115I 24Legis. Staff I I I I 1 I I 17.1+ + + + + + +I 6 I 412181416/ 30Legislators I I I I / I 1 21.4+ + + + + + +I 10 I 3 I 8 I 10 I 7 I 6 1 44Int. Grp. Reps. I I I I I I 1 31.9
+ + + 1. + +COLUMN 30 17 23 24 19 24 140TOTAL 22.2 22.6 17.0 17.8 12.6 17.8 100.0
CHI-SQUARE D.F. SIGNIFICANCE MIN E.F. CELLS WITH E.F.< 5Mlb 41 ,I
13.90 15 0.533 (n/s) 2.770 9 of 24 (37.5%)
r
1 1 4
As can be seen, there was no significant difference in roles
in the samples. One hundred forty unweighted cases were usable for
this analysis.
summary
A complex but coordinated research design allowed comparative
analysis of six states' processes of embodiment of values. It
allowed us to explore the viability of a taxonomy for organizing
policy/values enactments and to examine the explanatory power of
several paths to understanding how values are incorporated into
policy.
Page 11-24
115
(
REFERENCES
Adams. K. (1982. A changing federalism: The condition of the
states. Denver, CO: Education Commission of thc. States.
Bailey, S. K. et al. (1962). Schoolmen and politics. Syracuse,
NY: Syracuse Univ. Press.
Campbell, R. F. and Mazzoni, Jr., T. L. (1976). State policy
making for the public schools. Berkeley, CA: McCutchan
Publishing Corp.
Easton, D. (1966). A systems analYsis of political life. New
York: Wiley.
Elazar, D. (1972). American federalism: A view from the states
(2nd. ed.). New York: Crowell.
Glazer, B. and Strauss, A. (1267). The discovery of grounded
theory. Chicago: Aldine.
Iannaccone, L. (1967). Politics in Education. New York: Center
for Applied Research in Education.
Marshall, C. (1984). "Elites, bureaucrats, ostriches and
Epussycats: Managing resattrch in policy settings."
Anthropology and Education Q:larterty, vol. 16, no.
3:194-201.
Marshall, C. and Lynch, K.K. (April, 1986). "Analysis of
qualitative data with with microcromputers." Paper
presented at the Annual Conference of the AERA. Chicago.
Masters, N., Salisbury, R. and Eliot, T. (1264). State_politics
and the Public schools. New York: Alfred Knopf.
Page 11-2S
1 1 6
Milstein, M. C. (1973). Jenhings, R. Educational policy-making
aindie_a_teleglEj.ature: the New York experience. New
York: Praeger.
Mitchell, D.E. (1981). Shaping legislative decisions: Education
Rolicv and the social scier.ces. Lexington, MA: D.C. Heath
a Co.
Murphy, J. T. (1976). "Title V of ESEA: the impact of
discretionary funds of state educational bureaucracies." In
W. Williams, and R.F. Elmore (Eds.), Social Program
implementation. New York: Academic Press.
Murphy, J. T. (1980). State Leadership in Education: On Being a
Chief State School Officer. Washington, DC: /nstitute for
Educational Leadership, The George Washington University.
Odder. A. and Dougherty, V. (1982). States programs of school
improvement: A 50-stat survey: Denver, CO: Education
Commission of the States.
Rosenthal, A. and Fuhrman, S. (1981). Legislative education
leadership in the states. Washington, DC: The Institute
for Educational Leadership.
United States Bureau of the Census. (1978). CountY and city data
book 1977. Washington, DC: U.S. Printing Office.
Wirt, F. and Kirst, M. (1982). Schools in conflict: The
politics of education. Berkeley, CA: McCutchan.
Page 11-26
117
CHAPTER III
STATE POLICY MECHANISMS:
RANKING, ATTENTION, KNOWLEDGEABILITY
One of the primary reasons for undertaking this study was the
development and clarification of a theoretically consistent and
operationally powerful taxonomy of state policy mechanisms (SPMs).
The development of such a taxonomy is important to the improvement
of both research and practice in public education. From a research
perspective, identification of an empirically reliable tavonomy is
a an important pre-requisite to tracing decision making processes
within any policy system. That is, in order to know whether
various policies have been shaped by identifiable social forces or
affected by specific organizational and political structures, we
need to be able to accurately classify them -- to differentiate
between similar and dis-similar types of action and then identify
systemic regularities associated with each class. If we operate
with a taxonomic structure that views all education policy
decisions as similar, or one that sees every policy issue as
vnique, we will be unable to explore the regularities of the policy
system or to develop meaningful hypotheses for explaining either
the processes by which state education policies are made or the
impacts which they will have on school performance.
From a practical perspective, it is obvious that state level
policy niak deeply affects to day-to-day school operations. It
Page TII-1
ir 0,
,
is equally clear that states borrow very heavily from each other --
passing very similar laws and regulations ln waves as "hot issues"
become political cause celebres, for legislative or state agency
sponsozs who thrust them onto the political agenda in attempts to
become recognized as "dynamic leaders" who "care about the
schools." In the absence of a basic policy taxonomy, however,
neither these sponsors nor the school systems toward which their
efforts are directed can predict the effects of particular policy
actions.
The development of a policy taxonomy begins with the recognition
that state level policy systems are complex and the decisions which
they make vary widely. ln the last few years, for example, several
states have adopted "comprehensive" school improvement programs
aimed at integrating into a unified strategy various combinations
of fiscal, organizational, staff development, curriculum
enhancement and student assessment elements (among the most active
are California, Colorado, Connecticut, Delaware, Florida, Kentucky,
Maryland, Missouri, and Pennsylvania -- see Odden & Dougherty,
1982; McLaughlin, 1981). Most states, however, have undertaken
narrower and less v'yorous action in dealin5 with education. In
many states some form of student and/or teacher testing and
assessment programs have figured prominently An recent policy
debates (Arizona, Nebraska, New Mexico, South Carolina, and
Wisconsin have been especially active in this area). Once the
states with so-called "comprehensive programs" and those following
a "testing strategy" have been identified, it is difficult to
Page 111-2
119
Awe--
discern any systematic distinctions among the myrisi of policies
being adopted in the name of school improvement. Even the
empirically simple distinction between comprehensive school
improvement programs and narrower testing and assessment policies
is not very helpful if we are trying to understand why states adopt
particular policies or are trying to predict whether adopted
policies will be effectively implemented. "Comprehensive programs"
and "student assessment policies" are note after all, mutually
exclusive categories. Every comprehensive program has to deal in
some way with testing issues. And every testing policy is part of
some form of overall policy ftamework, even if it has been adopted
"piece-meal" over a period of years. Moreover, the content of
various "comprehensive reform" programs differs so much from one
state to the next that it is hard to justify treating them as
comparable policy mechanisms in any sense other than the fact that
they represent a bundle of policies all adopted at about the same
time.
We concluded, therefore, that development of a formal taxonomy,
one that would systematically classify all major policies and
apnropriately distinguish among them would be an invaluable
contribution to long term analysis of state policy systems. The
needed taxonomy, we reasoned, could be either "empirical" or
"theoretical" in character. That is, the taxonomy couid be
constructed by closely examining the similarities and differences
among existing policies and clustering them into meaningful groups
based on these empirically observed characteristics, or it could be
Page 111-3
..
(
constructed by identifying a set of analytical concepts (or
variables) capable of describing and accounting for all of the
possible education policy variations (whether they can be
empirically observed or not). We found some examples of empirical
taxonomic frameworks in the literature, but they tended to be
neither consistently developed nor comprehensively applied (see,
e.g Odden & Dougherty, 1982; McLaughlin, 1981; Manifest
International, 1981; Mitchell, 1981; Kirst, 1980). The problem
with empirical construction of a taxonomies is that they are
typically of only instrumental value to the researchers working on
them -- used as a handy way to summarize data but not intended to
meet the basic criteria of a sound taxonomic structure: the use of
categories that are'simultaneously exhaustive (covering all
elements) and mutuely exclusive (allowing particular policies to
be classified as belonging to one and only one category).
This tendency can be overcome if we use a theoretical framework
to guide category development. To do so, we must decide what
underlying characteristic, common to all policy elements, will
serve as the basis for developing categories. At least three
different bases for approaching this problem can be found in the
literature on public policy. The first approach, illustrated in
Garms, Guthrie and Pierce (1978), distinguishes taxonomic
categories on the basis of the fundamental social values which they
embody. (These authors assert that school finance policies can be
distinguished on the basis of whether they contribute to the
"equality", "efficiency", or "liberty" values that underlie all
Page I/1-4
121
(
policy decisions). Kaufman (1956) originated this approach to a
social value-based taxonomy of public policies. He argued that the
three values of "democratic legitimacy", "organizational
efficiency", and "neutral technical competence" are held in
constant tension in American politics -- and that particular po2icy
choices must, at least implicitly, embrace one of these values at
the expense of the others.
A second theorevical approach to taxonomy development is found in
Lowi's (1964) provocative work. He emphasizes the importance of
looking to the economic consequences of various policy choices in
order to classify them. (He originated the distinction between
"distributive", "re-distribtltive", and "regulatory" policies --
later adding a fourth policy category, "constituency", to this
list). This taxonomic structure classifies policy actions
according to their impact on the distribution of costs and benefits
resulting from their enactment. Lowi's categorical scheme has been
widely used. It has been especially well applied by Paul Peterson
and several of his students (see, e.g., Rabe and Peterson, 1982;
1983).
The third theoretical principle of classification found in the
literature, and the one which we found most appropriate for this
study, focuses on the basic control mechanisms available to state
level policy makers. Mitchell & Iannaccone (1979) used this
principle of classification in looking at the impact et legislatiqe
policy on school operations. They distinguished only three basic
mechanisms: resource allocation, rule making, and ideological
Page II1-5
122
_
belief articulation. A few years later, Mitchell and Encarnation
(1984) argued that the control mechanism principle could be used to
distinguish among seven different SPMs. Their work became the
starting point for the taxonomic structure developed in this
research. As described below, our field data led to substantive
revisions and detailed elaboration of the Mitchell and Encarnation
framework.
Defining Education Policy Mechanisms
In our field research, identification of specific SPMs was
approached in two stages. First, we asked whether observed state
level policies can be reliably divided into a meaningful set of
mutually exclusive and exhaustive categories -- categories that
enable us to distinguish which SPMs are most prominent and which
are least frequently considered within each state's policy making
system. Finding that we could distinguish among seven basic policy
mechanisms we then asked whether the policy debates within each
policy domain are focused on a limited set of easily identified
competing approaches to the resolution of educational issues and
problems.
The work by Mitchell and Encarnation (1984) provided a tentative
list of seven basic SPMs to guide our initial data collection
activities. Their list included: 1) school organization and
governance, 2) personnel training and certification, 3) school
program definition, 4) curriculum materials development and
selection, 5) student testing and assessment, and two finance
policy domains -- 6) revenue generation and 7) resource allocation.
Page 111-6
123
Shortly after our field work began, this preliminary list was
altered in two ways. First, it was soon discovered that we had
overlooked an important policy domain: the construction of school
buildings and facilities. This policy mechanism was identified
through early interviews with key actors in California and West
Virginia. It was seen as an important element in the overall
repertoire of state level decisions by a small, but significant
group of respondents in all of our sample states. It was probably
missed earlier because building and facilities decisions generally
have a very low political profile and tend to change rather
slowly.
A second change was required because our early field interviews
clearly demonstrated'that in mcst cases the generation of education
revenues is so entangled with problems of revenue generation for
the states generai funds that clear description of how this SPM
operates would require a very broad approach to state policy
formation and would exhaust our available time and resources.
Hence we reluctantly decided to limit our analysis of school
finance policies to those that deal with resource allocation,
leaving revenue generation for later study.
After revision through the early field work, the following
definitions were adopted for the seven basic state policy
mechanisms in education:
I. School Finance: controlling who pays for education, how those
costs are distributed, and how human and fiscal resources are
allocated to the schools.
Page -7
124
II. School Personnel Training and Certification: controlling the
conditions for getting or keeping various jobs in the school
system.
III. Student Testing & Assessment: fixing the timing and
consequences of testing, including subjects covered and the
distribution,of test data.
IV. School Program Definition: controlling program planning and
accreditation, or otherwise specifying what schools must teach and
how long they must teach it.
V. School Organization & Governance: the assignment of authority
and responsibility to various groups and individuals.
V. Curriculum Materials: controlling the development and/or
selection of textbooks and other Instructional materials.
VII. School Buildings & Facilities: determination of
architecture, placement and maintenance for buildings and other
school facilities.
Assessing Policy Makers Views
Having clarified the seven basic state policy domains through
literature review and preliminary interviews, a second round of
interviews was undertaken to determine whether the taxonomy could
be used by policy makers to help describe the overall context of
education policy formation in their respective states. A sample of
140 key actors from six states were asked three broad questions
about the seven SPMs:
1. How much attention is being Oven to each SPM in your state?
Page III-8
125
In answering this question, rebpondents were given a list of the
seven SPMs -- each accompanied by examples of several policy
actions that fit the definition. They were asked to review the
list carefully and then rank order the SPMs from 1 to 7 on the
basis of the relative amount of attention that was being given to
each within the overall state policy making system.
2. Are the various SPMs being given too much, too little, or
about the right amount of attention by policy makers in this state?
In responding to this question, respondents were asked to review
the SPM list and indicate which, if any, were in need of more (or
less) attention. They were encouraged to offer their own personal
judgment in response to this question -- rather than adopting the
reportorial stance which was requested in response to the first
question.
3. Which SPMs do you feel most knowledgeable about?
To answer this question, respondents were asked to identify the
three SPMs with which they were most familiar. (They were
subsequently asked to discuss alternative approaches to the SPMs
with which they were most familiar -- those responses are described
in the next chapter).
We turn now to an analysis of the responses to these three
questions. The data will be reviewed in three steps. First, an
analysis will be made cf the extent to which respondents from all
six sample states hold similar views regarding the SPMs. By
looking at commonalities across all six states, we will be able to
gain a national perspective -- to discover the extent to which
Page 111-9
126
-
a
,
,
,,
I
(
policy makers in all states confront similar education problems and
develop similar responses.
Secondly, with this national view in mind, we will disaggregate
the respondents into their respective state sub-groups and examine
the extent to which views in one state differ from those in the
others. Using a simple analysis of variance (ANOVA) technique, we
examine whether policy makers report systematic differences in: a)
the amount of attention given to each SPM, b) the belief that some
SPMs are getting more or less attention than needed, and c) the
degree to which they feel knowledgeable about each of the policy
domains.
Third, since there are significant inter-state differences, we
will apply multiple discriminant analysis to the data to assist in
describing more precisely the ways in which the sta*.4s differ.
The National Perspective: State Commonalitier
To what extent do policy makers in all six states report similar
amounts of attention being given to each policy domain? During the
second round of interwlews each respondent was given a list of the
seven basic SPMs, asked to examine the list carefully, and to rank
order the SPMs on the basis of which ones had received the most
attention within their states during the last two or three years.
The mean scoren of responses from 140 policy makers are shown in
Table 3-1.
Insert Table 3-1 about here.
Page /xi: -lo
127 .
,
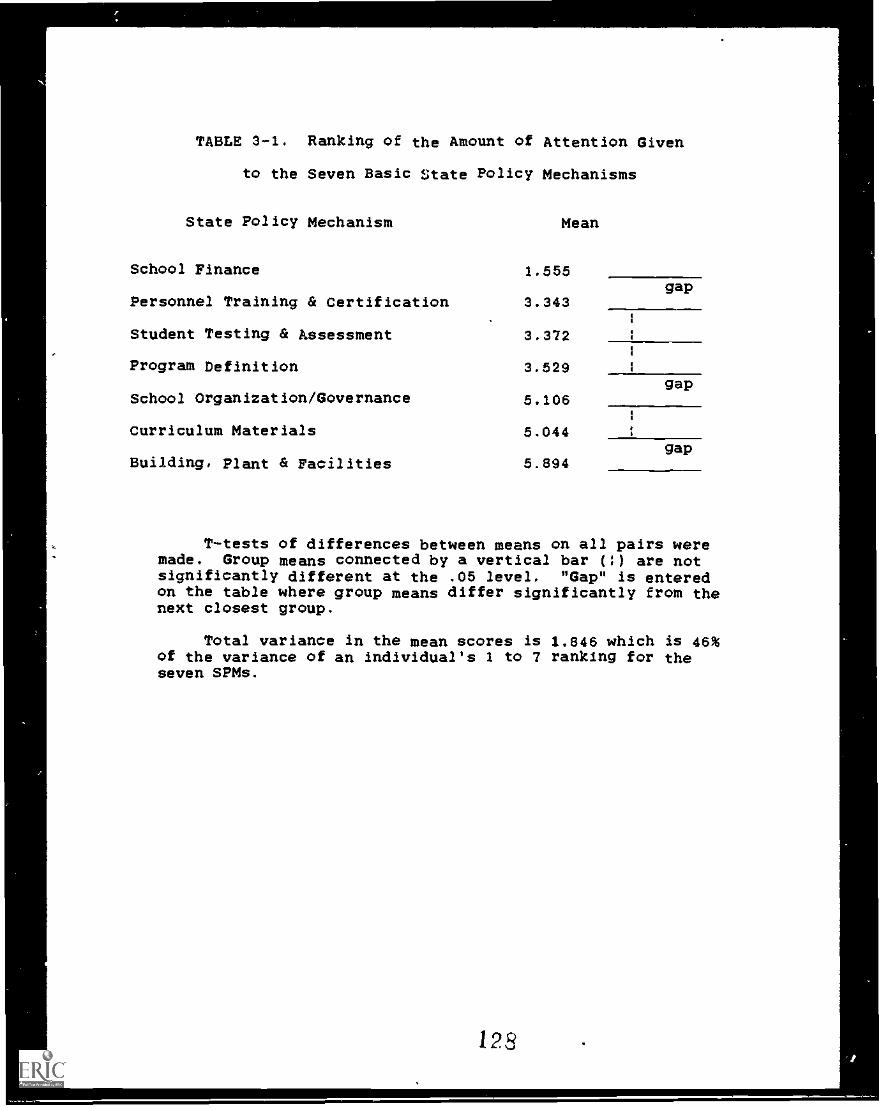
TABLE 3-1. Ranking of the Amount of Attention Given
to the Seven Basic State Policy Mechanisms
State Policy Mechanism Mean
School Finance
Personnel Training & Certification
Student Testing & Assessment
Program Definition
School Organization/Governance
Curriculum Materials
Building, Plant & Facilities
1.555
3.343
3.372
3.529
5.106
5.044
5.894
gap
gal)
gap
T-tests of differences between means on all pairs weremade. Group means connected by a vertical bar (I) are notsignificantly different at the .05 level. "Gap" is enteredon the table where group means differ significantly from thenext closest group.
Total variance in the mean scores is 1.846 which is 46%of the variance of an individual's 1 to 7 ranking for theseven SPMs.
128
Two important conclusions can be drawn from the data on this
table. First, there is a remarkably high level of agreement among
respondents in all six of the sample states that the most prominent
educational policy mechanism is control over the allocation of
fiscal resources to the schools, and that the least frequently
utilized mechanism is the one dealing with school building, plant
and facilities issues. Had the respondents randomly ranked th.
seven SPMs each would have received a mean score across the entire
sample of 3.5 (half way between 1 and 7). The mean rank of 1.555
for school finance reflects an overwhelming agreement that this is
the most frequently used mechanism for influencing school
performance. As indicated on the table, the seven SPMs were
differentiated into four distinct clusters by the respondents.
Following school finance, personnel training and certification,
student testing and assessment, and program definition policies
were ranked very much alike (their mean rankings of 3.343, 3.372,
and 3.529 respectively did not differ significantly). All three of
these means were significantly below that for school finance and
well above the 5.044 mean score for school organization and
governance policies. The third cluster of SPMs were those dealing
with school governance and curriculum materials policies. These
two SPMs did not differ from each other but did differ from all
others. Finally, the 140 respondents agreed that their states pay
least attention to school building and facilities policies. The
mean of 5.894 for this SPM reflects a ve.-y strong agreement that it
is near the bottom of the list (averagirv only a bit more than one
Page III-11
129
point above the 7.00 last place given hy each individual
respondent).
One way of assessing the extent of agreep.eh: among the
respondents s to compare the variance of the mean scores for the
total group with the variance in the typical 1 through 7 ranking
given hy individual respondents. The ranks 1 through 7 have an
overall variance of 4.00. The group means which range from 1.555
to 5.894 have a total variance of 1.862 which is 46% of the
individual variance. Hence, on average, our respondents agreed 46%
of the time with the ranking given to all SPMs hy all other
respondents -- a remarkable degree of agreement when we consider
that these respondents represent six states as diverse as those in
our sample.
Should the state give more or less attention to each SPM? In
addition to asking respondents to rank the seven SPMs, we asked
them to indicate whether any of the policy mechanisms are receiving
either more attention than they need and deserve or less attention
that they believe is appropriate. Their responses were scored -1.0
for an expressed belief that the SPM should be getting less
attention, 0.0 if the amount of attention was viewed as "about
right", and +1.0 if it was felt that the SPM should be receiving
greater attention by state policy makers. The mean scores for the
140 respondents are shown on Table 3-2.
Insert Table 3-2 about
Page 111-12
130
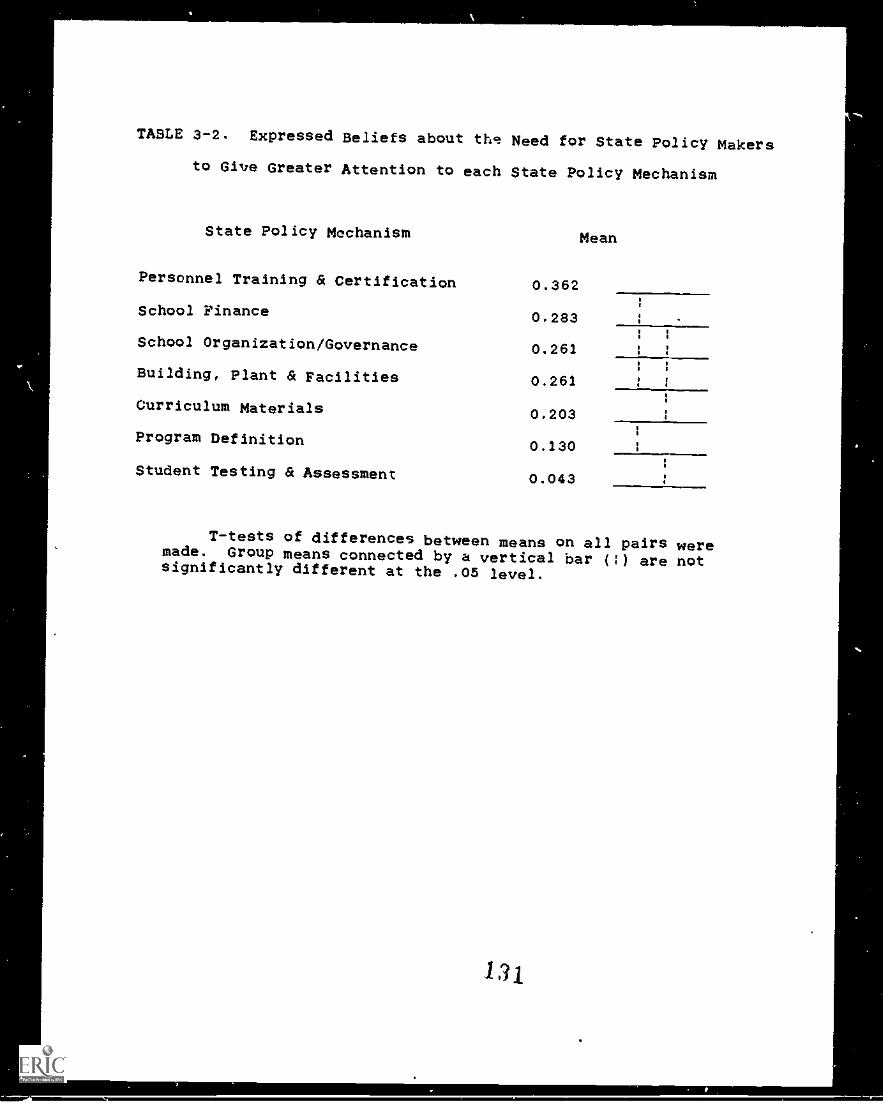
.,
\
\
TABLE 3-2. Expressed Beliefs about the Need for State Policy Makers
to Give Greater Attention to each State Policy Mechanism
State Policy Mechanism Mean
Personnel Training a Certification
School Finance
School Organization/Governance
Building, Plant a Facilities
Curriculum Materials
Program Definition
Student Testing a Assessment
0.362
0.283
0.261
0.261
0.203
0.130
0.043
oo
:
1
:
T-tests of differences between means on all pairs weremade. Grou P means connected by a vertical bar (;) are notsignificantly different at the .05 level.
131
,
I
4
1
The first thing to note about the scores shown in Table 3-2 is
that they are all positive. That is, on average, ollr respondents
believed that all of the seven SPMs should be receiving greater
attention. At least 35% of all respondents believe that personnel
training and certification policies need greater attention. More
that 25% felt that finance, governance and school building policies
need greater attention, and over 20% felt that curriculum materials
need more attention. Only the student testing and assessment SPM
appeared to be getting about as much attention as our respondents
feel is appropriate.
When the data are disaagregated by state, the pattern is about
the same, with two notable exceptions (the individual state means
are shown on Table 3-9). First, Arizona respondents felt quite
strongly that student testing issues are getting too much attention
in that state (they gave this SPM a mean rating for needed
attention of -.367). Second, California respondents tended to agree
that school finance policies are given too much attention in that
state (a mean attention rating of -.118)
As shown at the right side of Table 3-2, there are no rank to
rank gaps in the level of attention sought for each of the seven
SPMs by our total respondent group. The mean score of .362 for the
top ranked school personnel domain is not significantly greater
that any of the next three SPMs. A paired t-test for group
differences shows that the first four SPMs (personnel, finance,
governance axle building facilities) are believed to need greater
Page 111-13
132
4
attention more frequently than are the lasl: two (program definition
and student testing).
Which SPMs to policy makers feel most knowledgeable about? EAch
respondent was asked to identify three of the seven policy domains
that he/she felt most knowledgeable about or familiar with and to
discuss policy making in those areas in more detail. While our
motivation for asking this question was .primarlly to provide a
seguay into a discussion of alternative policy approaches (the
details of which are described in the next chapter), we recorded
responses to this question and found that they provide additional
insight tnto the context of state level education policy formation.
As might be expected, policy makers tended to feel most
knowledgeable about'the SPMs that they reported to be receiving the
most attention. As shown in Table 3-3, nearly 80% of all
respondents felt that they knew about school finance issues. Less
than 20% felt most comfortable discussing either school building or
curriculum materials policies. T-tests of the mean scores indicate
that there are three distinct levels of knowledge about the seven
SPMs. Roughly half the respondents felt comfortable with the
second cluster of SPMs: personnel, student testing, program
definition and school governance. Expressed familiarity with these
four SPms differed significantly from both the highly familiar
school finance and the poorly understood building and cuzriculum
materials clusters.
Insert Table 3-3 about here.
Page III-14
1:43
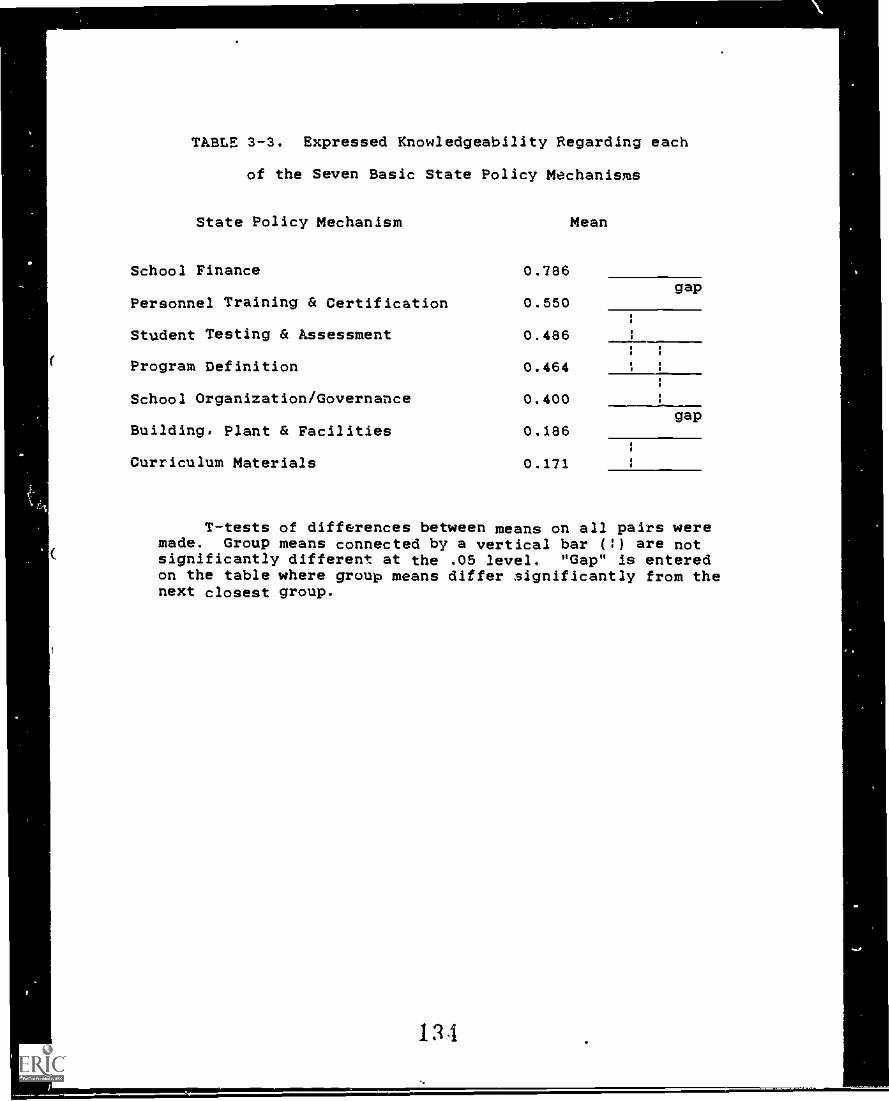
TABLE 3-3. Expressed Knowledgeability Regarding each
of the Seven Basic State Policy Mechanisms
State Policy Mechanism Mean
School Finance 0.786gap
Personnel Training & Certification 0.550
Student Testing & Assessment 0.486 .
. .
. .
Program Definition 0.464 .
.
.
.
School Organization/Governance 0.400 :
gapBuilding, Plant & Facilities 0.186
Curriculum Materials 0.171
T-tests of differences between means on all pairs weremade. Group means connected by a vertical bar (I) are notsignificantly different at the .05 level. "Dap" is enteredon the table where group means differ ignificantly from thenext closest group.
114
It is difficult to see any reason other than the political
salience of the various SPMs that could account for the strong
pattern of agreement among respondents. It is certainly no easier
to understand school finance than building policies. And the
professionally arcane issues of student testing seem to be just as
broadly understood as the more political and controversial issues
of school governance. At the present moment, leverage on school
performance seems to be more easily enhanced through finance and
personnel reform, but that was not always the case. For most of
the 50s and 60$ school governance was the hot topic, and we suspect
it would have been seen as the most familiar topic if our study had
been done 30 years ago.
Inter-state Differences in Po)icy Profiles
Having noted that the strong agreements among all respondents on
the level of attention currently being given to each SPM, the need
for more attention to them, and the level of familiarity
respondents feel about each domain, we turn now to analyzina
whether there are significant inter-state differences as well. Two
approaches are used to discover and analyze these inter-state
differences. First, a simple one-way analysis of variance is used
on the responses to our three questions about the SPMs to determine
whether there are significant differences in the mean scores on
answers given by respondents from each of the various states.
Second, multiple discriminant analysis is applied to the question
responses in order to provide an overall multivariate summary of
Page 111-15
135
?"
the in*.er-state differences inItially identified through univariate
analyses of variance.
Are there differences in the amount of attention given to the
various SPMs? Table 3-4 shows the results of one-way ANOVAs
applied to the level of attention rankings reported for each of the
seven SPMs. For five of the SPMs interstate differences are highly
sionificant (p-values for them apprcach 0.000). Only the first
place ranking of for school finance and the fourth place ranking of
school program definition do Jot appear to differ significantly
from one state to another. (With an F-statistic of 2.194, p=0.059,
the school finance SPM comes very close to the criteria for
establishing significant variation in ranking acroc the states).
Insert Table 3-4 about here.
Do differences exist in the extent to which policy makers believe
'chat each policy domain should be given more or less attention than
it is now receiving? Table 3-5 presents a similar report of ANOVA
tests on the degree to which respondents from different states feel
differertly about the degree to which each of the seven SPMs should
be receiving more (or less) attention from state policy makers than
it now does. As indicated in the last column of the table, our
respondents disagreed about the need for additional attention on
four of the seven SPMs. All tended to support the great need for
more attention to personnel policy matters, and all seemed to agree
Page III-16
1:1,S
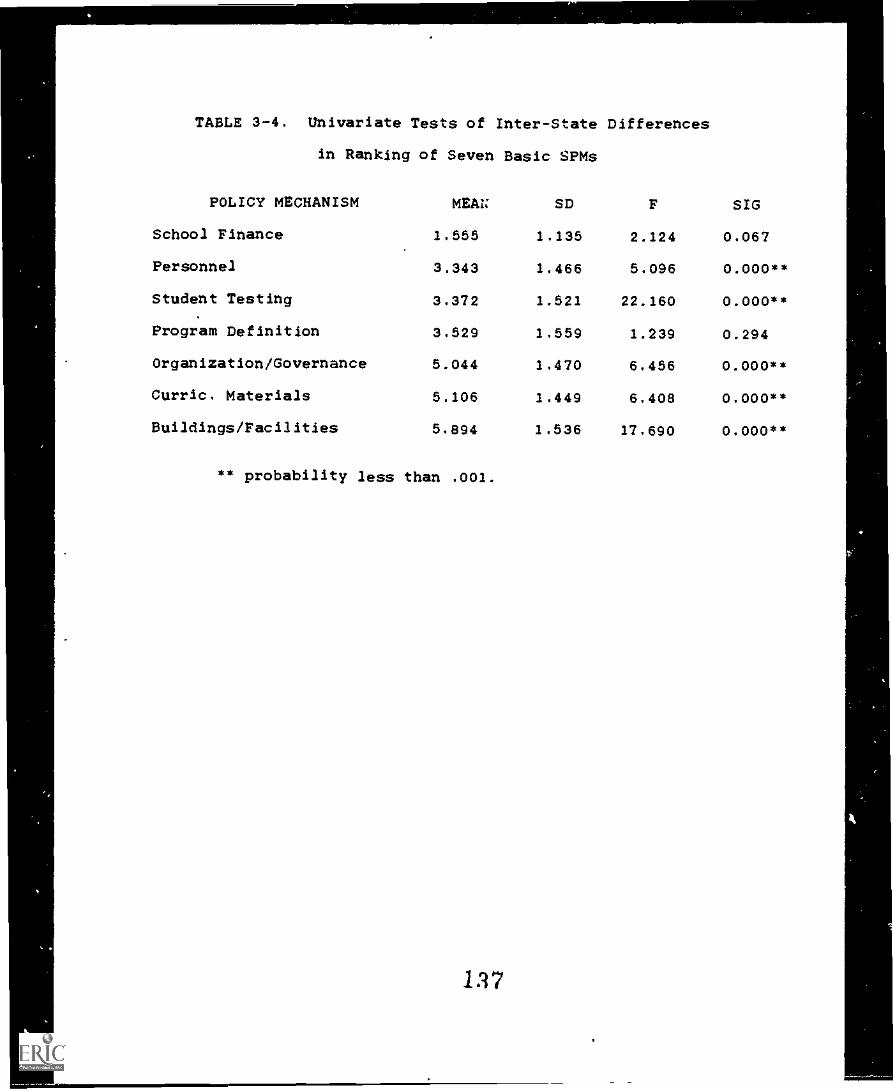
TABLE 3-4. Univariate Tests of Inter-State Differences
In Ranking of Seven Basic SPMs
POLICY MECHANISM MEAN SD F SIG
School Finance 1.555 1.135 2.124 0.067
Personnel 3.343 1.466 5.096 0.000**
Student Testing 3.372 1.521 22.160 0.000**
Program Definition 3.529 1.559 1.239 0.294
Organization/Governance 5.044 1.470 6.456 0.000**
Curric. Materials 5.106 1.449 6.408 0.000**
Buildings/Facilities 5.894 1.536 17.690 0.000**
** probability less than .001.
1 3 7
that relatively modest increases in attention are required for
curriculum materials and program definition policies.
We found the program definition SPM the most curious. Most of
the outpouring of policy reports dealing with the problems of
American education -- beginning with the Nation at Risk report --
have taken the view that school program definition policies are of
crucial importance to the improvement of education. That our
respondents ranked this SPM fourth, and reported only modest
Interest in increasing attention here, rather than on personnel,
finance, governance or building and facilities polic.: struck us
as a bit of an anomaly. Perhaps it takes time for the spate of new
reports to be internalized and produce an upswing in attention to
program definition. Or perhaps state policy makers are able to see
that the other policy domains are more promising avenues of school
improvement.
/nsert Table 3-5 about here.
To what extent are there differences among the states in the
degree of familiarity policy makers express about the various SPMs?
Table 3-6 reports on the results of an ANOVA test applied to
responses to the questica; Which SPMs are you most knowledgeable
about or familiar with? Only three of the SPMs show significant
inter-state differences in this table. There are differences
across the states in the level of knowledge regarding student
testing, school governance, and curriculum materials. Looking back
Page /11-17
ns
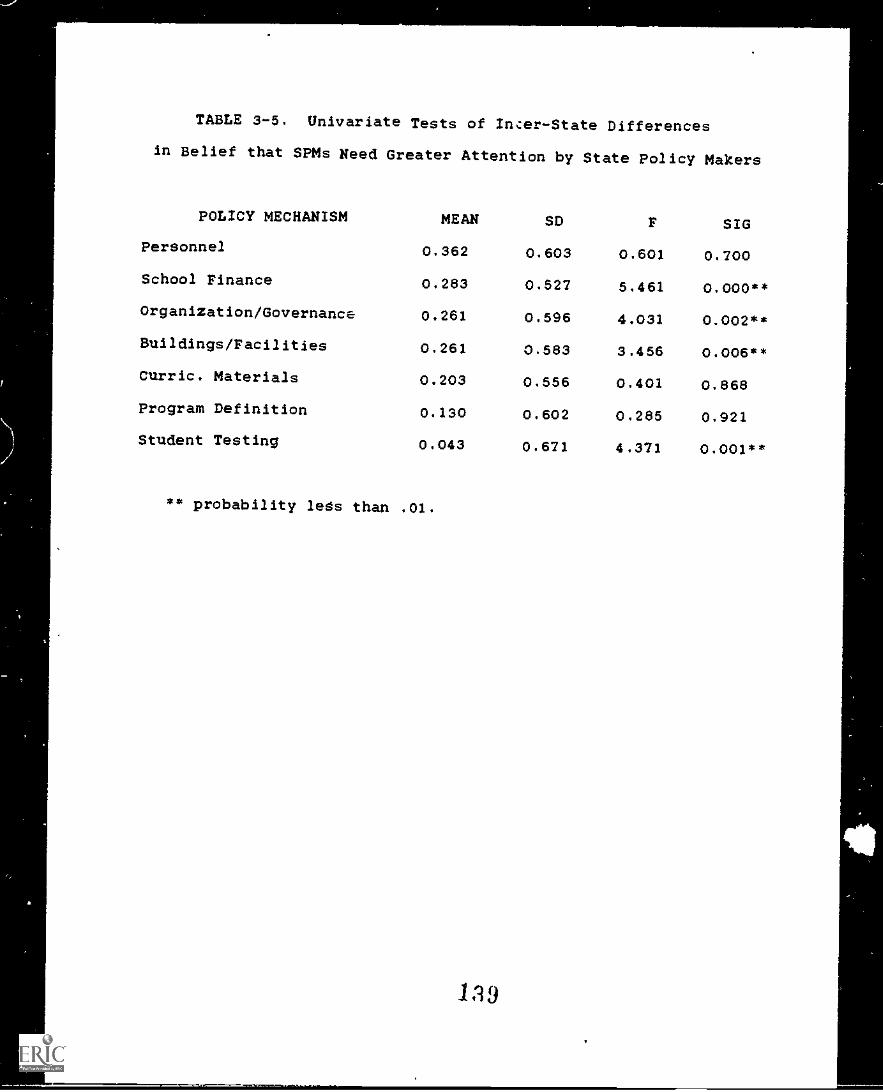
MP'
TABLE 3-5. Univariate Tests of Incer-State Differences
in Belief that SPMs Need Greater Attention by State Policy Makers
POLICY MECHANISM MEAN SD F $IG
Personnel 0.362 0.603 0.601 0.700
School Finance 0.283 0.527 5.461 0.000**
Organization/Governance 0.261 0.596 4.031 0.002**
Buildings/Facilities 0.261 0.583 3.456 0.006**
Curric. Materials 0.203 0.556 0.401 0.868
Program Definition 0.130 0.602 0.285 0.921
Student Testing 0.043 0.671 4.371 0.001**
** probability lets than .01.
139
at the F-statistics in Table 3-4, it can be seen that these are
three of the four SPMs that are reportedly receiving the most
sharply divergent levels of attention. Only building policies have
a larger F-statistic in Table 3-4 (indicating an even sharper
divergence across states in the amount of attention being given to
this policy domain. Since our sample is rather modest in size, and
drawn to be informative rather than strictly representative, we
should be cautious in attaching great significance to the
differences shown in Table 3-6. As described more fully below,
however, these differences do illuminate some important ways in
which states deal in different ways with school policy questions.
Insert Table 3-6 about here.
Multivariate tests of state differences
Table 3-7 presents the first of a series of multiple discriminant
analyses (MDA) of differences between respondents when they are
grouped by state. This table reports the results of MDA of the
amount of attention being given in each of the samp)e states to the
seven basic SPMs. Though interpretation is a bit complicated, MDA
provides the most powerful tool available for summarizing major
differences between the six states in our sapple.
Insert Table 3-7 about here.
Page III -18
1.10
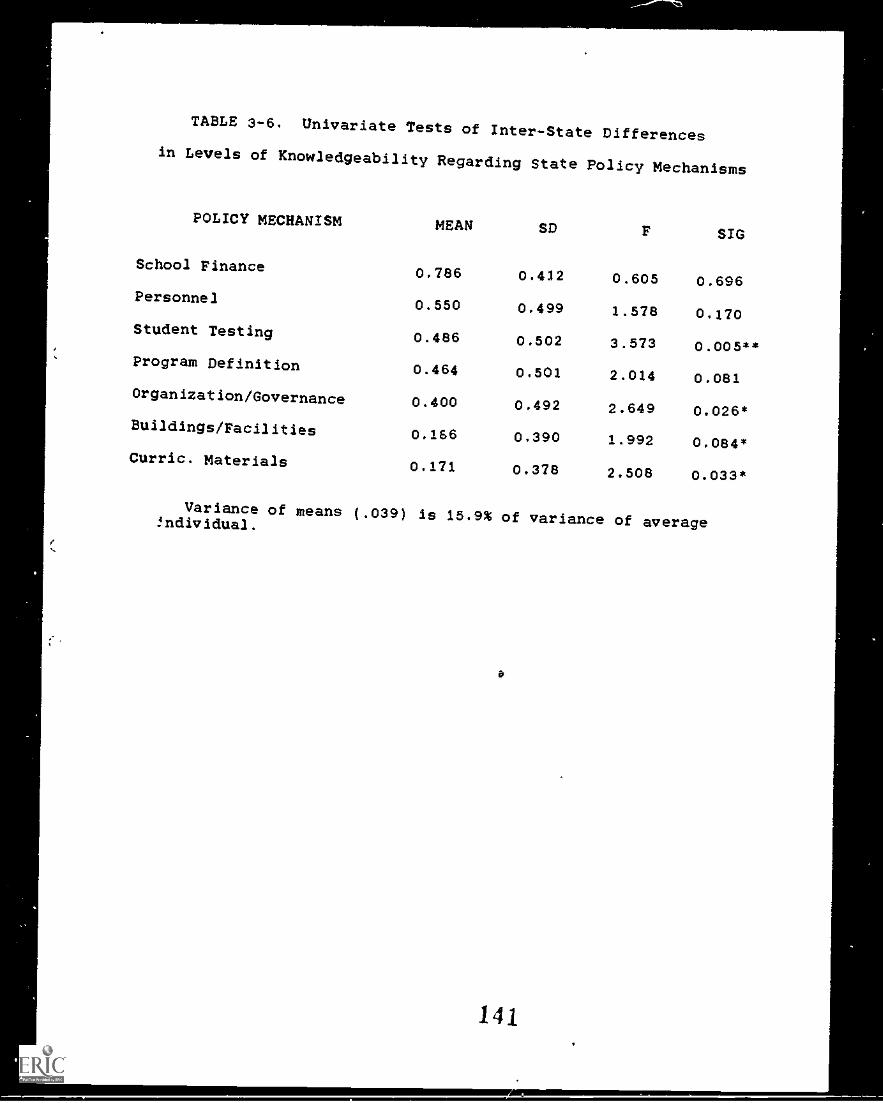
TABLE 3-6. Univariate Tests of Inter-State Differencesin Levels of Knowledgeability Regarding State Policy Mechanisms
POLICY MECHANISM MEAN SD F SIG
School Finance 0.786 0.412 0.605 0.696Personnel 0.550 0.499 1.578 0.170Student Testing 0.486 0.502 3.573 0.005**Program Definition 0.464 0.501 2.014 0.081
Organization/Governance 0.400 0.492 2.649 0.026*Buildings/Facilities 0.166 0.390 1.992 0.084*Curric. Materials 0.171 0.378 2.508 0.033*
Variance of means (.039) is 15.9% of variance of averageThdividual.
b
141
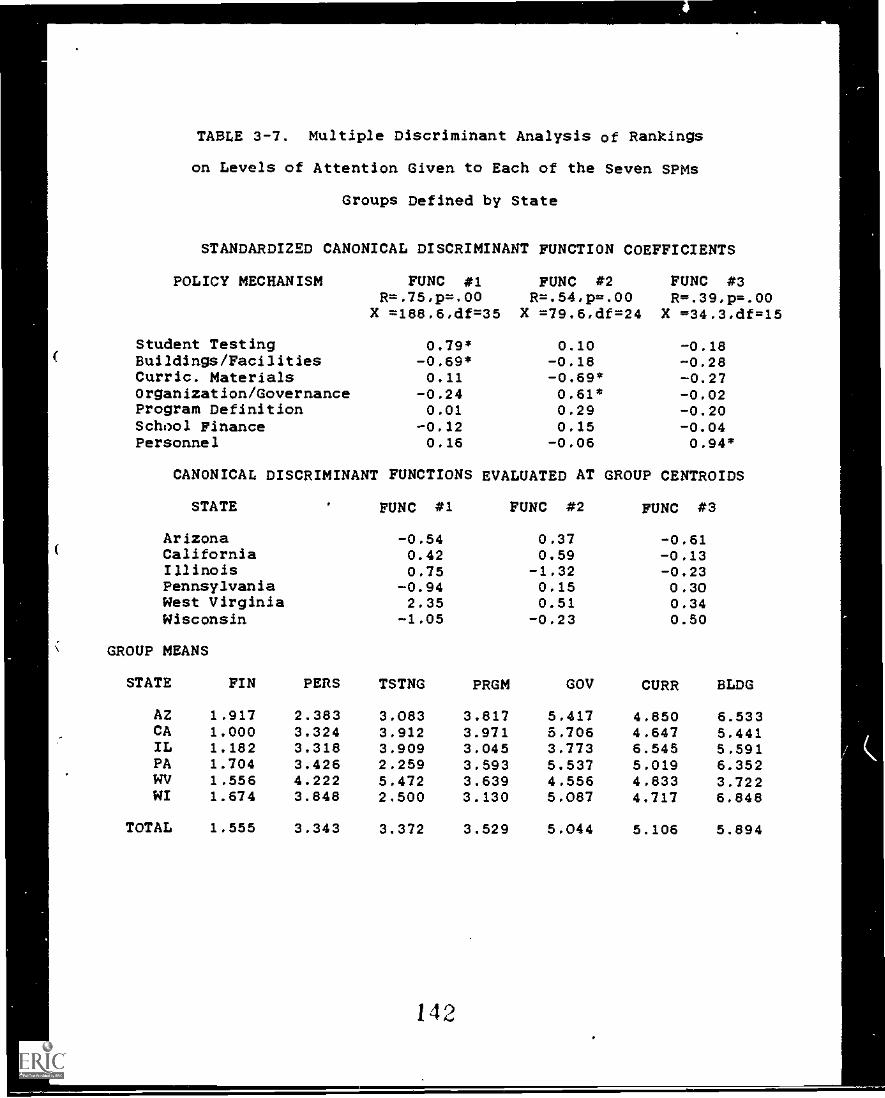
TABLE 3-7. Multiple Discriminant Analysis of Rankings
on Levels of Attention Given to Each of the Seven SPMs
Groups Defined by State
STANDARDIZED CANONICAL DISCRIMINANT FUNCTION COEFFICIENTS
POLICY MECHANISM FUNC #1R=.75,p=.00
X =188.6,df=35
FUNC #2R=.54,p=.00X =79.6,df=24
FUNC #3R=.39,p=.00
X =34.3,df=15
Student Testing 0.79* 0.10 -0.18( Buildings/Facilities -0.69* -0.18 -0.28
Curric. Materials 0.11 -0.69* -0.27Organization/Governance -0.24 0.61* -0.02Program Definition 0.01 0.29 -0.20School Finance -0.12 0.15 -0.04Personnel 0.16 -0.06 0.94*
CANONICAL DISCRIMINANT FUNCTIONS EVALUATED AT GROUP CENTROIDS
STATE FUNC #1 FUNC #2 FUNC #3
Arizona -0.54 0.37 -0.61( California 0.42 0.59 -0.13
Illinois 0.75 -1.32 -0.23Pennsylvania -0.94 0.15 0.30West Virginia 2.35 0.51 0.34Wisconsin -1.05 -0.23 0.50
GROUP MEANS
STATE FIN PERS TSTNG PRGM GOV CURR BLDG
AZ 1.917 2.383 3.083 3.817 5.417 4.850 6.533CA 1.000 3.324 3.912 3.971 5.706 4.647 5.441IL 1.182 3.318 3.909 3.045 3.773 6.545 5.591PA 1.704 3.426 2.259 3.593 5.537 5.019 6.352WV 1.556 4.222 5.472 3.639 4.556 4.833 3.722WI 1.674 3.848 2.500 3.130 5.087 4.717 6.848
TOTAL 1.555 3.343 3.372 3.529 5.044 5.106 5.894
142
r-
,
4
,
The first step in interpreting multiple discriminant analysis is
to look at the canonical correlation (R) for each of the reported
discriminant functions and the associated probability (p-value)
indicating whether the canonical correlations are significant. The
square of each canonical correlation is an estimate of the amount
of variance in the data set that contributes to successful
discrimination among respondents from each of the several states.
Thus, for example, in Table 3-7 the first discriminant function has
a canonical R of .75 with a highly significant p-value (virtually
0.00). This means that this function accounts for approximately
56% of the variations in group membership of the respondents (an
extraordinarily high level of explained variance when using only
seven predictor variables on a sample of 140 respondents).
Once it is determined that a discriminant function is successful
in significantly separating groups of respondents, it becomes
appropriate to begin interpreting its substantive meaning. This i.
done by using both the standardized discriminant function
coefficients (shown in the top portion of each table) and the group
centroids (shown in the middle portion of the tables). The large
coefficients in the first function found in Table 3-7 are those
associated with student testing (0.79) and building and facilities
(-0.69) policies. Since thew coefficients have opposite signs,
respondents from the various states who viewed one of the two SPMs
as prominent tended to view the other one as receiving less
attention within their state. The group centroids (in the middle
portion of the table) show which state was most likely to be
Page 111-19
143
represented In these competing views. Respondents trom West
Virginia with a centroid of 2.35 held the most dramatic position on
this discriminant function. They gave small scores (i.e. tended to
rank as quite prominent) the building and facilities policy domain
while giving relatively large scores (indicating a lower rank) to
student testing policy. This can be easily confirmed by looking at
the mean scores for each state's respondents shown at the bottom of
Table 3-7. West Virginia gave the building and facilities SPM an
average rank of 3.722 (more than two full ranks above the 5.894
average for all respondents), and gave student testing policy a
rank of 5.472 (well below the 3.372 average rank for all
respondents). Looking back at the group centroids in the middle of
the table, we see that West Virginia respondents contrasted in
their views most sharply with those in Wisconsin and Pennsylvania
who had group centroids of -1.05 and -0.94 respectively.
In sum, the first discriminant function in Table 3-7 supports:
MDA Finding, #1. West Virginia policy makers are especially
concerned about school building and facili...ies policies, and
relatively unconcerned about student testing issues.
This finding is fully confirmed by field Interviews In the state.
A recent court case in that state, which found inequality of
educational opportunity to be directly tied to inequities in access
to adequate school facilities and mandated significant new school
facilities development, was repeatedly identified as the most
important recent school policy event In the state (Pauley v. Bailey
324 S.E.2d 128, 1984).
Page 111-20
144
-4-
6
The second MDF shown in Table 3-7 is also highly significant
(with a canonical correlation of .54, it accounts for 29% of the
response variance). Two of the seven SPMs account for most of the
explanatory power of this function: curriculum materials and
school organization/ governance. The state centroids and pattern
of mean scores indicate that:
MDA Findino *2: /llinois respondents have -he most unique view
on these two SPMs -- they are most concerned dth governance
questions and least concerned with curriculum materials issues.
This focus on governance issues in Illinois has been recently
manifested in controversy over reorganization of the office of the
state superintendent of public instruction (from an elected to an
appointed office) and a hard fought collective bargaining statute
for teachers. Governance issues have had a long history of
importance in Illinois, however, because traditional tensions
between the city of Chicago and "downstate" interests have produced
a labyrinthine dual governance system for most public services in
the state.
Contrasts among the six states in the sample can be seen clearly
in Figure 3-1 which is a plot of the state centroids on the first
two discriminant functions in Table 3-7. West Virginia and
Illinois are visEdly the "outliers" on these two discriminant
functions. West Virginians, with their traditional reluctance to
provide substantial funding or state level direction to education
have been dramatically affected by Judge Recht's decision in the
Paulev v. Bailey case. They have responded to this court mandates
Page 111-21
145
by giving unusually intense attention to building facilities and
curriculum materials policy issues, while giving commensurately
less attention to student testing and governance matters.
Illinois, much less concerned about these issues, gives more
attention than any other state to problems of governance.
insert Figure 3-1 about here.
California shares with West Virginia a higher than average
interest in curriculum and building issues. Indeed, as suggested
in Figure 3-1, California policy makers reported the highest level
of attention to curriculum matters (though still ranking this SPM
fifth, giving it a modest mean ranking of 4.647).
The third MDF shown in Table 3-7 is also highly significant and
accounts for about 15% of the respondent variance. Only one of the
seven SPMs (school personnel policies) provides most of the
explanatory power for this MDF. As seen in the centroid scores:
MDA Finding #4: Arizona policy makers gave the highest ranking
to personnel policies.
They gave a mean score of 2.38 t, the personnel training and
certification SPM -- more than a full rank higher than any other
state. West Virginia and Wisconsin occupy the other extreme,
giving personnel questions a relatively low ranking. Arizona's
interest in personnel matters is easily seen in our field
interviews. This state has recently adopted merit pay, career
ladders, teacher evaluation, and staff development reforms -- all
Page 111-22
146
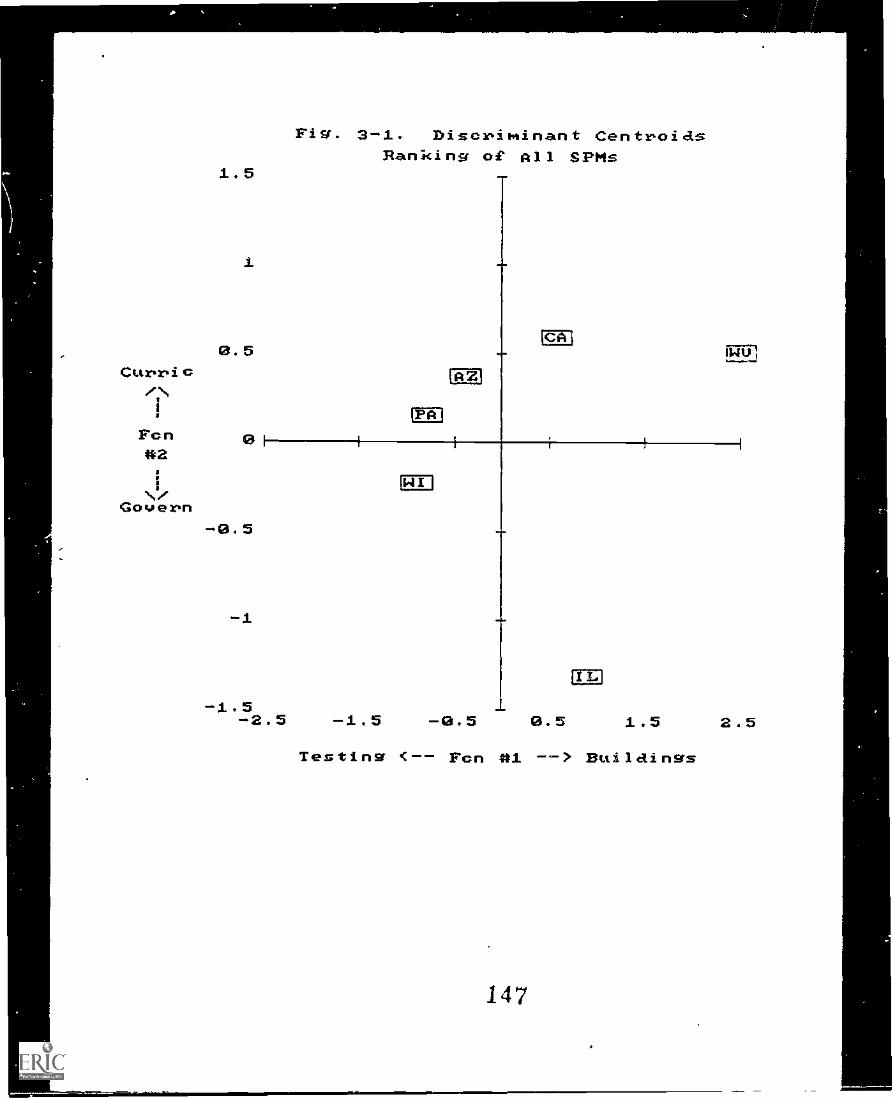
Cuvvic/:.
I
Fen02
8
Govevn
1.5
1
0.5
9 1
-0.5
-1
Fig. 3-1. Disor.iminant Centr,oidsBanking of All SPMs
Cin
UZI
CA
-1.5-2.5 -1.5
MEI
1-
I
MI
I
1.5 2.5
Testing <-- Fen 01 --) Builaings
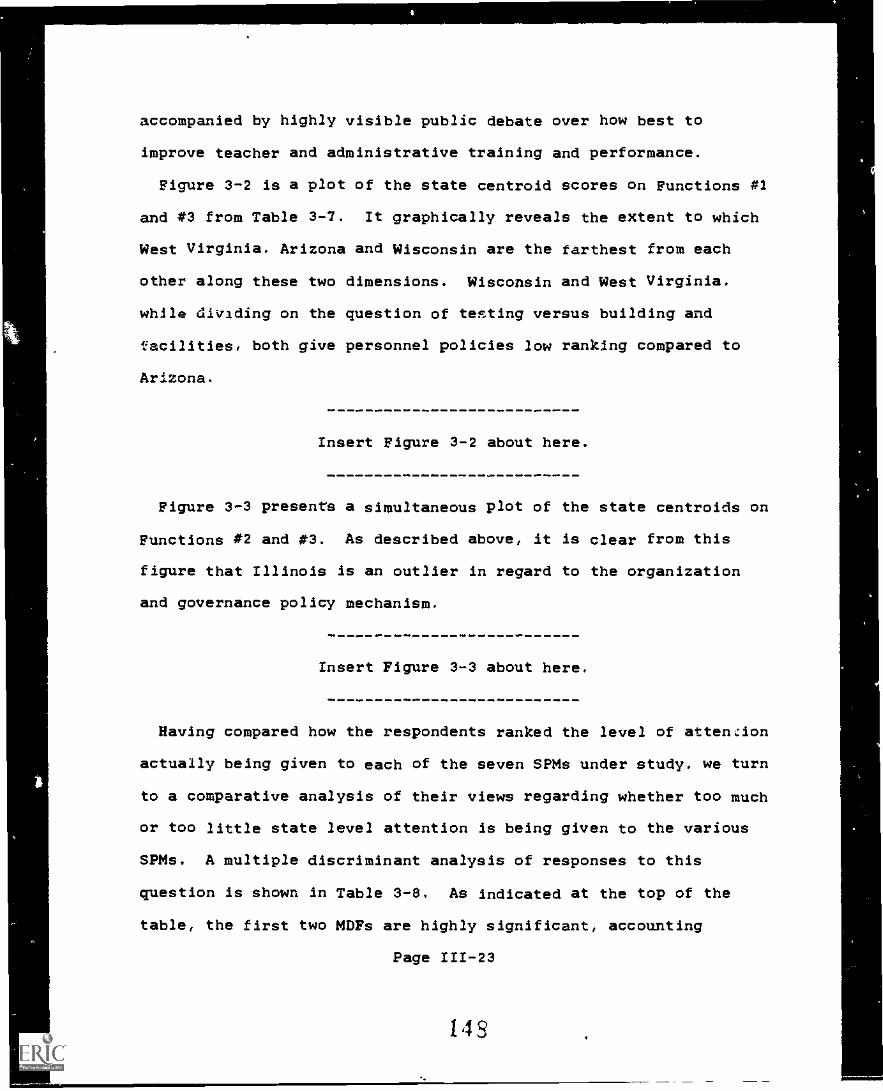
accompanied by highly visible public debate over how best to
improve teacher and administrative training and performance.
Figure 3-2 is a plot of the state centroid scores on Functions #1
and #3 from Table 3-7. It graphically reveals the extent to which
West Virginia, Arizona and Wisconsin are the farthest from each
other along these two dimensions. Wisconsin and West Virginia,
while dividing on the question of testing versus building and
facilities, both give personnel policies low ranking compared to
Arizona.
Insert Figure 3-2 about here.
Figure 3-3 presents a simultaneous plot of the state centroids on
Functions #2 and #3. As described above, it is clear from this
figure that Illinois is an outlier in regard to the organization
and governance policy mechanism.
Insert Figure 3-3 about here.
Having compared how the respondents ranked the level of attenzion
actually being given to each of the seven SPMs under study, we turn
to a comparative analysis of their views regarding whether too much
or too little state level attention is being given to the various
SPMs. A multiple discriminant analysis of responses to this
question is shown in Table 3-8. As indicated at the top of the
table, the first two MDFs are highly significant, accounting
Page 111-23
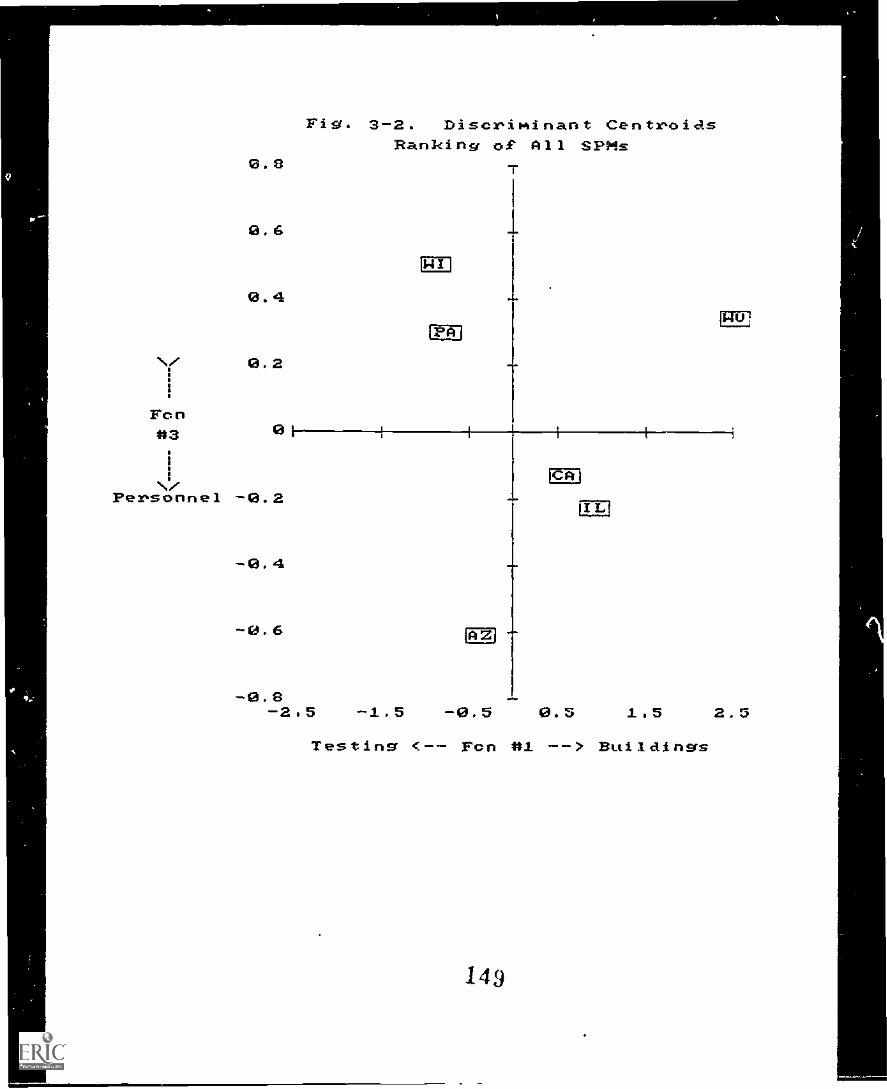
0.8
0.6
0.4
Fen#3
Fig. 3-2. Discriminant CentroiasRanking of All SPOls
T
MEI
PA
T0 1 --I I -I I i
i
NI/Personnel -0.2 ...
-0. 4 -
-0. 6
-0.8-2,5 -1.5
MI
wArm.
CA
-0.5 0.5
M.,
1,5 2.5
Testing <-- Fen #1 --> Buildings
149
-
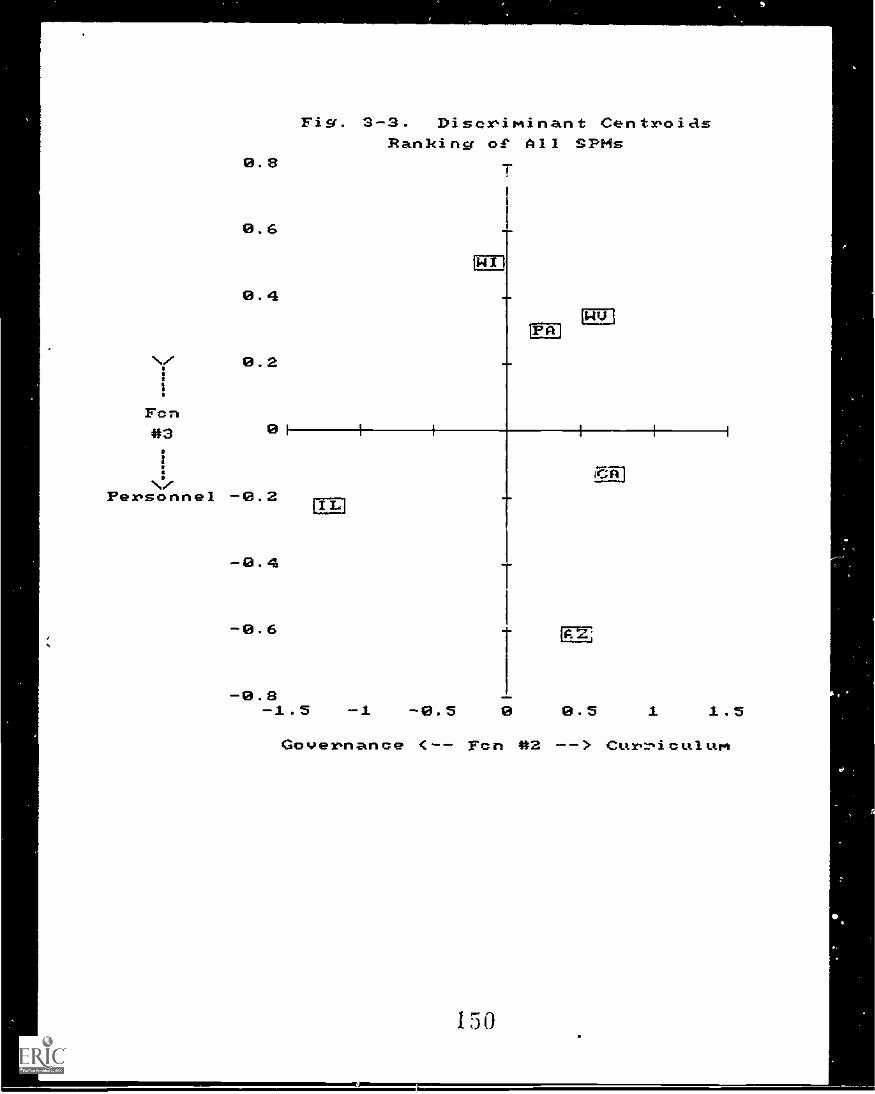
8.8
8.6
8.4
y 0.21
I
Fon*3 0
Fig. 3-3. Disorqminant Cent3noidsRanking of All SPMs
I
M...
LaiwIlim
PA
-Ma
1
:
`...,
Pevsonnel -0.2 _MI172...api
-0.4T
-8.6
-0.8-1.5 -1 -0.5 0 8.5 1 1.5
Gover.nance <-- Fon *2 --> Cuvr.iculum
150
respectively for 21% and 16% of the response variance. The third
function, acrounting for just under 12% of the response variance,
has a p-value of .10 Indicating that we can be only 90% sure that
it Is not the result of sampling error. Hence we should interpret
this third function with extreme caution and accept its findings
only if they are corroborated by other data.
/nsert Table 3-8 about here.
Before looking at the discriminant functions, note that averaging
the mean scores for each SPM for the six sample states provides an
overall measure of the extent to which policy makers In each state
believe that state Control over education should be increased. The
average for all states Is positive, but they differ substantially:
State Mean Score for all SPMs
AZ .095
PA .218
W/ .220
CA .243
WV .278
/L .317
Six State Average .220
This profile of mean scores support:
MDA Finding *5: Arizona respondents showed the least Inclination
to increase state level control over school policy. Illinois and
Page 111-24
151
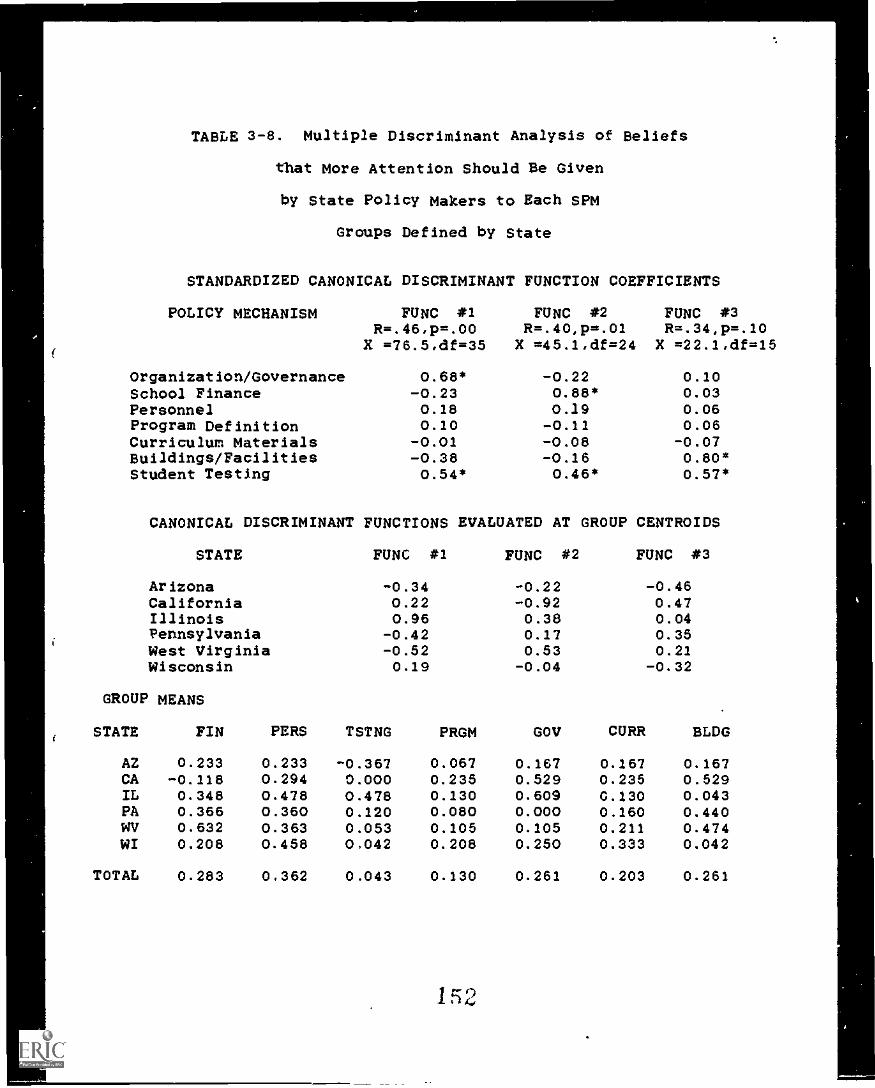
TABLE 3-8. Multiple Discriminant Analysis of Beliefs
that More Attention Should Be Given
by State Policy Makers to Each SPM
Groups Defined by State
STANDARDIZED CANONICAL DISCRIMINANT FUNCTION COEFFICIENTS
POLICY MECHANISM FUNC #1R=.46,p=.00
X =76.5,df=35
FUNC #2R=.40,p=.01
X =45.1,df=24
FUNC #3R=.34,p=.10
X =22.1,df=15
Organization/Governance 0.68* -0.22 0.10School Finance -0.23 0.88* 0.03Personnel 0.18 0.19 0.06Program Definition 0.10 -0.11 0.06Curriculum Materials -0.01 -0.08 -0.07Buildings/Facilities -0.38 -0.16 0.80*Student Testing 0.54* 0.46* 0.57*
CANONICAL DISCRIMINANT FUNCTIONS EVALUATED AT GROUP CENTROIDS
STATE FUNC #1 FUNC #2 FUNC #3
Arizona -0.34 -0.22 -0.46California 0.22 -0.92 0.47Illinois 0.96 0.38 0.04Pennsylvania -0.42 0.17 0.35West Virginia -0.52 0.53 0.21Wisconsin 0.19 -0.04 -0.32
GROUP MEANS
STATE FIN PERS TSTNG PRGM GOV CURR BLDG
AZ 0.233 0.233 -0.367 0.067 0.167 0.167 0.167CA -0.118 0.294 0.000 0.235 0.529 0.235 0.529IL 0.348 0.478 0.478 0.130 0.609 0.130 0.043PA 0.366 0.360 0.120 0.080 0.000 0.160 0.440WV 0.632 0.363 0.053 0.105 0.105 0.211 0.474WI 0.208 0.458 0,042 0.208 0.250 0.333 0.042
TOTAL 0.283 0.362 0.043 0.130 0.261 0.203 0.261
152
a
r
,
-
West Virginia decision makers displayed the greatest interest in
more centralized policy making.
Arizonans uniquely believe that less state leve.:4 attention should
be given to issues of student testing and assessment. The high
overall mean scores for Illinois and West Virginia resulted from
very different specific interests. Illinois respondents were
particularly interested in giving more attention to governance
issues, West Virginians to school finance.
A close look at the discriminant function coefficients In the top
part of Table 3-8 shows that the student testing SPM makes a
substantial contribution to all three of the significant functions.
This would make respondent views on this SPM hard to interpret if
it were not for the very clear pattern of mean scores found in the
bottom section of the table. These means clearly indicate that:
MDA Finding *6: Concern over state level attention to testing
poliz.y plays a role in all of the statistically significant
discriminations among the states -- this SPM has the widest range
of expressed desires for greater attention. Illinois policy makers
show the greatest interest in increased state attention in this
domain.
As indicated by the function coefficients, the first MDF in Table
3-8 reflects a desire for increased state level attention to both
governance and student testing policies. The second MDF interprets
combined interest in school finance and student testing. The group
centroids for the six states on these two functions are plotted in
Figure 3-4. Note that Illinois, California and West Virginia are
Page 111-25
1 5 3
the outliers on this graph. Illinois is in the upper right
quadrant of the graph because:
MDA Finding #7: Illinois respondents display the greatest
interest in increased attention to both student testing and school
governance questions.
Insert Figure 3-4 about here.
The California centroid is at the bottom of the figure because:
MDA Finding #8: California respondents are the only ones to
reject increased state attention to school finance. Incidentally,
they also have a strong interest in increasing attention to school
governance and buildlng policies.
Finally, the West Virginia centroid has the extreme scores in the
upper left quadrant of Figure 3-4 because:
MDA Finding #9: West Virginians see the greatest need for
increased attention to school finance, and have a low level of
interest in focusing greater state attention on either governance
or testing matters.
To the extent that function *3 in on Table 3-8 produces a
reliable discrAmination among the sample states, it shows that
school building policies are thought to need much greater attention
in California, Pennsylvania and West Virginia, but not in Arizona
or Wisconsin.
As shown in Table 3-9, there were only two significant
discriminant functions separating the sample states on the question
Page III-26
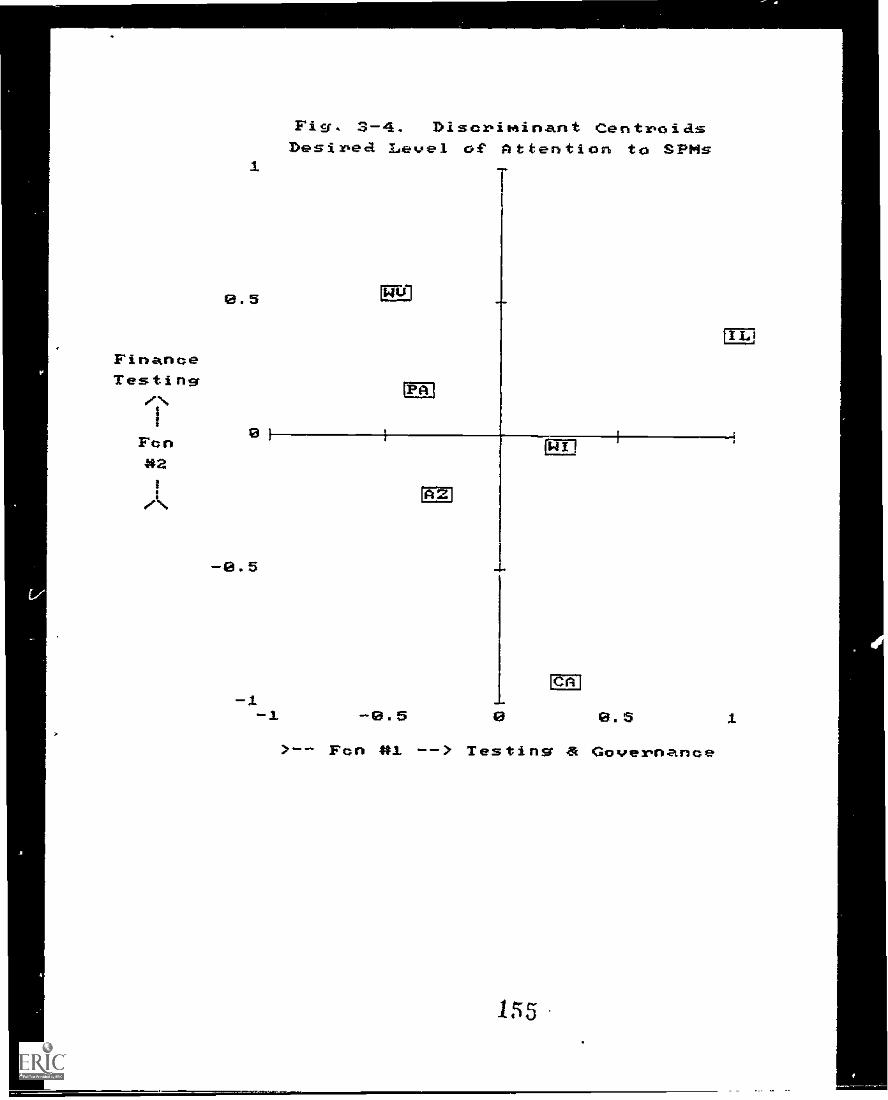
FinanceTesting
e'
':
Fen*2
!A
1
0.5
81
-0.5
Fig. 3-4. Discriminant CentroiasDesirea Level of Attention to SPMs
IAM
PA
AZ
WI
-0.5 0 8.5 1
>-- Fen 01 --> Testing a Governance
155
of which SPMs respondents felt most knowledgeable about. The first
discriminant function, accounting for about 19% of respondent
variance, indicates that those who were most knowledgeable about
the student testing domain tended not to feel knowledgeable about
either governance or school building matters.
Insert Table 3-9 about here.
The second function, accounting for about 17% of respondent
variance, indicates that fam!liarity with curriculum materials
issues was accompanied by knowledge about program definition but
not the personnel SPM. The state centroids shown in the middle of
Table 3-9 are plotted on the graph shown in Figure 3-5. This
pattern of centroids indicates that:
MDA Finding #10: Wisconsin respondents felt the most
knowledgeable about testing issues; they felt least well equipped
to discuss school building or governance questions.
Insert Figure 3-5 about here.
MDA Finding #11: West Virginia respondents were most comfortable
with school program and curriculum issues; they felt least
knowledgeable about the student testing SPM.
MDA Finding 2112: Arizona respondents, reflecting their recent
work on these issues, felt most knowledgeable about the personnel
SPM and were least familiar with program definition matters.
Page 111-27
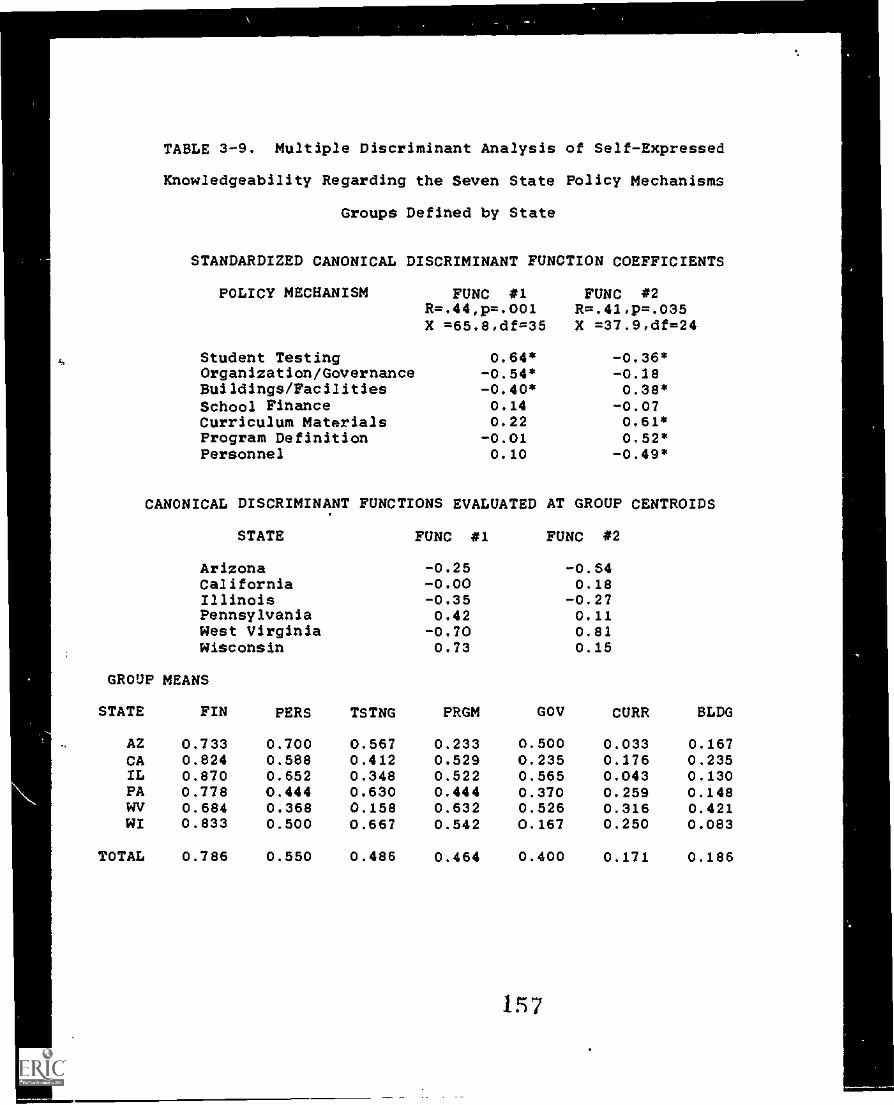
TABLE 3-9. Multiple Discriminant Analysis of Self-Expressed
Knowledgeability Regarding the Seven State Policy Mechanisms
Groups Defined by State
STANDARDIZED CANONICAL DISCRIMINANT FUNCTION COEFFICIENTS
POLICY MECHANISM FUNC *1R=.44,p=.001X =65.8,df=35
FUNC #2R=.41,p=.035X =37.9,df=24
Student Testing 0.64* -0.36*Organization/Governance -0.54* -0.18Buildings/Facilities -0.40* 0.38*School Finance 0.14 -0.07Curriculum Materials 0.22 0.61*Program Definition -0.01 0.52*Personnel 0.10 -0.49*
CANONICAL DISCRIMINANT FUNCTIONS EVALUATED AT GROUP CENTROIDS
STATE FUNC #1 FUNC #2
Arizona -0.25 -0.64California -0.00 0.18Illinois -0.35 -0.27Pennsylvania 0.42 0.11West Virginia -0.70 0.81Wisconsin 0.73 0.15
GROUP MEANS
STATE FIN PERS TSTNG PRGM GOV CURR BLDG
AZ 0.733 0.700 0.567 0.233 0.500 0.033 0.167CA 0.824 0.588 0.412 0.529 0.235 0.176 0.235IL 0.870 0.652 0.348 0.522 0.565 0.043 0.130PA 0.778 0.444 0.630 0.444 0.370 0.259 0.148WV 0.684 0.368 0.158 0.632 0.526 0.316 0.421WI 0.833 0.500 0.667 0.542 0.167 0.250 0.083
TOTAL 0.786 0.550 0.486 0.464 0.400 0.171 0.186
157
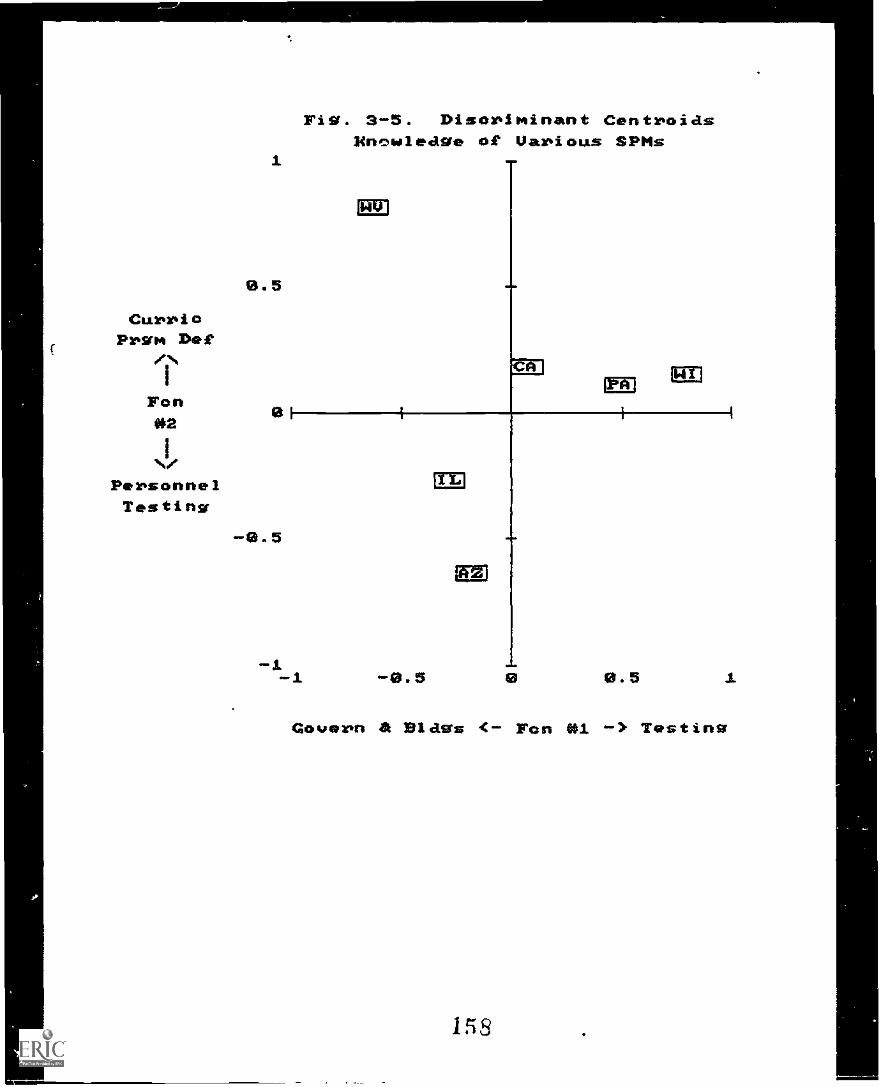
CarrieFrwm Diet
.,
i
Fon02
IN/PersonnelTesting
1
8.5
8i
-8.5
Fig. 3-5. Disoriminant CentroidsMnowledge of Uarioas SPMs
L1J
11,
MI
Li121Eli
OA
IEZ1
*Mb
i
el 0.5 .I.
Govern A Slags <- Fon 01 -, Testing
The other three states have less strong views that Wisconsin,
West Virginia and Arizona.
Conclusion
The responses of 140 key policy actors in six states to the
questions: 1) How much attention is given to each of the seven
basic SPMs in your state? 2) Should state level policy makers be
giving more (or less) attention than they do now to each policy
domain? And, 3) which of the seven SPMs do you feel most
knowledgeable about? were reviewed in this chapter. The data
indicate that there is both a strong underlying national consensus
about the relative importance of the various policy mechanisms and
sharp differences among the states in the amount of attention
actually being _focused on each of them. Moreover, policy makers
have systematically divergent views about how much attention the
state should give to each SPM. Differences in the degree to which
policy makers feel knowledgeable about a policy mechanism are
closely associated with their perception that the policy has been
receiving significant attention within their own state policy
system.
Having noted that policy interests vary from state to state, we
turn in the next chapter to ascertaining whether the states adopt a
characteristic approach to various policy mechanisms.
Page 111-28
159
CHAPTER IV
COMPETING APPROACHES TO THE SEVEN
ALTERNATIVE STATE POLICY MECHANISMS
The last chapter described in broad strokes how state policy
makers perceive seven basic statc policy mechanisms for shaping
school programs and practices. We noted the existence of a
national education policy perspective, shared broadly by key actors
in all of our sample states, which gives prominence to fiscal
policy mechanisms while giving school building and curriculum
materials issues much lower levels of attention. We further noted
that, on the average, state policy makers believe that they should
be giving substantially more attention to all education policy
domains.
We turn in this chapter to a more detailed look at competing
approaches to state policy making within each of the seven broad
domains already described. Data for this analysis was gathered by
asking respondents in each state indicate which of several
alternative approaches were receiving the most attention by policy
makers within their state. The alternative approaches which they
were asked to characterize were i6entified from first round
interviews with policy makers in each state. The number of
alternatives presen;:ed for comment and analysis varied across the
seven basic pAls. Only three apptoaches were identified in the
area of curriculum materials development and selection
(Specification of the scope and sequence of the core materials to
Page IV-1
160
be used in local districts, development of specialized
instructional materials for particular purposes, and mandating
local use of materials selected or developed by state agencies).
Either four or five alternatives were identified in each of the
other domains, except for school organization and governance which
was clearly the most complex of the basic SPMs with eight competing
approaches: 1) increasing or 2) redistributing state level powers,
3) strengthening teachers, 4) increasing administrative control, 5)
strengthening site level authority, 6) expanding citizen influence,
7) altering local district roles and responsibilities, and 8)
specifying student rights and responsibilities.
Tables 4-1 through 4-7 identify the specific approaches to each
SPM which were presented to respondents. Each approach is
described more fully and illustrated with specific examples on the
interview instrument shown in Appendix A. In each case,
respondents were asked to rank order the alternative approaches
(responses were given a score of 1 to the approach perceived to be
getting the most attention and larger scores to those getting less
attention during the last two or three years). Where respondents
were 'inable or unwilling to give alternative approaches different
ranks each was given the average score for the ranks covered.
Typically, respondents did not rank the alternative approaches to
all seven SPMs. Rather, each informant was first asked to report
on the three SPMs about which he/she felt most knowledgeable. If
interview time permitted, respondents were then asked to rank the
approaches with wbich they were less familiar. The number of
Page 1V-2
161
respondents evaluating each SPM ranged from a low of 38 who
evaluated school building policles to a high of 118 who were
prepared to rank alternative approaches to schocil finance. The
average respondent provided data on about 3.5 SPMs -- an average of
about 68 respondents per SPM.
As with the data analysis presented in the last chapter, we will
review the data on competing approaches to each policy mechanism in
two steps. First, the level and meaning of overall agreement among
all respondents who responded to the same SPM will be described.
Once again, this agreement reflects what might be thought of as a
"national perspective" on how best to handle each policy domain.
Following the discussion of agreement among respondents, we will
examine in detail the differences among them -- indicating how
states differ in their approach to each policy arena and
elaborating on what other field data tells us about why the various
states take the approaches that they do.
We should reiterate that the sample size is quite small in each
policy domain, and that the sample was selected to be
representative of the most active and informed members of each
state's decision making elite. There are, no doubt, important
sampling biases in this procedure. As a result, our findings
should not be construed to reflect the views of a state or even of
the average policy maker within each state. Our data describe how
the most active and informed members of the policy making elite at
the time of our study, and will apply to current actors in these or
other states only to the extent that the key actors we interviewed
Page 1V-3
1S2
represent those who are currently occupying positions of influence
and authority. While this limitation is both real and important,
our primary interest lies not in predicting how any particular
state can or will act on these matters -- reading newspapers,
journals and ongoing policy documents within each state, and
conducting open ended interviews with those who are key actors
today is the best way to go about that important task. Our
interest is more basic, we are seeking to show what the underlying
structure of policy alternatives looks like and how these
alternatives come to be valued and incorporated into specific
policy decisions.
Approaches to School Finance. As a group respondents from the
six sample states agreed that school finance is dominated by a
concern with equalizing financial support for all children. This
is followed very closely, however, by a concern with fixing the
total amount of money spent on education in the state. A
significant gap (as measured by a paired t-test of the means)
separates these two approaches from the third one, targeting funds
on populations with special needs. Another statistical gap
separates this approach from the two finance approaches ranked last
-- offsetting burdensome costs to school districts with special
financial hardships and financing specific school functions, such
as transportation, textbook acquisition, or building programs.
Insert Table 4-1 about here.
Page IV-4
113
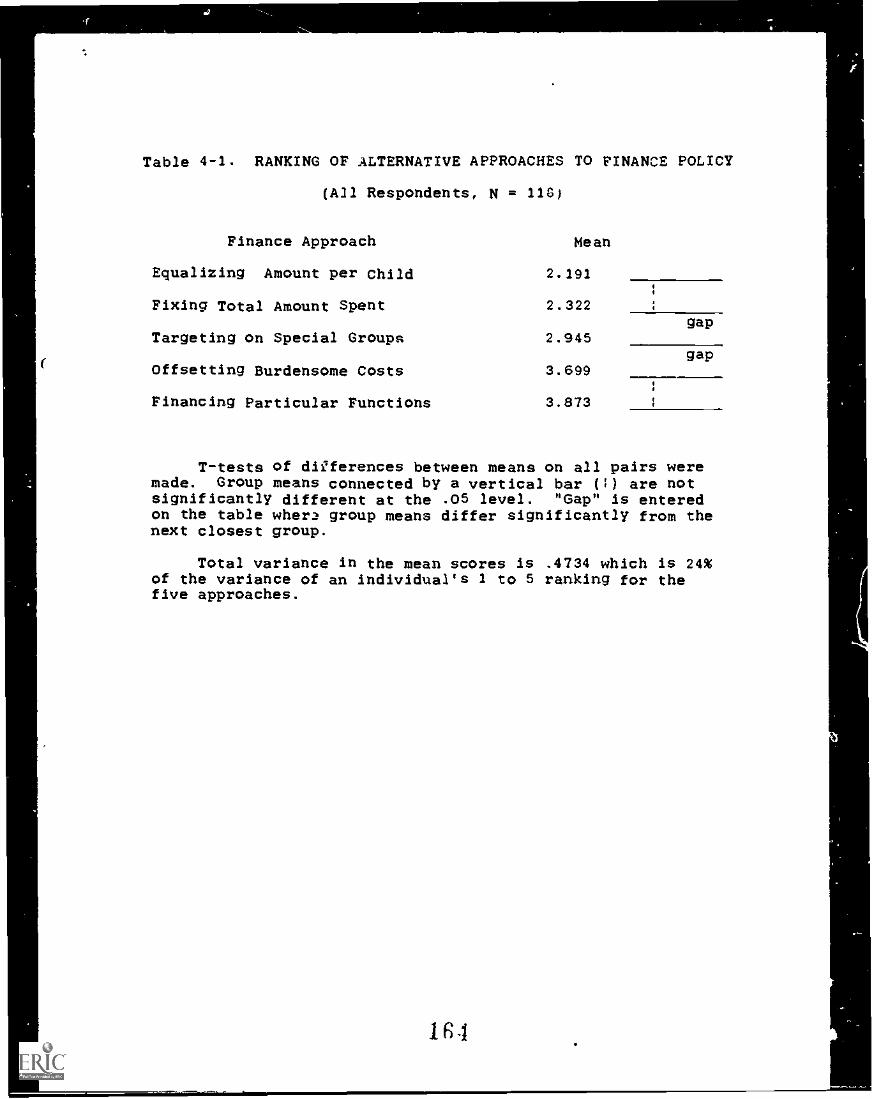
Table 4-1. RANKING OF ALTERNATIVE APPROACHES TO FINANCE POLICY
(A31 Respondents, N = 11G)
Finance Approach Mean
Equalizing Amount per Child 2.191
Fixing Total Amount Spent 2.322
Targeting on Special Groups 2.945
Offsetting Burdensome Costs 3.699
gap
Financing Particular Functions 3.873
gap
T-tests of differences between means on all pairs weremade. Group means connected by a vertical bar (:) are notsignificantly different at the .05 level. "Gap" is enteredon the table wher2 group means differ significantly from thenext closest group.
Total variance in the mean scores is .4734 which is 24%of the variance of an individual's 1 to 5 ranking for thefive approaches.
While there was substantial agreement among respondents
regarding the relative importance of these various approaches to
finance policy, the agreellent was less dramatic than that expressed
in their ranking of the relative importance of the seven SPMs
reported in the last chapter. Only 22% of the variance is shared
across the respondent sample compared to the 47% shared variance in
ranking the relative amount attenti,-n given to all seven SPMs.
AnProaches to Personnel Policy. Eighty respondents ranked
alternative approaches to school personnel policy. To a
substantial degree they agreed that the four alternatives we had
identified were ranked as shown in Table 4-2. Pre-service
certification and training issues were ranked as most important,
professional development and accountability system development were
ranked about equally, and issues of changing teacher job
definitions were clearly seen as the least frequent expression of
this SPM. Variance in the group mean scores for the SO respondents
evaluating this SPM indicates that they agreed with one another
about 22% of the time across all states.
Insert Table 4-2 about here.
Page /V-5
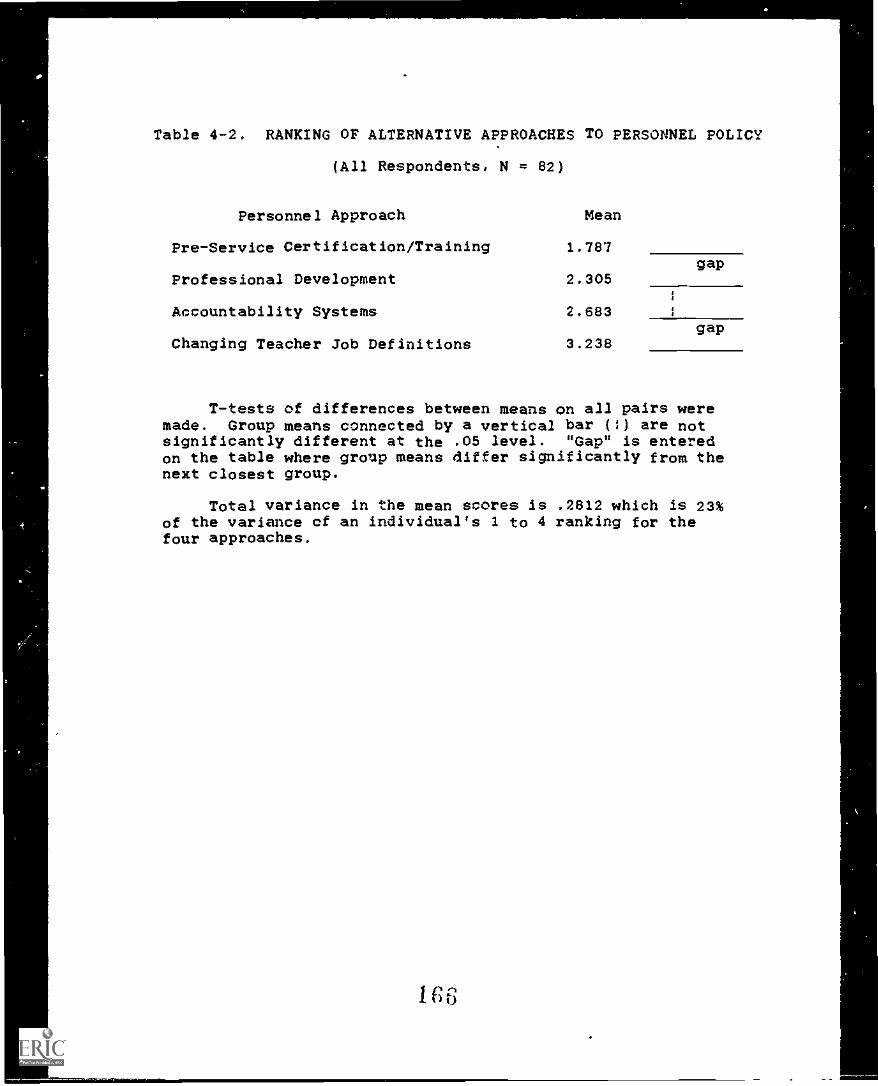
Table 4-2. RANKING OF ALTERNATIVE APPROACHES TO PERSONNEL POLICY
(All Respondents, N = 82)
Personnel Approach Mean
Pre-Service Certification/Training 1.787
Professional Development 2.305
Accountability Systems 2.683
Changing Teacher Job Definitions 3.238
gap
gap
T-tests of differences between means on all pairs weremade. Group means connected by a vertical bar (:) are notsignificantly different at the .05 level. "Gap" is enteredon the table where group means differ significantly from thenext closest group.
Total variance in the mean scores is .2812 which is 23%of the variance cf an individual's 1 to 4 ranking for thefour approaches.
Approaches to Student Testing and Assessment. Five alternative
approaches to student testing and assessment policy were identified
from the analysis of preliminary interviews and documents. Seventy
respondents told us about the relative amount of attention given to
each of these five testing policy options in their respective
states. As shown in Table 4-3, these respondents strongly agreed
that specifying the form or content of test instruments is the most
frequently used approach to this policy domain. Measuring
non-academic outcomes of student learning activities was ranked
last. The use of testing programs to evaluate teachers or school
programs was ranked next to last by these respondents, but our
interview notes suggest that this approach is definitely on the
upswing in several states. Lndeed, as shown on Table 4-3,
California respondents ranked this approach second in that state.
As indicated on Table 4-3, a whopping 40% of the average
individual variance 's found in the aggregate mean scores for the
70 respondents dealing with this SPM.
Insert Table 4-3 about here.
Alternative Approaches to Program Definition Policy. As shown in
Table 4-4, 76 respondents ranked four alternative approaches to
school program definition being worked on in their respective
states. They agreed overwhelmingly that setting higher program
standards is the number one approach to dealing with this policy
Page IV-6
167
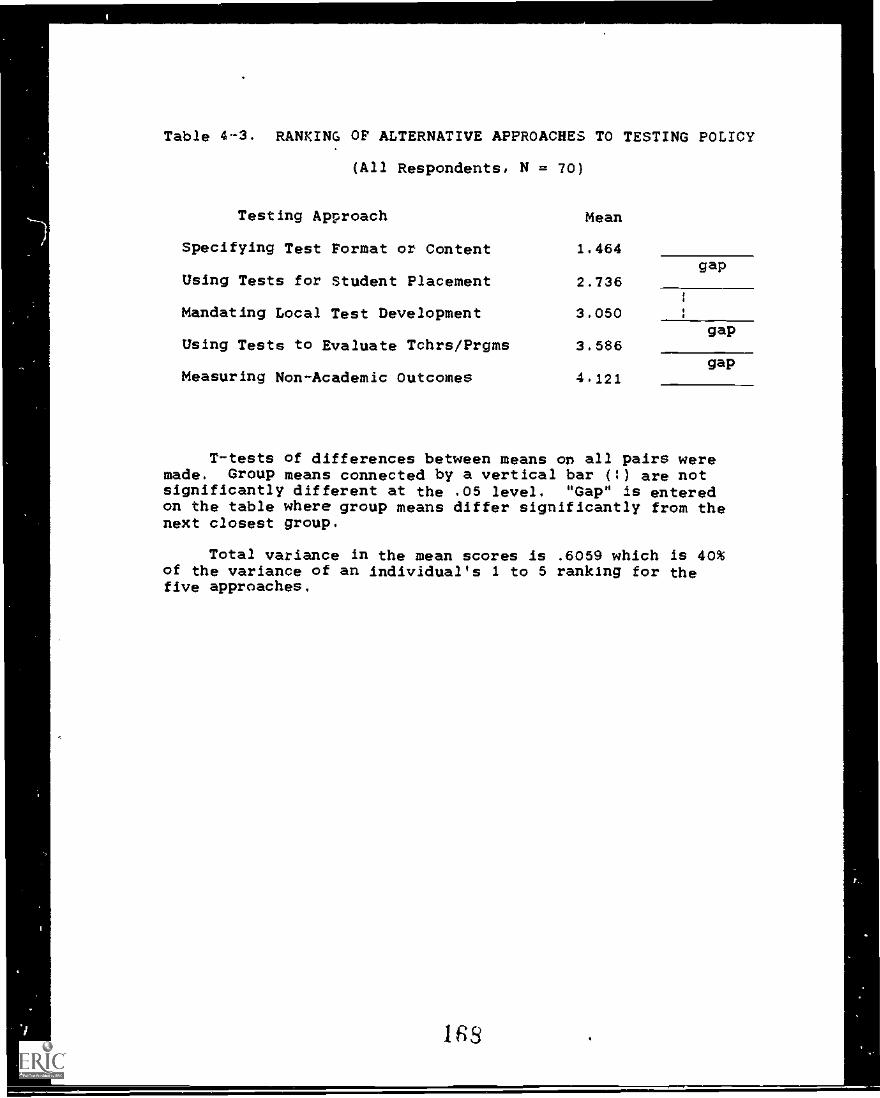
Tab1e 4-3. RANKING OF ALTERNATIVE APPROACHES TO TESTING POLICY
(All Respondents, N = 70)
Testing Approach Mean
Specifying Test Format or Content 1.464
Using Tests for Student Placement 2.736
Mandating Local Test Development 3.050
Using Tests to Evaluate Tchrs/Prgms 3.586
Measuring Non-Academic Outcomes 4.121
gap
1
gap
gap
T-tests of differences between means on all pairs weremade. Group means connected by a vertical bar (:) are notsignificantly different at the .05 level. "Gap" is enteredon the table where group means differ significantly from thenext closest group.
Total variance in the mean scores is .6059 which is 40%of the variance of an individual's 1 to 5 ranking for thefive approaches.
1 RS
domain. The other three approaches (mandating particular subjects,
developing programs for special groups of students, and changing
time requirements) were ranked well behind the standard setting
approach. The group mean scores for this SPM contain 34% of the
variance of the average respondent an amount that was second only
to the 40% shared variance in testing policy.
Insert Table 4-4 about here.
Alternative APProaches to School Governance. As shown in Table
4-5, 63 respondents were asked to rank eight different approaches
to school organization and governance. While, as described below
in relation to Tables 4-7 and 4-10, there were significant
differences among the six states, there was little agreement among
the respondents about common governance themes that carry across
state boundaries. Only 2% of the individual variance was found in
the group means for this SPM, by far the lowest level of agreement
on any of the seven basic SPMs. While increasing state level
control at the expense of local education agencies was ranked
first, and altering the roles of local districts was ranked eighth,
the differences were not statistically significant. Prom our
interview notes, it appears likely that the lack of inter-state
agreement on this SPM to a substantial degree at least, the
result of measurement error rather than lack of substantive
similarities in state level governance policy. We found too often
Page IV-7
163
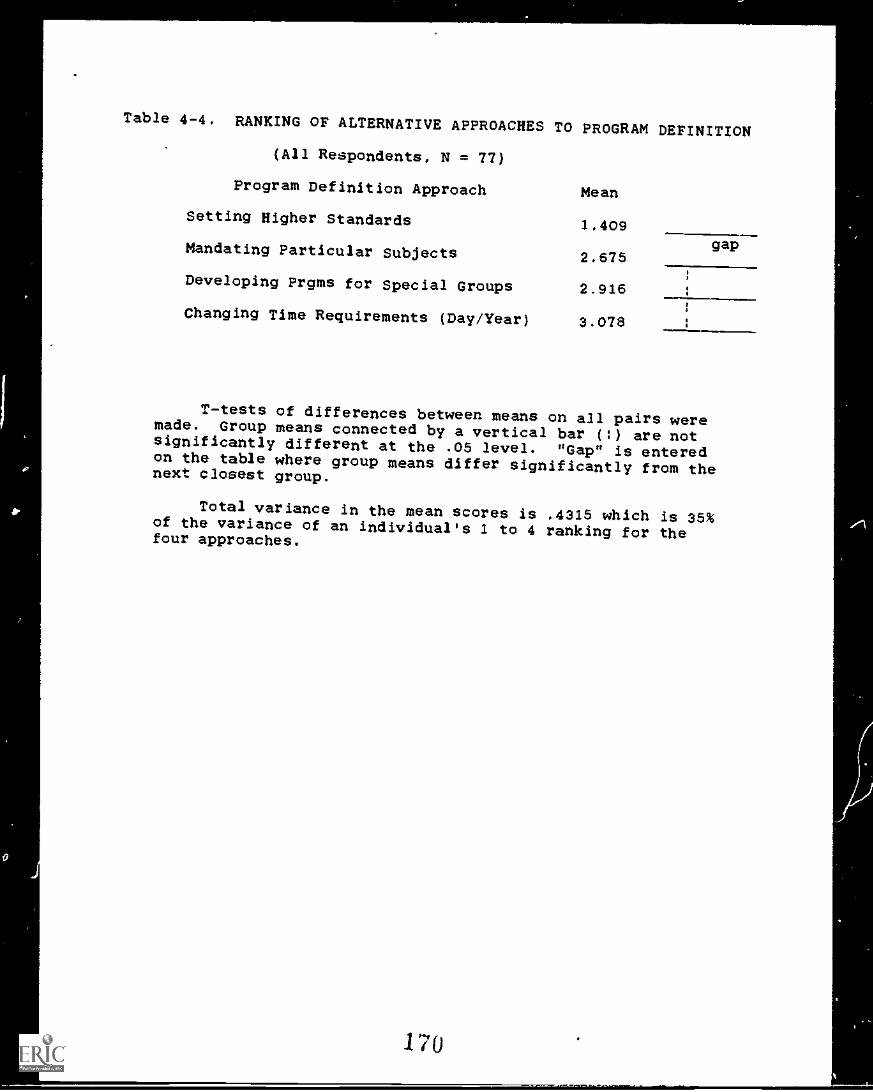
0
Table 4-4. RANKING OF ALTERNATIVE APPROACHES TO PROGRAM DEFINITION
(All Respondents, N = 77)
Program Definition Approach Mean
Setting Higher Standards 1.409gapMandating Particular Subjects 2.675
Developing Frgms for Special Groups 2.916
Changing Time Requirements (Day/Year) 3.078
T-tests of differences between means on all pairs weremade. Group means connected by a vertical bar (:) are notsignificantly different at the .05 level. "Gap" is enteredon the table where group means differ significantly from thenext closest group.
Total variance in the mean scores is .4315 which is 35%of the variance of an individual's 1 to 4 ranking for thefour approaches.
170
that we had to explain to our respondents what was meant by the
various approaches they were asked to rank, and we suspect that
different respondents may have been using different meaning systems
in applying the approaches to events within their own state policy
systems.
Insert Table 4-5 about here.
Alternative aPProaches to Curriculum Materials Policy. As shown
in Table 4-6, the 39 respondents who reported on the three
identified approaches to curriculum materials policy were in
substantial agreement (with 30% shared variance between individual
responses and the overall group mean). Specifying the scope and
sequence of school curricula was well ahead of developing
specialized materials for special purposes and mandating local use
of particular materials as the most common approach to curriculum
materials policy in the six states we studied. Some caution must
be used in interpreting the data on this SPM, however, because we
have no respondents in Illinois that ranked these approaches for
that state (see Table 4-14).
Insert Table 4-6 about here.
Page IV-6
171
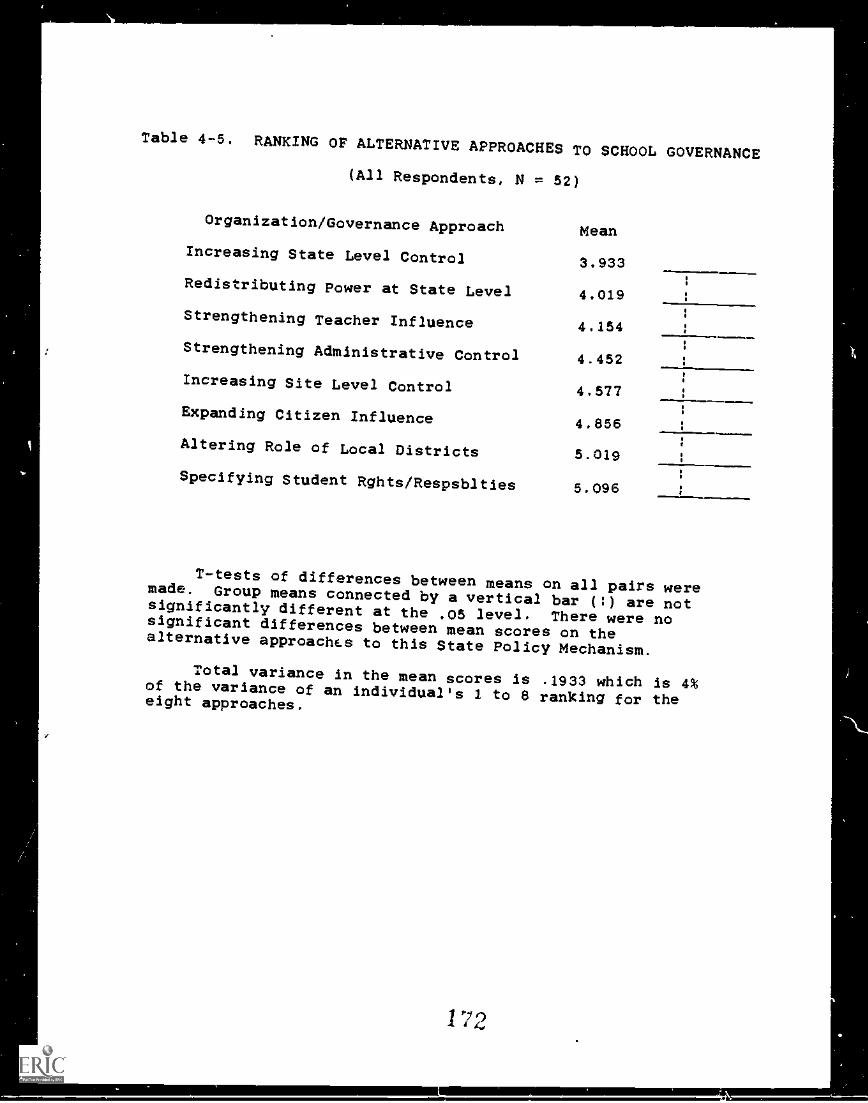
Table 4-5. RANKING OF ALTERNATIVE APPROACHES TO SCHOOL GOVERNANCE
(All Respondents, N = 52)
Organization/Governance Approach Mean
Increasing State Level Control 3.933
Redistributing Power at State Level 4.019
Strengthening Teacher Influence 4.154
Strengthening Administrative Control 4.452
Increasing Site Level Control 4.577
Expanding Citizen Influence 4.856
Altering Role of Local Districts 5.019
Specifying Student Rghts/Respsblties 5.096
I1
II
T-tests of differences between means on all pairs weremade. Group means connected by a vertical bar () are notsignificantly different at the .05 level. There were nosignificant differences between mean scores on thealternative approachLs to this State Policy Mechanism.
Total variance in the mean scores is .1933 which is 4%of the variance of an individual's 1 to 8 ranking for theeight approaches.
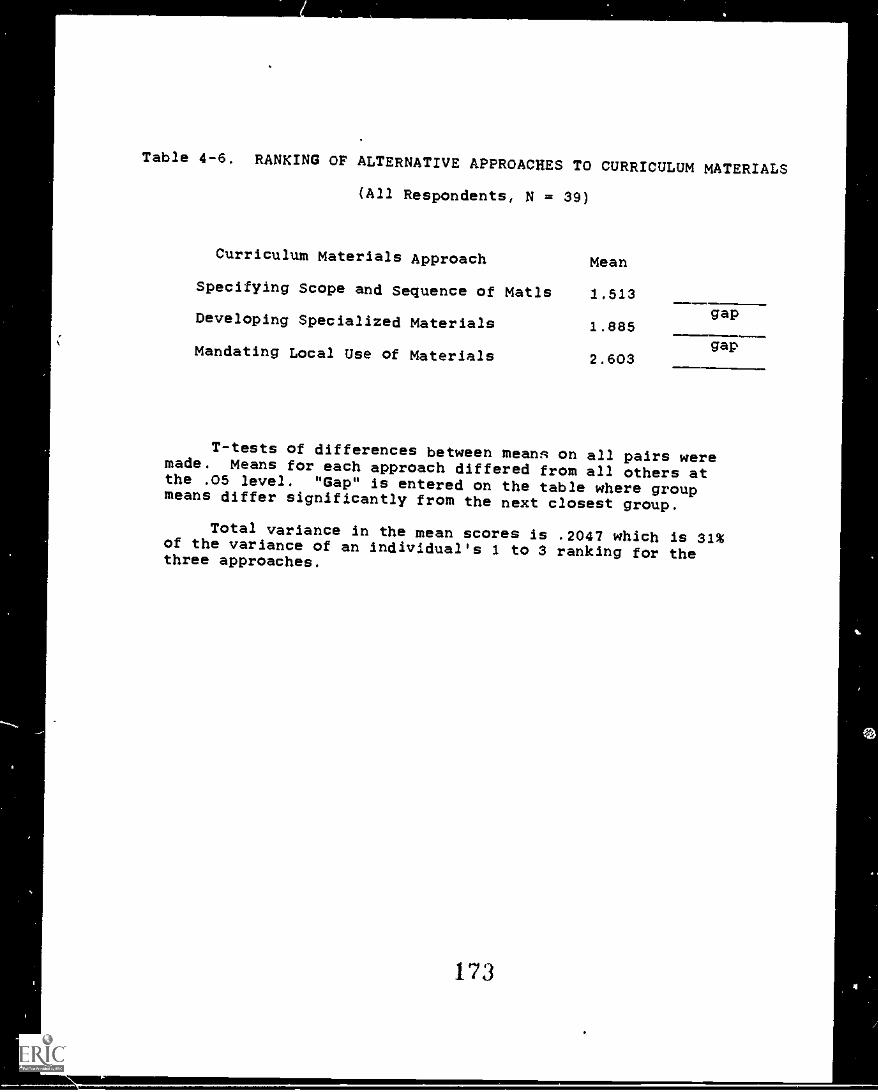
Table 4-6. RANKING OF ALTERNATIVE APPROACHES TO CURRICULUM MATERIALS
(All Respondents, N = 39)
Curriculum Materials Approach Mean
Specifying Scope and Sequence of Matls 1.513
Developing Specialized Materials 1.885
Mandating Local Use of Materials 2.603
gaPwermweam.
gap
T-tests of differences between means on all pairs weremade. Means for each approach differed from all others atthe .05 level. "Gap" is entered on the table where groupmeans differ significantly from the next closest group.
Total variance in the mean scores is .2047 which is 31%of the variance of an individual's 1 to 3 ranking for thethree approaches.
173
Alternative Approaches to School Building Policy. The data shown
in Table 4-7 indicate that there was substantial agreement among
the 38 respondents who reported on alternative approaches taken to
school building and facilities policy making. All agreed that
remediation of structural and other building problems was the most
common approach in this domain. Technical review of local district
building plans and long range planning for state wide building
needs were less frequently identified as hiahly important
approaches in this area, but they ranked ahead of the development
of new capacities. Overall 31% of the variance of a typical
respondent was shared with the total group and reflected in the
profile of group means.
Insert Table 4-7 about here.
To summarize, we found substantial agreements among the 140
respondents in our sample regarding both the relative importance of
the seven state policy mechanisms under study and the alternative
approaches available to state policy makers for pursuing acting
within each policy domain. Agreement on the SPMs included about
47% of all individual variances in ranking, despite the fact that
individuals were asked to report on six different state policy
systems. Agreement on the specific approaches taken within each
Page /V-9
171
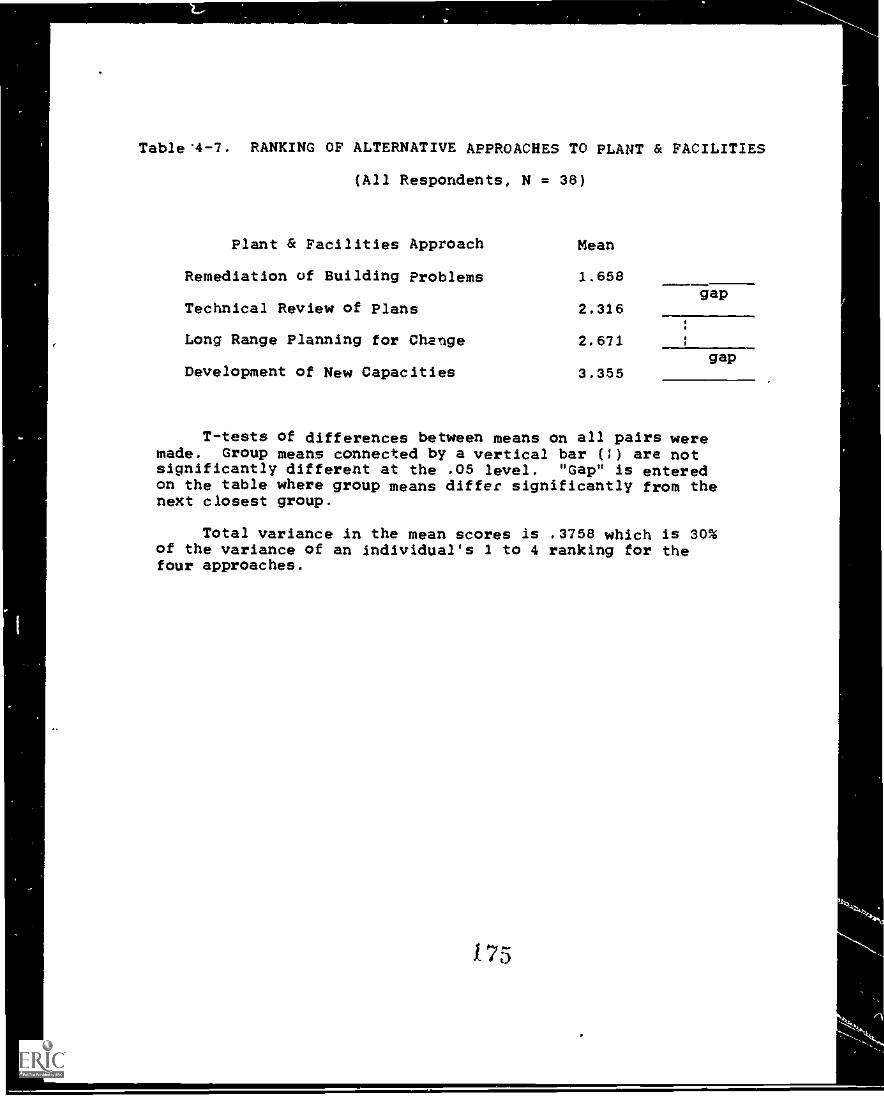
Table'4-7. RANKING OF ALTERNATIVE APPROACHES TO PLANT & FACILITIES
(All Respondents, N = 38)
Plant & Facilities Approach Mean
Remediation of Building Problems 1.658
Technical Review of Plans 2.316
Long Range Planning for Change 2.671
Development of New Capacities 3.355
gap
gap
T-tests of differences between means on all pairs weremade. Group means connected by a vertical bar (1) are notsignificantly different at the .05 level. "Gap" is enteredon the table where group means differ significantly from thenext closest group.
Total variance in the mean scores is .3758 which is 30%of the variance of an individual's 1 to 4 ranking for thefour approaches.
175
policy domains was somewhat less dramatic. Shared variance ranged
from a low of 2% in the governance area to a high of 40% in the
testing domain, with an average shared variance of approximately
26%. During our interviews we were struck by the high level of
consensus among respondents that the policy domains and the
alternative approaches which we presented to them for ranking
represented a fairly complete set of alternative state policy
mechanisms and approaches.
Table 4-8 presents the results of one-way ANOVA tests interstate
differences on the alternative approaches within each of the seven
basic policy domains. A close look at the data on this table
reveals highly significant differences between the states on 14 of
the 33 specific approaches identified for our respondents. Four
additional approaches have interstate differences that nearly meet
the traditional probability of less than .05 and could be
considered potentially significant. Only in the curriculum
materials domain were there no interstate differences in approach
rankings.
Insert Table 4-8 about here.
As indicated by the multiple discriminant analysis presented in
Table 4-9:
Page IV-10
176
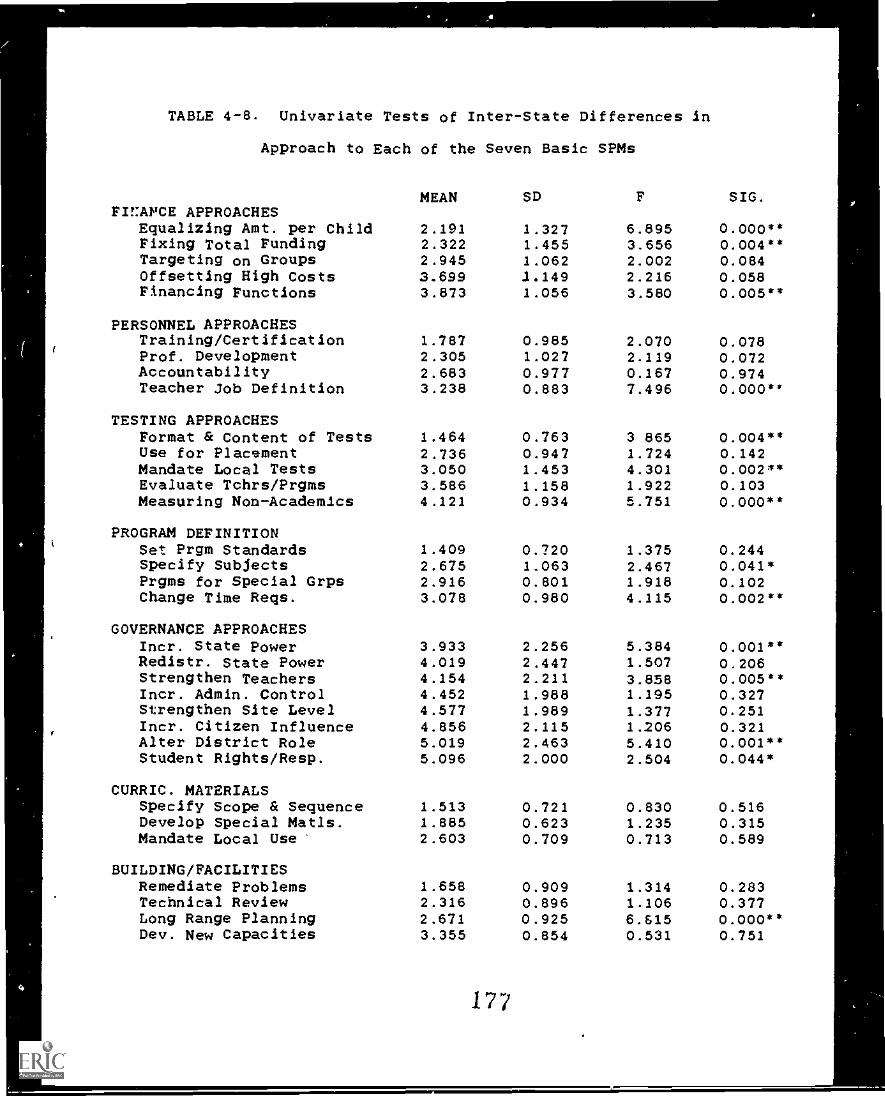
.
4
0.001**0.2060.005**0.3270.2520.3210.001**0.044*
0.5160.3150.589
0.2830.3770.000**0.751
(
I
r
TABLE 4-8. Univariate Tests of Inter-State Differences in
Approach to Each of the Seven Basic SPMs
FInAPCE APPROACHESEqualizing Amt. per ChildFixing Total FundingTargeting on GroupsOffsetting High CostsFinancing Functions
PERSONNEL APPROACHESTraining/CertificationProf. DevelopmentAccountabilityTeacher Job Definition
TESTING APPROACHESFormat & Content of TestsUse for PlacementMandate Local TestsEvaluate Tchrs/PrgmsMeasuring Non-Academics
MEAN SD F SIG.
2.191 1.327 6.895 0.000**2.322 1.455 3.656 0.004**2.945 1.062 2.002 0.0843.699 1.149 2.226 0.0583.873 1.056 3.580 0.005**
1.787 0.985 2.070 0.0782.305 1.027 2.119 0.0722.683 0.977 0.167 0.9743.238 0.883 7.496 0.000**
1.464 0.763 3 865 0.004**2.736 0.947 1.724 0.1423.050 1.453 4.301 0.002**3.586 1.158 1.922 0.1034.121 0.934 5.751 0.000**
PROGRAM DEFINITIONSet Prgm Standards 1.409 0.720 1.375 0.244Specify Subjects 2.675 1.063 2.467 0.041*Prgms for Special Grps 2.916 0.801 1.918 0.202Change Time Reqs. 3.078 0.980 4.115 0.002**
GOVERNANCE APPROACHESIncr. State PowerRedistr. State PowerStrengthen TeachersIncr. Admin. ControlStrengthen Site LevelIncr. Citizen InfluenceAlter District RoleStudent Rights/Resp.
CURRIC. MATERIALSSpecify Scope & SequenceDevelop Special Matls.Mandate Local Use
BUILDING/FACILITIESRemediate ProblemsTechnical ReviewLong Range PlanningDev. New Capacities
3.933 2.256 5.3844.019 2.447 1.5074.154 2.211 3.8584.452 1.988 1.2954.577 1.989 1.3774.856 2.115 1.2065.019 2.463 5.4105.096 2.000 2.504
1.513 0.721 0.8301.885 0.623 1.2352.603 0.709 0.713
1.658 0.909 1.3142.316 0.896 1.1062.671 0.925 6.6153.355 0.854 0.531
177
I
MDA Finding #1: Among the very substantial differences in the
ways states attend to issues of school finance policy, the contrast
between equalization and the establishment of overall funding
levels for education is the most prominent.
Insert Table 4-9 about here.
West Virginia, just recently placed under court order, reports
that equalization is the number one finance policy priority.
California, by contrast, was recently found to have adequately
complied with the terms of the Serrano decision on equalization and
reports that raising the overall level of funding is the primary
thrust of recent finance policy decisions in that state. As
indicated by the group centroid scores for the first multiple
discriminant function in Table 4-9, and confirmed in the group mean
scores at the bottom of the table, the other four states range
between the extremes found in West Virginia and California.
Wisconsin joins West Virginia in ranking equalization ahead of the
problem of setting an overall funding level. The other three
states join California respondents in reversing this order. This
finding is graphically displayed in Figure 4-1. Note that only
West Virginia and Wisconsin are to the right of center on the
horizontal axis, indicating positive centroid scores for multiple
discriminant function #I. We had expected somewhat greater concern
with funding level issues to be report in Arizona: that state has
Page IV-II
178
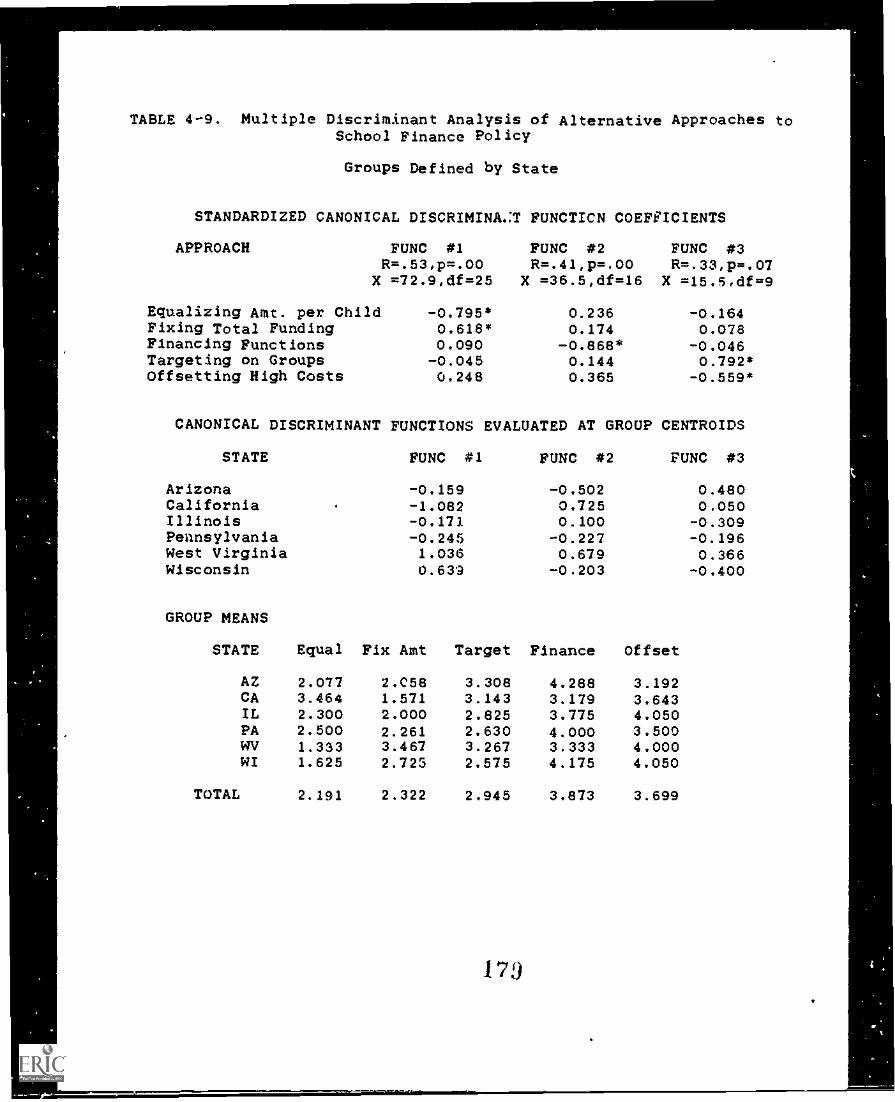
TABLE 4-9. Multiple Discriminant Analysis of Alternative Approaches toSchool Finance Policy
Groups Defined by State
STANDARDIZED CANONICAL DISCRIMINA.:T FUNCTICN COEFFICIENTS
APPROACH FUNC *1 FUNC *2 FUNC *3R=.53,p=.00
X =72.9,df=25R=.41,p=.00
X =36.5,df=16R=.33,p=.07
X =15.6,df=9
Equalizing Amt. per Child -0.795* 0.236 -0.164Fixing Total Funding 0.618* 0.174 0.078Financing Functions 0.090 -0.868* -0.046Targeting on Groups -0.045 0.144 0.792*Offsetting High Costs 0.248 0.365 -0.559*
CANONICAL DISCRIMINANT FUNCTIONS EVALUATED AT GROUP CENTROIDS
STATE FUNC *1 FUNC *2 FUNC *3
Arizona -0.159 -0.502 0.480California -1.082 0.725 0.050Illinois -0.171 0.100 -0.309Pennsylvania -0.245 -0.227 -0.196West Virginia 1.036 0.679 0.366Wisconsin 0.639 -0.203 -0.400
GROUP MEANS
STATE Equal Fix Amt Target Finance Offset
AZ 2.077 2.C58 3.308 4.288 3.192CA 3.464 1.571 3.143 3.179 3.643IL 2.300 2.000 2.825 3.775 4.050PA 2.500 2.261 2.630 4.000 3.500WV 1.333 3.467 3.267 3.333 4.000WI 1.625 2.725 2.575 4.175 4.050
TOTAL 2.191 2.322 2.945 3.873 3.699
170
passed both constitutional and statutory limits on educational
expenditures.
Insert Figure 4-1 about here.
Close behind the differences between states in their attention to
the problems of equalization versus overall funding levels is a
disagreemenc over how much attention is being given to the fiscal
policy approach we have called "flInancing." That is,
MDF Finding *2: While no state views this approach as a high
priority concern, there are substantial differences in states'
willingness to earmark school funds for particular types of
services or functions.
California gives this approach third place among the five
alternative appreaches, Arizona, Wisconsin and Pennsylvania put it
last. The California ranking is actually rather lower than our
interview data would ruggest. This state's 1983 omnibus education
bill (SB 813) provided money for a broad array of specific district
budget items ranging from textbooks to teacher salaries.
West Virginia joins California in placing the financing approach
third. In the West Virginia case, however, top prioriti is being
given to fiscal equalization and to targeting funds on specific
student groups. Clearly, West Virginia school finance is dominated
by the problems of inequity and disadvantage that dominated school
finance policy debates during the 1970s in the larger more
Page 1V-12
180
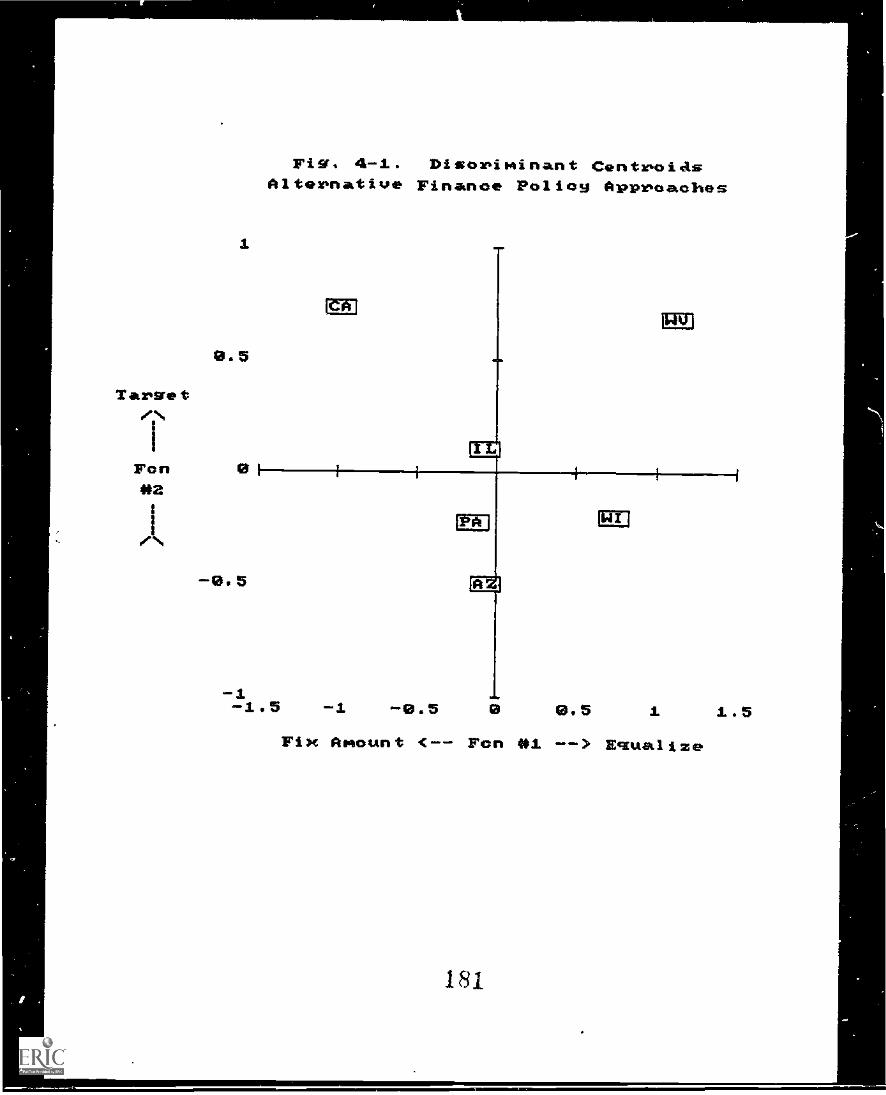
Fig. 4-1. Disoriminant CentroiasAlternative Finance Policy Approaches
iM
Target?I
Fon*2
1
1
/NEn
-1-1.5 -1 -0.5 0 8.5 1 1.5
Fix Amount <-- Fon *1 --> Eclualize
181
'.
-
1
Industrialized states like California, Florida, New Jersey and
Texas.
The third discriminant function shown in Table 4-9 is weaker in
explanato:y power and less statistically reliable than either of
the other two. It provides potentially Important Insight into
finance policy debates, however, so we cautiously interpret it
here. As indicated by the function coefficients and state centrold
scores:
MDF Finding *3: When developing categorical control over fund
distribution, states tend to differ over whether the funds should
be targeted on particular student populations or used to offset the
burdensome costs of associated with particular school operation
problems.
Generally, the states are giving greater priority to targeting
funds on special student needs. Arizona is an exception, however.
Arizona policy makers express the view that state policy Is giving
more attention to offsetting the extra costs associated with such
problems as rural transportation and declining enrollments. We
hasten to point out that Arizona has recently adopted a fairly
strong bi-lingual education program mandate, and has incorporated
extra funds for special education students into their school
finance formula. In the first case the policy is not tied directly
to categorical funding, however, and since the special education
funding Is built into the general finance formula it may not be
widely re,-:gnized as a process of targeting funds on special
populations.
Page IV-13
1S2
11,
Wisconsin and Illinois are at the other end of the policy
spectrum. They each give targeting a relatively prominent place in
school finance -- Wisconsin policy makers ranked this approach
second, behind equalizing.
As can be seen from the special 1.1a,..3 of the California centroid
in Table 4-9, California policy makers have been so deeply involved
in the fallout from the infamous Proposition 13 property tax relief
referendum in 1978 that they are indifferent to the ranking of all
finance policy alternatives save the one concerned with fixing the
overall level of school funding. They place this approach more
than 1.5 ranks above all other alternatives.
Different Approaches to Personnel Policy. As indicated in Table
4-10, personnel policy differences among the sample states produced
one very significant discriminant function, and a second much
weaker but still quite suggestive one. Substantively, the first
multiple discriminant function is dowinated by the amount of
attention given to teacher job definition policies (i.e., career
ladders, differentiated staffing, mentor teacher programs, etc.).
This means that;
MDF Finding #4: While not generally prominent issues, interest
in teacher job definition policies vary quite substantially from
state to state.
Insert Table 4-10 about here.
Page IV-14
183
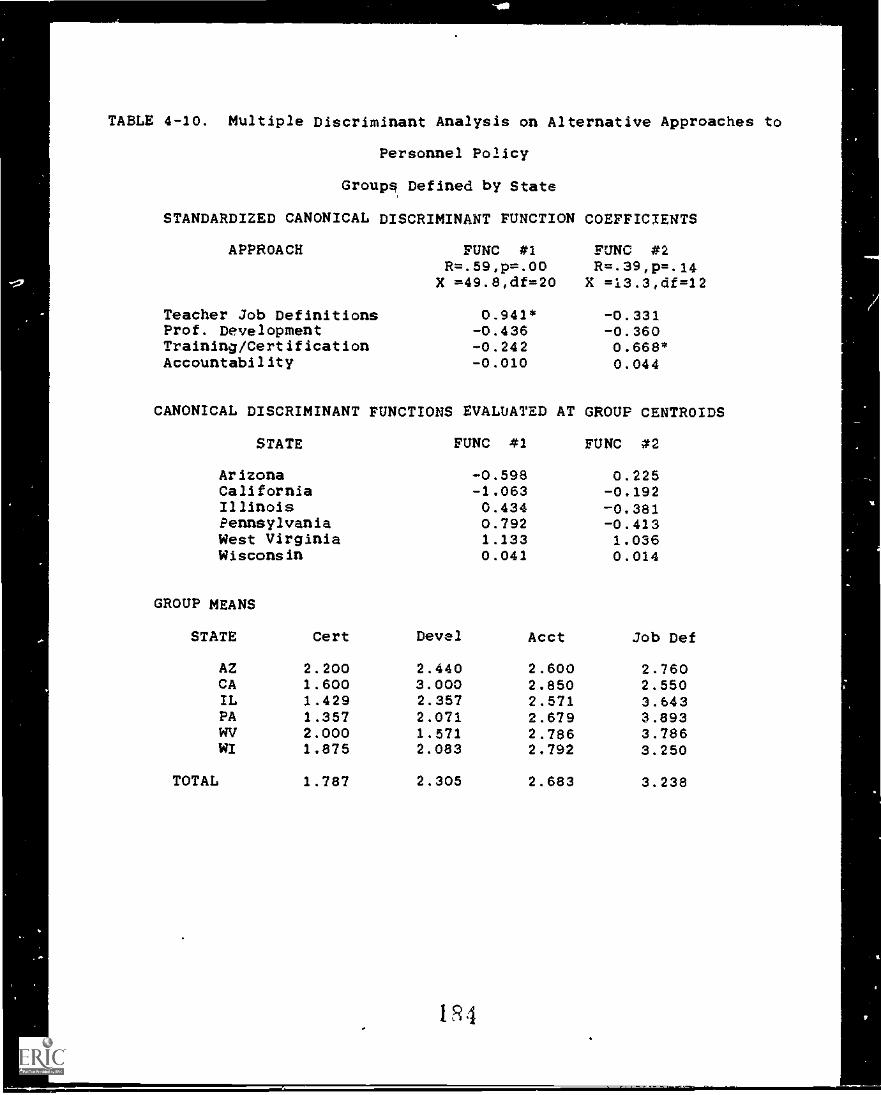
TABLE 4-10. Multiple Discriminant Analysis on Alternative Approaches to
Personnel Policy
Groups Defined by State
STANDARDIZED CANONICAL DISCRIMINANT FUNCTION COEFFICIENTS
APPROACH FUNC #1R=.59,p=.00X =49.8,df=20
FUNC #2R=.39,p=.14
X =13.3,df=12
Teacher Job Definitions 0.941* -0.331Prof. Development -0.436 -0.360Training/Certification -0.242 0.668*Accountability -0.010 0.044
CANONICAL DISCRIMINANT FUNCTIONS EVALUATED AT GROUP CENTROIDS
STATE FUNC 41 FUNC 02
Arizona -0.598 0.225California -1.063 -0.192Illinois 0.434 -0.381Pennsylvania 0.792 -0.413West Virginia 1.133 1.036Wisconsin 0.041 0.014
GROUP MEANS
STATE Cert Devel Acct Job Def
AZ 2.200 2.440 2.600 2.760CA 1.600 3.000 2.850 2.550IL 1.429 2.357 2.571 3.643PA 1.357 2.071 2.679 3.893WV 2.000 1.571 2.786 3.786W/ 1.875 2.083 2.792 3.250
TOTAL 1.787 2.305 2.683 3.238
1R4
Overall, respondents ranked the job definition approach dead
last, well behind the other three approaches they were asked to
review. California respondents did not follow this general
tendency, however. They reported that job definition polilies were
second in importance -- exceeded only by issues of training and
certification. Arizona respondents were also less inclined to view
job definition policies as unimportant. Arizona was unique,
however, in its tendency to view all of the teacher policy
approaches as about equally important -- with the first place mean
of 2.20 for preservice training and certification only .56 ranks
above their last place 2.76 for the job definition policy approach.
Contrast tNis with the strong rank order preferences in
Pennsylvania where the first plane preservice certification
policies were ranked a full 2.5 ranks above their last place job
definition policy actions. (Recall from the last chapte:', however,
that Arizona respondents ranked the overall attention level for all
personnel policy questions much higher than did the other states).
The second multiple discriminant function shown in Table 4-10,
while not a particularly reliable indicator (the p-value is only
.14) suggests that:
MDF Finding #5: There is a tendency for states to choose between
a pre-service certification and training focus for teacher
personnel policy and an emphasis on the professional development
and job re-definition approaches.
Page IV-15
As indicated in Figure 4-2, and confirmed in the mean scores
shown at the bottom of Table 4-10, West Virginia gives strong
emphasis to professional development (mor.2 than half a rank above
any other state). Pennsylvania, Illinois and California, by
contrast, report more interest in pre-service training and
certification.
Insert Figure 4-2 about here.
Different Approaches to Student Testing. Table 4-11 reports the
differemzes among our sample states in their approaches to student
and assessment policies. Interpreting the three multiple
discriminant functions show in this table is a bit complicated
because variations in state handling of the most prominent approach
to testing policy -- specification of the format or content of
statewide testing programs -- plays a substantial role in all three
of the functions. (That is, this policy approach has a relatively
large coefficient in each discriminant function). Careful scrutiny
of the function coefficients, state centroids and mean ranking
scores for the five different approaches to testing policy is well
worth the effort, however. First, we note that,
MDF Finding *6: The most important differences in state testing
policies related to the specification of test content. Some states
are more likely to rely on local district content decisions than
are the others.
Page IV-16
1S6
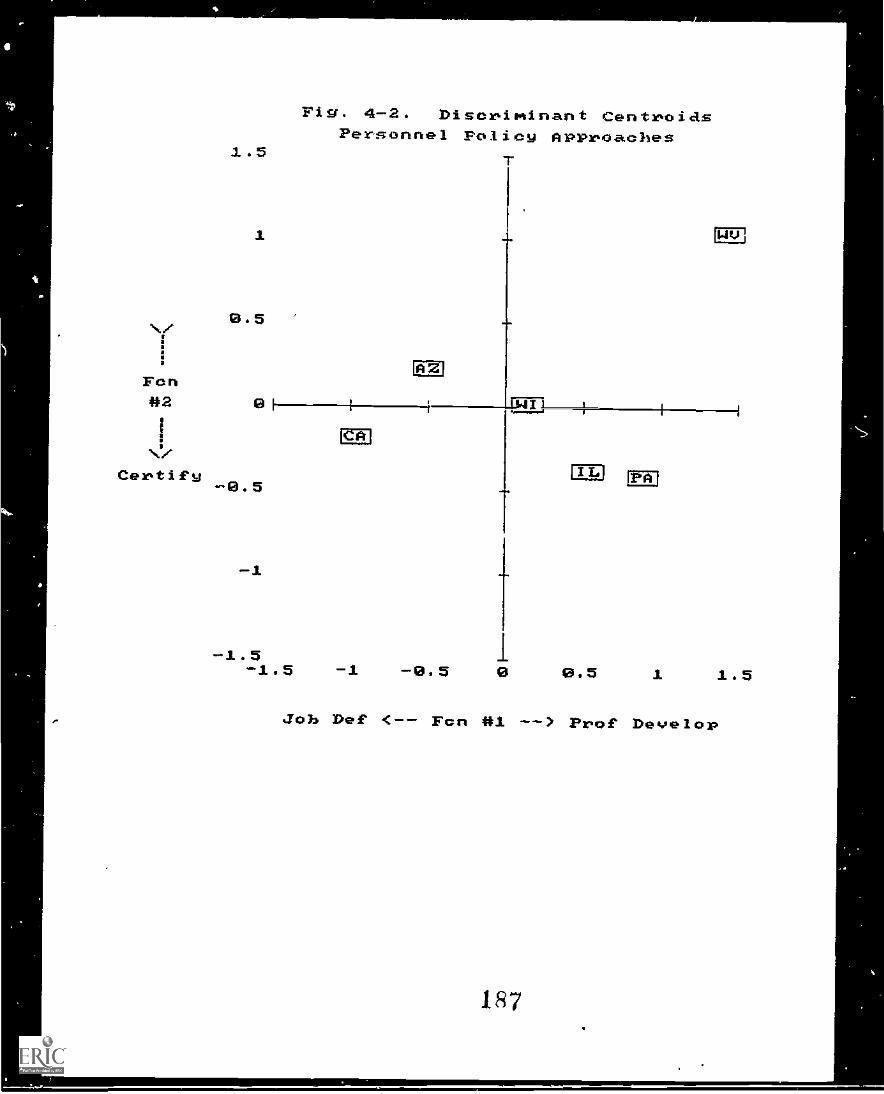
I.
Fig. 4-2. Discriminant CentroiasPersonnel Policy APPm'oacbes
1.5
[PT
0.5/Fon#2 0 I-
L.11
Certify
-1
CEI
tLI
-1.5-1.5 -1 -0. 5 0 0.5 1 1.5
Job Def <-- Fan #1 --) Prof Develop
187
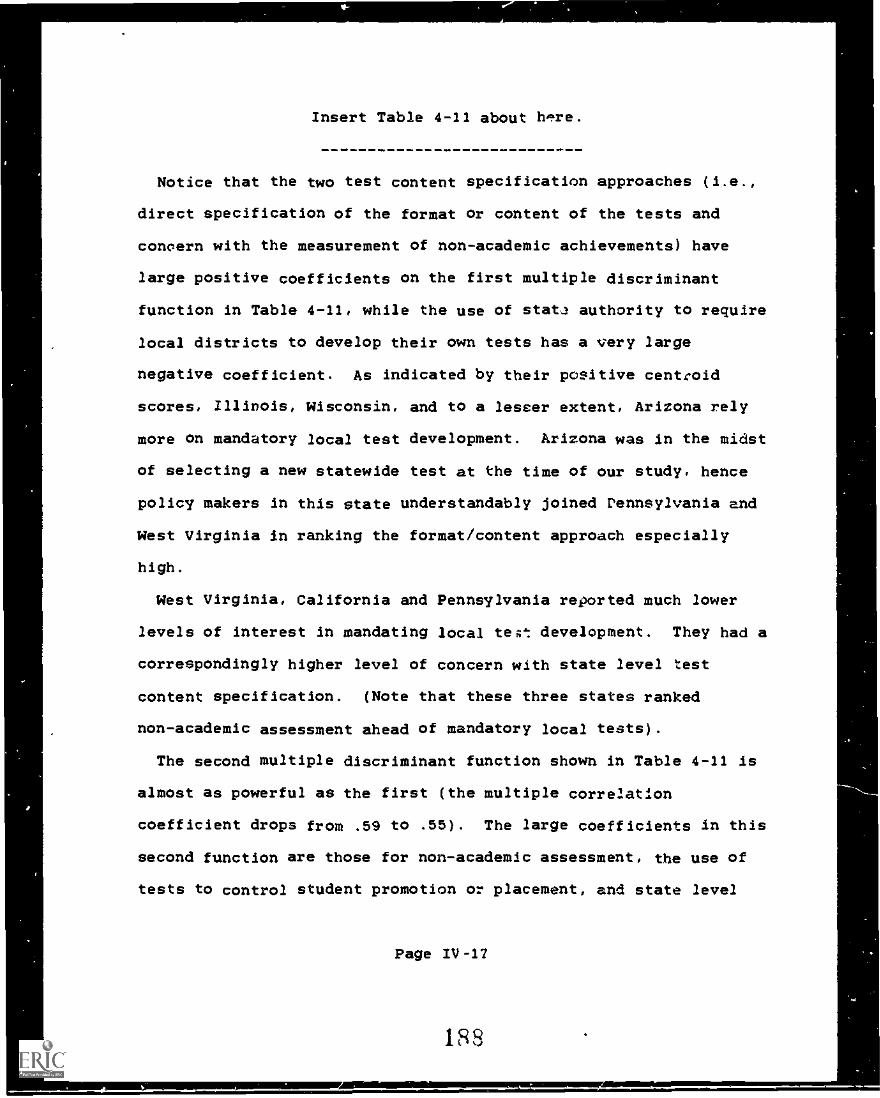
Insert Table 4-11 about hg..re.
Notice that the two test content specification approaches (i.e.,
direct specification of the format or content of the tests and
conoern with the measurement of non-academic achievements) have
large positive coefficients on the first multiple discriminant
function in Table 4-11, while the use of stat.1 authority to require
local districts to develop their own tests has a very large
negative coefficient. As indicated by their positive centroid
scores, Illinois, Wisconsin, and to a lesser extent, Arizona rely
more on mandatory local test development. Arizona was in the midst
of selecting a new statewide test at the time of our study, hence
policy makers in this state understandably joined Pennsylvania and
West Virginia in ranking the format/content approach especially
high.
West Virginia, California and Pennsylvania reported much lower
levels of interest in mandating local tee: development. They had a
correspondingly higher level of concern with state level test
content specification. (Note that these three states ranked
non-academic assessment ahead of mandatory local tests).
The second multiple discriminant function shown in Table 4-11 is
almost as powerful as the first (the multiple corre2ation
coefficient drops from .59 to .55). The large coefficients in this
second function are those for non-academic assessment, the use of
tests to control student promotion or placement, and state level
Page /V-17
188
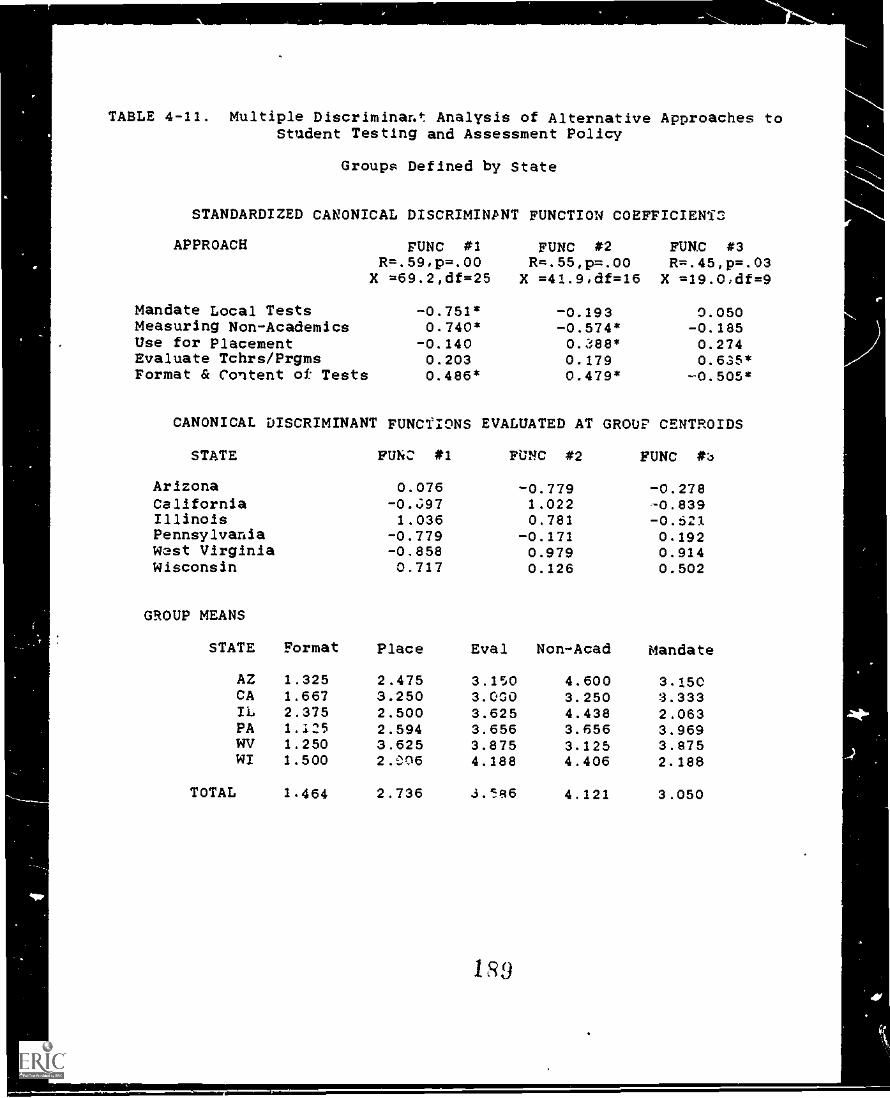
TABLE 4-11, Multiple Discriminant Analysis of Alternative Approaches toStudent Testing and Assessment Policy
Groupg Defined by State
STANDARDIZED CANONICAL DISCRIMINPNT FUNCTION COEFFICIENT::
APPROACH FUNC #1R=.59,p=.00
X =69.2,df=25
FUNC #2R=.551p=.00
X =41.91df=16
FUNC #3R=.45,p=.03
X =19.0,df=9
Mandate Local Tests -0.751* -0.193 0.050Measuring Non-Academics 0.740* -0.574* -0.185Use for Placement -0.140 0.388* 0.274Evaluate Tchrs/Prgms 0.203 0.179 0.635*Format & Content of: Tests 0.486* 0.479* -0.505*
CANONICAL DISCRIMINANT FUNCTIONS EVALUATED AT GROUP CENTROIDS
STATE FUNC #1 FUNC #2 FUNC #:1
Arizona 0.076 -0.779 -0.278California -0..397 1.022 -0.839Illinois 1.036 0.781 -0.521Pennsylvania -0.779 -0.171 0.192Wast Virginia -0.858 0.979 0.914Wisconsin 0.717 0.126 0.502
GROUP MEANS
STATE Format Place Eval Non-Acad Mandate
AZ 1.325 2.475 3.150 4.600 3.150CA 1.667 3.250 3.000 3.250 3.333IL 2.375 2.500 3.625 4.438 2.063PA 1.125 2.594 3.656 3.656 3.969WV 1.250 3.625 3.875 3.125 3.875WI 1.500 2.06 4.188 4.406 2.188
TOTAL 1.464 2.736 3.86 4,121 3.050
specification of state format and content. Thus it is appropriate
to conclude that:
MDF Finding #7: States differ significantly in their inclination
to use stated defined academic achievement tests to assess student
educational progress.
As indicated by their centroid scores, California, West Virginia,
Illinois and to some extent even Wisconsin policy makers view state
testing programs as less useful for monitoring academic progress
than those in Arizona and Pennsylvania. Illinois respondents
reported a higher than average ranking for the use of tests to
control student placement and promotion, but they also were the
only group to report that local test development takes precedence
over statewide testing programs.
The pattern of state preferences on these two testing issues can
be seen graphically in Figure 4-3. Note that California and West
Virginia respondents reported similar views, indicating that state
level testing programs are used to provide information rather than
to influence student placement and promotion decisions. Arizona
was farthest from these tvo states on the placement question:
Illinois held the k'st divergent view on the matter of local
control over test content.
Insert Figure 4-3 about here.
The third multiple discriminant function shown in Table 4-11 is
also highly significant (p = .03) and quite powerful (multiple R =
Page IV-lS
190
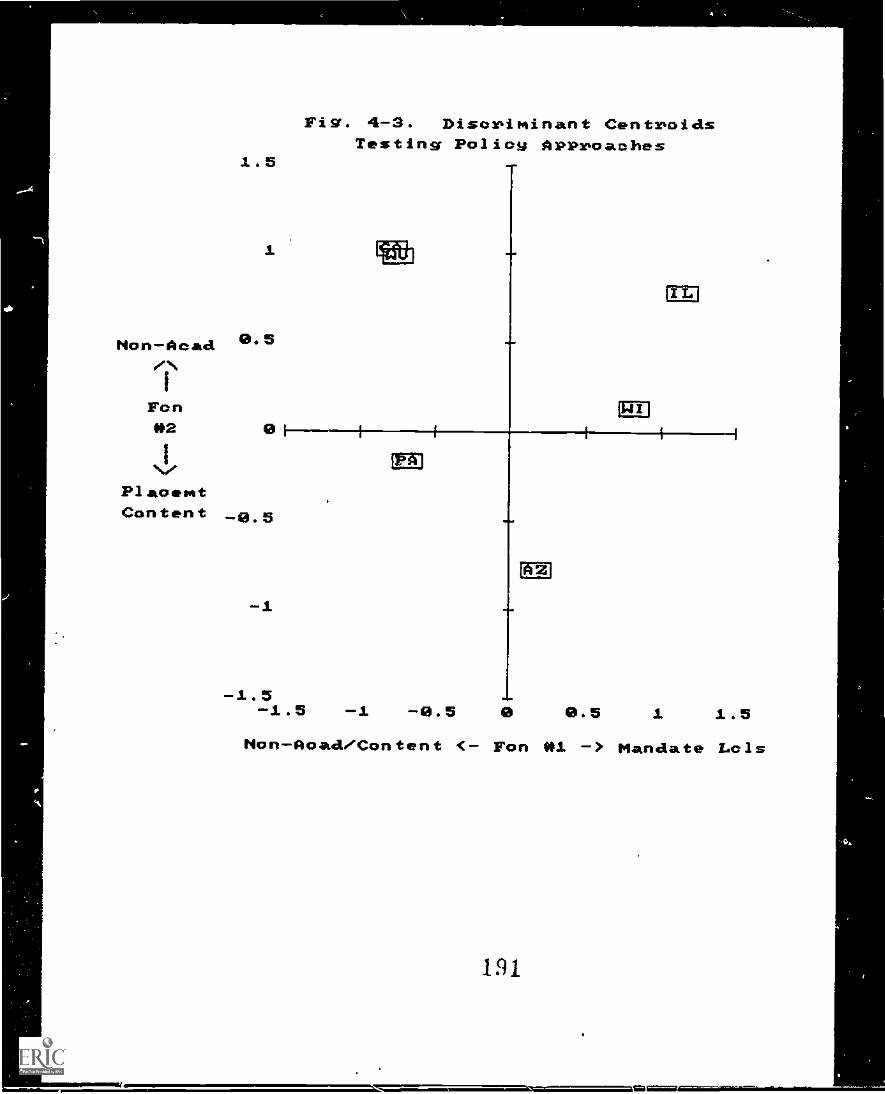
Mon-Acad/N
1
Fon*2
I\/PlaoomtContent
Fig. 4-3. Discriminant CentroidsTesting Policy Approaches
1.5 -
0.5
8
-0.5
-1
r..7'2Wki.la la WNW
mlim
aii
LIM
ftl]
Mibl
MI
-1.5 --1.5 -1 -0.5 e 0.5 1 1.5
Mon-Aoad/Content <- Fon *1 -> Mandate Lols
191
.45, meaning that about 20% of variance in responses is explained
by it). The two large coefficients for this 'unction are those for
using test scores to evaluate school programs or teachers and, once
again, the question of whether test format and content is being
decided at the state level. This indicates that:
MDF Finding C.1: While all states are giving substantially
greater attention to specifying the content or format of testing
programs than to the use of tests for evaluating school
performance, there are significant differences among the states in
their incl:Ination to concentrate on how test results are to be
used.
As indicated by the state centroid scores for this third
function. California tends to give the most emphasis to the
utilization of tests for personnel and program evaluation. West
Virginia and Wisconsin give the least amount of attention to this
policy approach.
While it is difficult to hold the results of all three testing
policy discriminant function results in mind at once, they vividly
describe the basic options available t,..e all states. California is
unique in its concern for broadening test content to include
non-academic assessments and for its stronger than average interest
in using tests to evaluate school and teacher performance rather
than to control student pl*cement. Only Californians reported the
s,hol/teacher evaluation fwaction to be more prominent than the
studLnt assignment one.
Page 1V-19
192
SeV
rt.4
}AP
.&ar
4#%
.,41
,1-4
.4%
,°v4
40P 44
0
1.0
mm
1.5
mrn
2.0
mm
8 o 3 3
INE
)11
111=
1111
13
Frr
rrir
r r
77.1
lir.
or
ifro
ivIN
iTh,
AB
CD
EF
GH
IJK
UO
N0P
QR
ST
WO
HX
YZ
abcd
eleh
Olm
nom
stuv
wxy
z123
4%/8
90
AB
CD
EF
GH
1JK
LMN
OP
QR
ST
UV
WX
YZ
abcd
efgh
tjklm
nopq
rstu
vwxy
z12
3456
7890
West Virginia policy makers were unique in their lack of interest
in test utilization for either student placement or school program
evaluation. Only West Virginia respondents ranked non-academic
assessment policies as more important than both placement and
evaluation usage. Illinois policy makers are uniquely committed to
local control over test content. Only this state ranked mandates
for local test development ahead of establishing state control over
the format or content of tests. Wisconsin policy makers generally
shared the Illinois view, but they reperted that the balance of
attention is shifted somewhat toward state level test
specification.
Arizona is unique in its emphasis on tests utilization for
evaluation of student progress combined with a rejection of
non-academic assessments. This state expresses the view that
schools are intended to produce academic achievement and that
testing that achievement should be a prominent state policy
concern. Moreover, Arizonans believe test results should control
both student progress and school evaluation more strongly than
policy makers in other states. Pennsylvania largely shares the
Arizona pattern, but gives greater emphasis to state level test
content specification and commensurately less attention to local
test development.
Different Approaches to School Program Definition. Though
described by most policy makers as receiving the least amount of
attention,
Page IV-20
133
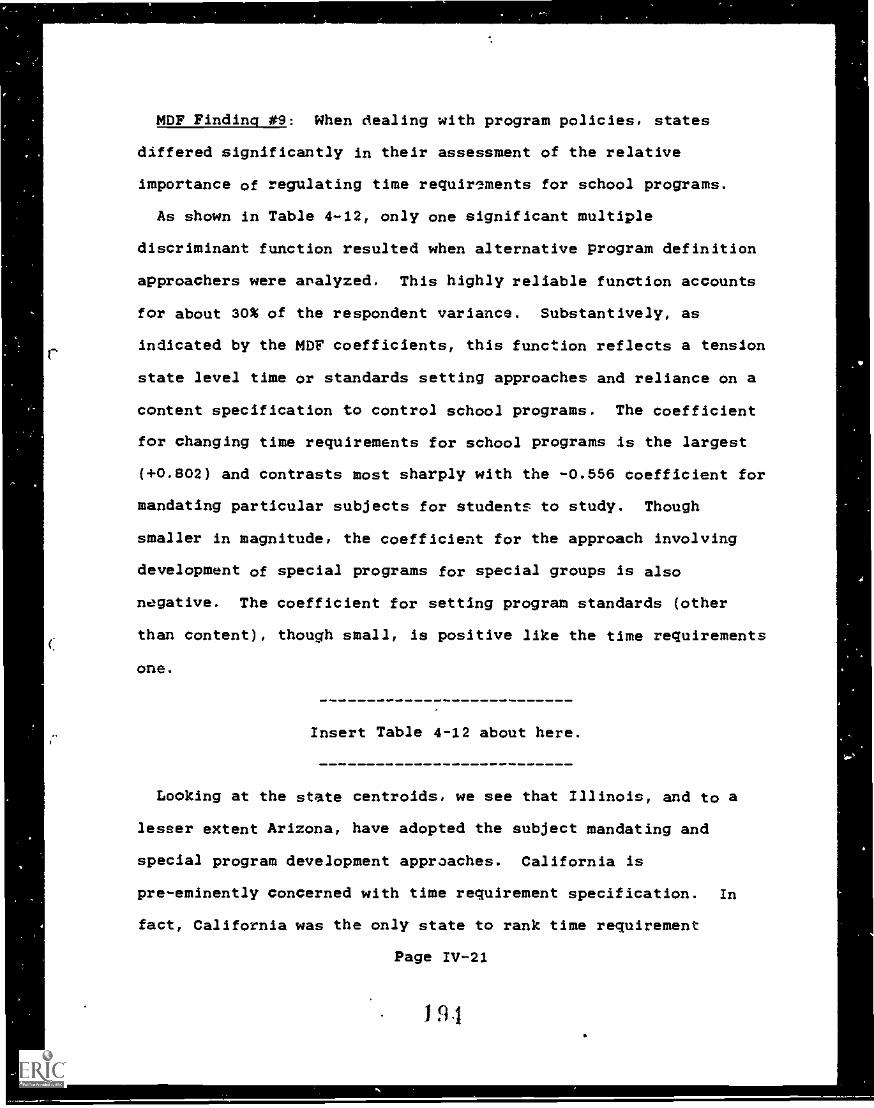
MDF Finding #9: When dealing with program policies, states
differed significantly in their assessment of the relative
importance of regulating time requirements for school programs.
As shown in Table 4-12, only one significant multiple
discriminant function resulted when alternative program definition
approachers were analyzed. This highly reliable function accounts
for about 30% of the respondent variance. Substantively, as
indicated by the MDF coefficients, this function reflects a tension
state level time or standards setting approaches and reliance on a
content specification to control school programs. The coefficient
for changing time requirements for school programs is the largest
(+0.802) and contrasts most sharply with the -0.556 coefficient for
mandating particular subjects for students to study. Though
smaller in magnitude, the coefficient for the approach involving
development of special programs for special groups is also
negative. The coefficient for setting program standards (other
than content), though small, is positive like the time requirements
one.
Insert Table 4-12 about here.
Looking at the state centroids, we see that Illinois, and to a
lesser extent Arizona, have adopted the subject mandating and
special program development approaches. California is
pre-eminently concerned with time requirement specification. In
fact, California was the only state to rank time requirement
Page IV-21
I 9,1
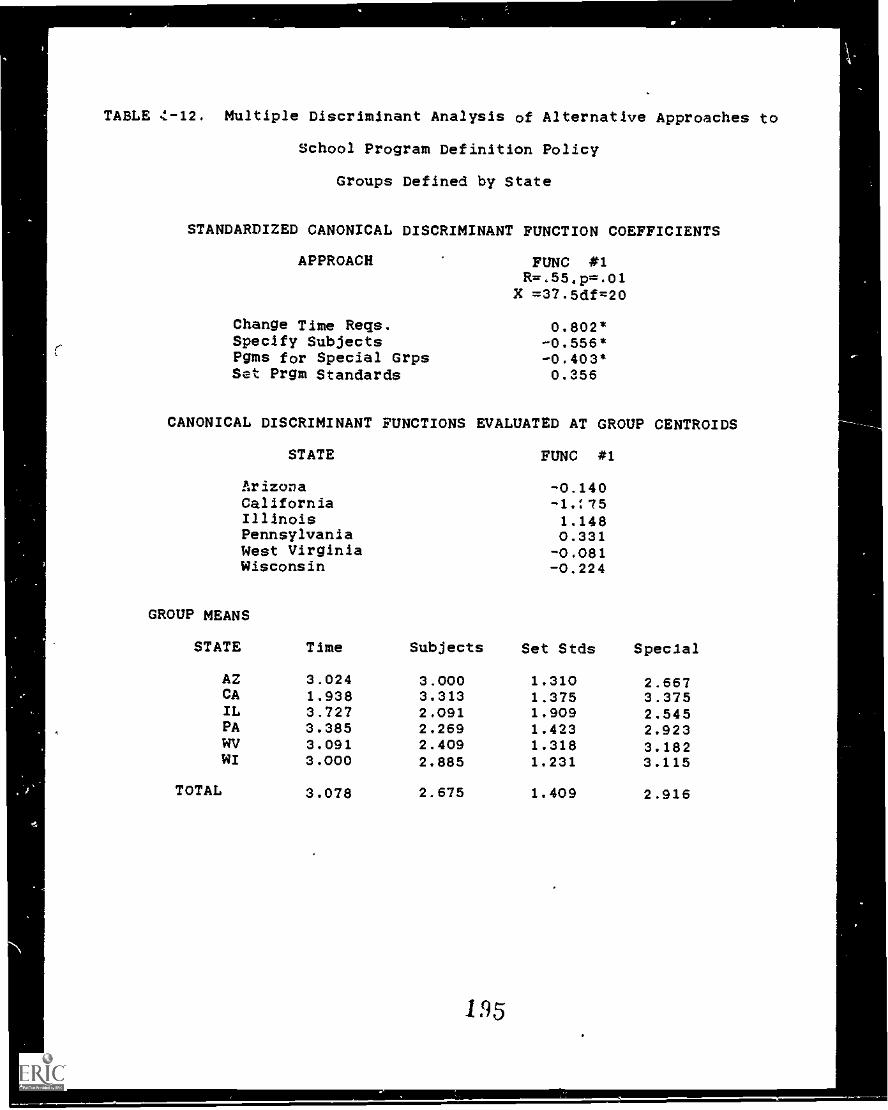
TABLE 4.-12. Multiple Discriminant Analysis of Alternative Approaches to
School Program Definition Policy
Groups Defined by State
STANDARDIZED CANONICAL DISCRIMINANT FUNCTION COEFFICIENTS
APPROACH FUNC #1R=.551p=.01X =37.5df=20
Change Time Reqs. 0.802*Specify Subjects -0.556*Pgms for Special Grps -0.403*Set Prgm Standards 0.356
CANONICAL DISCRIMINANT FUNCTIONS EVALUATED AT GROUP CENTROIDS
STATE FUNC *1
Arizona -0.140CaliforniaIllinois 1.148Pennsylvania 0.331West Virginia -0.081Wisconsin -0.224
GROUP MEANS
STATE Time Subjects Set Stds Special
AZ 3.024 3.000 1.310 2.667CA 1.938 3.313 1.375 3.375IL 3.727 2.091 1.909 2.545PA 3.385 2.269 1.423 2.923WV 3.091 2.409 1.318 3.182WI 3.000 2.885 1.231 3.115
TOTAL 3.078 2.675 1.409 2.916
1 95
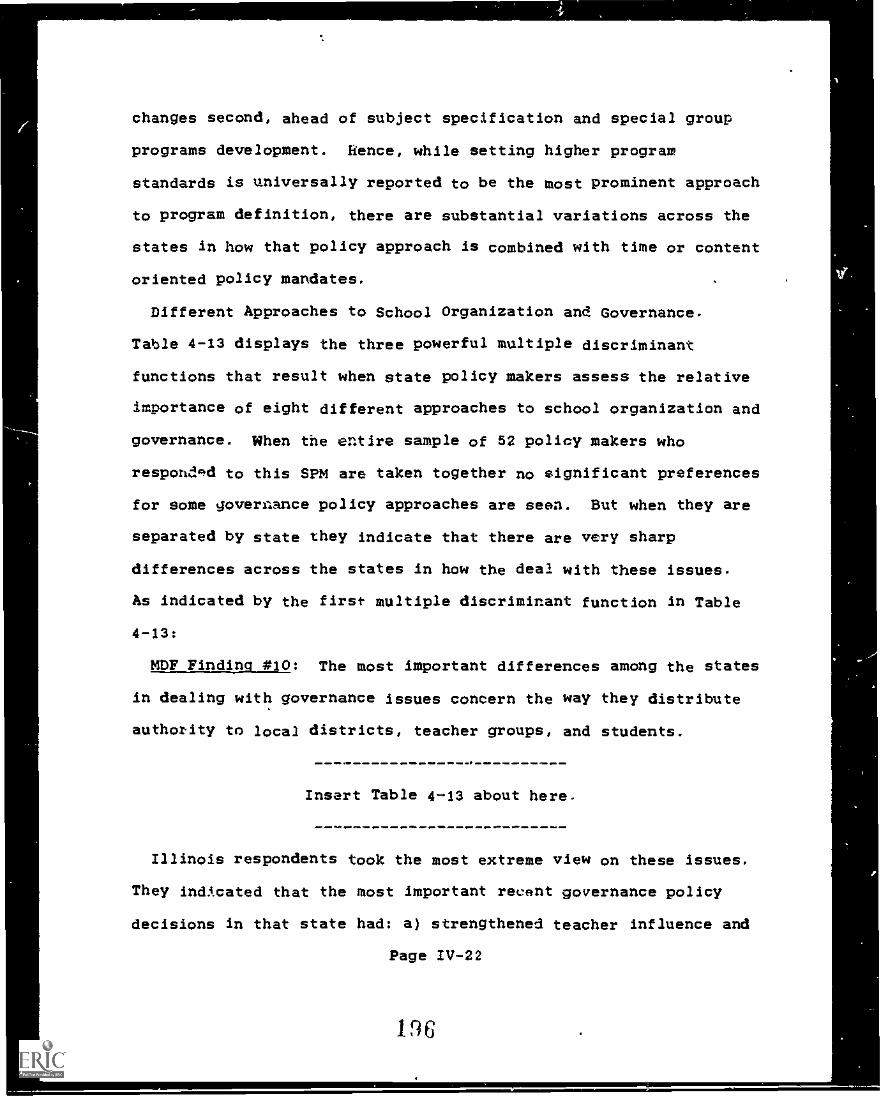
changes second, ahead of subject specification and special group
programs development. Hence, while setting higher program
standards is universally reported to be the most prominent approach
to program definition, there are substantial variations across the
states in how that policy approach is combined with time or content
oriented policy mandates.
Different Approaches to School Organization and Governance.
Table 4-13 displays the three powerful multiple discriminant
functions that result when state policy makers assess the relative
importance of eight different approaches to school organization and
governance. When the entire sample of 52 policy makers who
responded to this SPM are taken together no significant preferences
for some governance policy approaches are seen. But when they are
separated by state they indicate that there are very sharp
differences across the states in how the deal with these issues.
As indicated by the first multiple discriminant function in Table
4-13:
MDF Finding #10: The most important differences among the states
in dealing with governance issues concern the way they distribute
authority to local districts, teacher groups, and students.
Insert Table 4-13 about here.
Illinois respondents took the most extreme view on these issues.
They indAcated that the most important recent governance policy
decisions in that state had: a) strengthened teacher influence and
Page IV-22
196
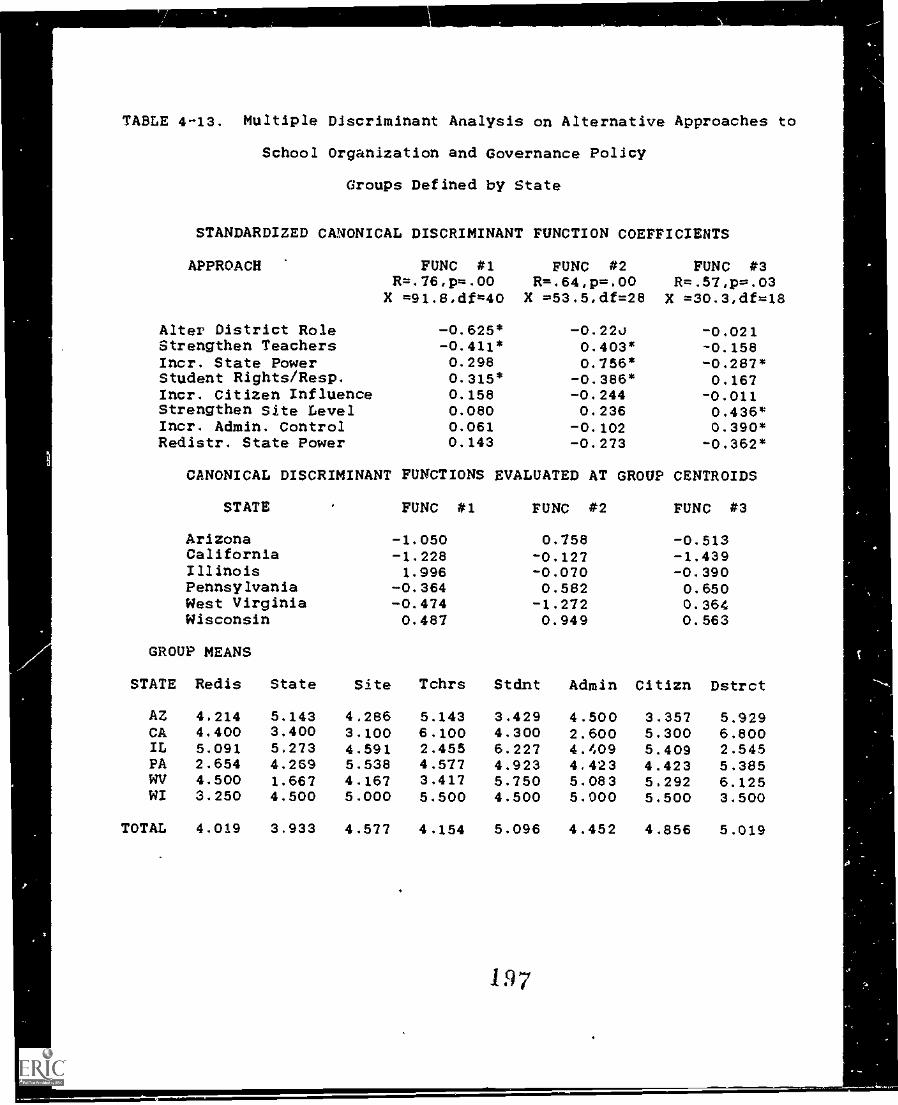
TABLE 4-13. Multiple Discriminant Analysis on Alternative Approaches to
School Organization and Governance Policy
Groups Defined by State
STANDARDIZED CANONICAL DISCRIMINANT FUNCTION COEFFICIENTS
APPROACH FUNC *1 FUNC *2 FUNC *3R=.76,p=.00 R=.64,p=.00 R=.57,p=.03X =91.8,df=40 X =53.5,df=28 X =30.3,df=18
Alter District Role -0.625* -0.22o -0.021Strengthen Teachers -0.411* 0.403* -0.158Incr. State Power 0.298 0.756* -0.287*Student Rights/Resp. 0.315* -0.386* 0.167Incr. Citizen Influence 0.158 -0.244 -0.011Strengthen Site Level 0.080 0.236 0.436*Incr. Admin. Control 0.061 -0.102 0.390*Redistr. State Power 0.143 -0.273 -0.362*
CANONICAL DISCRIMINANT FUNCTIONS EVALUATED AT GROUP CENTROIDS
STATE FUNC *1 FUNC *2 FUNC *3
Arizona -1.050 0.758 -0.513California -1.228 -0.127 -1.439Illinois 1.996 -0.070 -0.390Pennsylvania -0.364 0.582 0.650West Virginia -0.474 -1.272 0.364Wisconsin 0.487 0.949 0.563
GROUP MEANS
STATE Redis State Site Tchrs Stunt Admin Citizn Dstrct
AZ 4.214 5.143 4.286 5.143 3.429 4.500 3.357 5.929CA 4.400 3.400 3.100 6.100 4.300 2.600 5.300 6.800IL 5.091 5.273 4.591 2.455 6.227 4.409 5.409 2.545PA 2.654 4.269 5.538 4.577 4.923 4.423 4.423 5.385WV 4.500 1.667 4.167 3.417 5.750 5.083 5.292 6.125WI 3.250 4.500 5.000 5.500 4.500 5.000 5.500 3.500
TOTAL 4.019 3.933 4.577 4.154 5.096 4.452 4.856 5.019
b) altered local school district roles and responsibilitias. rhe
reported increase in teacher influence is the direct result of.the
fact that in 1964, Illinois became the 33rd state to grant formal
collective bargaining rights to teachers. Though more than half the
teachers in the state had long been covered bv collective
bargaining agreements worked out under a 1965 court interpretation
allowing districts to voluntarily organized under the terms of the
National Labor Relations Act, the new low forces districts to hold
union elections and bargain in good faith if an exclusive
representative is selected.
In contrast with their views on the teacher influence and
district responsibilities questions, Illinois respondents reported
that little attentiOn is being paid to student rights and
responsibilities issues. On average they gave this approach a rank
of 6.227, nearly a full rank below the'2.455 mean rank of teacher
influence.
California and Arizona respondents reported a very different
picture of recent governance policy decision making in their
states. Respondents from these two states reported little or no
interest in either teacher or district authority expansion.
Conversely, Arizona respondents ranked student
rights/responsibilities second in importance to citizen influence
considerations. California respondents did not indicate that
student policies were prominent in recent decisions, however,
ranking them fourth among the eight alternatives.
Page IV-23
198
The other three stZtes reported that recent governance policy
actions lie somewhere between the Illinois and the
California/Arizona patterns. On this first dimension, Wisconsin
tended to follow thr) IlIinois pattern while Pennsylvania and West
Virginia were more like California and Arizona,
The second multiple discriminant function shown in Table 4-13
describes another important set of differences among our sample
states. With a very strong multiple R of .64 (accounting for more
than 40% of the respondent variance), this ftnction reveals that:
MDF Finding #11: The states differ quite substantially in the
extent to which recent gnvernance policies have strengthened state
level authority (at the expense of loca). districts). Where state
level authority is beinz increased, this tends to be accompanied by
increased teacher influence and a neglect of student rights and
responsibilities issues.
West Virginia respondents reported the most aggressive expansion
of state level authority, ranking this approach at the top of their
list (their mean rank of 1.667 for this approach was far above that
for any other state and move than one and a half ranks above their
second pa:ace governance policy approach -- expanded teacher
influence),
Wisconsin, Arizona and Pennsylvania rejected the West Virginia
pattern, reporting little inclination for expansion of state
authority within their states. California and Illinois respondents
did not take sides on this tension.
Page IV-24
199
The third multiple discriminant function shown in Table 4-13 is
also very powerful (multiple R = .57, p = .03) and indicates that:
MDF Finding #12: The states differ substantially over whether
site level and administrative governance authority is being
supported by recent policy decisions. Those states giving less
attention to these approaches tend to emphasize either state level
control or redistribution of power among various state level
agencies.
California reported the greatest support for local administrators
and school site governance (ranking these two approaches well ahead
of the other sin alternatives considered). This viewpoint is
clearly embodied in recent California legislation making teacher
dismissal easier and mandating training for school administrators.
The California perspective is shared to some extent by Arizona and
Illinois policy makers. Pennsylvania, Wisconsin and West Virginia
report the contrasting view that state level considerations have
been given greater attention than site governance or increased
administrative control.
Different Approaches to Curriculum Policy. As indicated by the
multiple discriminant analysis presented in Table 4-14, there are
ro significant differences among the states in their responses to
the three alternative curriculum development and selection
approauhes offered for comment to the 39 policy makers who
expressed familiarity with this policy domain. Hence we concluded
that:
Page 1V-25
0
%
,
(
,
,
MDF Finding #15: Among the seven SPMs under study, only
curriculum development and selection policies showed no systematic
variations across the six sample states.
Insert Table 4-14 about here.
As indicated above in our discussion of Table 4-6, ther& was
strong agreement among all respondents regarding the relative
priority among the three identified curricular policy approaches.
Scope and sequence specification dominates, specialized materials
development is second, and mandatory curriculum usage by local
districts is a distant third. When separated into their respective
state groupings we find no further clarification of curriculum
policy priorities. There are slight differences across the states,
but they are well within expected sampling variations.
Different Approaches to Building Plant and Facilities Policy.
The views of the 38 respondents who discussed alternative
approachee to school building policy are shown on Table 4-15. As
indicated on the table, there As one significant multiple
discriminant function separating the six sample states. It
indicates that:
MDF Finding #16: Although all statas but California ranked the
long range planning approach to building policy lower in priority
than remediation of various architectural problems, there are
significant differences among the states regarding the relative
importance of this approach to dealing with schools.
Page IV-26
2n1
..
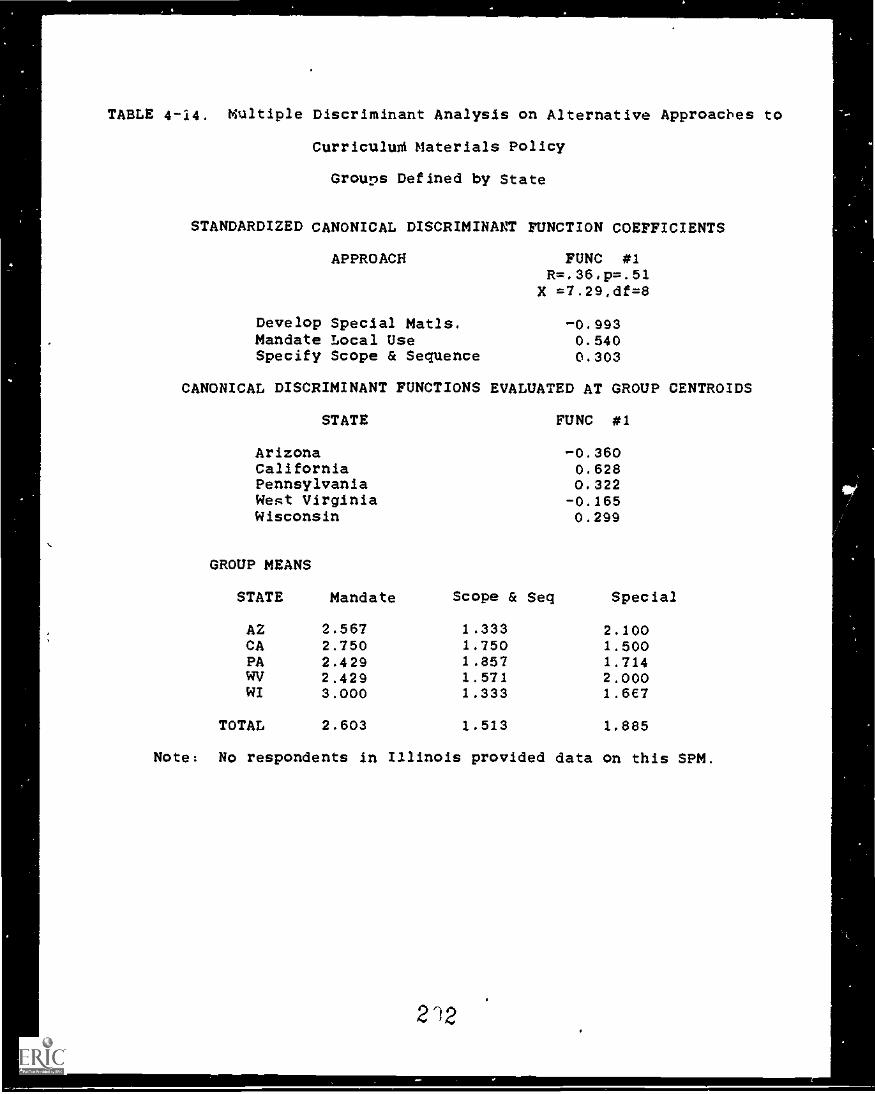
,
TABLE 4-14. Multiple Discriminant Analysis on Alternative Approaches to
CurriculuM Materials Policy
Groups Defined by State
STANDARDIZED CANONICAL DISCRIMINANT FUNCTION COEFFICIENTS
APPROACH FUNC #1R=.36,p=.51
X =7.29,df=8
Develop Special Matls. -0.993Mandate Local Use 0.540Specify Scope & Sequence 0.303
CANONICAL DISCRIMINANT FUNCTIONS EVALUATED AT GROUP CENTROIDS
STATE FUNC #1
Arizona -0.360California 0.628Pennsylvania 0.322West Virginia -0.165Wisconsin 0.299
GROUP MEANS
STATE Mandate Scope & Seq Special
AZ 2.567 1.333 2.100CA 2.750 1.750 1.500PA 2.429 1.857 1.714WV 2.429 1.571 2.000WI 3.000 1.333 1.687
TOTAL 2.603 1.513 1.885
Note: No respondents in Illinois provided data on this SPM.
2'12
Insert Table 4-15 about here.
Pennsylvania and West Virginia respondents tended to share the
California concern for long range planning. Arizona, Illinois and
the lone respondent in this domain from Wisconsin indicated that
building policies in their states to not emphasize this approach.
Conclusion
In this chapter we have reviewed the commonalities and
differences among our six sample states in their reliance ,-..)n
various approaches to each of the seven basic state policy
mechanisms described in the previous chapter. We found that,
except for the gove'rnance domain, there is a national consensus on
the most important approaches to take to in each policy domain.
Equalization and establishing overall funding levels dominate
school finance policy. Pre-service certification and training
issues are most important in the personnel arena. Testing policy
is dominated by a state level concern with specifying the format or
content of required student tests. Setting higher standards for
school programs dominates policy making in this area. Curriculum
materials policy is pre-eminently concerned with specifying the
scope and sequence of instruction. And building policy is
predominantly concerned with remediation of identified
architectural problems.
Beyond this national consensus, however, we found very important
variati3ns across the six states under study in all policy domains
Page IV-27
2(13
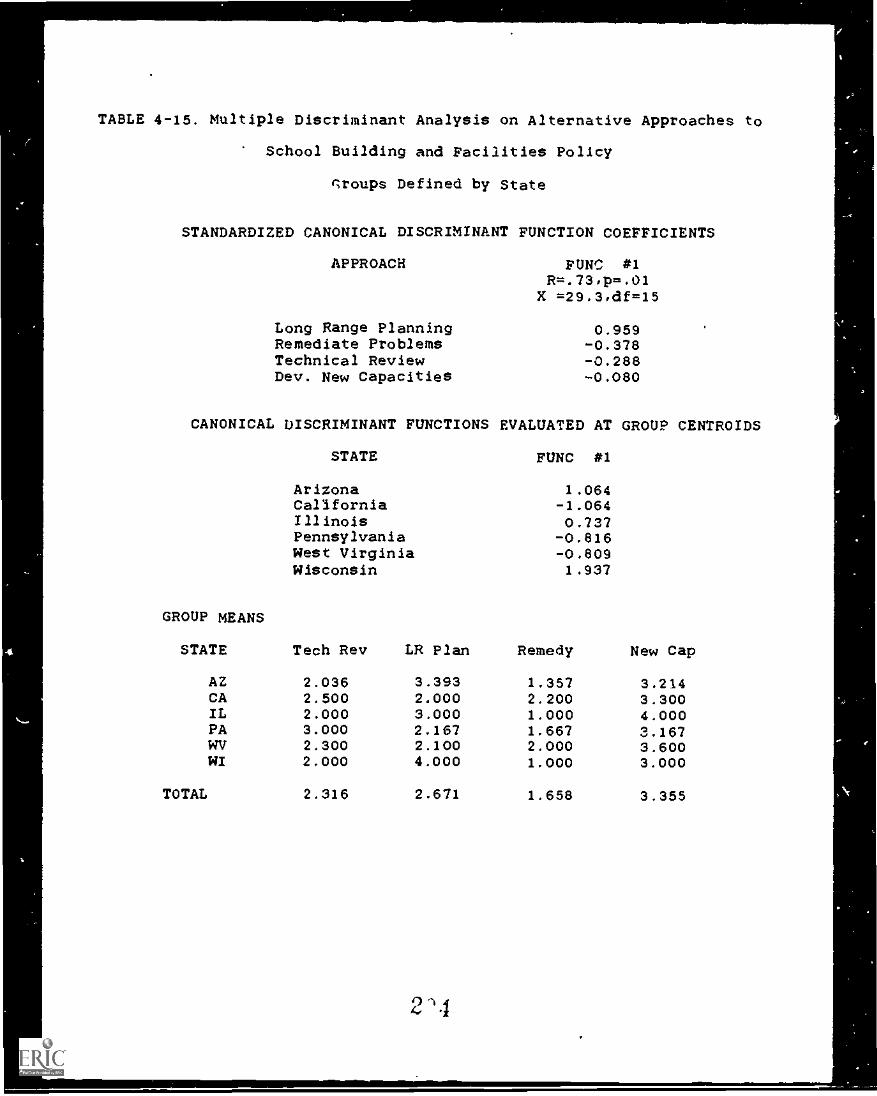
4
TABLE 4-15. Multiple Discriminant Analysis on Alternative Approaches to
School Building and Facilities Policy
ilroups Defined by State
STANDARDIZED CANONICAL DISCRIMINANT FUNCTION COEFFICIENTS
APPROACH
Long Range PlanningRemediate ProblemsTechnical ReviewDev. New Capacities
FUNC #1R=.73,p=.01
X =29.3,df=15
0.959-0.378-0.288-0.080
CANONICAL DISCRIMINANT FUNCTIONS EVALUATED AT GROUP CENTROIDS
STATE FUNC *1
Arizona 1.064Callfornia -1.064Illinois 0.737Pennsylvania -0.816West Virginia -0.809Wisconsin 1.937
GROUP MEANS
STATE Tech Rev LR Plan Remedy New Cap
AZ 2.036 3.393 1.357 3.214CA 2.500 2.000 2.200 3.300IL 2.000 3.000 1.000 4.000PA 3.000 2.167 1.667 3.167WV 2.300 2.100 2.000 3.600WI 2.000 4.000 1.000 3.000
TOTAL 2.316 2.671 1.658 3.355
214
,\
except the curriculum materials one. Especially strong inter-state
variations are found in the domains of school governance, finance
and student testing. Each of these policy mechanisms produced
three stiong, statistically independent, and substantively
meaningful multiple discriminant functions which distinguish among
alternative state policy approaches in these areas. Two
substantively important functions illuminate inter-state
differences in approach to personnel policies, and one significant
function was found for program definition and building policy
differences.
Page IV-28
205
CHAPTER V
VALUES IN LEGISLATIVE CODES
Introduction
Political power in policy making is directed toward promoting
and protecting certain values; that concept is basic to the
definition of pclitics as "the authoritative allocation of values
and resources" (Easton, 1965). Authoritative sources of policy
values are found in statutes, court decisions, and bureaucratic
rules. The value focus of this chapter seeks to understand the
limited set of values found in the codified educational statutes of
our six sample states.
As suggested by Easton (1965, p. 11), if political science
research concepts remain ambiguous, "there is little possibility of
passing on to consider the interrelationships among" them.
Consequently, defining educational value concepts and locating them
within different policy forms are vitally important tasks designed
to clarify referents and remove ambiguity. To undertake this task,
we first raise some conceptual distinctions about four major values
evident in education policy. We then employ content analysis in
two states of sharply differing political cultures (see next
chapter) in order to see these values reflected in policy forms.
Definitions of Maior Values
A review of prior research led us to posit, a priori4that four
values are central to educational policy -- Choice, Efficiency,
Page V-1
2 9 6
-
Equity, and Quality (The basis for this postulate is described more
fully in Chapter 7). A first task was to define these terms
operationally, that is to delineate the intended behavioral goals
of legal language. This task was particular?v nettlesome, however,
because each of our four postulated values were gradually
recognized as the instrumental aspect of deeper, more abiding
aspects of the American political value system. Over an extended
period, our search for basic meanings led to the following
definitions.
Choice
In normal discourse, Choice refers to both the presence of
options for action and the ability to select a preferred option. In
the context of education code analysis, Choice means that a state
statute mandates to a school constituency the opportunity to make
policy decisions or to reject them. Note the contradiction in
terms. A mandate is a requirement, but in this case it is a
requirement that creates uncertainty by permitting local agencies
to exercise power if they wish. Law does not exist without a
mandate, a focus of legislative intent to specify or limit the
activity of citizens. Indeed, Choice exists to the greatest
possible extent where no state law exists at all.
Obviously, therefore, Choice as an object of state policy is
difficult to Isolate. There is no way of Identifying state intent
to create absolute Choice, only where Choice is circumscribed and
"mandated" it is concretely expressed in statutory language.
Page V-2
2(17
The presence of Choice in the education codes analyzed was
ultimately defined in terms of the following three rules (their
application will be illustrated later):
1. Where statutory language explicitly grants the right to
select among alternative allocations of public values and
resources, as for example, the right to choose among alternative
textbooks for a given course.
2. Where statutory language preserves local freedom by use of
permissive verbs like "may" or "can" in reference to a district's
actions, as for example, in the grant of authority to parental
advisory boards for various programs (Where actual appointment of
such advisory groups remains optional).
3. Where statutory language allocates authority for decision
on some aspect of school operations or programs to particular
groups -- professionals in the district, voters, parents, students
-- even though professional administrators and teaGhers must carry
out the decision once made, as for example, where voters are given
authority to vote a bond issue up or down.
It is important to look behind the vestiges of Choice
preserved in statutes to see the substructure of another value on
which it relies. Underlying legal Choice is a basic political
value: the liberty derived from popular sovereignty. The
sovereignty of individual citizens, arguably the most fundamental
of all American political values, creates the basis for legitimate
citizen authority over public officials and policy actions. Choice
then is an instrumental value, a means for citizens to carry out
Page V-3
20s
the rights derived from their sovereignty. In short, behind this
value of Choice is the elaborate set of political ideas which lie
at the heart of democratic governance -- they need no elaboration
here.
Efficiency_
Efficiency is widely used in this nation as a standard for
assessing both public and private life, but it turns out to be a
very complex value. Its classic definition, derived from the world
of mechanical processes, is that of a ratio of work performed to
energy expended. But in referring to human actions it if popularly
seen as a goal -- "We intend to make this program the most
efficient in the country." But in reality it is less ends-oriented
than means-oriented. That appears in state codes, where Efficiency
has at least two meanings and takes two guises..
1. It has an economic form, that is, minimizing costs while
maximizing gains in order to obtain an optimized policy. This
usage is an economic surrogate for the machine definition. In this
form in state codes, it may appear as a state mandate to determine
local compliance with a goal by the state specifying resources
needed for specified units of work. Most familiarly, this appears
as a certain ratio of services provided for a given number of
persons served, such as the pupil-teacher ratio or the minimum
number of children needed for a kindergarten.
2. It also has an accountability form, that is, the mandate
of effective means by which superiors in an authority system can
oversee and hence control the local exercise of power and
Page V-4
2119
responsibility. This form of Efficiency is manifest in the fine
detailing of procedures for using school authority in many matters.
Such procedural requirements are designed to ensure that those
affected by the exercise of power can judge its wisdom, honesty,
and effectiveness. It is seen most familiarly in the specification
of stages of the budgetary process, each of which must be
publicized. Common to both these forms of Efficiency is the state
mandating a subordinate agency to follow specified and public
procedures for the purpose of enabling the agency and citizens to
determine compliance with their goals.
Underlying the instrumental values of economic and regulatory
efficiency is a deeper American value -- the public service
responsibility of those who are granted political power to pursue
the interest of those who authorize its use. The responsible
exercise of power, this basic American value, is instrumentally
evaluated through assessments of the economic and accountability
Efficiency of public agencies.
Equity
In education as elsewhere in the policy world, Equity involves
the use of political authority to redistribute more equitably
resources for critical resources required for the satisfaction of
human needs. From the standpoint of statute formation, basic
Equity is a problem of redress rather than address. This value
becomes operative only in a two-stage process.
1. A disadvantage, deficiency, or other measure of the gap
between normative standards of social life and the needs of
Page V-5
210
-
(
(
,
citizens must be explicitly identified. Enmeshed in the discovery
of norm-need gap are moral and political decisions about whose
needs are real and substantial (rather than being inappropriate
claims for privilege or social largess), how their needs can be
addressed programmatically, and how they will be financed.
2. Motivated by equity considerations, then, public resources
are allocated to close the gap between norm and need. Note that
these resources are not made equally available to all citizens.
Those who are already advantaged are asked to forego benefit
because they are already benefiting from other public programs or
their own private resources.
Equity is most familiarly seen in compensatory or handicapped
educational programs. Typically, these programs define a norm-need
gap, and employ public resources to close it. Quite often,
specific state mandates in these programmatic areas are designed to
qualify for and implement federal programs. Such Equity
requirements consist of detailed guidelines for ensuring the
distribution of resources to particular pupils.
Underlying Equity is an even more basic American value -- the
worth of every individual in society, and the responsibility of the
total society to realize that worth. In brief, the American
political system rests on a widespread belief that realizing
individual worth requires active promotion and protection by a wide
range of public and private institutions. Gaps between normativ?,
standards of individual dignity and worth and the frequent failure
of reality to meet them, through either accident or the pernicious
Page V-6
211 .
effects of the actions of various groups or agencies in society
generate public programs to redress this inequality. Equity is
thus the instrumental value, the mechanism of law, used to realize
this more basic value of the worth of the individual.
Quality
Popularly, Quality means the best or at least a substantial
net improvement in the well-being of those affected by a program,
and here public law matches that belief. Again, a two-stage
process is at work in the application of this value:
1. The state mandates certain standards of performance for
the schools -- Identified in student proficiency, program content,
personal qualifications, or other identifiable attributes of
program quality. Clearly, such mandates are subject to
redefinition over time; we are currently in the midst of such a
change following A Nation at Risk call for reform.
2. To achieve these standards, public resources are allocated
and regulations formulated to direct their utilization. A
commitment to Quality underlies the identification and definition
of these standards, and it is evigent in requirements for staff
training, use of instructional resources, or performance by school
professionals and pupils. Much of the history of education has
been driven by this search for Quality -- curriculum, teaching
methods, teacher and admiListrator training, and the other
attributes of the professional model of education. Tt is seen most
familiarly in the certification procedures for teachers or in
school program definitions.
Page V-7
212
Educational program qualitY tlike quality in other publicservices) is not an end in itself. High quality education programsare valued because they are instrumentally connected to the
fulfillment of the moral and social obligations of all citizens.The good life, American's believe, is a life enhanced by education.Only the expanded sensibilities anti honed skil: produced by
education assists individuals in realizing their full potential andaccepting their obligations as responsible citizens.
Quality, then, is an instrumental value -- one needed to
support the American belief in the crucial importance of education
as the source of character and fulfillment of ultimate human
purposes. Quality provides the norms and resources which, in
application, make life worth living and individuals worthwhile --
education prepares the citizen for a life of dignity in a complexworld.
CiSAMEUNCLIWASLULSI_Policv Values
The Iterative Process of Definitions
These definitions were arrived at by an interative process
among the three senior researchers on our team, and took this form:I. We began with generalized notions of the four values
through reading and discussion.
2. We undertook a preliminary review of the codes of the sixstates to see if these meanings were relevant to the code data.
3. That review led us to specify more operationally what eachvalue meant, producing the definitions set out above .
Page V-8
213
4. The operational definitions were applied to code analysis
to mean that a value's presence in a statutory code section rested
upon the observed presence of certain legally authorized actions,
as they affected school systems -- pupils, parents, teachers, and
so on. In this approach, then, broad conceptua3 terms were further
clarified and defined by examining the statutory requirements for
behavior by political authorities and their clientele; the examples
provided in Exhibit I illuminate that behavior.
As noted above, this operational approach 2ed us to distinguish
between two kinds of one value -- Efficiency -- which displays b,th
economic and accountability forms.
5. Those operational definitions served as our guide iaterstate
comparisons in the legal content of education coiles. They
reinforced our judgment the interstate equivalency of values in
legal references.
An important result of this iterative process was that it
identified no new values with comparable staading as basic elements
in these codes. The language of all sections of all analyzed codes
fit within one of our four values. Of course, other values can be
subsumed under these four. Fro" example, a desire for honesty in
governmental performance is subsumed under 4ccountability aspects
of Efficiency. Or, a preference for decisional systems to be open
to citizens is subsumed under both Efficiency-accountability and
Choice. That is, we conceived our results to mean that other values
were parts of the four larger values. The result may be an
Page V-9
21 4
,
artifact of our method, of course, but we found no values so
evident to constitute a separate category.
The crucial significance of these values cannot be over-
stated. They are major normative references for educational policy
in any political system, although priorities will differ with the
system. Even an authoritarian system has rulers concerned about
Quality and Efficiency in education; they also need to provide
Equity remedies for gaps between norms and needs; but they will
ignore Choice by others when they believe they know best. In
democratic systems, on the other hand, EH four values are pursued,
although as we will see, not with an even hand. How these values
relate to one another and how policy makers give them priorities
are other issues of interest, to which we now turn.
Dimensions of Values
How do these values relate to each other, that is, do they
possess some internal logic whIch makes them opposed or rein-
forcing to one another? Are they hierarchical? Can one be
selected by policvmakers while ignoring the others? Answers here
can provide insight into the value conflict that lies at the heart
of policymaking. That conflict is illustrated in the American
political ideology itself, where equality and liberty drive
citizens into confrontation. Enforcing programs of equal
opportunity works against the inequalities which result from
citizens freely pursuing disparate ends. Current controversies
over desegregation and affirmative action are illustrative of this
basic opposition of values.
Page V-10
215
-0
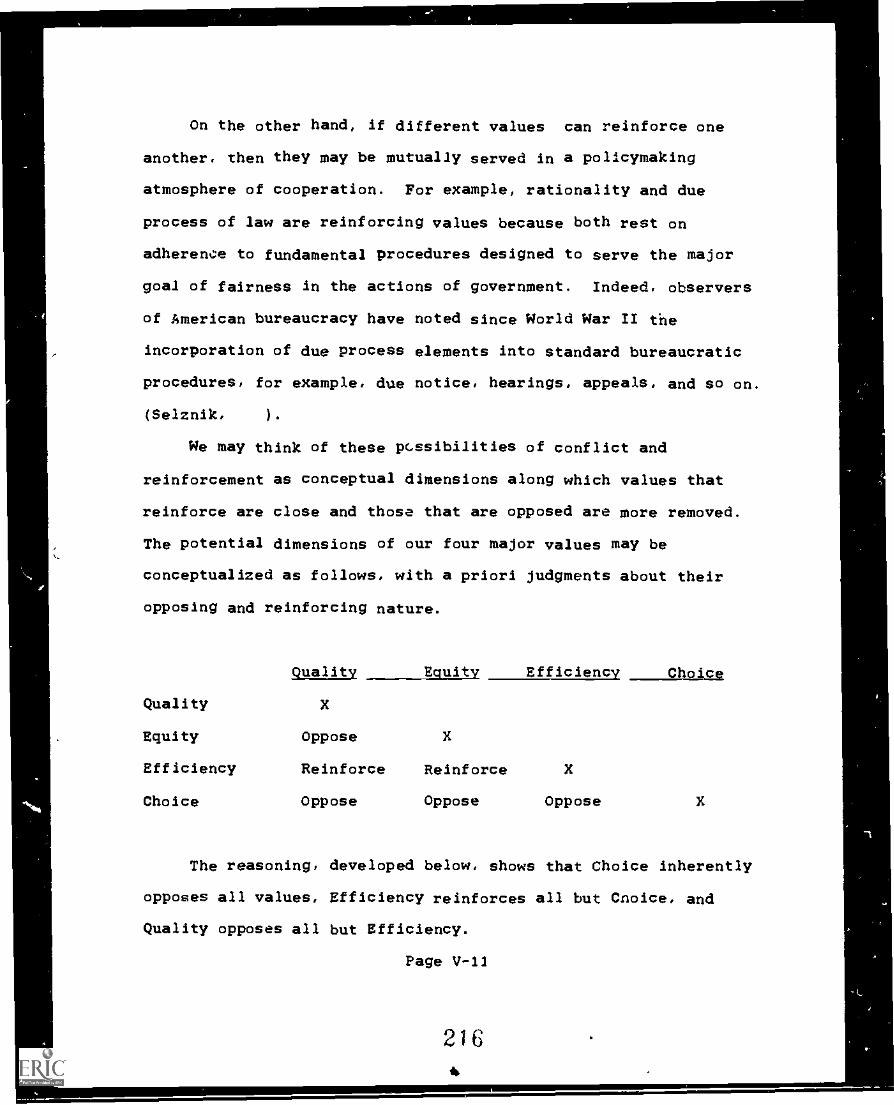
On the other hand, if different values can reinforce one
another. then they may be mutually served in a policymaking
atmosphere of cooperation. For example, rationality and due
process of law are reinforcing values because both rest on
adherence to fundamental procedures designed to serve the major
goal of fairness in the actions of government. Indeed, observers
of American bureaucracy have noted since World War 11 the
incorporation of due process elements into standard bureaucratic
procedures, for example, due notice, hearings, appeals, and so on.
(Selznik, ).
We may think of these pGssibilities of conflict and
reinforcement as conceptual dimensions along which values that
reinforce are close and those that are opposed are more removed.
The potential dimensions of our four major values may be
conceptualized as follows, with a priori judgments about their
opposing and reinforcing nature.
Quality Equity Efficiency Choice
Quality X
Equity Oppose X
Efficiency Reinforce Reinforce X
Choice Oppose Oppose Oppose X
The reasoning, developed below, shows that Choice inherently
opposes all values, Efficiency reinforces all but Cnoice, and
Quality opposes all but Efficiency.
Page V-11
216
.
The Qualitv-Equity Dimension
The values of Quality and Equity are in opposition because the
first value seeks uniform standards and services applied to all
clients of schools, while the second seeks special services or
standards for particular clients. If educational resources were
infinitely elastic there might be no conflict here; more funds for
educating or rewarding special clientele would not cut into funds
for all other pupils. But, except in boom periods, funds at all
governmental levels tend to be zero-sum (either in a steady state
or declining economic era); consequently, demands for Equity
services will necessarily be opposed by those who will not benefit.
Equity supporters claim, properly enough, that their efforts are
designed to achieve Quality standards for their clients. But, out
of economic, racial and ethnic, or status fears, supporters of
Quality see these efforts as a loss to them and so oppose them.
Many major disputes within educational services -- ove
desegregation, affirmative action, bilingual and handicapped
education -- are basically rooted in the polar positions of these
two values on this dimension.
Iht_21.1LIILTYiLLSjILY_SjI&M42D
On the other hand, the values of Quality and Efficiency
illustrate the reinforcing principle. Achievement of the uniform
standards that underlie the thrust of Quality must rely upon both
the economIc and accountable forms of Efficiency to achieve their
purposes. Formula-based 2aws and regulations, with their appeal to
an ostensible rationality, as well as elaborate reporting
Page V-I2
217
2.11.
procedures, are consciously designed by policy makers to ensure
that their legislative goals are effectively implemented. The large
apparatus in all state departments of education and chief school
officer staff is Efficiency manifest in search of Quality.
Furthermore, there is a temporal sequence implicit in the
reinforcing relationship of these two values -- Quality first and
Efficiency second -- which will be treated more fully later.
The two's necessary linkage accounts for the politics that
always accompanies implementation. Implementation seeks both
efficient and effective means of realizing legislative purposes.
Politically wise groups know that decisions at this stage can
enhance or protect their particular goals, and so they convert the
search for rationality into a political contest. In this contest,
all agree on the Quality goals and on the need for
efficient and effective means of realizing them. However, the
dispute is over defining efficient and effective, not over the
Efficiency goal itself.
The Quality-Choice Dimension
Quality and Choice are in tension because the operation of
Choice leads often to different definitions of Quality in
educational programs. But only one definition can be officially
authorized. Hence if choice is supported, quality becomes
difficult to control. Historically, the involvement of
professional educators in policymaking has led to the dominance Of
their views of Quality in policy areas, like Personnel and Program.
Page V-I3
218
The Choice-Equity Dimension
The opposition between Choice and Equity arises because
conceptually the first provides options from which districts
may choose, while the second mandates requirements that districts
or states must choose. The "shall" and "must" terms of Equity
provisions stand sharply opposed to the "may" provisions of Choice.
That conceptual distinction has been fleshed out experientally
as well. It has been the historic unwillingness of a decentralized
education system.to redistribute resources to those with special
schooling needs that has generated the drive for Equity-based law.
The poor, minority, handicapped, and gifted pupils have each a
similar history of local inattention, discrimination, or
underfunding; they is each also shared a similar process of
political mobilization to protect themselves in courts and
legislatures at higher levels of government. The opposition
between these two values continues into the implementation stage,
leading to current efforts to reduce or eliminate them in some
cases. Finally, these two values especially exemplify the generic
contradiction between equality and freedom in our political
ideology noted earlier in this chapter.
The Choice-Efficiency Dimension
Choice and Efficiency is another case of opposing values.
Conceptually, providing optiohs for others decisions runs against
the "one best way" orientation of achieving educational goals. In
one sense, the means-oriented purposes inherent in Efficiency
policies are ;..t odds with the self-fulfillment
Page V-14
219
purposes inherent in Choice policies. That is, the first seeks a
single set of economic or accountable procedures for ensuring that
educational goals are achieved; the second seeks a range of
procedures that necessarily maximizes plural paths to those
goals. What is logical conceptually is supported empirically in
code analysis. Efficiency dominates not simply Choice but all
values.
In a larger sense, the Choice-Efficiency opposition
symptomizes the enduring tension in democracies between two
political forces. One might be termed the "participatory," that
is, the desire to participate in those decisions about services
which affect citizens' lives. For example, "local control" has
been so important for so long in American education because it so
well reflects this participatory impulse. That does not mean that
all, or even a majority of, citizens do participate. But there has
been a clear expectation to which most citizens are that affected
individuals should have some say over, not simply who our officials
will be, but how they shape public policy.
The opposing force in democracy -- indeed, in all nation
states -- is the "rationalizing" influence of public policy. This
is the effort to make rational choices between policies that expend
resources. Rational means both a clear fit between policy means --
the mechanisms for using resources -- and social goals and at
regularizing of programs and institutional functions so that they
can be held accountable for their actions.
The Efficiency-Equity Dimension
Page V-15
29 0
Efficiency and Equity are conceptualized as reinforcing
values, because the goals associated with the second require
employing the means of the second to be realized. That is, the
redressing of unequal distributions of educational resources cannot
be accomplished without assessing the costs of pursuing particular
goals and the development of accountability procedures to ensure
goal compliance.
Desegregation illuminates this conceptual linkage between
means and ends. The familiar disparities of resources in
segregated school systems required, first, the will to seek a
political solution, second, the technical knowledge to identify
specific disparities and devise means for redistributing resources
within a school system, and third, the means to enforce change
through oversight of implementation (that is, an accountability
form of Efficiency). There have been other Equity-based policies
in education -- school consolidation earlier and more recently,
vocational education, bilingual education, and so on. Each has
been accompanied by much protest over that goal and the method of
accomplishing it efficiently; the protest came from those not
benefited by this goal and its methods.
Actor Influences on Values
This brief review of six value dimensions is unified by
conceptualizing them as influences within the political system,
working upon the policy-making process. These value influences are
not in any sense hierarchical, but rather each value is pursued in
policy always in relationship to the other values.
Page V-16
221
Tn four of the
(
six dimensions, we suggest that dlese values are in conflict, both
conceptually and expez*ientally. Implicit among all these conflicts
is the presence of two sets of policy actors: the professional
(oriented to rational means and professionally- defined goals) on
the one hand; and on the other, groups of citizens (often
non-professionals) who reflect the pluralism of American interests.
The power of the professionals has been enormous in our
history. They have left their mark on the Efficiency and Quality
code provisions among the states. Professionals have generally
defined Quality goals and Efficiency means for achieving them.
But the participatory thrust, legitimated by the democratic
principle of popular sovereignty, gets in the way of this dominance
when it seeks new goals and means. Of course, not all citizens
oppose all professionals all the time. Some citizen groups also
reinforce professionals in their work. Workers and trade unions
did so in helping found public schools in major cities (Peterson,
1985, chapter 2); also, over time that may have been the chief
contribution of middle-class PTAs. This citizen influence is
probably more subtle, however. That is, professionals get
sensitized to the potential for participatory influence, and so
they must deal with it in their own efforts at state policy making
and implementation. Chapter 9 later will show, however, that in
the judgments of state policy elites, public opinion in general is
not that influential on their'decisions: however, opinions of
clientele groups, like teachers, definitely is important.
Page V-17
222
The Sequencing of Values in Policymaking
Issue Creation
Can we derive from these data a model of how these major
values are sequenced into law? On any given policy matter, do all
values emerge simultaneously? Or does the policymaking process
shape the order in which values get recognized and dealt with?
This question of policy sequence cannot be answered by resort to
historical data in the codes, for usually such data do not exist.
Rather, it would be important first to build a conceptual framework
of the most likely interactions which would affect this matter of
sequence.
Perception of crisis Is most often the trigger to innovation
in many policy areas, but more than a crisis is required. Issues
get on governmental agendas as a result of the interaction between
leaders and stressful societal conditions which Ire precipitated by
trlggering events (Cobb and Elder, 1983). The stress may be either
extensive (affecting much of society) or intensive (affecting
significant groups); wars and depressions illustrate the first
pattern, and urban riots among minorities the second.
In education policy, leaders have been crucial in getting
issues on the agenda. Scholars have noted the pivotal role of
leaders in building educational administration (Tyack and Hansot,
1982), in constructing a model of professional control (Cremin,
1965), and, even earlier, in urging the idea of free, public
education. State by state, beginning in the mid-19th century and
without federal direction, voluntary networks of professors and
Page V-I8
223
I
,
practitioners responded to, and helped create, the sense of need
for public education.
Why Quality Comes First
Reading this historical analysis it is evident that the first
efforts to build such a service were premised on a belief in
Quality. The reaction against the party machine control of
schooling was rooted in the conviction that poor education was the
result, and that a higher quality result could come from
transforming teaching and administration into a profession. The
policy ideas of this profession -- both professors and
practitioners alike -- were the best source for improving
educational quality. There then resulted professional values of
0one best system" (Tyack, 1974) of "managers of virtue" (Tyack and
Hansot, 1982). This transformation was premised on first bringing
Quality into schooling.
A broader perspective on professions in general will
illuminate what happened here. In any service that is
profession-driven (unlike say, auto repair), professionals seek to
dominate four basic policy domains. What is good service? How
much of it should be provided? How is a competent practitioner
defined? Who shall evaluate the results (Wirt, 1981)? Ultimately
these are political questions (although professionals have rejected
this ugly phrase); ii answering these questions, professionals have
usually dominated, although recurrent challenge from clients can
alter them. But note that all four questions center around
Page V-19
224
defining matters of Quality in service, quantity, personnel, and
evaluation.
We need not look back toc far to see why Quality is the first
value concern of policy makers. In the effort to reform
educational services among the states in the mid-1980s, much of the
discussion centered around one basic idea at the heart of A Nation
at Risk. This idea was that pervasive deficiencies in the deli-sry
of this service had produced poor quality results. This and later
reports accepted this premise and thereafter focused on different
remedies to improve Quality. Notice that the first state reforms
dealt mostly with adding more courses to the curriculum, increasing
in-school time, and improving instruction. All of these have in
common a concern about Quality -- as professionals defined it.
Wiv Efficiency Comes Second
Goals of Quality once proclaimed are not automatically
self-executing; like all good aims in life they must be worked at
to be realized. That necessitates some rational estimation of
procedures and resources needed for goal success set in a framework
of decisional rules. It also calls for oversight of these rules to
ensure compliance. We have defined this latter process as
Efficiency-based, which is why it follows, not precedes, the
setting of Quality goals. This sequence makes conceptual sense.
If the Efficiency value generates means-like actions, those must be
directed to some end that predates the means. Otherwise we would
have means floating around in human actio.1 without direction,
behavior that is usually termed non-ratioval.
Page V-20
225
1
The large amount o' Efficiency in education law is striking.
Both conceptually and empirically, legislating one policy goal
necessitates creating more than one Efficiency method to achieve
it. The latter value must infuse all the SPMs, and subsequent
analysis will show there was considerably more code references for
Efficiency than for Quality (48% V. 19% in Illinois, and 36% V. 18%
in Wisconsin). That is also why the Golden Rule required only ten
commandments but innumerable human regulations to back it, with
results still being debated.
Why Equity Comes Third
The provisions of a Quality program, followed by
Efficiency-based methods to implement it, leads to a curious result
in experience -- maldistribution of any public service. Whatever
the policy area, some clients get more than others, and not because
of a simple Marxian notion of class power. For example, the poor
need mare public welfare and housing services than do the middle
and high income citizens, and they need more protection against
violent crime (and even against such non-violent crimes of consumer
fraud) than the others (Lineberry and Sharkansky, 1978, Part 4).
These findings illuminate the point that differential service
delivery arises because of differential social needs.
tifferential access to service has been a constant in
education as well. We know well that basing school funding upon a
single, locally-based tax made the quality of a child's education a
function of district wealth; funding reforms in the 1920s and 1970s
Page V-21
226
at the state level testify to that. It is also clear that
educational achievements differ dramatically, although the argument
continues over whether it is a fumtion of status, race, or
resources.
Let us make an even larger point, that any educational service
is bound to be maldistributed among even those clients to whom it
is specifically directed. Even in a classroom of wealthy students,.
backed by reinforcing parents and a resource-filled school, there
is still a grading curve; even here, learning is not equally
received and instilled. Consequently, when any Quality goal is
sought, those who do not benefit are likely to seek additions to
existing resources and procedures which will assist them. That is,
Equity will be next sought.
Of course, Not all inequities are pursued into the policy world.
Many inequities are not visible to clients; or if visible, citizens
may feel alienated from participating in the political system, or
if they perceive inequities and desire action, they may lack
maze-wisdom of how to succeed in it: In short, barriers of
perception, will, and knowledge act to depress political protest
against objectively evident inequities. But in terms of our
sequence model, Equity concerns follow the creation of Quality
goals and of Efficiency means. Hence equity is a matter of redress
for real or perceived inequities. Quality, by contrast is a matter
of address -- the development of public programs to garner the
benefits of collective action.
Page V-22
227
Why Cnoice Pervades The Seouence
This linear model of how values get sequenced into the body of
law must yield to the fact that citizen Choice operates at every
step, not at some single point in the sequence. Log5cally, Choice
arises even before lawa exist on a matter. Without laws, there
would be the "state of nature" beloved of 17th century political
philosophers; here there was maximum Choice to do anything.
However, as these writers noted, that kind of choice without law
left power in the hands of those who control the means of violence.
Under these conditions, then, Choice ended up messily for most
people; it was a life that was, as Hobbes wrote, "mean, nasty,
brutish, and short." The coming of government and its law in a
"social contract" would limit Choice for some, but expand freedom
from violence for most.
That insight has meaning for understanding the place of Choice
in the educational policy sequence. The participatory influence
noted earlier has entered determinations about the other three
vallAes. Indeed, it can be argued, Choice was present even before
Quality goals for education were established. People could choose
not to be educated, and as we know, many did -- the Census Bureau
data on illiteracy testify to that Choice.
More significantly, Choice entered at the founding of
American educatior, because free, public education was an idea
which gained wide public acceptance among Protestants; Paul
Peterson (1985; chapter 2) has recently saown how its founding
Page V-23
229
rested on a broad base of workers and trade unions in four major
cities. Further, Choice was maintained atter creation of the
public school system in the Efficienctt stage by the election of
school boards and, in about half the states, the use of the
referendum on tax levies, blnds, and even annual budgets (Wirt and
Kirst, 1982, chapters 5, 7). Also, Choice has an episodic impact
on Efficiency, seen in the socialization of professionals to
anticipate the public's "zone of tolerance" of actions, outside
which popular discontent will intrude (Boyd, 1976). Finally, the
recent struggle for Equity has generated much pressure group
litigation and legislative initiative at state and federal levels.
These political actions mean simply that many citizens exercised
Choice in order to alter maldistributions of resources for special
pupils.
In short, democratic principles have made Choice an active
ingredient of educational policy affecting the other.three values.
Its possibility for challenging professional decisions makes it an
ever-present consideration in any contemporary decisions about
those values.
Summary
In this chapter we are seeking to clarify one of the major
concepts in political analysis -- values. In this first section we
posited that four major values permeate the structure of state
educatlonal policy. Choice, Equity, Efficiency, and Quality
Page V-24
229
represent in turn underlying political values in the policy system.
Conceptual analysis leads to the conclusion that these four values
exist in no hierarchical fashion, but rather operate alternately to
reinforce or oppose one another. In many of the policy choices
resting on these values, professional determinations have been of
key importance, although episodic influences from the participatory
force of democracy also play a role; the latter are most visible in
the accountability form of Efficiency and in Choice. Furthermore,
there is a logical chronology to the sequence by which three of
these values enter the policy system; Quality begets Efficiency
which begets Equity, but Choice, however, constrains the growth of
all three of these values.
How do these values look when reflected in the structure of
actual educational policy among the states? We will examine their
distribution in two drastically differnt states and also
illustrate their presence. Not everything countable is valuable,
of course, but some quantitative analysis will reinforce the
conceptual clarifications advanced to this point.
Methodology of Content Analysis
Comprehensive content analysis of state codes is not often
used to present the full panoply of state action in a policy area;
two recent exceptions are found in education policy in the fields
of civics curriculum by the American Bar Association (Henning et
al., 1979; reviewed in Wirt, 1984), and in the field of state
control of local education (Wirt, 1977, 1978). More often,
analysis of a public policy is quite narrow, focused upon but one
Page V-25
230
program in a few or even one state. In this chapter, however, we
demonstrate the utility of comprehensive code analysis, employing
of our six states with different political cultures (chapter 6).
The purpose is to adduce the inherent value content of the entire
set of state policy mechanisms (SPMs) reported earlier.
The Item of Analysis
The analysis in this chapter rests upon a tally of all items
of the state codes of education for Illinois and Wisconsin in the
early 1980s. An "item," the object of the tallying, is defined as
any unit of the code (sentence, paragraph, group of paragraphs or
numbered code section) that expressed a state policy utilizing one
of the State Policy Mechanisms (SPMs) described in chapter 3. The
largest unit of analysis in any case was a numbered code section.
In reading each item, we drew inferences about the presence of one
or more major values, defined earlier. (Representative
illustrations of the four policy values expressed within each of
the seven SPMs are presented below.) A fuller explanation of this
process may be useful.
The usual diversity of American state practices emerged even
in the way of expressing codes among our sample states. For the
same program embodied in any given SPM, code language could be
brief or long, its placement among sections of the code could vary,
and the wording itself could be clear or murky. The first decision
we made was that the largest unit of content analysis would be any
code-numbered sub-heading of an SPM. That sub-heading could
contain one or many sentences, one or many paragraphs, but every
Page V-26
231
numbtred section was given at least one tally. The decision to
code every number reference was based on an assumption, namely,
that legislators in writing a particular part of the code believed
it was linked to that common topic and accordingly numbered it to
appear there.
The Presence of Values
In content analysis, the counting of items can be as complex
or simple as research requires; one can tally every word, sentence,
or paragraph within an item. We concluded, however, that states
use different expressive styles in writing statutory language
(Wisconsin's was a model of clarity). Counting small units like
words or sentences would, therefore, constitute aL4 Immense labor
for some states and.give a false basis for state comparisons. Just
because legislators in one state use prolix -- even confused --
expression does not mean they are saying more about an item than
legislators in other states who speak concisely and lucidly.
Rather, we read the whole of a code-numbered subheading and
subdivided it for multiple tallies only if it explicitly embodied
more than one of the seven basic SPMs. Each code section (or
subdivision if more than one SPM was affected by the full section)
was then eXamined to infer the presence of one or more of the
values described above. No matter how many words, sentences, or
paragraphs were required to detail the presence of a value within a
unit of code language, only one tally for that was made for each
inferred value. Consequently, each tally was a measure of a
value's presence within each unit of analysis, within the unit.
Page V-27
4 :12
.4%
This tally process was applied to each of the four of values
in relation to each of the seven 8Rol5 explored in chapter 3,
summarized by categories for each state, and analyzed for their
relevance to our central themes. For each of the three
investigators on the research team, the tallying was done by a
research assistant, with regular evaluation of sample tallies.
There are great difficulties in this process -- changing research
assistants, misunderstandings of how statutes should be interpreted
or of instructions, and so on. Despite thesp problems, however,
results led us to decide that in two states the inter-coder
agreement was very high -- Illinois and Wisconsin. Their selection
was useful because each represented a distinctively different
political culture (explored in chapter 6) which might serve to
explain code differences.
The Distribution of Values: Introduction
We begin with some summary comparisons before moving to more
detailed category analysis. Table 1 displays the distribution of
the four major values across the two states. The dominance of
Insert Table 5-1 about here
Efficiency is our first clue that policymakers are motivated by the
need to control whatever programs they think desirable and by the
concern to account for all allocations of authority. These needs
flow first from the constitutional dominance of state authority in
education; the legislature is the single source of policy authority
Page V-28
233
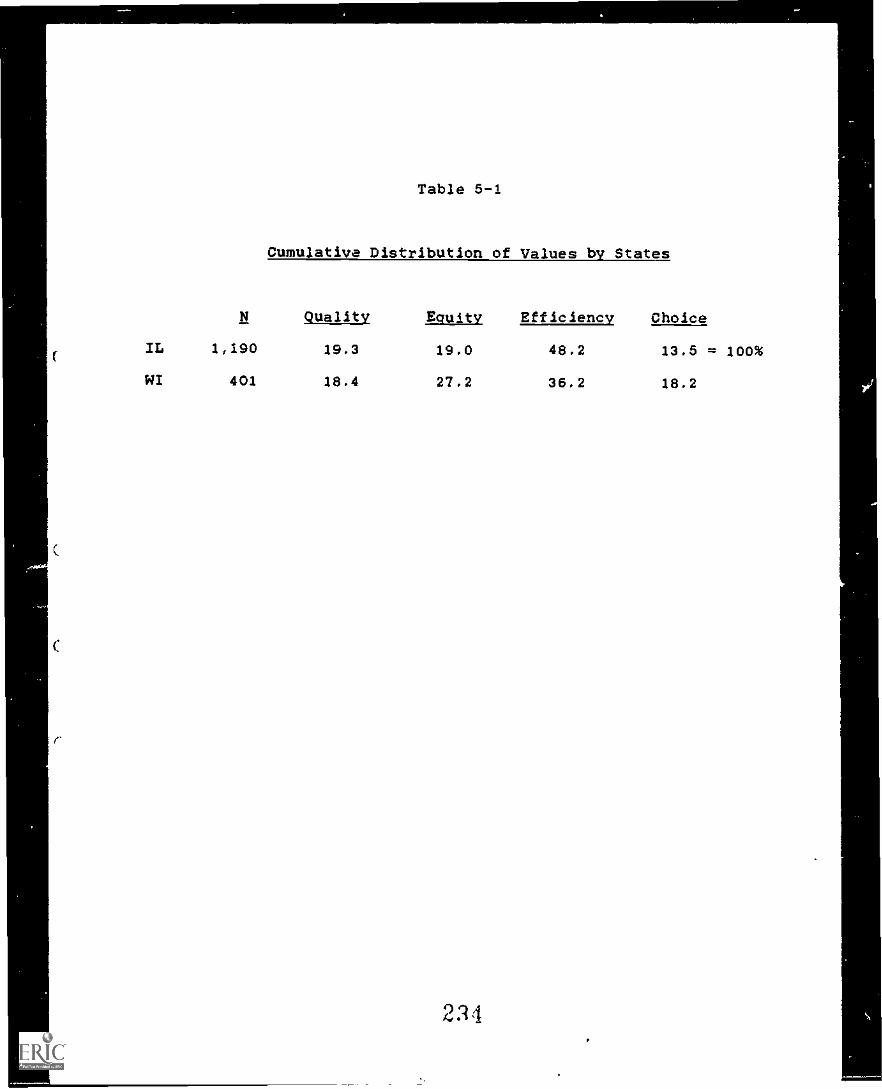
Table 6-1
Cumulative Distribution of Values by States
N Quality EcruitY Efficiency Choice
IL 1,190 19.3 19.0 48.2 13.6 t= 100%
WI 401 18.4 27.2 36.2 18.2
234
in this and other policy worlds. But also, the need for control
arises from policymakers' awareness of the popular desire for
control of power which Efficiency code references attempt. Tension
between the participatory and rational bases for injection
Efficiency into policymaking, generates much of the politics of
American education, as we noted earlier.
- Educational Values and Political Culture
Table 5-1 also suggests, however, states differ substantially
in their preferences for various policy values. In Illinois,
Efficiency dominates the code absolutely, with the other three
values about equally distributed. This dominance rests upon the
prevalence of accountability provisions designed to control the use
of power. That is, Illinois policymakers have tried to ensure that
any responsibility granted to state or local school authorities is
held accountable to those over whom it is exercised. In Illinois,
power granted has meant power checked.
Political history helps explain this distribution. Illinois
has been a state in the Individualistic political culture,
characterized by fragmentation of power, high conflict between
parties and regions, political corruption,a citizen sense of
politics as "dirty," and so on. Consequently, making grants of
authority accountable reflects the reformist effort against these
practices; such controls appear in detailed reporting systems and
publicity requirements for decisionmaking by local districts.
Another element of the political culture has been Illinois's
considerable localism, a suspicion of state control over local
Page V-29
235
school systems. Hence, the prevalence of accountability controls
in state mandates is consonant with this localism.
Wisconsin, possessed of a Moralistic culture, presents another
pattern. Here, while Efficiency leads other values, its proportion
is considerably less than in Illinois. Much more Equity, and
somewhat more Choice exists in this state. We can infer that
Efficiency and Equity are responses to different influences in
Wisconsin's history. Efficiency reflects the need to ensure that
policies are created and administered in an accountable fashion:
that is also true of Illinois. But Equity responds to a special
theme In Wisconsin's culture -- political power is to be used
positively to improve citizen's lives by redistributive policy
which alds the less fortunate. Also, voters are to have policy
choices to vote upon (initiative and referendum was pioneered in
this state). The state's "squeaky clean" reputation, often cited
in others' research (Pierce and Hagstrom, 1983), was evident in
expressions given in our field work and in its policy elite's
answers to the political culture scale analyzed in the next
chapter.
These comments exemplify the conditions In Wisconsin. That
is, laws are ultimately statements about the particular values that
are to dominate in a political system. Consequently, the different
distributions of the values seen in Table 5-1 support the inference
that variations in political institutions and political history
have consequences for the kinds of policy that are produced. For
example, Wisconsin's Moralistic concern that politics be used to
Page V-30
2.'46
improve the common weal and that citizens should play an active
part in that action can be inferred to lie behind its dominant
values. That is, Efficiency not only protects against abuse of
power -- the accountability aspect -- but it can also be built into
quality educational programs and effective decisional mechanisms.
Equity underlies the use of power to redress social imbalances in
the conditions of society, in this case, those of the young. In
Illinois, on the other hand, the dominance of Efficiency reflects
much more a basic distrust of the political system. We will note
later how the dominance of this value in certain SPMs supports this
inference.
The Distribution of Values within the SPMs
Each of the seven state policy mechanisms by which education
is provided reflected each of the four values in this study. It
can be assumed that, without some intervening influence, the four
would be distributed equally within each of the seven SPMs. As the
data reveal, such intervening influences must be present since
values are far from evenly distributed. To address them, each
column in Table 5-2 shows the frequency distribution within each
state of each value across the SPMs whose substantive meanings are
explored in chapter III). For example, the first column shows how
all the Quality values were distributed among the seven SPMs, in
the Illinois code, and the second in Wisconsin's. As is
immediately cbvious, there is no equal distribution of any of these
values in either state. Some SPMs embody little of the four
values. Student Testing and Assessment and Curriculum Materials
Page V-31
217
for example, have both few code provisions and a combined total of
only two choice value expressions. Without an equal distribution,
then, the inference about the influence of intervening factors can
be further explored.
Insert Table 5-2 about here
Political Culture Influences. If a state's political culture
were an intervening factor, then we should expect to see two states
of different cultures to have a different frequency distribution.
In Table 5-2, we have underlined in each column the largest
percentage received by any SPM. For three of the four values the
two states contrast In their value distributions but are similar in
a fourth value. A single SPM -- Program Definition -- accounts for
a majority or plurality of all Quality, Choice, and Equity code
references in Wisconsin. Illinois, however, Personnel policies have
the most Quality references, while Organization and Governance
receive the largest share of Equity and Choice value expressions.
The Moralistic state of Wisconsin strongly emphasizes its Program
provisions with three values.
he distributions of the Efficiency value enactments cannot be
explained by culture. however. Efficiency dominates the codes of
both states (see Table 5-1) and loads heaviest on Governance in
both states (Table 5-2). What may explain this commonality is the
pre-occupation in democracy with the control of power which the-
accountability portions of Efficiency seek.
Page V-32
2:1S
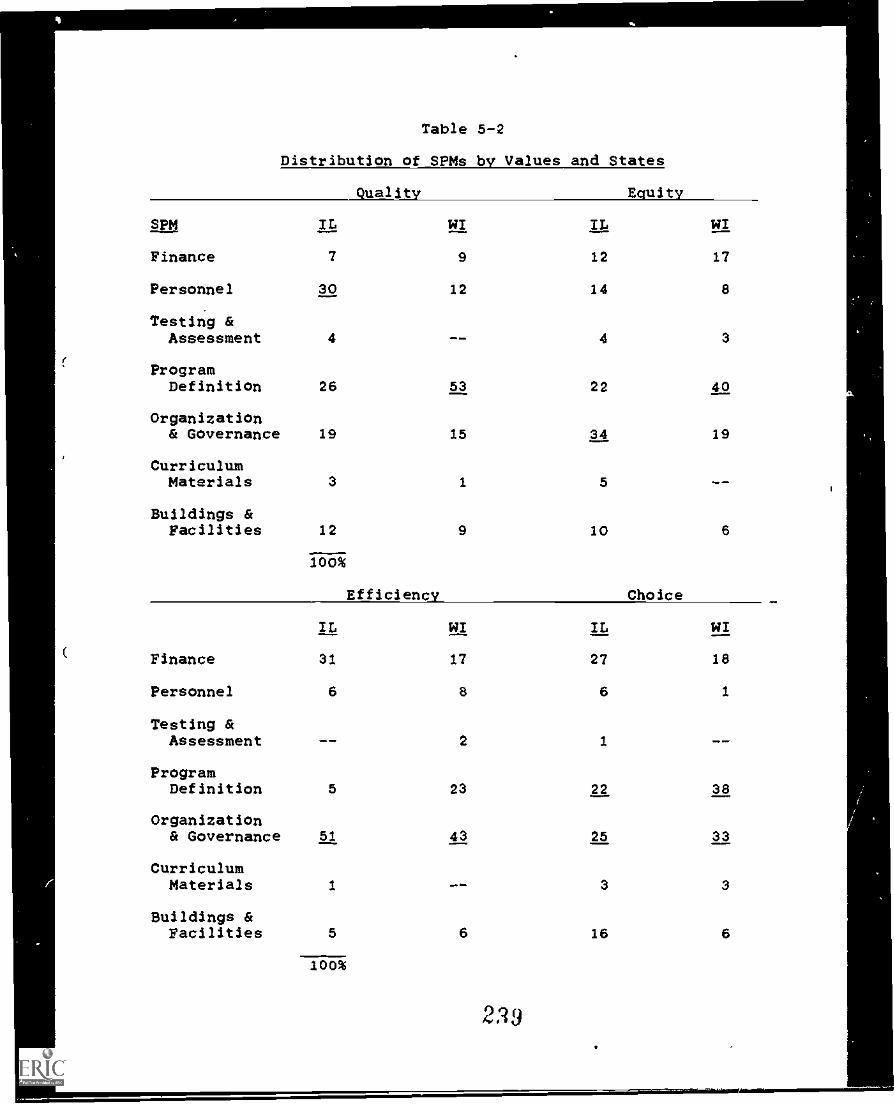
,
Table 5-2
Distribution of_SPMs by Values and States
Quality Equity
spm IL WI IL WI
Finance 7 9 12 17
Personnel 30 12 14 8
Testing &Assessment 4 -- 4 3
f ProgramDefinition 26 53 22 40
Organization& Governance 19 15 34 19
CurriculumMaterials 3 1 5
Buildings &Facilities 12 9 10 6
100%
Efficiency Choice
IL WI IL WI
( Finance 31 17 27 18
Personnel 6 8 6 1
Testing &Assessment __ 2 1 __
ProgramDefinition 5 23 22 38
Organization& Governance 51 43 25 33
CurriculumMaterials 1 ..- 3 3
Buildings &Facilities 5 6 16 6
100%
239
1
Within-State Distributions
A clearer picture of how each state's code reflects these four
values will demonstrate great variation in their distribution among
SPMs. (The limited code attention given to Student Testing and to
Curriculum Materials, is omitted.from the following analysis.) In
Illinois, for example, Table 5-3 shows that over half the Quality
tallies appeared for just two SPMs -- Personnel and Program. As
part of the national reform surge, the 1984-85 additions to the
Illinois code would add some more language to these two. However,
the distribution for Equity in Illinois is much different,
concentrating most on Governance and secondarily on Program.
Efficiency tallies, accounting for almost half of all code
references in this state, loads almost half of these on Governance,
and most of the rest on Finance. One-quarter of all Illinois code
references fell into the category of Efficiency -- Governance.
Insert Table 5-3 about here
This last finding reinforces the perception gained in field
work and expressed by other writers of a pervasive and typical
distrust of political authority in Illinois. Not surprisingly,
then, these code references involve an extensive and exquisite
detailing of who may do what, when, and how -- all for the purpose
of checking against the abuse of educational authority. That is,
few of the Efficiency provisions are of the economic type --
Page V-33
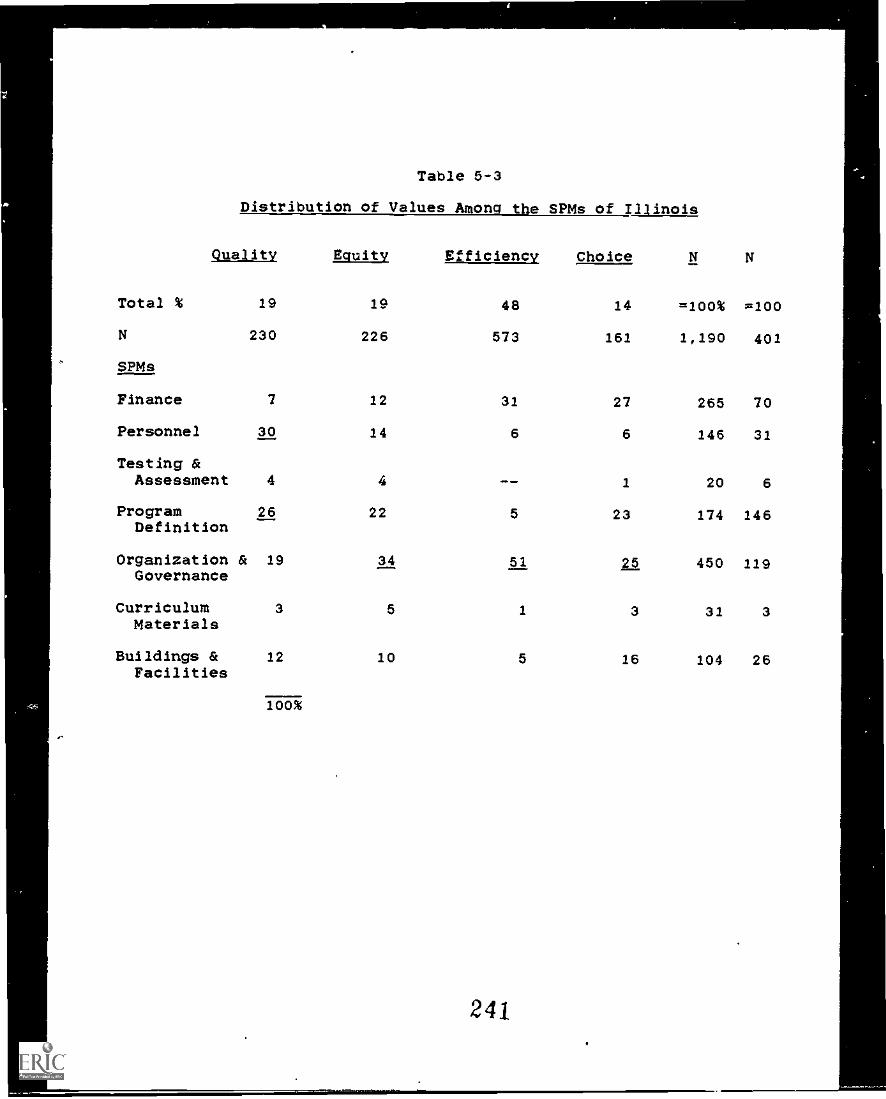
Table 5-3
Distribution of Values Among the SPMs of Illinois
Quality Equity Efficiency Choice
Total % 19 19 48 14 =100% =100
N 230 226 573 161 1,190 401
SFMs
Finance 7 12 31 27 265 70
Personnel 30 14 6 6 146 31
Testing &Assessment 4 4 -- 1 20 6
Program 26 22 5 23 174 146Definition
Organization & 19 34 51 25 450 119Governance
Curriculum 3 5 1 3 31 3Materials
Buildings & 12 10 5 16 104 26Facilities
100%
requiring formulas for carrying out tasks -- but rather they
emphasize the accountability type. That result is further enhanced
by the large amount of attention given to Efficiency in Finance
provisions, again a detailed control over the raising and spending
of public monies.
Another cultural concern Illinois arises in the Choice column
of Table 5-3. Motivated by a fear of authority, Choice provisions
extend across three SPMs in about the same percentage -- Finance,
Governance, and Program -- while the Facilities percentage is not
far behind. Thus, what is ensured by these Choice provisions
recorded here is loca3 control, which, after all, Is partly a fear
of state authority. Typically, Choice references are requirements
for certain groups to be represented on local boards (Governance),
for tax levy or bond options to raise money to support federal
programs (Finance), ann for options for special curricula or
special schools (Program). Little curriculum has been mandated by
Illinois (until 1985, only physical education), so much of this
authority was left expressly to the districts. Of course, state
requirements in 1985 f : science, math, English, and social
sciences -- following the national reform current -- has changed.,
this. Finally, while Choice accounted for the fewest code
references in Illinois, thAs is a case -- as wAth all the states --
where examining written statutes is misleading. The absence of
state mandates tells us something, in thia case, the influence of
localism in keeping state mandates out of statues.
Page V-34
242
Turning to Wisconsin while location is still important, we
see indications of another way of viewing political authority. The
distribution of case values, seen in Table 5-4, shows that they
are much more likely concentrated on one SPM for any value, rather
than being scattered. Thus Quality is concentrated in Program
provisions (much different from Illinois), which points to a much
larger role for state mandates in school programs. That, in turn,
reflects the influence of professionals at the state level (we will
see in Chapter IX the unusual influence given to Wisconsin's chief
state school officer and school lobbies in policy making). But
this state does not go so far in extending professional influence
as to dictate Curriculum Materials; only three such provisions
appear in this state's entire code. But this statutory
reinforcement of professionals in other matters testifies to
another aspect of the state's Moralistic culture. That is the use
of political authority, through law and regulation, to provide
general public services for citizens.
Insert Table 5-4 about here
A related element of that political culture appears in the
amount of the state's code reflecting Equity, more than in other
states (Table 5-1). Again, most references to this value are
concentrated on Program Definition policies, where,
characteristically, resources are used for those who fall below
educational norms. More than in Illinois, Equity looms large in
Page V-35
243
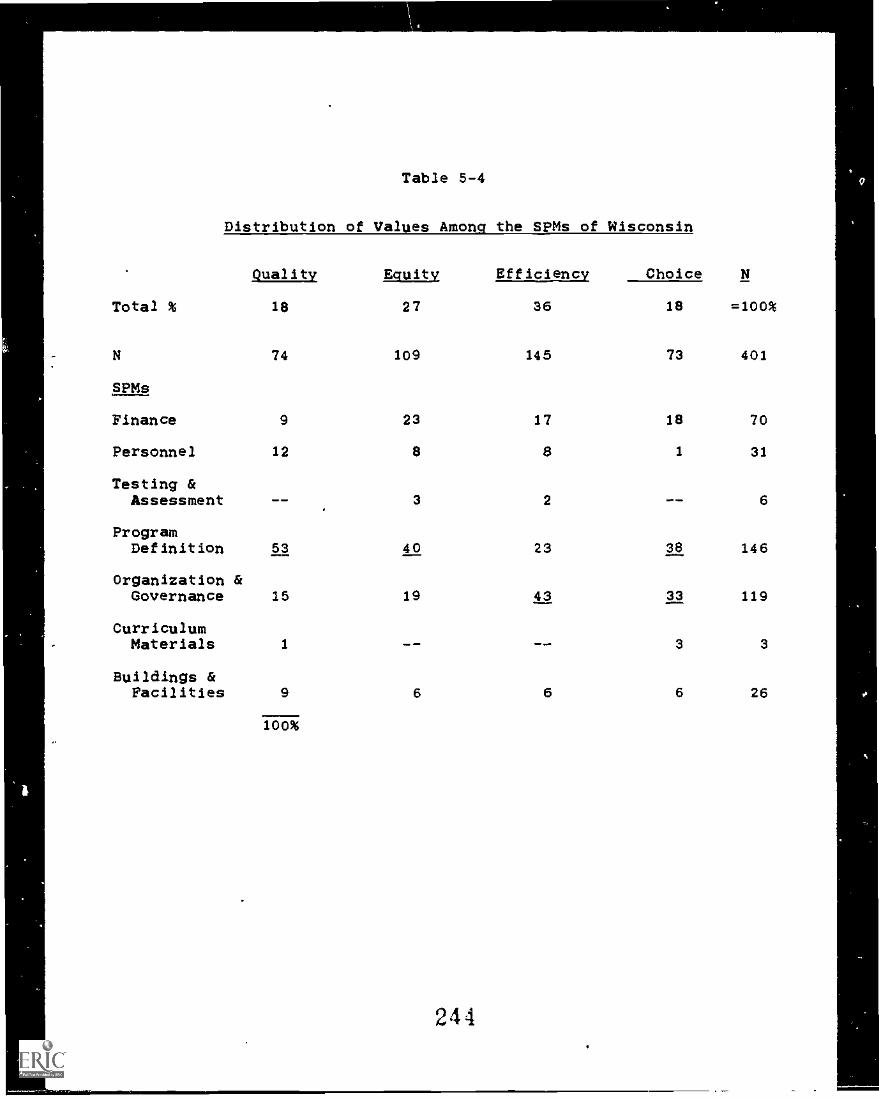
Table 5-4
Distribution of Values Among the SPMs of Wisconsin
Duality Equity Efficiency Choice N
Total % 18 27 36 18 =100%
N 74 109 145 73 401
SPMs
Finance 9 23 17 18 70
Personnel 12 8 8 1 31
Testing &Assessment 3 2 -- 6
ProgramDefinition 53 40 23 38 146
Organization &Governance 15 19 43 33 119
CurriculumMaterials 1 -- 3 3
Buildings &Facilities 9 6 6 6 26
100%
244
Finance provisions, which is seen in funding for programs designed
to narrow the norms-needs gap. Both Program Definition and Finance
SPMs show signs of a state policy elite motivated to use authority
to serve a widely perceived common good -- better educetion.
In Wisconsin Efficiency values are concentrated on Governance.
Here is seen the familiar detailing of structure and process in
local decision making in order both to facilitate citizen
participation and to protect against abuse of political authority.
As noted, this encouragement of citizen partici?ation is another
aspect of the Moralistic culture. More than in Illinois, Wisconsin
infuses its Program provisions with the value of Efficiency. Thesr,
are efforts to ensure that state-mandated programs and
formula-based resources are followed through reporting
requirements.
Finally, Wisconsin has a bit more of its code reflecting
Choice values than in Illinois, but these are spread among the SPMs
more than for other values. Thus, about one-third each of Choice
values appears in Program and in Governance. Typically, Choice is
provided for pupils in some kinds of curricula, for voters using
referenda (a practice pioneered in this state) on taxes, and for
voting for local school board members. Note how all three are
linked to Wisconsin's cultural emphasis upon citizen participation.
Summary
The distribution of values across three sample states shows
clearly that Efficiency dominates, although it looms larger in
Illinois. Equity is half again ac. important in Wisconsin, but
Page V-36
245
Quality provisions are very similar. Choice accounts for the
fewest code provisions in both states (a bit more exists !r1
Wisconsin), which may reflect the nature of statutory language, or
perhaps professional influence in shaping education towards their
goals.
Interstate analysis of these value distributions infers much
about the linkage between value preferences and state policy
mechanism choices. Distrust of political authority in Illinois,
for example, results in many Efficiency values, which by definition
restrain the exercise of authority in Governance. On the other
hand, Wisconsin seeks Quality mostly through Program, while
Illinois seeks it in expansive Personnel requirements. Equity is
pursued in Wisconsin primarily through Program Definition --
indicative of professional dominance from the state level -- but in
Illinois it is found primarily in Governance, policies aimed at
wining local control. Choice -- based on a preference for citizen
control -- is diffused in the Illinois code in three SPMs, but it
is restricted to two SPMs in Wisconsin. These contrasts typify the
kind of variation found in using law to reflect dominant political
values that the mosaic of American federalism generates.
The Weight of Values within SPMs
The preceding analyzed the weight or distribution of SPMs
within each of the four major values. Reversing the analysis, that
is, examining the weight of values within each of the SPM, will
provide insight into the value basis of these fundamental
instruments for providing educational services. We might presume
Page V-37
246
that Efficiency would be basic to Finance policy (to control the
use of public monies and to provide formula-based programs), or
that concern for Quality would underlie Program Definition.
Analysis of the distribution of these values by SPMs and by states
enables us to test-those assumptions.
The Overall Picture
Table 5-5 displays the distribution of the SPMs references in
the two states. It is immediately evident that there are some
distinctive similarities in the clustering of these figures.
Insert Table 5-5 about here
For example. Governance receives the most code attention in
Illinois and is second ilighest in Wisconsin. Also, two values
account for half or more all provisions. In /11inois it is
Governance and Finance (60%), and in Wisconsin Program Definition
and Governance (66%). On the other hand, Testing and Curriculum
Materials receive remarkably little Provision in either state.
Strikingly, the rank order of these SPMs among the two states is
high; the Rho coefficient is +.86. One inference evident even at
this gross level is that states have somewhat similar priorities in
legislating their educational SPMs. They greatly stress
Governance, moderately provide for Program and Finance, and skimp
Testing and Curriculum Materials.
Within each of those SPMs, however, what is their priority in
values? The cumulative picture is shown in Table 5-6, where the
Page V-38
247
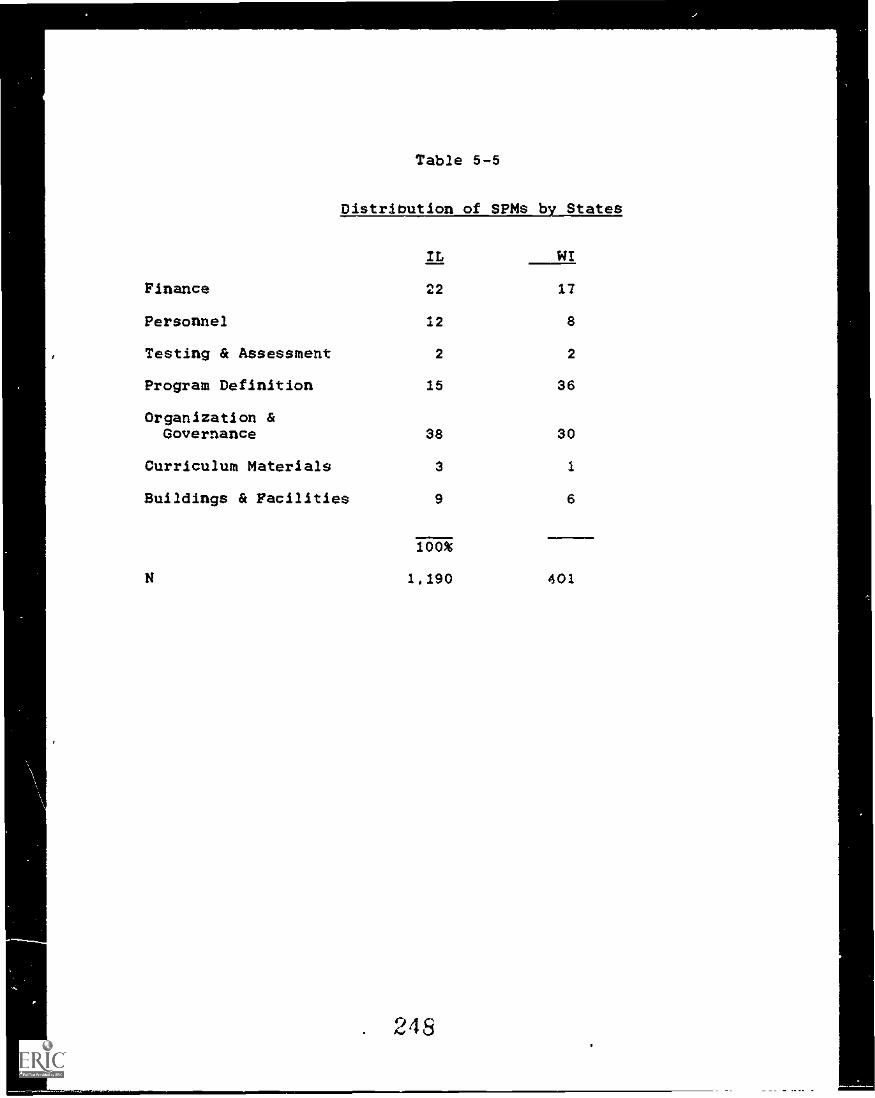
Table 55
Distribution of SPMs by States
IL WI
Finance 22 17
Personnel 12 8
Testing & Assessment 2 2
Program Definition 15 36
Organization &Governance 38 30
Curriculum Materials 3 1
Buildings & Facilities 9 6
100%
1,190 401
248
distribution of each SPM for the four values is shown for each
state. For example, across the first row, we can see the
proportion of each value in the Finance SPM for each state; the
percentages for each value are grouped by state for comparison.
Insert Table 5-6 about here
The conclusions are that;
1. Finance and Governance are dominated by the Efficiency
value in the Individualistic culture of Illinois; moralistic
Wisconsin stresses Equity as well.
2. Personnel is dominated by the Quality value in Illinois,
but by Efficiency in Wisconsin.
3. Program is split among Quality and Equity in Illinois and
among all four values in Wisconsin.
4. Governance is heavily concentrated on Efficiency in
Illinois and Wisconsin.
5. Facilities provisions are spread evenly among all values
in both states.
6. The very small total tallies for Testing and Curriculum
Materials make the percentages distorted, and so are not analyzed
further here.
These findings challenge simple assumptions about the
single-value basis of any SPM, because the expected values do not
appear generally in all states. Personnel and Program Definition
seem rooted in notions of improving the quality of education;
Page V-39
249
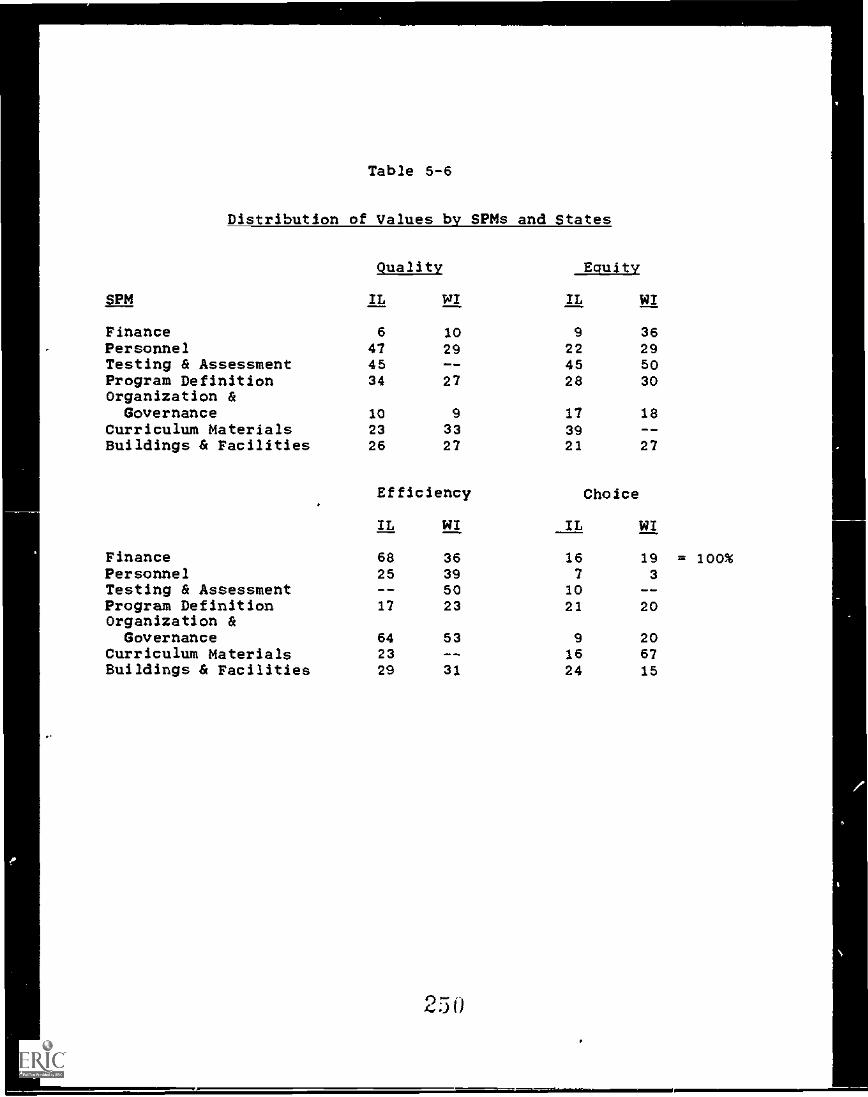
Table 5-6
Distribution of Values by SPMs and States
Quality Equity
IL WI IL W/
Finance 6 10 9 36Personnel 47 29 22 29Testing a Assessment 45 -- 45 50Program Definition 34 27 28 30Organization a
Governance 10 9 17 18Curriculum Materials 23 33 39 ..m..41w
Buildings & Facilities 26 27 21 27
Efficiency
IL WI
Choice
IL WI
Finance 68 36 16 19 =Personnel 25 39 7 3Testing a Assessment 50 10 --
Program Definition 17 23 21 20Organization a
Governance 64 53 9 20Curriculum Materials 23 __ 16 67Buildings & Facilities 29 31 24 15
415')4 (
100%
indeed, Quality provisions for these two SPMs do dominate in
Illinois but not in Wisconsin. Finance is presumably oriented to
Efficiency, but, again. Wisconsin loads this SPM just as heavily
with Equity considerations, Governance should focus upon
Efficiency and Choice, but Illinois and Wisconsin focus only upon
Efficiency. Facilities should deal with Efficiency concerns, but
the two states spread this SPM among all the values,
State Profile of Values with SPMs
Clearly then, conditions distinctive to these states' cultures
and a political systems must contribute to such differentiation in
the value basis of these SPMs. Each state must share some common
value concerns--the dominance of Governance and of Efficiency are
illustrative. But states also have distinctive concerns, for
example, Wisconsin's concern for Equity but low interest in
Personnel. Given such distinctive influences among the states, it
would be useful to profile each state's distribution of values
within each SPM. Tables 5-7 ard 5-8 set out these profiles for the
two states for which we can provide some code examples of values
within SPMs.
Insert Table 5-7 & 5-8 about here
Illinois, Governance (38% of all provisions) and Finance
(22%) dominate this state's code. In both SPMs, Efficiency
accounts for about two-thirds all tallies. Personnel loads heavily
upon Quality, while Program relies upon both it and Equity.
Page V-40
251
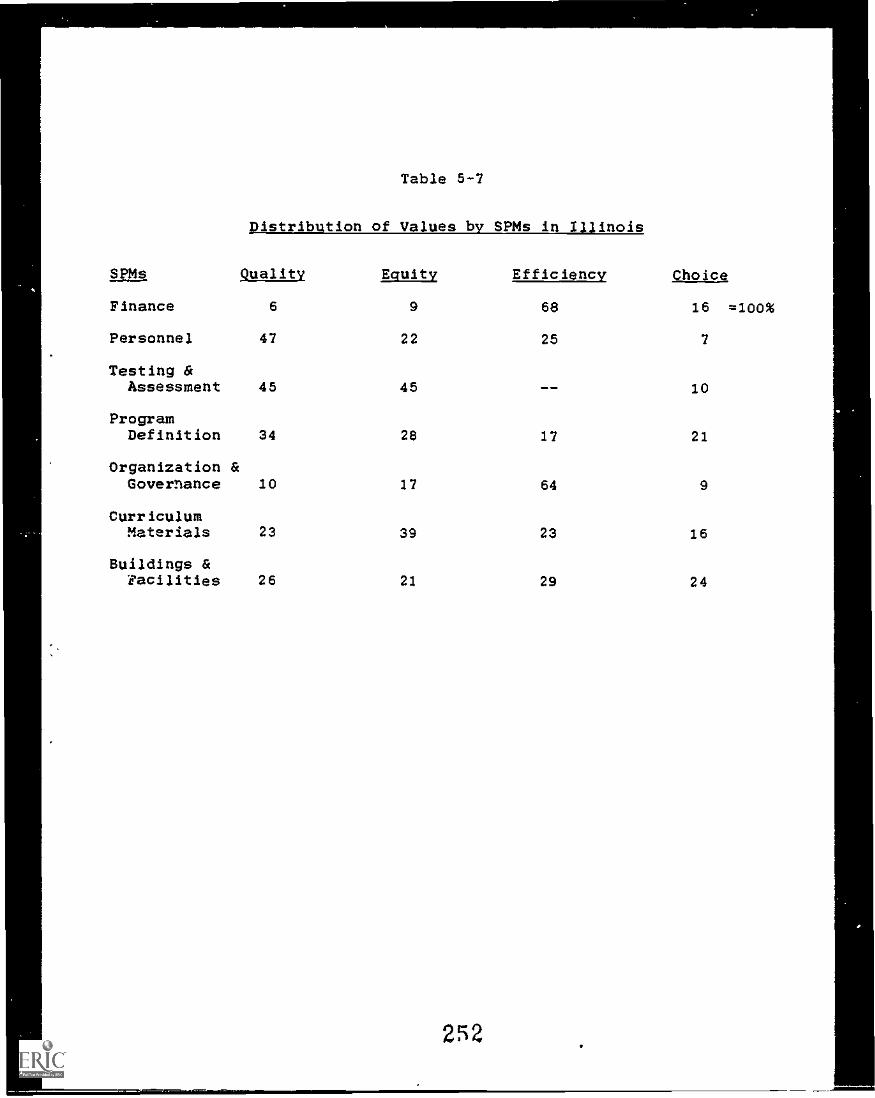
Table 5-7
Distribution of Values by SPMs in Illinois
SPMs Quality Efficiency Choice
Finance 6
.Equity
9 68 16
Personnel 47 22 25 7
Testing &Assessment 45 45 10
ProgramDefinition 34 28 17 21
Organization &Governance 10 17 64 9
CurriculumMaterials 23 39 23 16
Buildings &Facilities 26 21 29 24
252
=100%
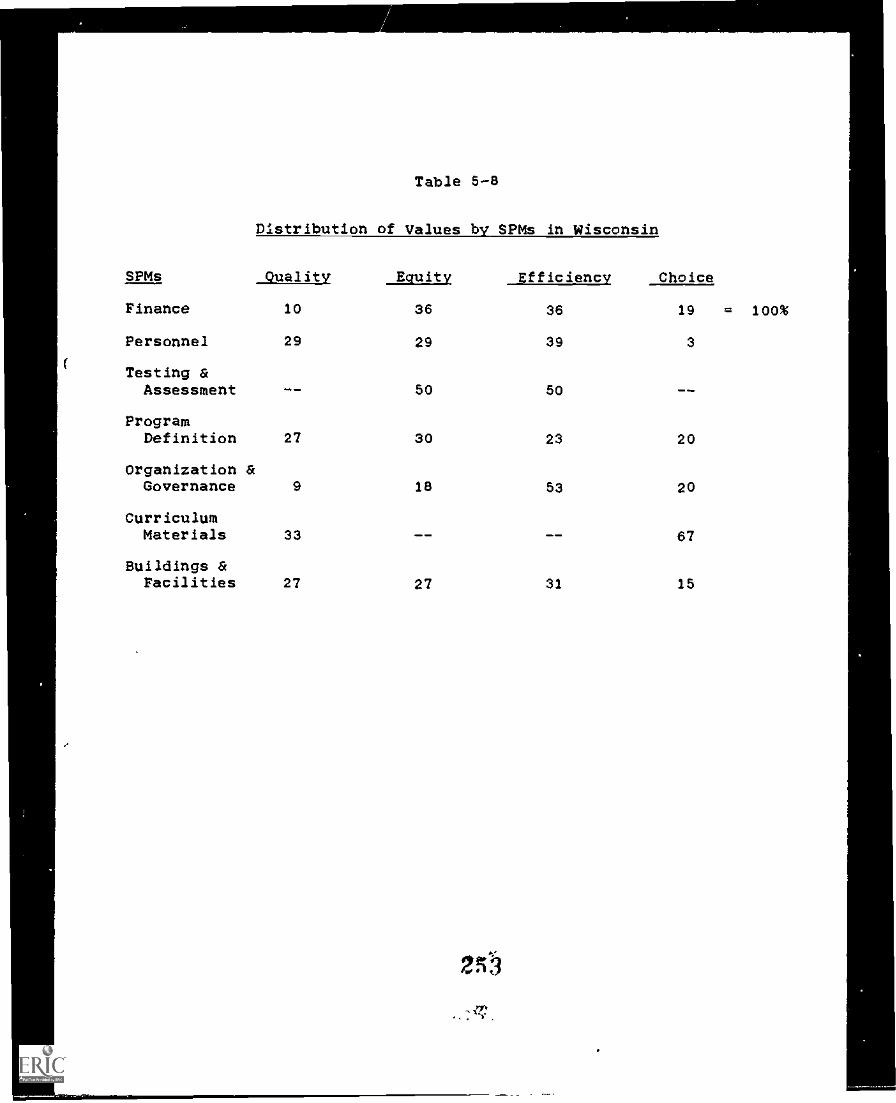
SPMs
Table 5-8
Distribution of Values by SPMs in Wisconsin
ChoiceQuality Equity Efficiency
Finance 10 36 36 19 =
Personnel 29 29 39 3
Testing &Assessment -- 50 50 --
ProgramDefinition 27 30 23 20
Organization &Governance 9 18 53 20
CurriculumMaterials 33 67
Buildings &Facilities 27 27 31 15
zn*)
100%
Facilities is the SPM most balanced among ell values. Little
attention is given to Testing and Curriculum Materials (4%).
Wisconsin. Program (36%) and Governance (30%) dominate this
state's code. The first SPM is spread rather evenly among the
values unlike Illinois), but the second loads heavily upon
Efficiency. Finance gets limited code attention, with Equity and
Efficiency equally dominant in it. The remaining four SPMs attract
a total of only 16 percent of the total code.
To illustrate every combination of SPMs and values in states
(that is, 56 examples) would confuse more than add to
understanding. But not untypical examples from one state --
Illinois -- will provide an appreciation of the way in which these
values are implicit in SPMs. These arb set out in Exhibit 5-1.
Insert Exhibit 5-1 about here
Note how some sections infer the presence of more than one value
(recall that both are entered as separate tallies). The
percentages for any SPM provide a rough sense of what values get
priority, and the exact wording (edited slightly for clarity)
demonstrates the care needed to specify legislative purposes and
processes. Behind these extracts lie a mass of wordage designed to
flesh out purpose and process, something hinted at in the
Program-Quality and the Governance-Efficiency examples.
Summary
Page V-41.. ....I,
254
Clarifying the role of values in educational policy making
takes many routes -- understanding their operation in the
perceptions and program judgments of policy makers, sensing the
influence world in which these actors perform, and so on. In this
chapter we have explored a source of values that lies in
authoritatively legitimated public policies of the states -- their
education statutes. These were passed at different times in the
states' history, of course, but in combination, they represent the
accumulated record of policy value preferences within each state.
From this accumulated record four major values can be
identified: Choice, Equity, Efficiency, and Quality. As the first
section pointed out, there is considerable difference among these
values in their inherent meaning, differences even in how they are
sequenced into the body of law. There is also variation among the
states in how these code values are distributed across our seven
SPMs and in how the SPMs are differently constituted by code
values. Some of that difference may well rest in the distinctive
political culture that policy makers bring to their tasks; the
contrasts between Illinois and Wisconsin are striking evidence.
However, there also e.cist common approaches to these values, as
both states must make use of Efficiency to strengthen their
democratic accountability and to distribute their resources
rationally.
Consequently, just as chapter I showed in general terms that
there are differences and commonalities in the environment within
which state education policy making proceeds, this chapter
Page V-42
demonstrates specific similar and dissimilar features of education
law and their inherent values. That same search for both patterns
will illuminate the next chapter's examination of policymakers'
perceptions of their states' political culture and the consequences
that has for different policy choices.
Page V-43
. Z56
Exhibit 6-1
Illustrations of Values in SPMs in Illinois*
(Within each SPM, values are presented in order of frequency, noted
by %)
FINANCE
Efficiency. (68%) [Economic type) [Tax rates are set for]
districts maintaining only grades 1-8 [at] .92% for educational
purposes and [at] .25% for operations, building and maintenance
purposes. [17-2(1)] (Accountable type) [Districts under 100,000
population may tax annually] at not to exceed the maximum rates and
for the specified purposes. (17-2).
Choice. (16%) (All districts under 500,000--all but Chicago]
may, by a proper resolution, cause a proposition to increase the
anntal tax rate for educational purposes to be submitted to the
voters...(17-3).
gauity. (8%) [When 5% or more of a district's pupils have
parent working for the state, the Superintendent of Public
Instruction] semi-annually shall direct.the State Comptroller to
pay an amount sufficient to pay 1/4 the annual tuition cost of such
children...(18-4.2).
Quality. (6%) [School boards may] levy an annual tax...used
only for maintenance of health care facilities and to provide
primary health care...(17-2.2b)
PERSONNEL
Page V-44
257
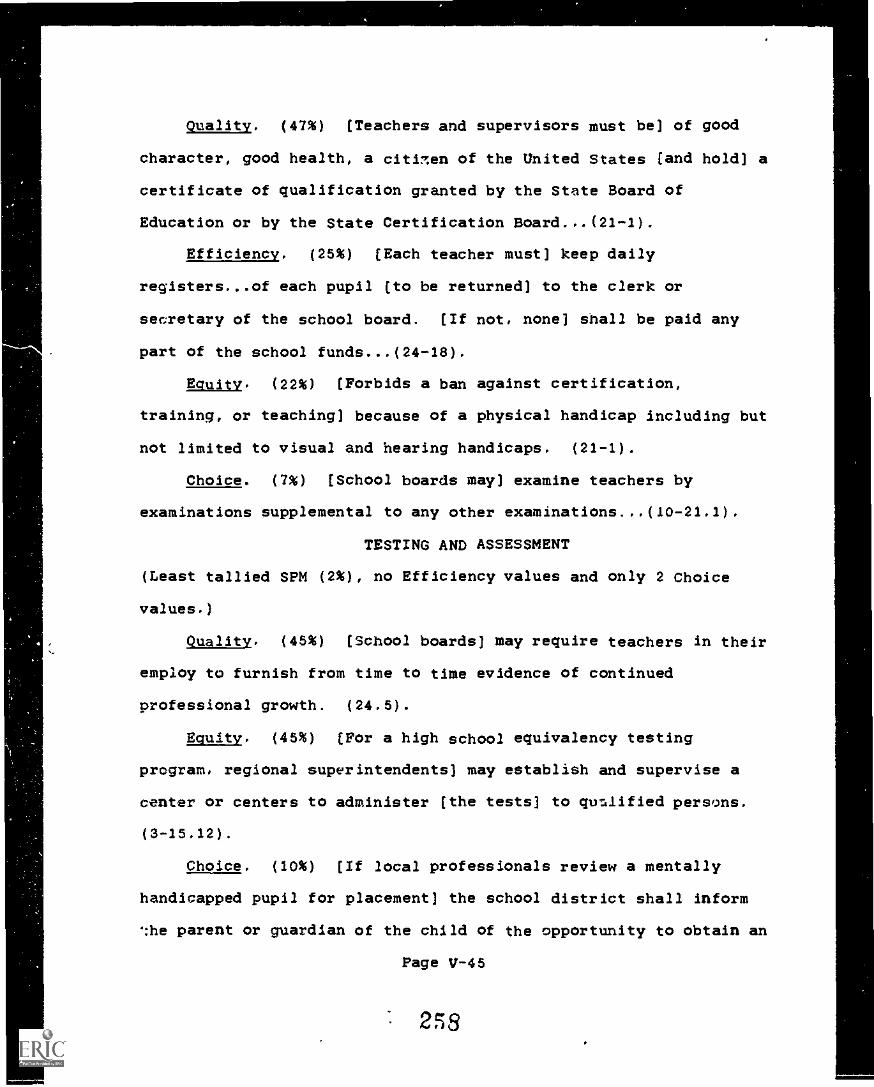
Quality. (47%) [Teachers and supervisors must be] of good
character, good health, a citizen of the United States [and hold] a
certificate of qualification granted by the State Board of
Education or by the State Certification Board...(21-1).
Efficiency. (25%) [Each teacher must] keep daily
registers...of each pupil [to be returned] to the clerk or
secretary of the school board. [If not, none] shall be paid any
part of the school funds...(24-18).
Equity. (22%) [Forbids a ban against certification,
training, or teaching] because of a physical handicap including but
not limited to visual and hearing handicaps. (21-1).
Choice. (7%) [School boards may] examine teachers by
examinations supplemental to any other examinations...(10-21.1).
TESTING AND ASSESSMENT
(Least tallied SPM (2%), no Efficiency values and only 2 Choice
values.)
Quality. (45%) [School boards] may require teachers in their
employ to furnish from time to time evidence of continued
professional growth. (24.5).
Equity. (45%) (For a high school equivalency testing
program, regional superintendents) may establish and supervise a
center or centers to administer [the tests] to qu.lified persons.
(3-15.12).
Choice. (10%) [If local professionals review a mentally
handicapped pupil for placement] the school district shall inform
'the parent or guardian of the child of the opportunity to obtain an
Page V-45
258
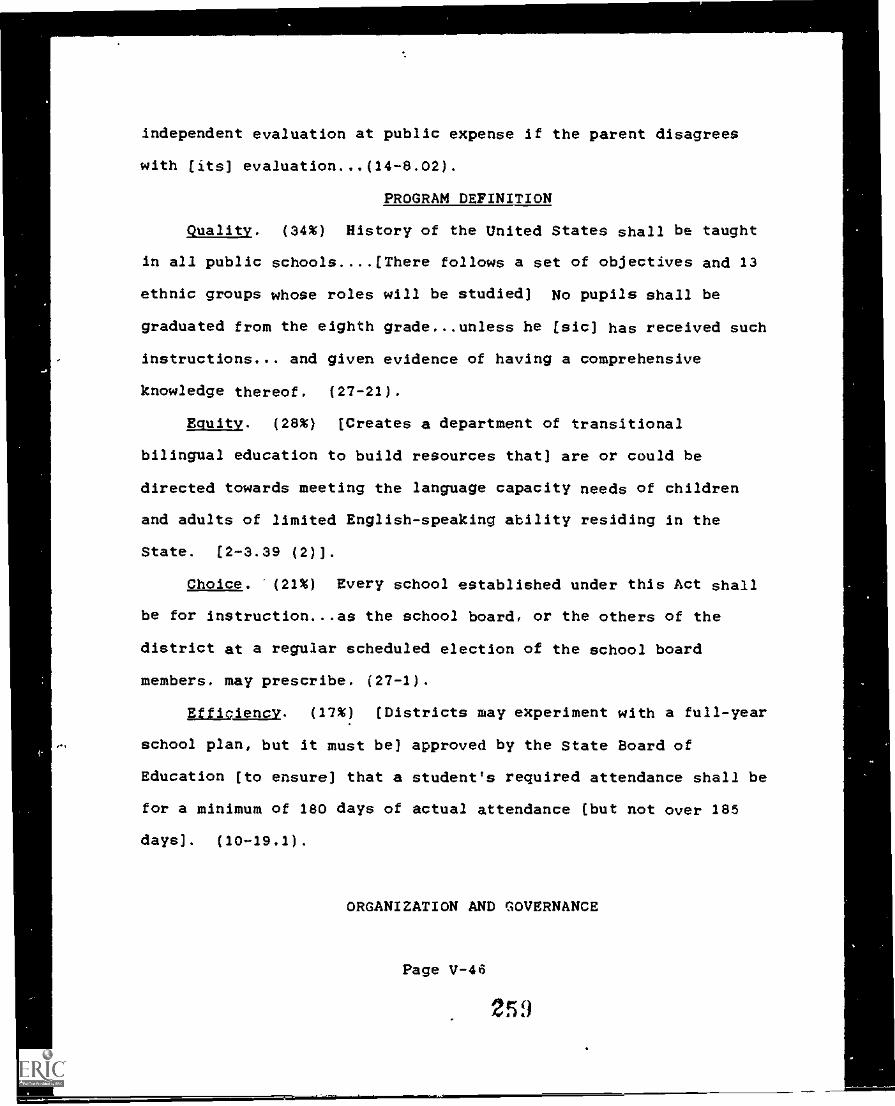
independent evaluation at public expense if the parent disagrees
with (its) evaluation...(14-8.02).
PROGRAM DEFINITION
Quality. (34%) History of the United States shall be taught
in all public schools....(There follows a set of objectives and 13
ethnic groups whose roles will be studied) Ho pupils shall be
graduated from the eighth grade...unless he (sic) has received such
instructions.., and given evidence of having a comprehensive
knowledge thereof. (27-21).
Equity. (28%) [Creates a department of transitional
bilingual education to build resources that) are or could be
directed towards meeting the language capacity needs of children
and adults of limited English-speaking ability residing in the
State. (2-3.39 (2)).
Choice. (21%) Every school established under this Act shall
be for instruction...as the school board, or the others of the
district at a regular scheduled election of the school board
members. may prescribe. (27-1).
Efficiency. (17%) (Districts may experiment with a full-year
school plan, but it must be) approved by the State Board of
Education (to ensure) that a student's required attendance shall be
for a minimum of 180 days of actual attendance (but not over 185
days). (10-19.1).
ORGANIZATION AND GOVERNANCE
Page V-46
259
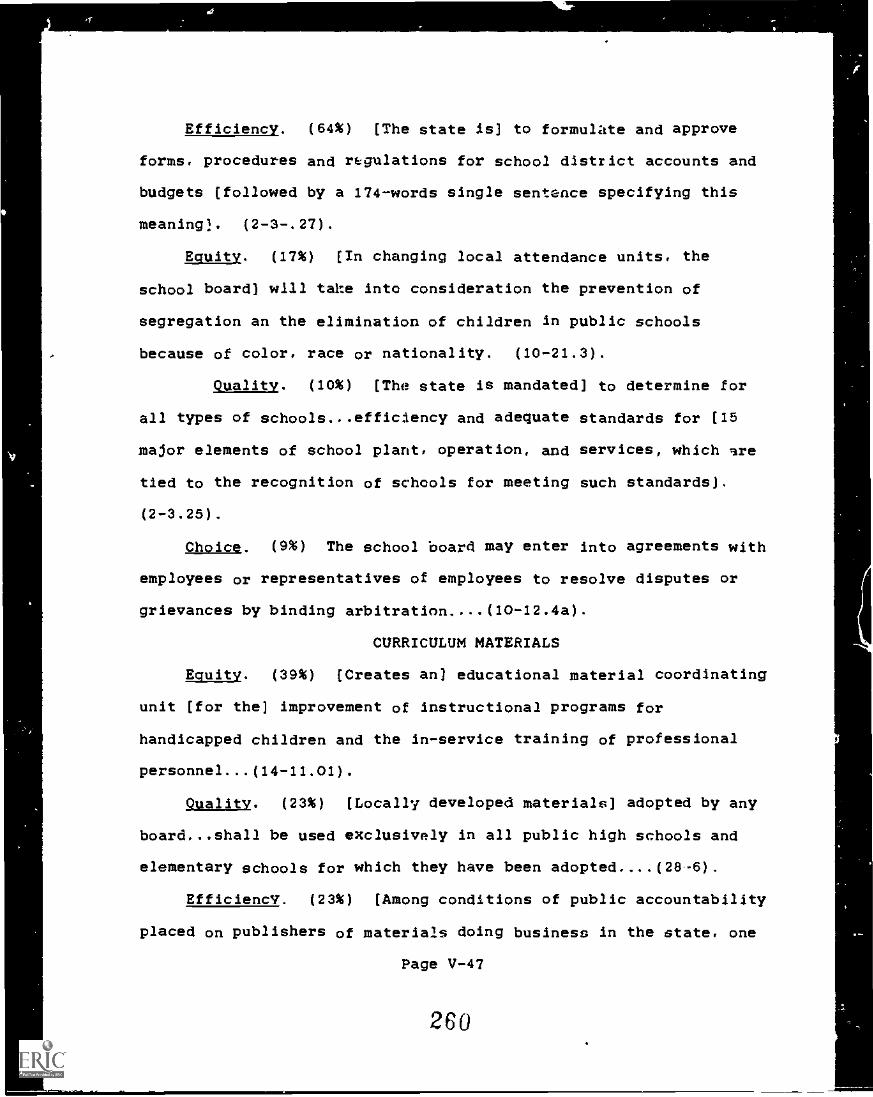
Efficiency. (64%) [The state is] to formulate and approve
forms, procedures and regulations for school district accounts and
budgets [followed by a 174-words single sentence specifying this
meaning]. (2-3-.27).
Equity. (17%) [In changing local attendance units, the
school board] will take into consideration the prevention of
segregation an the elimination of children in public schools
because of color, race or nationality. (10-21.3).
Quality. (10%) [The state is mandated] to determine for
all types of schools...efficiency and adequate standards for [15
major elements of school plant, operation, and services, which lre
tied to the recognition of schools for meeting such standards].
(2-3.25).
Choice. (9%) The school board may enter into agreements with
employees or representatives of employees to resolve disputes or
grievances by binding arbitration....(10-12.4a).
CURRICULUM MATERIALS
Equity. (39%) [Creates an] educational material coordinating
unit [for the] improvement of instructional programs for
handicapped children and the in-service training of professional
personnel...(14-11.01).
Quality. (23%) [Locally developed materials] adopted by any
board...shall be used exclusively in all public high schools and
elementary schools for which they have been adopted....(28-6).
EfficiencY. (23%) [Among conditions of public accountability
placed on publishers of materials doing business in the state, one
Page V-47
260
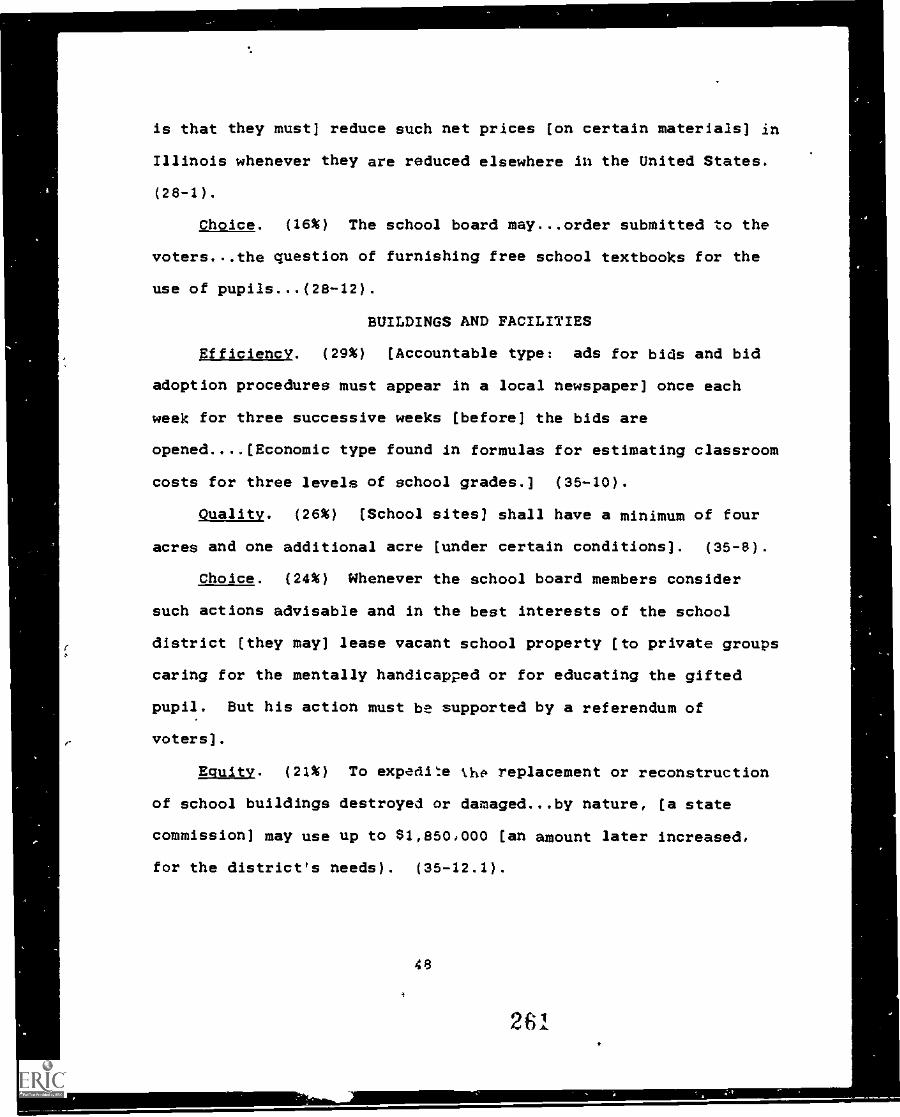
I.
is that they must] reduce such net prices (on certain materials] in
Illinois whenever they are reduced elsewhere in the United States.
(28-1).
Choice. (16%) The school board may...order submitted to the
voters...the question of furnishing free school textbooks for the
use of pupils...(28-12).
BUILDINGS AND FACILITIES
Efficiency. (29%) [Accountable type: ads for bids and bid
adoption procedures must appear in a local newspaper] once each
week for three successive weeks [before] the bids are
opened....[Economic type found In formulas for estimating classroom
costs for three levels of school grades.] (35-10).
Quality. (26%) [School sites] shall have a minimum of four
acres and one additional acre [under certain conditions]. (35-8).
Choice. (24%) Whenever the school board members consider
such actions advisable and in the best interests of the school
district [they may] lease vacant school property [to private groups
caring for the mentally handicapped or for educating the gifted
pupil. But his action must be supported by a referendum of
voters].
Equity. (21%) To expedite khp replacement or reconstruction
of school buildings destroyed or damaged...by nature, [a state
commission] may use up to $1,850,000 (an amount later increased,
for the district's needs). (35-12.1).
48
281
REFERENCES
Boyd, William. (1476). The public, the professionals, and
educational policy-making: Who governs? Teachers College
Record 77.
Cobb, Roger & Elder, Charles. (1983). Participation in American
politics, (3rd ed.). Baltimore: John Hopkins University Press.
Lineberry, obert & Sharkansky, Ira. (1978). Urban Politics and
public policy, (3rd ed.). New York: Harper & Row.
McGivney, Joseph. (1984). State educational governance patterns.
Educational Administration Quarter1V, 20(2), 43-63.
Peterson, Paul. (1985). The politics of school reform. Chicago:
University of Chicago Press.
Tyack, David. (1974).' The one best system. Cambridge, MA: Harvard
University Press.
& Hansot, Elizabeth. (1982). Managers of virtue.
New York: Basic.
Wirt, Frederick. (1981). Professionalism and political conflict: A
developmental model. Journal of Public Policy 1, 61-93.
& Kirst, Michael. (1982). Schools in conflict.
Berkeley, CA: McCutchan.
49
262
CHAPTER VI
POLITICAL CULTURE VALUES Or
STATE EDUCATION POLICYMAKERS
Cultural Perspectives on Values
An explicit assumption in this study has been that Americans
do not all share similar values about education -- or almost any
other policy. There is no mass American, but rather differences
about how a public policy is to be financed, implemented, and
evaluated. oncz sou;ce of such differences lies in personal
attributes -- status, gtAnder, race, and so on -- which cause
different judgnnts of needs to policymaking. Typical of thit-..
approach is the annual Gallup polls on the state of education
conducted for Phi Delta Kappa. While there is much use in studying
education values this way, it telZ us little about the values
motivating those who mak* policy. In this project, those values
from the past appear In statl.ctes (chapter V) and from the present
in judgments about contemporary policy issues (chapters III-IV).
We have noted already, however, that personal attributes of policy
makers do not fully account for differences in policy judgments
(see chapter II).
One possible explanation of differences lies in the culture in
which policymakers live. Let us first be clear about this basic
Page VI-I
283
(-
,-
term, culture. As an explanation of human institutions and human
behavior, culture is a concept rooted in social anthropology. Its
central thrust has been that humans are socialized to accept
particular behaviors and beliefs that are appropriate for the
values dominant in a given society. The pioneering work of Frank
Boas was later given wide currency by the popular reports of
"primitive" cultures by Margaret Mead (1925) and Ruth Benedict
(1934). Here we see institutions prescribing roles to its members
for all the diverse functional tasks of living together and
surviving in the face of an often hostile natural and social world.
But we also see that the precise content of roles and values vary
with the society studied, that in Benedict's phrase, there are
"patterns of culture."
A parallel intellectual development was the belief emerging
from the late 19th century that each of the major "civilized"
nations possessed a "national character." Here, students of
national politics ascribed prototypical behavior to each nation and
its citizens, with consequences for how that nation operated in the
world of international politics. This notion of "enduring
personality and life styles" (Inkeles, and Levinson, 1954) to be
found in each nation was thought to explain international behavior,
berause behavior was traced to national socialization to
distinctive values and actions by dominant institutions.
Political Culture and the American States
How would such learning apply to political behavior within the
nation? Answering that query began with the pioneering ideas of
Page VI-2
284
Gabriel Almond (1956) and developed during the 1960's out of
Americans' interest in the differences among democracies (Almond
and Verba, 1963) and among the developing nations (Pye and Verba,
1966). This political culture was conceptualized as an influence
shaping both action and values within a political system. The
concept was defined broadly as:
The set of attitudes, beliefs, and sentiments which give orderand meaning to a political process and which provide theunderlying assumptions and rules that govern behavior in thepolitical system. It encompasses both the political ideals andthe operating norms of a polity. [1t1 is the product of boththe collective history of a political system and the lifehistories of the members of that system, and thus it is rootedequally in public events and private experiences (Pye, 1968, P.218).
This concept has aided greatly in explaining differences among
nation-states, and specialists in the states of the American polity
quickly asked whether it might have application to their units of
analysis. More importantly, if the root values could be tapped
with this concept, that is, if one :ould find those values "which
provide the underlying assumptions and rules that govern behavior
in the political system" of the state, would differences in such
cultures help explain the obvious differences among their public
policies? V. 0. Key (1949) shortly after World War II noted how
Southern cultural patterns produced a distinctive kind of Southern
politics with its unique foous race. As poll data became more
available and extensive, different analysts noted regional patt,Jrns
of political attitudes, enough to enable one to infer the existence
of distinctive political cultures (Patterson, 1968).
Page VI-3
265
The ElaLar Model of Political Culture
The application of this concept to the American states which
has had most use derived from the work of Daniel Elazar, from his
seminal statement of such a theory (1966) and its in-depth
exploration in the midwest (1970). He defined political culture
simply as "the particular pattern of orientation to political
action in which each political system is embedded" (1984, p. 109).
Three aspects of political culture were crucial for understanding
how such ideas shaped governing:
1. the set of perceptions of what politics is and what can beexpected from government, held by both the general publicand the politicians;
0 2. the kinds of people who become active in government andpolitics, as holders of elective offices, members of theLareaucracy, and active political workers;
3. the actual way in which the art of government is practicedby citizens, politicians, and public officials in the lightof their perceptions (1964, p. 112).
These perceptions and values did not lead one to expect there
would be a uniform political culture in America, because our
political ideology contained certain contradictions Which could
lead to different cultural expectations of the political system.
Some citizens expect the political system to maintain and protect
the existing political order, others see the political system as a
place where Individual welfare can be pursued, and yet others see
it as a means for helping everyone live a better life. These
threefold and contrasting ideas are concentrated in different
geographical locations throughout our country. Local institutions
Page VI-4
216
reinforce these ideas for successive generations and infuse the'l
into their political practices.
There has been much work on the historical origins of such
differences. Cultural origins have been found in the different
streams ef migrants and immigrants moving into and across the
country. These streams brought different value systems te
different locales. Scholars have traced these flows or iersons;
especially of their religions which are seen as a strong underlying
factor, in regional cultures (see separate analyses in Elazar and
Zikmund, 2975). Geographers have found that state and regional
diversity existed in a wide variety of behaviors, including the
political and religious (Gastil, 2975; Zelinsky, 1973; Gausted,
1962). Political scholars have sought and found interstate
correlations between religions and policy outputs (Fairbanks, 2977;
Hutcheson and Taylor, 1973; Sweet, 2952).
Underlying these political culture differences in Elazar's
model are three distinctive types of beh..---lor, perceptions and
value -- with consequent differences for their political systems.
We will sketch these briefly and then detail how each culture views
particular objects in the political world.
Traditionalistic Political Culture (Traditionalist PC)
Traditionalists see the main function of government as
maintaining established patterns of life through control by a
governing elite. (Traditionalist cultures are usually strongest in
agricultural societies.) Political partisanship is subordinated "o
personal ties among the elite. Traditionalist PCs initiate new
Page V1-5
267
programs only if they serve the interests of the governing elite.
Bureaucracy is viewed negatively, because it seeks to depersonalize
governance by applying universalistic and rational norms to
political relationships. Hence Traditionalist PCs prefer no merit
system; relying instead on direct control of government
functionaries by the elite.
In Traditionalist PCs, politics is viewed as a privilege.
However, only those with claims to office that are "legitimate" are
eligible to participate, which means only the elite or those they
control. Moreover, parties are to be avoided. They are prone to
recruit xhe wrong people to power, and have a tendency to
substitute ideological principles for the interpersonal loyalties
needed for support elite role. Consequently, political competition
is to be avoided, or at least oriented to elite values, which means
a one-party system. We can recognize in Traditionalist PCs the
host of small communities and states dominated by the elite of a
single-basis industry or agriculture) such places have
traditionally ignored new needs and challenges, assured that their
rule is for the good of all.
Individualistic Political Culture (Individualistic PC)
Where Traditionalistic PCs defines the public good in elitist
terms, in Individualistic PCs that good is defined on the basis of
individual interest. Government, like the economy, is seen as a
kind of marketplace, designed to enable citizens to pursue
improvement of their own improving one's individual lots.
Government't:1 proper role is to promote economic development, for
Page VI-6
266
the economy is restricted to private initiative; those who enter
the marketplace in both the government and economy respond to two
sources. One is public opinion (the collective mobilization of
individual demands) focused through a strong political party; the
second are the entrepreneurs who possess economic resources needing
development (they, too, work best with tn organized party that can
make governmental arrangements). Bureaucracy is a problem in
Individualist PCs; when efficient, it is responding to rational
norms that can end up constraining favors to private entrepreneurs.
As for politics, in tile Individualist PCs it is a dirty
business, left to lesser persons willing to wallow in it; so
politics should be participated in by professional politicians.
However, parties are good. They help mobilize and focus individual
interests, and they act like business organizations (distributing
rewards to the loyal or penalties to the opponents); therefore, the
party should be cohesive. Party competition should be expected, of
course, but it should not be competition over issues (opponents to
entrepreneurs can too easily be mobilized) but over winning public.
office. /n short, competition is directed to winning whJ-h will
bring the material favors that inhere in office. °To the victor
belongs the spoils" is an archetypical Individualist PC concept.
/n /ndividualist PCs we recognize the strong party machines so
long iden*ified with big cities (although rural Individual PC
machines may have been even more extensive). On the urban scene,
party and business work together to foster urban development.
Economic expansion is pursued for the jobs and profit it brings,
Page VI-7
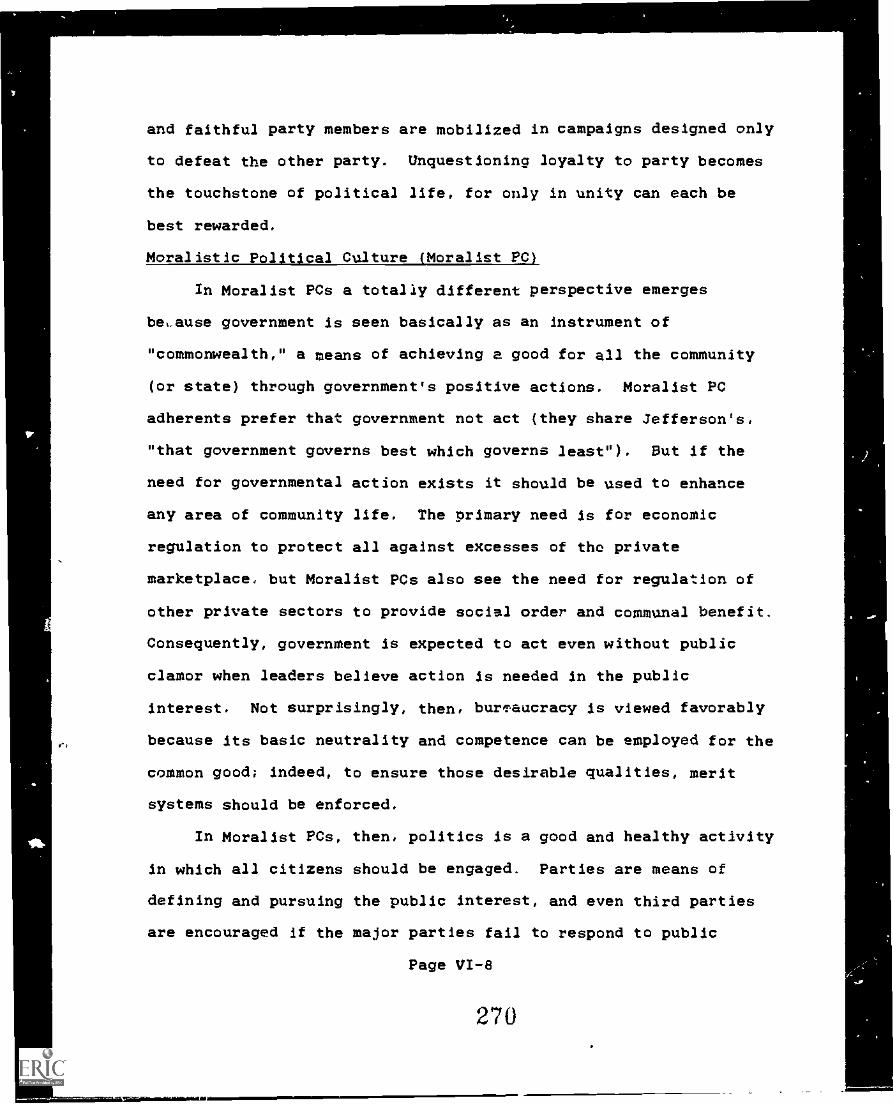
and faithful party members are mobilized in campaigns designed only
to defeat the other party. Unquestioning loyalty to party becomes
the touchstone of political life, for only in unity can each be
best rewarded.
Moralistic Political Culture (Moralist PC)
In Moralist PCs a totally different perspective emerges
beLause government is seen basically as an instrument of
"commonwealth," a means of achieving a good for all the community
(or state) through government's positive actions. Moralist PC
adherents prefer that government not act (they share Jefferson's,
"that government governs best which governs least"). But if the
need for governmental action exists it should be used to enhance
any area of community life. The primary need is for economic
regulation to protect all against excesses of the private
marketplace, but Moralist PCs also see the need for regulation of
other private sectors to provide social order and communal benefit.
Consequently, government is expected to act even without public
clamor when leaders believe action is needed in the public
interest. Not surprisingly, then, burTaucracy is viewed favorably
because its basic neutrality and competence can be employed for the
common good; indeed, to ensure those desirable qualities, merit
systems should be enforced.
In Moralist PCs, then, politics is a good and healthy activity
in which all citizens should be engaged. Parties are means of
defining and pursuing the public interest, and even third parties
are encouraged if the major parties fail to respond to public
Page VI-8
270
concerns. In short, loyalty to party is of less importance than to
principles and issues which affect the public good. Party
competition, therefore, should take place over such issues and
should be oriented to winning. The goal is not jobs that victory
brings but the chance to devise policies that will promote the
common weal. Moralist pc has been the source of most reforms of
the political, economic, and social subsystems throughout our
history. Government and politics are good means to even better
ends for everyone. But if the existing means are achieving bad
ends, Moralist PC seeks to change both.
Table 6-1 draws together the diverse strands of these three
cultures for focused presentation, and we shall shortly turn to
demonstrating these items' utility in the present research.
Insert Table 6-1 about here
Are Differences in Culture and Policy Related?
While this concept has intrinsic interest for explaining the
differences in cultural life among Americans, there is a greater
utility if these differences could explain variations in public
policy among the 50 states. Recent research shows that these three
cultures, derived from historical roots (Blazer, 1975, parts 2-3,
Appendices), are indeed associated with differences in policies and
politics. When political culture is operationalized as an interval
measure (Sharkansky, 1969). it can be used as an independent
variable in multi-variate analyses policy outputs.
Page V/-9
2 71
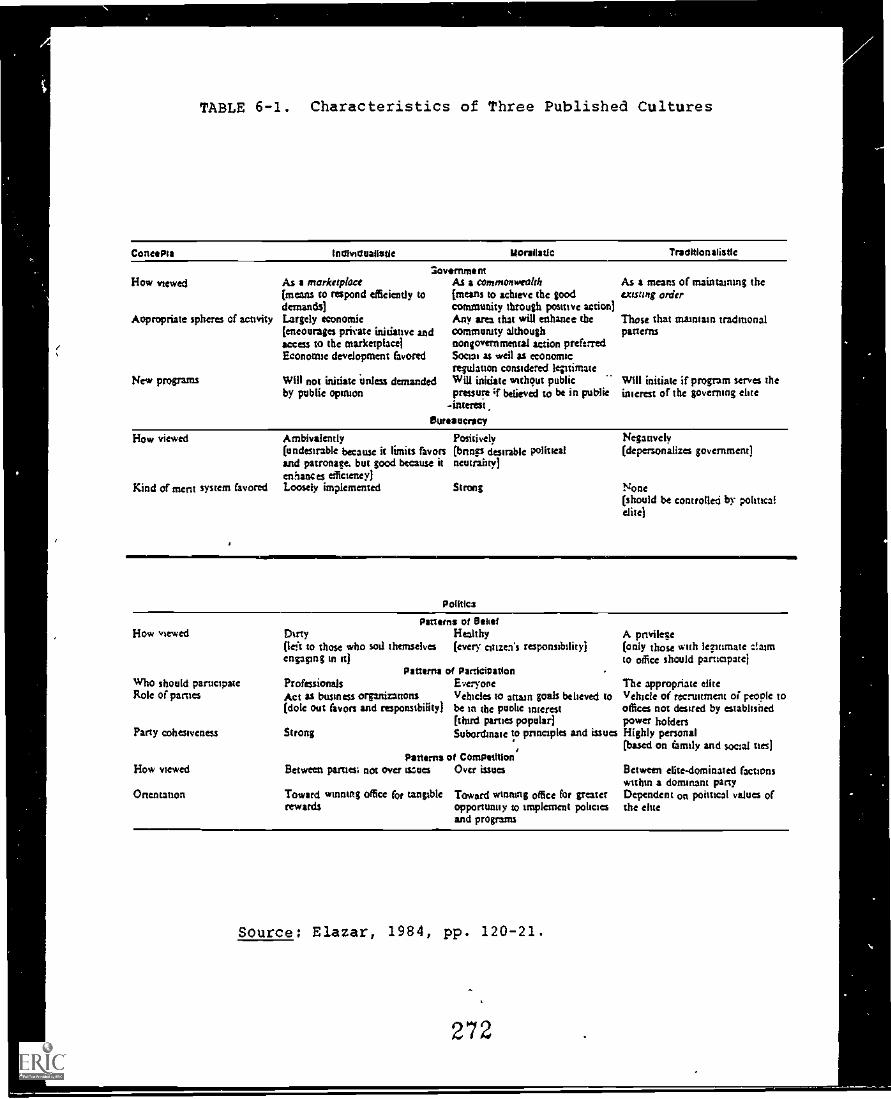
\
(
TABLE 6-1. Characteristics of Three Published Cultures
Contents individualistic Moralistic Traditionalistic
3overnme ntHow viewed As a marketplace
(mem co respond effieiemly todemands)
Aopropriate spheres of activity Largely economic[encourages private initiative andaccess to the marketplace]Economic development favored
New programs Will not initiate inkiest demandedby public opinion
As a commonwealth(means to achieve the goodcommunity through positive action)Any arra that will enhance thecommunity althoughnongovernmental action preferredSoma. as well as economicregulation considered iqstimateWill initiate without public
..
pressure 4f believed to be in public-intereit
bureaucracy
As a means of maintaining theLusting order
Those that maimam tradmonalpmem
Will initiate if program serves theinierest of the governing elite
How viewed
Kind of merit system favored
Ambivalently(undesirable because it limits favonand patronage. but good because itenhanos efficiency)LOOS* implemented
Positively(bnngs desirable politicalneutrahty)
Strong
Negatively(depersonalizes government)
None(should be controlled by politicalelite)
Polities
How viewed
Who should participateRole of parties
Party cohesiveness
How viewed
Orientation
Patterns 01 BetioDirty Healthy(left to those who sod themselves (every atizea's responsibility)engaging in it)
Patterns of ParticipationProfessionals EveryoneAct as business organizations Vehicles to amain goals believed to(dole out favon and responsibility) be in the puolie interest
(third parties popular)Strong Subordinate to principles and issues
Patterns of CompetitionBetween parties; not over woes Ova issues
Toward winning office for tangible Toward winning office for greaterrewards opportunity to implement policies
and programs
A pnviiete(only those with le/inmate :lamto office should participate)
Ile appropriate eliteVehicle of recruitment of people tooffices not desired by establishedpower holdersHighly personal(based on family and social ties)
Between elite-dominated factionswithin a dominant partyDependent on political values ofthe clue
Source: Elazar, 1984, pp. 120-21.
272
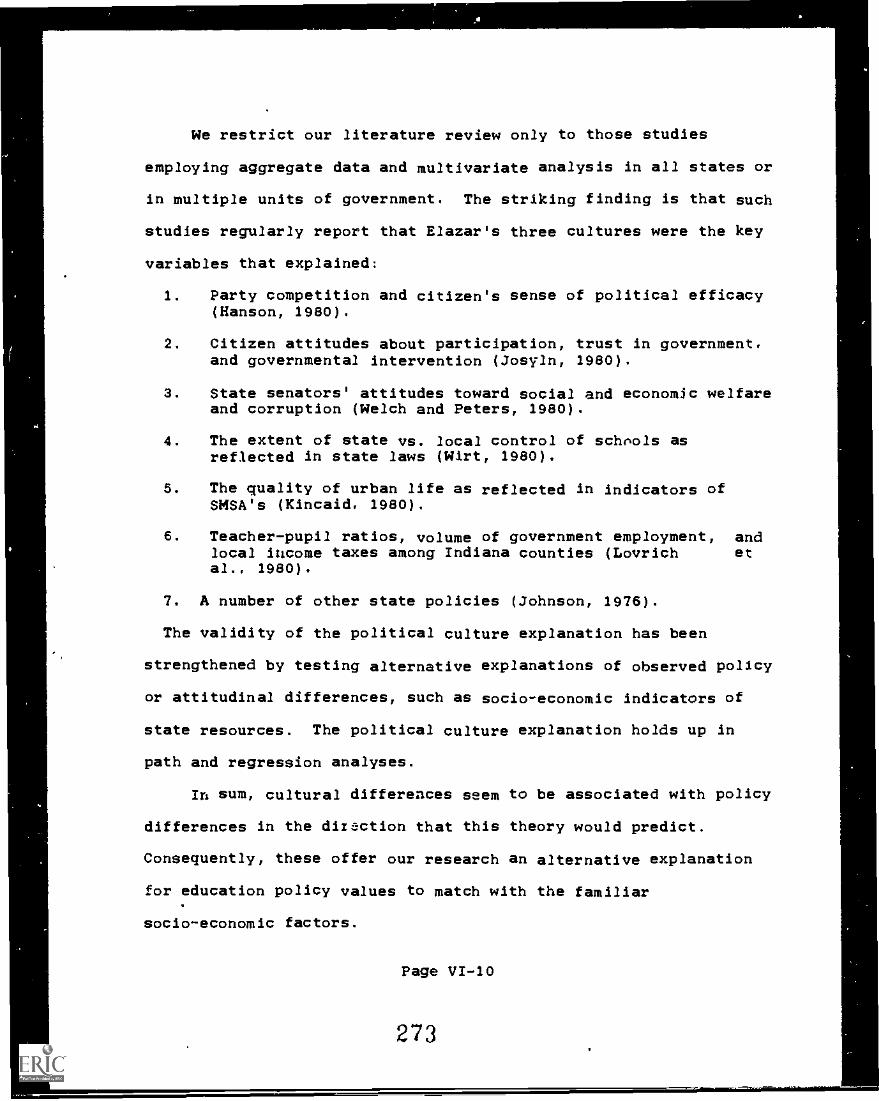
(
We restrict our literature review only to those studies
employing aggregate data and multivariate analysis in all states or
in multiple units of government. The striking finding is that such
studies regularly report that Elazar's three cultures were the key
variables that explained:
1. Party competition and citizen's sense of political efficacy(Hanson, 1980).
2. Citizen attitudes about participation, trust in government,and governmental intervention (Josyln, 1980).
3. State senators' attitudes toward social and economic welfareand corruption (Welch and Peters, 1980).
4. The extent of state vs. local control of schools asreflected in state laws (Wirt, 1980).
6. The quality of urban life as reflected in indicators ofSMSA's (Kincaid, 1980).
6. Teacher-pupil ratios, volume of government employment, andlocal income taxes among Indiana counties (Lovrich etal., 1980).
7. A number of other state policies (Johnson, 1976).
The validity of the political culture explanation has been
strengthened by testing alternative explanations of observed policy
or attitudinal differences, such as socio-economic indicators of
state resources. The political culture explanation holds up in
path and regression analyses.
In sum, cultural differences seem to be associated with policy
differences in the dixection that this theory would predict.
Consequently, these offer our research an alternative explanation
for education policy values to match with the familiar
socio-economic factors.
Page VI-10
273
,
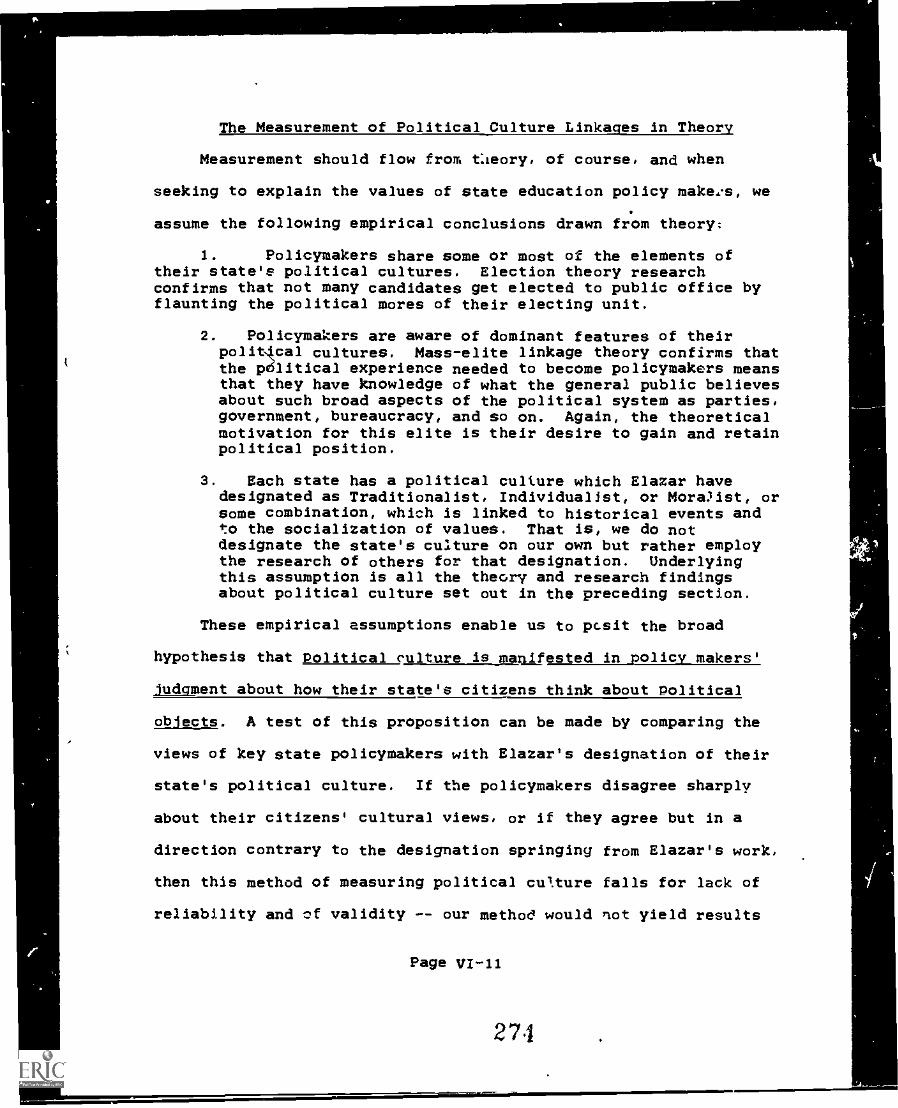
The Measurement of Political Culture Linkages in Theory
Measurement should flow from Cleory, of course, and when
seeking to explain the values of state education policy make:s, we
assume the following empirical conclusions drawn from theory:
1. Policymakers share some or most of the elements oftheir state'e political cultures. Election theory researchconfirms that not many candidates get elected to public office byflaunting the political mores of their electing unit.
2. Policymakers are aware of dominant features of theirpolit4cal cultures. Mass-elite linkage theory confirms thatthe political experience needed to become policymakers meansthat they have knowledge of what the general public believesabout such broad aspects of the political system as parties,government, bureaucracy, and so on. Again, the theoreticalmotivation for this elite is their desire to gain and retainpolitical position.
3. Each state has a political culture which Elazar havedesignated as Traditionalist, Individualist, or Mora)ist, orsome combination, which is linked to historical events andto the socialization of values. That is, we do notdesignate the state's culture on our own but rather employthe research of others for that designation. Underlyingthis assumption is all the theory and research findingsabout political culture set out in the preceding section.
These empirical assumptions enable us to pcsit the broad
hypothesis that Political culture is_maagested in_policy makers'
judgment about how their state's citizens think about Political
objects. A test of this proposition can be made by comparing the
views of key state policymakers with Elazar's designation of their
state's political culture. If the policymakers disagree sharply
about their citizens' cultural views, or if they agree but in a
direction contrary to the designation springing from Elazar's work,
then this method of measuring political culture falls for lack of
reliability and of validity -- our method would not yield results
Page VI-11
274
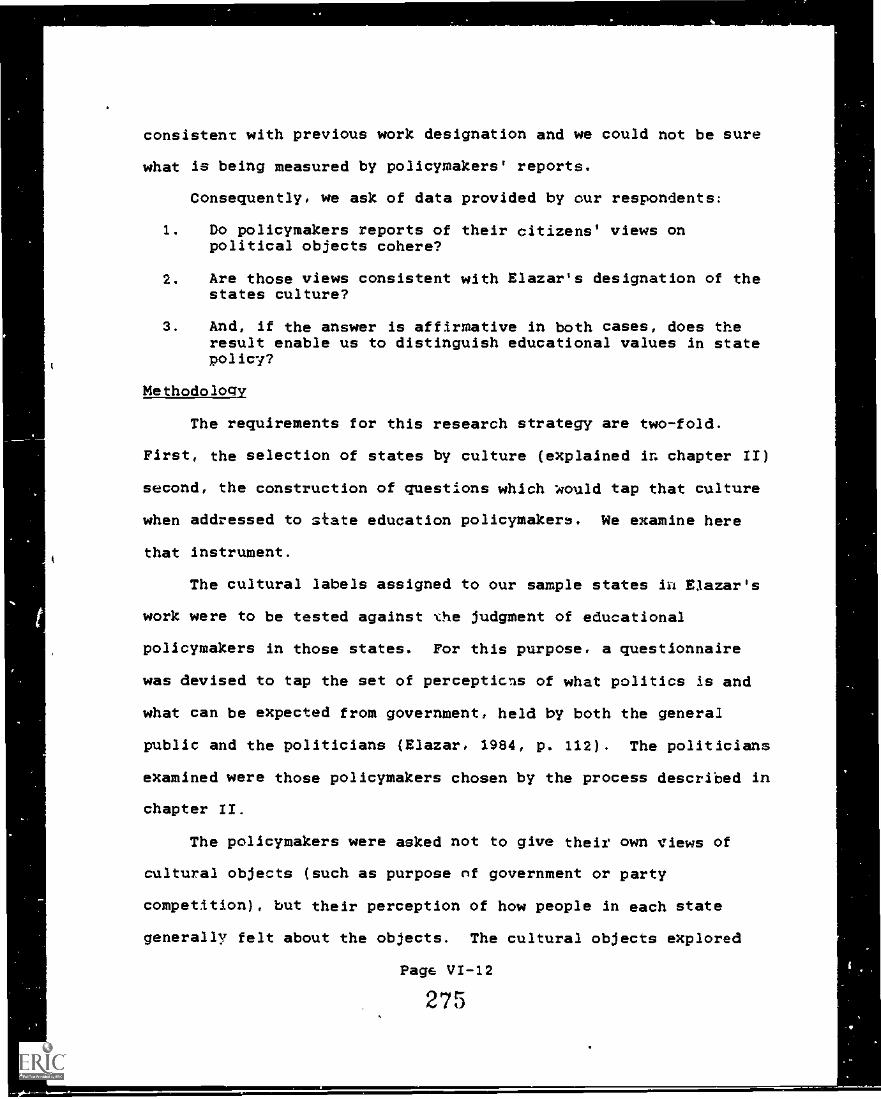
\
i
(
consistent with previous work designation and we could not be sure
what is being measured by policymakers' reports.
Consequently, we ask of data provided by our respondents:
1. Do policymakers reports of their citizens' views onpolitical objects cohere?
2. Are those views consistent with Elazar's designation of thestates culture?
3. And, if the answer is affirmative in both cases, does theresult enable us to distinguish educational values in statepolicy?
Methodology
The requirements for this research strategy are two-fold.
First, the selection of states by culture (explained in chapter II)
second, the construction of questions which would tap that culture
when addressed to state education policymakers. We examine here
that instrument.
The cultural labels assigned to our sample states in Elazar's
work were to be tested against the judgment of educational
policymakers in those states. For this purpose, a questionnaire
was devised to tap the set of perceptions of what politics is and
what can be expected from government, held by both the general
public and the politicians (Elazar, 1984, p. 112). The politicians
examined were those policymakers chosen by the process described in
chapter II.
The policymakers were asked not to give their own views of
cultural objects (such as purpose of government or party
competAtion), but their perception of how people in each state
generally felt about the objects. The cultural objects explored
Page VI-12
,275
..--.-I
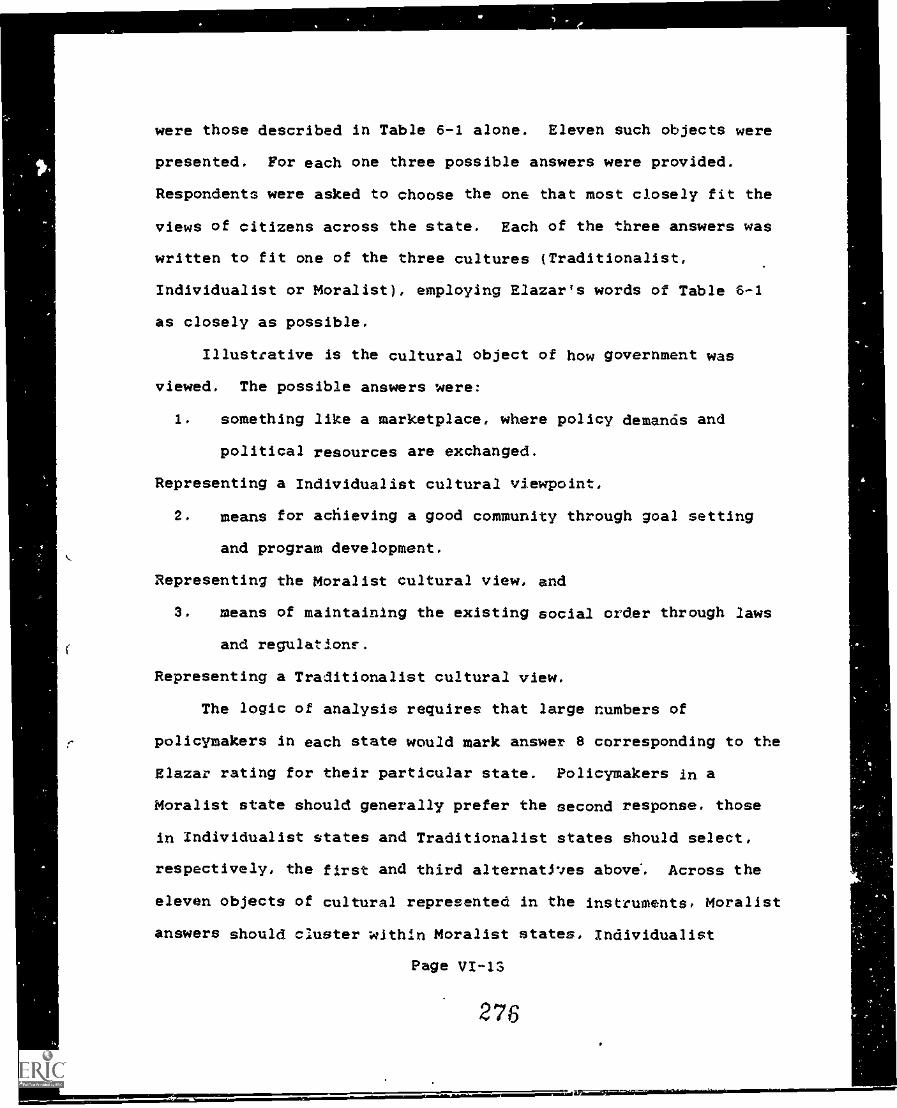
were those described in Table 6-1 alone. Eleven such objects were
presented. For each one three possible answers were provided.
Respondents were asked to choose the one that most closely fit the
views of citizens across the state. Each of the three answers was
written to fit one of the three cultures (Traditionalist,
Individualist or Moralist), employing Elazar's words of Table 6-1
as closely as possible.
Illustrative is the cultural object of how government was
viewed. The possible answers were:
1. something like a marketplace, where policy demands and
political resources are exchanged.
Representing a Individualist cultural viewpoint,
2. means for achieving a good community through goal setting
and program development.
Representing the Moralist cultural view, and
3. means of maintaining the existing social order through laws
and regulationr.
Representing a Traditionalist cultural view.
The logic of analysis requires that large numbers of
policymakers in each state would mark answer 8 corresponding to the
Blazer rating for their particular state. Policymakers In a
Moralist state should generally prefer the second response, those
in Individualist states and Traditionalist states should select,
respectively, the first and third alternathes above% Across the
eleven objects of cultural represented in the instruments, Moralist
answers should cluster within Moralist states, Individualist
Page VI-13
276
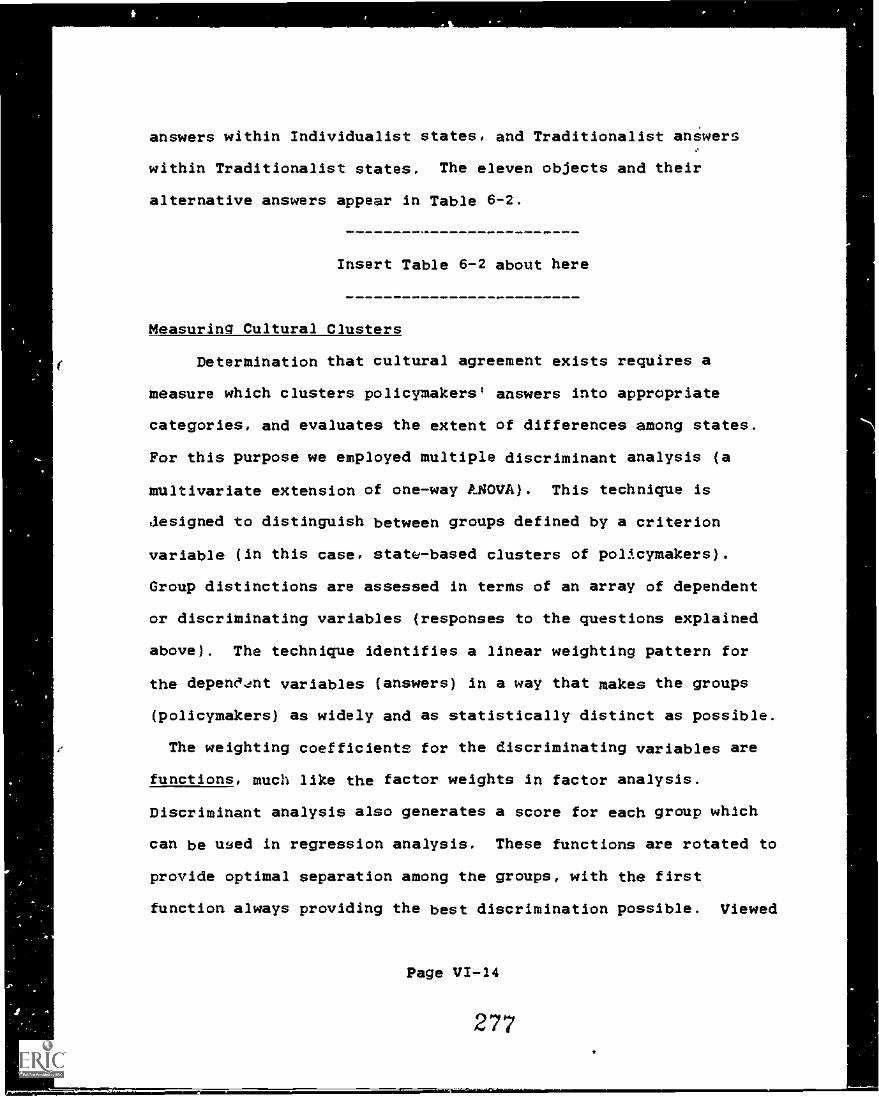
answers within Individualist states, and Traditionalist anSwers
within Traditionalist states. The eleven objects and their
alternative answers appear in Table 6-2.
Insert Table 6-2 about here
Measuring Cultural Clusters
Determination that cultural agreement exists requires a
measure which clusters policymakers' answers into appropriate
categories, and evaluates the extent of differences among states.
For this purpose we employed multiple discriminant analysis (a
multivariate extension of one-way ANOVA). This technique is
aesigned to distinguish between groups defined by a criterion
variable (in this case, state-based clusters of policymakers).
Group distinctions are assessed in terms of an array of dependent
or discriminating variables (responses to the questions explained
above). The technique identifies a linear weighting pattern for
the depene.ent variables (answers) in a way that makes the groups
(policymakers) as widely and as statistically distinct as possible.
The weighting coefficients for the discriminating variables are
functions, much like the factor weights in factor analysis.
Discriminant analysis also generates a score for each group which
can be twed in regression analysis. These functions are rotated to
provide optimal separation among the groups, with the first
function always providing the best discrimination possible. Viewed
Page VI-14
277
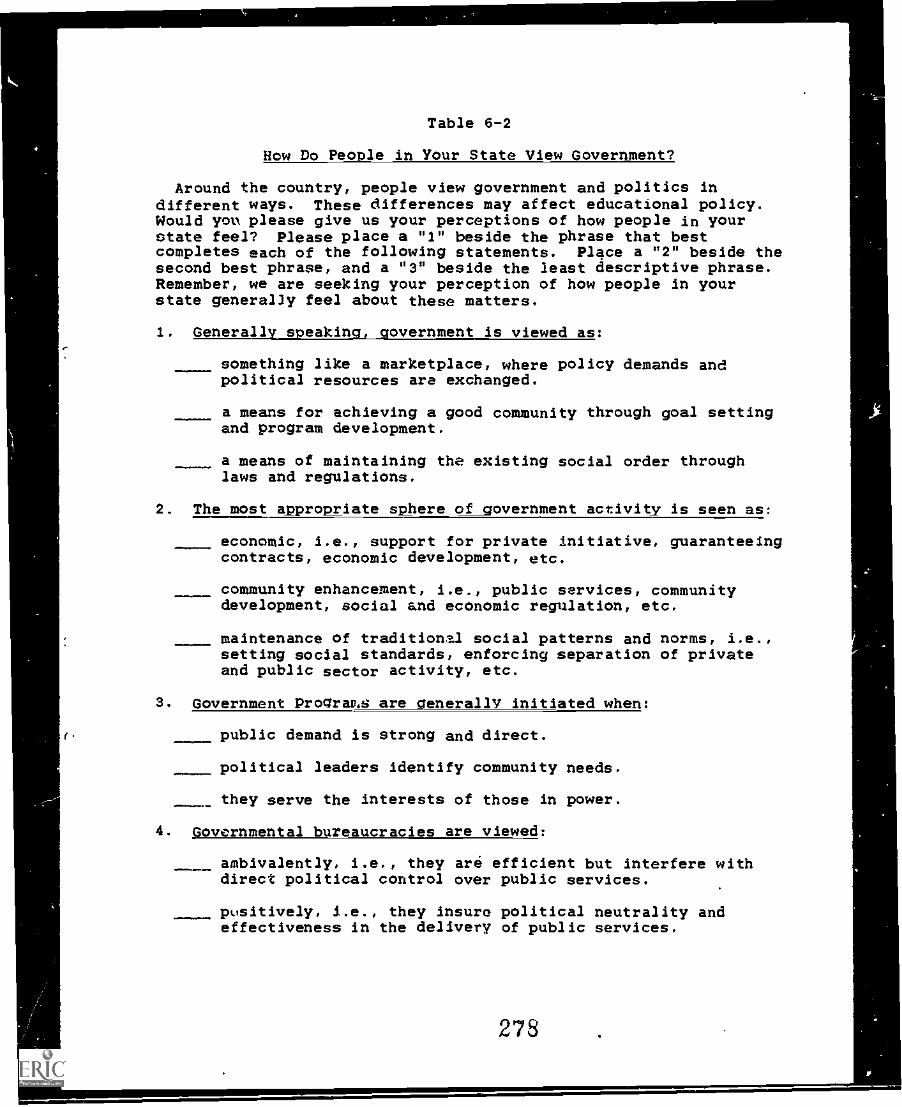
Table 6-2
How Do People in Your State View Government?
Around the country, people view government and politics indifferent ways. These differences may affect educational policy.Would you please give us your perceptions of how people in yourstate feel? Please place a "1" beside the phrase that bestcompletes each of the following statements. Place a "2" beside thesecond best phrase, and a "3" beside the least descriptive phrase.Remember, we are seeking your perception of how people in yourstate generally feel about these matters.
1. Generally speaking, government is viewed as:
Iii...11111
something like a marketplace, where policy demands andpolitical resources are exchanged.
a means for achieving a good community through goal settingand program development.
a means of maintaining the existing social order throughlaws and regulations.
2. The most appropriate sphere of government activity is seen as:
=1.111
economic, i.e., support for private initiative, guaranteeingcontracts, economic development, etc.
community enhancement, i.e., public services, communitydevelopment, social and economic regulation, etc.
maintenance of traditional social patterns and norms, i.e.,setting social standards, enforcing separation of privateand public sector activity, etc.
3. Government Prograv.s are generallY initiated when:
public demand is strong and direct.
political leaders identify community needs.
they serve the interests of those in power.
4. Governmental bureaucracies are viewed:
ambivalently, i.e., they are efficient but interfere withdirect political control over public services.
pysitively, I.e., they insure political neutrality andeffectiveness in the delivery of public services.
278
r
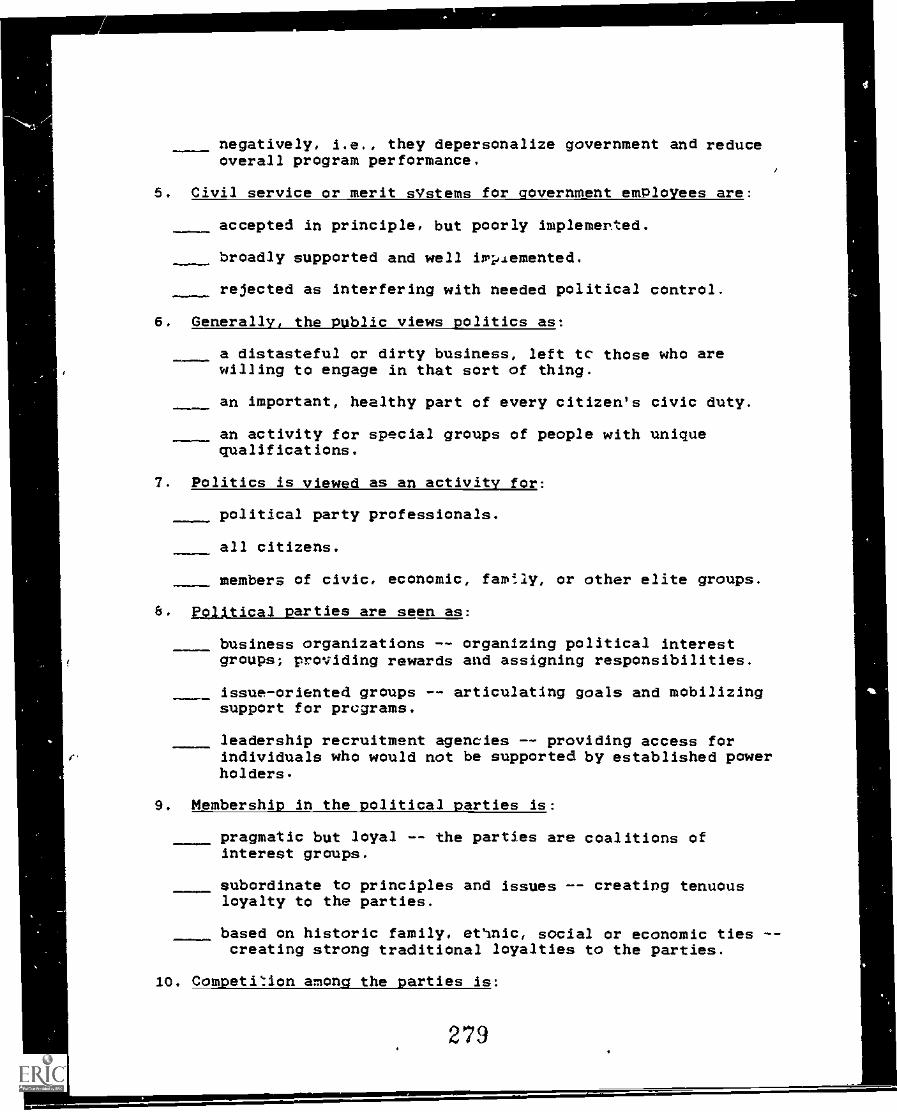
negatively, i.e., they depersonalize government and reduceoverall program performance.
5. Civil service or merit sYstems for government emPloYees are:
accepted in principle, but poorly implemented.
broadly supported and well lyplemented.
rejected as interfering with needed political control.
6. Generally, the public Views politics as:
a distasteful or dirty business, left tO those who arewilling to engage in that sort of thing.
an important, healthy part of every citizen's civic duty.
an activity for special groups of people with uniquequalifications.
7. Politics is viewed as an activity for:
political party professionals.
all citizens.
members of civic, economic, fam!ly, or other elite groups.
6. Political parties are seen as:
business organizations -- organizing political interestgroups; providing rewards and assigning responsibilities.
issue-oriented groups -- articulating goals and mobilizingsupport for pregrams.
leadership recruitment agencies -- providing access forindividuals who would not be supported by established powerholders.
9. Membership in the political parties is:
pragmatic but loyal -- the parties are coalitions ofinterest groups.
subordinate to principles and issues -- creating tenuousloyalty to the parties.
i
based on historic family, ethnic, social or economic ties --creating strong traditional loyalties to the parties.
10. CompetMon among the parties is:
279
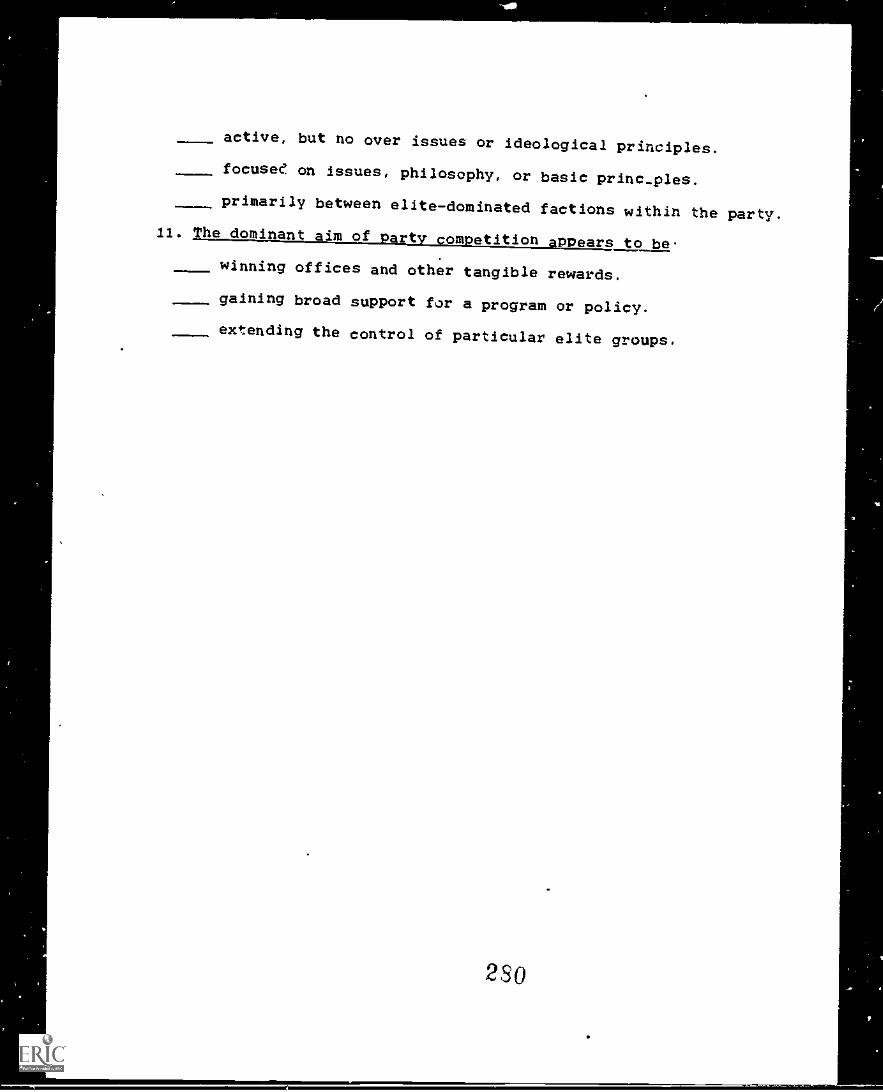
'AMP
active, but no over issues or ideological principles.
focused on issues, philosophy, or basic princ_ples.
primarily between elite-dominated factions within the party.
11. The dominant aim of party competition appears to be .
winning offices and other tangible rewards.
gaining broad support for a program or policy.
extending the control of particular elite groups.
290
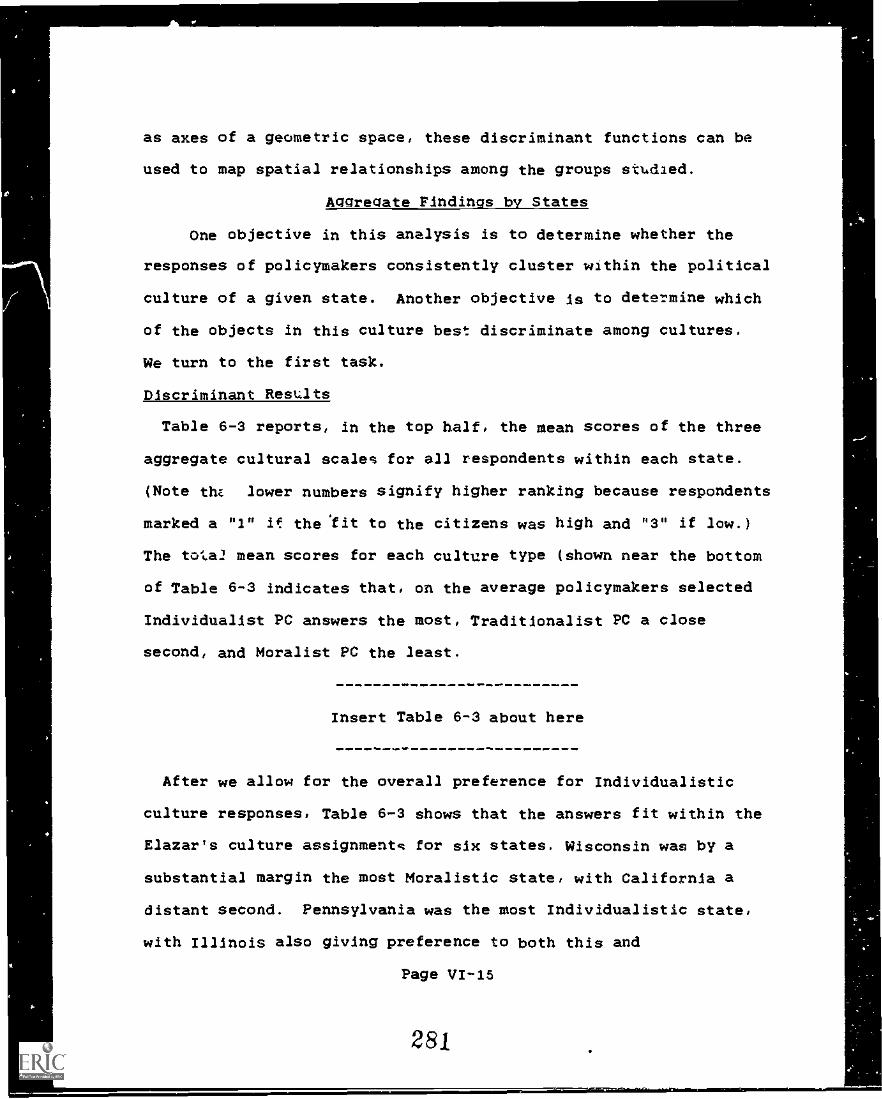
as axes of a geometric space, these discriminant functions can be
used to map spatial relationships among the groups studied.
Aggregate Findings by States
One objective in this analysis is to determine whether the
responses of policymakers consistently cluster within the political
culture of a given state. Another objective is to determine which
of the objects in this culture best discriminate among cultures.
We turn to the first task.
Discriminant Results
Table 6-3 reports, in the top half, the mean scores of the three
aggregate cultural scales for all respondents within each state.
(Note thz lower numbers signify higher ranking because respondents
marked a "1" it the 'fit to the citizens was high and "3" if low.)
The tota2 mean scores for each culture type (shown near the bottom
of Table 6-3 indicates that, on the average policymakers selected
Individualist PC answers the most, Traditionalist PC a close
second, and Moralist PC the least.
Insert Table 6-3 about here
After we allow for the overall preference for Individualistic
culture responses. Table 6-3 shows that the answers fit within the
Elazarts culture assignmentg for six states. Wisconsin was by a
substantial margin the most Moralistic state, with California a
distant second. Pennsylvania was the most Individualistic state,
with Illinois also giving preference to both this and
Page VI-15
281
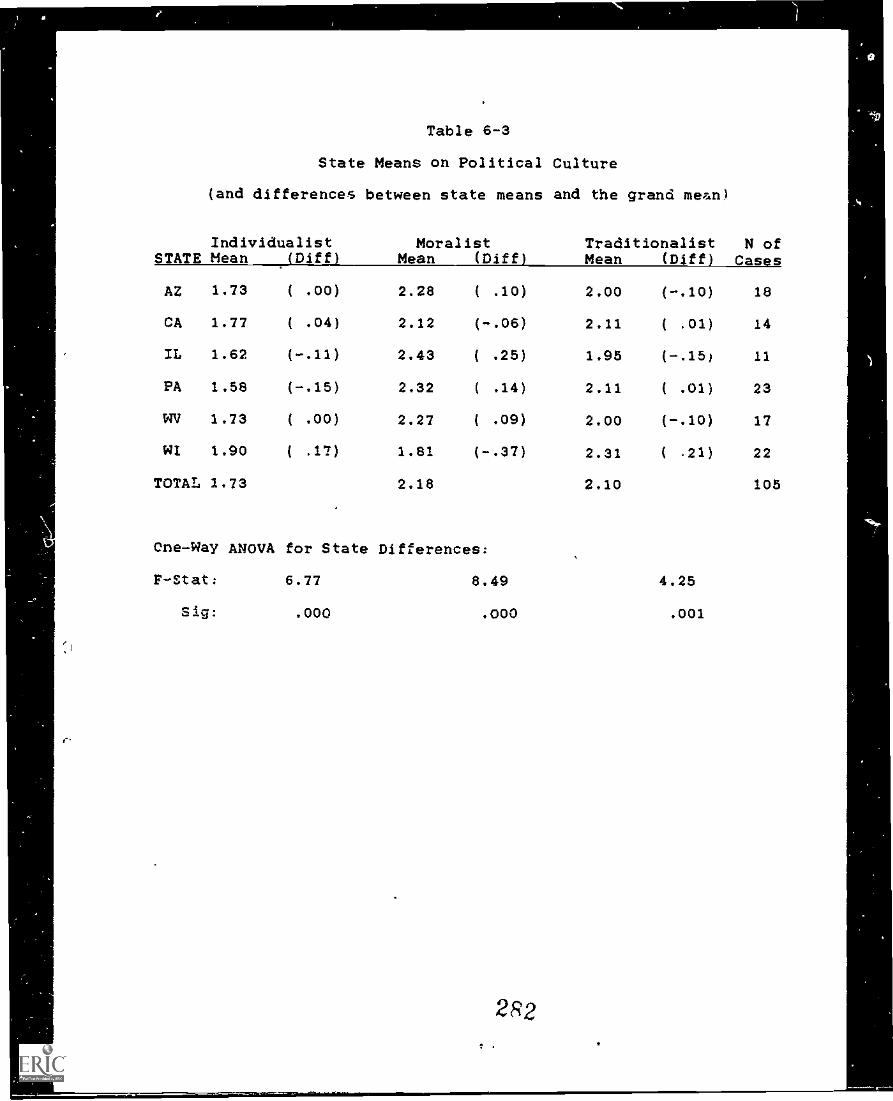
r.
Table 6-3
State Means on Political Culture
(and differences between state means and the grand mean)
Individualist Moralist Traditionalist N ofSTATE Mean (Diff) Mean (Diff) Mean (Diff) Cases
AZ 1.73 ( .00) 2.28 ( .10) 2.00 (-.10) 18
CA 1.77 ( .04) 2.12 (-.06) 2.11 ( .01) 14
IL 1.62 (-.11) 2.43 ( .25) 1.95 (-.15) 11
PA 1.58 (-.15) 2.32 ( .14) 2.11 ( .01) 23
WV 1.73 ( .00) 2.27 ( .09) 2.00 (-.10) 17
WI 1.90 ( .17) 1.81 (-.37) 2.31 ( .21) 22
TOTAL 1.73 2.18 2.10 105
One-Way ANOVA for State Differences;
F-Stat: 6.77 8.49 4.25
Sig: .000 .000 .001
2R2
'4D
Traditionalistic responses. Finally, the two Traditionalist PC
states, Arizona and West Virginia, were among the three loading
most heavily upon the Traditionalist PC alternative; only Illinois
surpassed them, a state noted for a southern sector where
Traditionalist PC dominates (Elazar, 1970).
Are these differences in mean scores significant? The bottom
half of Table 6-3 reports emphatically that they are. All of the
means are significantly different at the .001 level. That is,
these three cultural alternatives have significantly different
means across the six states, using a one-way ANOVA test. Do the
differences cluster into distinguishable functions which account
for the variance? Table 6-4 provides the answer, again in the
affirmative. Multiple dIscrimination analysis (clustering
respondents by states and analyzing the three culture scales
simultaneously) produces two useful discriminant functions. The
first Ss highly significant (the multiple R of .551 means that it
accounts fa,* more than 30 percent of the variance in individual
responses). The second function is not statistically significant
(i.e. the F-Value is only .199), but it does account for an
additional seven percent of the group variance, and assists In
illuminating state differences, hence we retain it for cautious
interpretation. The coherence of specific questions is reviewed in
Appendix A.
Insert Table 6-4 about here
Page VI-16
2S3
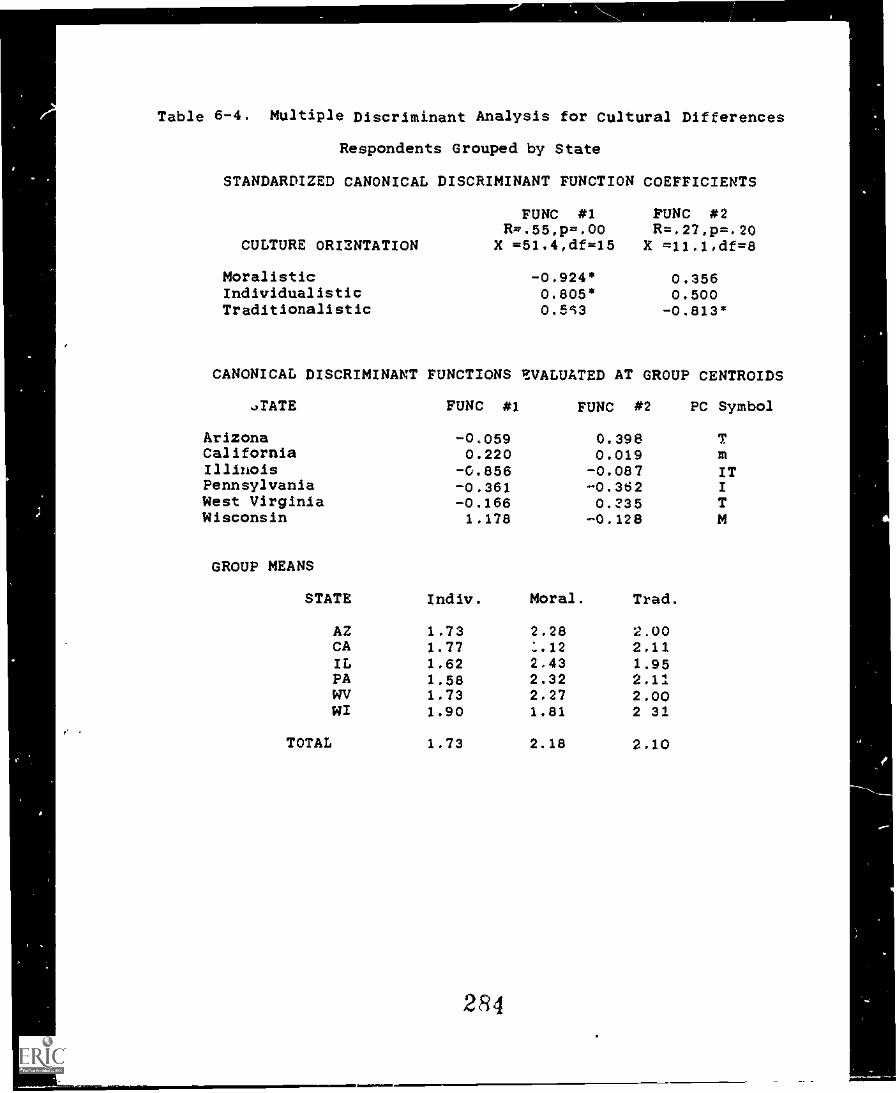
Table 6-4. Multiple Discriminant Analysis for Cultural Differences
Respondents Grouped by State
STANDARDIZED CANONICAL DISCRIMINANT FUNCTION COEFFICIENTS
CULTURE ORUNTATION
FUNC #1R.w.55,p=.00X =51.4,df=15
FUNC #2R=.27,p=.20X =11.1,df=8
Moralistic -0.924* 0.356Individualistic 0.805* 0.500Traditionalistic 0.553 -0.813*
CANONICAL DISCRIMINANT FUNCTIONS VALUATED AT GROUP CENTROIDS
..,TATE FUNC #1 FUNC #2 PC Symbol
Arizona -0.059 0.398 TCalifornia 0.220 0.019 mIllinois -0.856 -0.087 ITPennsylvania -0.361 -0.362 I
West Virginia -0.166 0.235 TWisconsin 1.178 -0.128 M
GROUP MEANS
STATE Indiv. Moral. Trad.
AZ 1.73 2.28 2.00CA 1.77 2.11IL 1.62 2,43 1.95PA 1.58 2.32 2.11WV 1.73 2.27 2.00WI 1.90 1.81 2 31
TOTAL 1.73 2.18 2.10
24
The Fit to State Cultures
What, then are the specific components of these two functions
just described? The middle portion of Table 6-4 shows that the
structure matrix of Function #1 consists of Moralist PCs opposed to
both Individualist PC answers and Traditionalist PCs answers, with
the opposition between moralism and individualism being the
strongest. That is, policymakers that embraced Moralistic views of
their states tended to reject both of the other two cultures. The
reverse also applies. Function *2 of Table 6-4 reveals a tension
between Traditionalistic PC views and those of the other two scales
-- the tension here is steongest between Traditionalism and
Individualism. In short, the responses of state educational
policymakers discriminate among the three cultures along two
contrasting dimensions.
Does that mean that each of the six sta.es actually fall in
the culture expected from the Elazar classification? The bottom
part of Table 6-4 shows how these two functions apply to each of
the six states (using the group centroid measures). We also
provide a shorthand symbol for the strength of the cultural
identification revealed in this statistical analysis. Thus:
1. Arizona and West Virginia combine near zero scores onFunction #1 with strong positive centroids on Function #2,indicating a strongly Traditionalist PCs set of responsesamong their policymakers, hence they are designated T.
2. Wisconsin shows very strong Moralist PC in its responses onFunction #1. California also has a positive centroid onthis function (though it is much weaker). Hence, the firstis labelled M and the second m.
Page 1/1-17
285:.
3. Illinois strongly rejects the Moralist PCs of Function *1,but has a near zero score on Function *2. This combinationrepresents a roughly equal embrace of botil the Individualistand Traditionalist views, hence 'Illinois is labelled IT.
4. Pennsylvania respondents (as indicated by their groupcentroids) tended to reject both the Moralism of Function *1and the Traditionalism of Function *2. Hence this state isthe most Individualistic in orientation of our sample --exactly as predicted by Elazar (1970).
A spatial sense of these discriminants is shown in Figure 61.
Insert Figure 6-1 about here
The first and highly significant Function *1 is the hcrizontal
axis. As states move to the right along this axis they give
stronger and stronger support to a moralistic culture perspective.
The weaker and non-significant Function *2 appears as the vertical
axis -- the closer centroids approach to the top of this axis the
more they reflect endorsement of traditionalism. The dots
represent the centroid values of each state on each of these two
functions; a centroid is the mean value on that function for all
members of the group surveyed. The power of Function *1 is
suggested not only in sigtlificance measures but can be sig.en in
Figure 1 by how great the distance is between Wisconsin and
Illinois along this dimension. The gulf that separates the
perceptions of in Wisconsin and Illinois -- two states that
actually border one another -- is quite remarkable. The
Pennsylvania centroid reveals the Individualism of this state by
being located in the lower left quadrant of the figure, a
Page VI-18
2 6
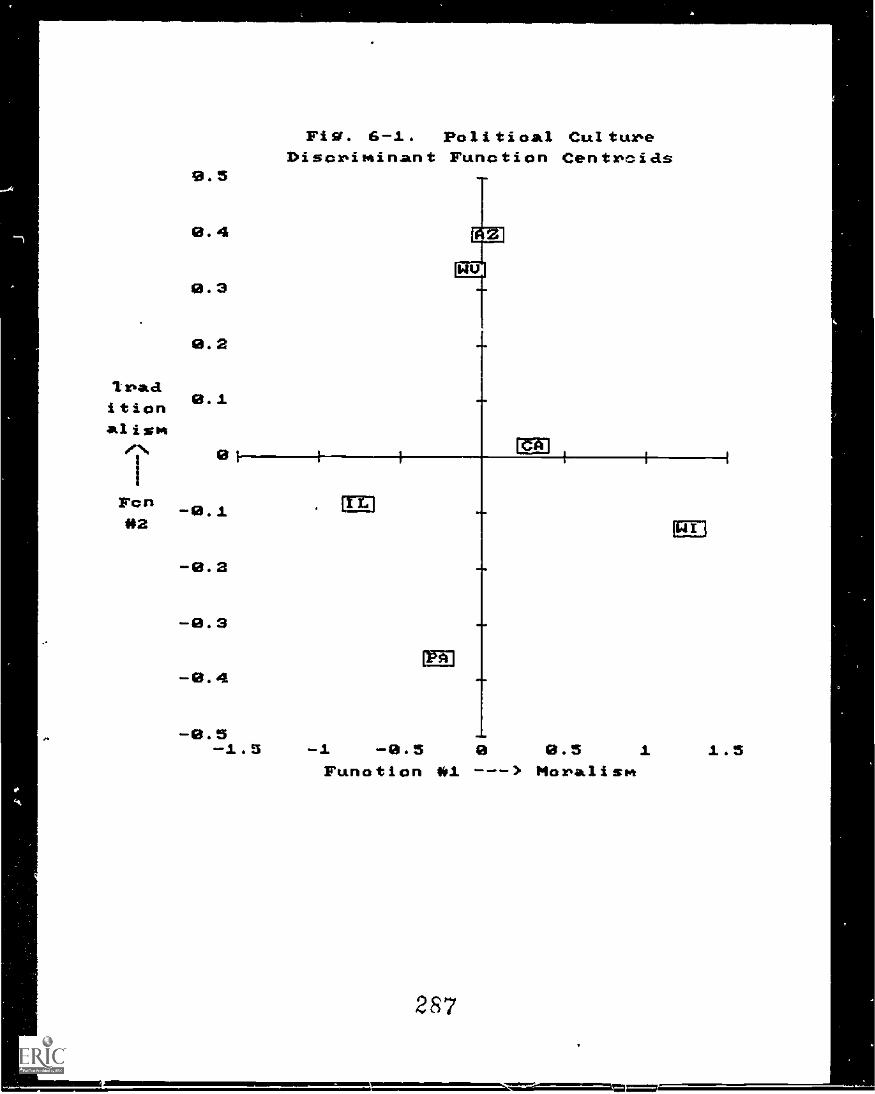
Triaditionalism
Fig. 6-1. Politioal CultureDiscriminant Function Centrcias
".I
I
Fon*2
Of 1-
-0.1
-0.2
-0.2
-0.4
-0.5
EEE
I
0.111m
4.
.MID
allim
--1.5 -1 -0.5 0 0.5
Funotion *1 ---> Moralism
287
FT
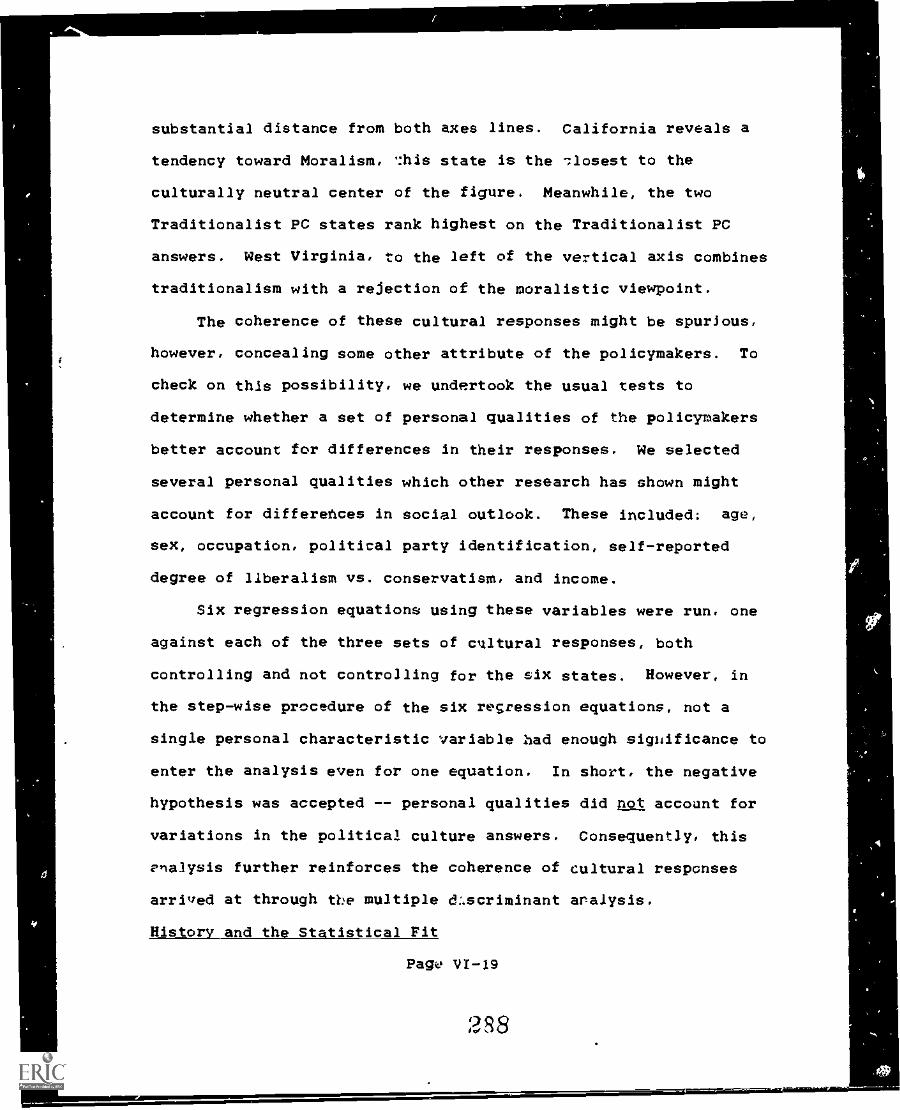
substantial distance from both axes lines. California reveals a
tendency toward Moralism, 'this state is the :losest to the
culturally neutral center of the figure. Meanwhile, the two
Traditionalist PC states rank highest on the Traditionalist PC
answers. West Virginia, to the left of the vertical axis combines
traditionalism with a rejection of the moralistic viewpoint.
The coherence of these cultural responses might be spurious,
however, concealing some other attribute of the policymakers. To
check on this possibility, we undertook the usual tests to
determine whether a set of personal qualities of the policymakers
better account for differences in their responses. We selected
several personal qualities which other research has shown might
account for differences in social outlook. These included: age,
sex, occupation, political party identification, self-reported
degree of llberalism vs. conservatism, and income.
Six regression equations using these variables were run, one
against each of the three sets of cultural responses, both
controlling and not controlling for the six states. However, in
the step-wise procedure of the six regression equations, not a
single personal characteristic variable had enough sigLificance to
enter the analysis even for one equation. In short, the negative
hypothesis was accepted -- personal qualities did not account for
variations in the political culture answers. Consequently, this
enalysis further reinforces the coherence of cultural responses
arrived at through tbe multiple d:.scriminant analysis.
History and the Statistical Pit
Page VI-19
288
.:40.
4?tr
tw
cvto
*cv
IL,' 4.
-Vd,
*.;;
V4
3d
,e5
v.4,
,,,s
,,,,,,
0 0t e
kt,
4. .v
. ,,a
,,#.
-<
so.
it./ 41
4/.,
014
c3.1
t,3
1.0
mm
1.5
mm
2.0
mm
IIIII
0111
=H
ills
1111
1--
,crr
rFrr
rilig
1111
F- 1
5NE
FF
AB
CD
EF
GH
IJK
LMN
OP
QR
ST
UV
WX
YZ
abcd
etst
mkI
mno
pqrs
tuvw
xyz
2345
6789
0
AB
CD
EF
GH
IJK
LMN
OP
QR
S W
VW
XY
Zab
cdef
ghijk
lmno
pqrs
tuvw
xyz
1234
5678
90
A04
0.°4
1'A
(to
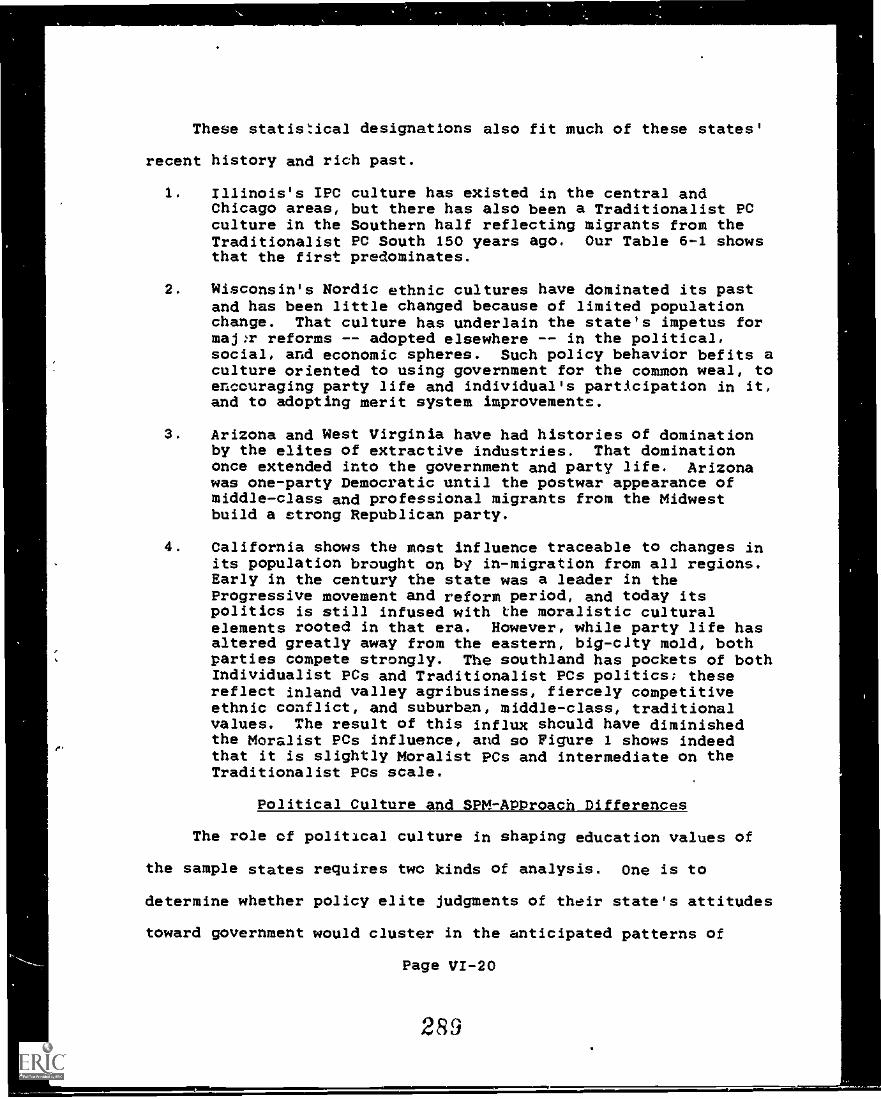
These statistical designations also fit much of these states'
recent history and rich past.
1. Illinois's IPC culture has existed in the central andChicago areas, but there has also been a Traditionalist PCculture in the Southern half reflecting migrants from theTraditionalist PC South 150 years ago. Our Table 6-1 showsthat the first predominates.
2. Wisconsin's Nordic ethnic cultures have dominated its pastand has been little changed because of limited populationchange. That culture has underlain the state's impetus formaj:r reforms -- adopted elsewhere -- in the political,social, and economic spheres. Such policy behavior befits aculture oriented to using government for the common weal, toencouraging party life and individual's participation in it,and to adopting merit system improvements.
3. Arizona and West Virginia have had histories of dominationby the elites of extractive industries. That dominationonce extended into the government and party life. Arizonawas one-party Democratic until the postwar appearance ofmiddle-class and professional migrants from the Midwestbuild a strong Republican party.
4. California shows the most influence traceable to changes inits population brought on by in-migration from all regions.Early in the century the state was a leader in theProgressive movement and reform period, and today itspolitics is still infused with the moralistic culturalelements rooted in that era. However, while party life hasaltered greatly away from the eastern, big-city mold, bothparties compete strongly. The southland has pockets of bothIndividualist PCs and Traditionalist PCs politics; thesereflect inland valley agribusiness, fiercely competitiveethnic conflict, and suburban, middle-class, traditionalvalues. The result of this influx should have diminishedthe Moralist PCs influence, and so Figure 1 shows indeedthat it is slightly Moralist PCs and intermediate on theTraditionalist PCs scale.
Political Culture and SPM-Approach Differences
The role of political culture in shaping education values of
the sample states requires two kinds of analysis. One is to
determine whether policy elite judgments of their state's attitudes
toward government would cluster in the anticipated patterns of
Page VI-20
289
three types of culture. This analysis found that elite perceptions
were measurable in this fashion, that their perceptions did cluster
between the states, and that they clustered in a fashion congruent
with the Blazer formulation. A second kind of analysis is now
required, namely, to determine what effects these cultural
perceptions have on perceptions on the SPMs and approaches analyzed
in chapters III-/V. In short, what difference does political
culture make on pollcy perceptions and preferences on these elites?
There are two ways of disaggregating the effects of both
culture and states on these matters. One is to determine the
effect on elite policy judgments of between-state differences in
political culture perceptions, and the seclnd is to determine the
within-state effects.
Between State Differences
Multivariate analysis using six states as units of analysis is
of limited use in measuring between-state differences because of
this small N; coefficients of .75 would be needed to achieve a
significant difference. However, it is possible to look for
substantial correlations that are less than this level.
Significant correlation provides statistical reliability, but the
small-N problem and the non-random state selection make that
inappropriate here. But substantial correlations can be useful,
especially when displayed in scattergrams, a device used in Robert
Crain's small-N study of school desegregation (1969). Since a .50
correlation coefficient accounts for 25 percent of the variation
between two variables we felt that coefficients of about this size
Page VI-21
290
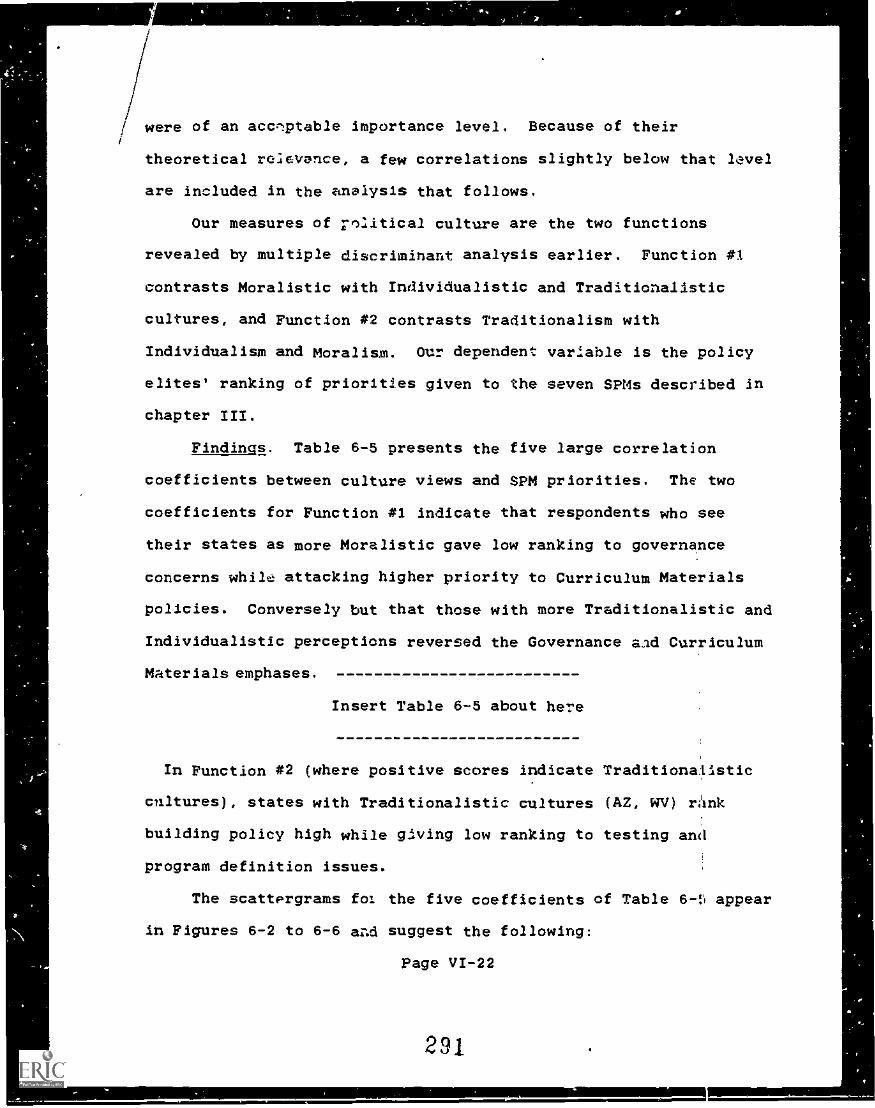
i
/
/ were of an accrTtable importance level. Because of their/
theoretical ro.levance, a few correlations slightly below that level
are included in the analysis that follows.
Our measures of vllitical culture are the two functions
revealed by multiple discriminant analysis earlier. Function *1
contrasts Moralistic with Individualistic and Traditionalistic
cultures, and Function #2 contrasts Traditionalism with
Individualism and Moralism. Our dependent variable is the policy
elites' ranking of priorities given to the seven SPMs described in
chapter III.
Findings. Table 6-5 presents the five large correlation
coefficients between culture views and SPM priorities. The two
coefficients for Function #1 indicate that respondents who see
their states as more Moralistic gave low ranking to governance
concerns while attacking higher priority to Curriculum Materials
policies. Conversely but that those with more Traditionalistic and
Individualistic perceptions reversed the Governance aad Curriculum
Materials emphases.
/nsert Table 6-5 about here
In Function *2 (where positive scores indicate Traditionalistic
cultures), states with Traditionalistic cultures (AZ, WV) rAnk
building policy high while glving low ranking to testing and
program definition issues.
The scattergrams fol the five coefficients of Table 6-!'t appear
in Figures 6-2 to 6-6 ar.d suggest the following:
Page VI-22
291
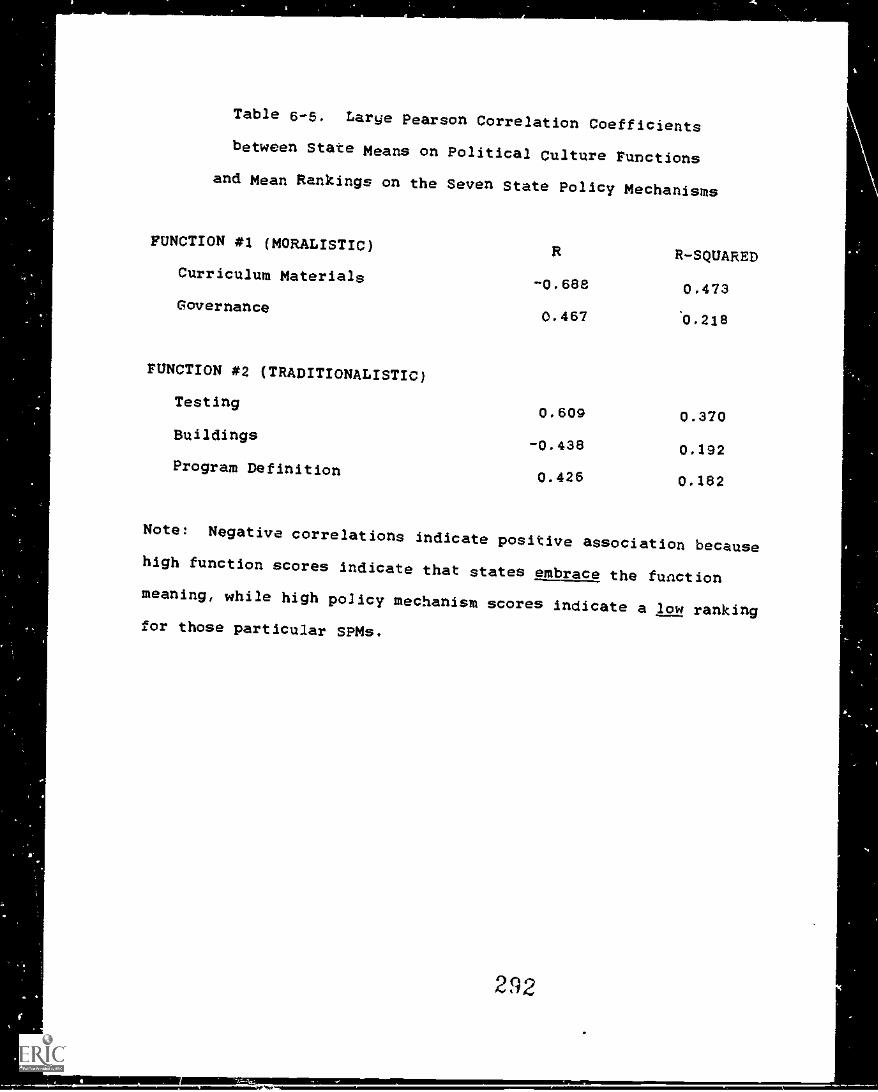
Table 6-5. Large Pearson Correlation Coefficients
between State Means on Political Culture Functions
and Mean Rankings on the Seven State Policy Mechanisms
FUNCTION #1 (MORALISTIC)R R-SQUARED
Curriculum Materials-0.688 0.473
Governance0.467 0.218
FUNCTION #2 (TRADITIONALISTIC)
Testing0.609 0.370
Buildings-0.438 0.192
Program Definition0.426 0.182
Note: Negative correlations indicate positive association becausehigh function scores indicate that states embrace the functionmeaning, while high policy mechanism scores indicate a 10 rankingfor those particular SPMs.
292
I
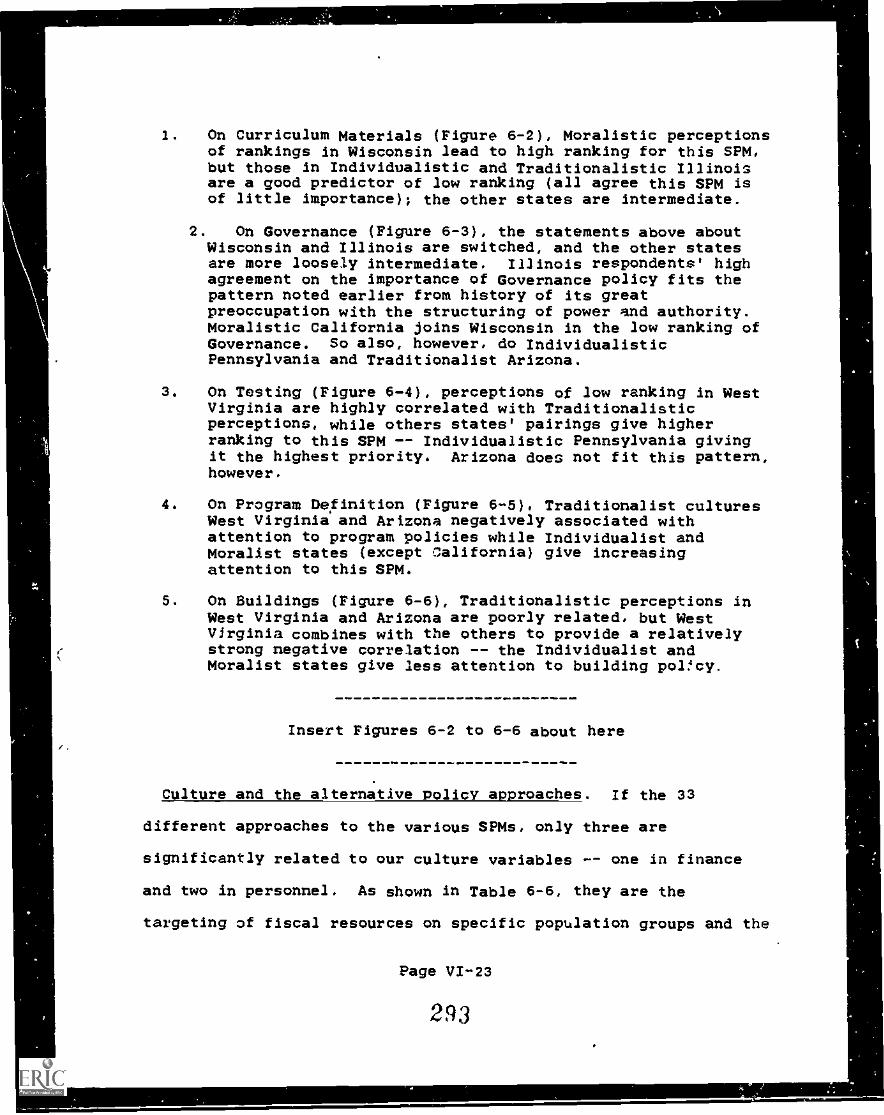
1. On Curriculum Materials (Figure 6-2), Moralistic perceptionsof rankings in Wisconsin lead to high ranking for this SPM,but those in Individualistic and Traditionalistic Illinoisare a good predictor of low ranking (all agree this SPM isof little importance); the other states are intermediate.
2. On Governance (Figure 6-3), the statements above aboutWisconsin and Illinois are switched, and the other statesare more loosely intermediate. Illinois respondents' highagreement on the importance of Governance policy fits thepattern noted earlier from history of its greatpreoccupation with the structuring of power and authority.Moralistic California joins Wisconsin in the low ranking ofGovernance. So also, however, do IndividualisticPennsylvania and Traditionalist Arizona.
3. On Testing (Figure 6-4), perceptions of low ranking in WestVirginia are highly correlated with Traditionalisticperceptions, while others states' pairings give higherranking to this SPM -- Individualistic Pennsylvania givingit the highest priority. Arizona does not fit this pattern,however.
4. On Program Depnition (Figure 6-5), Traditionalist culturesWest Virginia and Arizona negatively associated withattention to program policies while Individualist andMoralist states (except California) give increasingattention to this SPM.
5. On Buildings (Figure 6-6), Traditionalistic perceptions inWest Virginia and Arizona are poorly related, but WestVirginia combines with the others to provide a relativelystrong negative correlation -- the Individualist andMoralist states give less attention to building polcy.
Insert Figures 6-2 to 6-6 about here
Culture and the alternative policy approaches. /f the 33
different approaches to the various SPMs, only three are
significantly related to our culture variables -- one in finance
and two in personnel. As shown in Table 6-6, they are the
targeting of fiscal resources on specific population groups and the
Page VI-23
293
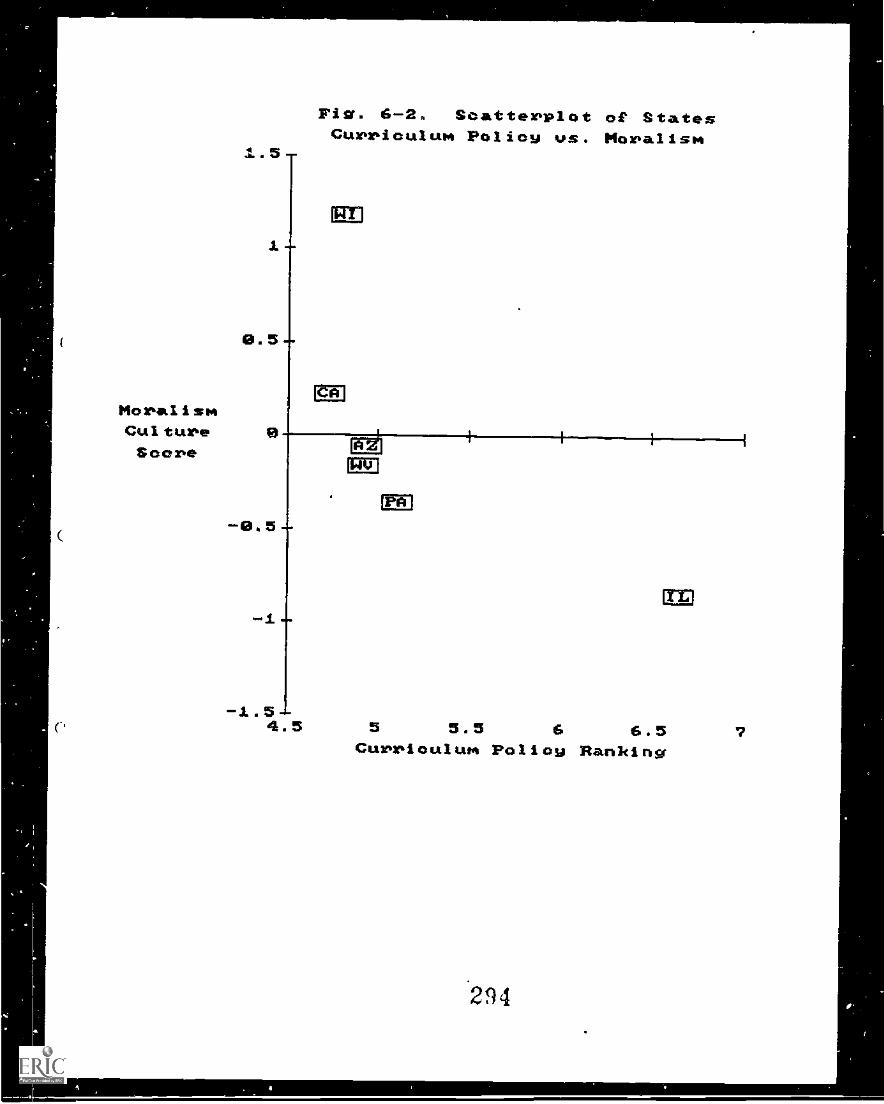
MoralismCultureScore
Fig. 6-2. Scatterplot of StatesCurriculum Policy us. Moralism
-1.54.5 5 5.5 6 6.5
Curriculum Policy Ranhing
.294
'7
4
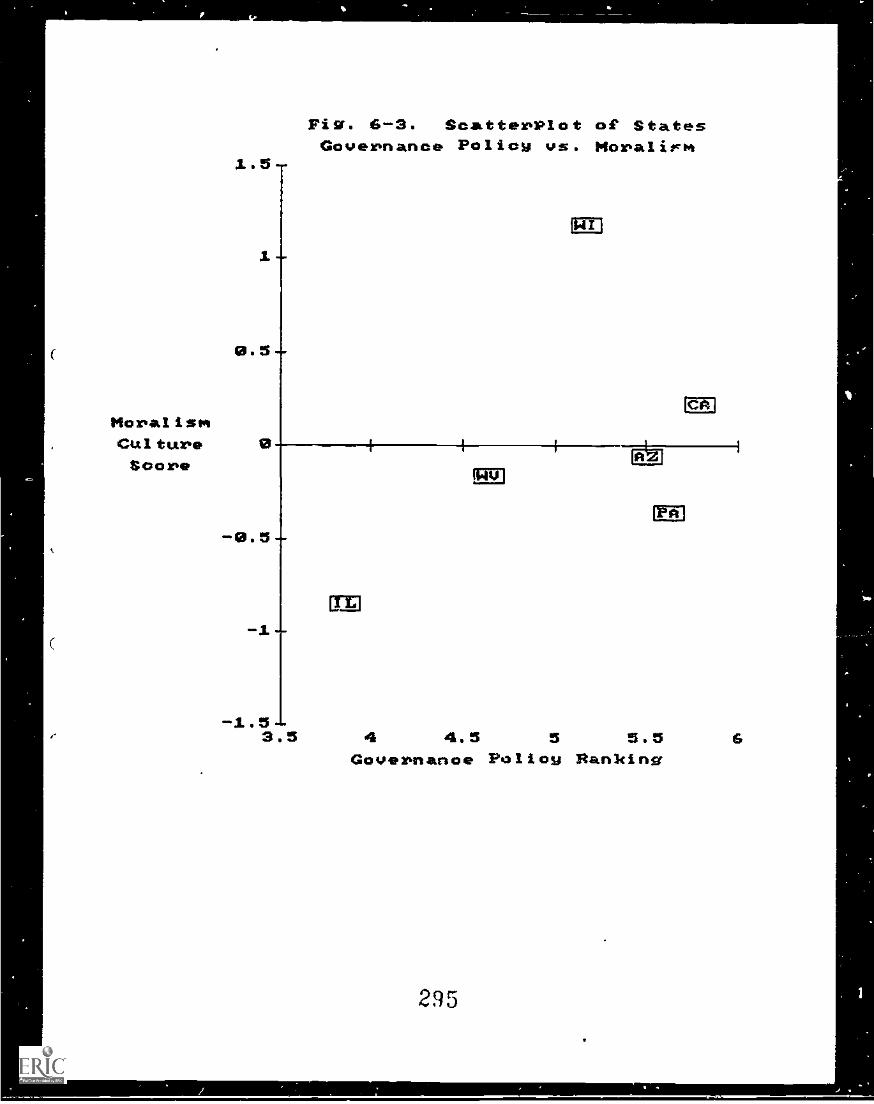
MoralismCultureScore
Fig. 6-3. Scatterplot of StatesGovernance Polioy vs. Moralirm
MA
mLi171
4 4.5 5 5.5Governance Policy Ranking
295
EG3
Tratition-alismCultureScore
Fig. 6-4. Scatterplct of StatesTesting Policy vs. Traaitionalism
0.5
CM
au
-0.52 2.5 3 3.5 4 4.5 5 5.5
Testing Policy Ranking
Li Ell
CIE
296
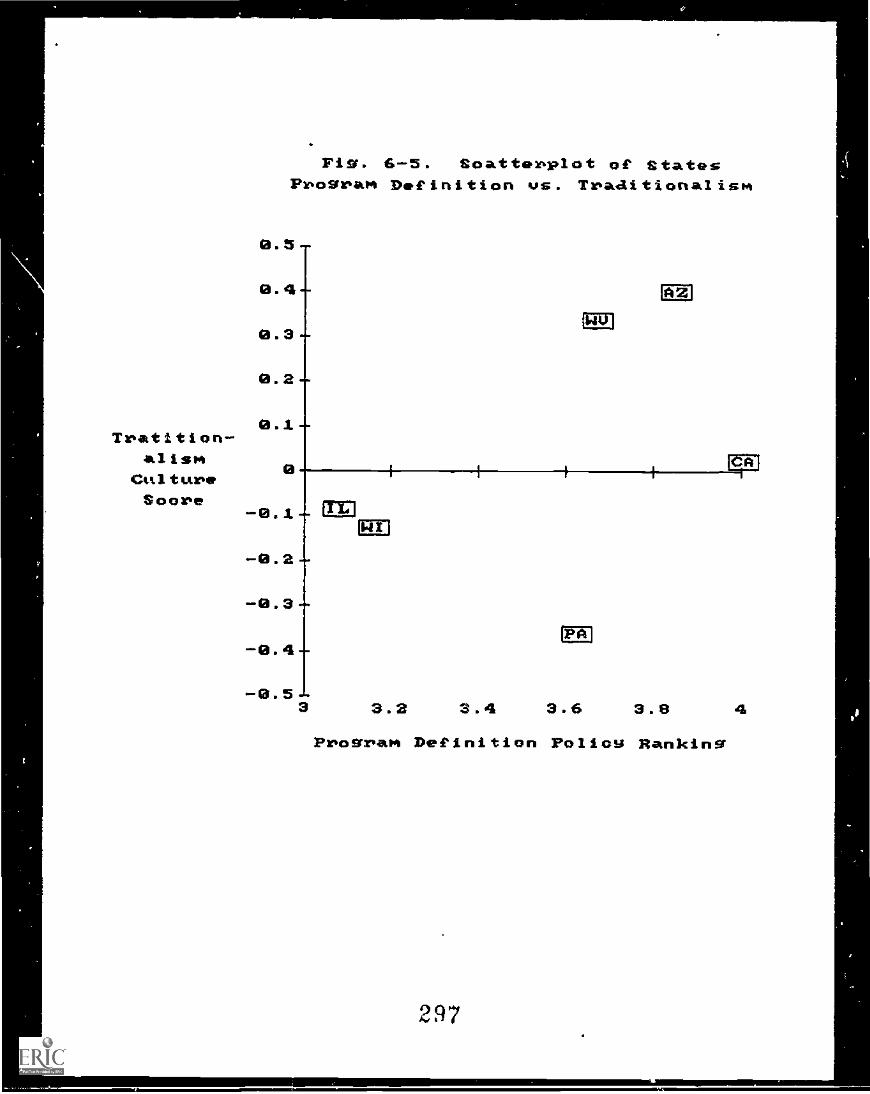
g
Tratition-alism
CulturbeScore
Fig. 6-5. Soattelpplot of StatesFrbogrbam Definition us. Tvaditionalism
0.5-
0.4-
0.3 -
0.2 -
0.1 -0
- 0 . 1 - CM]
-0.2-- 0.3-
-0.4-- 0.5
CB
BE
ED
GU
3 3.2 3.4 3.6 3.8 4
Pvogram Definition Folios; Ranking
297
,-
II
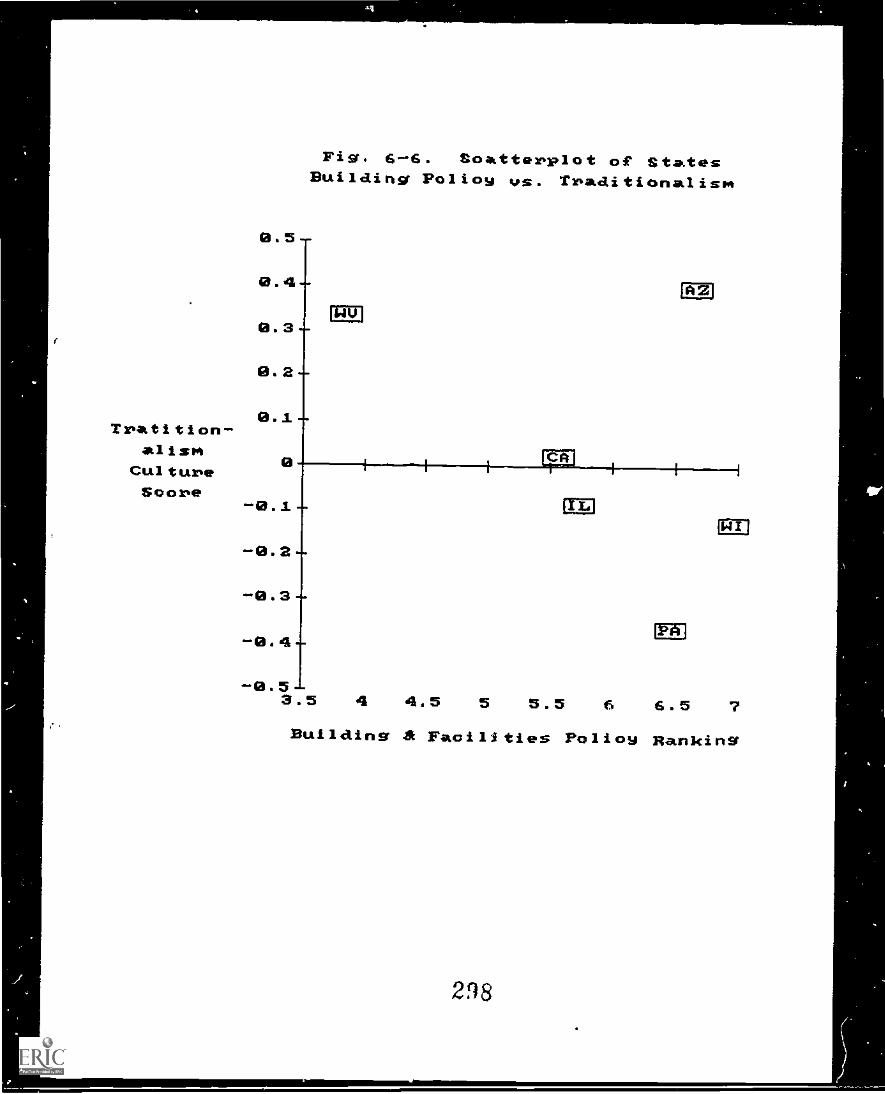
Tratition-alism
Cultuifte
Sootfte
Fig. 6-6. Soatterplot of StatesBuilding Policy vs. Traditionalism
Building Facilities Policy Ranking
298
,-
preferences for accountability or pre-service certification
training in school personnel policy.
Insert Table 6-6 about here
Moralistic culture was linked to a rejection of the financial
targeting approach. At first glance this is a bit difficult to
explRin, since moralistic cultures embrace a strong positive role
for government -- linking public services to popular definitions of
the public interest. When we note, however, that the correlation
between moralism and a targeting approach reaches a value of -.468
(indicating moderate support for this way of dealing with education
as a commonweal interest) and the correlation between state
traditionalism and the targeting approach to finance is a very
strong -.675 (indicating that traditionalists prefer this
conception of the commonweal good) the picture becomes clearer.
Moralist states favor equity through equalization; traditionalists
through the identification of populations with special needs and
proviuion of targeted services. Individualist states favor neither
of these approaches and are, in fact, indifferent to all of the
tiscal policy alternatives.
The two culture fuactions divergent orientations toward
appropriate handling of personnel policy issues. Both of the large
Pearson correlations coefficients have positive signs (meaning that
large function scores are accompanied by reduced attention to the
approaches -- i.e. larger numerical scores for ear-h approach).
Page VI-24
299
k
.!'
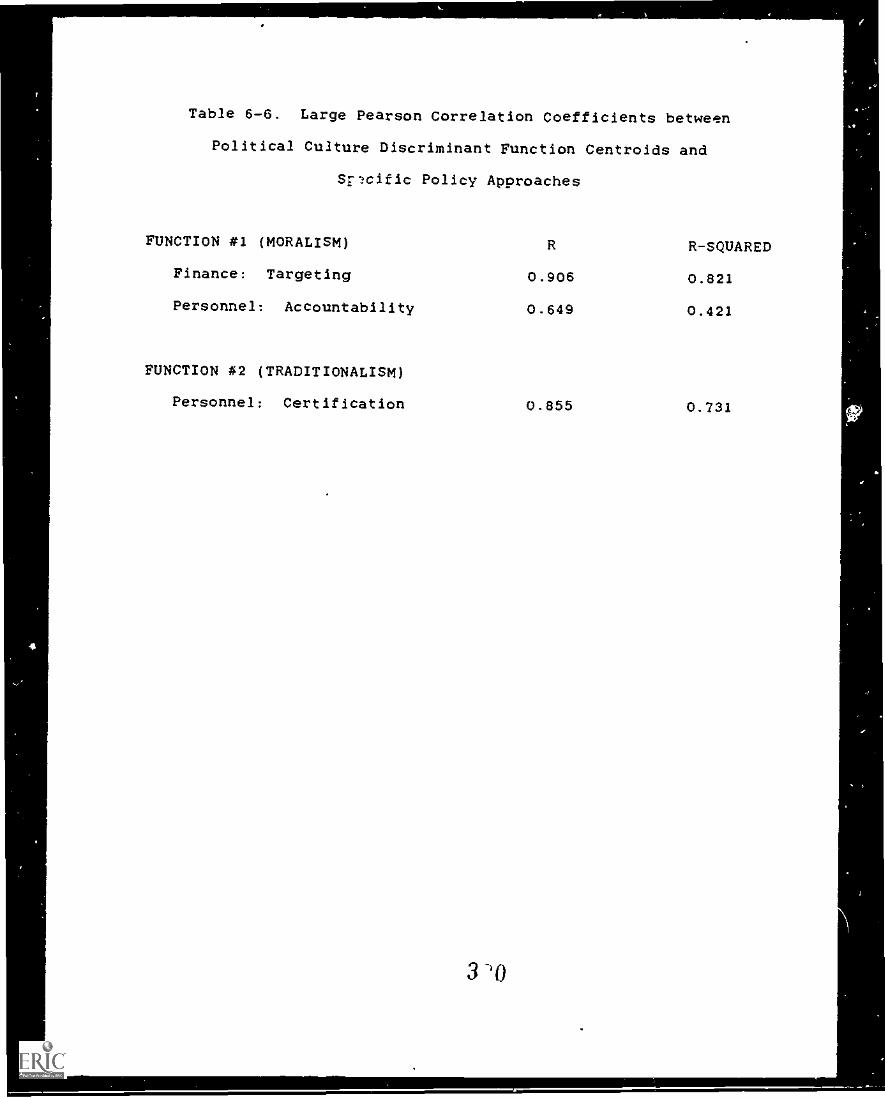
-
Table 6-6. Large Pearson Correlation Coefficients between
Political Culture Discriminant Function Centroids and
Srlcific Policy Approaches
FUNCTION #1 (MORALISM) R R-SQUARED
Finance: Targeting 0.906 0.821
Personnel: Accountability 0.649 0.421
FUNCTION #2 (TRADITIONALISM)
Personnel: Certification
3
0.855 0.731
(
State moralism, expressed as large centroid scores for Function #1,
is associated with a general resistance to the accountability
approach to personnel policy. With less intensity, moralist states
also reject increased attention to pre-service certification
training, preferring instead to concentrate on redefinition of
teacher work roles.
Traditionalist states (measured by Function #2) combine a very
strong rejection of pre-service certification training with
relatively strong support for the accountability approach to
personnel policy. Traditionalists clearly believe that state
control is best expressed through actions aimed at demanding
specific job performance, whereas moralists reject this
accountability approach. Individualist states share the
traditionalist support for accountability policies, but combine
that rejection with a rejection of the teacher job redefinition
approach to personnel.
Given the potential number of relationships between culture and
policy approach (66 total; 2 culture functions times 33
approaches), the three strong relationships reported in Table 6-6
are not very dramatic. They are quite interesting, however, and
suggest that future research work might fruitfully explore the
complex linkage between state cultures and education policy
preferences in much more detail.
Within-State Differences
A second method for analyzing the linkage between perceptions
of culture and of policy lies in sorting out the differences within
Page VI-25
391
states. The perceptions of political culture within a state might
be affected by system effects of the state or have an independent
effect in explaining variations in SPM priority and policy
judgments.
Hypotheses. Multivariate techniques enable us to test two
broad hypotheses about the possible effects of culture and policy
perceptions.
1. On those SPMs and approaches where there is wide agreementwithin and between the states regarding what the state isand should be doing, then differences in culture perceptionswould have little influence. That is, if there isagreement, there is no variation for culture differences toexplain.
2. On the other hand, where there are substantial differencesamong the states, or where there is low interest in aparticular SPM political culture should help to explainthose differences.
What do we know about such common and differing perceptions?
Chapters III-IV demonstrate that:
there is very high agreement that the most prominent of allstate policy mer:hanisms is school finance -- the allocationcf fiscal resources to various districts and programs.
there is similar high agreement that school building andfacilities policies are receiving the least amount ofattention.
that on the other five SPMs there are significantdifferences among the states in the relative rankings.
there is least agreement among the states in rankingalternative approaches to Governance; it is the only SPMwhere significant gaps among ratings of approaches betweenstates could not be found.
The logic of analysis, then, leads us to predict that within
states, in these areas where rankings of SPMs and approaches agree,
there will be few cultural effects, but in areas of much
Page VY-26
3 '12
disagreement, a stronger relationship between policy and culture
will be seen.
Methodology. The method of testing for these effects is
multiple regression, in which the states are entered as a block
before the introduction of political culture variables. This
process takes out the state effects on SPMs and approaches which
would otherwise confound the effect of political culture. Then we
can determine whether within-state variations in political culture
perceptions are related to variations in: a) elite judgments
regarding which SPMs and approaches are given priority, and b)
elite preferences on both policy matters.
Findings. Table 6-7 presents the significant results found in
the 12 regression equations where culture variables were
significant beyond the state effects. The only equation dealing
with Finance concerns the personal Preferences of policymakers for
a targeting approach to resource allocation. Elite preference for
one approach -- targeting funds on particular groups) -- is
strongly associated with their belief that their constituents are
Moralistic. By contrast, when it comes to building policy, where
all states agreed low priority and where that low priority is being
given to the whole domain knowledge of alternative approaches is
most limited, we see that cultural perceptions do explain
within-state differences. The building approach related to long
range architectural planning was best explained by Moralistic
cultural orientations (the highest betN coefficient in this table).
Individualist cultural views predicted policymaker's personal
Page VI-27
3 1) 3
preferences for two building policy approaches. Individualists
preferred remediations of architectural problems over other
approach.
Insert Table 6-7 about here
For the SPM where there was least interstate agreement --
Governance -- political culture perceptions accounted for much of
the variation in priorities and preferences. Note that this SPM is
a subject where differences over political values can have full
play. We find that seven of the twelve significant equations fall
in this Governance SPM, namely:
1. Moralistic culture perceptions:
.,
...
are positively related to the view that redistributingstate power at the state level is receiving muchattention; and our respondents' preference for it toreceive substantial attention, and
are negatively related with the view that attention isbeing given increasing site level control and to therespondents' Preferences for it to receive littleattention,
These perceptions are congruent with the moralistic view that
government, especially centralized government, can play a positive
role in realizing public goals.
2. Traditionalistic cultural 2gt22,14.(2ns:
inir are positively related to preferences forredefining student's rights and responsibilitiesand for altering expanding citizen influence overschool policy, and
Page VI-26
314
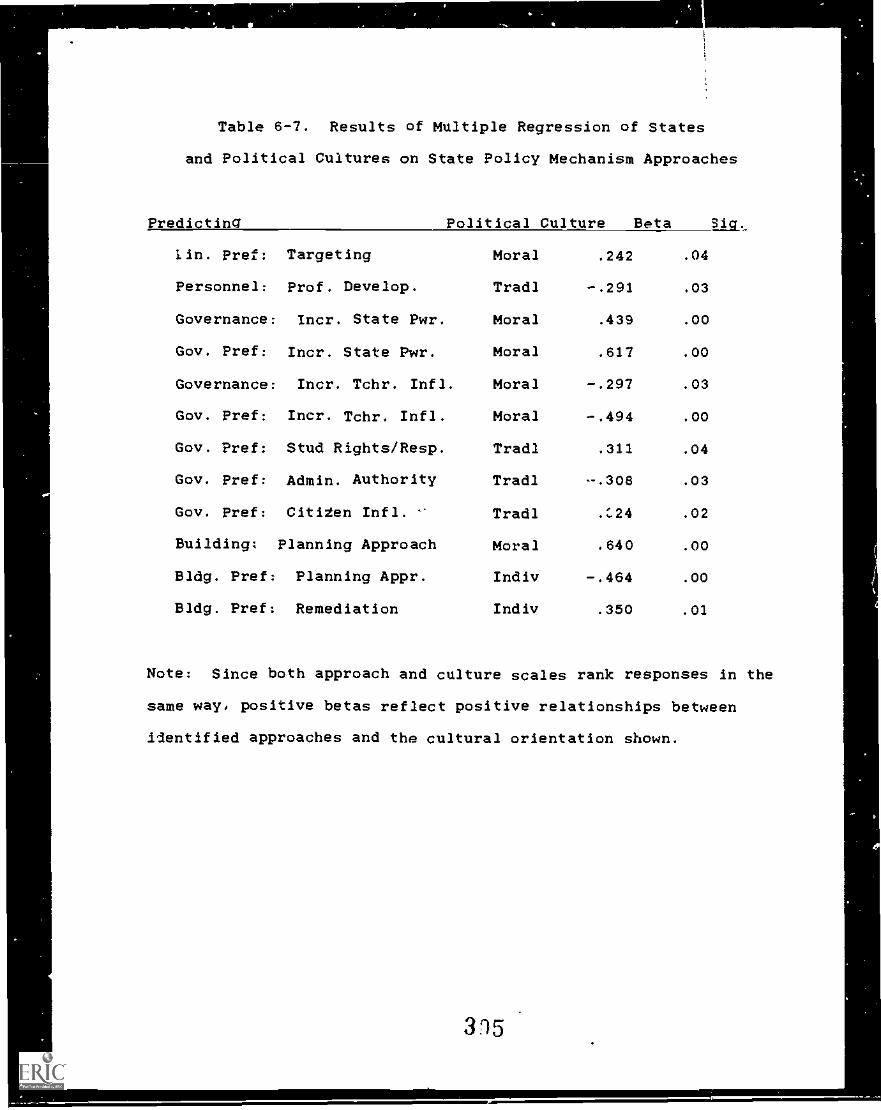
Table 6-7. Results of Multiple Regression of States
and Political Cultures on State Policy Mechanism Approaches
Predicting Political Culture Beta Sig.
lin. Pref: Targeting
Personnel: Prof. Develop.
Governance: Incr. State Pwr.
Gov. Pref: Incr. State Pwr.
Governance: Incr. Tchr. Infl.
Moral
Tradl
Moral
Moral
Moral
.242
-.291
.439
.617
-.297
.04
.03
.00
.00
.03
Gov. Pref: Incr. Tchr. Infl. Moral -.494 .00
Gov. Pref: Stud Rights/Resp. Tradl .311 .04
Gov. Pref: Admin. Authority Tradl -.308 .03
Gov. Pref: Citi2en Infl. Tradl .C.24 .02
Building; Planning Approach Moral .640 .00
Bldg. Pref: Planning Appr. Indiv -.464 .00
Bldg. Pref: Remediation Indiv .350 .01
Note: Since both approach and culture scales rank responses in the
same way, positive betas reflect positive relationships between
identified approaches and the cultural orientation shown.
315
'T
41'
are negatively associated with increasing administratorinfluence over policy.
These perceptions are compatible with an aggressive anti-public
service stance, suggesting that traditionalist cultures view
government as a controlling rather than an enabling institution.
Limitation of Cultural Explanation. If cultural perceptions
could fully explain elite judgments of SPM priorities and elite
preferences for approaches, there would be 42 equations in which
significant relationships would exist (7 SPM priorities 7
approaches x 3 political cultures). The analysis produced,
however, a total of only 12 significant equations. But the
assumption underlying such an expected relationship is faulty
because of an interesting statistical fact. If every respondent
within a given state had the same SPM priority and approach
preference, ostensibly as a reflection of that state's culture,
then there would be no variation within that state for culture to
explain. In that case, the between-state effects are all we would
expect to find. So, one reason why this section has only 12
significant equations is because there is so little of the total
variance is left to explain when between state effects are removed.
Rather, what we find is a reflection of both the commonalities and
differences-in perceptions of SPMs and approaches reported in
detail in chapters
Comparative Influence of Culture. There is no evidence that
the data in this chapter will suggest a single explanation for all
policy variance. As one path to understanding education policy
Page VI-29
3".6
..
alternatives, however, it provides some importanx Insights into the
ways in which different perceptions among the states, regarding
political culture objects lead to differences in policy priorities
and approaches. But does culture explain these differences any
better than other factors?
To test this comparative Influence we regressed against the
rankings of the SPM the following independent variables:
1. The three political culture answers.
2. The personal qualities of our respondents (analyzedelsewhere in this report), including: political party,self-reported liberalism-conservatism, income, age, sex, andoccupation. These are measures of status and politicalvalue which much research has shown to be associated withdifferences in beliefs and behaviors in our society.
3. The states themselves as a block, for there might besomething else In the state we have not tapped which couldexplain differences.
State identity counted for the most variance on all the SPMs,
while personal qualities account for none. When personal variables
are added to the cultural variables both are reduced to little or
no explanatory power.
When the states are removed from the stepwise regression, the
results improve only slightly. Political party is significant in
determining how the Personnel SPM was ranked, (Democrats gave it
high priority -- beta -.251, significance 014). only two cultural
answers emerge as significant. Individualist culture predicts
attention Curriculum Materials -- (beta -.362, significance .000).
Traditionalist culture predicts attention to building policy (beta
.235, significance .019). It is important to note from earlier
Page VI-30
327
chapters that these two SPMs have few respondents knowledgeable
about them and all agree they receive lowest attention in state
school policymaking.
Summary,
In this chapter we have explored the existence and utility of
the concept of political culture. We found that a Moralistic
culture function was a powerful interstate discriminant, and that a
Traditionalistic function was present, but less distinct. These
cultural functions served to explain some interstate differences in
rankings and preferences amonc the SPMs by state policy elites, but
in a quite complex manner. Also, these functions explained quite
different within-state differences in such rankings and
preferences.
The explanatory power lf distinct political cultures is
similarly present in regression analyses when combined with other
explanations. The state itself, however, seems to account for
major policy differences. A similar finding using regression
appeared recently in accounting for why some states adopted more of
the "A Nation at Risk" recommendatlans than did others (Shinn and
Van Der Slik, 1985). These authors found in a 50-state study that
the Moralist PCs retained some significance, but that other factors
were more important. An updated version (reviewed by one author
but not yet presented or published) reports that the Southern
states -- home of the Traditionalist PCs in the Elazar (1984)
analysis -- accounted for far more of the variance than any other
Page VI-31
398
quality, including those economic measures usually found so
important.
But the explanatory power of culture may well be lessened when
all states are swept by policy reforms. That possibility is
demonstrated in the high agreement in our states that Finance was
most important by a considerable measure, or thLt Buildings and
Curriculum were just as uniformly ranked low. The first arises
from the continuing problems of educational finance in many states,
while the second arises from the low interest and knowledge that
those SPMs generate.
Maybe the ultimate utility of culture does not lie in multi-
variate forms of analysis, because Ule elements of this influence
are not captured so specifically as such analysis requires. This
influence is better detected and anallzed from accounts in our
field reports which show that there are different perceptions of
the political system, different rules for making policy within it,
and different values which appear in their policy behavior and its
results, their statutes. When reported in this fashion, the major
utility of political culture lies in tracing how educational values
become institutionalized and so serve as the origin of later
policies, which will differ among the states as the cultures
differ. There is little in the multivariate approach to
understanding that can capture these complex and subtle human
interactions, except as respondents report them. That will become
more evident in chapters IX and X of this report.
Page VI-32
319
APPENDIX A
REFINING THE INSTRUMENT
It is important for future work to determine which objects and
questions in the policymaker interviews were especially good
indicators of political culture. That is because not all responses
loaded very strongly on some -- or any -- of the functions derived.
Ideally, all the Individualist PCs answers in each of the eleven
sets of questions would load heavily and significantly on the
functions found. That was not the case, however, but there were
some questions which did the job. We begin by asking: Which set
of questions found the three cultural responses stgnificantly
loading on each function? Then, which reported significance on two
out of threu functions?
Matching the Ideal
Only two of the eleven sets matched the iemanding requirement
that all three cultural responses load significantly on the first
function; another set did this but on the secon:.3 function. The
following lists question and correlation of each answer in the
function.
The first function with all three items significant were:
2. The most appropriate sphere of government activity is seen as:
economic, i.e., support for private initiative, guaranteeingcontracts, economic development, etc. (Individualist PC,
coefficient = .20)community enhancement, i.e., public services, community
Page VI-33
310
development, social and economic regulation, etc. (Moralist PC,.35)
maintenance of traditional social patterns and norms, i.e.,setting social standards, enforcing separation of private and
public sector activity, etc. (Traditionalist PC, .48)
10. Competition among the parties is:
active, but not over issues or ideological principles(Individualist PC, 49)
focused on isaues, philosophy, or basic principles (MoralistPC, .55)
primarily between elite-dominated factions within the party(Traditionalist PC, .26)
The second function with all three answers significant were:
6. Generally, the public views politics as:
a distasteful or dirty business, left to those who are willingto engage in that sort of thing (Individualist PC, .47)
an important, healthy part of every citizen's duty (MoralistPC, .57)
an activity for special groups of people with uniquequalifications (Traditionalist PC, -.02)
Note that the successful sets focused on three analytically
separate objects in the political world which a culture might
evaluate. These are the role of government, the nature of party
activity, and the view of.politics (that ties the first two
together). This col.i.ection did not include the object of
bureaucracy, although it appears shortly. But the ability of these
three objects to distinguish significantly among diverse
policymakers suggests their future utility in research with this
smaller list. The results also reinforce the evidence that
Page VI-34
311
V'o
political culture has some validity as a guide to political
behavior.
NearlY Matching the Ideal
If we lower our testing one notch, and seek those sets which
had only two out of the three answers loading significantly, we
find a new political ob.lect -- bureaucracy.
First function significant answers were:
5. Civil service or merit systems for government employees are:
accepted in principle, but poorly implemented (IndividualistpC, .23, not significant on this function, but significant at .55on second function)
broadly supported and well implemented (Moralist PC, .47)
rejected as interfering with needed political control(Traditionalist PC, .44)
11. The dominant aim of party competition appears to be:
winning offices and other tangible rewards (Individualist PC,.23, not significant on first function)
gaining broad support for a program or policy (Moralist PC,.52)
extending the control of particular elite groups(Traditionalist PC, .60)
Then, if we add to this relaxed test those sets where two out
of three answers were significant on the second function, they
were:
4. Government bureaucracies are viewed;
ambivalently, i.e., they are efficient but interfere withdirect political control over public services (Individualist PC,-.22)
positively, i.e., they insure political neutrality andeffectiveness in the delivery of public services (Moralist PC,.36, not significant)
Page VI-35
312
negatively, i.e., they depersonalize government and reduceoverall program performance (Traditionalist PC, .28)
Not as strongly as other political objects, attitudes aboutbureaucracy help discriminate among the cultures and add anotherstroke to the picture of party competition noted earlier. Usedwith those reviewed in the preceding section, such question setswould provide greater discrimination in further surveys of thiskind.
The Failures
While this technique compels every variable to appearsignificant in at least one function, that minimum standardoperated only for the question set on how party membership was seen(No. 9 in Appendix 6 chapter II), although there it had strongloadings on all threc functions derived. Two other questions (1.3) loaded significantly only at the third function; this functionwas not significant for Moralist PC but was for Individualist PCanswers. Other questions did have significant responses amongthree functions, not on one; for example, in response to thequestion set. Politics is viewed as an activity for, theIndividualist PC answer was significant on the first function, theMoralist PC on the third, and the Traditionalist PC on the second
(incidentally, with sizable coefficients). The same scatteroccurred for the Political parties are seen as question set.
It is helpful to realize that an instrument translating ascholar's (Elazar, 1984) descriptions of a complex culture could beused successfully to capture perceptuai distinctions among the
Page VI-36
313
three cultures even in a handful of occasions.
Page V1-37
31 4
REFERENCES
Almond, G. (1956). Comparative political systems. Journal of
Politics, 18, 391-409,
Almond, G., & Verba, S. (1963). The civic culture. Princeton, NJ:
Princeton University Press,
Benedict, R. (1934). Patterns of culture. Boston: Houghton
Mifflin.
Crain, R., et al. --need all names--(1969). The politics of school
desegregation. Garden City, NY: Doubleday, Ancor.
Dye, T. (1966). Politics, economics, and the_public. Chicago: Rand
McNally.
Elazar, D. (1970). Cities of the prairie. New York: Basic Books.
Elazar, P. (1984). American federalism: A View From the States (3rd
ed.),. New York: Harper & Row.
Elazar, D., & Zikmund, J. 11. (1975). The ecology of American
political culture. New York: Crowell.
Fairbanks, D. (1977). Religious forces and 'morality' politics in the
American states. Western Political Quarterly, 30, 411-17.
Gastil, R. (1975). The cultural regions of the United States.
Seattle: University of Washington Press.
Gausted, E. (1962). Historical atlas of religion in America. New
York: Harper & Row.
Hanson, R. (1980). Political culture, interparty competition and
Political efficacy in the American states. Publius: The Journal
of Federalism, 10(2), 17-36.
Page VI-38
315
#
Hutcheson, J., & Taylor, G. (1973). Religious variables political
system characteristics, and policy outputs in the American
states. American Journal of Political Science, 17, 414-21.
Inkeles, A., a Levinson, D. (1954). National character: The study of
model personality and sociocultural systems. In G. Lindsey
(Ed.). Handbook of social psychology, (pp. ). Cambridge,
MA: Addison-Wesley.
Joslyn, R. (1980). Manifestations of Elazar's political subcultures:
State 0.inion and the content of olitical camPaign advertising.
Publius: The Journal of Federalismj_10(2), 37-58.
Key, V. 0. (1949). Southern politics in state and nation. New York:
Knopf.
Kincaid, J. (1980). Political culture and the_gualitv of urban life.
Publius: The Journal of Federalism, 10(2), 69-110.
Lovrich, N., Jr., Daynes, B., & Ginger, L. (1980). Public policy and
the effects of historical-cultural phenomena: The case of
Indiana. Publius: The Journal of Federalism, 10(2), 111-26.
Marshall, C. (1986). The context of state level PolicY formation.
Paper prepared for presentation to the meeting of the American
Education Research Association, San Francisco.
Mead, M. (1926). Coming of age in Somoa. New York: (publisher?)
Patterson, S. (1966). The political cultures of the American states.
Journal of Politics, 30, 167-209.
Pye, L. (1968). Political culture. In International encyclopedia of
the social sciences, (Vol. 12). New York: Crowell Collier &
Macmillan.
Page VI-39
316
Pye, L., & Verba, S., (Eds.). (1965). Political culture and political
development. Princeton, NJ: Princeton University Press.
Sharkansky, I. (1969). The utility of Elazar's political culture.
Polity, 2(1), 66-83.
Shinn, D., & Van Der Slik, J. (1985). Legislative efforts to improve
the Quality of public education in the American states: A
comParative analysis. Paper prepared for presentation the annual
meeting of the American Political Science Association, New
Orleans.
Sweet, W. (1952). Religion in the development of American culture.
New York: Scribner's.
Welch, S., & Peters, J. (1980). Statl_political culture and the
attitudes of state senators toward social, economic welfare and
corruption issues. Publius: The Journal of Federalism, 10(2),
59-68.
Wirt, F. (1980). Does control follow the dollar? Value analysisL
school Dolioy, and state-local linkages. Publius: The Journal of
Federalism, 10(2), 69-88.
Wirt, F. (1986). Multiple paths for understanding the role of values
in state_PolicY. Paper prepared for presentation to the annual
meeting of the American Education Research Association, San
Francisco.
Wirt, F., & Kirst, M. 1982. Schools in conflict. Berkeley, CA:
McCutchan.
Young, K. 1977. Values in the policy process. Policy and Politics,
3(5), 1-22.
Page V/-40
3 1 7
Zelinsky, W. (1973). The cultura! _geography of the United States.
Englewood Cliffs, NJ: Prentice-Hall.
Page VI-41
318
CHAPTER VII
STATE STATISTICAL PROFILES
Introduction
Education policy is, no doubt, grounded in the overall condition
of state social, political and educational systems. In this
chapter we examine the general status of these systems in each of
our six sample states. The focus of the discussion is descriptive,
our aim is to illuminate the unique character of each state
studied, and to show that they are, as a group, broadly
representative of the country as a whole.
As reported in the bibliography, there were nine sources for the
statistical data reported in this chapter. The most recent is a
wall chart, State Education Statistics, recently prepared by the
Department of Education's Office of Planning, Budget and Evaluation
(ED, 1986). Other statistics were taken from the U.S. Bureau of
Census' Statistical Abstract of the United States, (U.S. Govt.
Printing Office, 1985c), National Center for Education Statistics,
Digest of Education Statistics 1983-84 (U.S. Govt. Printing Office,
1984), Digest of Education Statistics 1984-85 (U.S. Govt. Printing
Office, 1985b), The Condition of Education (U.S. Govt. Printing
Office, /985a), a contract study for the Department of Education by
Michie and Moore (1986), a series of data tables in Jacob and Vines
(1984), a paper by Shim and Slik (1985), and the Book of the States
Page VII -1
319
published by the National Conference of State Legislatures (NCSL.
1984).
Two techniques are used to report the data drawn from these
sources. First, tables of key variables are presented. The
variables are clustered into twelve related domains of state system
performance:
1. Educational Productivity
2. Human Resource Inputs to Education
3. Fiscal Resource Inputs to Education
4. Indicators of Children's Educational Need
5. Indicators of Community Educational Need
6. Measures of State Fiscal Capacity
7. State Policies Defining School Programs
8. State Social Demography
9. Demographic Characteristics of School Children
10. Political Power Distribution in the States
11. Levels of Political Activity in the States
12. Economic Context Factors Influencing Education
A total of 45 variables are examined in these twelve tables (Tables
7-1 through 7-12).
In order to clarify the ways in which these variables describe
and define the policy context of the six states, a graphic display
of the position of the sample states on each of the variables is
presented (See Figures 7-1 through 7-12). The figures show the
deviation scores for each of the sample states on each of the
variables. The deviation scores were derived by calculating
Page VII-2
320
standard scores (Z-scores) for each variable. Hence the displayed
score for each state is a measure of its value above or below the
national average -- the size of the deviation from the national
mean measured in standard deviation units. Roughly speaking, a Z-
score greater than I indicates that a state's score is among the
highest (or lowest) eight states on that particular variable. A
score greater than 2 means that only I or 2 states have a value
this far from the national mean.
Educational Productivity
The first area of concern is the productivity of the public
school system in each state. Assessment of school productivity is
notoriously difficult and has proven politically controversial in
many instances. Academic achievement is the most widely discussed
productivity goal for the public schools, but test scores are not
the only important indicators of high performance. More
importantly, the only standardized achievement test score data
available for cross-state comparison are those of the American
College Testing program (ACT) and the Scholastic Aptitude Test
(SAT). These tests are problematic in two important respects.
First, only a limited portion of any school's students take the
tests -- those aspiring to higher education. As a result, the test
scores are biased and do not assess the average or typical effects
of schooling. Second, these tests were developed for the express
purpose of measuring students capasity to perform well in college,
not to assess their acquisition of knowledle from the school
curriculum. In some unknown mixture, scorAs on these colle/e
Page VII-3
321
admissions tests result from a combination of school teaching and
student intellectual ability.
Hence, while we report on the SAT and ACT te:_t scores for our
sample states, we also report on three other measures of school
performance: .the proportion of each states students motivated to
take the tests, the rate at which ninth grade students graduate
from high school, and the rate of school attendance by enrolled
students. There are, no doubt, significant flaws in each of these
measures as well, but they are probably reliable enough to reflect
accurately the general pattern of school performance within our
sample states.
a. Standardized Test Score Data
Most high school students take the SAT in California and
Pennsylvania. The larger number take the ACT in Arizona Illinois,
West Virginia and Wisconsin. Hence, the Secretary of Education's
Wall Chart reports the scores this way. As shown in Table 7-1 and
reported graphically in Figure 7-1, all of our sample states but
West Virginia are performing above the national mean on their
respective tests.
Insert Table 7-1 about here.
Insert Figure 7-1 about here.
Page VI/ -4
322
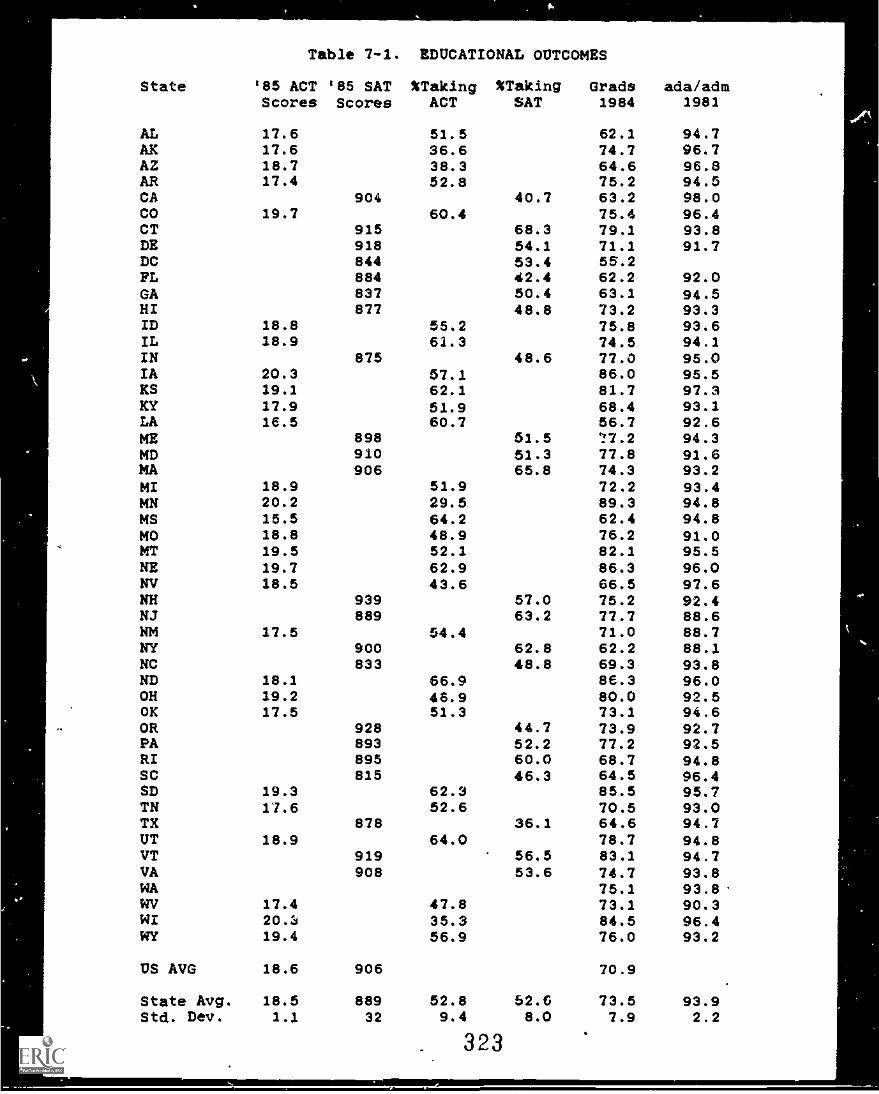
=Ix
Table 7-1. EDUCATIONAL OUTCOMES
State '85 ACT '85 SAT %Taking %Taking Grads ada/admScores Scores ACT SAT 1984 1981
AL 17.6 51.5 62.1 94.7AK 17.6 36.6 74.7 96.7AZ 18.7 38.3 64.6 96.6AR 17.4 52.8 75.2 94.5CA 904 40.7 63.2 98.0CO 19.7 60.4 75.4 96.4CT 915 68.3 79.1 93.8DE 918 54.1 71.1 91.7DC 844 53.4 56.2FL 884 42.4 62.2 92.0GA 837 50.4 63.1 94.5HI 877 48.8 73.2 93.3ID 18.8 55.2 75.8 93.6IL 18.9 61.3 74.5 94.1IN 875 48.6 77.0 95.0IA 20.3 57.1 86.0 95.5KS 19.1 62.1 82.7 97.3KY 17.9 51.9 68.4 93.1LA 16.5 60.7 56.7 92.6ME 898 51.5 '1'7.2 94.3MD 910 51.3 77.8 91.6MA 906 65.8 74.3 93.2MI 18.9 51.9 72.2 93.4MN 20.2 29.5 89.3 94.8MS 15.5 64.2 62.4 94.8MO 18.8 48.9 78.2 91.0MT 19.5 52.1 82.1 95.5NE 19.7 62.9 86.3 96.0NV 16.5 43.6 66.5 97.6NH 939 57.0 75.2 92.4NJ 889 63.2 77.7 88.6NM 17.5 54.4 71.0 88.7NY 900 62.8 62.2 88.1NC 833 48.8 69.3 93.8ND 18.1 66.9 86.3 96.0OH 19.2 46.9 80.0 92.5OK 17.5 51.3 73.1 94.6OR 928 44.7 73.9 92.7PA 893 52.2 77.2 92.5RI 895 60.0 68.7 94.8SC 815 46.3 64.5 96.4SD 19.3 62.3 85.5 95.7TN 17.6 52.6 70.5 93.0TX 878 36.1 64.6 94.7UT 18.9 64.0 78.7 94.8VT 919 56.5 83.1 94.7VA 908 53.6 74.7 93.8WA 75.1 93.8WV 17.4 47.8 73.1 90.3WI 20.3 35.3 84.5 96.4WY 19.4 56.9 76.0 93.2
US AVG 18.6 906 70.9
State Avg. 18.5 889 52.8 52.6 73.5 93.9Std. Dev. 1.1 32 9.4 8.0 7.9 2.2
- 323
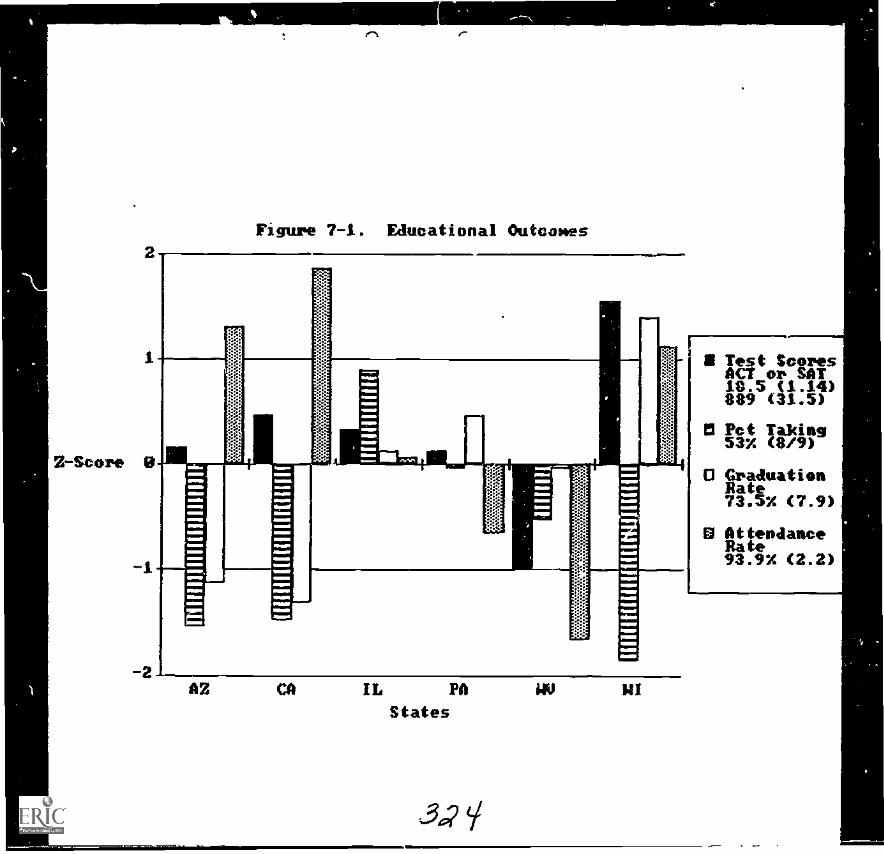
Z-Score
Figure 7-1. Educational Outcomes
AZ ca IL PA
States
3,77 (71=
NI
11 Test ScoresACT or SAT18.5 (1.14)889 (31.5)
a Pct Taking53% (8/9)
O GraduationMate73.5% (7.9)
O AttendanceRate93.9% (2.2)
Wisconsin students performed the highest of all. With an average
of 20.3 they tied Iowa students for the highest ACT test scores in
the nation. West Virginia, with an average score of 27.4, tied
with Arkansas and outperformed only Mississippi and Louisiana among
the 28 states using this test.
b. Percentage of Students Taking College Admissions Tests
In past years state average scores on the ACT and SAT were
strongly correlatd with the proportion of their students who took
the tests. Apparently because high ability students are the first
to sign up for the tests, states with more students taking the test
had lower averages. In the most recent data, for some unknown
reason, this historical correlation does not seem to be present.
The percent of stuc4hts taking a college admissions test has
another important meaning, however, one which makes it an
appropriate indicator of school performance. Aspiring to higher
education is a necessary pre-requisite to taking these
examinations, hence an increase in the number of students taking
the tests would be a pretty good indication that the schools are
succeeding in motivating students to pursue higher learning.
On this measure, only Illinois with 62.3% of its students taking
the ACT is producing above the national average (about 53% of
seniors taking the college admission test). Wisconsin, whose
average scores are among the highest in the nation is least
successful among our sample states in motivating students to take
the ACT.
Page VII -5
325
c. Graduation Rates
Statistics on the extent to which students are dropping out of
school are notoriously weak -- there is no good system for tracking
student movement from school to school, and good reasons for
schools whose inconies are linked to student enrollment to be slow
in reporting dropouts. Nevertheless, some sense of school
productivity can be acquired by comparing the number of high school
graduates with the number of ninth graders four years earlier. Our
sample states show striking variation la the proportion of their
ninth graders finishing in four years. With an average rate of
73.5% for all states, Wisconsin shows the strongest performance --
graduating 84.5%, sixth highest in the nation. At 63.2% and 64.6%.
California and Arizona are more than a full standard deviation
belaw the national average.
d. Student Attendance at School
Student attendance is another indicator of school performance.
Though problems of weather, distance and social demography
differentially affect attendance rates across the country, student
absenteeism is widely recognized as a serious problem in low
performing school systems. The data indicate that students in West
Virginia and Pennsylvania attend well below the national average
rate of 93.9%. (Their rates are 90.3% ana 92.5% respectively).
The highest reported attendance rate among our sample states was in
California (98%). Arizona and Wisconsin also report high
attendance rates, while the Illinois rate is just 0.2% above the
national average.
Page VII -6
326
In sum, measured by test scores alone, five of our six states are
performing above national norms. But if motivation to take the
tests, timely graduation from high school and regular attendance
are also considered important, the picture is much more complex.
Only Illinois is at or above the national average cn all four
outcome indicators, while West Virginia's scores are below average
on all measures. Overall, Wisconsin could be viewed as having the
strongest school system -- local factors rather than poor schools
probably account for most of their low rate of ACT test taking.
Human Resource Inputs to Education
Three measures of the human resource inputs available to the
schools are presented in Table 7-2 and graphically displayed on
Figure 7-2. The first, average teacher salary (in 1985 dollars),
reflects the value placed on teaching within each state (and
presumably affects the willingness of highly qualified workers to
enter this occupation). The remaining two indicators --
pupil/teacher and pupil/staff ratios -- reflect the willingness of
states to invest in large school staffs.
Insert Table 7-2 about here.
Insert Figure 7-2 about here.
do
Page VII -7
327
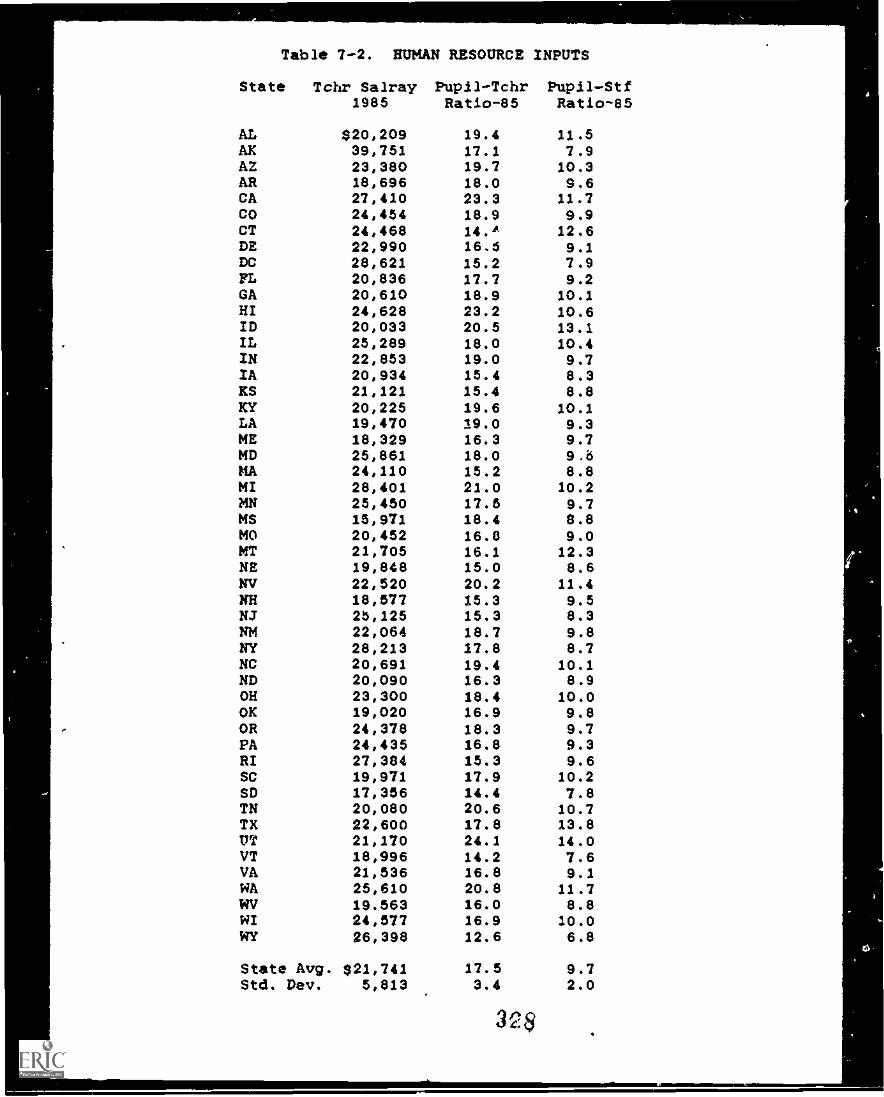
Table 7-2. HUMAN RESOURCE INPUTS
State Tchr Salray Pup11-Tchr Pup11-Stf1985 Ratio-85 Ratio-85
AL $20,209 19.4 11.5AK 39,751 17.1 7.9AZ 23,380 19.7 10.3AR 18,696 18.0 9.6CA 27,410 23.3 11.7CO 24,454 18.9 9.9CT 24,468 14."' 12.6DE 22,990 16.0 9.1DC 28,621 15.2 7.9FL 20,836 17.7 9.2GA 20,610 18.9 10.1HI 24,628 23.2 10.6ID 20,033 20.5 13.1IL 25,289 18.0 10.4IN 22,853 19.0 9.7IA 20,934 15.4 8.3KS 21,121 15.4 8.8KY 20,225 19.6 10.1LA 19,470 19.0 9.3ME 18,329 16.3 9.7MD 25,861 18.0 9.16
MA 24,110 15.2 8.8MI 28,401 21.0 10.2MN 25,450 17.5 9.7MS 15,971 18.4 8.8MO 20,452 16.0 9.0MT 21,705 16.1 12.3NE 19,848 15.0 8.6NV 22,520 20.2 11.4NH 18,577 15.3 9.5NJ 2b,125 15.3 8.3NM 22,064 18.7 9.8NY 28,213 17.8 8.7NC 20,691 19.4 10.1ND 20,090 16.3 8.9OH 23,300 18.4 10.0OK 19,020 16.9 9.8OR 24,378 18.3 9.7PA 24,435 16.8 9.3RI 27,384 15.3 9.6SC 19,971 17.9 10.2SD 17,356 14.4 7.8TN 20,080 20.6 10.7TX 22,600 17.8 13.8UT 21,170 24.1 14.0VT 18,996 14.2 7.6VA 21,536 16.8 9.1WA 25,610 20.8 11.7WV 19.563 16.0 8.8WI 24,577 16.9 10.0WY 26,398 12.6 6.8
State Avg. $21,741 17.5 9.7Std. Dev. 5,813 3.4 2.0
32$
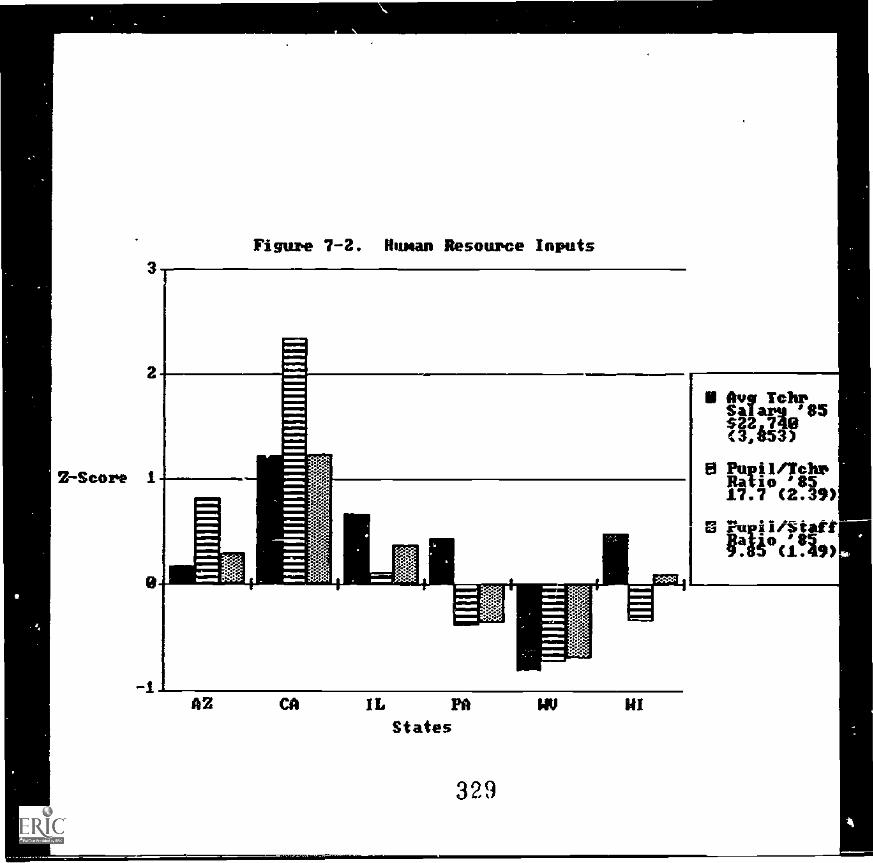
.411)tx+
1111111111
*Um
11111111111I 111111111111111111 111111
co1
C1
a
a
a. Teacher Salary
Among our sample states, all but West Virginia pay teachers above
the national average of $22,740 per year (this is an average of the
state averages, not the average for individual teachers).
California pays the highest of our sample states. At $27,410,
their teachers get the fifth highest salaries in the nation --
behind Alaska, the District of Columbia, Michigan and New York.
West Virginia's $19,563 ranks 43rd in the nation.
Though the numbers are not shown in Figure 7-2, we examined how
salary differentials for teachers are related to the ov
average per capita income within each state. As shown in Table 7-6
(discussed below), per capita income varies substantially among the
atxt. Nationally, the typical teacher earns about 1.84 times the
average per capita income within his/her state. In five of our
sample states that ratio exceeds the national average (only
Illinois has a lower ratio with average teacher salaries only 1.83
times per capita income). In fact, West Virginia, whose salary is
lowest among our sample states, actually provides the best ratio
between teacher salary and per capita income. The 2.01 ratio in
this state means that a teacher with one dependent to support just
manage to provide the average income for each of them.
b. Pupil/Teacher Ratios
Our six states were evenly divided on the question of
pupil/teacher ratios. California, Arizona and Illinois have fewer
than average teachers while West Virginia, Pennsylvania and
Wisconsin have more than the national norm. California's 23.3:1
Page VII-8
330
ratio puts this state in 50th place, just above last place Utah.
West Virginia's 16:1 ration puts that state 13th from the top in
willingness to provide a generous number of teachers.
Since both contribute to the overall cost of education, one might
expect a direct trade-off between average salary and the number of
teachers provided. As the data indicate, however, that this in not
always the case. Pennsylvania and Wisconsin manage to provide both
higher than average salaries and below average pupil teacher
ratios.
c. Pupil/Staff Ratios
When the entire educational staff in considered, only
Pennsylvania and West Virginia succeed in keeping the ratio below
the national average. Three of other states are close, but
California's 11.7:1 pupil/staff ratio is substantially above the
9.65:1 national average.
Comparison of the teacher and general staff ratios gives some
insight into the staffing efficiency of state school systems.
Wisconsin and Illinois have relatively °efficient" staffing --
their non-teaching staff is relatively sparse compared to their
teaching staff. California and Arizona are at the other extreme --
they bring their overall pupil/staff ratios closer to the national
average by allowing teacher work loads to rise.
In sum, human resource inputs in our sample states are relatively
spartan. Only Pennsylvania is able to provide both higher than
average teacher salaries and lower than average pupil work loads.
West Virginia appears to make a trade-off appropriate to a sparsely
Page VII-9
331
populated state -- a large staff at a substantially below average
pay rate. California is at the opposite extreme, giving much
higher than average salaries while allowing work loads to soar.
Fiscal Resource Inputs to Education
Four measures of the level of financial support made available to
the public schools were examined. The first measure, per pupil
expenditure, is the most direct. It can also be misleading,
however, since program costs and living standards vary from state
to state. Hence, two Measures of comparative effort to fund
schooling were also received: the percentage of per capita income
within each state devoted to public schools, and the proportion of
total state and local expenditures devoted to education. Finally,
we looked at the level of federal assistance to each state.
a. Per Pupil Expenditure
In 1984 the average state spent $3,229 per pupil to purchase
educational services. This amount varied widely, as the standard
deviation of $1,039 suggests. At the high end, Alaska spent $8,625
per child. At the opposite extreme, Utah spent less than one-
quarter as much ($2,053). As reported in Table 7-3 and depicted on
Figure 7-3, three of our six states (PA, WI and IL) spent at or
above the national average. The highest, Pennsylvania, ranked 11th
among the states with $3,648. The other three states fell below
the national average. Arizona, at the bottom of our sample, ranked
35th in the nation with $2,751.
Page VII -10
312
INSERT TABLE 7-3
INSERT FIGURE 7-3
b. Expenditure as a Percent of Per Capita Income
We found little relationship between per pupil expenditures and
the relative wealth of each state's population. The richest states
in our sample, California and Illinois, both spent 1.40.11 below the
national average of 25.9 % of per capita incobe on education. But
Illinois was spending slightly above the $3,229 national average
per pupil, while Californians devoted such a small percentage of
their great wealth to schooling that they fell to 28th place in
average expenditure per pupil. The poorest of our sample states,
West Virginia, matched Pennsylvania for the highest financiftl
effort at 29.6% of per capita income, but this effort which enables
Pennsylvania to reach Ilth place in per pupil expenditure only
brought West Virginia up to 32nd.
c. Education's Share of Total State and Local Expenditures
Another way to look at the relative commitment to education in
our sample states is to assess the proportion of total expenditures
by state and local government devoted to the schools. The 1985
edition of the Condition of Education presents a convenient summary
of each state's education expenditures indexed to the national
Page VII-11
3 23
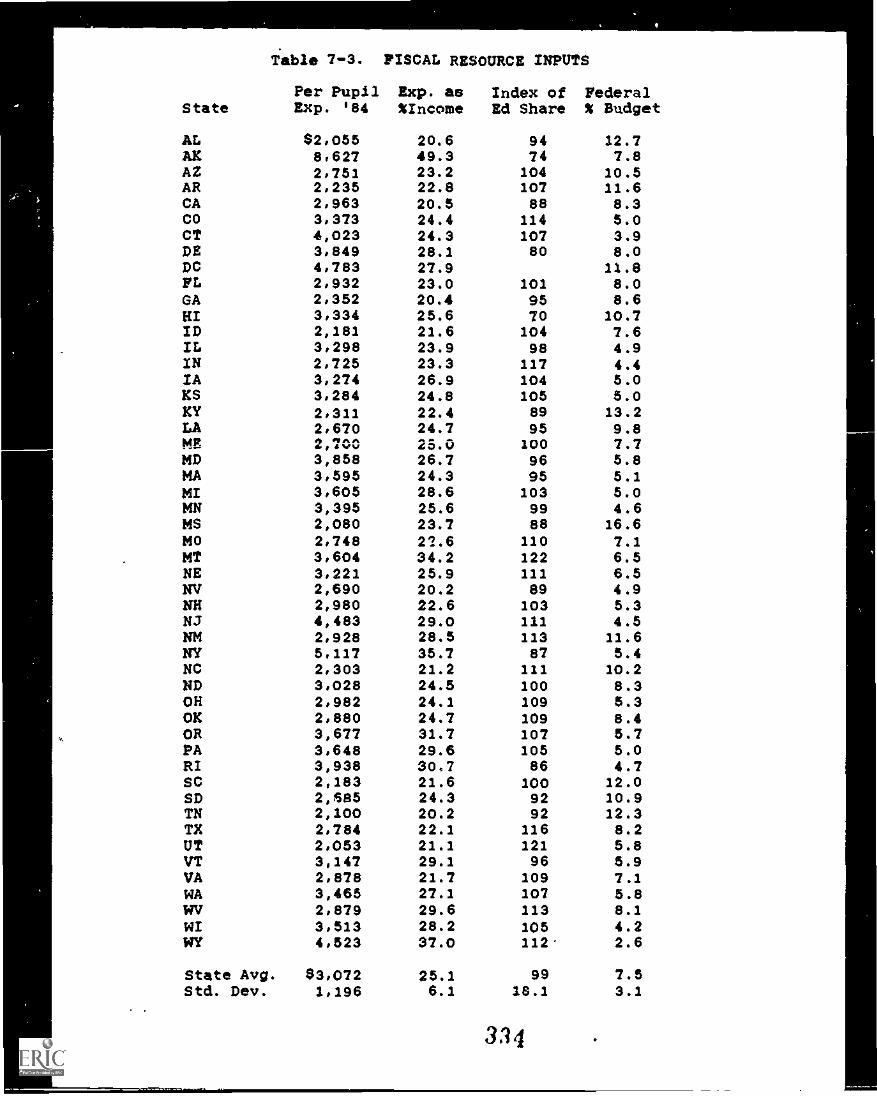
Tabl 7-3.
Per Pupil
FISCAL RESOURCE INPUTS
Exp. as Index of FederalState Exp. 184 %Income Ed Share % Budget
AL $2,055 20.6 94 12.7AK 8,627 49.3 74 7.8AZ 2,751 23.2 104 10.5AR 2,235 22.8 107 11.6CA 2,963 20.5 88 8.3CO 3,373 24.4 114 5.0CT 4,023 24.3 107 3.9DE 3,849 28.1 80 8.0DC 4,783 27.9 11.8FL 2,932 23.0 101 8.0GA 2,352 20.4 95 8.6MI 3,334 25.6 70 10.7ID 2,181 21.6 104 7.6IL 3,298 23.9 98 4.9XN 2,725 23.3 117 4.4IA 3,274 26.9 104 5.0KS 3,284 24.8 105 5.0KY 2,311 22.4 89 13.2LA 2,670 24.7 95 9.8MP ,,,,svv0000 25.0 100 7.7MD 3,858 26.7 96 5.8MA 3,595 24.3 95 5.1MI 3,605 28.6 103 5.0MN 3,395 25.6 99 4.6MS 2,080 23.7 88 16.6MO 2,748 22.6 110 7.1MT 3,604 34.2 122 6.5NE 3,221 25.9 111 6.5NV 2,690 20.2 89 4.9NE 2,980 22.6 103 5.3NJ 4,483 29.0 111 4.5NM 2,928 28.5 113 11.6NY 5,117 35.7 87 5.4NC 2,303 21.2 111 10.2ND 3,028 24.5 100 8.3OH 2,982 24.1 109 5.3OK 2,880 24.7 109 8.4OR 3,677 31.7 107 5.7PA 3,648 29.6 105 5.0RI 3,938 30.7 86 4.7SC 2,183 21.6 100 12.0SD 2,5a5 24.3 92 10.9TN 2,100 20.2 92 12.3TX 2,784 22.1 116 8.2UT 2,053 21.1 121 5.8VT 3,147 29.1 96 5.9VA 2,878 21.7 109 7.1WA 3,465 27.1 107 5.8WV 2,879 29.6 113 8.1WI 3,513 28.2 105 4.2WY 4,523 37.0 112 2.6
State Avg. 83,072 25.1 99 7.5Std. Dev. 1,196 6.1 18.1 3.1
334
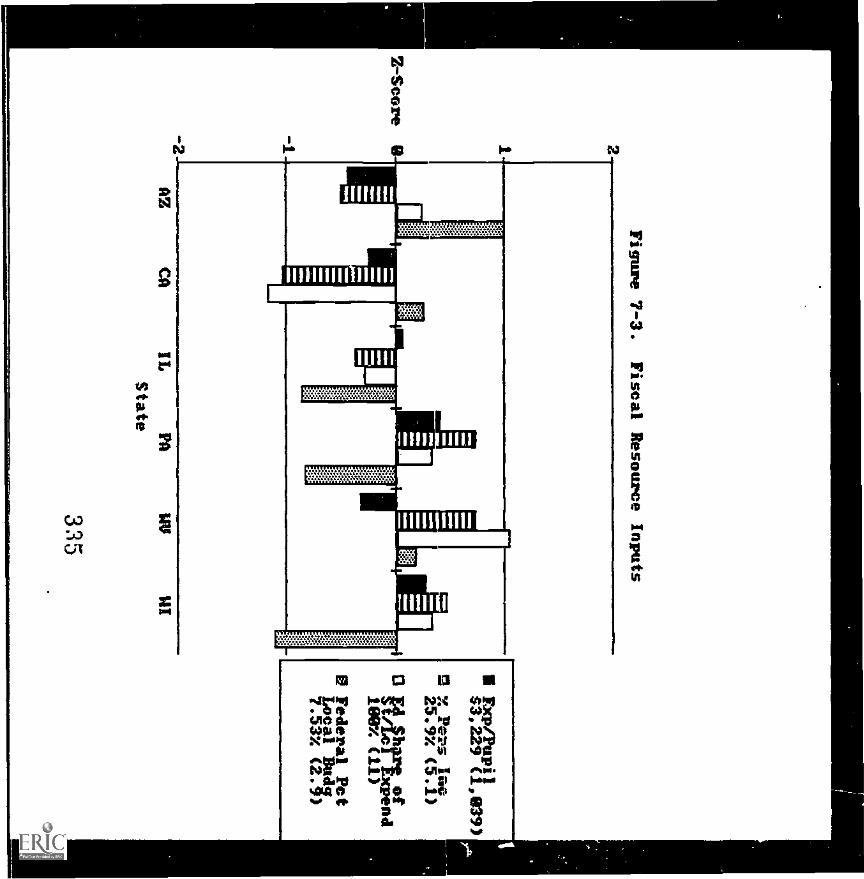
CA)
2
11111111
1111111111 111111
111111
1 men4.
NOMMS
11111111
average. On average, states devote percent of all state and
local expenditures to education. The highest commitment to
education was made by Montana which gives % to education, 22%
more than the national average. The lowest rate is found in Alaska
whose commitment to education is only 74% of the national average.
Among our sample states, California devotes the least of its public
wealth to education. At 88% of the national average, California
was tied with Mississippi, and ranked behind all but five other
states (HI, AK, DE, RI and NY). Overall, this index of effort
is quite closely related to wealth in each state. The richer the
state, the smaller proportion of its public expenditures devoted to
education. Conversely, poor states with low total expenditures
devote a larger proportion of that spending to education.
d. Federal Spending as Percent of Local Budgets
The sample states are evenly divided as to whether they are
receiving more or less than the national average of 7.53% of their
education dollars from the federal government (1984 figures). The
division of federal dollars is not very clowaly related to overall
state wealth, however. The poorest of our states, West Virginia,
receives the third highest proportion of federal dollars (8.1%).
The wealthiest state, California, receives an even larger 8.3% of
its education budget from federal sources.
The highest proportion of federal support in cll.,: sample goes to
Arizona (10.5%), the lowest to Wisconsin (4.2%). Wisconsin's share
is the second smallest in the nation (only Wyoming at 2.6% gets
Page VII -12
316 .
less). Ten states get a larger proportion of federal support than
Arizona.
In sum, state investment In education varies greatly. Poorer
states devote a larger proportion of their spending to education
than wealthy ones, but total public spending is not very closely
related to per capita income. Federal support for education is not
very closely related either to the states' overall wealth or their
willingness to spend a larger proportion of that wealth on
education.
Indicators of Children's Educational Needs
Two clusters of variables indicating the level of need for
educational services within the states were examined. The first
group, described inIthis section, consists of four measures of
children's educational needs. The second group, discussed below,
identify characteristics of the adult population associated with
educational need. Ihe child need variables are shown on Table 7-4;
sample state deviation scores are graphed in Figure 7-4.
Insert Table 7-4 about here.
Ilisert Figure 7-4 about here.
a. Poverty Among 5-17 Year-olds.
In 1980, an average of 15.3% of the children in each state were
living below the poverty line. In keeping with its generally low
Page VII-13
337
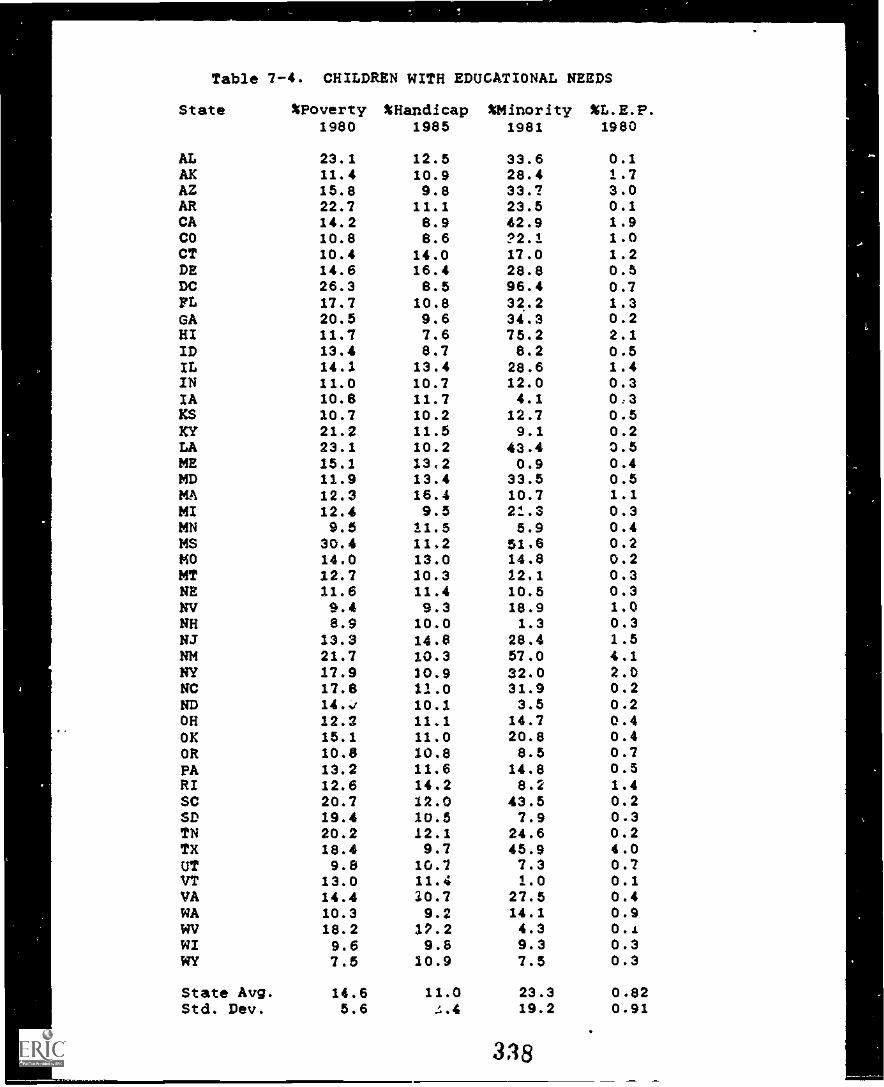
Table 7-4. CHILDREN WITH EDUCATIONAL NEEDS
State %Poverty %Handicap %Minority %L.E.P.1980 1985 1981 1980
AL 23.1 12.5 33.6 0.1AK 11.4 10.9 28.4 1.7AZ 15.8 9.8 33.7 3.0AR 22.7 11.1 23.5 0.1CA 14.2 8.9 42.9 1.9CO 10.8 8.6 1,2.1 1.0CT 10.4 14.0 17.0 1.2DE 14.6 16.4 28.8 0.5DC 26.3 8.5 96.4 0.7FL 17.7 10.8 32.2 1.3GA 20.5 9.6 34.3 0.2HI 11.7 7.6 75.2 2.1ID 13.4 8.7 8.2 0.5IL 14.1 13.4 28.6 1.4IN 11.0 10.7 12.0 0.3IA 10.8 11.7 4.1 0 3KS 10.7 10.2 12.7 0.5KY 21.2 11.5 9.1 0.2LA 23.1 10.2 43.4 0.5ME 15.1 13,2 0.9 0.4MD 11.9 13.4 33.5 0.5MA 12.3 16.4 10.7 1.1MI 12.4 9.5 21.3 0.3MN 9.5 11.5 5.9 0.4MS 30.4 11.2 51,6 0.2MO 14.0 13.0 14.8 0.2MT 12.7 10.3 /2,1 0.3NE 11.6 11.4 10.5 0.3NV 9.4 9.3 18.9 1.0NH 8.9 10.0 1.3 0.3NJ 13.3 14.8 28.4 1.5NM 21.7 10.3 57.0 4.1NY 17.9 20.9 32.0 2.0NC 17.8 11.0 31.9 0.2ND 14.4 10.1 3.5 0.2OH 12.2 11.1 14.7 0.4OK 15.1 11.0 20.8 0.4OR 10.8 10.8 8.5 0.7PA 13.2 11.6 14.8 0.5RI 12.6 14.2 8.2 1.4SC 20.7 12.0 43.5 0.2SD 19.4 10.5 7.9 0.3TN 20.2 12.1 24.6 0.2TX 18.4 9.7 45.9 4.0UT 9.8 10.7 7.3 0.7VT 13.0 11.4 1.0 0.1VA 14.4 10.7 27.5 0.4WA 10.3 9.2 14.1 0.9WV 18.2 1,.2 4.3 0.tWI 9.6 9.8 9.3 0.3WY 7.8 10.9 7.5 0.3
State Avg. 14.6 11.0 23.3 0.82Std. Dev. 5.6 4.4 19.2 0.91
338
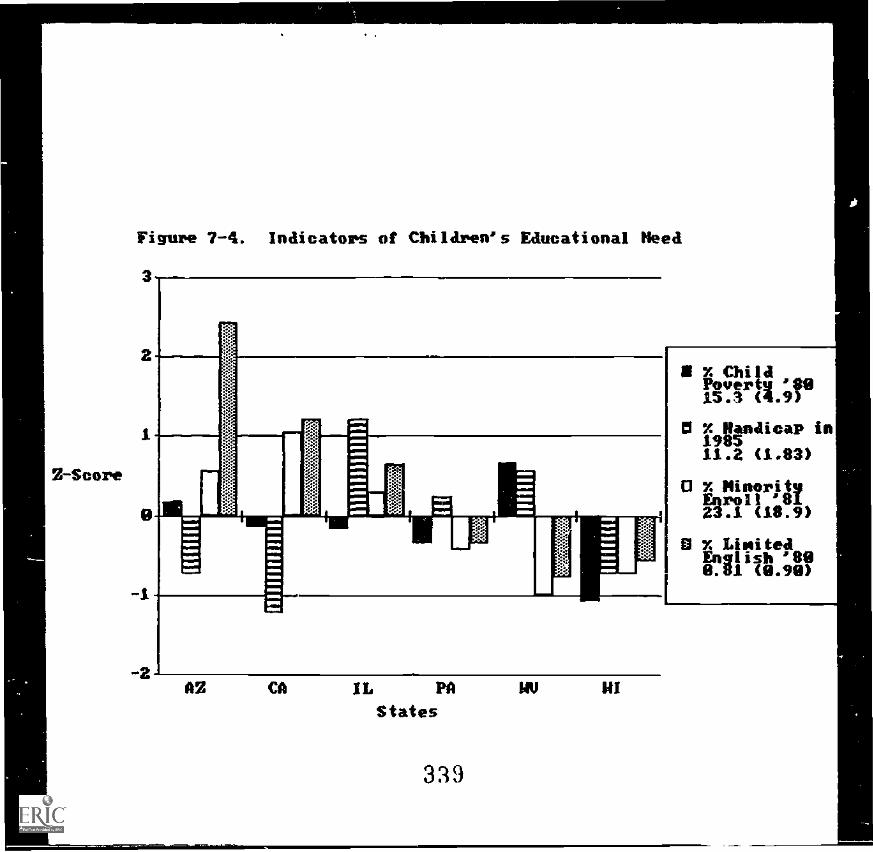
S-Score
Figure 7-4. Indicators of Children's Educational Heed
3
x Child
O X Handicap in198511.2 (1.83)
o x MinorityEnroll '11.1.23.1 (18.9)
x LimitedEnglish '898.81 (9.99)
AS Ch IL PA MU UIStates
339
income, West Virginia had the highest proportion of children in
poverty in our sample (at 18.2% WV ranked 13th). Wisconsin, not
wealthiest California, had the fewest poverty stricken children.
At 9.6%, Wisconsin had fewer poor children than all but four states
-- WY, NH, NV and MN. Of the remaining states in our sample, all
were below the national poverty rate except Arizona which at 15.8%
was just half a percentage point above the national average.
b. Children Identified as Handicapped
The Education Department's Wall Chart provides data on the
proportion of children in each state classified as handicapped. We
are uncertain about the usefulness of these numbers, however,
because the identification of handicapping conditions is frequently
encouraged (or discouraged) by special funding formulas. We
suspect that interstate comparison of such rates tells more about
handicapped program policies than about variations in children.
There are, nevertheless, substantial differences among our sample
states in the number of identified handicapped children being
served. California reports the lowest rate -- 8.9%, more than a
full standard deviation below the national average of 11.2%. Only
H/, CO and ID report lower rates. Illinois, by contrast, reports
that 13.4% of their school children are handicapped -- tied for
sixth place in the nation with MD. Of the remaining four states,
WV and PA report rates above the national average, while W/ and AZ
report very low rates.
c. Minority Enrollment
Page V/I -14
340
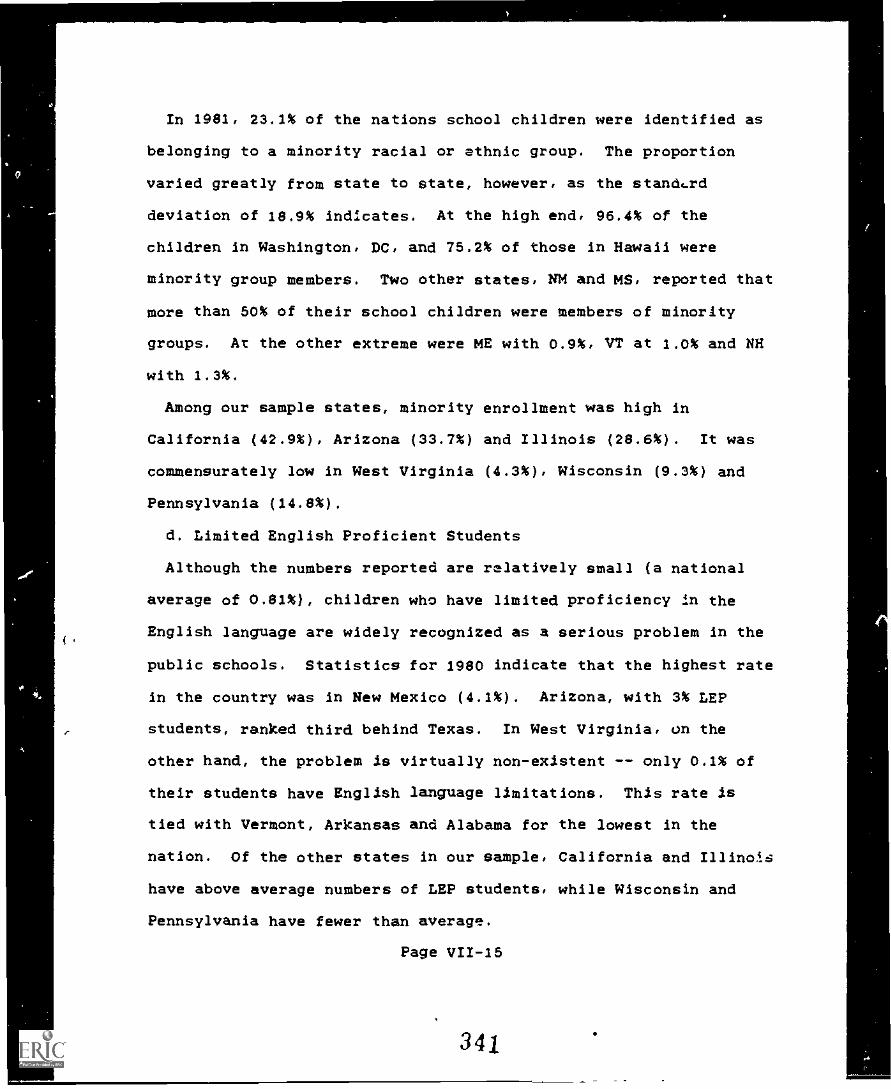
In 1981, 23.1% of the nations school children were identified as
belonging to a minority racial or ethnic group. The proportion
varied greatly from state to state, however, as the standrd
deviation of 18.9% indicates. At the high end, 96.4% of the
children in Washington, DC, and 75.2% of those in Hawaii were
minority group members. Two other states, NM and MS, reported that
more than 50% of their school children were members of minority
groups. At the other extreme were ME with 0.9%, VT at 1.0% and NH
with 1.3%.
Among our sample states, minority enrollment was high in
California (42.9%), Arizona (33.7%) and Illinois (28.6%). It was
commensurately low in West Virginia (4.3%), Wisconsin (9.3%) and
Pennsylvania (14.8%).
d. Limited English Proficient Students
Although the numbers reported are relatively small (a national
average of 0.81%), children who have limited proficiency in the
English language are widely recognized as a serious problem in the
public schools. Statistics for 1980 indicate that the highest rate
in the country was in New Mexico (4.1%). Arizona, with 3% LEP
students, ranked third behind Texas. In West Virginia, on the
other hand, the problem is virtually non-existent -- only 0.1% of
their students have English language limitations. This rate is
tied with Vermont, Arkansas and Alabama for the lowest in the
nation. Of the other states in our sample, California and Illinois
have above average numbers of LEP students, while Wisconsin and
Pennsylvania have fewer than average.
Page VII-15
341
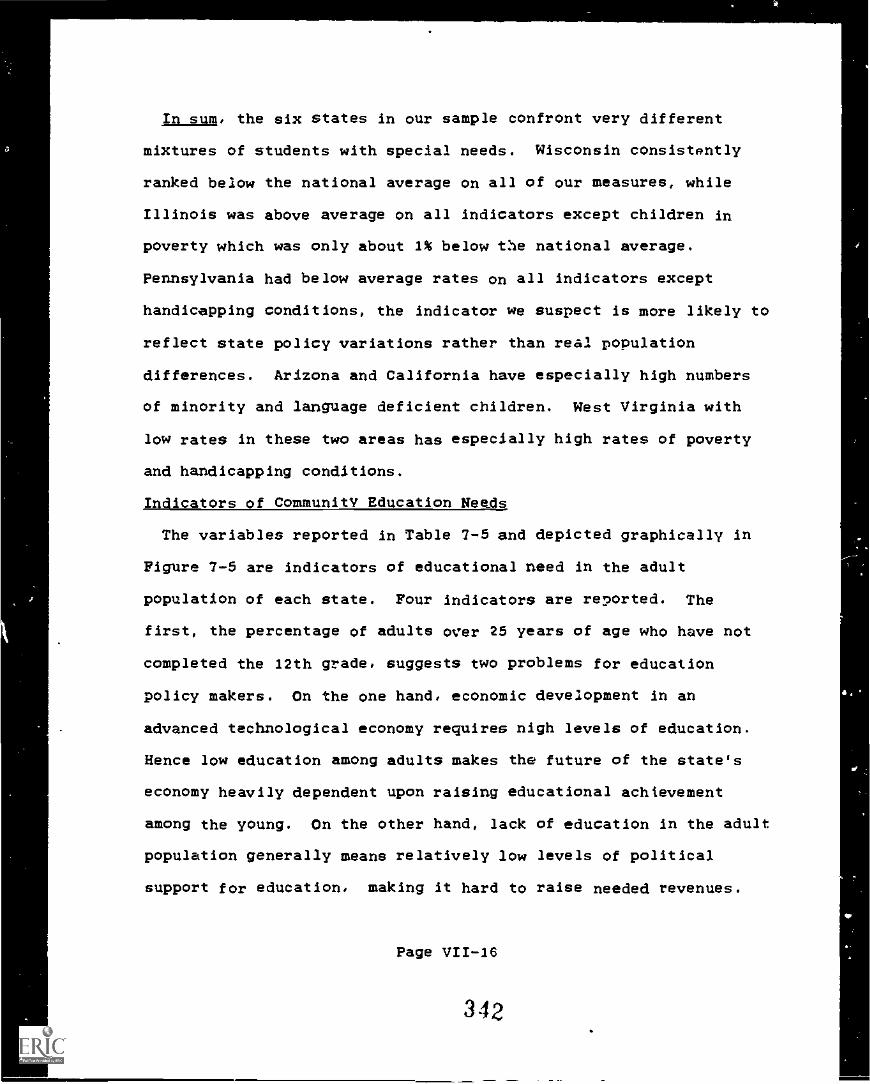
In sum, the six states in our sample confront very different
mixtures of students with special needs. Wisconsin consistently
ranked below the national average on all of our measures, while
Illinois was above average on all indicators except children in
poverty which was only about 1% below the national average.
Pennsylvania had below average rates on all indicators except
handicapping conditions, the indicator we suspect is more likely to
reflect state policy variations rather than real population
differences. Arizona and California have especially high numbers
of minority and language deficient children. West Virginia with
low rates in these two areas has especially high rates of poverty
and handicapping conditions.
Indicators of Community Education Needs
The variables reported in Table 7-5 and depicted graphically in
Figure 7-5 are indicators of educational need in the adult
population of each state. Four indicators are reported. The
first, the percentage of adults over 25 years of age who have not
completed the 12th grade, suggests two problems for education
policy makers. On the one hand, economic development in an
advanced technological economy requires nigh levels of education.
Hence low education among adults makes the future of the state's
economy heavily dependent upon raising educational achievement
among the young. On the other hand, lack of education in the adult
population generally means relatively low levels of political
support for education, making it hard to raise needed revenues.
Page VII-16
342
Insert Table 7-5 about here.
Insert Figure 7-5 about here.
The birth rate within each state, the second variable reported in
Table 7-5, is a good leading indicator of overall demand for
education in the future. Higher birth rates will require either
more tax dollars or lower per pupil expenditure.
Poverty rates among adults, like that among children, creates
special problems for the schools. This indicator is the third one
reported in Table 7-5.
Finally, the percentage of non-whltes in the population is a
useful measure of need for special programs to serve disadvantaged
groups.
a. Adults Not Completing High School
Despite more than half a century of commitment to universal
education through the 12th grade, nearly one third of all adults in
the United States have not completed high school. Moreover, this
large number is not primarily the result of poorly educated
immigrants entering the country. Not only le the overall
percentage of foreign born and recent immigrants much lower (4.3%,
see Table 7-8), but the rate of immigration is highest in states
that also manage to maintain relatively high rates of high school
graduation.
Page VII -17
343
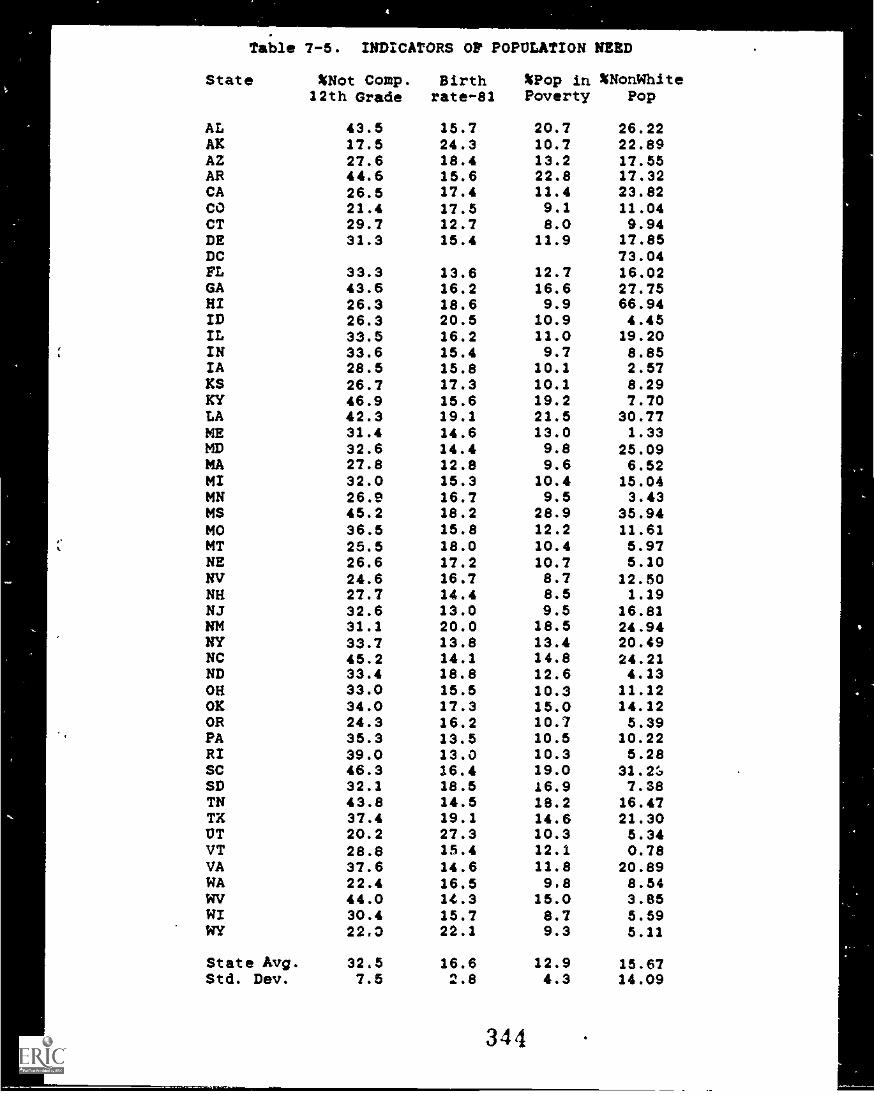
Table 7-5. INDICATORS OF POPULATION NEED
State %Not Comp. Birth %Pop In %NonWhIte12th Grade rate-81 Poverty Pop
AL 43.5 15.7 20.7 26.22AK 17.5 24.3 10.7 22.89AZ 27.6 18.4 13.2 17.55AR 44.6 15.6 22.8 17.32CA 26.5 17.4 11.4 23.82CO 21.4 17.5 9.1 11.04CT 29.7 12.7 8.0 9.94DE 31.3 15.4 11.9 17.85DC 73.04FL 33.3 13.6 12.7 16.02GA 43.6 16.2 16.6 27.75HI 26.3 18.6 9.9 66.94ID 26.3 20.5 10.9 4.45IL 33.5 16.2 11.0 19.20IN 33.6 15.4 9.7 8.85IA 28.5 15.8 10.1 2.57KS 26.7 17.3 10.1 8.29KY 46.9 15.6 19.2 7.70LA 42.3 19.1 21.5 30.77ME 31.4 14.6 13.0 1.33MD 32.6 14.4 9.8 25.09MA 27.8 12.8 9.6 6.52MI 32.0 15.3 10.4 15.04MN 26.9 16.7 9.5 3.43MS 45.2 18.2 28.9 35.94MO 36.5 15.8 12.2 11.61MT 25.5 18.0 10.4 5.97NE 26.6 17.2 10.7 5.10NV 24.6 16.7 8.7 12.50NH 27.7 14.4 8.5 1.19NJ 32.6 13.0 9.5 16.81NM 31.1 20.0 18.5 24.94NY 33.7 13.8 13.4 20.49NC 45.2 14.1 14.8 24.21ND 33.4 18.8 12.6 4.13OH 33.0 15.5 10.3 11.12OK 34.0 17.3 15.0 14.12OR 24.3 16.2 10.7 5.39PA 35.3 13.5 10.5 10.22RI 39.0 13.0 10.3 5.28SC 46.3 16.4 19.0 31.2SSD 32.1 18.5 16.9 7.38TN 43.8 14.5 18.2 16.47TX 37.4 19.1 14.6 21.30UT 20.2 27.3 10.3 5.34VT 28.8 15.4 12.1 0.78VA 37.6 14.6 11.8 20.89WA 22.4 16.5 9.8 8.54WV 44.0 14.3 15.0 3.85WI 30.4 15.7 8.7 5.59WY 22.3 22.1 9.3 5.11
State Avg. 32.5 16.6 12.9 15.67Std. Dev. 7.5 2.8 4.3 14.09
344
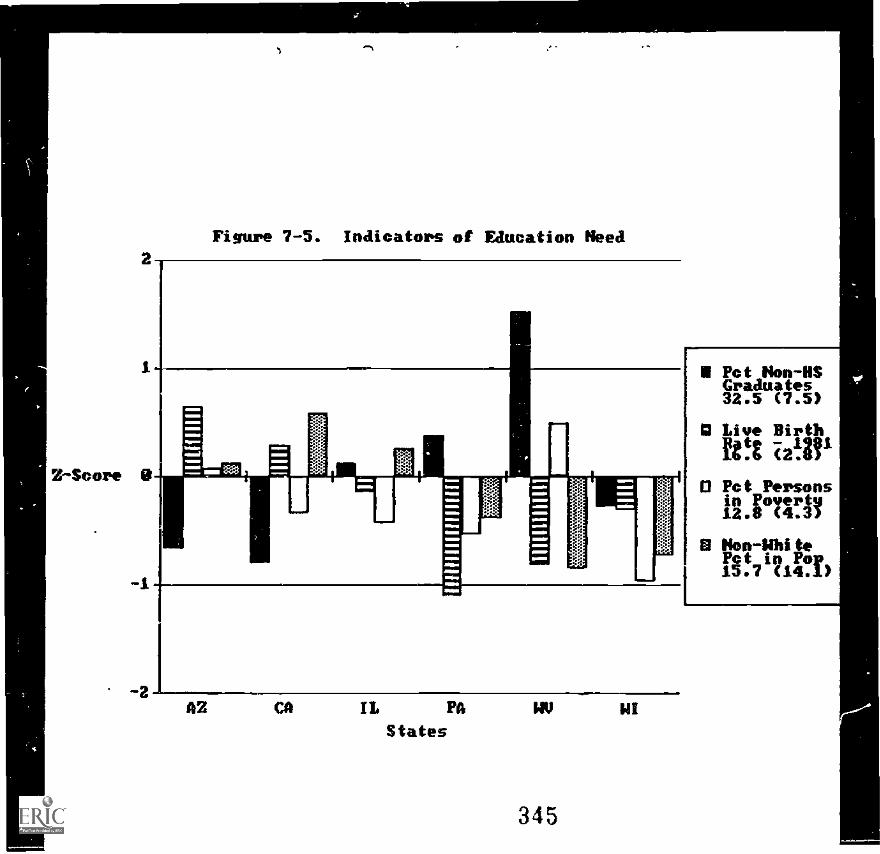
Z-Score
Figure 7-5. Indicators of Education Need
AZ CA IL PA
States
345
Pet Wm -OSGraduates32.5 (7.5)
Live Birth
fel i2!1!'
O Pet Personsin Poverty12.8 C4.3)
O Hon-WhitePet in Pop15.7 (14.1)
Our sample states are evenly divided above and below the 32.5
percent national average. West Virginia has the most citizens not
completing high school (44%, sixth highest rate in the nation).
Two other states. Pennsylvania and Illinois have rates above the
national average. Only.ten states have fewer adults without high
school diplomas than California whose 26.5 percent is the lowest
rate in our sample.
b. Live Births per 1,000
Although the national fertility rate is relatively low, birth
rates vary quite substantially among the states -- from a low of
12.7 per 1,000 In Connecticut to a high of 27.3 in Utah. This
means that some state school systems face a much heavier demand for
educational services than others. Indeed, a recent study by the
Connecticut Department of EducatIon indicates that this state does
not face the serious teacher shortage problems found in other
states (Forgione, 1985). Surprisingly, at 18.4 per 1,000. Arizona
had the highest birth rate in our sample. This puts Arizona among
the ten most prolific states, belying its image as a retirement
community and health resort.
Pennsylvania. Wisconsin and West Virginia are all well below the
national average. Pennsylvania's 13.5 rate is lower than all but
C. MA, RI and NJ.
c. Adult Poverty
The poverty rate among adults displays, as expected, the same
general profile as that for children. The overall rate averages
Page VII-18
346
12.8 percent, substantially lower than the 25.3 percent for
children, confirming that poverty Is concentrated In large
families.
d. Percentage of Minority Citizens
As with poverty, the number of minority citizens In each state
parallels, but falls several percentage points behind, the school
enrollment figures.
In sum, there Is a diverse array of educational needs among the
adult popula:.lons of our sample states. Wisconsin Is below the
national average In all four areas examined. Pennsylvania has a
small birth rate and fewer than average numbers of poor and
minority group members, but has more than an average number of non-
high school graduates. Arizona has just slightly above the average
rates of poverty and minority group membership, but deviates
substantially from other states In birth rate (which Is high) and
number of persons not finishing the 12th grade (which Is low).
West Virginia has substantial voblems with poverty and low
educational achievement among adults. California does better than
average In these two areas, but has relatively high birth rates and
minority group membership.
Measures of State Fiscal Capacity
There are a number of possible ways to assess the relative
ability of the states to provide fiscal resources to support the
schools. As shown In Table 7-6 and Figure 7-6, we reviewed three
indicators. The first, 1984 per capita incomes measures individual
wealth -- presumably a good indicator of the capacity of citizens
Page VII-19
347
to provide for the schools. The second indicator, budget surplus
(or deficit) at the end of 1984, reveals whether the states have an
immediate cash problem in providing resources for various public
purposes. The third measure is a composite Representative Tax
System index. Prepared by the Advisorlf Commission on
Intergovernmental Relations, this index was, "designed to answer
the question, 'What would be the total revenue potential of the 50
states if every state applied identical tax rates -- national
averages -- to each of 26 commonly used tax bases?'" (Michie and
Moore, 1985, p. 4).
Insert Table 7-6 about here.
Insert Figure 7-6 about here.
a. Per Capita Income in 1984
Three of our states have above average per capita incomes. As
noted earlier, California is the richest state in the sample with a
per capita income of $14,487 -- higher than all other states except
AK, DC, CT, NJ and MA. West Virginia is the poorest state with
69,258 in per capita income 7- lower than all other states but MS.
b. Budget Surplus/Deficit in 1984
Wisconsin had the most trouble with financing public services in
1984, ending the year with a 6.89 percent budget deficit (one of
only three states to end the year in the red). Cf the other states
Page VII-20
348
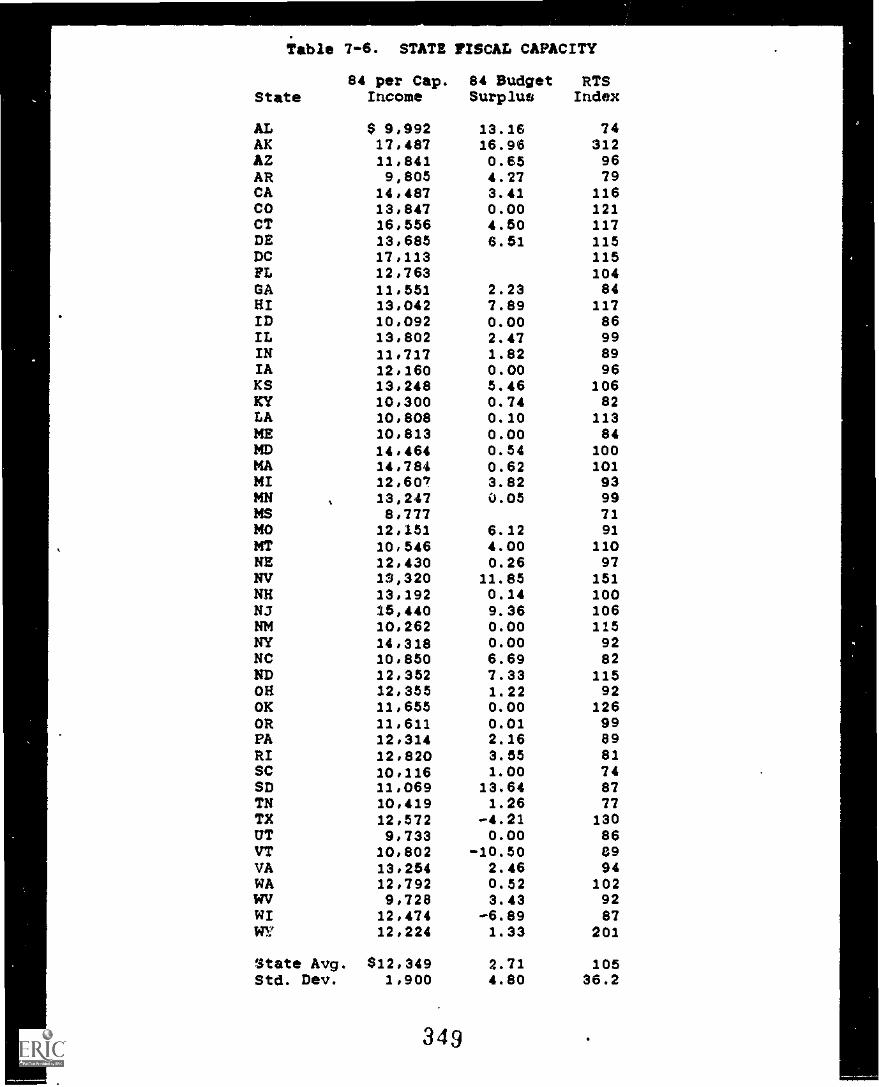
Table 7-6. STATE FISCAL CAPACITY
84 per Cap. 64 Budget RTSState Income Surplus Index
AL $ 9,992 13.16 74AK 17,487 16.96 312AZ 11,841 0.65 96AR 9,805 4.27 79CA 14,487 3.41 116CO 13,847 0.00 121CT 16,556 4.50 117DE 13,685 6.51 115DC 17,113 115PL 12,763 104GA 11,551 2.23 84HI 13,042 7.89 117ID 10,092 0.00 86IL 13,802 2.47 99IN 11,717 1.82 89IA 12,160 0.00 96KS 13,248 5.46 106KY 10,300 0.74 82LA 10,808 0.10 113ME 10,813 0.00 84MD 14,464 0.54 100MA 14,784 0.62 101MI 12,607 3.62 93MN 13,247 0.05 99MS 8,777 71MO 12,151 6.12 91MT 10,546 4.00 110NE 12,430 0.26 97NV 13,320 11.85 161NH 13,192 0.14 100NJ 15,440 9.36 106NM 10,262 0.00 115NY 14,318 0.00 92NC 10,850 6.69 82ND 12,352 7.33 115OH 12,355 1.22 92OK 11,655 0.00 126OR 11,611 0.01 99PA 12,314 2.16 89RI 12,820 3.55 81SC 10,116 1.00 74SD 11,069 13.64 87TN 10,419 1.26 77TX 12,572 -4.21 130UT 9,733 0.00 86VT 10,802 -10.50 89VA 13,254 2.46 94WA 12,792 0.52 102WV 9,728 3.43 92WI 12,474 -6.89 87WY 12,224 1.33 201
state Avg. $12,349 2.71 105Std. Dev. 1,900 4.80 36.2
349
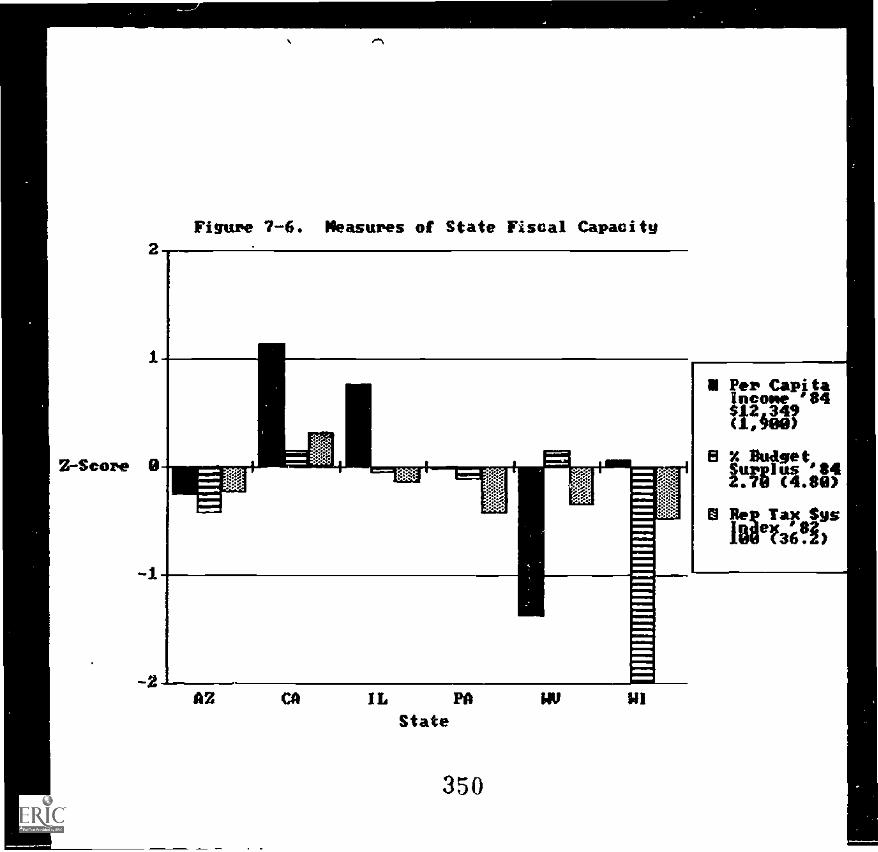
Z-Score
2
1
-1
-2
Figure 7-6. Measures of State Fiscal Capacity
Per CapitaIncome 84
WO?El X Budget
Militto°31
O Ree Tar Sys
Ildef369)
AZ CA IL PA
State
350
In the sample, California and West Virginia had above average
ending balances (3.41% and 3.43% respectively). Arizona squeaked
through with a 0.65 percent ending balance, while Illinois and
Pennsylvania had more comfortable year-end totals (2.47% and 2.16%
respectively).
c. Representative Tax System Index Values
Among the sample states, only California would produce more than
an average tax yield by using average tax rates in all categories.
Arizona and Illinois would be close to the average, while
Pennsylvania, Wisconsin and West Virginia would have tax yields
about 10% below the average for all states.
In sum, measured by citizen Income our sample states are well
distributed across the national spectrum. This raw fiscal capacity
Is not evenly tapped for support of public services, however.
Wisconsin overspent its resources In 1964, while poverty stricken
West Virginia was able to end the year with an above average
balance. Moreover, if our sample states adopted the average tax
rates for all types of levies they would not raise revenue equally.
State Policies Defining School Programs
We turn next to four variables reflecting how state policies are
serving to define school programs. The first indicator, length of
school year, reflects a quantitative commitment to educational
service delivery while the second, required units for graduation,
assesses state commitment to qualitative control. A second
Indicator of qualitative control over school programs Is reflected
in whether students are required to pass examinations in order to
Page VII-21
351
graduate from high school -- 21 states have such required exams.
The final program variable is Wirt's (1980) school centralization
index which measures the relative Influence of state law over local
decisionmaking.
Insert Table 7-7 about here.
Insert Figure 7-7 about here.
a. Length of School Year
The average state had a 178.4 day school year. The longest
school year was in MD (185.7), the shortest in NE (172). Two of
our sample states have above average years -- Pennsylvania (179.6)
and Wisconsin (178.8). Arizona had :he shortest school year in our
sample (175 days), but California, Illinois and West Virginia also
had short years.
b. Units Required for Graduation
California and Wisconsin had very low statewide graduation
requirements -- the lowest of all the states that actually specify
the number of required units. Only the four states that leave all
graduation requirements in the hands of local school boards -- CO,
IA, MI and MN could be considered to have lower graduation
requirements The highest unit requirements in our sample were in
Pennsylvania which requires 21 units -- tied by TX and exceeded by
UT, LA, MO and OR.
Page VII -22
352
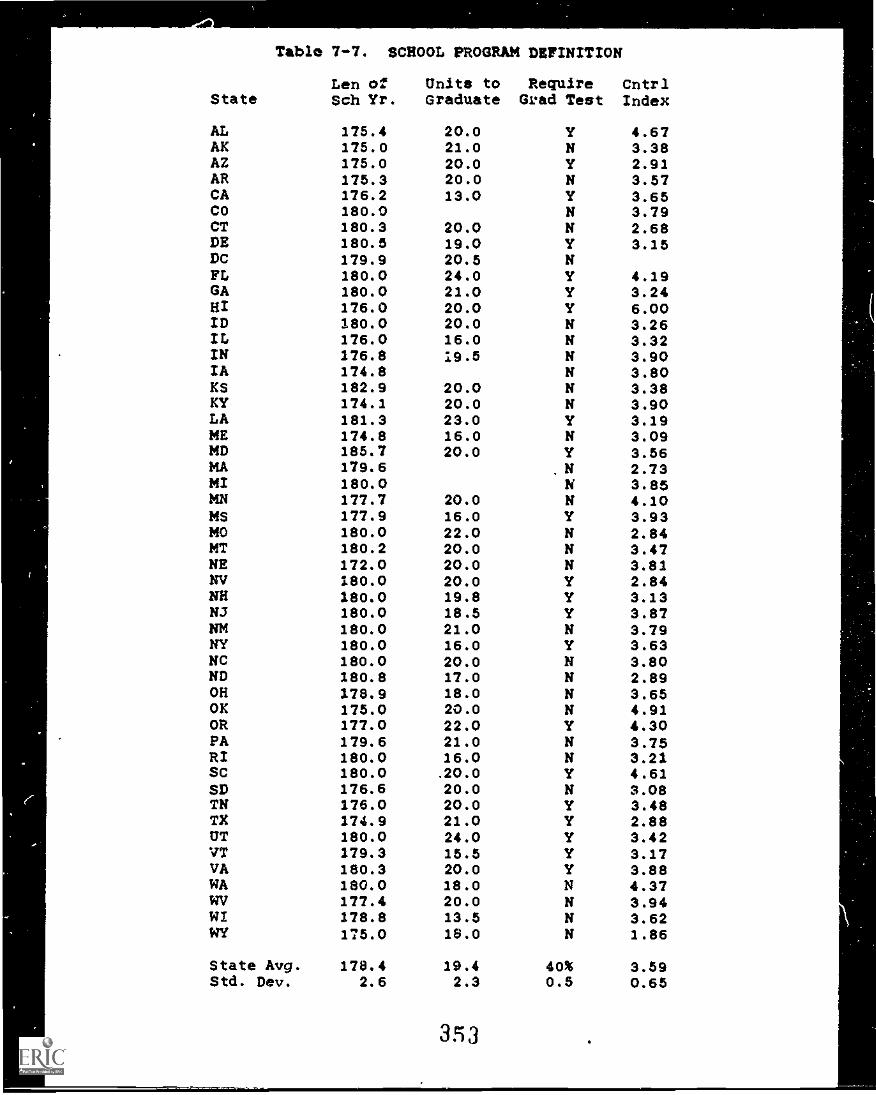
Table 7-7. SCHOOL PROGRIA DEFINITION
Len of Unite to Require CntrlState Sch Yr. Graduate Grad Test Index
AL 175.4 20.0 Y 4.67AK 175.0 21.0 N 3.38AZ 175.0 20.0 Y 2.91AR 175.3 20.0 N 3.57CA 176.2 13.0 Y 3.65CO 180.0 N 3.79CT 180.3 20.0 N 2.68DE 180.5 19.0 Y 3.15DC 179.9 20.5 NFL 180.0 24.0 Y 4.19GA 180.0 21.0 Y 3.24HI 176.0 20.0 Y 6.00ID 180.0 20.0 N 3.26IL 176.0 16.0 N 3.32IN 176.8 19.5 N 3.90IA 174.8 N 3.80KS 182.9 20.0 N 3.38KY 174.1 20.0 N 3.90LA 181.3 23.0 Y 3.19ME 174.8 16.0 N 3.09MD 185.7 20.0 Y 3.56MA 179.6 N 2.73MI 180.0 N 3.85MN 177.7 20.0 N 4.10MS 171.9 16.0 Y 3.93MO 180.0 22.0 N 2.84MT 180.2 20.0 N 3.47NE 172.0 20.0 N 3.81NV 180.0 20.0 Y 2.84NH 180.0 19.8 Y 3.13NJ 180.0 18.5 Y 3.87NM 180.0 21.0 N 3.79NY 180.0 16.0 Y 3.63NC 180.0 20.0 N 3.80ND 180.8 17.0 N 2.89OH 178.9 18.0 N 3.65OK 175.0 20.0 N 4.91OR 177.0 22.0 Y 4.30PA 179.6 21.0 N 3.75RI 180.0 16.0 N 3.21SC 180.0 .20.0 Y 4.61SD 176.6 20.0 N 3.08TN 176.0 20.0 Y 3.48TX 174.9 21.0 Y 2.88UT 180.0 24.0 Y 3.42VT 179.3 15.5 Y 3.17VA 180.3 20.0 Y 3.88WA 180.0 18.0 N 4.37WV 177.4 20.0 N 3.94WI 178.8 13.5 N 3.62WY 175.0 18.0 N 1.86
State Avg. 178.4 19.4 40% 3.59Std. Dev. 2.6 2.3 0.5 0.65
353
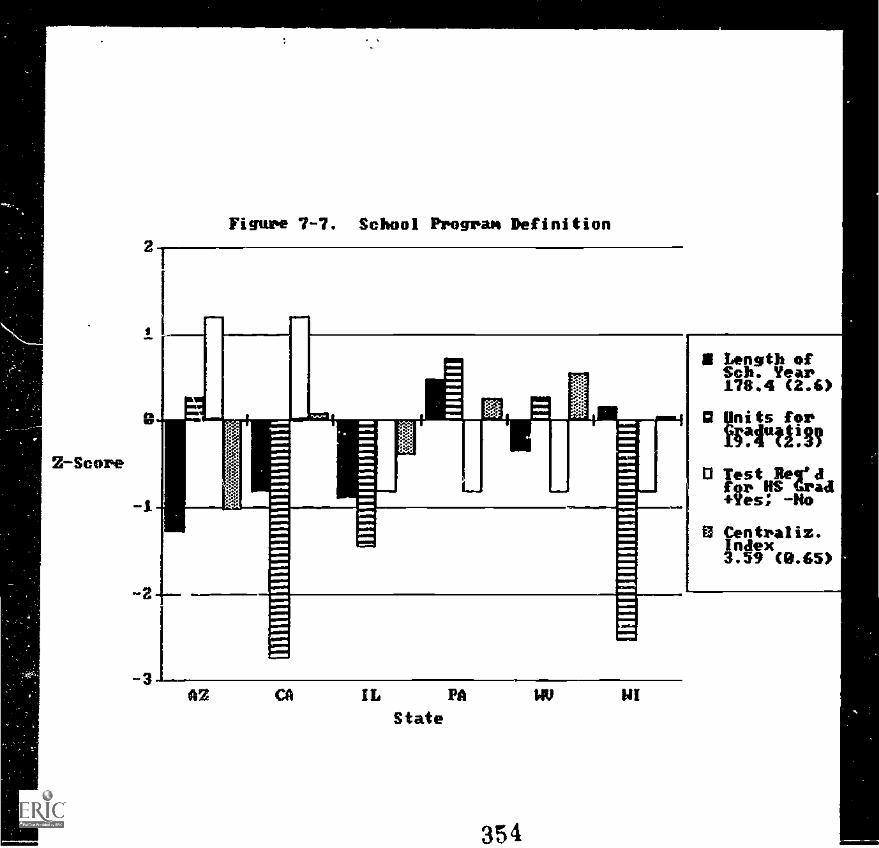
Figure 7-7. school progran Definition
Z-Scere
AZ CA IL PA
State
354
c. High School Graduation Test
Two of the 21 states requiring high school exit tests (AZ and CA)
are in our sample.
d. School Centralization Index
Two of the four states in our sample are below the national
average of 3.59 on Wirt's Centralization Index (AZ and IL).
Arizona, with an index value of 2.91 is the seventh most
decentralized state in the nation. West Virginia has the highest
centralization score in our sample. Its value of 3.94 places this
state ninth from the top of the list.
In sum, as with most other indicators, our sample states present
a very mixed picture of state involvement with school program
definition. Illinois has low scores on all four indicators, but it
is the only state with this pattern. Pennsylvania has high
indicators in all areas except a required high school exit
examination. Arizona has high exit requirements (both exam and
unit requirements) but has decentralized decision making and a
short school year. Wisconsin and California have especially low
state graduation requirements, leaving this issue largely up to
local school district discreticn.
State Social Demography
Table 7-8 and Figure 7-8 present data on the social demography of
the United States. Four social demographic variables are shown --
degree of urbanization, percent of foreign born and recent
immigrants in the population, projected population growth for the
Page VII -23
355
present decade, and the extent to which traditionalistic or
moralistic values are expressed in the political culture.
Insert Table 7-8 about here.
Insert Figure 7-8 about here.
a. Urbanization
By design our sample states were broadly spread across the
urbanization spectrum. California and Arizona are among the most
highly urbanized states in the country. With 91.3% of its citizens
living in cities, CalAfornia is the most urbanized state in the
nation. Arizona is tied for eighth place with Massachusetts, just
above tenth place Illinois. At the other end of the spectrum, West
Virginia with 36.2% of its population in urban centers ranks just
above last place Vermont. Pennsylvania and Wisconsin are close to
the national average with percentages in the mid-60s.
b. Foreign Born and Recent Immigrants
Based on 1980 census figures, California with a rapid growth in
hispanic and asian immigration, had the highest proportion of
foreign born and recent immigrant citizeris in the nation. At 15.1%
this state has more than 3-1/2 t.tmes the national average. In West
Virginia, on the other hand, only 1.1% of the population is foreign
born. The other four states in our sample range between these two
extremes. Wisconsin is below the national average with only 2.7
Page VII-24
3 5 6
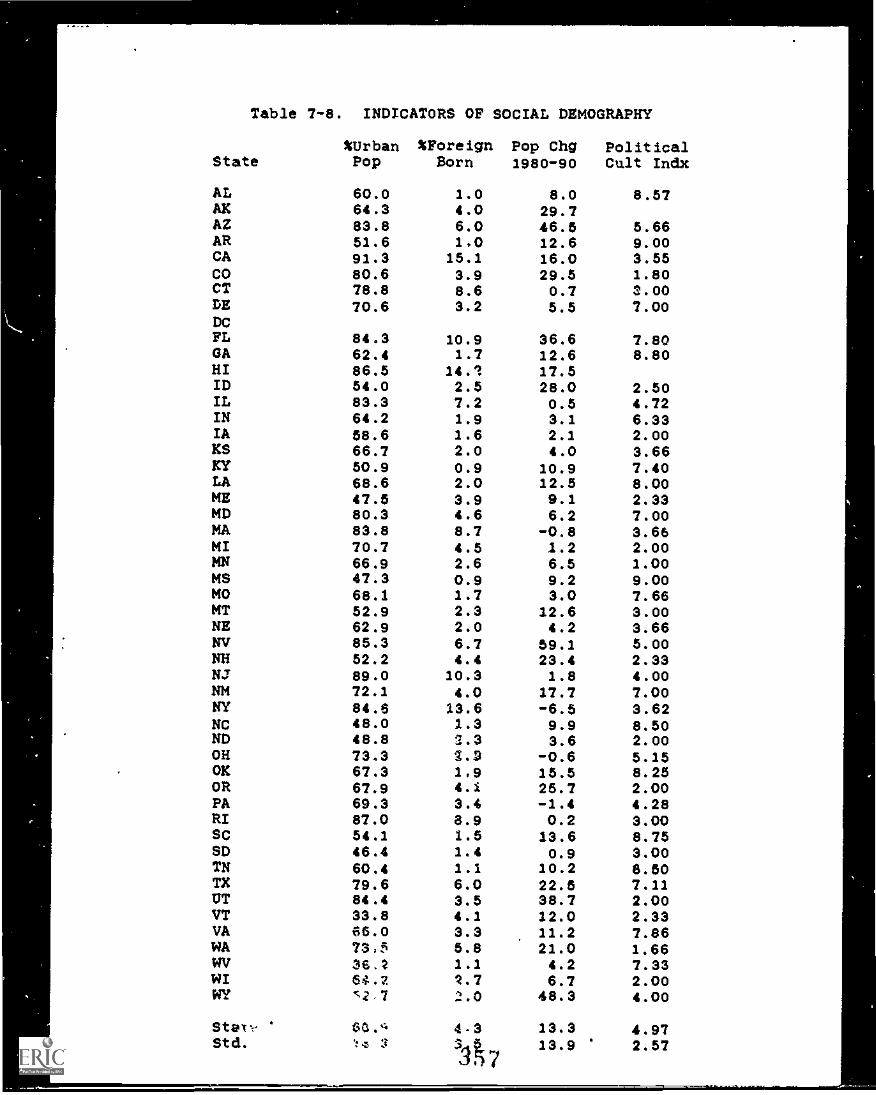
Table 7-8. INDICATORS OF SOCIAL DEMOGRAPHY
%UrbanState Pop
AL 60.0AK 64.3AZ 83.8AR 51.6CA 91.3CO 80.6CT 78.8DE 70.6DCFL 84.3GA 62.4HI 86.5ID 54.0IL 83.3IN 64.2IA 58.6KS 66.7KY 50.9LA 68.6ME 47.5MD 80.3MA 83.8MI 70.7MN 66.9MS 47.3MO 68.1MT 52.9NE 62.9NV 85.3NH 52.2NJ 89.0NM 72.1NY 84.6NC 48.0ND 48.8OH 73.3OK 67.3OR 67.9PA 69.3RI 87.0SC 54.1SD 46.4TN 60.4TX 79.6UT 84.4VT 33.8VA 66.0WA 73,5WV 36.2WI 64.2WY 2 7
Starr.Std.
%ForeIgn Pop Chg PolltIcalBorn 1980-90 Cult Indx
1.0 8.0 8.574.0 29.76.0 46.5 5.661,0 12.6 9.0015.1 16.0 3.553.9 29.5 1.808.6 0.7 3.003.2 5.5 7.00
10.9 36.6 7.801.7 12.6 8.80
14.1 17.52.5 28.0 2.507.2 0.5 4.721.9 3.1 6.331.6 2.1 2.002.0 4.0 3.660.9 10.9 7.402.0 12.5 8.003.9 9.1 2.334.6 6.2 7.008.7 -0.8 3.664.5 1.2 2.002.6 6.5 1.000.9 9.2 9.001.7 3.0 7.662.3 12.6 3.002.0 4.2 3.666.7 59.1 5.004.4 23.4 2.33
10.3 1.8 4.004.0 17.7 7.0013.6 -6.5 3.621.3 9.9 8.502.3 3.6 2.002.2 -0.6 5.151,9 15.5 8.254.1 25.7 2.003.4 -1.4 4.288.9 0.2 3.001.5 13.6 8.751.4 0.9 3.001.1 10.2 8.506.0 22.5 7.113.5 38.7 2.004.1 12.0 2.333.3 11.2 7.865.8 21.0 1.661.1 4.2 7.332.7 6.7 2.002.0 48.3 4.00
4 - 338
7
13.3 4.9713.9 2.57
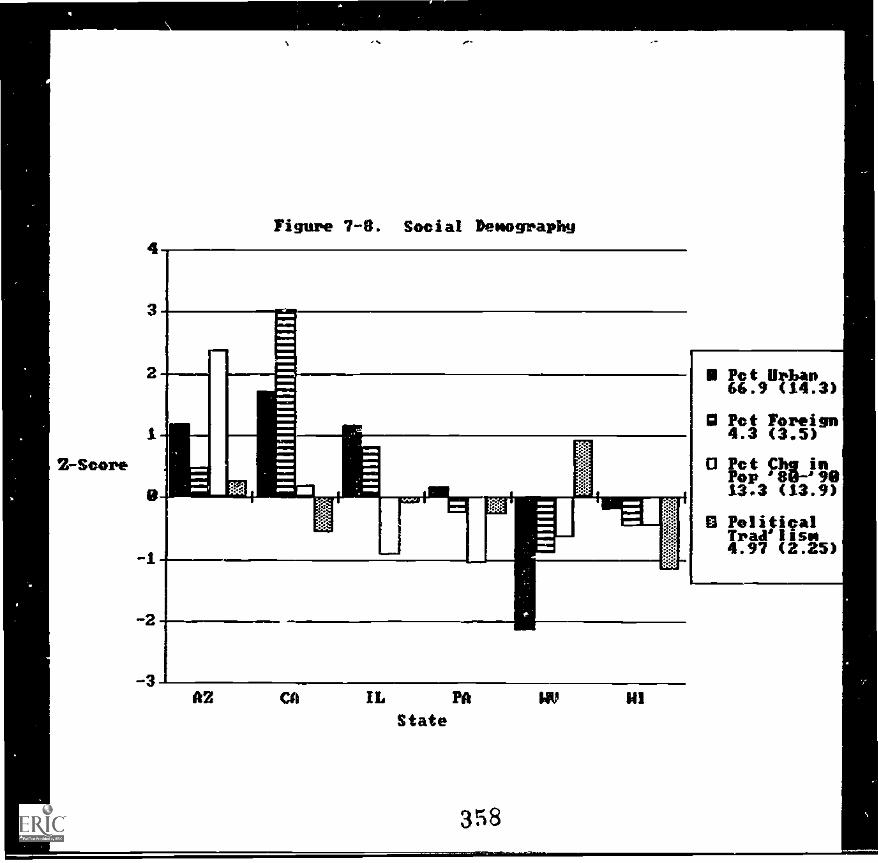
Figure 7-8. Social DenograpbY
Zr-Score
-3AZ CA IL PA 14P NI
State
358
Pot Urban66.9 (14.3)
10 Pot Foreign4.3 (3.5)
O Pet Cbg inPop '8U-'14113.3 (13.9)
O PoliticalTrall'Issm4.97 (2.25)
711.,
percent foreign born citizens, Pennsylvania is also below average
(3.4%), while Arizona and Illinois have hefty foreign born
population groups (6.0% and 7.2%, respectively).
c. orojected Population Change 1980-1990
While the nation as a whole is projected to grow about 13.3
percent over the decade of the 80s, this growth is expected to vary
dramatically from state to state. Arizona, facing a 45.5 percent
population growth, ranks third in the nation behind two very small
states -- Nevada and Wyoming. The only other rapid growth state in
our sample is California with a projected 16 percent increase.
Pennsylvania, with a neaative projected growth rate of -1.4
percent, is expected to 1ose population during this decade.
Illinois will :last about et:4w constant (+0.5%), while West Virginia
and Wisconzin will grow at ratea below the national average (4.2%
and 6.7%, respec:ively).
d. Traditional and Moralistic Polltical Cultures
Sharkansky (1978) modified Elazar's (1968) political culture
measure to create a lincar gcele Indicating the degree of
traditionalism in each etaWs political culture. Low scores
indicate strongly aoralletic culture values, mid-range scores
identify relatively individualistic states, and high scores are
associated with traditionalistic cultural values. Our own measures
preserve the Elazar tripartite scales (see discussion in Chapter
V), but it may be helpful to compare our sample states with the
rest of the nation using the Sharkansky scale.
Page VII -25
359
The greatest contrast in our sample states is between Wisconsin's
moralistic 2.00 and West Virginia's traditionalistic 7.33.
Wisconsin is tled with five other states, and ranks just above MN,
WA and CO as among the most moralistic states in the Union.
Thirteen states, Including top scoring AR and MS (both with 9.00),
have higher traditionalism scores than West Virginia.
The other four states in our sample tend toward the
individualistic center. California has overtones of moralism while
Arizona tends to favor traditionalism.
In sum, our sample states have very diverse demographic
characteristics. Arizona faces extraordinarily rapid growth,
California has a large number of recent immigrants, West Virginia
is one of the least urbanized states. Pennsylvania is facing an
actual decline in population during the 1980s. Wisconsin, with a
strongly moralistic political culture, and a low level of
environmental press from urbanization, immigration and population
presents the most likely environment for successful educational
program innovation. West Virginia's traditionalistic values, rural
population distribution and low rates of change ln immigration and
population growth make it likely that this state will have a hard
time mustering political support for substantial school reform.
DemograPhic Characteristics of School Children
Four measures of the demographic characteristics of children in
the schools provide a framework for examining another set of
important differences among the state educational systems. First,
states with a younger population profile have a larger proportion
Page VII-26
380
of their total population in the 5-17 year old group. As a result,
they have a greater demand for school services and a smaller
population of taxpayers to pay for them. A second Indicator,
school enrollment changes in the last two years, reveals whether
the schools are facing upward demand pressure.
The other two variables reported in Table 7-9 and graphically
displayed for our sample states in Figure 7-9 describe the
distribution of specific schooling problems. The first is the
degree of racial Isolation in the schools -- measured as the
proportion of black students attending schools with 99-100 percent
minority enrollments. The second is a measure of the proportion of
the total student body transported to and from school at district
expense.
Insert Table 7-9 about here.
Insert Figure 7-9 about here.
a. School Age Population Index
At 19.3 percent of its total population, West Virginia's school
age population is substantially above the national average (17.1%),
giving this state an index soore of 113. Pennsylvanla's school age
population is 12 percent lower than typical, and fourth smallest in
the nation (behind RI, :I, and DC). Of the other states in our
sample, California, Illinois and Wisconsin have lower than average
Page V11-27
361
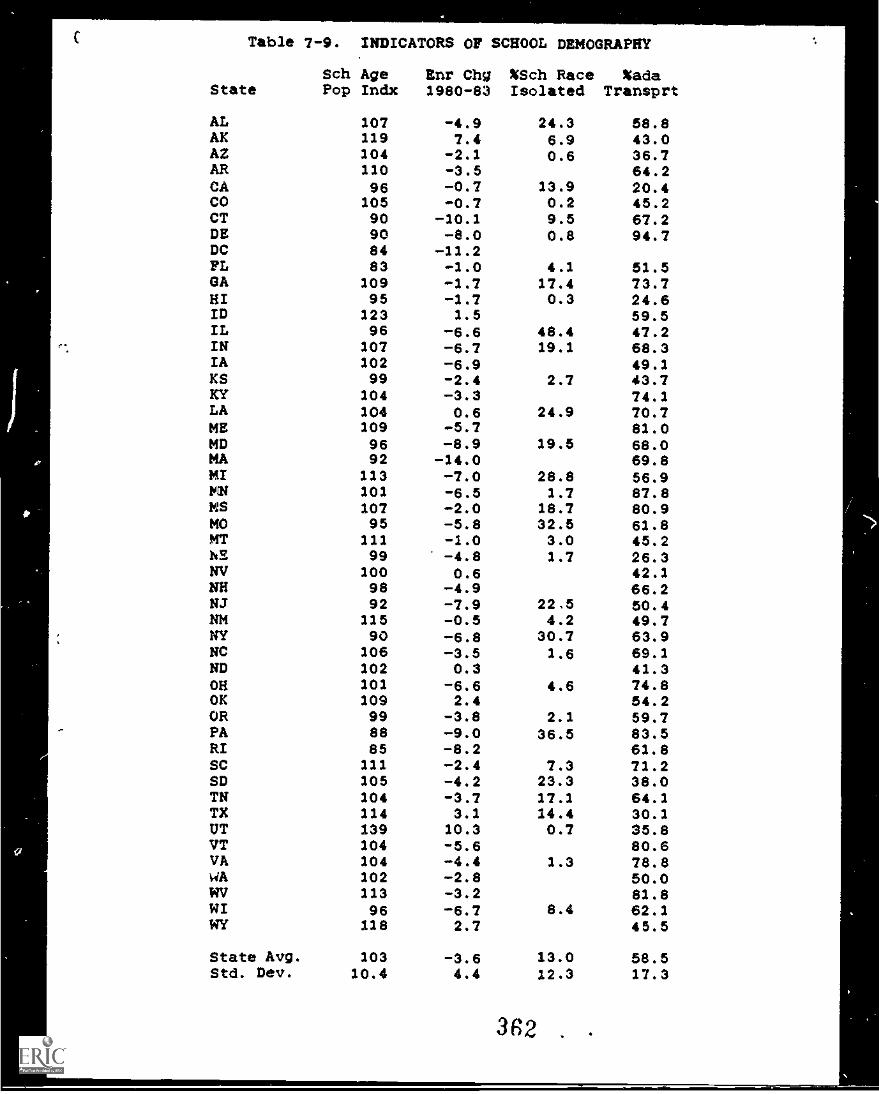
Table 7-9. INDICATORS OF SCHOOL DEMOGRAPHY
Sch Age Enr Chg NSch Race NadaState Pop Indx 1960-63 Isolated Transprt
AL 107 -4.9 24.3 58.8AK 119 7.4 6.9 43.0AZ 104 -2.1 0.6 36.7AR 110 -3.5 64.2CA 96 -0.7 13.9 20.4CO 105 -0.7 0.2 45.2CT 90 -10.1 9.5 67.2DE 90 -8.0 0.8 94.7DC 84 -11.2FL 63 -1.0 4.1 51.5GA 109 -1.7 17.4 73.7HI 95 -1.7 0.3 24.6ID 123 1.5 59.5IL 96 -6.6 46.4 47.2IN 107 -6.7 19.1 66.3IA 102 -6.9 49.1KS 99 -2.4 2.7 43.7KY 104 -3.3 74.1LA 104 0.6 24.9 70.7ME 109 -5.7 81.0MD 96 -6.9 19.5 66.0MA 92 -14.0 69.6MI 113 -7.0 26.6 56.9MN 101 -6.5 1.7 87.6MS 107 -2.0 16.7 80.9MO 95 -5.6 32.5 61.6MT 111 -1.0 3.0 45.2hE 99 -4.6 1.7 26.3NV 100 0.6 42.1NH 96 -4.9 66.2NJ 92 -7.9 22,5 60.4NM 115 -0.5 4.2 49.7NY 90 -6.6 30.7 63.9NC 106 -3.5 1.6 69.1ND 102 0.3 41.3OH 101 -6.6 4.6 74.6OK 109 2.4 54.2OR 99 -3.6 2.1 59.7PA 86 -9.0 36.5 83.5RI 85 -6.2 61.8SC 111 -2.4 7.3 71.2SD 105 -4.2 23.3 38.0TN 104 -3.7 17.1 64.1TX 114 3.1 14.4 30.1UT 139 10.3 0.7 35.8VT 104 -5.6 80.6VA 104 -4.4 1.3 78.8WA 102 -2.8 50.0WV 113 -3.2 81.8WI 96 -6.7 8.4 62.1WY 116 2.7 45.5
State Avg. 103 -3.6 13.0 58.5Std. Dev. 10.4 4.4 12.3 17.3
362 . .
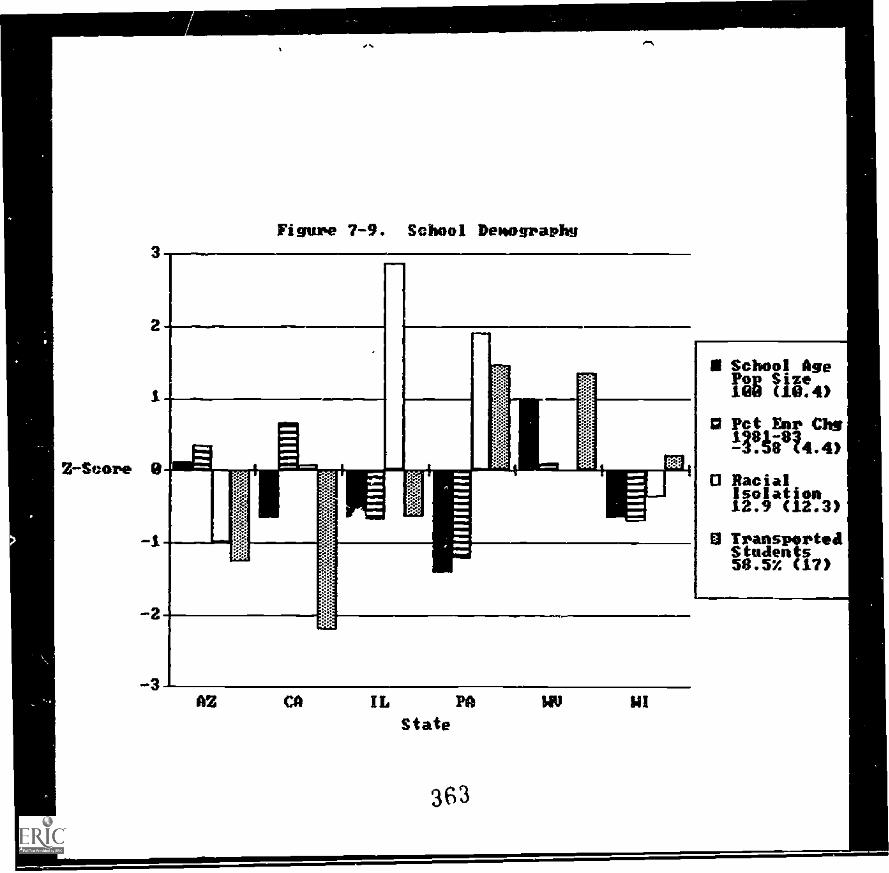
(LT) WI'S sluarns masasuieaci
(CiT) WZT uolvelosl Rion U
WY') WE- g8-186T 5113 Jul 404"
Wen MIT Z @Oa sV 100IPS
C9C
aVelS (NM Vid qI V3 ZU
mVP'
raideaSoosag Tomlin .6-L aan6f1
C-
Z-
T-
0400s-z
student population groups, Arizona just slightly above the national
average.
b. Enrollment Change 1981-83
On average, states lost 3.58 percent in school enrollments
between 1981 and 1983. As is typical of other social indicators,
however, the losses were far from evenly distributed. The largest
loss 11.2 percent occurred in the District of Columbia; Connecticut
was not far behind with a 10.1 percent loss. At the other end of
the spectrum, Utah had double digit growth (10.3%). None of the
states in our sample were among the nine states with increasing
enrollments. California had the smallest loss -- 0.7 percent.
Pennsylvania had the greatest loss -- 9.0 percent Arizona and West
Virginia, like California, lost fewer than the national average of
3.58 percent of their student population. Wisconsin and Illinois
joined Pennsylvania in having greater than average losses. Except
in California, the losses were greatest in those states which
already had lower than average school age populations (see above,
Table 7-9).
c. Racial Isolation
Illinois, with black students making up slightly more than 20
percent of its total student body, had the most racially isolated
schools in the country. In 1980, nearly half the black students in
this state attend schools with 99-100 percent minority enrollments.
With 36.5 percent of its black students in racially isolated
schools, Pennsylvania schools were also racially isolated. Though
they had very few black students (4.2%), Arizona had the best
Page VII-28
record for at least nominal integration of them; only 0.6 percent
of their blacks attended racially isolated schools. No data were
available for West Virginia, but they had such a small number of
black students (3.9%) that it would be difficult to isolate them
anyway.
d. Student Transportation
Nearly 60 percent of all students in the U.S. are transported to
and from school each day. Seven states, including Pennsylvania and
West Virginia, transport more than 80 percent of their students;
Delaware transports almost 95 percent of its student body.
California, the most urbanized state provides the least amount of
student transportation in the nation (20.4%). Arizona and Illinois
also transport fewer than the national average.
In sum, our states face very different student demographic
profiles. West Virginia has a young population with an unusually
high demand for education. Illinois has intense racial isolation.
Pennsylvania combines substantial racial isolation with intensive
student transportation and a low school age population. Arizona
and California provide little transportation. Pennsylvan:1,
Wiscorsin and Illinois suffered major declines in enrollment during
the early 1980s.
EnlAtical Power Distribution
Table 7-10 and Figure 7-10 report three measures of political
power within the states. The first measure created by Hanson
(1983) assesses the formal powers of the Governor in each state.
The second, created by Zeigler (1983) assess the relative strength
Page V/I-29
4
365
r
of special interest groups in each state (on a three point scale).
The meaning of the thArd political power variable, degree of
political party competition, Is a b1t more complex. As developed
by Bibby, et al. (1983), this variable assesses the strength of the
Democratic (or Republican) party during the 1974-80 period. A very
high score on this scale clearly means that political power rests
with the Democratic party and a low score means RepuLlican party
dominance. In the mid-ranges, however, lt is uncertain whether the
scores mean that political parties are relatively weak or highly
competitive. That 1s, party competition scores provide a
comparative estimate of party strength, but do not tell us whether
the overall party system 1s strong or weak.
Insert Table 7-10 about here.
Insert Figure 7-10 about here."
a. Governor's Formal Powers
With a score of 25 on this scale, Pennsylvania's governor ranks
with New Jersey and Utah as among the strongest in the country.
The weakest governor in our sample, Wisconsin, had a score of 16.
This tied with MO, NE, OH, and VA -- just above the six weakest
governorships (MS, TX, SC, NH, NC and NV). The other four states
in our sample range close to the J9 point average for all
governors. We should quickly note that the availability of
specific formal powers to the governors of our states does not mean
Page VII-30
366
-
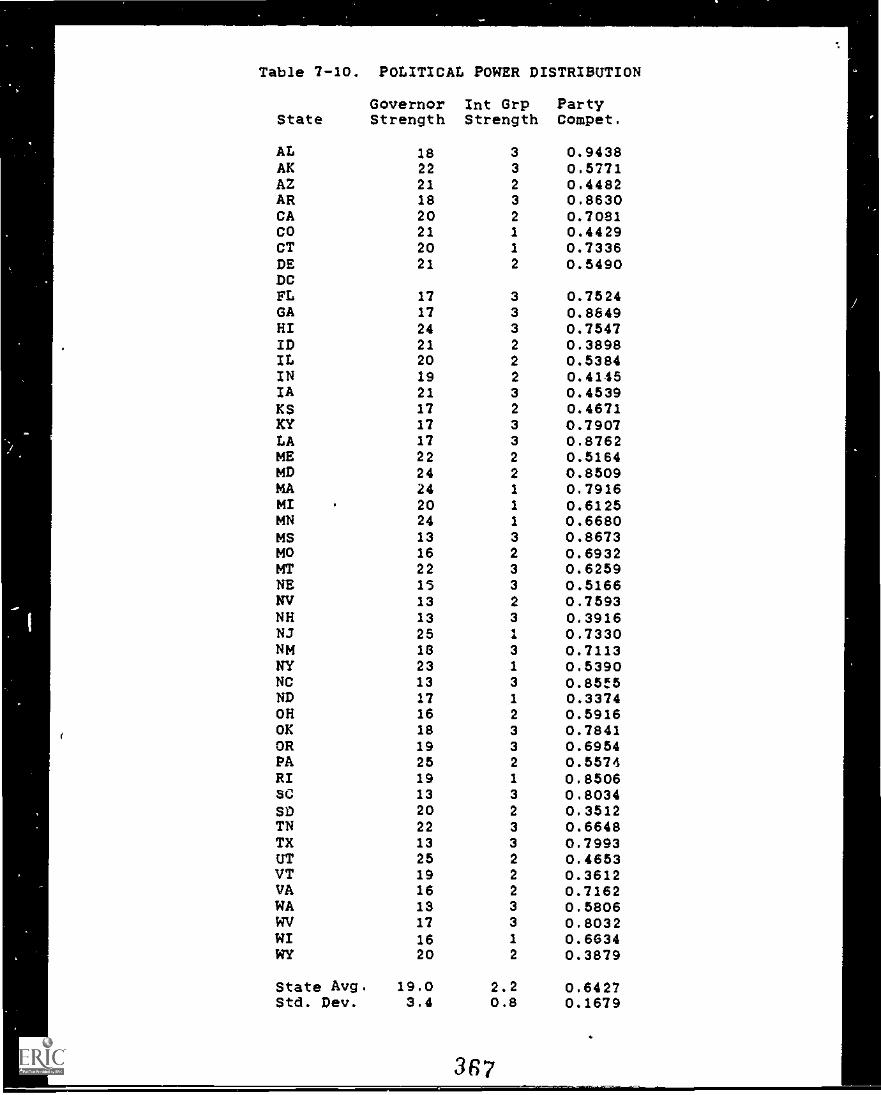
Table 7-10. POLITICAL POWER DISTRIBUTION
Governor Int Grp PartyState Strength Strength Compet.
AL 18 3 0.9438AK 22 3 0.5771AZ 21 2 0.4482AR 18 3 0.8630CA 20 2 0.7081CO 21 1 0.4429CT 20 1 0.7336DE 21 2 0.5490DCFL 17 3 0.7524GA 17 3 0.8849HI 24 3 0.7547ID 21 2 0.3898IL 20 2 0.5384IN 19 2 0.4145IA 21 3 0.4539KS 17 2 0.4671KY 17 3 0.7907LA 17 3 0.8762ME 22 2 0.5164MD 24 2 0.8509MA 24 1 0.7916MI 20 1 0.6125MN 24 1 0.6680MS 13 3 0.8673MO 16 2 0.6932MT 22 3 0.6259NE 15 3 0.5166NV 13 2 0.7593NH 13 3 0.3916NJ 25 a 0.7330NM 18 3 0.7113NY 23 1 0.5390NC 13 3 0.85f5ND 17 1 0.3374OH 16 2 0.5916OK 18 3 0.7841OR 19 3 0.6954PA 25 2 0.5574RI 19 1 0.85063C 13 3 0.8034SD 20 2 0.3512TN 22 3 0.6648TX 13 3 0.7993UT 25 2 0.4653VT 19 2 0.3612VA 16 2 0.7162WA 13 3 0.5806WV 17 3 0.8032WI 16 1 0.6634WY 20 2 0.3879
State Avg. 19.0 2.2 0.6427Std. Dev. 3.4 0.8 0.1679
367
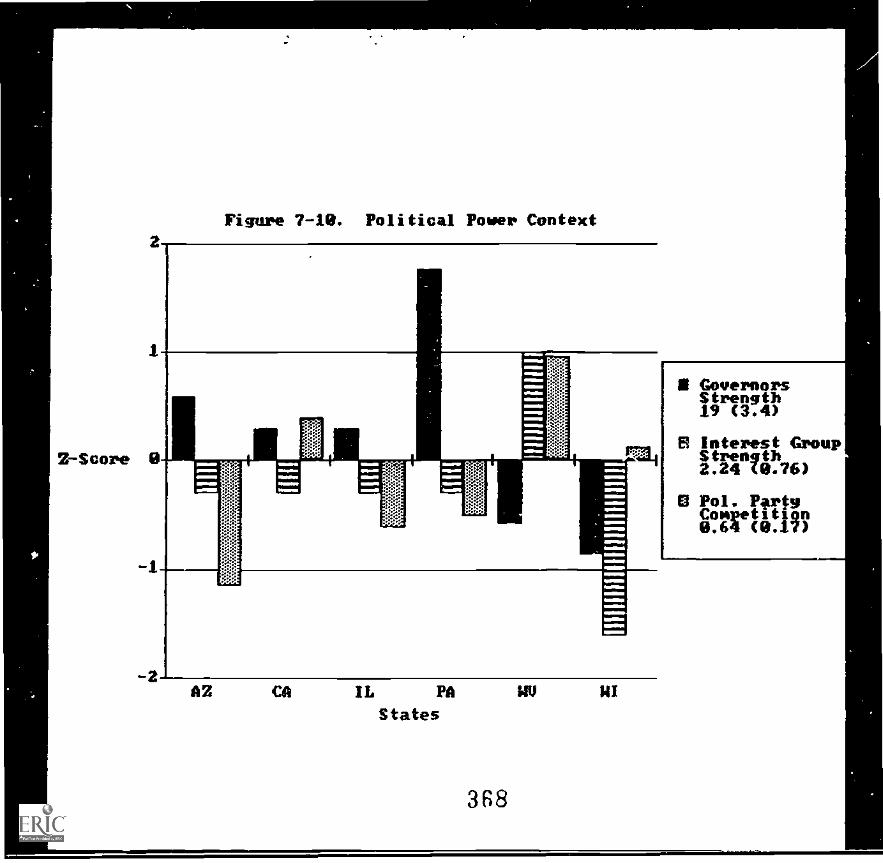
Figure 7-10. Political Power Context
Z-Score
AZ CA IL PA MU RI
States
368
V.
e.I
that they have either the will or political support needed to bring
those powers fully to bear on major public policy questions. All
other things being equal, however, governors with greater formal
powers can be expected to play a stronger role in shaping school
policy.
b. Interest Group Stz.:ngth
Zeigler identifies 22 states with strong political interest
groups. Only West Virginia in our sample is placed in this group.
He describes the interest group strength in 18 states as moderate.
This group includes Arizona, California, Illinois and Pennsylvania
from our sample. Wisconsin, amumg the remaining group of ten
states with weak interest groups is the last member of our sample
group.
c. Party Competition
Illinois, with a party competition score of .53, had the most
evenly balanced parties within our sample. West Virginia had the
strongest Democratic party in our sample (it ranked 10th, behind
five states in the Southeast, MD and RI). Arizona had the
strongest Republican party in our sample, ranking ahead of just ten
other states. Even so, Bibby, et al. (1983) descr3be this state as
a an effectively two-party state durlog the period under study.
In sum, political power is distributed in rather different ways
in our six sample states. Pennsylvania has an especially strong
governor, West Virginia particularly strong interest groups and the
strongest Democratic pe.rty in our sample. Wisconsin has a weak
governor, particularly weak interest groups, and a modified one-
Page VII-31
3 6 9
party Democratic party system. Arizona has the strongest
Republican party in our sample. Illinois is the closest to the
national averages on all three indicators, California is also close
to the national means but has a stronger than average Democratic
party.
jaevels of Political Activity
Three indicators of general political activity provide some
insight into how attentive citizens are to public policy making.
Tie first two measures, voter registration and voter turnout,
assess broad interest in the actions of the political system. The
voter statistics shown in Table 7-11 and graphically presented in
Figure 7-11 was taken from the 1980 presidential election data --
the last presidential election before our field work began. The
dlird variable shown in Table 7-11 is an scale reflecting the
number of educational reform measures adopted in the first two
years following the publication of A Nation at Risk (Shinn and
Slik, 1985). The Shinn and Slik index was generated by counting
the number of reform measures passed in each state and assigning a
score of 1 to states adopting 0 to 4 changes, 2 for states with 5
to 9 changes, 3 for 10 to 14, 4 for 15 to 19, and 5 if the states
adopted 20 or more reform measures.
a. Voter Registration
On average, 73.5 percent of the voting age population is
registered in each state. The total ranges from a high of 95.2
percent in Minnesota to a low of only 49.6 percent in Nevada. The
lowest state in car sample is Arizona with a 57.3 percent
Page V11-32
370
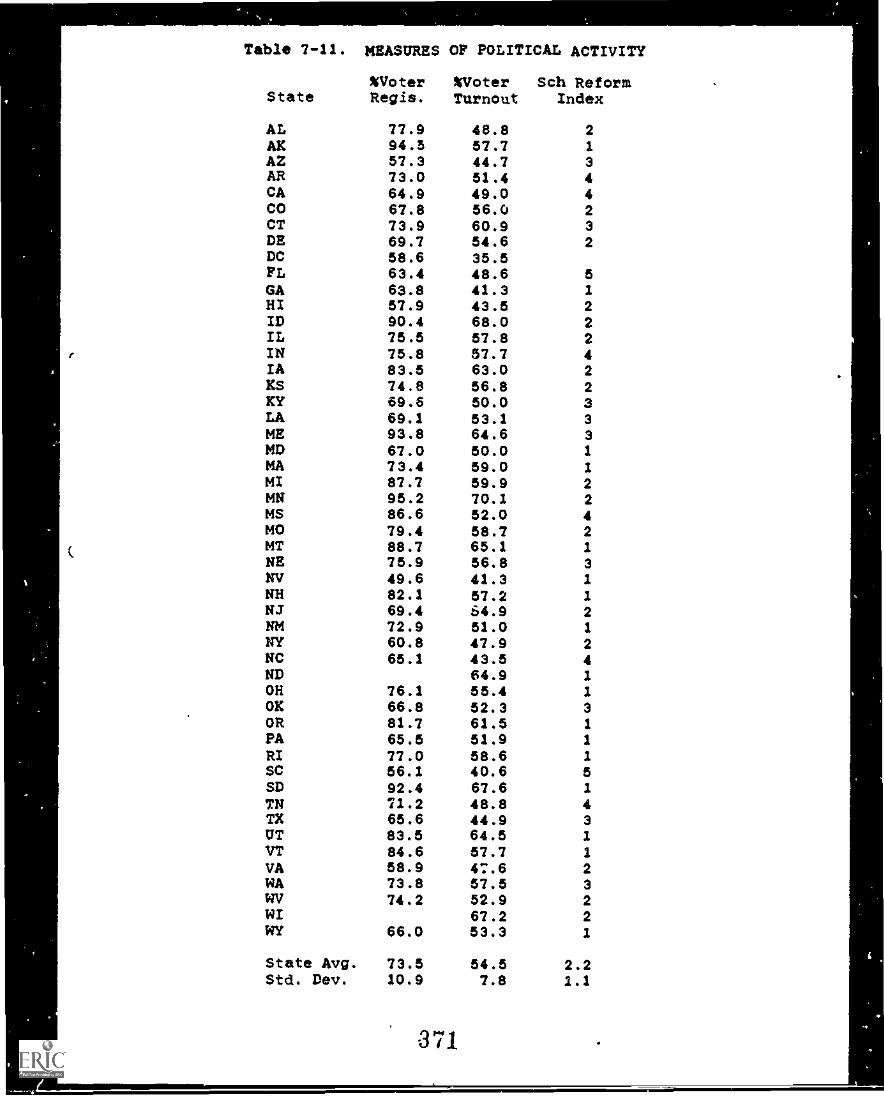
Table 7-11. MEASURES OF POLITICAL ACTIVITY
%Voter %Voter Sch ReformState Regls. Turnout Index
AL 77.9 48.8 2AK 94.5 57.7 1AZ 57.3 44.7 3AR 73.0 51.4 4CA 64.9 49.0 4CO 67.8 56.0 2CT 73.9 60.9 3DE 69.7 54.6 2DC 58.6 35.5FL 63.4 48.6 5GA 63.8 41.3 1
HI 57.9 43.5 2ID 90.4 68.0 2IL 75.5 57.8 2IN 75.8 57.7 4IA 83.5 63.0 2KS 74.8 56.8 2KY 69.6 50.0 3LA 69.1 53.1 3ME 93.8 64.6 3MD 67.0 50.0 1
MA 73.4 59.0 1
MI 87.7 59.9 2MN 95.2 70.1 2MS 86.6 52.0 4MO 79.4 58.7 2MT 88.7 65.1 1NE 75.9 56.8 3NV 49.6 41.3 1NH 82.1 57.2 1
NJ 69.4 64.9 2NM 72.9 51.0 1
NY 60.8 47.9 2NC 65.1 43.5 4ND 64.9 1
OH 76.1 55.4 1OK 66.8 52.3 3OR 81.7 61.5 1
PA 65.5 51.9 1
RI 77.0 58.6 1SC 56.1 40.6 5SD 92.4 67.6 1
TN 71.2 48.8 4TX 65.6 44.9 3UT 83.5 64.5 1
VT 84.6 57.7 1
VA 58.9 47.6 2WA 73.8 57.5 3WV 74.2 52.9 2WI 67.2 2WY 66.0 53.3 1
State Avg. 73.5 54.5 2.2Std. Dev. 10.9 7.8 1.1
371
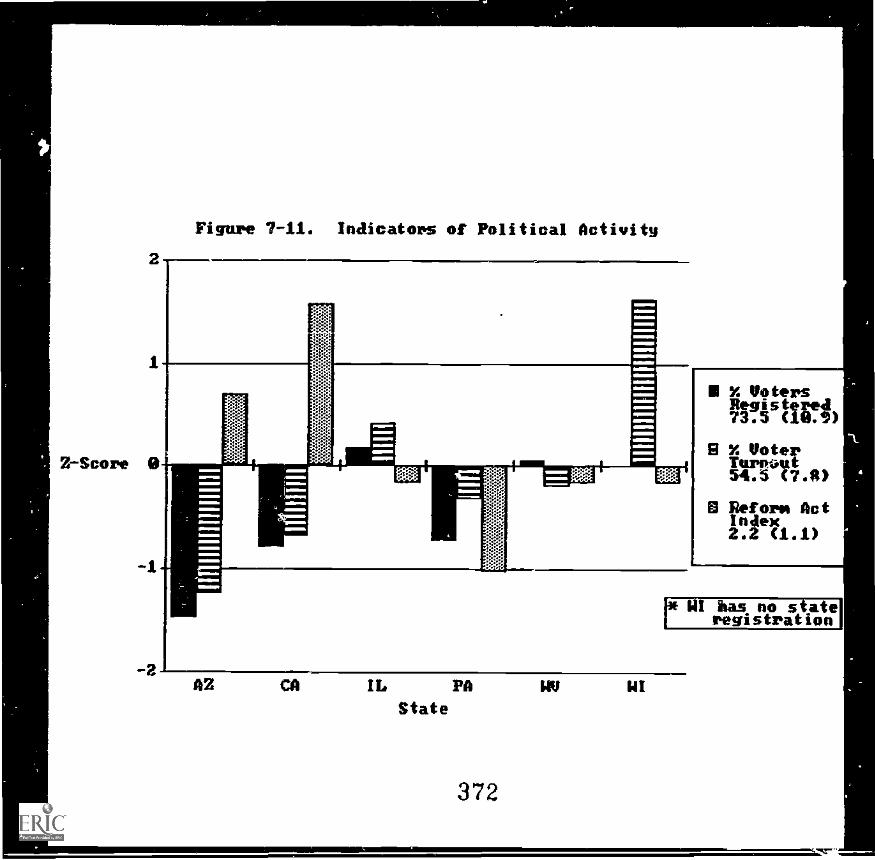
Figure 7-11. Indicators of Political Actiuitg
41%.
Z-Score
AZ IL PA
State
372
UI
X VotersRegistered73.5
B X VoterTurnout54.5 (?.R)
Reform ActIndex2.2 (1.1)
13* NI has no state'registration
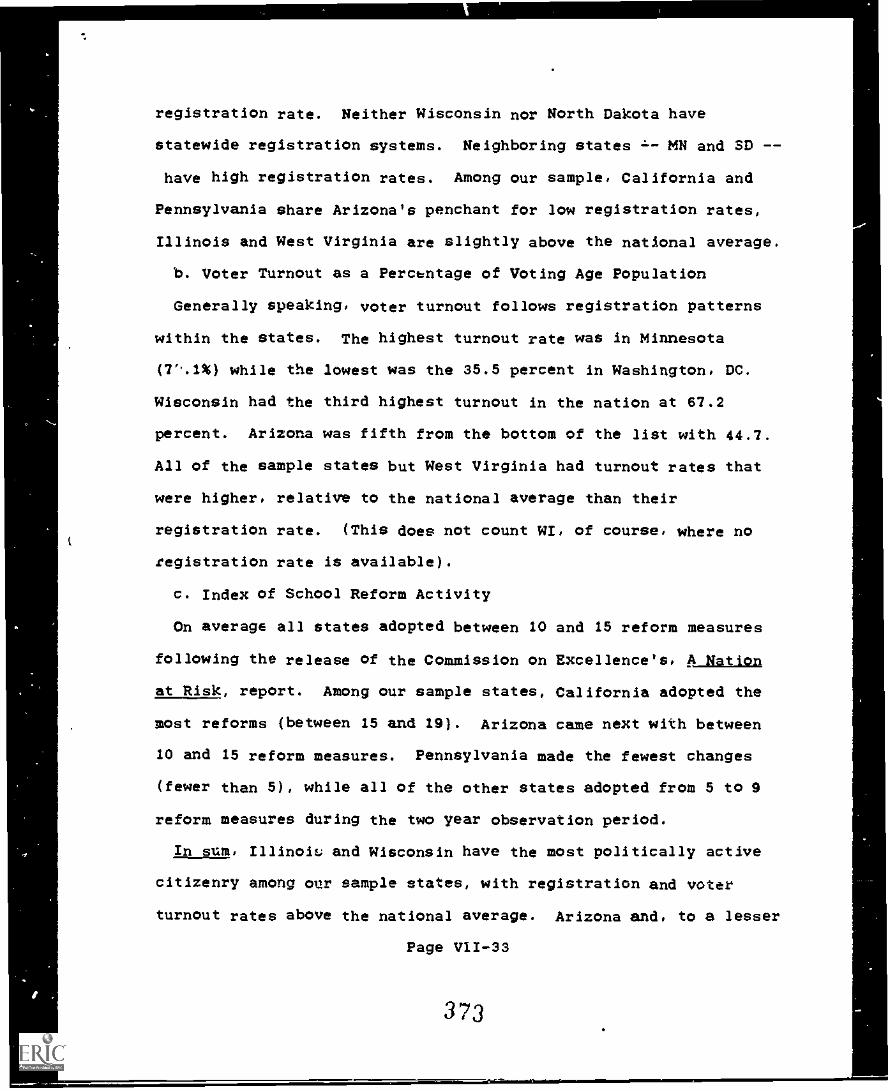
registration rate. Neither Wisconsin nor North Dakota have
statewide registration systems. Neighboring states MN and SD --
have high registration rates. Among our sample, California and
Pennsylvania share Arizona's penchant for low registration rates,
Illinois and West Virginia are slightly above the national average.
b. Voter Turnout as a Percbntage of Voting Age Population
Generally speaking, voter turnout follows registration patterns
within the states. The highest turnout rate was in Minnesota
(7''.1%) while the lowest was the 35.5 percent in Washington, DC.
Wisconsin had the third highest turnout in the nation at 67.2
percent. Arizona was fifth from the bottom of the list with 44.7.
All of the sample states but West Virginia had turnout rates that
were higher, relative to the national average than their
registration rate. (This does not count WI, of course, where no
registration rate is available).
c. Index of School Reform Activity
On average all states adopted between 10 and 15 reform measures
following the release of the Commission on Excellence's, A Nation
at Risk, report. Among our sample states, California adopted the
most reforms (between 15 and 19). Arizona came next with between
10 and 15 reform measures. Pennsylvania made the fewest changes
(fewer than 5), while all of the other states adopted from 5 to 9
reform measures during the two year observation period.
In sum, Illinoi.. and Wisconsin have the most politically active
citizenry among our sample states, with registration and voter
turnout rates above the national average. Arizona and, to a lesser
Page V1/-33
373
4
extent, California and Pennsylvania have inactive citizens. There
appears to be little connection between political activism by
citizens and the rate of school reform, however. California and
Arizona with less ctive citizens had high rates of policy change.
Pennsylvania, with a similarly low rate of citizen involvement,
however, also had a low level of legislative reform activity.
Wisconsin, with extraordinary voter turnout, had only a modest
record of legislative chang.
Economic Context Factors
Four aspects of the economic context for policy making round out
our review of the states. The first is a measure of state and
local tax effort, indexed so that the national average is set to
100 which represents an effective tax rate of 4.2 percent. The
second indicator is the overall per capita expenditure for all
state and local services. Third is the share of state and local
expenditures going to education. This variable is also indexed to
set the national average at 100. The national index value of 100
represents 24.3 percent of all state and local expenditures.
Finally, we look at the index of tax progressivity developed by
Hansen (1983).
INSERT TABLE 7-12
INSERT FIGURE 7-12
Page V/I -34
374
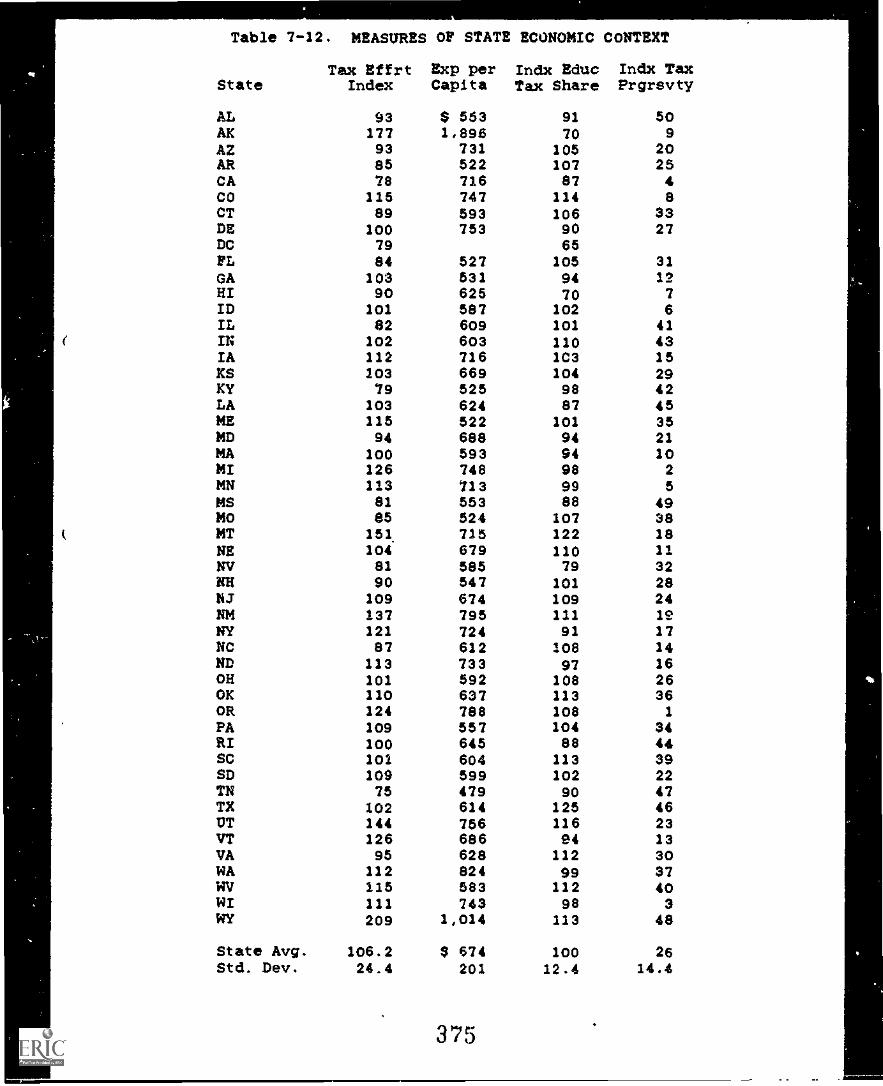
Table 7-12. MEASURES OF STATE ECONOMIC CONTEXT
Tax Effrt Exp per Indx Educ Indx TaxState Index Capita Tax Share Prgrevty
AL 93 $ 563 91 50AK 177 1.896 70 9
AZ 93 731 105 20AR 85 522 107 25CA 78 716 87 4CO 115 747 114 eCT 89 593 106 33DE 100 753 90 27DC 79 65FL 84 527 105 31GA 103 531 94 12HI 90 625 70 7
ID 101 587 102 6IL 82 609 101 41IN 102 603 110 43IA 112 716 1C3 15KS 103 669 104 29KY 79 525 98 42LA 103 624 87 45ME 115 522 101 35MD 94 688 94 21MA 100 593 94 10MI 126 748 98 2MN 113 713 99 5
MS 81 553 88 49MO 85 524 107 38MT 151 715 122 18NE 104 679 110 11NV 81 585 79 32NH 90 547 101 28NJ 109 674 109 24NM 137 795 111 19NY 121 724 91 17NC 87 612 108 14ND 113 733 97 16OH 101 592 108 26OK 110 637 113 36OR 124 788 108 1
PA 109 557 104 34RI 100 645 88 44SC 101 604 113 39SD 109 599 102 22TN 75 479 90 47TX 102 614 125 46UT 144 756 116 23VT 126 686 94 13VA 95 628 112 30WA 112 824 99 37WV 115 583 112 40WI 111 743 se 3WY 209 1,014 113 48
State Avg. 106.2 $ 674 100 26Std. Dev. 24.4 201 12.4 14.4
375
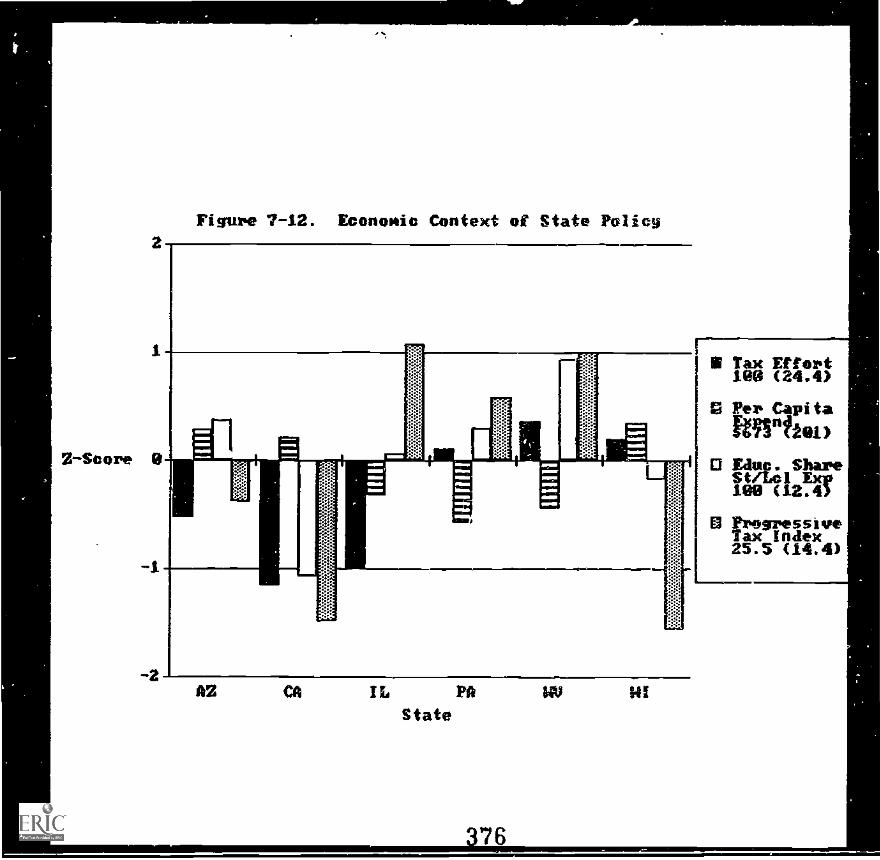
Z-Seore
Figure 7-12. Economic Context of State PoIieg
AZ IL PA HI
State
376
1
it Tax Effort160 (24.4)
a Per Capitaitnnfiel)
0 flue. ShareSt/LeI Exp1611 (12.4)
0 ProgressiveTax Index25.3 (14.4)
a. Tax Effort. Measured againct the U.S. Average of 4.2 percent
West Virginia, the poorest of our states, makes the greatest
effort to raise taxes for state expenditures. The WV rate of
approximately 4.8 percent is tied with CO and ME, and ranks behind
other states. Alaska has the highest effort index, 177 or 1.77
times the national average. In 1962 when the index was calculated,
California had the lowest tax effort index among our sample states
(76). Only TN had a lower effort score (75). Illinois, with an
index score of 62, was also making a low tax effort. Of the
remaining states in the sample. Wisconsin and Pennsylvania had tax
rates slightly above the national average, while Arizona shared
with CA and IL a low effort index.
b. Per wapita Expenditures
Another indicator of overall public support for state services is
the aggregate per capita expenditure. On a:erage, states spent
$673 per capita on public services. The range of expenditures was
quit high, however, from Alaska's $1,695 to Tennessee's $479.
Among our sample, expenditures were relatively close to the
national average for all stat4s but West Virginia whose $563 was
12th lowest in the nation. Despite their relatively low tax
efforts, Arizona. California and Illinois were all able to raise
more than the average revenue level. Wisconsin's relative wealth
enabled an above average tax effort to produce an even more above
average rate of expenditure.
c. Education's Share of State and Local Expenditures
Page VII -35
377
Education received more *hen the average 24.3 percent of all
state and local expenditures in West Virginia, Arizona,
Pennsylvania and Illinois. California and Wisconsin gave education
a relatively smaller portion of total resources, with California
giving an especially low 87% of the national average.
d. Progressivity of State Taxes
Illinois ranks ninth from the bottom and West Virginia tenth from
the bottom of the Hansen (1983) tax progressivity index. Wisconsin
and California have very progressive index numbers (3rd and 4th
respectively). The othev. states range in the middle -- Arizona's
tax system relatIvely progressive and Pennsylvania's relatively
regressive by Hansen'c calculation.
In sum, our states vary widely in the progressivity of their tax
systems and in the overall level of tax effort being made.
California has a progressive tax system, but makes a low effort and
gives education relatively little of the money raised. West
Virginia, with a regressive tax system makes a larger than average
effort and puts a large portion of the money raised into the
schools. Illinois, by contrast, with an equally regressive tax
system makes a low effort and gives schools only about the average
share of total expenditures. Wisconsin, with the most progressive
tax system in our sample states has effort and expenditure rates
fairly close to the national average. Arizona is the only state
that succeeds in getting a relatively high rate of expenditure and
strong support for education out of a relatively regressive tax
system and a low tax effort.
Page VII-36
378
pollclusion
A review of 44 selected variables on the educational, social,
economic and political characteristics of all states demonstrates
that our six state sample in very representative of the nation as a
whole. In no case did the sample states all fall on the same side
of the national mean score for a measured indicator. In only four
cas's was the sample divided five to one (five states on one side
of the mean and only one on the other). On 19 variables the states
split three above and three below the national mean. In addition,
on the two variables for which one state had a missing value the
means were split three to two (three states above the mean on
racial isolation, and three below the mean on voter registration).
On the remaining nineteen variables the states *plit four to two.
All together, 47 percent (224) of the :ecorded values were above
the national mean and 53 percent (136) were below the national
average. The sample states are also distributed fairly well with
regard to the extent of their departure from the national mean. A
total of 27 percent (70) of all sample state values had standard
scores of at least 1.0 (a few less than the expected 32 percent
(63). These large z-score values were very evenly divided above
and below the national mean scores for each variable -- 64 below
the mean and 36 above).
This representativeness is comforting as we try to project our
findings from the eix sample states to the nation as a whole. Of
course, states with unusual social and demographic characteristics
may well not fit the patterns identified in our sample, but we are
Page VII-37
379
reasonably confident that the national consensus on policy
priorities and decision making processes discovered in our study of
these six states is typical of those found in most states.
Moreover, the representative cnaracter of the six states in our
study strongly supports the conclusion that the variations we
mapped are typical of the inter-state variations found across the
nation. While there are, no doubt, states with more exaggerated
deviations from the sample mean than any found in our particular
sample, our states are very likely to prcvide a clear picture of
the range of differences found across the country.
We have not pressed the next logical step in data analysis --
determining whether the broad social indicators described in this
chapter are effective predictors of the educational policy
variations discussed in Chapters III, IV and V. There are two
reasons for stopping short of eramining the stat!stical
relationships between gross social indicators and the sort of data
collected in our study. First, we feel that data from a single
cross-sectional study of 140 policy makers is too unreliable to be
used for this purpose. The basic data collected for this research
project should be replicated and tested for its statistical
stability before using it to paint a probably misleading picture of
the origins of specific policy priorities and policy processes.
Second, and more important, we feel that no convincing theory of
the origin and adoption of education policy has been developed
fully enough to warrant testing it within the available data. Any
effort to search for the origins cf our data from individual policy
Page VII-38
350
makers in the broad social indicators reviewed in this chapter
would be extraordinarily tenuous -- amounting to little more than a
statistical "fishing expedition" that would yield interesting
correlations which have little meaning.
Page VII -39
CHAPTER VIII
PUBLIC VALVES AS ORIGINS OF POLICY ACTIONS
Among the brief written questionnaires respondents were
asked to complete following their description of various policy
mechanisms and competing approaches was one designed to assess
their public value preferences. Four basic public values were
presented in the instrument:
1. Choice (or Liberty)
This is arguably the most basic of all American public
values. It was the passionate belief of the American Federalists
that good government is defined by its ability to preserve freedom
of choice for its citizens. This was the bedrock of classical
liberalism as formulated by John Locke and John Stuart Mill. It
was summed up succinctly by Thomas Jefferson in his declaration
that, "That government governs best which governs least."
Choice is a difficlt value to pursue through governmental
action -- it seems generally to be supported more by inaccion than
by positive policy formatior A number of critical choice iscues
can be identified in current education policy debates, however.
Probably the most prominent among them are vouchers and other
strategies to allow families to choose among schools for their
children. But many choice expansion strategies are less dramatic
and less controversial. They include alternative school program
Page VIII-1
382
development, flexibility in local school planning and greater
decentralizetion of budget and management decisions.
2. Quality
Given the primary role played by choice or liberty under our
political system, positlite public policy a:tions must be justified
in terms of their ability to enhance the quality of life for
citizens. /ndeed, governmental action to provide direct services
is defensible only if the quality of the services provided is, on
the whole, at least as good as could be reasonably expected to
arise through private action.
The argument that government is intrinsically superior to
private action in some areas of service has a long and convincing
history. In the modern period, Rousseau's Social Contract theory
best captured this argument. His theory is based on the
proposition that citizens join together in collective action to
achieve goals they would be incapable of reaching through private
actions and thus enter into a contractual relationship with the
State -- securing improved life opportunities in exchange for
reduced personal liberties.
As a practical matter, Americans have believed for about a
century that the overall quality of life in this country is
substantially increased through a system of free, compulsory mass
education. For some, the quality improvement is economic, measured
by the greater productivity of well educated workers. For others,
the compelling rationale for public ducation is civic -- schools
provide an introduction to American culture and prepare responsible
Page VI/I-2
3R3
k
citizens. Still others see the benefits of public education In
private terms -- increased personal capacities and expanded
sensitivity to culture, language, literature and the arts.
However the goal of public education is defined, quality is
destroyed if schools do not have the resources, the technical
capacity, or the will to deliver services-effectively. Hence,
despite the variety of its ultimate ends, there is broad agreement
that quality is an instrumental and immediate public value, one
with which to judge school performance and formulate policies aimed
at shaping their performance. This instrumental meaning of quality
provides the positive basis for policy evaluation and informs
strategic thinking about how to improve schools.
3. Efficiency
Americans have had an intense love-hate relationship with
efficiency as a public policy value since the founding of the
Republic. The cruel efficiencies of totalitarian governments are
recognized and feared. But the productive efficiency of American
business and industry are just as frequently held out as the model
after which to design public service aglncies. And the possibility
that social order will dissolve In the face of popular unrest is a
constant worry for many.
It was Thomas Hobbes who used the problem of efficiency and
order as the cornerstone of modern political theory. Without
gviernment to create efficient order, Hobbes argued, life quickly
becoves "brutish, short and ugly." For Hobbea, t.le arbitrariness
Page VIII-3
3 8 41
g.)
44;*`
V44e, Pr"_=,A,
1.0 mm
1.5 mm
2.0 mm
0033
ABC C.) Ef GHIIKLANOPQRSTUVWXYZabcdethipdrnnopqrStuvwxyz 1234567890
ABCDEFGHIJKLMNOPQRSTUVWXYZabcdefghliklmnopqrstuvwxyz
1234567890

of efficient governmental authority Is a small price to pay for the
resulting security and order which make civilized life possible.
In the American experience, the efficiency of Iglentific
Management (Taylor, 1911) Is more often presented as the
legitimating reason for expansive governmental authority. But
recent conservative political Ideologues offer a straightforward
- embrace of the Hobbesian argument In their call for "law and order"
In daily life.
In education, the embrace of efficiency was given a
tremendous boost by scientific management theorists during the
first three decades of tills century (see Callahan, 1962).
Regulating school operations In ways Intended to keep costs down
and order up has been a major concern of policy makers In most
states and localities. The strong presumption that expansive and
generally centralized governmental authority Is the proper means
for achieving efficient control has recently come under attack, but
It remains a core value In most education programs.
4. Equity
Though the very first "self-evident" truth set forth In the
Declaration of Independence Is that "all men are created equal,"
Americans have had much difficulty embodying this core value In
public policies. Nevertheless, equity Is a core public value and
one which can be powerfully invoked as a basis for creating oe
changing policy decisions.
Karl Marx framed the problem of equity for modern political
theory. He argued that inequities In society are a governmental
Page VIII-4
3 S5
responsibility because the inevitable dynamic of private social
relationships make exacerbate the problem. In private society,
Marx argued, there is a steady accumulation of wealth and privilege
in the hands of one social class at the expense of others.
Revolutionary warfare is, he asserted, the inevitable consequence
of this instability in private social relationships. Hence the
government must perform the most important function of Interceding
In this drift toward private domination by taking action to restore
equality of opportunity to all citizens -- giving everyone a chance
to benefit from economic productivity and to share in the
privileges of full citizenship.
The Marxist vision of inevitable revolution by
disenfranchised groups against the privileged classes has not come
to fruition -- but it has been stayed primarily by the fact that
political leaders have understood his argument and have acted to
keep the process from following the natural tendency toward
cumulative inequality.
As a policy matter, equity is complicated because it is a
matter of redress rather than one of address. That is,
governmental action is not justified until some identifidble
ineaultv has been shown to be serious and in need of remedy. And
then action is only justified to the extent necessary to eliminate
the identified inequity. In the schools, educators have been asked
to treat equity problems on two levels -- to provide equal
opportunities within and across the schools to all children, and to
give dissidvantaged children educational resources that will enuble
Page VIII-5
386
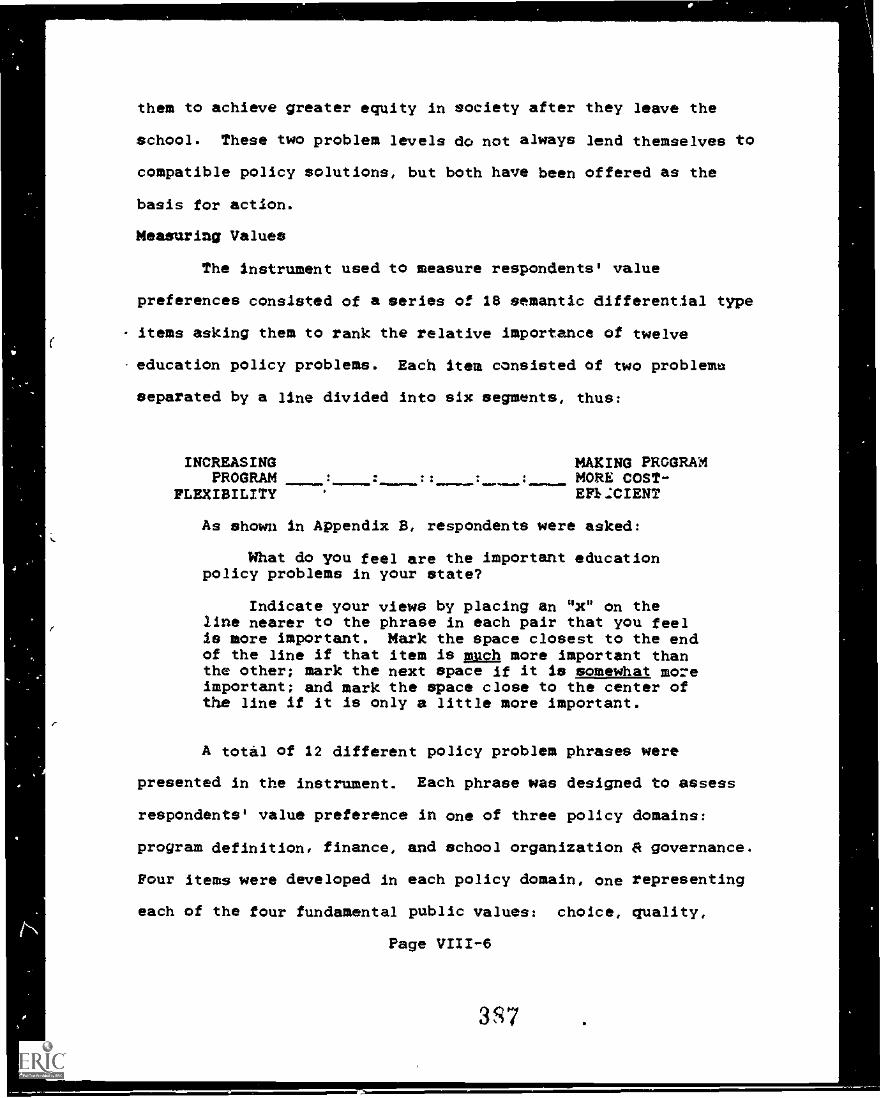
them to achieve greater equity in society after they leave the
school. These two problem levels do not always lend themselves to
compatible policy solutions, but both have been offered as the
basis for action.
Measuring Values
The instrument used to measure respondents' value
preferences consIsted of a series of 18 semantic differential type
- items asking them to rank the relative importance of twelve
.education policy problems. Each item consisted of two problems
separated by a line divided into six segments, thus:
INCREASING MAKING PROGRAMPROGRAM : MORE COST------- - -------------
FLEXIBILITY Ea.:CIENT
As shown in Appendix B. respondents were asked:
What do you feel are the important educationpolicy problems in your state?
Indicate your views by placing an "x" on theline nearer to the phrase in each pair that you feelle more important. Mark the space closest to the endof the line if that item ie much more important thanthe other; mark the next space if it is somewhat moreimportant; and mark the space close to the center ofthe line if it is only a little more important.
A total of 12 different policy problem phrases were
presented in the instrument. Each phrase was designed to assess
respondents' value preference in one of three policy domains:
program definition, finance, and school organization * governance.
Four items were developed in each policy domain, one representing
each of the four fundamental public values: choice, quality,
Page VIII-6
3S7
efficiency and equity. The 12 items are displayed in the rows and
columns of Figure 8-1 according to the intersection of value and
policy domain reflected in each.
Insert Figure 8-1 about here.
Items were paired within each policy area, but no
comparisons were requested across the three different policy
domains. Respondents indicated relative preferences for each value
within each sphere. They were assigned scores for each phrase
listed in the bi-polar pairs (a positive score for the item closest
to their "x" and a negative score for the other item). Responses
were scored 1 if an x was close to the cent-;tr of the line, 2 if
the x was on the middle segment, and 3 when the x oas in the space
closest to the end of the line.
The mean scores for all rlpondents are shown in brackets
ender each phrase in Figure 8-1. Several important observations
about the value preferences of our sample of state policymakers can
be made on the basis of these item mean scores. The educational
quality items, for example, were ranked first in all three domains,
indicating that this value Is widely held to be the most important
consideration in current policy debates.
The mean scores for all items in the finance and the
organization/vovernance domains have the same rank order -- quality
first, followed by efficiency and equity, with choice ranked a
distant last. By contrast, in dealing with school program
Page VIII-7
388
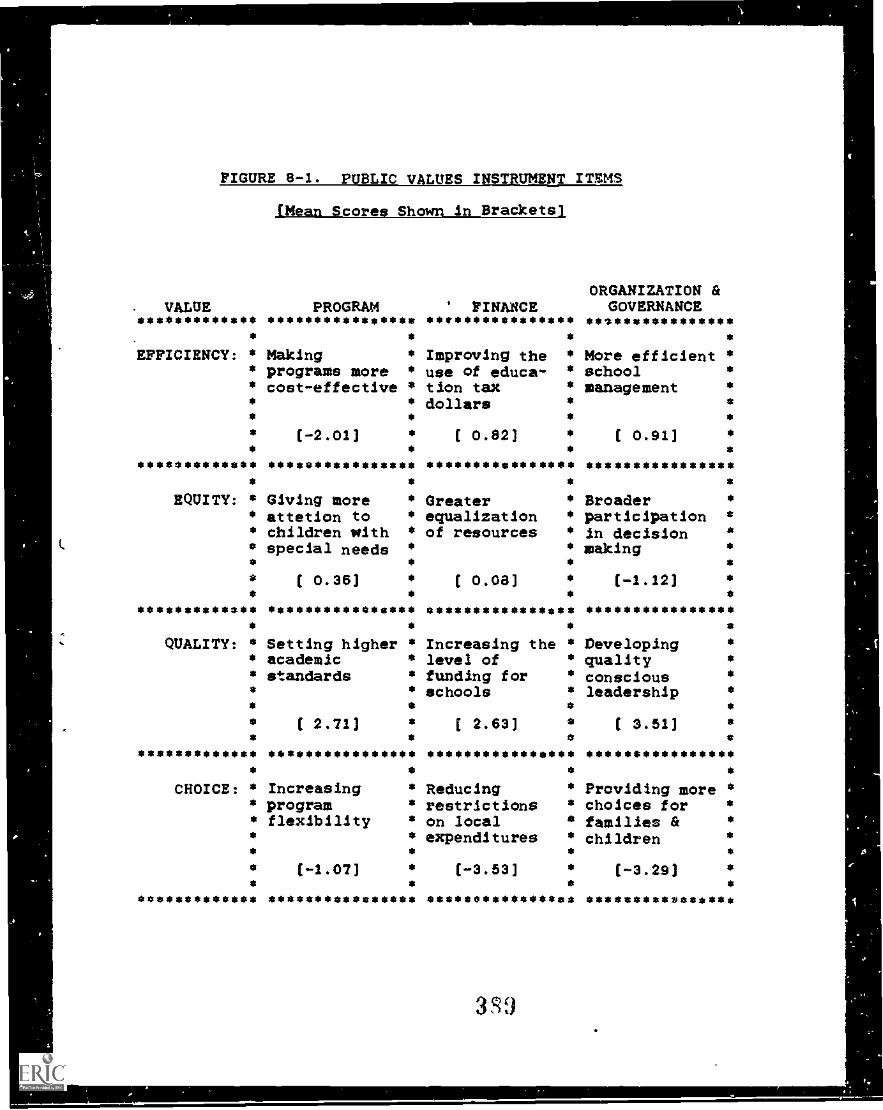
FIGURE 8-1. PUBLIC VALUES INSTRUMENT ITEMS
(Mean Scores Shown in Bracketsl
VALUE PROGRAM********EFFICIENCY: * Making
* programs more* cost-effective *
I-2.0114**EQUITY: Giving more
* attetion to* children withspecial needs *
( 0.36]
1010=x10 *****QUALITY: * Setting higher *
* academic* standards
I 2.71]
S************ iSSS************
CHOICE: * Increasing* program* flexibility
(-1.07)
SaliSitSS****** ****************
' FINANCE,Improving theuse of educa- *
tion taxdollars
( 0.82]
$16181Greaterequalization *
of resources *
( 0.08)
Increasing the *level offunding forschools
[ 2.83]
ORGANIZATION &GOVERNANCE4010.x$
More efficient *schoolmanagement
( 0.91]
5*************1641
Broaderparticipation *
in decisionmaking
(-1.121
*****Developingqualityconsciousleadership
********Ss********Reducing Providing more *
restrictions * choices foron local families &expenditures * children
(-3.53] (-3.29]
SSSSSO**********
3)
****************
4
problems, respondents ranked efficiency (represented by the phrase
"Making programs more cost-effective") last, well behind both
equity and choice values. Since our intent was to produce an
instrument containing three different scales for assessing the same
four values, this difference could be seen as a measurement problem
-- but our interview data suggest otherwise. Program efficiency is
not seen as a primary mechanism for improving overall educational
quality. More efficient management and financivg are seen as
directly related to quality imprcvement, but our respondents tend
to view a cost-benefit approach to program development as a threat
to program quality.
We were a bit surprised to see the consistently negative
cores for the three choice items. The interviews did not suggest
that policy makers were opposed to expanding educational choice --
though the emphasis on improving school quality was clearly the
dominant theme in most policymakers' remarks. The data from this
instrument clearly suggest, however, that our respondents would
sacrifice choice (especially in the fiscal and organization/
governance domains) in order to pursue quality improvement.
The receding support for educational equity is clearly
evident in our data. The equity problems of finance equalization
and expanded participation in decision making were ranked third --
well behind quality and efficiency considerations. In the program
domain equity concerns related to the development of programs for
children with special needs we:e a distant second (behind setting
higher academic standards).
Page VIII -8
390
mif
dr,
vo'
The scores on our education policy values instrument are
ipsative -- that is, positive scores on any one item are matched by
negative scores on another, resulting in a grand mean of zero for
each individual (and for the entire sample). As a result, it is
possible to estimate the extent of agreement among all 140
respondents on the rank ordering of the values embodied in their
. means scores. To do so, we simply compare the variance of the
group mean scores within each policy domain with the average item
variance for the same items. The group means in the
organization/governance domain have the largest variance (6.31).
That represents about 48% of the 13.16 average response variance
for each of the four items in this domain. Hence, on the average,
nearly half the variance in each individual's response to the
instrument was shared by all respondents. That represents a
-remarkable degree of consistency across the sample.
In the finance domain agreement among respondents was less
strong (the variance of 5.01 for the group means representing only
about 30% of the average item variance of 16.63). In the program
area, value consensus was even less strong -- the variance of the
means was only 3.17, bout 2154 of the 15.06 average for the
variance of the individual items. These numbers indicate that our
respondents were more than twice as strong in their agreement about
the rank ordering of values In the organization/governance arem
than in the area of program policy problems. In the finance
domain, agreement was greatest in the rejection of choice as an
important policy value. The item "Reducing restrictions on local
Page VI/I-9
1
expenditures" received the lowest overall mean (-3.53) of all items
in the questionnaire, indicating strong agreement that this is not
a pressing problem for state policymakers at this time.
Averaging Across the Four Domains
Overall preference scores for each of the four competing
public values were generated by summing across the program, finance
and organization/governance domains. Distribution statistics on
the four value preferences for the 140 policy makers in the sample
are shown in Table 8-1.
Insert Table 8-1 about here.
As is obvious from the figures in Table 8-1, the strongest
bias among the respondents is toward quality oriented definitions
of education policy issues. Quality and choice items were seen as
most antithetical, while efficiency and equity values were close to
each other and very close to the grand mean of zero.
By giving negative mean scores to all but the quality value
option, our policy maker sample was confirming the obvious fact
that educational quality has replaced the equity theme of the past
two decades and now holds the dominance that was reserved for
efficiency oriented concerns of the 19208 and 305. The variance in
the mean scores shown in Table 8-1 is 35.29, which represents about
57% of the average variance in the four basic values. This is a
substantial improvement over the 48% agteement within the
organization/govertance sub-scale, and an even greater improvement
Page VIII-10
392
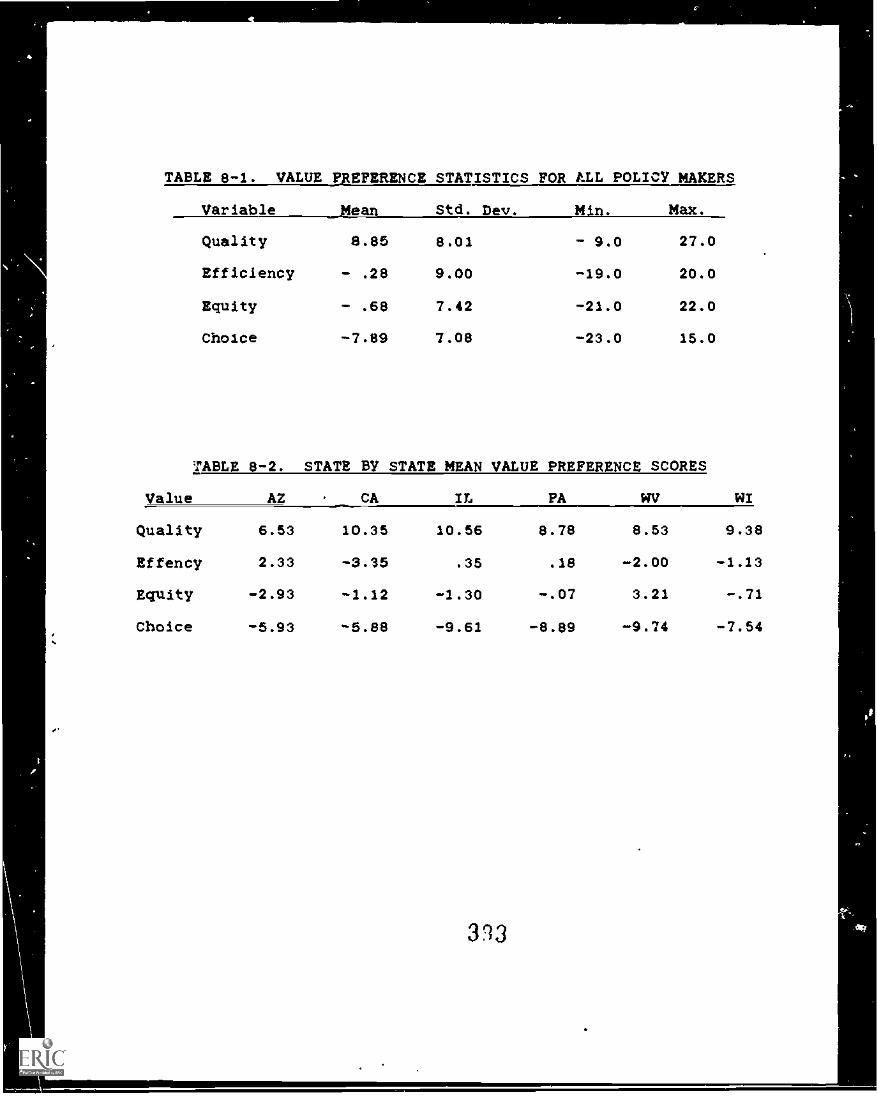
P.
TABLE 8-1. VALUE PREFERENCE STATISTICS FOR ALL POLICY MAKERS
Variable Mean Std. Dev. Min. Max.
Quality 8.85 8.01 - 9.0 27.0
Efficiency - .28 9.00 -19.0 20.0
Equity - .68 7.42 -21.0 22.0
Choice -7.89 7.08 -23.0 15.0
Value
TABLE 8-2. STATE BY STATE MEAN VALUE PREFERENCE SCORES
AZ CA IL PA WV W/
Quality 6.53 10.35 10.56 8.78 8.53 9.38
Effency 2.33 -3.35 .35 .18 -2.00 -1.13
Equity -2.93 -1.12 -1.30 -.07 3.21 -.71
Choice -5.93 -5.88 -9.61 -8.89 -9.74 -7.54
313
over the 30% and 2194 agreement variance in the finance and program
domains.
Mote, however, that substantial disagreements among
respondents are also present. The standard deviations, and
especially the range data presented in the table show the extent of
disagreement. With possib1e minimum and maximum scores ranging
from -27 to +27, we can see that individuals within the sample
group have taken nearly all possible value positions.
Comparison among the states
As indicated in the state by state breakdown of mean scores
presented in Table 9-2, differences among individual respondents
are partially ezplained by differences in value preference across
the stats.
Insert Table 8-2 about here.
As confirmed by the graphic representation of the data
presented in Figure 8-2, all states shared the view that quality
is the most pressing policy prob:.m and that choice is most
easily sacrificed to get it.
Insert Figure 8-2. about here.
Though the value of quality was ranked first in every
state, it was highest in Illinois and California and least
dominant in Arizona. The largest range in value preferences
Page VIII-11
394
t
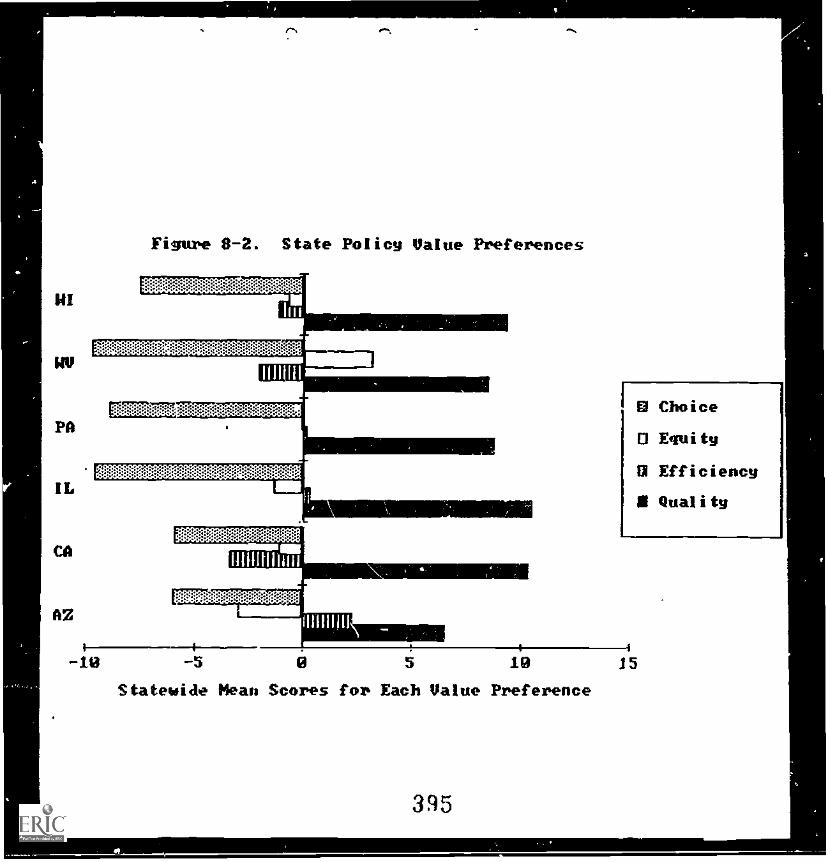
NI
Figure 8-2. State Policy Value Preferences
EMEMEMMEWNliii
EMEEMINW0MWwiftmu
PA
IL
CA
AZ
HUH
MENZIEVOIMININENOI
lIIUIIiluni
-le -s 5 111
Statewide Mean Scores for Each Value Preference
395
O Choice
O Equity
a Efficiency
II Quality
.1 5
a
concerned the equity items which went from a high score of +3.21
in West Virginia (a state just brought under court order to do
something about equality of educational opportunity at the timo
of our study) to a low of -2.93 in Arizona. There were also
reasonably strong inter-state variations in preference for
efficiency and choice policy values. Efficiency was most
strongly embraced by Arizona policymakers while it was most
frequently rejected by California respondents. Choice as a
public value was rejected in all states, but the rejection in
Arizona and California was much less pronounced than that in
Illinois aLd West Virginia.
Discriminant Analysis of State Variations
Table 8-3 presents a multiple discriminant analysis of the
twelve individual policy value items, when respondents are
grouped by state. As shown in the table, one very powerful
discriminapt function is generated (the multiple R of .50 means
that it accounts for about 25% of the group member variance). An
additional 18% (multiple R = .43) is explained by a second
function whose low statistical reliability (p .11) requires
that we interpret it with caution.
Insert Table 8-3 about here.
As reported in the top part of Table 8-3, the strongest
contributors to the more reliable first function are the items
drawn from the finance domain. The discriminant function
Page VIII-12
396
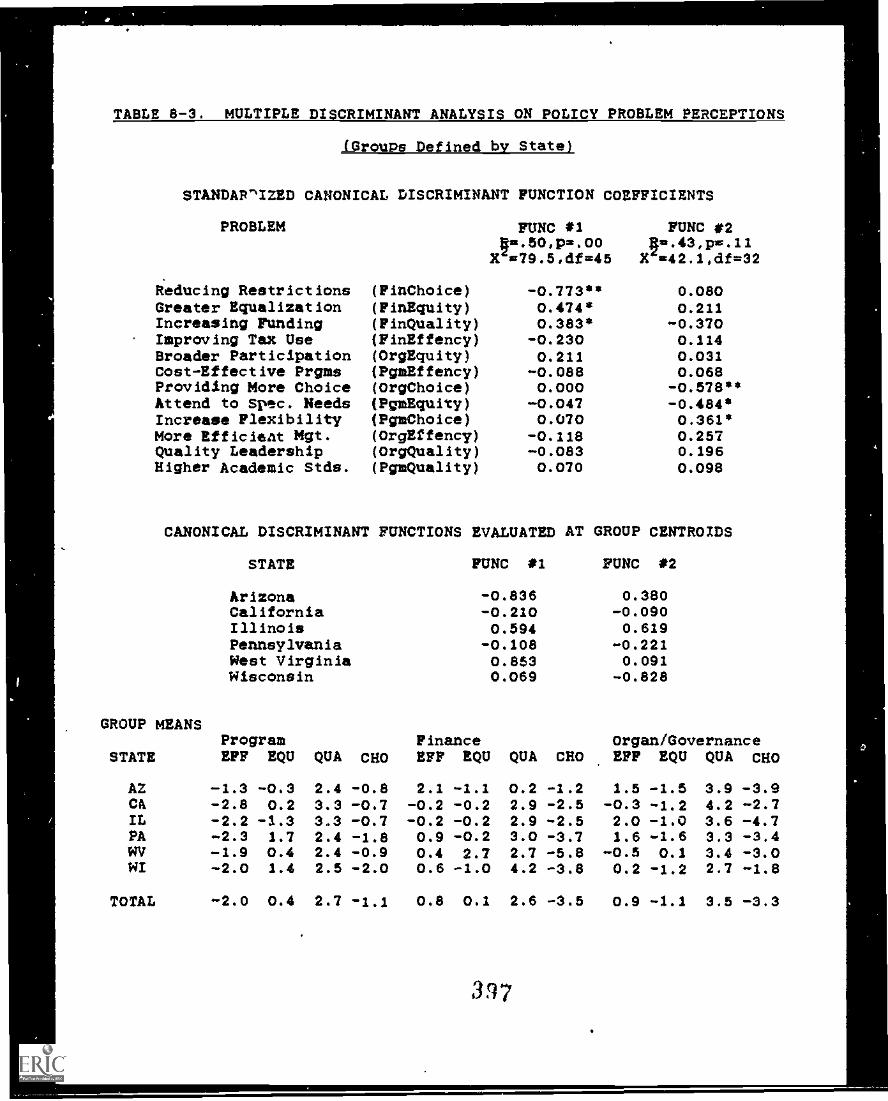
TABLE 8-3. MULTIPLE DISCRIMINANT ANALYSIS ON POL/CY PROBLEM PERCEPTIONS
larourls Defined by State)
STANDAP^IZED CANON/CAL DISCRIMINANT FUNCTION COEFFICIENTS
PROBLEM FUNC *1#=.50,pa.00
Ir=79.5,df=45
FUNC *241=.43,pw.11r=42.1,df=32
Reducing Restrictions (FinChoice) -0.773** 0.080Greater Equalization (FinEquity) 0.474* 0.211increasing Funding (FinQuality) 0.383* -0.370improving Tax Use (FinEffency) -0.230 0.114Broader Participation (OrgEquity) 0.211 0.031Cost-Effective Prgms (PgmEffency) -0.088 0.068Providing More Choice (OrgChoice) 0.000Attend to Spec. Needs (ftmEquity) -0.047 -0.484*increase Flexibility (FigmChoice) 0.070 0.361*More Efficleat Mgt. (OrgEffency) -0.118 0.257Quality Leadership (OrgQuality) -0.083 0.196Higher Academic Stds. (PgmQuality) 0.070 0.098
CANONICAL DISCRIMINANT FUNCTIONS EVALUATED AT GROUP CENTROIDS
STATE FUNC *1 FUNC *2
Arizona -0.836 0.380California -0.210 -0.090Illinois 0.594 0.619Pennsylvania -0.108 -0.221West Virginia 0.853 0.091Wisconsin 0.069 -0.828
GROUP MEANS
STATEProgramEFF EQU QUA CHO
FinanceEFF EQU QUA CHO
Organ/GovernanceEFF EQU QUA CHO
AZ -1.3 -0.3 2.4 -0.8 2.1 -1.1 0.2 -1.2 1.5 -1.5 3.9 -3.9Ch -2.8 0.2 3.3 -0.7 -0.2 -0.2 2.9 -2.5 -0.3 -1.2 4.2 -2.7/L -2.2 -1.3 3.3 -0.7 -0.2 -0.2 2.9 -2.5 2.0 -1.0 3.6 -4.7PA -2.3 1.7 2.4 -1.8 0.9 -0.2 3.0 -3.7 1.6 -1.6 3.3 -3.4WV -1.9 0.4 2.4 -0.9 0.4 2.7 2.7 -5.8 -0.5 0.1 3.4 -3.0W/ -2.0 1.4 2.5 -2.0 0.6 -1.0 4.2 -3.8 0.2 -1.2 2.7 -1.8
TOTAL -2.0 0.4 2.7 -1.1 0.8 0.1 2.6 -3.5 0.9 -1.1 3.5 -3.3
397
coefficients for fiscal choice and efficiency are both negative,
while those for finance equity and quality are positive. Hence,
the best discrimination among the states separates those who
favor equalization of resources and an overall increase in the
level of funding from those who would be more willing to reduce
restrictions on local budgets and who see some need to improve
the use of tax dollars.
The distribution of the state respondents is shown in the
middle section of Table 8-3. West Virginia respondents have the
largest positive centroid score, indicating strong embrace of the
equity/quality perspective. Arizonans showed the most negative
centroid, indicating on embrace of the choice/efficiency approach
to finance.
The second, weaker, discriminant function is dominated by
the items related to organization and program. Organizational
choice ("Providing more choices for families a children") has the
largeat coefficient (-.578). It is closely followed by the
program equity item ("Giving more attention to children with
special needs"). Also contributing substantially to this
function is the financial quality item ("/ncreasing the level of
funding for schools"). Contrasting with these three items are
program choice (the item "Increasing program flexibility") and
organizational efficiency ("More efficient school management").
/n essence, thin second function contrasts an emphasis on
traditional school improvement strategies (more money, special
programs, and greater choice for families) with a technical
Page VIII-13
398
managerial approach rooted in program flexibility and better
management.
Illinois and Arizona tend to embrace the technical
approach, while Wisconsin respondents gave groatest support to
the more traditional approach to school improvement.
The state centroids from Table 8-3 are displayed
graphically in Figure 8-3. As shown in the figure, with near
zero centroids on both functions California and Pennsylvania
serve as the hub of the distribution. The other states are
scattered around this hub. West Virginia. indifferent on the
question of how to handle school improvement gives singular
emphasis to financial equity and quality. Illinois shares the
West Virginia finance perspective, but adds a technical
management emphasis. Arizona tends to share the Illinois
management view, but gives strong support to local control over
finances. Wisconsin, being neutral on the finance question and
uniquely embraces the traditional school improvement strategies.
ls located at the bottom of the figure.
Insert Figure 8-3 about here.
Policy Values and Political Cultures
Having noted that the value preferences of our respondents
do vary systematically from one state to another. it seemed
appropriate to test whether these value preferences are related
to the political cultures of the states. As shown in Table 8-4.
Page VIII-14
399
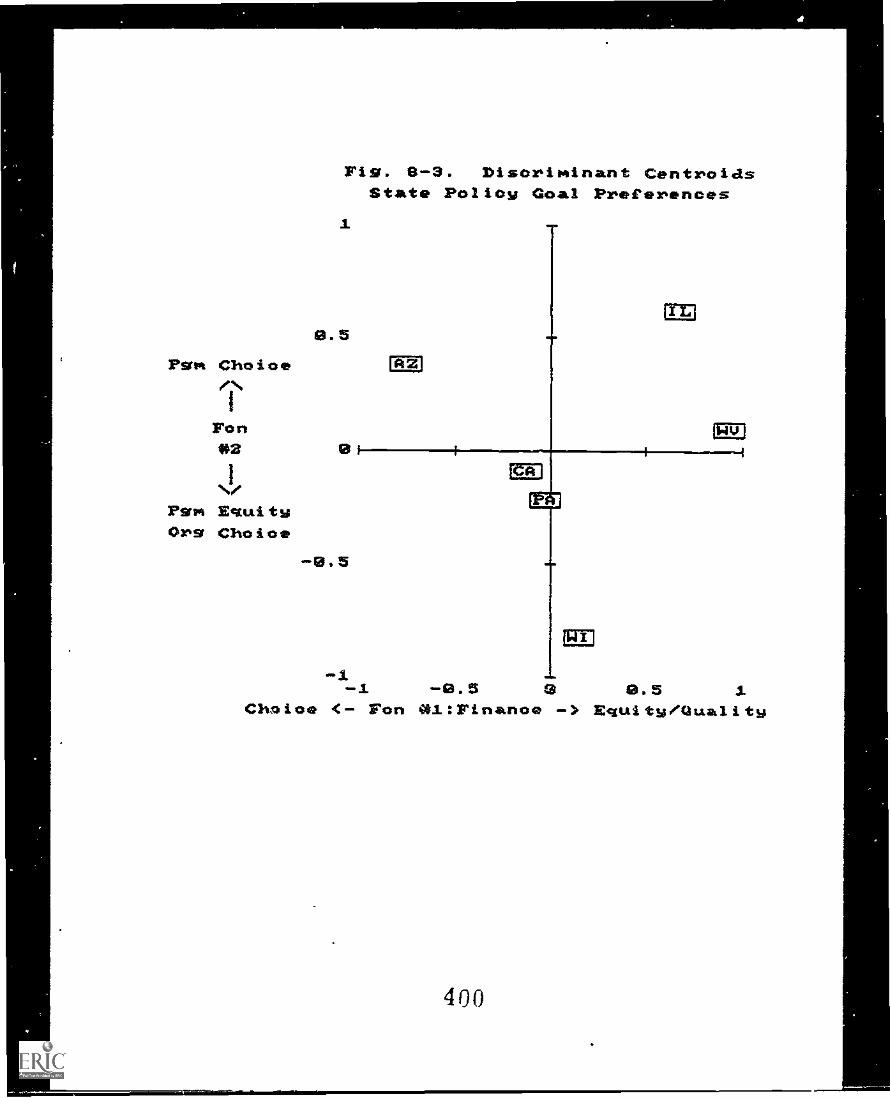
Pam Choice
Fon*3
1N/Psm VaultsOrs Choice
Fig. 6-3. Disoriminant CentroidsState Polices; Goal Preferences
1
9.5
12E1
-1-1 -0.5 e 0.5 1
Choice <- Fon 01:Finance -> Equits/Qualltm
400
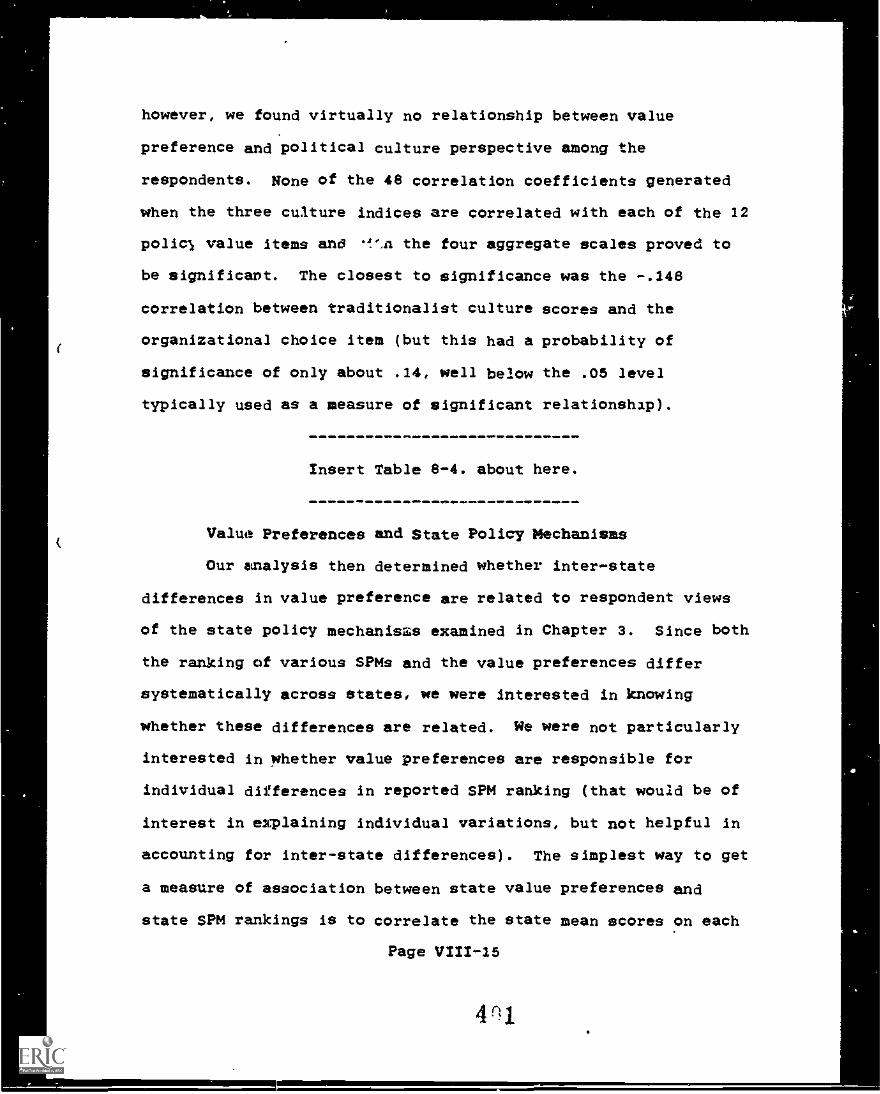
however, we found virtually no relationship between value
preference and political culture perspective among the
respondents. None of the 48 correlation coefficients generated
when the three culture indices are correlated with each of the 12
policl value items and ".',n the four aggregate scales proved to
be significavt. The closest to significance was the -.148
correlation between traditionalist culture scores and the
organizational choice item (but this had a probability of
significance of only about .14, well below the .05 level
typically used as a measure of significant relationship).
Insert Table 8-4. about here.
Value Preferences and State Policy Mechanisms
Our analysis then determined whether inter-state
differences in value preference are related to respondent views
of the state policy mechanisms examined in Chapter 3. Since both
the ranking of various SPMs and the value preferences differ
systematically across states, we were interested in knowing
whether these differences are related. We were not particularly
interested in rhether value preferences are responsible for
individual differences in reported SPM ranking (that would be of
interest in explaining individual variations, but not helpful in
accounting for inter-state differences). The simplest way to get
a measure of association between state value preferences and
state SPM rankings is to correlate the state mean scores on each
Page VIII-15
4,11
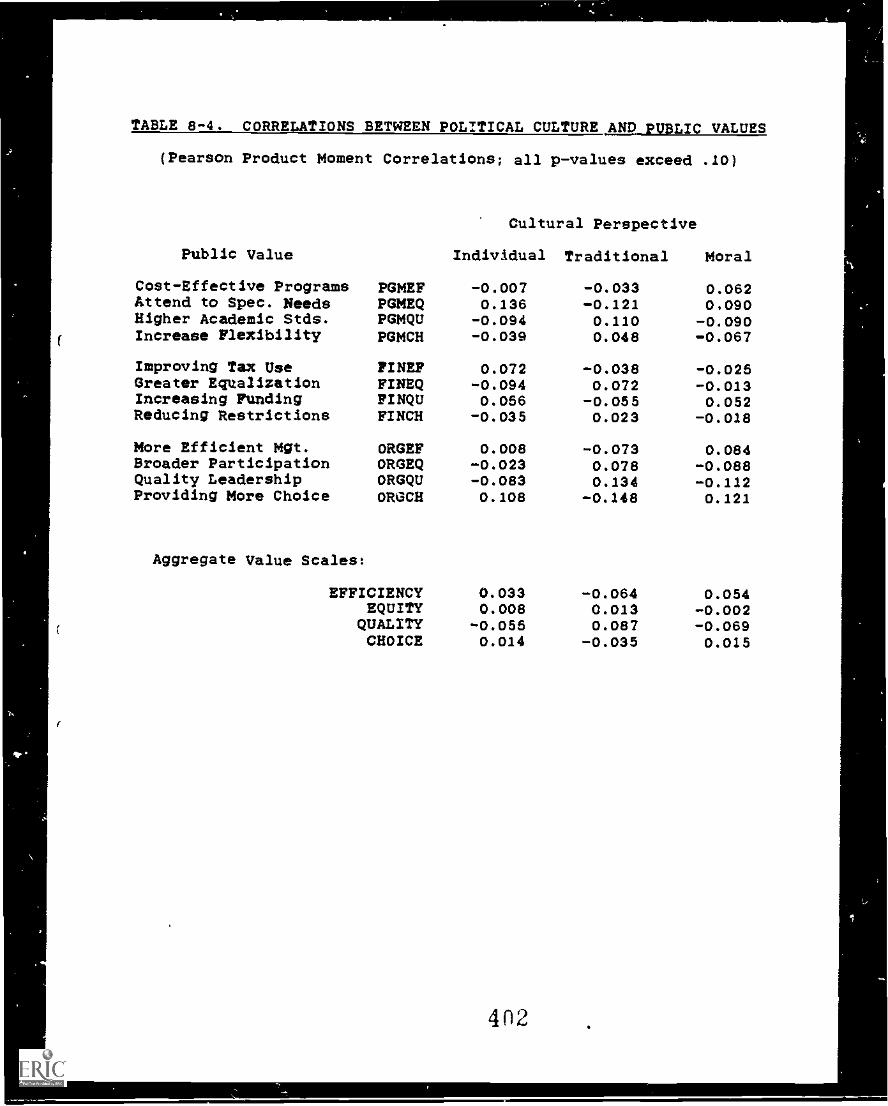
TABLE 8-4. CORRELATIONS BETWEEN POLITICAL CULTURE AND PUBLIC VALUES
(Pearson Product Moment Correlations; all p-values exceed .10)
Public Value
Cultural Perspective
individual Traditional Moral
Cost-Effective Programs PGMEF -0.007 -0.033 0.062Attend to Spec. Needs PGMEQ 0.136 -0.121 0,090Higher Academic Stds. PGMQU -0.094 0.110 -0.090Increase Flexibility PGMCH -0.039 0.048 -0.067
Improving Tax Use FINEF 0.072 -0.038 -0.025Greater Equalization FINEQ -0.094 0.072 -0.013Increasing Funding FINQU 0.056 -0.055 0.052Reducing Restrictions FINCH -0.035 0.023 -0.018
More Efficient Mgt. ORGEF 0.008 -0.073 0.084Broader Participation ORGEQ -0.023 0.078 -0.088Quality Leadership ORGQU -0.083 0.134 -0.112Providing More Choice ORGCH 0.108 -0.148 0.121
Aggregate Value Scales:
EFFICIENCY 0.033 -0.064 0.054EQUITY 0.008 0.013 -0.002QUALITY -0.056 0.087 -0.069CHOICE 0.014 -0.035 0.015
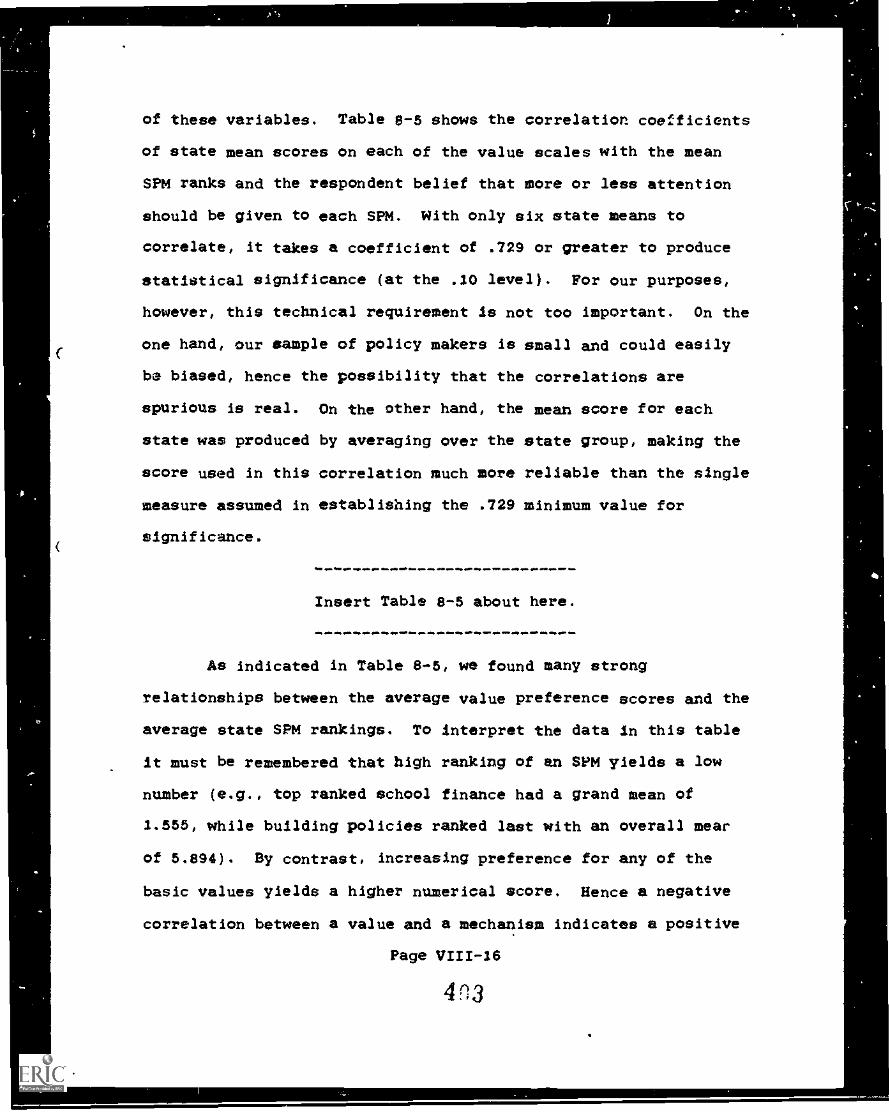
of these variables. Table 8-5 shows the correlation coefficients
of state mean scores on each of the value scales with the mean
SPM ranks and the respondent belief that more or less attention
should be given to each SPM. With only six state means to
correlate, it takes a coefficient of .729 or greater to produce
statistical significance (at the .10 level). For our purposes,
however, this technical requirement le not too Important. On the
one hand, our sample of policy makers Is small and could easily
be biased, hence the possibility that the correlations are
spurious Is real. On the other hand, the mean score for each
state was produced by averaging over the state group, making the
score used In this correlation much more reliable than the single
measure assumed In establishing the .729 minimum value for
significance.
Insert Table 8-5 about here.
As indicated in Table 8-5, we found many strong
relationships between the average value preference scores and the
average state SPM rankings. To interpret the data In this table
lt must be remembered that high ranking of an SPM yields a low
number (e.g., top ranked school finance had a grand mean of
1.555, while building policies ranked last with an overall tear
of 5.894). By contrast, increasing preference for any of the
basic values yields a higher numerical score. Hence a negative
correlation between a value and a mechanism indicates a positive
Page VIII-16
4n3
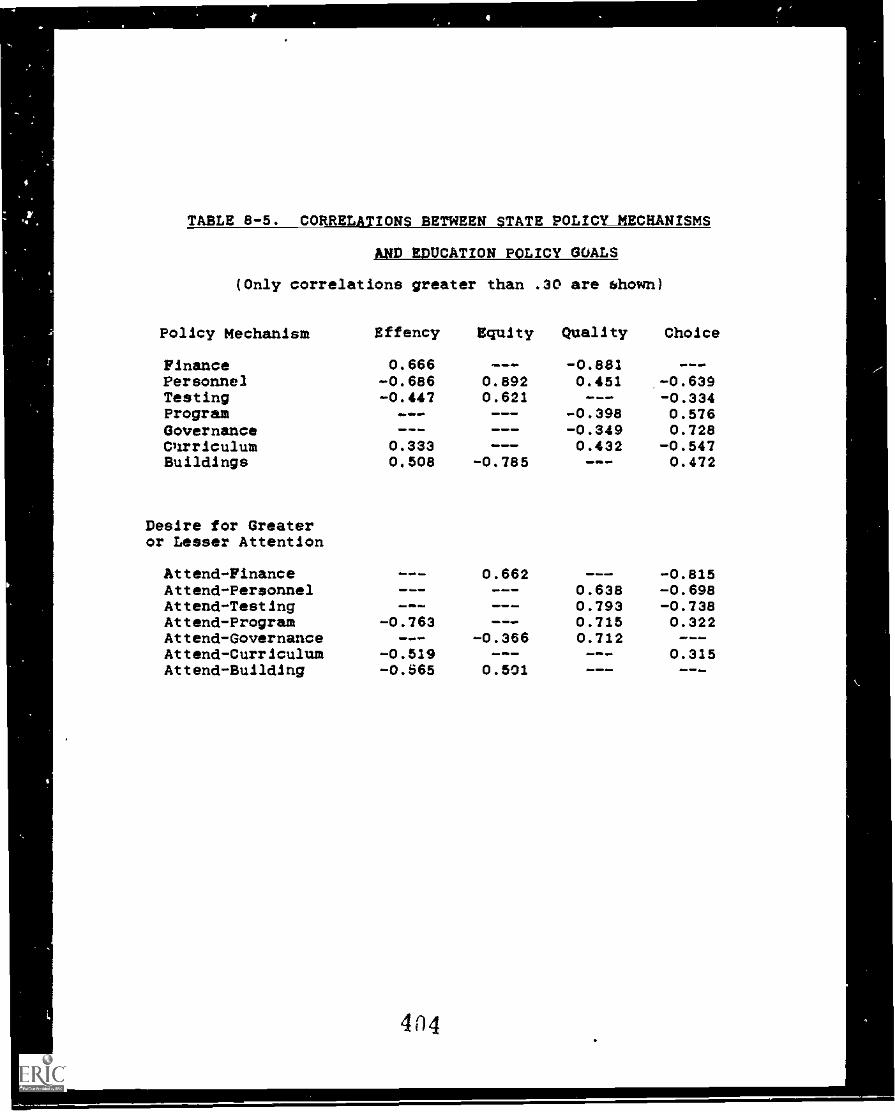
TABLE 8-5. CORRELATIONS BETWEEN STATE POLICY MECHANISMS
AND EDUCATION POLICY GOALS
(Only correlations greater than .30 are shown)
Policy Mechanism
Finance
Effency
0.666
Equity
---
Quality
-0.881
Choice
--_
Personnel -0.686 0.892 0.451 -0.639Testing -0.447 0.621 --- -0.334Program --- --- -0.398 0.576Governance --- - - - -0.349 0.728Cnrriculum 0.333 --- 0.432 -0.547Buildings 0.508 -0.785 --- 0.472
Desire for Greateror Lesser Attention
Attend-Finance --- 0.662 -0.815Attend-Personnel --- wa 0.638 -0.698Attend-Testing --- --- 0.793 -0.738Attend-Program -0.763 --- 0.715 0.322Attend-Governance --- -0.366 0.712Attend-Curriculum -0.519 --- 0.315Attend-Building -0.565 0.501 411m.10.41. 411W
4n4
relationship between rank and value preference; a positive
correlation coefficient indicates the opposite.
Careful review of the correlation coefficients shown in
Table 8-5 indicates that;
/. Finance policies tend to receive more
attention where value preference is pi7en
to quxlity, and less attention when
efficiency is the preferred value.
2. Personnel policies are of greatest
interest where efficiency and choice
values are higher, they move down in
attention as equity and quality values go
up.
3. Testing policy follows the szme pattern as
personnel policy, but is much less
strongly associated with value
preferences.
4. Program definition policy is weakly
related in a positive way with quality
preference, and a bit more negative in
Sts relationship to an emphesis on
choice.
5. Governance policy attention follows the
same pattern as program definition, but
the relationship to choice is even more
negative.
Page V1/1-17
4 (1)-
6. Curriculum materials policy attention is
poritively associated with a choice value
preference and a bit negatively related
to quality and efficiency emphases.
7. Building policy emphasis is an important
consideration in states where equity is
given greater emphasis, it is negatively
associated with efficiency and choice
values.
The correlation coefficients reported in the lower part of
Table 8-5 indicate that greater attention to four policy domains
(testing, program, governance and personnel) is urged in states
whore quality is emphasized. Finance nd building nolicy
attention is emphasized whore equity is the primary concern.
Efficiency and choice values generally lead to a belief that
state attention to various policy mechanisms should be reduced,
rather than increased. An efficiency emphasis loads to a desire
for lowering the emphasis placed on program definition,
curriculum materials and building policies. (Actually, this
means only a lower level of pressure for increased attention to
these policy issues, ince most respondents called for greater
state level attention in all policy domains). Embracing choice
as a value leads to a lowering of concern with state level school
finance, testing and personnel policies, balanced by some
increase in interest in program definition and curriculum
materials development.
Page VI/I-18
4116
To summarize, in states where quality is most strongly
embraced (Illinois and Califcrnia) there is also a stronger than
average tendency to rank school finance as the most prominent
policy mechanism. The opposite is true for states scoring high
on efficiency (Arizona) -- they report the lowest relative
ranking for finance.
The relative ranking of the Personnel Certification and
Training policy mechanism was related to both efficiency and
choice value preferences. Arizonans with the highest efficiency
preference was also highest in attention to personnel issues,
West Virginia, with the lowest choice score was lowest in
personnel policy attention.
The only value to affect the ranking of Student Testing
and Assessment policy was equity. West Virginia's very high
sensitivity to equity questions following a recent court mandate
wela accompanied by the lowest ranking of the testing policy
mechanism. Low interest in equity policy in Arizona was
associated by intense attention to testing and assessment policy.
Pennsylvania and Wisconsin were outliers on this scale -- their
near-zero scores of -.07 and -.71 for equity were associated with
the very high levels of attention to testing and assessment
policy questions.
Program definition, school governance and curriculum
materials policy mechanisms were all related to the choice valu._
preference scores. Interest in curriculum materials was
positively associated with the choice value preference, while the
Page VIII-19
V. 7
program definition and governance mechanisms were negatively
affected by the choice value preference.
Building and facilities policy interest was positively
related to an Interest in equity, but negatively related to
efficiency scores. This relationship was strongly affected by
the West Virginia respondents who ranked building policy as quite
important -- the court having mandated equalization of school
facilities in that state.
Values and Policy Approaches
Table 8-6 presents the correlations between the four
public values and the alternative approaches to policy within
each of the seven broad state policy mechanisms. As In the case
of the SPM rankings and the preferred levels of attention data
shown in Table 8-5, this table has an array of impressively large
correlation coefficients. There Is obviously a strong
relationship between policy preference and value commitment among
across our six state sample. Figure 8-4 summarizes In non-
statistical terms the relationships shown In Table 8-6. The four
value preferences are shown in the columns of the figure, and the
seven state policy mechanisms make up the rows.
Insert Table 8-6 about here.
The cells of Figure 8-4 show how value preferences
affected policy approach preferences across the slx state sample.
The personnel certification and training case was the clearest
Page VII/-20
408
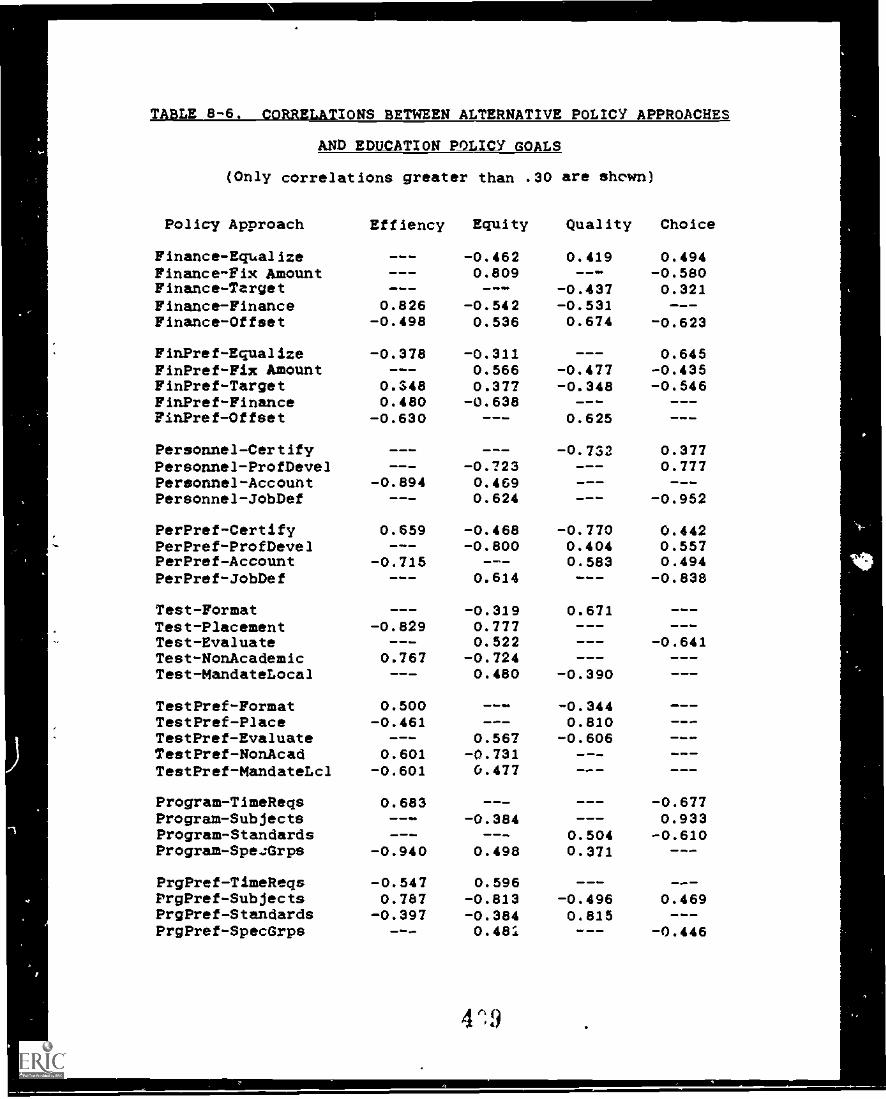
-
TABLE 8-6. CORRELATIONS BETWEEN ALTERNATIVE POLICY APPROACHES
AND EDUCATION POLICY GOALS
(Only correlations greater than .30 are shcwn)
Policy Approach
Flnance-EquallzeFinance-Fix AmountFlnance-TergetFinance -FinanceFlnance-Offset
FlnPref-EqualizeFlnPref-Fix AmountFlnPref-TargetFlnPref-FlnanceFinPref-Offset
Personnel-CertifyPersonnel-ProfDevelPersonnel-AccountPersonnel-JobDef
PerPref-CertifyPerPref-ProfDevelPerPref-AccountPerPref-JobDef
Test-FormatTest-P1acementTest-EvaluateTest-NonAcademlcTest-MandateLocal
TestPref-FormatTestPref-PlaceTestPref-EvaluateTestPref-NonAcadTestPref-MandateLc1
Program-TlmeReqsProgram-SubjectsProgram-StandardsProgram-SpezGrps
PrgPref-TimeReqsPrgPref-SubjectsPrgPref-StandardsPrgPref-SpecGrps
Efflency
0.826-0.498
-0.378
0.3480.480
-0.630
-0.894
0.659
-0.715
110-0.829
0.767
0.500-0.461
0.601-0.601
0.683.111.
-0.940
-0.5470.787
-0.397
Equity
-0.4620.809
-0.5420.536
-0.3110.5660.377
-0.638
=11.-
-0.7230.4590.624
-0.468-0.800
0.614
-0.3190.7770.522
-0.7240.480..0.567
-0.7310.477
-0.384
0.498
0.596-0.813-0.3840.481
Quality
0.419Migee.
-0.437-0.5310.674
IMP
-0.477-0.348
0.625
-0.732
01.0.
-0.7700.4040.583
0.671Ime ..
-0.390
-0.3440.810
-0.606VW WO. CO
0.5040.371
-0.4960.815
Choice
0.494-0.5800.321
-0.623
0.645-0.435-0.546
111..010
0.3770.777
-0.952
0.4420.5570.494
-0.838
- -gi
-0.641,011.41MON
0.10
-0.6770.933
-0.610
0.469
-0.446
4 ", .9
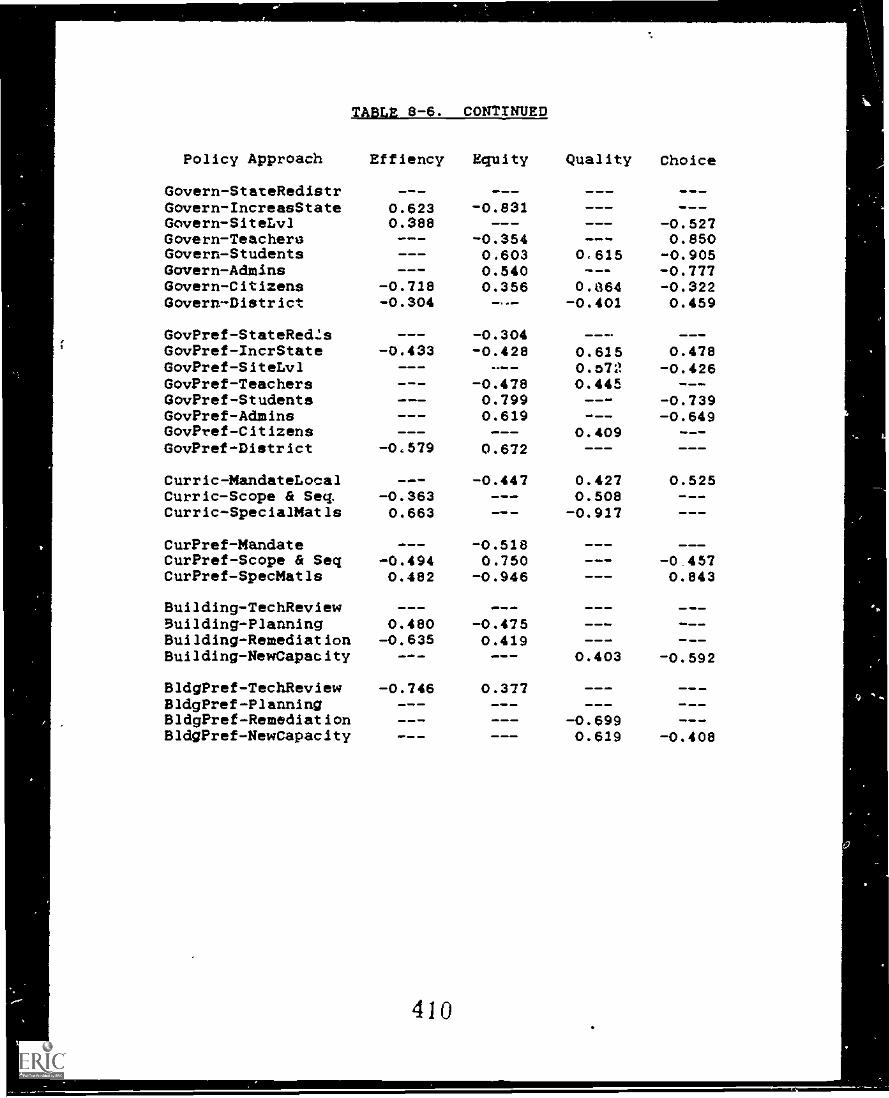
TABLE 8-6. CONTINUED
Policy Approach
Govern-StateRedistrGovern-IncreasStateGovern-SlteLvlGovern-TeachersGovern-StudentsGovern-AdmInsGovern-CltlzensGovern-Dlstrlct
GovPref-StateRedZsGovPref-IncrStateGovPref-SlteLvlGovPref-TeachersGovPref-StudentsGovPref-AdmlnsGovPref-CltlzensGovPref-Dletrlct
Currlc-MandateLocalCurrlc-Scope & Seq.Currlc-SpeclalMatls
CurPref-MandateCurPref-Scope & SeqCurPref-SpecMatls
Bulldlng-TechRevlewBulldlng-PlannlngBulldlng-RemedlatlonBulldlng-NewCapaclty
BldgPref-TechRevlewBldgPref-PlannlngBldgPref-RemedlatlonBldgPref-NewCapacIty
Efflency
=111.111,
0.6230.388
-0.718-0.304
-0.433411m.m.
-0.579
-0.3630.663
-0.4940.482
0.480-0.635
MON..
-0.746mllo4110110. =ID
41101=11
Equity
-0.831
-0.3540.6030.5400.356
-0.304-0.428
-0.4780.7990.619
0.672
-0.447
-0.5180.750
-0.946
MID .0
-0.4750.419
0.377
110. ..
..411mme
Quality
....M. 'Pm
0,615
0.864-0.401
0.6150.3720.445
0.409
0.4270.508-0.917
.. .11
..0.403
_ --0.6990.619
Choice
.01.01
-0.5270.850-0.905-0.777-0.3220.459
.111m
0.478-0.426
-0.739-0.649
0.525=1,
-0.4570.843
-0.592
MlnIMP ..
mllo
-0.408
410
demonstration of relationship between value preferences and
policy approach priorities. Of the four alternative approaches
identified in our early interviews and offered to respondents for
analysis, one was positively related and one was negatively
related to each of the four value preferences. Efficiency
oriented states embraced the accountability approach to personnel
and rejected pre-service training and certification. Equity
oriented states endorsed the professional development approach to
personnel while rejecting re-definition of teacher jobs. The
higher the level of preference for quality, the more states take
a pre-service training and certification approach to personnel
policy, while rejecting accountability strategies. And choice
oriented states emphitsized the need for re-definition of teacher
jobs and rejected the professional development approach.
It is especially important to note that there is a strong
symmetry between the efficiency and quality value preferences and
between the equity and choice perspectives. Quality oriented
states embrace improved teacher training, but are not sanguine
about accountability policies; the reverse is true where
efficiency is the dominant value. Equity orientations accept
what choice enthusiasts reject -- professional development. They
reverse positions on teacher work role changes. As important as
the symmetric lines of disagreement are, it is perhaps even more
important to realize that the data indicate that equity and
choice oriented policy makers will talk past rather than confront
directly those with quality or efficiency orientations. Such a
Page VIII-21
411
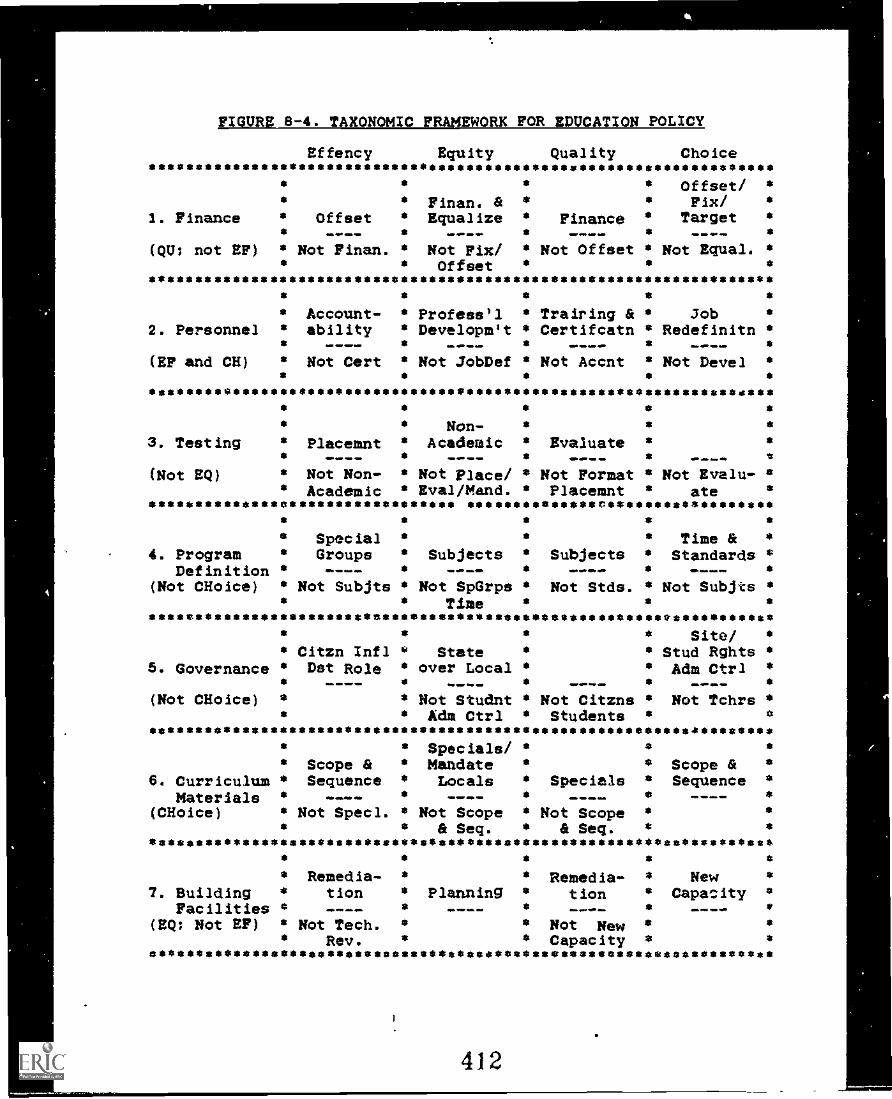
FIGURE 6-4. TAXONOMIC FRAMEWORK FOR EDUCATION POLICY
Effency Equity Quality Choice* ******************************************************************
* 0 * * Offset/ *
* * Finan. & * * Fix/ 0
1. Finance * Offset * Equalize * Finance * Target 0
* ___ * ---- * ---- * ---- 0
(QU; not EP) * Not Finan. * Not Fix/ * Not Offset * Not Equal. *it * Offset * *
******************************************************************** * * * *
O Account- * Profess'l * Trairing & 0 Job *
2. Personnel * ability * Developm't * Certifcatn Redefinitn ** * * * *
(EP and CH) * Not Cert * Not JobDef * Not Accnt * Not Devel 0
* * 0 0 0*******************************************************************
* * * ** * Non- * * *
3. Testing * Placemnt * Academic * Evaluate * ** S0 * e * ---- *
(Not EQ) 0 Not Non- * Not Place/ * Not Format Not Evalu- ** Academic * Eval/Mand. * Placemnt * ate *
********************************* **************0******************* * * *
* Special * * * Time & *
4. Program * Groups * Subjects * Subjects * Standards *Definition * ---- * ---- * ---- * ---- 0
(Not CHoice) * Not Subjts * Not SpGrps * Not Stds. * Not Subjts 0O * Time * * *
******************************************************************** * * * Site/ 0
O Citzn Infl * State * * Stud Rghts *5. Governance * Dst Role * over Local * * Adm Ctrl *
* ---- * ---- * ---_ * ---- *
(Not Mice) * * Not Studnt * Not Citzns * Not Tchrs ** * Ada Ctrl * Students * *
* ******************************************************************* * Specials/ * * *
* Scope & * Mandate * * Scope & *
6. Curriculum 0 Sequence * Locals * Specials Sequence *
Materials * ---- * ---- it ---- ---- *
(CHoice) 0 Not Specl. * Not Scope * Not Scope * *
* * & Seq. * 6 Seq. * *
*******************************************************************
* Remedia- * * Remedia- * New *
7. Building * tion * Planning 0 tion 0 Capaizity *
Facilities * ---- * ---- 0 ---- * ---- *
(EQ; Not EP) * Not Tech. * 0 Not New* Rev. * * Capacity *
*******************************************************************
412
lack of direct argument offers marvelous opportunities for
compromise and coalition building within the policy system -- it
also creates the optimum conditions for misunderstanding and
feelings of betrayal.
A quick review of the entries in the other rows of Figure
8-2 will confirm that the lines of disagreement found in the
personnel policy domain are not consistent across the other
policy arenas. Finance policy approaches do generally follow the
personnel pattern -- efficiency preferences support the
offsetting burdensome costs approach and lead to a rejection of
the financing of particular school functions. A quality
preference leads to the reverse -- support for financing
particular functions and rejection of the offsetting approach.
Equity and choice value preferences also tend to be symmetrical,
especially when it comes to the issue of equalization financing
and fixing the total amount of education funding at the state
level. An equity preference does, however, also lead to support
for the financing of particular school functions -- a place where
equity and quality oriented policy makers can agree.
In the student testing area symmetrical disagreement is
more sharply seen in the differences between efficiency and
equity value preferences than between efficiency and quality.
Equity values lead to support for non-academic testing, and
rejection of using tests to place students. Efficiency value
preferences reverse these approach priorities. Quality oriented
policy makers emphasize program evaluation uses of student tests
Page VIII-22
413
,a4k
-- a position rejected by both choice and equity oriented value
preferences.
In the program definition area, equity and quality value
preferences team up in opposition to both efficiency and choice
value orientations on the question of whather states should
mandate particular school subjects. Equity and efficiency
preferences lead to conflict over the virtues of mandating
programs for special groups -- surprisingly the equity oriented
respondents dld aot feel that this was a desireable way of
fulfilling their values.
In the area ef governance, a quality value preference dld
not lead to the embrace of any particular governance approach,
but was associated with a rejection of enhanced citizen influence
or an emphasis on students rights and responsibilities. Enhanced
teacher authority was rejected by those who embraced a choice
value position. As might be expected equity values lead to an
embrace of state over local authority.
In the curriculum materials domain efficiency and choice
preferences ferm a common interest in the specification of scope
and sequence of local school curricula. Equity and quality
oriented policy makers both reject thls approach. Quality
preferences lead to support for the development of specialized
materials, while equity preferences support this approach and
state mandates to local districts.
Efficiency and quality value preferences lead to support
for a building policy approach involving remedlatlon of
Page VIII-23
, 4 1 4
architectural problems. The development of new building
capacities is positively related to choice, but negatively
associated with a quality preference.
Conclusion
This chapter has examined the role of public value
preferences in shaping state level education policies. Data on
value preferences were gathered from 140 policy makers in the six
sample states by asking them to complete a semantic differential
type questionnaire pairing policy problems in each of three broad
domains of school action: educational programs, finance, and
school organization or governance. Scales of relative respondent
preference for quality, efficiency, equity and choice values was
constructed by summing across these three broad domains of
action.
Analysis of the value preference data indic ted that, for
the 1980s, educational quality considerations substantially
outweigh all other values. Attention has definitely shifted away
from the equity considerations that dominated policy during most
of the last uarter of a century. Across the six sample states
we found significant differences in value orientation, and tested
whether those differences were related to state political
cultures, the level of attention to various state policy
mechanisms, and/or the amount of attention given to apec1f1c
approaches within each of the seven basic policy mechanisms.
No relationship between value preferences and political
culture was found, but a number of strong relationships between
Page VIII-24
values and the attention given to specific policy mechanisms and
alternative approaches were idemified and explored. A 4 by 7'
matrix presented in Figure 8-4 summarizes the overall
relationship between public values and the amount of attention
given to various policy approaches.
As will be elaborated in more detail in the concluding
chapter of this report, we see this matrix as the basic framework
for developing a state education policy taxonomy -- one in which
four basic public values intersect with seven core mechanisms of
control to create alternative approaches to policy development.
Tbe resuiting approaches create a complex arid fluid basis for
conflict and coalition development within tbe policy making
process. To the extent tbat this matrix of options captures the
most important education policy proposals being debated by state
policy makers, it deserves a full and rigorous test of as a
framework for describing and explaining differences between state
policy systems and for analyzing the effects of particular policy
actions.
Page VIII -28
4 16
a
(
CRAPTER IX
INFLUENCE, POWER AND POLICYMAKING PROCESSES
Although many people participate ln the making of education
policy, influence over final decisions is far from evenly
distributed among them. Moreover, variation in the distribution -f
influence are affected as more by historical circumstances and the
work of particularly effective individual policymakers as bY
differences in constitutional authority or formal organizations.
Since policies emerge through the efforts of various actors to
incorporate specific values into authoritative state actions
guiding school activities, the dynamics of state education
policymaking can be better understood lf the unique patterns of
power and influence distribution In each state are closely
examined.
Influence distribution ls complex, of course. Some individuals
or groups strongly influence a few decisions. Others have less
influence on any particular decision, but are routinely involved
across a broad range of issues. Nevertheless, the current
distribution of influence in any state policy system is a matter of
intense interest to all the participants -- most policymakers are
able to comfortably discuss the relative influence of a wide range
of other key players. Hence we undertook a straightforward
assessment of policy influence in each of our sample states through
the simple but effective devire of asking earn respondent to rate
Page IX-1
417
the influence of various key actor groups in his/her state. The
seven point scale shown in Appendix 5 was used.
An initial list of policy actors likely to te Involved in
education policymaking was developed through a review of previous
literature (see, e.g., Furhrman and Rosenthal, 1982; Milstein and
Jennings, 1976; Iannaccone, 1967; Wirt and Kirst, 1982; Mitchell,
1981). This list was then augmented on the basis of first round
interview reports with key actors in each state.
Mean influence ratings reported by the entire sample reveal the
underlying pattern of influence coamon to all six states -- thus
providing a national perspective on the question of who makes
education policy decisions. After examining the data from this
national perspective, the main body of this chapter reports on the
unique characteristics of policy influencet in each of the six
sample states.
Education Policy Influence: The Rational Perspective
Table 9-1 reports the mean influence rankings for 17 different
key actor groups. It shows sharp differences in the reported
influence of these groups, confirming the common perception that
participants in state policy systems have little difficulty
assessing the relative Influence of other actors.
Insert Table 9-1 about here.
As suggested In Table 9-1 (and displayed grarhically in Figure 9-
1), key actor groups with similar mean influence ratings fall into
Page IX-2
418
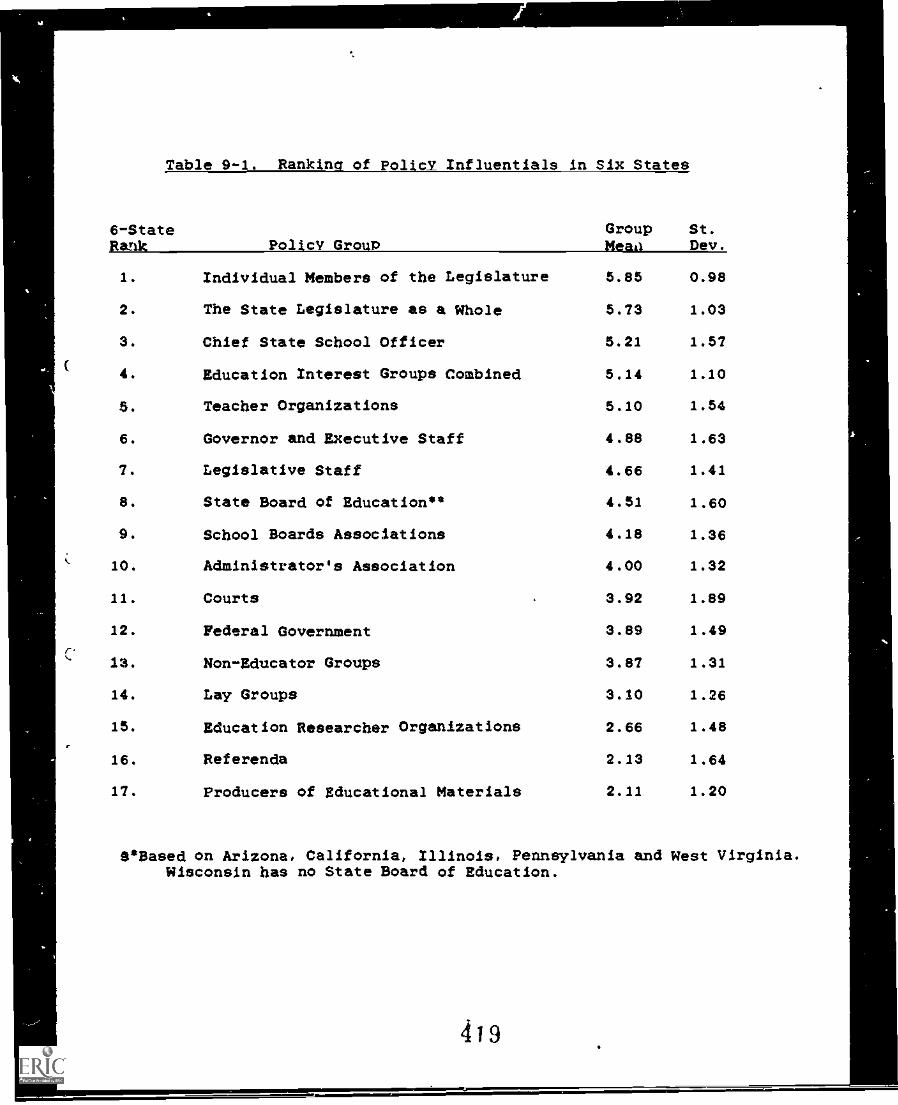
6-StateRank
Table 9-1. Rankina of FolicY Influentials in Six States
St.Dev.Policy GrouP
GroupMeaa
1. Individual Members of the Legislature 5.85 0.98
2. The State Legislature as a Whole 5.73 1.03
3. Chief State School Officer 5.21 1.57
4. Education Interest Groups Combined 5.14 1.10
5. Teacher Organizations 5.10 1.54
6. Governor and Executive Staff 4.88 1.63
7. Legislative Staff 4.66 1.41
8. State Board of Education's 4.51 1.60
9. School Boards Associations 4.18 1.36
10. Administrator's Association 4.00 1.32
11. Courts 3.92 1.89
12. Federal Government 3.89 1.49
13. Non-Educator Groups 3.87 1.31
14. Lay Groups 3.10 1.26
15. Education Researcher Organizations 2.66 1.48
16. Referenda 2.13 1.64
17. Producers of Educational Materials 2.11 1.20
AsBased on Arizona, California, Illinois, Pennsylvania and West Virginia.Wisconsin has no State Board of Education.
419
six meaningful clusters. The members of each cluster have roughly
comparable levels of overall involvement in education policy
development. Although individual states vary (sometimes quite
markedly), this national consensus regarding policy influence was
widely recognized by respondents. Where respondents in one state
rated the influence of a particular actor group substmntially above
that shown in the table, interview data provided a ready
explanation of the reasons for this deviation.
Insert Figure 9-1 about here.
In all but one case,mean scores for all members of each of the
six cluster groups differed significantly from all members of the
other five clusters (i.e., yield paired t-test probability values
lees than .01). Thus, in each case the most Influential member of
the lower cluster has significantly less influence than the least
influential member of the cluster above it. The one exception to
this general rule is the separation between the three groups in the
cluste :. we call the "inner circle" (the chief state schOol
officers, teacher organizations, and the coalition of all education
interest groups combined) and those in the "outer circle" cluster
(the governors and their executive advisors, legislative staffers,
and the state boards of education). The lower two groups in the
"outer circle" (legirlative staff and state boards of education)
are ranked significantly lower than all members of the "inner
circle," but the mean score for the governor and his advisors is
Page IX-3
420
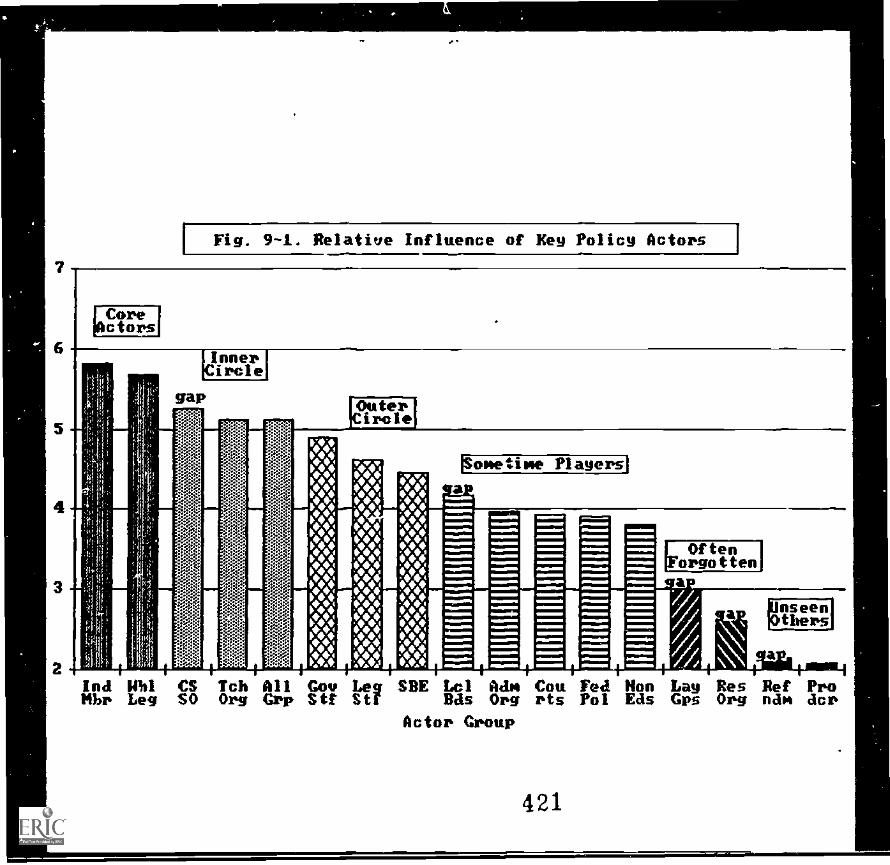
only significantly lower than that for the CSSOs. Hence it is
appropriate to think of the governor and executive staff as a
transitional group, closer to the inner circle than the legislative
staff and state board, but still not among the most influential
participants.
The Core Actors
State legislators, individually and taken as an organizational
. unit, are the ultimate insiders in education policy. With a mean
rank of 5.82 on the seven point scale used to rate all groups,
individual members of the legislature were reported to have the
strongest voice in policymaking. Just below these prominent
individual legislators came the institutional rating for the
"Iegiolature as a whole."
The four states that rated individual legislators highest (AZ,
PA, WV, WI) confirm the early finding by Wahlke, et al (1962) that
legislative policy is disproportionately controlled by
"specialists" -- legislators who concentrate on a particular policy
area and earn the respect (and thus the voting support) of other
legislators. These specialists have the power to affect a broad
range of education policy decisions, including budget allocations
and school improvement strategies. In interviews, Pennsylvania
respondents exemplify this respect for individual legislators by
repeatedly reporting that the 20-year veteran chair of the House
Education Committee was the single most powerful individual in the
policy system -- able to "make or break" nearly any policy proposal
in which he took and active interest.
Page IX-4
4 2 2
While the legislature as a whole was frequently called a "super
school board," respondents obviously recognized'that most
legislators devote only sporadic attention to education. The
legislatures immense obvious power Is wielded by a relative handful
of its members.
The Inner Circle
Three actor groups constitute a powerful "Inner circle." With
mean ratings about a half point lower than the legislative actors,
these groups generate most of the substantive proposals presented
to the legislatures for action.
The chief state school officers (CSS0s) are at the top of this
second-echelon group. Though ranked third overall, CSSO ratings
varied sharply from one state to another. In Wisconsin and West
Virglnia, for example, the Chiefs were given very high ratings --
well above the legislators. In Illinois, by contrast, the Chief
was ranked lith, behind federal policy, non-educator interest
groups and the courts.
In Pennsylvania, where he was viewed as the governor's education
advisor, the CSSO was ranked third, right after the governor.
California's CSSO is a constitutional officer, commanding a
constituency of his own. Typically, CSSOs exercise control by
building an expert staff. Departmental staff are typically full
time, long term professionals who develop power based on their
experience and expert knowledge. Their Influence Is less flashy
and obvious than that of legislators or governors who must show
Page IX-5
423
results to a constituency to get re-elected, but it is often just
ss effective.
The wide range in the CSSO rankings across the six state sample
suggests that there are important differences in the perception of
the CSSO. Presumably the CSSO and the SDE staff are the policy
group with full-time, legitimate, expert and authoritative
responsibility for managing education policy for the state. In
most states, however, this group is upstaged by the newly powerful
full time legislators who are lAcreasingly supported by their own
full time, expert staff dvisors.
Teacher organizations and the coalition of "all education
Interest croups combined" are the second and third luczabers of the
Inner circle. The political activities of aggressive teacher
organizations have clearly succeeded in distinguishing them as the
most influential professional Interest group. They typically
outrank local school boards associetions, administrator
organizations and lay groups (such as the PTA) by a wide margin.
In Illinois and Wisconsin, teachers are viewed as extraordinarily
powerful -- outranking the legislature itself In those states. on
the other hand, they were noticeably ineffective in Arizona, where
they ranked IIth in overall influence -- well behind the local
school boards association which is clearly an Important player in
this state.
Though teachers are uniquely powerful, respondents recognized the
independent significance of coalition behavior by key professional
interest groups. Where the interest groups are divided it is very
Page 1X-6
424
difficult to get proposals made by any one of them through the
legislature. In five of onr Six states, the coalition of key
interest groups was Identified as ranking well &Jove average in
influence. Only Arizona, where non-professiontl groups dominate,
was coalition behavior seen to be relatively unimportant (see the
discussion of individual state systems, below).
The Outer Circle
The next three groups make up a cluster we have labeled the
"outer circle." These three groups -- the governor and his
advisors, the legislative staff, and the state boards of education
-- have mean scores between 4.0 and 5.0 and are clearly seen as
Important, if less powerful, participants in the policy process.
The_governors, as noted above, were ranked clocest to the inner
circle, differing significantly only from the CSSOs. This
difference Is a bit misleading, however. In three of our sample
states the governors were actually ranked somewhat above the chiefs
(the overall low rank for governors resulted from a decisively
lower ranking in the other three states). The governors belong to
the outer circle, however, because they typically take a relatively
narrnw interest in education issues. As Campbell and Mazonni
(1975) noted more than a decade ago, governors typically focus
their attention almost entirely on Issues of school finance (the
most prominent, but certainly not the only education policy
mechanism). The reform movement of the 1950s has broadened that
Interest in many executive offices, however. Education agenda
setting and program development work are very visible in some
Page IX-7
425
governors' offices today. Indeed, the National Governors
Association has given education a prominent place in its policy
planning activities for 1966.
It is not clear whether the recently expanded activism of
governors will last. Historical data suggest that it wil1 not
Since they have responsibility for the full range of public
services, governors will probably only give attention to education
issues as long as they remain highly salient to major political
constituency groups. It is possible, however, that the interest in
the governors office will remain focused on '-ducation fo a long
time. Teacher organizations are now, like industrial unions in the
1940s and 60s, important political constituencies whose persistent
attention to the golrernors political leadership can be expected.
Moreover, changing worked economics may force the current round of
educational reform and improvement to become a sustained national
concern -- perhaps as prominent as support for cientific research
or transportation services have been for the 40 years since World
War II.
Legislative staffers are the middle group in the outer circle.
For this group influence is not lted by the scope of their
attention -- which covers the full range of education policy
concerns. Rather staff influence is lted by the fact that they
are formally subordinate to the elected members of the legislature.
We were a bit surprised by the extent of the reported difference
between the staff and the members, and suspect that the staff
influence has been under reported by respondents who honor the
Page IX-6
426
formal position of the legislators rather more than is warranted by
the facts.
In many cases we observed staffers diplomatically allowing
legislators to take the lead and the credit for answers and
insights while they, the staffers, formulated the answers and
provided the information. Thus, the ranking of the staffers MAY
be, at least partially, a tribute to their skill at remaining
unobtrusive.
The state boards of education have the lowest ranking of any of
the formal state policy groups. Professional interest groups and
legislative staffers -- groups without constitutional authority and
consisting of individuals hired to inform and influence
policymaking were reported to have significantly higher power
than the typical SBE.
Wisconsin is the only state without an SEE, so we could learn
about possible reasons for the low ranking of board iafluence from
observations in that state. Among the remaining five states, two
observations seem to account for the relatively meager influence of
the SBEs. First, SBEs are more influential in the smaller states
with less well supported legislative staffs (AZ and WV). They are
weakest in large populous states with strong legislative staffs (CA
and IL). Second, except for Arizona, there appears to be a
positive correlation between SBE Influence and that attributed to
the CSSO. This suggests that the influence of these two actor
groups may be mutually reinforcing (not a zero-sum distribution of
a fixed total amount of influence). IL may be, therefore, that If
Page IX-9
427
a Chief ignores the board it leads to a reduction in influence for
them both. Similarly, SBEs that seek to wrest power from the chief
and the department may claim a wholly pyrrhic victory -- succeeding
only in reducing the total authority available to them both.
The Sometime Players
Separated from the outer circle by a statistically significant
gap in their overall influence are five policy actor groups we have
called the "sometime players". These groups were quite effective
on some issues and in some states, but were noticeably weak in
others.
State associations of local school boards were the most
frequently noticed members of this cluster. They ranked ninth in
overall influence -- putting them in the middle of the 17 groups
ranked. Arizona and Wisconsin school boards association ranked
significantly higher than the six-state average; the West Virginian
Association was viewed as significrantly weaker (see state by state
discussion below).
Administrator organizations were ranked next with an overall mean
rating of 3.97. Administrators were notably strong in California
and Pennsylvania, but even at their strongest, the administrators
were viewed as less powerful than teacher groups.
The courts and federal_Rolicv ranked eleventh and twelfth.
respectively. The position of the courts was particularly varied.
West Virginia and California, having been recently mandated by the
judiciary to revise school policy $n the interests of equal
opportunity reported particularly powerful court influence. West
Page IX-l0
428
Virginia ranked the courts as the single most powerful agency --
above the legislature and the CSSO.
Pennsylvania subjects frequently commented that the courts had
been a major influence in the past, but were no longer, One
explained, "We haven't had a court decision affecting us In a
while." CPA,2,71. But polIcymakers' choices, particularly in
school finance policy, were made with clear knowledge of previous
court decisions. Court decicions influenced and constrained policy
choices but policy actors did not recognize the influence when it
was subtle.
An anti-court view that "we take care of ourselves" was
graphically articulated in the 1985 State of the State address by
Governor Arch Moore of West Virginia. His words on education
dramatically stated that West Virginians know how to manage their
schools without the unwelcome interference of the court. These
words were met mdth the trongest applause of the evening.
The range of scores tor federal policy was somewhat narrowfr, but
Wisconsin respondents rated it especially low; Arizona and West
Virginia especially high. Part of this variation is ideological --
conservative and individualistic feelings in the latter two states
raise sensitivity to federal incursions into education, while
moralistic support for an activist central government in Wisconsin
causes these policymakers to vlew similar federal action as less
intrusive.
Speaking of federal influence, a Pennsylvania staffer said:
"Federal is ranked pretty low now. I give It a high ranking when
Page /X-11
429
talking about special educations but generally it's a lowerrating." fPA.2.71.
Finally, non-educator interest groups (taxpayer associations,
business round tables, etc.) round out the sometime players
cluster. Arizona respondents give these groups especially high
aarks. Interviews confirmed that a taxpayer group (the Arizona Tax
Research Association) and a civic elite group known as the *Phoenix
40* were responsible for these high ratings. Both groups have
introduced and actively supported education policy proposals.
The Often Forgotten
Two groups we came to call the *often forgotten*, because they
occasionally have quite dramatic Impacts on particular issues, but
are rarely mentioned as active participants in the policymaking
process.
Lay groups associated with the schools (PTAs, advisory councils,
etc.) are clearly the neglected step-children among those whose
interests are initially affected by state policy. In MO state were
these groups reported to be as influential as non-educator groups
(though they were seen as stronger than the administrator
associations in Arizona, and stronger than the state board in
California.
Statistically weaker even than the lay interest groups are
research organizations (universities, regional laboratories, etc.). '
In West Virginia. however, researchers were reported to be notably
influential -- outranking lay interest groups and even the local
school boards association.
Psge IX-12
430
One policymaker in that state recalled the old days of making
projections of impact of school finance proposals by hand and
education reports and recommendations wIth no supporting data. He
commented on the impact of surveys and computer tatistical
analysis printouts as having marked "our turning from being natural
philosophers to scientists" VA,1,21. A Pennsylvania respondent
said that computer printouts had wrought tremendous change in
education policymaking. The facility to have immediate projections
of school district/legislative district impact on every education
policy proposal led to "policymaking by printout" (PA,2,26].
The Unseen Others
The last two influence sources (popular referenda and lobbying by
procedures of education products) we called the "unseen others"
because their influence was rarely reported to be of any
significance. California respondents, reflecting the unique
history of this state reported referenda to be moderately
important, outranking lay groups and the SHE. Producer groups were
most frequently recognized as important in Arizona.
In sum, from a national perspective education policy influence is
concentrated in the hands of state legislators and an inner circle
made up of the chief, teacher organizations and the coalition of
education interest groups worklisg together. An outer circle,
noticeably less powerful, but typically consulted consists of
governors, legislative staff and state boards of education.
Sometimes players in the policy formation process include local
boards associations, administrator groups, the courts, federal
Page IX-13
431
policy mandates and a variety of non-educator political interest
groups. Lay groups and researchers are often forgotten, but are
occasionally quite important. Unseen and rarely recognized as
important are popular referenda and producers of education
products.
ft turn now to a brief look at the influence patterns in each
state in order to highlight the unique character of each state and
note waya in willch state patterns deviate from the national
perspective just described.
Influence in the States
ARIZONA: A weak inner circle, strong lay influence.
The mean scores for key actor group in Arizona are presented
graphically in Figure 9-2 with a profile for all states shown as a
line on the graph (the numerical data is in Table 9-2). Two
generalizations about the Arizona policy system are suggested by
this figure. First, Arizona has a relatively weak "Inner circle."
Arizona legislature is even more powerful than its counterparts in
other states, while the teacher organizations, special interest
coalition and governor's staff are less influential than those in
other states.
Insert Figure 9-2 about here.
Insert Table 9-2 about here.
Page IX-14
432
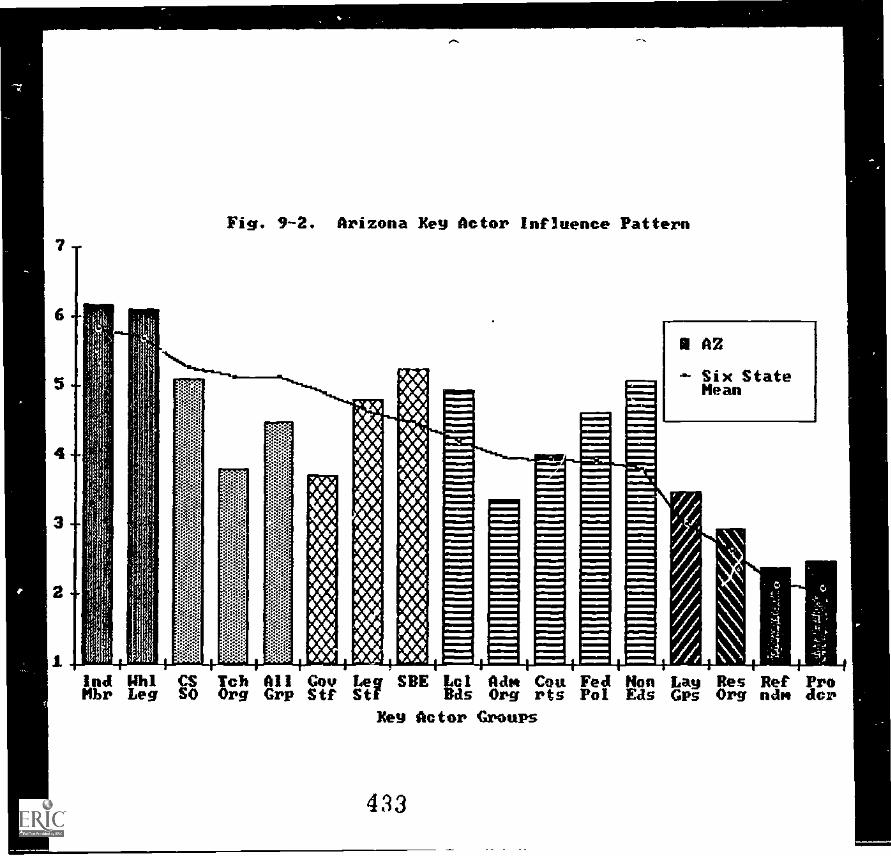
Fig. 9-2. Arizona Xey Actor Influence Pattern
Ind Uhl CS Tch All Gov Leg SEE Lc1 Ade, Cou Fed Non Lay Res Ref ProMhr Leg SO Org Grp Stf Stf Eds Org rts Pol Eds Grs Org who dcr
Xey Actor CVOUPS
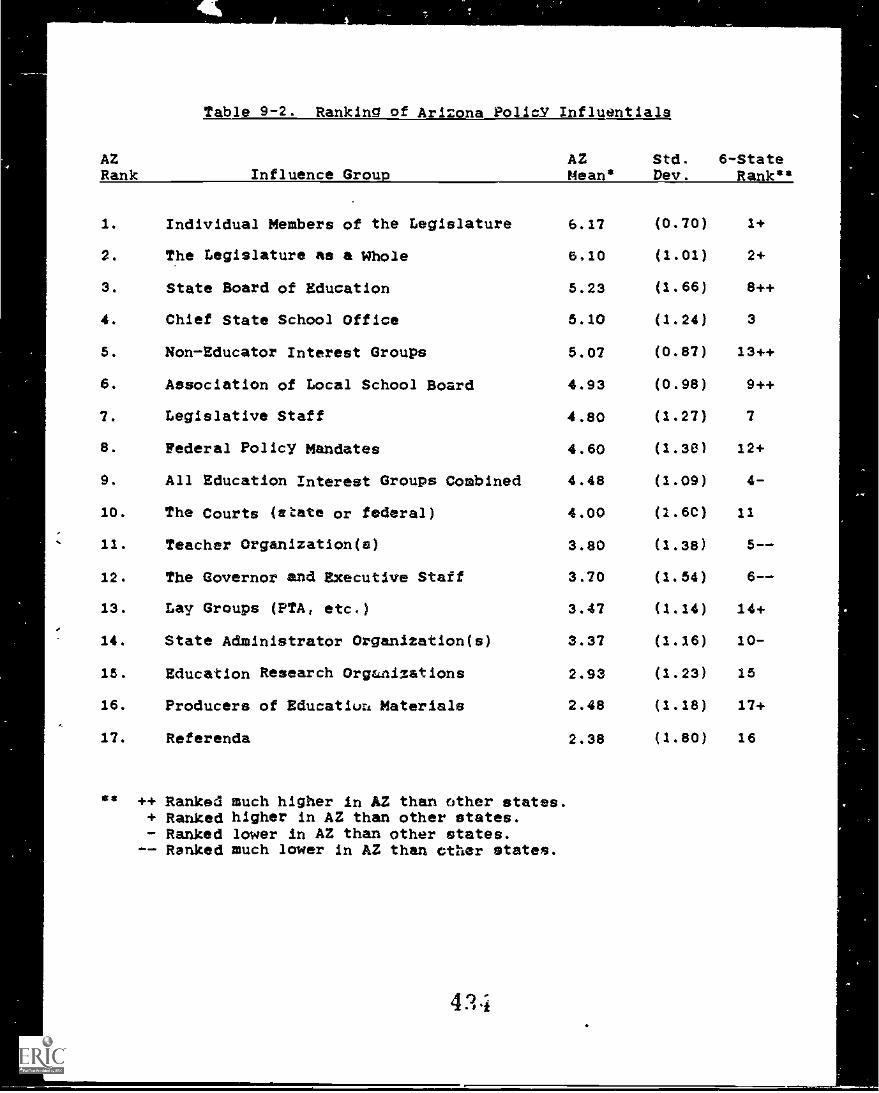
AZRank
Table 9-2. Ranking of Arizona PolicY Influentials
6-StateRank**Influence Group
AZMean*
Std.Dev.
1. Individual Members of the Legislature 6.17 (0.70) 1+
2. The Legislature as a Whole 0.10 (1.01) 2+
3. State Board of Education 5.23 (1.66) 8++
4. Chief State School Office 5.10 (1.24) 3
5. Non-Educator Interest Groups 5.07 (0.87) 13++
6. Association of Local School Board 4.93 (0.98) 9++
7. Legislative Staff 4.80 (1.27) 7
8. Federal Policy Mandates 4.60 (1.30) 12+
9. All Education Interest Groups Combined 4.48 (1.09) 4-
10. The Courts (state or federal) 4.00 (1.6C) 11
11. Teacher Organization(s) 3.80 (1.38) 5--
12. The Governor and Executive Staff 3.70 (1.54) 6--
13. Lay Groups (PTA, etc,) 3.47 (1.14) 14+
14. State Administrator Organization(s) 3.37 (1.16) 10-
15. Education Research Orsmaizations 2.93 (1.23) 15
16. Producers of Educaticni Materials 2.48 (1.18) 17+
17. Referenda 2.38 (1.80) 16
** ++ Ranked much higher in AZ than other states.+ Ranked higher in AZ than other states.- Ranked lower in AZ than other states.
-- Ranked much lower in AZ than ether states.
4 3, 4i
The second characteristic seen in Figure 9-2 is the dominance of
lay are professional interests. In addition to the legislature .
unusually prominent actors in Arizona include the state board of
education, a strong local school boards association, particularly
effective non-educator interest groups, stronger than average lay
organizations, and even some effective educational producer groups.
Along with the teachers, school administrators are noticeably weak
in Arizona.
The priorities associated with this lay emphasis can be seen by
examining the program of Arizona's powerful SBE.
In most states this group ranks eighth. Our interviews provided
ample reason tor the high ranking of the State Board, however. The
board has a broad mandate from the legislature to develop programs
and regulations to support statutory policies. They have actively
pursued curriculum policy improvements by sp,cifying a series of
basic skills competency targets for use by local schools, targeting
computation, communication, and citizenship competencies
(affectionately known as the "3 cs" by State Department of
Education staff). It was expected that these competencies would
also be used by teacher training institutions in the preparation of
new teachers.
The State Board also adopted expansive school personnel
policies. From the standpoint of intensity of effort, the
showpiece of the board's personnel interest was a pilot program for
extended supervision and assessment of teachers. Another board
personnel policy -- flashier In its press coverage, but probably
Page IX-15
435
less intense in its impact -- was a program developed by Northern
Arizona University. This program, commits MAU to create a series
of six or seven "Centers for Excellence" across the state for both
preservice and inservice training of teachers and administrators.
A third key program in the State Board's aggressive pursuit of
personnel training reform is the "Arizona Principals' Academy."
Its dec1ared objective, according to the Board, was to "provide
administrators wlth the tools to make school improvement a
reality." One symbolically important clause in the authorizing
legislation for the Arizona Principal's Academy (SB 1226, 1984) was
its insistence that "no faculty member of any public university in
the state" be employed to staff the academy. As described more
fully below, this overt questioning of the competency of public
university faculty to provide needed training and leadership in
education is an important factor in the mood and tenor of Arizona
policy development.
The special place of the State Board of Education in Arizona
can be traced to the work of a relatively small group of key board
members. The board has succeeded in bringing into coalition
business and industrial interests with key school administrators
the state.
Virtually identical in rank with the board is the vigorous and
generally quite effective Superintendent of Public Instruction.
While the superintendent's rank of 5.30 did not differ
significantly from that given to other CSSOs in our study, the
current superintendent has Identified herself with a number of
Page IX-16
436
9
reforms, and has provided organizational skill, energy, and ideas
to support the state board's activist approach to policy.
Our interview data ider%tified two unusually effective
non-educator groups the prestigious "Phoenix 40" group (a group of
business leaders that met about once a month on an informal basis),
and the technically competent but less obviously powerful Arizona
Tax Research Association. On an individual basis we were able to
identify several other active and influential community and
business leaders as well, but we were not able to trace their
influence on specific issues.
CALIFORNIA: Strong 1egislative staff, educator interest groupsand referenda.
California's policy influence patterns is shown in Figure 9-3.
Six groups were seen as especially powerful ln this) state while
only one (the SBE was seen as notably weak). Among the unusually
influential groups, the prominence of the legislative staff, the
coalition of all education interest groups, and the overall
effectiveness of the legislature are noteworthy.
Insert Figure 9-3 about here.
Insert Table 9-3 about here.
As in other states, the California legislature was the prime
mover in education policy matters, and major education programs
Page XX-17
437
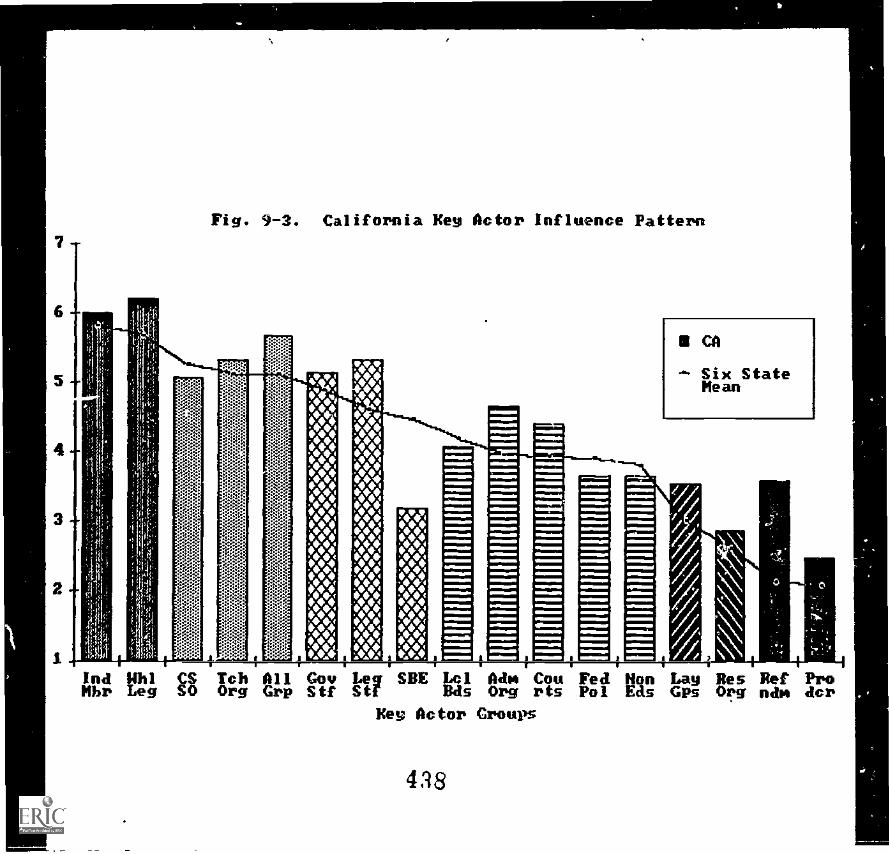
e71
CCrt
Zra3
PZno
0 0glidta
Z040Ss
I triC.
COtn
op*,
«r4D
444.)trt".
1.00
WO
*10:*::.OP
PM
1§2:MtV
gaSigglgaZ
tag:MI:43k3::::$
ntx-x***v::g:
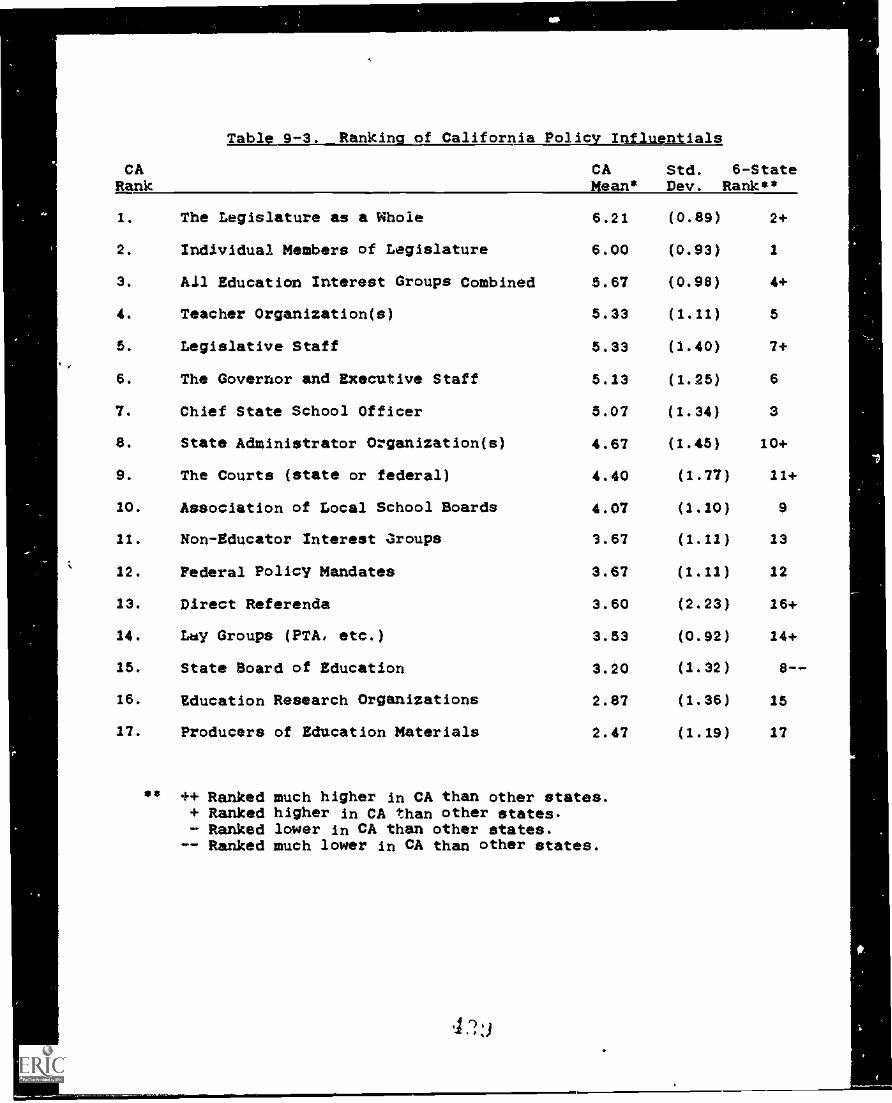
CARank
Table 9-3. Ranking of CaliforrliA_I'SgIAILISA3SUULUJiLI
CA Std. 6-StateMean* Dev. Rank**
1. The Legislature as a Whole 6.21 (0.89) 2+
2. Individual Members of Legislature 6.00 (0.93) 1
3. All Education Interest Groups Combined 5.67 (0.98) 4+
4. Teacher Organization(s) 5.33 (1.11) 5
5. Legislative Staff 5.33 (1.40) 7+
6. The Governor and Executive Staff 5.13 (1.25) 6
7. Chief State School Officer 5.07 (1.34) 3
8. State Administrator Organization(s) 4.67 (1.45) 10+
S. The Courts (state or federal) 4.40 (1.77) 11+
10. Association of Local School Boards 4.07 (1.10) 9
11. Non-Educator Interest aroups 3.67 (1.11) 13
12. Federal Policy Mandates 3.67 (1.11) 12
13. Direct Referenda 3.60 (2.23) 16+
14. Luy Groups (PTA, etc.) 3.53 (0.92) 14+
15. State Board of Education 3.20 (1.32) 8--
16. Education Research Organizations 2.87 (1.36) 15
17. Producers of Education Materials 2.47 (1.19) 17
++ Ranked much higher in CA than other states.+ Ranked higher in CA than other states.- Ranked lower in CA than other states.
-- Ranked much lower in CA than other states.
were frequently known by the name of the legislator who introduced
them -- the Ryan Act for teacher certification, the Rodda Act for
labor relations, the Green Act on building design and financing,
the comprehensive Hughes-Hart Reform Act of 1983, etc. The
legislature did not work in a vacuum, however. Members were
surrounded by some of the most sophisticated, energetic, and
well-financed lobbyists to be found in any state. And members had
to respond to initiatives and policy positions taken by a powerful
governor and.a very effective superintendent of public instruction.
The high level of influence exercised by education interest
groups is revealed in significantly above average scores for
administrators and lay groups (as well as a slightly above average
score for teacher organizations and textbook publishers). Local
boards and non-educator groups were rated slightly (but not
significantly) below average.
In sum, the policy environment in California is reflected in
the generally high influence scores for all influence groups. As
hown in Table 9-1, influence ratings for all of the 17 groups
rated by our respondents were, on the average, a full one-half
point higher (on a 1 to 7 scale) than the scores provided by
respondents in the other five sample states. California
respondents, in effect, believed that all policy actors are more
influential.
If we view policy influence as a "zero-sum" game in which
increased influence by one actor is only achieved by reducing the
Page IX-18
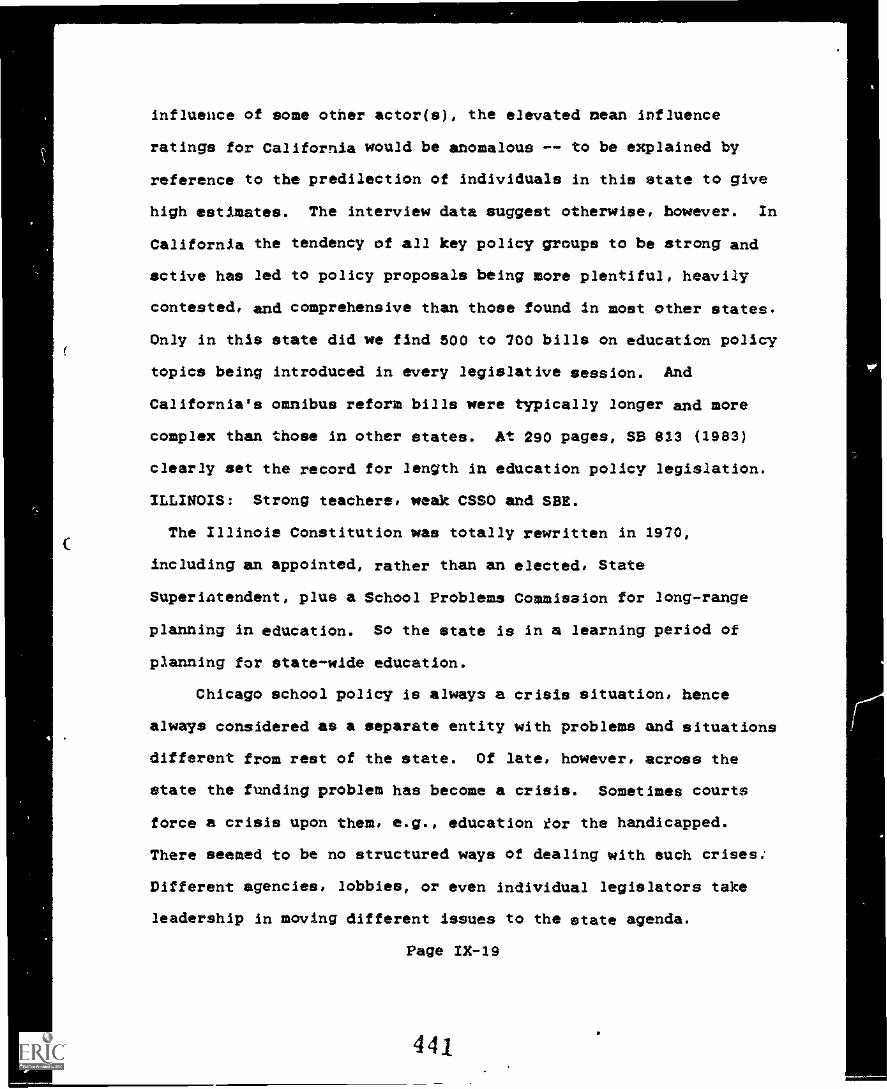
influence of some other actor(s), the elevated nean influence
ratings for California would be anomalous -- to be explained by
reference to the predilection of individuals in this state to give
high estimates. The interview data suggest otherwise, however. In
California the tendency of all key policy groups to be strong and
active has led to policy proposals being more plentiful, heavily
contested, and comprehensive than those found in most other states.
Only in this state did me find 500 to 700 bills on education policy
topics being introduced in every legislative session. And
California's omnibus reform bills were typically longer and more
complex than those in other states. At 290 pages, SS 813 (1983)
clearly set the record for length in education policy legislation.
ILLINOIS: Strong teachers, weak CSSO and SHE.
The Illinois Constitution WAS totally rewritten in 1970,
including an appointed, rather than an elected, State
Superiatendent, plus a School Problems Commission for long-range
planning in education. So the state is in a learning period of
planning for state-wide education.
Chicago school policy is always a crisis situation, hence
always considered as a separate entity with problems and situations
different from rest of the state. Of late, however, across the
state the funding problem has become a crisis. Sometimes courts
force a crisis upon them, e.g., education tor the handicapped.
There seemed to be no structured ways of dealing with such crises..
Different agencies, lobbies, or even individual legislators take
leadership in moving different issues to the state agenda.
Page 1E-19
4 4
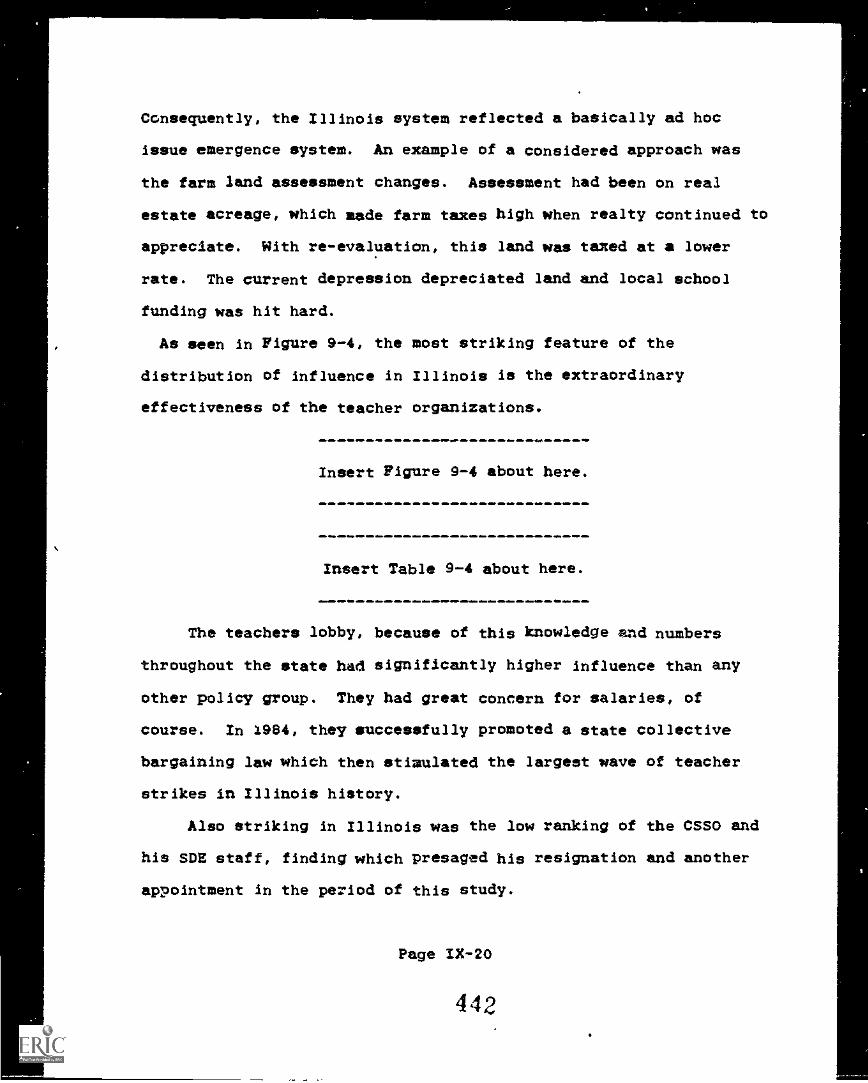
Consequently, the Illinois system reflected a basically ad hoc
issue emergence ystem. An example of a considered approach was
the farm land assessment changes. Assessment had been on real
estate acreage, which made farm taxes high when realty continued to
appreciate. With re-evaluation, this land was taxed at a lower
rate. The current depression depreciated land and local school
funding was hit hard.
As seen in Figure 9-4, the most striking feature of the
distribution of influence in Illinois is the extraordinary
effectiveness of the teacher organizations.
Insert Figure 9-4 about here.
Insert Table 9-4 about here.
The teachers lobby, because of this knowledge and numbers
throughout the state had significantly higher influence than any
other policy group. They had great concern for salaries, of
course. In 1984, they successfully promoted a state collective
bargaining law which then stimulated the largest wave of teacher
strikes in Illinois history.
Also striking in Illinois was the low ranking of the CSSO and
his SDE staff, finding which presaged his resignation and another
appointment in the period of this study.
Page IX-20
442
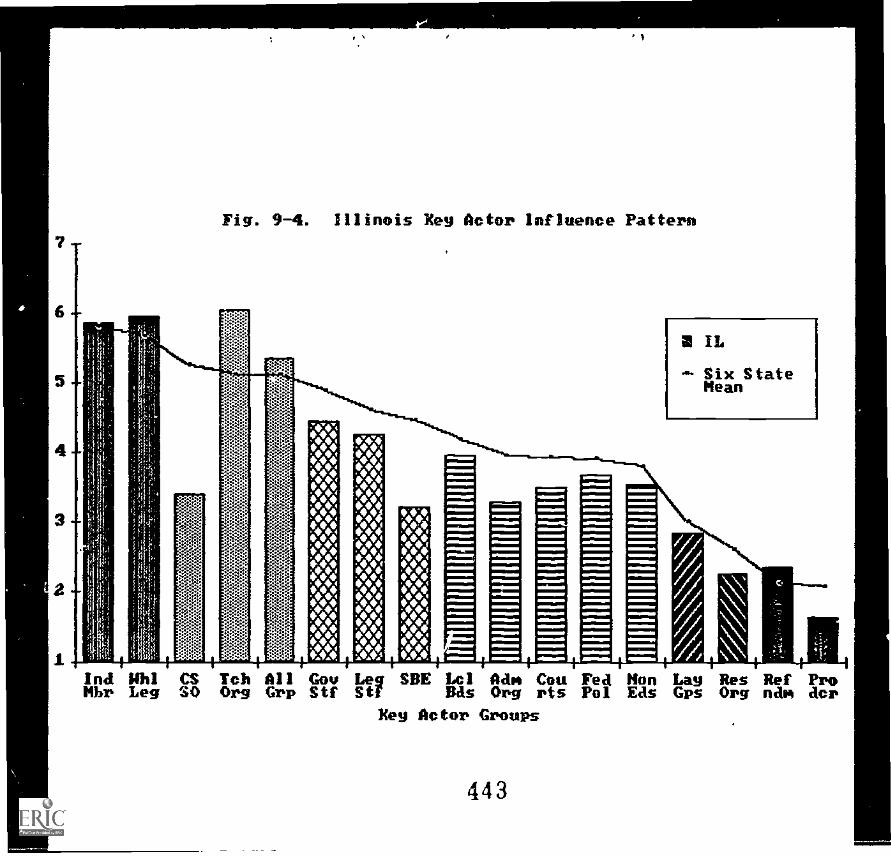
IIIIIIIIIIIIIIIIIIIIIIIIIIIII
E43Pg
u§ctri
Act,
c utco%Zrui
PCot0 0444
tA040
rio
co
11111 IIIIIIIIIIIIIIII11111
4P- * `AV 4P- * -IP -41;40 40 * * 40 * 40 40 4M 4
40 40 * 40 40 40 40 4M 40 *ottet4tf!%!40t*f
-------4?"vp,64.,,,e4t4t4:40,4**404N;V-.1(wk.. ..41
tx+kagati*.c: tet...reerisaAt t
kagy0AVmhome.-.- 4%5w ..".dtive44o.'
164.41, PAo....4,A41'<v+400.016_%}7}Wf" *061INT4't
04
nt10
ins tri
cpaoniz
C'f')
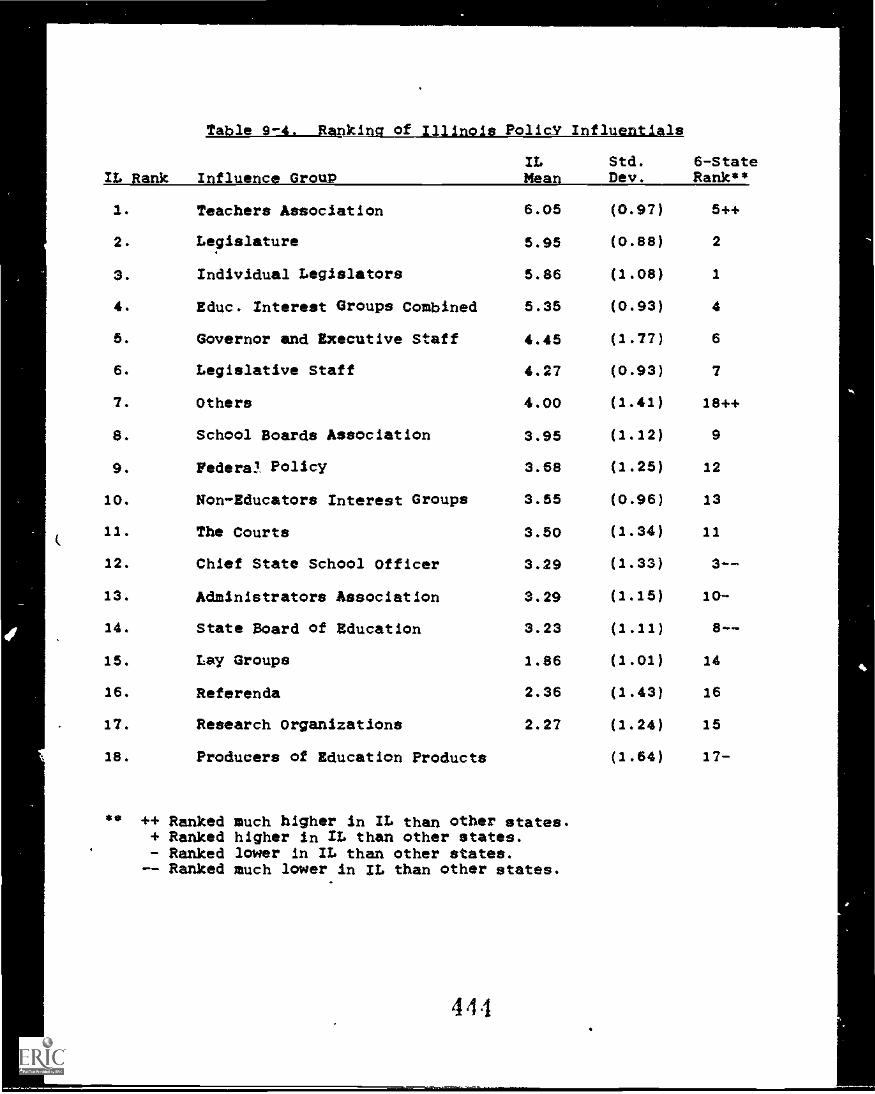
(
IL
Table 9-4. Rankina of Illinois Policy Influentials
6-StateRank**
ILRank Influence GrouP Mean
Std.Dev.
1. Teachers Association 6.05 (0.97) 5++
2. Legislature 5.95 (0.88) 2
3. Individual Legislators 3.86 (1.08) 1
4. Educ. Interest Groups Combined 5.35 (0.93) 4
5. Governor and Executive Staff 4.45 (1.77) 6
6. Legislative Staff 4.27 (0.93) 7
7. Others 4.00 (1.41) 18++
8. School Boards Association 3.95 (1.12) 9
9. Federal Policy 3.68 (1.25) 12
10. Non-Educators Interest Groups 3.55 (0.96) 13
11. The Courts 3.50 (1.34) 11
12. Chief State School Officer 3.29 (1.33) 3--
13. Administrators Association 3.29 (1.15) 10-
14. State Board of Education 3.23 (1.11) 8--
15. Lay Groups 1.86 (1.01) 14
16. Referenda 2.36 (1.43) 16
17. Research Organizations 2.27 (1.24) 15
18. Producers of Education Products (1.64) 17-
** ++ Ranked much higher in IL than other states.+ Ranked higher in IL than other states.- Ranked lower in IL than other states.
-- Ranked much lower in IL than other states.
444
The CSSO's significantly lower ranking in Illinois car: be put
in context. The State Superintendent's role in education policy
has been transformed, but still seems to have only a limited
initiative in the policy system. Under the new Constitution, his
role changed from its traditional, elective nature (which meant
exercising limited policy leadership) to one appointed by the State
Board. Efforts by three of these officers since this change
demonstrate it is not useful for leadership in the education policy
system; a fourth, appointed in 1985, was too recent for evaluation.
The first did little, but the second tried to do much
(desegregation, consolidation). Ne got the Legislature and local
school boards so unhappy with these efforts that legislators
actually threatened.to change the Constitution and make the office
elective once again (he left shortly thereafter with little
substantive progress to report).
Also below average is the influence exercised by the Illinois SBE
and its school administrator organization. These low rankings
confirm the impressions generated by our interviews that the nexus
of Illinois policy formation is the interaction between its
powerful teacher organizations and the particularly rancorous
debate and programmatic politics of its legislature which is
perpetually divided between Chicago and down state interests --
overlaid by overt partiaan political contests tor control.
PENNSYLVANIA: A strong outer circle.
As indicated in Figure 9-5. Pennsylvania comes the clos'est of the
six sample states to reflecting the national average influence
Page IX-21
445
scores for all key actor groups. They are some noticeable
differences, however. Two members of the outer circle (the
governor and the legislative staff) are particularly powerful and
the school administrators organization is strong enough to
effectively balance teacher influence. At the ame time, non-
educator groups and popular referenda are significantly less
important sources of influence.
Insert Figure 9-5 about here.
Insert Table 9-5 about here.
The governor's visibility followed publication of his xgragg_thp
Tide school reform initiative. He also benefited from conflict
surrounding the appointment of his first superintendent of schools
(whom he latter replaced), making the role of the CSSO as a
representative of the governor's policy agenda painfully obvious to
everyone.
Pennsylvania's legislative staffers were ranked just below the
legislature as a whole. These staffers are plentiful, expert,
full-time professionals who are clearly rely on broad data sets and
factual analyses to help frame Issues and plan strategy for
education policy. They meet with lobbyists and act as middlemen,
conveying the sense of how legislators will respond to proposals
Page IX-22
446
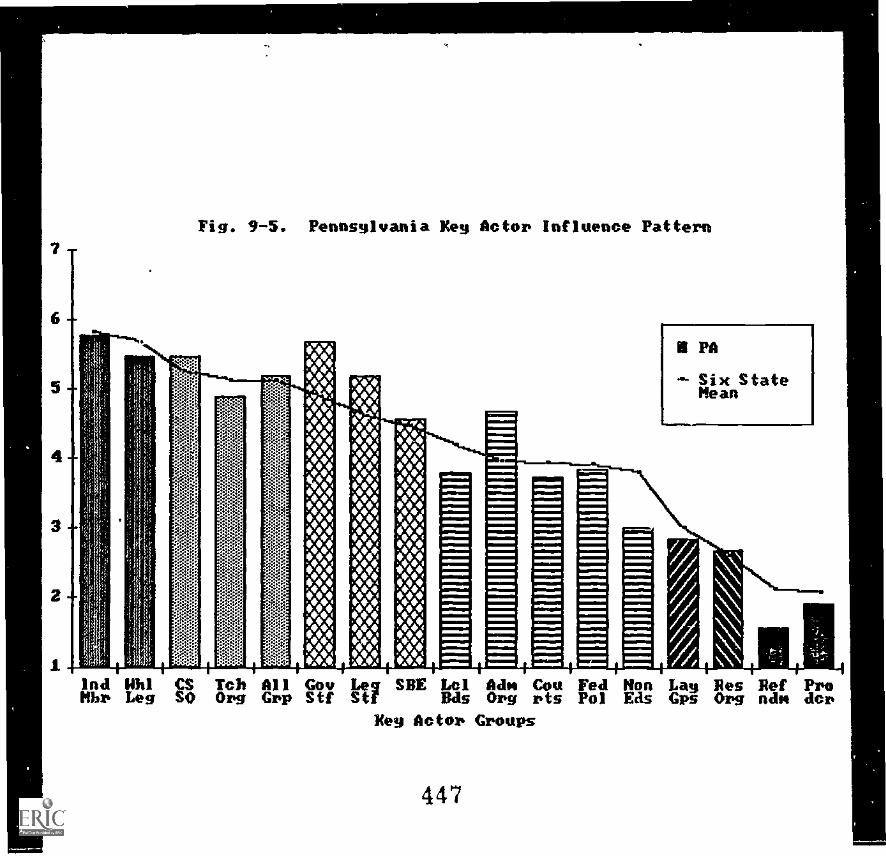
1111111.1111111111111111111111111111liii
Dcp.
ma,wi ACU
tpee
00cott4
Int tri
galPO A
wiz
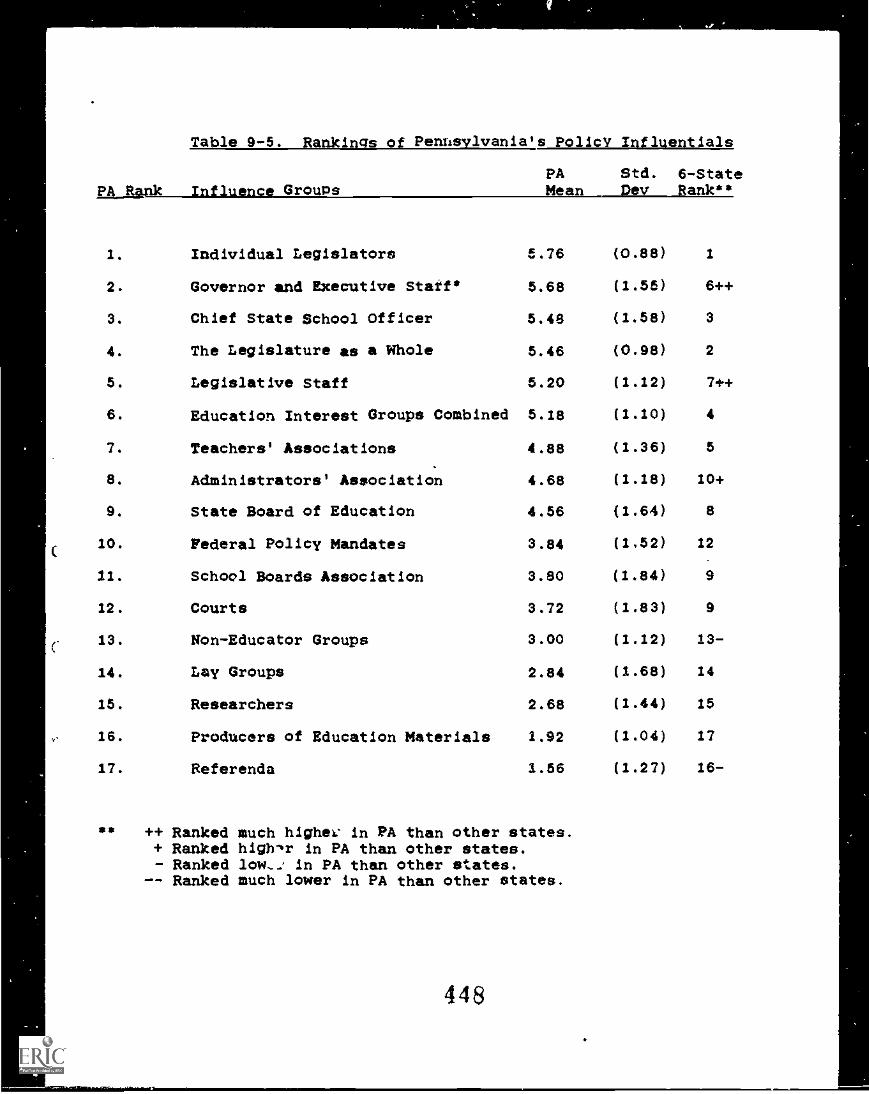
fA_Rank
Table 9-5. Rankings of Penusvlvania's Policy Influentials
Influence GroupsPA Std. 6-StateMean __WBank**
1. Individual Legislators 5.76 (0.66) 1
2. Governor and Executive Staff* 5.66 (1.55) 6++
3. Chief State School Officer 5.48 (1.56) 3
4. The Legislature as a Whole 5.46 (0.96) 2
5. Legislative Staff 5.20 (1.12) 7++
6. Education Interest Groups Combined 5.16 (1.10) 4
7. Teachers' Associations 4.66 (1.36) 5
6. Administrators' Association 4.66 (1.16) 10+
9. State Board of Education 4.56 (1.64) 6
10. Federal Policy Mandates 3.64 (1.52) 12
11. School Boards Association 3.80 (1.64) 9
12. Courts 3.72 (1.63) 9
13. Non-Educator Groups 3.00 (1.12) 13-
14. Lay Groups 2.64 (1.66) 14
15. Researchers 2.66 (1.44) 15
16. Producers of Education Materials 1.92 (1.04) 17
17. Referenda 1.56 (1.27) 16-
* ++ Ranked much highft- in PA than other states.+ Ranked high-sr in PA than other states.- Ranked low in pA than other tates.
-- Ranked much lower in PA than other states.
and, at the same time, glean information about the concerns and
potential actions of interest groups.
Interview data indicated the high inability of the school
administrators group was due primarily to their success in
promoting a form of collective bargaining for principals. State
policymakers generally are impressed with well organized special
interest groups who propose and directly pursue policies or
programs designed to support their own members. They are doubly
impressed if these programs involve legislating a shift of formal
authority or significant resources into the interest group's hands.
WEST VIRGINIA: Judicial lightening bolts and a strong stateagency.
As shown in Figure 9-6, most obvious difference between West
Virginia's influence profile and that of the other states was the
stunning prominence of the pourte.
Insert Figure 9-6 about here.
Insert Table 9-6 about here.
The courts became involved in poicymaking when the 1979 case of
Pauley vs. Bailey was remanded to Circuit Court Judge Arthur Recht,
who issued a decision unprecedented in its detailing of an
equitable reform of the state school system. Judge Recht decided,
Page IX-23
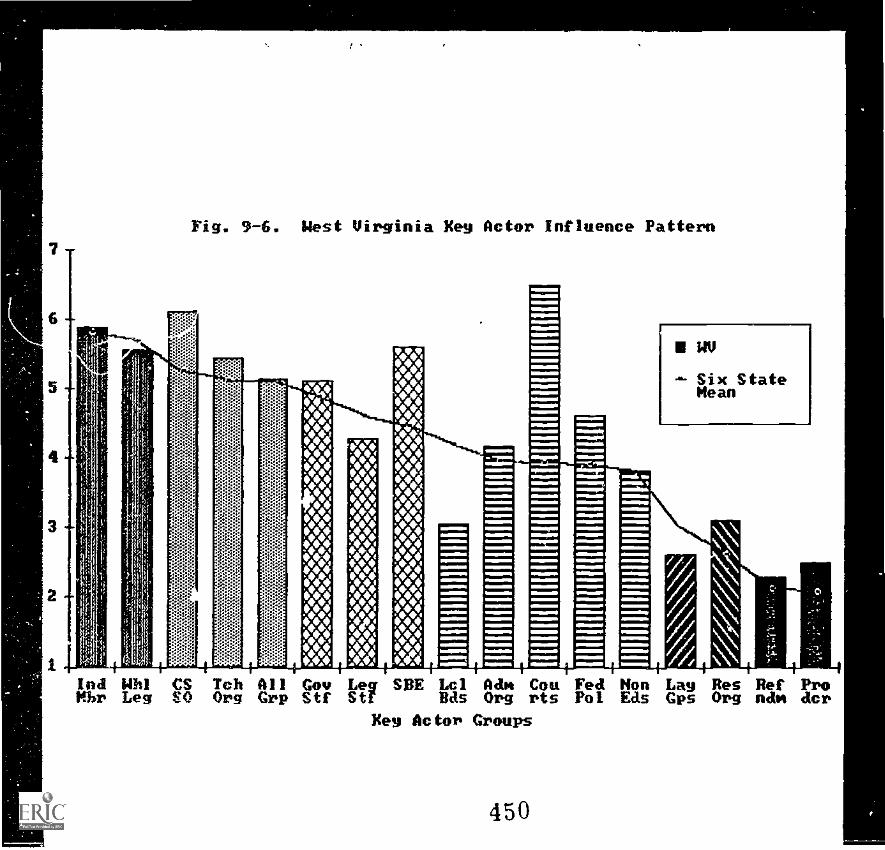
III1111111111111111111111IHIIIIIIIII1111111111111111111111
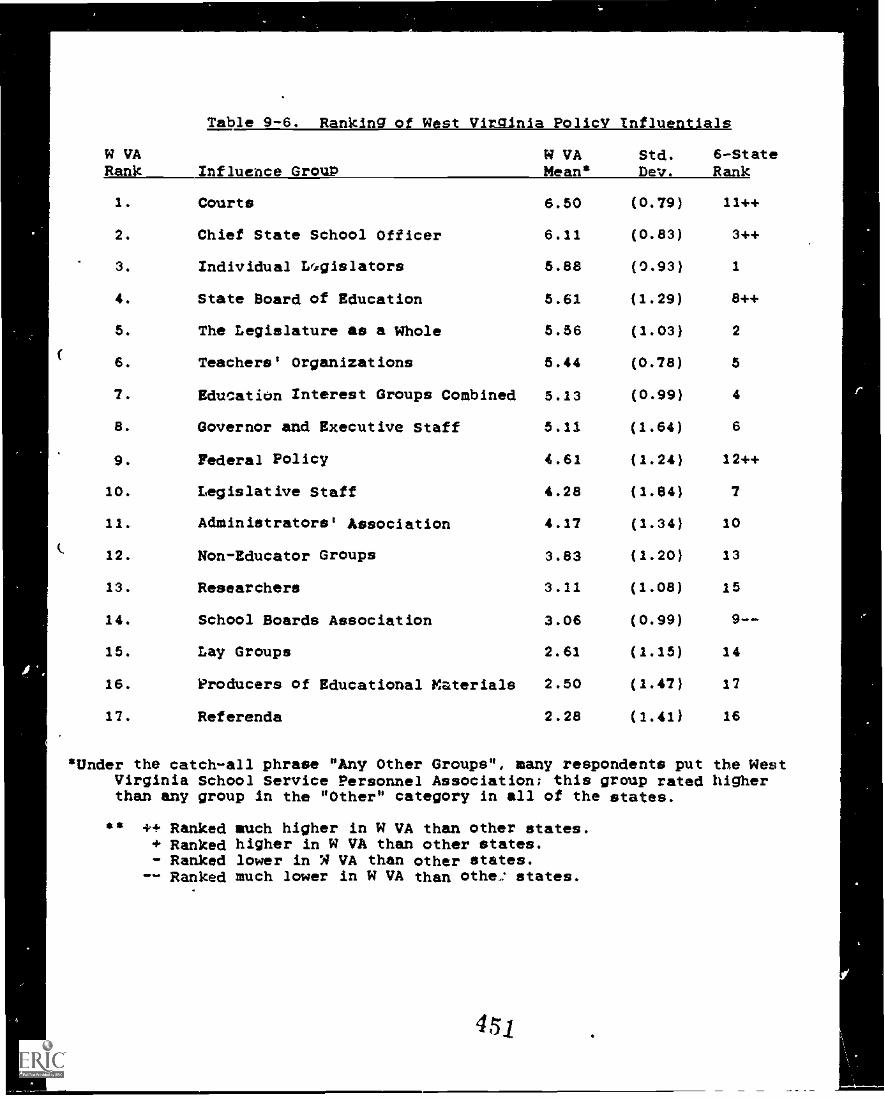
W VARank
Table 9-6. Ranking of West Virginia Policy Influentials
Influence GrOUPW VAMean*
Std.Dev.
6-StateRank
1. Courts 6.50 (0.79) 11++
2. Chief State School Officer 6.11 (0.83) 3++
3. Individual Lrggislators 5.88 (0.93) 1
4. State Board of Education 5.61 (1.29) 8++
5. The Legislature as a Whole 5.56 (1.03) 2
6. Teachers' Organizations 5.44 (0.78) 5
7. Education Interest Groups Combined 5.13 (0.99) 4
8. Governor and Executive Staff 5.11 (1.64) 6
9. Federal Policy 4.61 (1.24) 12++
10. Legislative Staff 4.28 (1.84) 7
11. Administrators' Association 4.17 (1.34) 10
12. Non-Educator Groups 3.83 (1.20) 13
13. Researchers 3.11 (1.08) 15
14. School Boards Association 3.06 (0.99) 9--
15. Lay Groups 2.61 (1.15) 14
16. Producers of Educational Materials 2.50 (1.47) 17
17. Referenda 2.28 (1.41) 16
*Under the catch-all phrase "Any Other Groups", many respondents put the WestVirginia School Service Personnel Association; this group rated higherthan any group in the "Other" category in all of the states.
** ++ Ranked much higher in W VA than other states.Ranked higher in W VA than other states.
- Ranked lower in N VA than other states.-- Ranked much lower in W VA than othe: states.
after years of litigation, that the state legislature's
responsibility to provide t :a "thorough and efficient" education
system demanded by the Constitution required reformat:on of the
tax structure and a plan to ensure uniformity in the program,
facilities, and resources for the education of every child. Recht
himself offered sn explanation for this:
Trial courts react. We rarely act. And the only time a trial
-court is required to act is when there is legislative and executive
inertia. When those two branches of government do nothing, nature
abhors a vacuum and the judicial branch of government then has to
step in and take some action. (Interview, State Ed, 1984, 1).
Although the basis of the Recht decision was the thorough and
efficient clause, the interpretation was that the inequity, the
uneven standards of program quality constituted an inefficient and
non-thorough system that had to be corrected. The lovic of the
decision was that education is a fundamentaY right according to the
state constitution so that any student who did not have equal
opportunity to a minimum standard of educational program was being
denied an equal and fundazental right. The decision actually
-defined minimum standards and asserted that the state government
was remiss in not providing an efficient system for generating and
allocating the funding to provide for a quality educational system
to each student, no matter which county the student resides in.
Policy actors were keenly aware that this court decision has
altered basic assumptions in West V1rginia, as illustrated here:
Page IX-24
4 5 2
The Supreme Court has made two fundamental changes. It said
that property tax must be assessed at its true and actual value,
because property is a major constituent of financing schools and is
the only base that they have. And also in Pauley vs. whoever....
its said that the quality of schools must be changed.... So we are
going to see property carrying more of a load in financing schools.
The state uperintendent, ranking second only to the courts in
West Virginia, was significantly higher in ranking than all the
other sample states except Wisconsin The CSSO was initially a
political appointee with a nobly apolitical mission but, around the
1920s and 1930s, his efforts became partisan. So, by
constitutional amendment in 1958, control over his appointment was
shifted to the SBE, in an effort to insulate from political
pressures (Pearson and Puller, 1969). The resignation of Dr. Roy
Truby in 1985, however, revealed that this move was not entirely
successful. It was his support for the opponent of newly-elected
Governor Arch Moore that ended his effectiveness in office.
The CSs0 is the final arbiter in grievances in any education
system in the state. The Wpfit Virginia Constitution gives
education special status. In fact, in 1982, when the governor cut
the education budget (but not transpw:station budget), the CSSO
brought suit against the governor and won. The
Constitutionally-protected independence of the CSSO is demonstrated
here.
Local school boards were notably weaker than average in West
Virginia. This weakness was the result of frequent tensions
Page 1X-25
4$3
between the school boards association and the state superintendents
organization.
These tensions recur when superintendents are expected to take a
side in political campaigns for school board elections; sometimes
their side does not win and, "you see huge nuahers of
superintendents looing their jobs within six months." EW VA,2,6].
The state association of school boards was lower in West Virginia
than in any of ete saaple state (but not significantly so). The
local boards are county elected officials, responsible to local
citizens' needs and have some difficulty accepting state influence
at a time when state level involvement in the schools is a fact of
life.
WISCONSIN: An inner circle that dominates the legislature.
As indicated in Figure 9-7, Wisconsin was unique among our sample
states in the weakness of its legislative actors. The CSSO, the
governor and the teacher organizations were all more powerful than
any legislative actors. Even the association of local school
boards was seen as having influence comparable to the legislature.
Insert Figure 9-7 about here.
Insert Table 9-7 about here.
Page IX-26
454
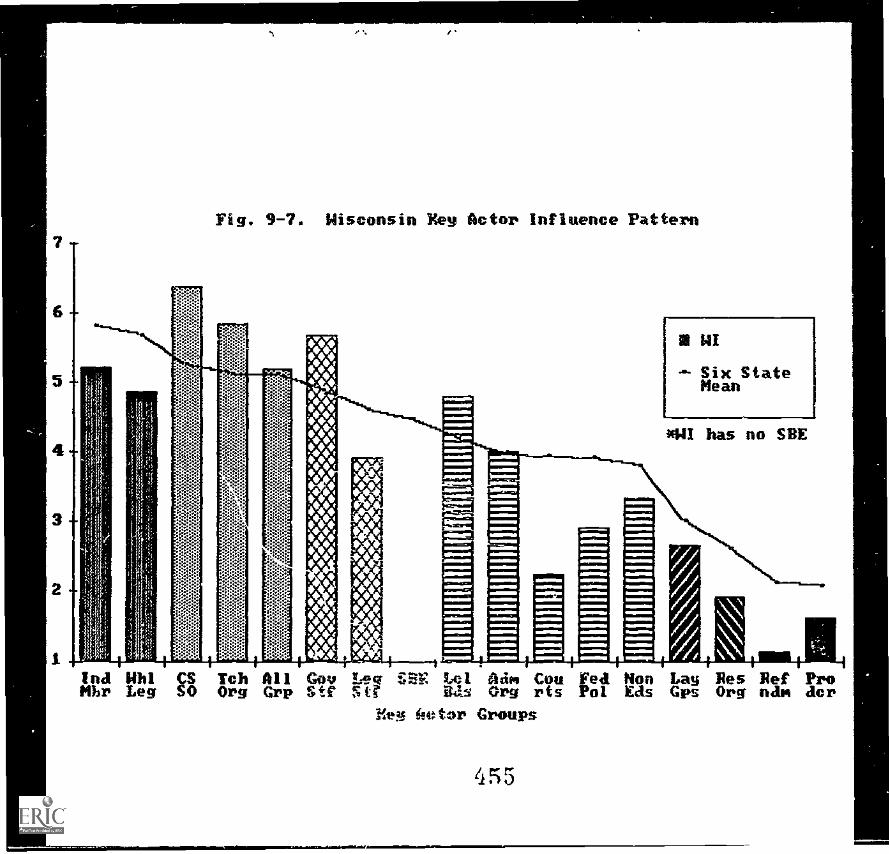
I
Fig. 9-7. Wisconsin Bey Actor Influence Pattern
Six StateMean
lOWI has no SBE
MMEm.mimm.mlmmomlm..M.
m1M1m ImEMEIm1mlimlmI
Ind Uhl CS Tch All Gov Leg SEE Lel Aim Cou Fed Non Lag Res Ref ProMbr Leg SO Org Grp Ste stt aas Org rts Pol Eds Gps Org ndm der
Mel hetor Groups
455
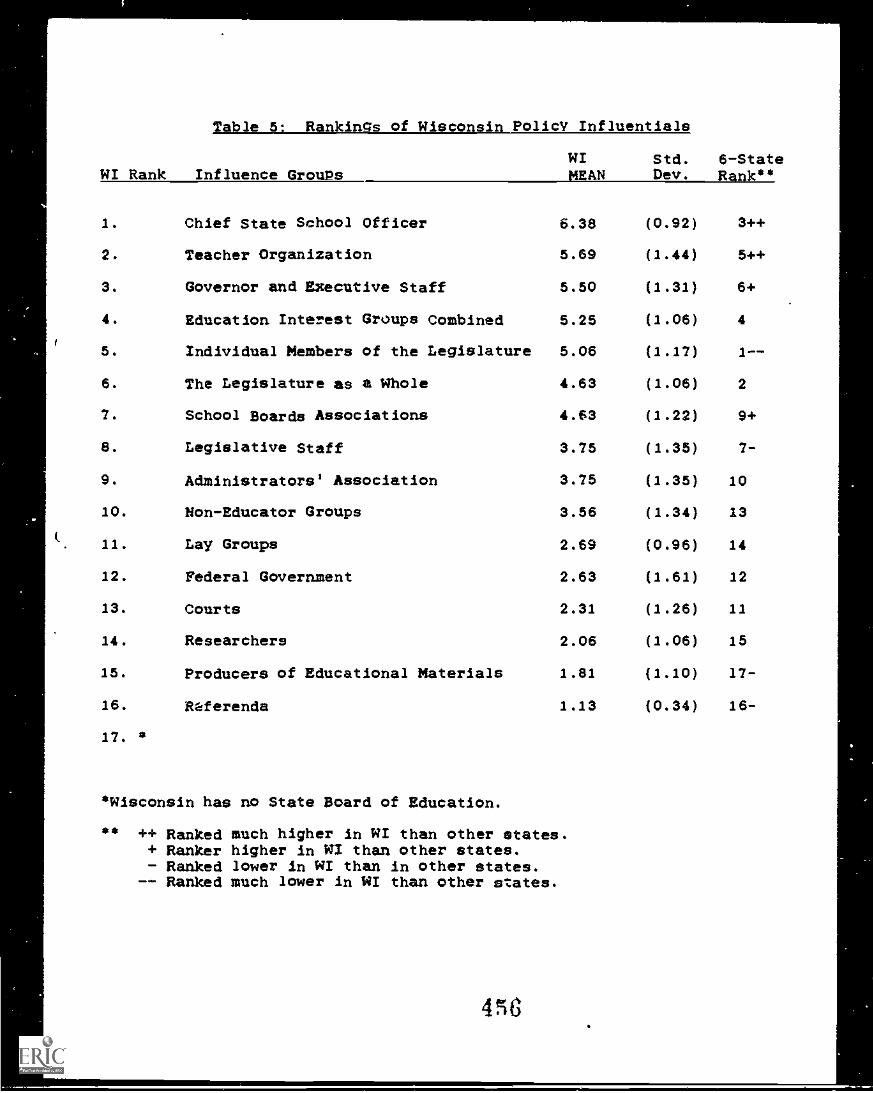
WI Rank
Table 5- Rankings of Wisconsin Policy Influentials
6-StateRank**Influence GrouPs
WIMEAN
Std.Dev.
1. Chief State School Officer 6.38 (0.92) 3++
2. Teacher Organization 5.69 (1.44) 5++
3. Governor and Executive Staff 5.50 (1.31) 6+
4. Education Interest Groups Combined 5.25 (1.06) 4
5. Individual Members of the Legislature 5.06 (1.17) 1--
6. The Legislature as a Whole 4.63 (1.06) 2
7. School Boards Associations 4.63 (1.22) 9+
8. Legislative Staff 3.75 (1.35) 7-
9. Administrators' Association 3.75 (1.35) 10
10. Non-Educator Groups 3.56 (1.34) 13
11. Lay Groups 2.69 (0.96) 14
12. Federal Government 2.63 (1.61) 12
13. Courts 2.31 (1.26) 11
14. Researchers 2.06 (1.06) 15
15. Producers of Educational Materials 1.81 (1.10) 17-
16. Referenda 1.13 (0.34) 16-
17.
*Wisconsin has no State Board of Education.
** -1-1- Ranked much higher in WI than other states.+ Ranker higher in WI than other states.- Ranked lower in WI than in other states.
-- Ranked much lower in MI than other states.
456
Interviews and observation data indicate that the unique
distribution of influence in Wisconsin is the result of its
strongly moralistic culture and powerful Democratic party. By
defining politics as a commonweal activity aimed at identifying and
pursuing broad community values, the moralistic culture supports
executive leadership for education and diminishes the normally
important conflict management of the legislature (see chapter VI
for a fuller discussion of political cultures). Because the
Democratic party has a very large margin of both popular support
and control of governmental offices, there are few opportunities
for other party interests to pose a serious challenge to the
governor's leadership. And finally, since the governor appoints
the CSSO and he has no SBE to provide alternative policy
anitiatives, it is easy for the executive branch to develop a close
working relationship and to present a single program to the
legislature for action.
Thi moralistic culture in Wisconsin also supports expanded
influence tor teachers and local school boards (without diminishing
the role of administrators). With policymaking defined as a search
for the public interest, it J. easy for strong executive agencies
to rely on advice from local school people.
The populism of the Democratic party also reinforces a diminished
role for non-citizen influences. The courts, federal policy
mandates and research orgdnizations were all given significantly
lower ratings in Pisconsin than in the other states. And the
special interest of textbook publishers and producers of other
"4aige IX-27
457
p.
educational materials, low in all the states, were reported to be
virtually without influence An Wisconsin. And because this culture
is so homogeneous and rely so easily on executive leadership,
referenda influence in Wisconsin has also disappeared from view.
Summary
From a national perspective, legislatures are the most prominent
actors in state level education policy formation. The legislative
arena is where policy issues are framed. Education specialists
among the legislature and key staff members have the lion's share
of the influence over what issues will be addressed and how they
will be framed.
An inner circle of key actors -- typically consisting of the
CSSO, the teacher organizations and a coalition of all education
groups working together -- provide the specifics of the policy
debates. They propose policy changes, generate data for use in the
legislative debates, and lobby directly to persuade the legislature
to act. Occasionally the governor enters this inner circle by
making education a major part of his policy agenda.
The SEEts are typically members of a less prominent outer circle,
often ranking with sometime players (such as local school boards,
administrator groups, the courts, federal policy mandates and non-
educator special interest groups.
While the six states sample provides an overall picture of
power and influence, each state has its own individual picture.
History, current crises, recent power shifts and pervasive informal
rules for action maintain policy groups power in each state.
Page 1X-2S
458
Rosenthal (1981) noted that "the legislative process cannot te
considered isolation from the prevailing ethos, the political
ethics, and the capital community in which it operates," (p 111).
He examined aspects of the culture -- the work flow, the hangouts
of legislators and lobbyists, the norms of legislators. This
chapter has shown that the different state authorities have
individual processes and power rankings. The next chaptez will
examine the pervasive cultural norms of education policymakers.
Page 1X-29
459
REFERENCES
Fuhrman, Susan a Rosenthal, Alan. (Eds.). (1981). ShaPing education
Policy in the States. Washington, DC: The Institute for
Educational Leadership.
Iannaccone, L. (1967). Politics in education. New York: Center for
Applied Research in Education.
Marshall, C. (1988, January). Politics of evaluation: The
competition for control of education policy. Urban Education 19,
(4), 411-439.
Mechley, R. (1981, Fall). Court grants education preferred funding
states in West Virginia. Journal of Education Finance, 7,
227-229.
Milstein, M. a Jennings, R. (1973). Educational_PolicY-making and
the state legislature: The New York experience. New York:
Praeger.
Mitchell, Douglas E. (1981). ShaPing legislative decisions:
Bdtication policy and the social sciences. Lexington, MA: D.C.
Health a Company.
Pearson, Jim a Fuller, Edgar. (Eds.). (1969). Education in the
states: A Proiect of Chief State School Officers. Washington:
National Education Association of the United States.
Rosenthal, Alan. (1981). Legislative life: People, processes and
Performance in the state. New York: Harper & Row.
Wirt, F. a Kirst, M. (1982). Schools in conflict: The politics of
pducations Berkeley, CA: McCutchan.
Page IX-30
460
CHAPTER X
ASSUMPTIVE WORLDS OF EDUCATION POLICTMAKERS
The ConcePt of the Assumptive Worlds
Each state policymaking setting has its own distinctive
calture. Policymakers are socialized in these cultures and share
understandings about what is right and proper. These
understandings specify expected policymaking behaviors and rituals,
and provide a basis for judging feasible policy options. The
resulting perceptual screen we term the "assumptive world" of the
policymaker in each state. Young (1977) described these
"assumptive worlds" as "policymakers' subjective understandings of
the environment in which they operate" (p. 2), incorporating
II several intermingled elements of belief, percepzion, evaluation,
and intention as responses to the reality 'out there'" (p. 3).
This chapter identifies, describes, and analyzes the utility of the
assumptive world concept of explaining how public values are
translated into concrete policy decisions.
Discovering the assumptive worlds of the policymakers in each
state began with the realization that the most influential policy
actors shared a common understanding of their state's
decisionmaking process. They were particularly attuned to the
meaning and eignificance of key words or phrases and told common
stories about the successes and failures of various actions taken
by those who tried to shape important decisions.
Page X-2
461
p.
at.
Careful analysis of interview data enabled us to make a
connection between the perceived distribution of influence in each
state, individual policy actors' sense of what works, and the words
they used about activities within their states' policy cultures.
We found definite rules for the exercise of influence --
rules that define the rights and responsibilities of various policy
groups. Various key actors' stories revealed how sptcific
activities allowed particular groups to gain (or lose) power. They
also revealed the existence of state-specific understandings about
the cultural constraints on policy behavior and choice.
We found, in short, each state system had a distinctive set of
assumptive worlds, and that actors shared more or less common
language about the processes, constraints, and rituals that must be
observed in policymaking. This common language reflected a
taken-for-granted framework within which policymaking occurs.
Analysis of the language shows how the assumptive worlds interact
with particular policy initiatives to control decision outcomes.
Theoretical and Methodological Developments
in the Study of Policy Cultures
This section briefly outlines the theory and methodological
traditions that guided our study of policymakers' assumptive
uorlds.
Theory Building
Schutz's (1962, p. 53) essays on research and social reality
underscore the importance of developing an "explanation of how
mutual understandings of human beings might occur." Social reality
Page X-2
462
9
contains elements of beliefs and convictions that are common, that
are the basic underpinning of all social interaction and action.
These are seen in common mediums of cogitations, reciprocity of
perspective, reciprocity of motive, common communicative
environments, and social traffic with consociates in a community of
space.
This focus on the origin of mutual understanding contrasts
sharply with most studies in the politics of education. Mainstream
politics research emphasizes linking decisAon inputs and outputs
relating formal and informal structures and processes, tracing the
effects of political culture, or interpreting the role of partisan
politics (See for example, Campbell ani Mazzoni, 1976; Furhman and
Rosenthal 1982; Blazer, 1984; Crain, 1969; and lannaccone, 1967).
Our examination of policymakers' informal rules and beliefs about
how decisionmaking should or must occur has parallels elsewhere in
policy research, however. Lasswell, Lerner and Rothwell's (1952)
research on "social circulation" among elites identified trends in
recruitment and careers of political leaders. They argued that
this defines the processes of control, replication, and continuity
in policy systems. Their data showed how personal orientation and
behavior fit into a policy culture, and shape the policy making
process.
Similarly, Wahlke, et al., (1962), in their research on
legislative behavior, found "rules of the game" about (a)
predictability of behavior; (b) restraint and canalization of
conflict; (c) expediting legislative business; (d) promoting group
Page X-3
463
cohesion or solidarity; and (e) the most desirable personal
qualities.
Our analysis explicitly focused on the words used by
policymakers -- their modes of expression, of obfuscation, of bias
(Schattsnelder, 1960). Using their utterances as a key to
understanding their assumptive worlds provided insights into the
way values are introduced, translated, interpreted, and mobilized
within a policy system.
This analysis is a form of political anthropology, a way "to
perceive regularities and similarities and differences in behavior,
institutions and systems of behavior, and to develop therefrom
correlations and principles of behavior" (Merritt, 1970200). How
elites actually behave is dependent upon the aspects of their
underlying perspectives that are politically relevant (Merritt,
1970). Policymaking can be viewed as an expression of ceremonial
and ritual behavior -- behavior whose authority rests upon the
authenticity with which it expresses key symbols and values.
Our interviewing of formal and informal elites contained
"inside" stories -- stories about how the powerful act, both in
front of and behind the scenes. The data are from elites who were
invited to use their own natural language systems *co describe and
interpret education policy foundation and implementation. Taped
interviews typically lasted from 30 to almost 120 minutes.
Methodological Development
Relying on typical field study methods for identifying the
normative and cognitive bases for action, and drawing upon Glaser
Page X-4
4 4
and Strauss's (1967) method of analysis to discover "grounded
theory", we examined how policymakers, in their talk, their choices
of symbols and metaphors, and their strategies for expanding or
reducing conflict, reveal role orientations, group affiliations,
and personal preferences or needs. From this data we inferred
their understandings of how the policy process is structured and
controlled.
Power is enacted through language. Language shapes the
meaning and interpretations attached to those events and behaviors
(Pfeffer, 1981a, 1981b). In the policy culture, where values and
assumptions Are necessarily contested, language is a tool for
determining which group's definition of the emergent order
prevails. Language forces attention to certain information by
making that information salient (Salancik and Pfeffer, 1978;
Roseman, Firestone and Corbett, 1984). In the policy arena, where
alliances, power, and boundaries are unclear and shifting, language
can be a most powerful tool for embedding values and enforcing
norms. "Reality is created through face-to-face interaction and
linguistic moves as people are engaging in a high level of symbolic
activity" (Roseman, et al., 1984, p. 24).
Language domain analysis provides an orderly interpretation of
how people construct their world of experience (Donmoyer 1984). As
Burlingame (1983, p. 2) put it, using this method in political
research means seeking,
to identify the characteristic patterns of individuals, howthese patterns are influenced by membership in particular
Page X-5
4g5
social groups,... and most importantly, how compromises arestruck between differing individuals or groups
He continues, when key actors tell stories about the behavior ...$f
otLers, they
tell us how power is distributed in our society. The stox?both creates and displays a universe of "facts" and "values."We are able to ground our construction of life because thestory tells us what "is" and what "ought" to be...
The Findings on Assumptive Worlds
Data from West Virginia and Pennsylvania are used in this
section to explore four questions.
I. Who has the right and responsibility to initiate policy?
2. What policy ideas are deemed unacceptable?
3. What policy mobilizing activities are deemed
appropriate?
4. What are the special conditions of the state?
These questions provide a framework for mapping the policy
culture in each state.
Typically, we discovered, the richest data came from stories
of mistakes, violations of tele rules, and failures to act and think
within the assumed parameters in a particular policy culture.
The Right and Responsibility to Initiate
The first important characteristic of policymakers' aspumptive
worlds is that they specify who iG obliged, and who has the right,
to initiate action on education policy issues.
Pennsylvania data shows, for example, that the policy culture
in this state soarply limits the legitimate role of the CSSO. The
CSSO during this study was Robert Wilburn, Secretary of Education.
Page X-6
4 RC
As a former chief advisor to the governor for budget, he had spent
time working closely with key legislators. As CSSO, when the
governor publicly took the initiative to set a major policy agenda
for education, Wilburn was given responsibility for securing
legislative approval of the governor's initiatives. He was
respected and viewed as having the full confidence of the governor
and the ability to work with key legislators. Policy actors spoke
of him with approval. As a result the policy agenda he worked for
was approved. One legislator portrayed his close interaction with
Wilburn:
If we have to bat heads on things like House Bill 1181, that'slire; he understands, that's life. He's been in the game asSecretary of the Budget. He's been over here in my office atfour in the morning and we,ve been batting heads on thebudget.... So far we're getting along very well. (PA,1,2).
Policy actors also spoke approvingly of an earlier CSSO, John
Pittenger. He also worked well with legislators, being former
legislator himself.
The importance of this pattern of expectations for the
Pennsylvania CSSO was clarified in stories and words describing an
'errant" CSSO, Robert Scanlon, who filled the office from
1979-1983. Scanlon aggressively pursued education policy change,
urging new directions in education philosophy as well as attempting
to initiate state mandates for reforms at the local district level.
Unfortunately, he was perceived as having acted without adequately
consulting the legislature. Rather than political consensus
building, Scanlon relied on educational experts and research to
plan his reform initiatives. He presented recommendations based on
Page X-7
467
,
SDE-staff findings ab=t school districts' preferences --
apparently believing that the validity of his data would compel
acceptance of his proposals. But legislators viewed this an
manipulative and out of line. Assessing local district preferences
was seen as a political matter, rightfully the domain of
legislators. Hence, any survey should have been initiated by
elected officials (the legislature or the governor). Scanlon came
to be viewed as inappropriately making decisions and taking action
that affected relations with political constitaencies. In short,
he violated a well established pattern of expectations. He was,
to be sure, the governor's appointee, and had prepared the
educational agenda in Governor Thornburg's 1978 campaign platform.
But he was a Democrat and Thornburg was Republican. Shortly after
Thornburg's reelection in 1982, he was replaced. Robert Wilburn
then took over management of Thornburg's education agenda , and
helped to recast it in terms of issues address in A Nation at Risk
report. Legislators1 we...se unusually blunt in their assessment of
Scanlon: Scanlon wasn't any longer becauseactivist, to do too much. (PA,3,11).
One legislator recalled the history of
to explain who the legislature had to teach
recently:
he tried to be too
conflict with Scanlon
the SDE a "lessen"
We think they've (the SDE) recognized who's who now, since thetime a group of legislators got together on that Special Edthing and they had to withdraw their directives. They came torecognize that there is a legislature. When Scanlon was herehe just didn't think there was a legislature. We'd have toremind him: 'Mr. Scanlon, there's a legislature!' (PA,1,10).
Page X-8
4138
Another key legislator described how he had issued a statement to
all school districts to disregard Scanlon's directive on special
education during that legislative/SDE conflict.
Pennsylvania legislators prefer a CSSO who observes the
boundaries of the state po1icy arena. POlicy discretion belongs to
elected officials -- not researchers and professional educators who
have their own agenda for change. The failure of Secretary Scanlon
to capture the policy process brought into sharp focus legislators'
awareness of their power and their need to keep a CSSO and a
department of education within the proper boundaries of power and
discretion. As a result, they created a Regulatory Review
Commission to prevent agencies like the SDE from creating or
modifying legislativ'e law through their regulations.
In Pennsylvania, then, acceptable CSSOs stay attuned to
politics and closely communicate with the legislature, viewing it
as the ultimate arbiter of political preferences and policy
values. Api.ointed by the governor, they are seen as the governor's
primary education policy advisors. But the CSSO role must be
carried out within the constraints and expectations of legislators
who have strong views about their proper role and who are quite
willing to undermine anyone who takes initiative °Improperly.°
Prescription for the SDE role. Pennsylvanians have an equally
clear set of expectations regarding the proper role of Education
Department staff. SDB staff are expected to refrain from
initiating policy or lobbying for specific proposals directly.
They are expected to provide service and information to interest
Page X-9
489
groups and legislators and other policy actors who do initiate and
lobby.
During Scanlon's administration, the SDE in Pennsylvania lost
stature because staff violated this operational principle.
Legislative staff, lobbyists, and SDE staff used to meet together
to plan strategy. In recent years, however, legislative staffers
have suspected the SDE of providing false, inadequate, and/or
delayed information and statistics. Sanctions were applied,
primarily by legislators and staffers refusing to use sDE
information. This had the effect of denying sDE access to policy
formulation since the SDE could no longer use frame issues by
providing the information. Legislators found clandestine ways to
obtain SDE data and legislative staff developed their own
information gathering expertise independent of the SDE's. Now,
strategy sessions includes lobbyists and legislative staffers, but
SDE staff are seldom invited. Banter during these strategy
sessions include mild ridiculing of the sDE bureaucratic operations
and an exhibited group sense that they are able to control and
manipulate the SDE, not 4ice versa.
The SDE in West Virginia has worked much more successfully in
a policy culture that aAso enhances the "no direct policy
initiation" rule for staff roles. Here, the SDE functions as
subtle lobbyist. In some cases they coordinate pressure groups, as
one staff person explained:
We developed pre-school and handicapped programs with thesupport of lobby groups. We developed a lobby for it.Realizing the potential violation of cultural norms in this
Page X-10
470
statement, this staffer quickly added, I should say the peopledeveloped a lobby. (W. VA,1,1)
Another West Virginia staffer described the elaborate process by
which a policy thrust, over a three-year period, emerged from an
idea, to an SEA proposal, to an SEE prlority, to a Board regulation
and or legislative action:
In your (SEA Program) budget-building, you throw In things thatvou and your staff think they need. Then you develop packagesaround that .... Feel out the internal procesLes andprioritize in relationship to what you think you can get....If you want to be an aggressive executive (rather than waitingfor everyone else to define things and then you get on boardwith them) then you define the needs, capsulize them intopackages, and gain support for these programs. For example, Iput the Principal's Academy on my list two years ago. It cameat about a ten In the SBE's priority list. People saw it andtalked about it. The next year, before the budget process cameIn, we called In all associations and laid out what we weregoing to do, told them what would be on our list, and If theywanted to support it we'd appreciate it. we also involved keymembers of the legislature In that discussion... We hadinternal and external people and had them put it Into theirlegislative programs. Eventually it ,:ame out high on the SBE'slist. (W VA,1,1)
This staffer again insisted that the Department only generates
information for legislators. "We don't officially lobby."
(t4 VA,1,1), he assured us.
This Is a conscious, patient sort of control, a slow by SDE
staff of support for particular policy proposals. Those who are In
for the long term, the bureaucrats, exercise power and Influence
which Is less flashy and obvious then the legislators and governors
who must show results and get attention to keep their posItIons,
but the evidence suggests that they are at least as influential
over the long run.
Page X-11
471
Legislative-state school board boundaries. The boundaries
separating responsibility, credit, and control over education
policy also invo.ve tensions between legisLative committees, the
Senate Education Committees, and the State Board. In Pennsylvania
the House Education Committee Chair, in early 1984, said, "I tell
the State Board 'we created you and we could dissolve you". The
state constitution does not provide for a State Board in this state
-- it was created through legislative action. Tension came to a
head in 1984, when new legislation expanded the state board to
include legislators who head the education committees. This
maneuver enabled legislators to exercise greater control and limit
the competition between board and legislature. One legislator
expressed a common sentiment:
One of the organizations conspicuous by their absence in thisdialogue here is the State Board of Education, whom I have atendency to discount, I think most people in the legislaturedo, too. They look upon them as meddling fools. (PA,1,11).
The House Education Committee sought to dominate the State
Board, the governor, and the SDE by passing legislation mandating
higher, less flexible, minimum curriculum requirements and
statewide curriculum-based testing. Had it become law, this
legislation would have preempted milder state board/CSSO/ governor
proposals. The Senate Education Committee maintained that program
definition and testing policy were not properly legislative
decisions, however. They refused passage of the House Initiatives,
restricting the wishes to "Sense of the Senate Resolutions" until
the House, CSSO, and governor negotiated a mutually acceptable
Page X-12
472
4
compromise which the Senate endorsed. In this instance,
competition for control of the policy initiative became more
important than the actual policy content. While the Mouse
Committee's aggressive stance was not fully support^d, all parties
ultimately agreed to leave initiative in its "proper pl'Ace" -- the
legislature.
Some legislators recognize the assignment of initiative for
certain policy issues to the State Board and SDE. One said,
I thought curriculum changes should be handled by the stateboard instead of by the legislature. I can't see thelegislature standing up and deciding how much time you spend oneach course, what courses to teach; I'm not sure that's ourfunction. (PA,1,8).
Oenerall 'peaking, Senate members are less activist and
interventionist than those in the House. One Senator explained,
I have a tendency to wait until the wrath of battle passes andthen make my decision based upon the result.... (PA,1,11).
In West Virginia, the view that legislators should not get
involved in curriculum or program definition was stronger than in
Pennsylvania. In this state the policy culture dictates that the
state board and the SDE have tLa right to initiate in these
domains. A legislator explained,
The Department of Education makes the program definition andcurriculua decisions.... I think we only react as alegislature. I'm in favor of extending into their [SDE andSBE) area but most legislators are not. (WVA,1,18).
In sum, state-specific cultural definitions of basic operating
principles bind the behavior of CSS0s. SBEs, and legislators in
each state.
Page X-13
473
What Policy Ideas Are Deemed Unacceptable
In addition to allocating assumptive worlds, the right to
initiate policy to various actors, policymakers provide a common
understanding of when policy proposals will be viewed as
unacceptable. Much of this understanding is unstated but appears,
for example, in Pennsylvania respondent's reported assertion that
the reason they have never had a court case on inequity in school
finance because every year the state-aid formula is adjusted to
promote equity. Unlike West Virginia, where inequality is
circulated for many years, the assumptive world of policymakers in
Pennsylvania contains broad acceptance of the view that school
finance equalization must be assured.
Some policy initiatives are doomed to failure because they
challenge the announced views of powerful political interest
groups. To propose such policies is widely seen as ridiculous
marking the advocates as naive and unrealistic. For example, in
Pennsylvania there is considerable behind-the-scenes concern about
unanticipated consequences of recent legislation providing
transportation of students to non-public schools. To the chagrin
of those who originally supported the legislation as an
accommodation to support Catholic schools, wealthy parents are
using this transportation to send children to exclusive private
schools, sometimes into Delaware and New Jersey. Since legislators
on key committees have constituents who benefit from this policy.
A strategy session, on the possibility of changing the law ended
when a legislative staffer said:.
Page X-14
474
%.
As long as we've got those legislators from those districtsthere, no proposal will see the light of day. (PA,3,11).
To propose such a policy, given the political reality that
legislators have strong commitments to protect the interests of
these constituents, is viewed as not only fruitless but as damaging
to the credibility of anyone who tries.
Volley proposals that hurt Philadelphia are also out of line.
In Pennsylvania it Is said,
No matter what it is, If It's not going to help Philadelphia,then it won't fly.
A legislative committee chairman gave an historical account:
In the past, we would allocate block grants. In the early '705Philadelphia sometimes received as much as $50 million In ablock grant strictly for Philadelphia. Fortunately that day Isgone. A few years ago we had a block grant of an additional$100 million in school calbsidy that would have been spread outamong 501 districts depending on their aid ratio. (PA,1,11).
This quote reveals the historical importance of Philadelphia's
political power -- it also shows the loss ef that power in recent
years.
Some formal policies are never honored In practice. As a result,
their neglect becomes an element In the assumptive world of the
policymakers nominally responsible for their oversight. /n
Pennsylvania, for example, policy mandating state support of 50 per
cent of education costs waa adopted, but funds to realize this goal
have never been appropriated. One policymaker told us,
The state government which was responsible for paying 50percent of the cost of education wasn't paying 39 percent andwe were really falling behind so we threw an additional $100million into the pot.... That was the last time we.... came upwith a specific allocation for a specific purpose such asthat.... We kept falling back from that 50 percent. We were
Page X-15
4 75
down to about 39 percent. I understand thi n. year we'll run 42or 43. We're coming back, not close to 50, but we're comingback. (PA,1,11).
Though it is a matter of understanding that the law will be
routinely violated, there continue to be ritual debates, in which
legislators or lobbyists provide figures showing the state falling
far below 50 percent and the Governor's rupresentatives give quite
different figures. It has become part of the informal policy
culture of Pennsylvania that there will be a continuing
discrepancy.
Assumptions about dominant interests end traditions. In West
Virginia, school finance equalization decisions illustrate another
strong assumptive world principle. Until the State Supreme Court's
Pauley v. Salley eecision in 1984, spending large amounts of money
to produce equal access to educational services had been
unthinkable. /n the years before the court case, a few legislators
had tried to work toward equalizing educational facilities and
programs by altering the school-aid formu:e. Sut the court's
solution -- a massive reform of the tax system, reevaluation of the
property holdings in all counties (particularly those with large
corporate-mining holdings), and use of state power to collect and
distribute monies to aid less property rich districts -- would have
been seen as outrageous. But the atate supreme court made such
outrageous policy. One policy actor explained,
excited anger because it required okay counties to pay fornon-okay counties. (W Va,3,3).
The senator recalled:
Page X-16
476
When Recht came down with his decision, all the politiciansscreamed all of this will cost millions of dollars and we justcan't afford it and it's a terrible thing that the judge couldbe so impractical. It's not common sense as to what can bedone in education. He's coming up with all these hyper ideasfor bilingual studies and paying teachers all the same: (WVa,1,18).
Previous policy suggestions about equalized pay, bilingual
education, increased fiscal investment in education, or state
mandated equalization of educational opportunity were considered
ridiculous, against the logi: of the state's assumptive world. That
such policy thrusts were commonplace in other states was
irrelevant. It required a policy actor who defied the assumptive
worlds -- a state supreme cnurt judge, backed by the testimony of
experts and the precedent of other states to issue such a policy.
Not surprisingly, the reaction of other policy actors to the Recht
decision has been slow compliance and implementation on the one
hand, and articulation of an anti-outsider sen*iment on the other
hand. The governor, ln his 1984 State of the State address,
asserted that West Virginians can make policy for schools without
the intrusion of outsiders. That statement drew the loudest
applause of the evening.
Honoring_ orevallin9 values. At any given moment each state's
policy culture makes assumptions about the nature of acceptable
policy mechanisms and goals, thereby focusing the policy
discussian.
For example, the assumptive goal of education policy in
Pennsylvania is the enhancement of quality. Said one respondent,
The present push to raise the standards, with the state board and
Page X-17
477
the legislators all trying to get their stamp on new regulations,is kind of a rush to toughness --- they all want to be perceived asstanding for higher quality." (PA,1,18).
This statement reflects the acknowledgement of the ritual of
competition for dominance in articulating the prevailing values.
More tmportantly, it demonstrates that assumptive worlds include
agreements among dominant actors about what the fundamental goal
is. Key policy actors focus their attention on the same goal, and
that is where the current game will be played; other values will be
subordinated. Policy groups regularly try to ensure that their
means-to-the-same-goal proposals prevail. Few offer policy
proposals directed toward competing goals. In 1984 it was
virtually impossible to challenge the agreed upon assumption that
quality improvement is the essential value to be pursued.
In the rush to raise standards there was general avoidance of
many issues -- choice in the curriculum, variety, equity, or
appropriateness for students, the arts and humanities, and the role
of the school in dealing with social issues like drugs and
intolerance. Quality was narrowly identify with °basic" education.
Those who articulated polloies promoting different values sounded
irrelevant. They were unheArd and likely to lose power in
promcting their unfashionable 7)olicies.
Thus we see that states' assumptive worlds include
understandings about the value and fit of policy proposals. These
tnderstandings affect policy outcomes.
Page X-18
478
Alloprooriate Uses of Power in Policvmaking Activities
This section describes the operational principles by which policy
groups attain influence in the state policy culture. Policy
actors' abilities to either create or to work within a common value
system and rale structure affect their ability to wield influence.
Know your place and cooPerate with those in mower. Outright
rejection of broadly supported values and goals rarely succeeds in
redirecting policy debates. In Pennsylvania's state policy
culture, for example, the association of local school boards
adopted a stance toward the proper basis for policy that virtually
destroyed their inability to work within the prevailing assumptive
world. The result as noted in chapter IX was extraordinarily low
influence. Two quotes illuminate their loss of effective
influence:
I don't look at the school directors' association as thatimportant.... their political clout in this state isSchool directors are usually elected because of people likemyself and the rest of the political people. So they're notthe ones that whip the political clout on you.... Theirlobbyist will go to our meetings, and they'll start espousingpositions and issues against everything that we do, and theythink that we're locked in with the teachers and theadministrators associations.... A lot of this animosity came upin the recodification effort. (PA,1,13).
They were always against recodifitcation. They alwayswould fight us tooth and nail .... They would try to say thatit cost too much money, we're mandating too many things.They'd just like to wipe out the whole code and juet do itthemselves, just at the local level. (PA,1.13).
It number of other respondents echoed this perception that the
School Boards AssociatIon was Inflexible and inappropriately
insisted that all states mandate come with fuAl special funding.
Page X-19
479
'11
In both Pennsylvania and West Virginia, the school boards
associations were not seen as a positive member3 of the education
interest group coalition. A key lobbyist explained that the WVS8A
prefers to act on its own. He then explained that local schcol
boards are highly political -- at election time, school board
members closely watch the positions taken by the local
superintendent and frequently retain or fire the superintendent,
based on his activities during the election. As a result, the
school boards associations in West Virginia) is rejected by other
interest groups.
Touch all the bases. The stories of policy actors included a
number of incidents where informal rituals of required involvement
were violated. The assumptive worlds regarding observance of
required ceremonies, underlying structures that constitute
boundaries are revealed by these stories. If the boundaries of
protocol or areas of responsibility are violated, there must be
restitution. If one group gets out of line, the others will punish
and restore the boundaries. For example, a legislative education
committee chair recalled,
The Governor called a press conference when I was in NewOr/eans...to announce his major initiative for education. Heshould have known better than to do that when / was out oftown." fPA,1,8).
The chairman made it clear that legislative action would not
proceed as long as such violctions continued. Thus, policy actors
are constrained in their power to mobilize policy by rules about
bases to be touched.
Page X-20
r,
Something for everyone. Mobilization of policy is hampered
when policy actors' needs are not met or when proposals would harm
their constituents or members. In order for policy proposals to
advance, policy actors must be convinced that they will benefit.
In Pennsylvania, for example, the CSSO explained the necessary
strategy for consensus, given his perception of competition among
interest groups:
When we vere formulating the new curriculum regulations ... Theprocess was interesting because no one got everything hewanted, but they (all of the interest group representatives)were able to see that no one else got everything they wantedeither... I think some of the groups care as much about whatother people are getting as what they themselves want....Consequently, there was very little resistance to Its passage.(PA,1,18)
Bet on the winner. Campaigning for a candidate who loses is a
sure way to lose power and opportunities to have one's values and
meeds incorporated in policy. For example, the Pennsylvania
teachers' association's easy access to the governor's office in
Governor Thornburg's first term disappeared when the association
supported Thornburg's challenger. Thornburg won and PSEA lost in
power and ability to present its positions to the man who was in
the process of becoming the most influential education policy actor
ln that state.
Similarly, the Chairmen of the West Virginia Senate Finance and
Education Committee lost staff and office and even membership on
the committees when they supported the losing candidate for
governor. The new education and finance committee chairs were
relative newcomers to education issues. One said that he took the
Page X-21
481
('
chairmanship of education because nobody else (among those who had
campaigned for the winners) wanted it. In these cases, the
principle of betting on the winner outweighed any logic regarding
the "authority of expertise".
Limits on social relationships. Inevitably, with their
frequent sharing of policy campaigns, information, and work space,
. policy actors develop friendships and special helping
relationships. However, when policy or career interests demand
abrogation of the special relationship, it can cometimes be done
with impunity and clear conscience. Several Pennsylvania policy
actors shared ownership In a racehorse, and the camaraderie that
accompanies such sport. This lent the appearance that these policy
actors were sharing information and working together on policies.
However, one of these policy actors told the story of being
surprised when his friend withheld information and took an opposing
position. He learned that policy actors' guiding principles put
pclitical career maintenance above friendship.
Constraints on staffers. Legislative staff work within a set
of historically-set operational principles. In Nest Virginia,
there are few legislative staffers; those who are In permanent
positions do have a national perspective. Pew of these are women,
In fact, there are few professional women In the state policy
arena. One staffer commented that professional women live with the
real.,zation that they must be different, must make a distinction
between themselves and those who, in the past, were secretaries of
legislators who were very probably their mistresses too, who got
Page X-22
482
the best parking places. The staffer called this "whore-hiring"
and commented (as did others) that some legislators still see
belonging to the legislature as a way to have a lark in the
capitol. staffers' status is still being established in that
state.
On the other hand, in Pennsylvania, several key legislators,
even the "education specialist" legislators, openly stated that
their staff were the ones who really knew education policy.
Staffers' status may be quite dependent upon what is conferred by
legislators, combined with the perceptions and expectations of
staffers historically. Thus the legislative staff, no matter how
expert, must carefully cultivate the good will of legislators. To
do so, they must ensure that their information &II assistance is
keyed into the value systems, and into the framework of the
dominant values.
Work with the constraints and tricks that are known. There
are accepted tricks known and used by policy actors for
circumventing problems. In both West Virginia and Pennsylvania
policy actors "close their eyes" and allow the Department of
Education to overestimate the cost of bus transportation in their
blidget so that they can "enjoy that flexibility" (W VA,3,15).
There is an understanding among the Department of Education, key
lobbyists, and legislative staff that this trick is functional.
In West Virginia, state budgeting processes would be upset by
massive strikes. However, policy actors have built in the
expectation that there will be a coal miners' strike every four
Page X-23
483
years. History, the sense of coal miners' solidarity, and the
constitutional mandate to balance the budget require that the
budgeting process build in this expectation of lower revenues
during a strike. Everyone knows that In the West Virginia state
policy culture.
Kirst
(1981) identified the existence of policy issue networks, whereby
values-assuaptions, ways of framing policy issues, research
reports, and consultants spread ideas for education policy
formulation among states. There was evidence of this phenomenon
with a few policy actors, particularly through contacts with
research institutions, universities, Education Commission of the
States, National Conference of State Legislators, and the like.
They use these contacts to get information on the standing of their
state on different educational measures and Initiatives, and to get
ideas. Legislators' participation In Education Commission of the
States and, in West Virginia, the Southern Regional Education
Conference enhanced the spread of ideas for education policy
formulation too.
Policy issue networks also function within the national
education interest group structures but they particularly function
within regions. Thus, a Pennsylvania teachers association lobbyist
gleans information about salary and pension policies along with
ways of conceptualizing Issues from counterparts in others states
at their regional meetings. West Virginia policy actors' ties with
the Southern Regional Education Council have shaped their ideas and
Page X-24
484
policy formulation, to the exclusion of other associations -- they
seldom attend ECS or other conferences, feeling they get all they
needs from Southern.
Key policy actors' sponsorship is essential before this
information gleaned from educational researchers or from interstate
commissions will be used. Dominant actors' perception of the
importance of research and interstate communication determines its
use. For example, a West Virginia Principals' Academy was
initiated by the combined efforts of the SDE and the House
Education Committee Chair, with the support of a staff grant from
the National Council of State Legislators for applying the
"effective schools research" to policy. Contacts were made with
the National Association of Secondary School Principals and the
Southern Regional Educational Council, but the coalition of
dominant actors promoting the policy was more important to success
than the research base.
A Pennsylvania Senator's words offer a possible explanation
for resistance to use of research and experts in that state;
don't think education in this state has had spectacula.'leadership. I think aggressive leadership has its hazards, andthe legislature is one of those hazards. The legislaturedoesn't like bright, hard-working people -- educators -- andthey have a tendency to be threatened by them. It brings outthe worst in the legislative process. (PA,1,11).
The use of interstate comparisons to Justify policy. A common
activity in policy formulation, related to policy issue networks,
is making comparisons with other states. This ranges from an
opportunistic use of crude comparisons to justify policy proposals,
Page X-25
485
to a general and continuing concern for the state's standing in
comparison to other states. Por example, the Pennsylvania policy
proposal for statewide minimum salary was promoted bi a coalition
among teachers' associations and the House Education Committee
chair. They gained credibility by citing how many other states are
using or proposing minimum salary scales. They did not, of course,
mention that the other states have state structures, such ae West
Virginia's lack of collective bargaining and TO percent state
funding of education, quite different from Pennsylvania, where the
state funds less than 50 percent of education costs and salaries
are negotiated at local level.
ExDerimenting with untested_Pglicies. Part of the assumptive
world In West Virginia is an understanding that there can be no
outright experimentation in education policy. One legislative
staffer, while discussing innovative ideas for policy, said:
Such things won't happen real fast because if you propose it,the first thing they'll have to know is what other states aredoing it and how did it work and how much did it cost and whatare the results. They won't consider it without that kind ofinformation. (W VA,2,21).
This comment was buttressed by an SDE seLlor staffer's description
of the laborious process of moving the idea of Principals Academy
policy from conception to implementation, through the maze of
resistance.
Special State Conditions Affecting Policy
State policy actors hold assumptions about the unique features
of their state that shape their policymaking. There is a
Page X-26
486
prevailing story about what features of the state that must be
considered in evaluating all policy proposals.
West Virginia's policy actors, for example, were congtantly
aware that they ranked near the bottom of all states on teacher
salary, graduation rates, etc. Many policy decisions are justified
by reference to statistical comparisons with other states. The
walls of the House Education Committee meeting room had a huge
chart, with West Virginia highlighted, showing the finited States
Department of Education statistics on inputs and outputs in the
education systems of all the states. Many West Virginia policy
actors cited these statistics as they explained education policy
issues.
Cultural expectations. Intriguing data on how cultural
expectations combine with economic and social realities to affect
state education policymaking come from West Virginia. One
legislative staffer told the classic joke about West Virginia's
attitude toward education:
There's an old saying about the West Virginian who said, 'I
went to first grade, then I went to second grade, and by golly,by then I decided that going on to higher edvcation was not forme!' (W VA,3).
Although West Virginia ls currently making major strides
toward statewide improvement in its education system, this story
provides a sense of historical context. Another informant reported
that out-of-state corporations owning land and mineral rights, have
a vested interest in avoiding property tax assessment and keeping
educatIon costs low. His sense was that West Virginians have a
Page X-27
47
passive attitude, a feeling that $f you don't strive for an
excellent education system you can't be called a failure.
The Effects of Assumptive Worlds in the Policy. The
findings presented above identified four broad domains within which
the assumptive worlds of policymakern shape their perceptions and
actions. Using data from two of the six states studied, we
Illustrated the ways in which policy cultures: (1) control policy
initiation, (2) determine what proposals will be deemed unworthy of
serious consideration, (3) limit the range of acceptable political
mobilizing activity and (4) remind policyaakers of special
conditions within their states. We turn now to an examination of
how these cultural assumptions contribute to the overall process of
embedding values in concrete policy decisions. As suggested ln
Figure 9-1, policy cultures and their related assumptive worlds
make two distinctly different contributions to the policy process.
First, they have the effect of creating and maintaining a stable
and predictable decisionmaking environment. Second, they build
cohesion among decisionmakers, facilitate coalition formation and,
hence, help to channel power and influence toward specific decision
issues.
Creating and Maintaining a Predictable Environment
Order and predictability in the state policy culture are
maintained by the rules regarding areas of right and responsibility
to initiate and the rules of behavior for using power to mobilize
policy. These cultural elements are understood by insiders in the
policy arena. In an environment where 411e competition for control
Page X-28
488
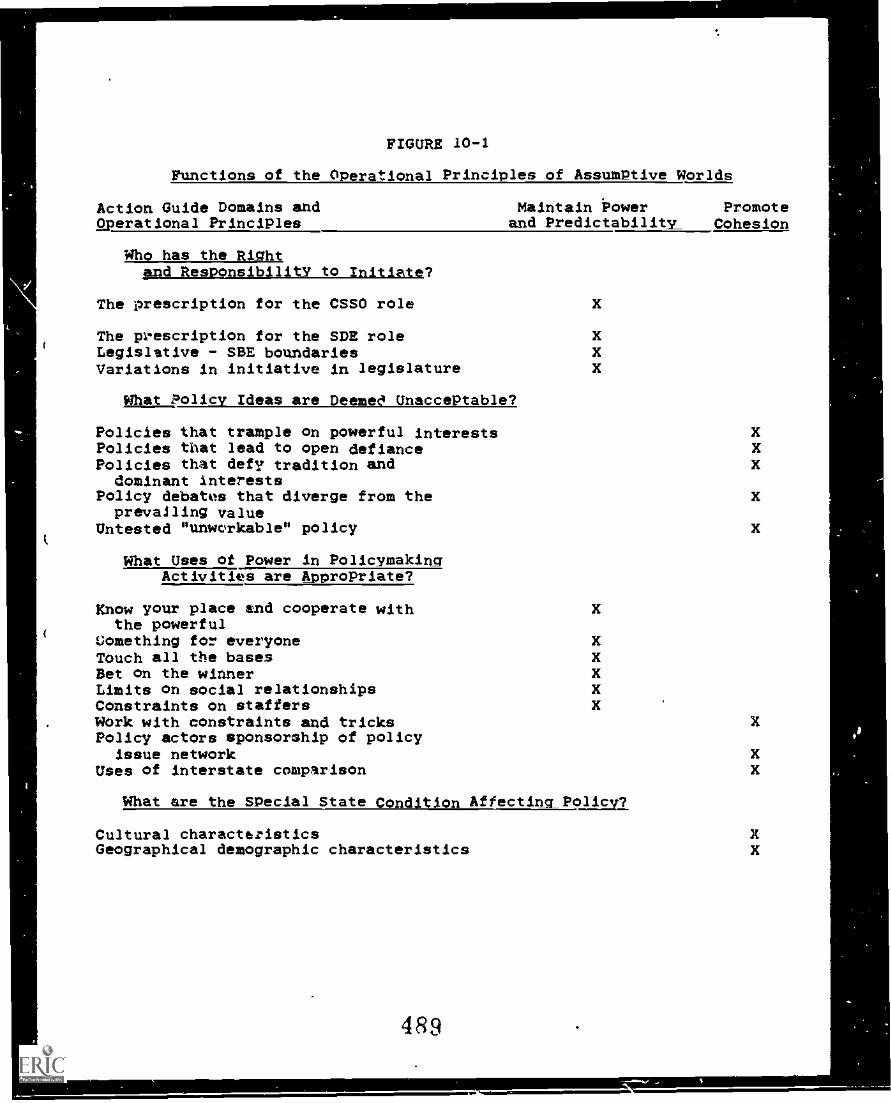
FIGURE 10-1
Functions of the Operational Principles of AssumPtive Worlds
Action Guide Domains andpperational PrinciPles
Who has the Right
Maintain i)ower Promoteand Predictability_ Cohesion
and ResponsibilitY to Initiate?
The prescription for the CSSO role X
The prescription for the SDE role XLegislative - SBE boundaries XVariations in initiative in legislature X
What ?olicV Ideas are Deeme0 UnaccePtable?
Policies that trample on powerful Interests XPolicies that lead to open defiance XPolicies that defy tradition and Xdominant interests
Policy debates that diverge from the Xprevailing value
Untested "unworkable" policy X
What Uses of Power in PolicvmakingActivities are Appropriate?
Know your place and cooperate with Xthe powerful
Vomething for everyone XTouch all the bases XBet on the winner XLimits on social relationships XConstraints on staffers XWork with constraints and tricksPolicy actors sponsorship of policy
issue networkUses of interstate comparison
What are the Special State Condition Affectins PollEy2_
X
XX
Cultural charactftristics XGeographical demographic characteristics X
489
Is the main game, there has to be a system which defines renegade
behavior. The data are replete with statements about what Is
proper behavior and even more replete with stories about remembered
violations. Policy actors' stories about their own acculturation
In the policy arena are full of examples of learning by faux pas
and of dismay when others violate the rules, overstep the
boundaries, or fail to observe the rituals. In the policy world,
there Is a predictability that comes from the assumptive world.
Stability Is created, everyone knows, for example, who will be
allowed to share in agenda-building. There Is security In knowing
that the ritual of touching all bases, involvement, and sharing
information will be observed. Behavior that, In another setting
would be upsetting, e.g. not supporting a friend's position, or
compromising to ensure something for everyone, is not only
acceptable but necessary when the prevailing culture calls for
boundary maintenance and respect for established values. Every
effective membar of the policy culture knows thls. Those who do
not observe this system of rules upset the stability. They not
only risk losing their own positions of power, but they deflect the
attention of many others away from the policy Issues themselves In
order to rebuild the hare cultural framework that provides the
criteria for accommodation and compromise.
This system of rules, roles, proper behavior and boundaries Is
most effective In maintaining stable power relationships. Groups
and individuals can gain power If they succeed in challenging the
rules and changing the the culture. If they try and fall, however,
Page X-29
490
they suffer insignificant losses. Most of the time, most
policymakers prefer using the power and position given them by the
prevailing culture to the high risks involved with trying to change
it.
The Effect of Building_Cohesion
Since every policy culture made up of Individuals with a broad
array of different personal values and blocraphies and groups with
an array of positions, demands, and competing values, policy actors
must find a way to come to agreement from time to time, albeit
temporarily, on a particular policy choice, While the range of
options for pollcymaking is theoretically infinite, actual policy
debates are conducted within a rather limited range. Assumptive
world function to limit the range of options and focus debate
within certain understood priorities.
The common understandings about what matters, are part of the
fundamental nature of every state system, they constrain policy
choices and create a shared sense of what threatens the present
system, and what opportunities for action should be considered
promising. The use of symbolAcally powerful words, phrases and
ceremonial activities evoke dominant themes, and condense a load
of state-specific meanings into provocative value positions and
issues that bring peofle together for action. The resulting group
coheslon allows a shorthand communication system to develop among
insiders in policymaking. Dissonant ideas are not articulated;
policies that promote unfashionable values are not formulated. It
also functions to exclude those who know only the surface language,
Page X-30
491
without Its deeper meaning and symbolic load. It facilitates
pollcymakIng; It also limits pollcymakIng by excluding people and
Ideas that do not fit with the local language and stories.
LaPlIcatIons
Assumptive Worlds as Values-Translators
Fitting Into a state-specific assumptive world means complying
with the rules and working within the constraints of proper Ideas
and behavior, only proposing Ideas that are °appropriate", attuned
to the unique features of that state. Aberrant behavior, ideas,
and proposals are filtered out. Thus, In order to have their ideas
and values Incorporated in the pollcymakIng process, state policy
actors must move away from the parochial values and preferences of
the people they originally represent. They must be re-created to
fit within the assumptive world of the pollcymaking system. They
must, In effect, be translated so that they will be recognized,
Included, and heard In the policy culture.
Where ,he translation falls, as was the case with the
Pennsylvania teachers association support for a state-wide minimum
salary. Their proposal was not given serious consideration because
it could not be translated to fit Into the context of an assumptive
world where the PSEA had backed a political loser, and where school
boards Incessantly demanded that the state pay for the full cost of
any state mandate. In addition, the proposal was not part of the
governor's Initiative, at a time when the governor, the CSSO, and
the key legislators were coalescing around quality as the
Page X-31
412
understood goal and personnel rather than finance reform as the
appropriate approach.
Thus policy actors alter, re-phrase, create, change the image
and symbols, and change the content and goals of policy preferences
if they are to maintain power and have a chance of seeing their
needs met. The alterations are made in response to the assumptive
worlds. They transltte preferences to fit.
AssumPtive Worlds as Barometers of Change
Action guides are embedded in the assumptive worlds shared by
state policy actors. When there is a shift in the policy culture,
existing assumptive worlds are upset. The turmoil revealed in
stories of "outrageous" behavior, wild proposals, policies that jar
tradition. For example, when Pennsylvania's Governor Thornburg
announced his 1983 comprehensive agenda for education, this upset
the hierarchy and boundaries of power and responsibility in that
policy culture. Similarly, Judge Recht's decree that the
legislature must equalize West Virginia school children's access to
quality education signalled realignment of values. In these cases,
state policy actors defied the assumptive worlds. They did so with
enough force and power to chanaft the assumptive worlds of other key
actors. Thornburg's action signalled a new alignment which
legislators, the CSSO, and other policy actors htd to zonsider in
all future policy mobilization. Recht's decision forced the West
Virginia policy culture to alter its values and re-shape its ideas
of "fashionable policies" to include equity goals, tied to the
state tax system.
Page X-32
493
In the Recht and Thornburg examples, powerful actors applying
the force of forral authority were'able to upset the stable
hierarchy and alter the values in the policy culture. Less
powerful actors attempting to defy the assumptive worlds would 'risk
sanctionsloss of power and exclusion from policy deliberations.
The A Nation at Risk report provides and excellent example of
outside influence that upset the assumptive worlds of state policy
actors. The national attention given to the quality of education
in this report obligated formal policy actors to respond. /n
states where CSSOs and legislators had formulated education policy
agendas, governors, like Thornburg, had to respond. The Risk
report, with its policy proposals for specific mechanisms for
controlling quality implementation of quality improvements (e.g.
required homework, competency exams) obligated policy actors to
demonstrate an assertive, controlled program of school improvement
or else, in effect, admit to constituents that there was no
leadership for excellence in education.
Upsets in the assumptive worlds -- boundary crossing, defiance
of norms, policy proposals that veer away from tradition -- are
indicators of significant shifts in values, power alignments and
understandings about what is pcowible and preferable. Assumptive
worlds are barometers that predict change in state policy cultures.
Any effort to explain education policymaking must eventually
come to terms with the assumptive worlds of key policy actors. /n
our view, the concept of policy culture, with its embedded
assumptive worlds, provides the integrative core for a theory of
Page X-33
494
./
Oa.
educational policymaking. Policy cultures arise from the hietory,
the values and role obligations of key actors, the formal structure
of power and responsibility, partisan politics, and the Informal
processes of the policy world. The assumptive worlds unique to
each state's policy culture binds together the other elements of
the policy system. Revealed by the words and stories of individual
policymakers, assumptive worlds link all other elements of the
policy system Into an organize whole, capable of guiding and
sustaining intelligent behavior on the part of individuals and
groups within the systems.
Page X-34
495
Footnote
In order to protect anonymity, subjects are given labels;
first their state is identified, then the type of data collection,
then the number assigned to that particular informant. Thus
PA,1,11 means this Pennsylvania quote is from round 1 of data
collection, code number is II. W VA,2,22 is a West Virginian
quoted from round 2 of data collection, and her code number is 22.
Data collected from participant observation were designated as
round 3. Thus W VA3,14 s West Virginia data collected during
informal participant observation 3 and the person providing the
datum was code number 14.
REFERENCES
Adams, X. (1982), A changing federalism: The condition of the
states. Denver, CO: Education Commission of the States.
Bailey, Steven and others. (1962). Schoolmen and Politics. New
York: Syracuse University Press.
Burlingame, M. (1983). Stories and local level politics and
education. Unpublished manuscript, University of Illinois, Fall.
Campbell, Roald F. and Mazzoni, Tim L. Jr. (1976). State PolicV
making_for the Public schools. Berkeley: McCutchen Publishing
Corp.
Crain, Robert. (1969). The Politics of school degredation. Chicago:
Aldine Publishing 4o.
Donmoyer, R. (1984). Choosing from plausible alternatives in
Interpreting qualitative data. Paper presented at the annual
meeting of the AERA. New Orleans, April.
Easton, D. (1965). A systems analysis of the political life. New
York: Wiley.
Elazar. D. (1972). American federalism: A view from the states
(second edition). New York: Crowell.
Elazar, D. (1984). (cited in Ch. 2: need to get from Fred.)
Purhman, Susan and Rosenthal, Alan. (1981). Shaping education policy
in the states. Washington, D.C.: The Institute for Education
Leadership.
Germs, W., Guthrie, J. & Pierce, L. (1978). School finance: The
Page X-36
497
economics and Politics of education. Englewood Cliffs, N.J.:
Prentice Hall.
Glazer, B. and Strauss, A. (1967) Thedismegy_of _grounded theory.
Chicago: Aldine.
Greenfield, T. (1985). Trial by what Is contrary. gurriculum
InguirY, vol. 15, no. 1, p. 1-3.
Iannaccone, L. (1967). Politics In education. New York: Center for
Applied Research In Education.
Kirst, M. W. (April, 1981). The state role In education Policy
innovation. Policy paper no. 81-Cl. Institute for Research on
Educational Finance and Governance.
Marshall, C. (1984). Elites, bureaucrats, ostriches and pussycats:
Managing research .in policy settings. Anthropology and Education
QuarterlY, Vol. 15 No. 3, p. 194-201.
Masters, N., Salisbury, R. and Eliot, T. (1964). State politics and
the public schools. New York: Alfred Knopf.
McLaughlin, M. W. (October, 1981) State involvement In local
education quality issues. Interim report prepared for the
Education Policy Development Center for Equal Educational
Opportunity for Disadvantaged Children, Rand Corporation.
Mechley, R. (1981). Court grants education preferred funding status
In West Virginia. Journal of Education Finance, 7 (Fall),
227-229.
Milstein, M. & Jennings, R. (1973). Educational policY-making and
the state legislature: the New York ex erience. Hew York:
Praeger, 1973.
Page X-37
498
Merritt, R. L. (1970). §ystematic approaches to comParative
politics. Chicago: Rand McNally.
Mitchell, Douglas A. (1981). Shaping legislative decisions:
Education policy and the social sciences. Lexington, Mass: D.C.
Health & Co.
Murphy, J. T. (1976). "Title V of ESEA: the impact of discretionary
funds of state educational bureaucracies." In W. Williams, and
R. P. Elmore (Eds.), Social program implementation. New York:
Academic Press.
Murphy, Jerome T. (1980). State leadership in education: On being_g
z7hief state school Office . Institute for Educational
Leadership, The George Washington University, Washington, DC.
Odden, A. and Dougherty, V. (1982). State Programs of school
improvement: A 50-state survey. Denver, Colorado: Education
Commission of the States.
Pfeffer, Jeffrey. (1981). Management in symbolic action. In
Research in Organizational Behavior 3:1-52. L.L. Cummings and
B.M. Staw, eds.: JAI Press.
Rosenthal, Alan and Puhrman, Susan. (1981). Legislative education
leadership in the states. Washington, DC: The Institute for
Educational Leadership.
Rosenthal, A. and Puhrman, S. (Fall 1982). State legislatures and
education policy: An overview. Educational Horizons.
Rossman, G., Firestone, W. and Corbett, H.D. (November, 1984). Plan
for the study of professional cultures in improving high schools.
Unpublished paper, Research for Better Schools.
Page X-38
499
Salancik. G. H. & Pfeffer, J. (1978). A social information
processing approach to job attitudes and task design.
Administrative Science Ouarterlx. 23:224-253.
Schatschneider, E. E. (1960). The semi sovereign people. New York:
Holt, Rinehart.
Schutz, W. C. (1958). The interpersonal world. Palo Alto. CA:
Science and Behavior Books, Inc.
United States Bureau of the Census. (1978). County and city data
book, 1977. Washington, DC: U.S. Printing Office.
Wahlke, Eulau. E., Duchanon, W.. and Ferguson, L. C. (1962). The
legislative system: Explorations in legislative behavior. New
York; John Wiley & Sons, Inc.
Wirt, F. and Kirst. M. (1982). Schools in conflict: The politics of
education. Berkeley, CA: McCutchan.
Young, K. (March 1977). Values in the policy process. Policy and
Politics (5)3. 1-22.
Wildavsky. A. (1964). The politics of the budgetary process.
Boston: Little, Brown.
Page X-39
5 ?0
SI
APPEND/CES
Page Ap-1
501
APPENDIX L
FIRST ROUND INTERVIEW PROTOCOL
(Initial Interviews with Key Policy Actors)
INTRODUCTORY STATEMENT:
It's good of you to take the time to meet with me...
As you may recall from my letter, I am part of a research team beingsupported by the National Institute of Education to review state-leveleducation policies. We will be taking a detailed look at six states --trying to develop a comprehensive picture of each state's overall policyframework. We will be looking at education statutes and regulations ineach state, but will need help from knowledgeable people like yourself inorder to get a feel for how written policies are working out in actualpractice.
This is the first of several visits which r and (name), my researchassociate will be making to (The State Capital). This week I'll beinterviewing about a dozen key people here in (The State Capital) -- someelected officials, a small group of senior staff peoplt., and a fewrepresentatives of the major education interest groupe. While I'm doingthese interviews, (name) will be spending time in the state librarycollecting various documents and reports which will help to clarify theeducational policy picture for us.
Before we begin, I would like to record our conversation, if I may-- that way I won't have to slow down to take notes. The recording willbe for research purposes only -- no one except members of our researchteam will have access to the tape, and we won't be quoting people by namein our final report. rf in the ceurse of our conversation anything comesup which you would rather not have on tape, just sht;I: the machine offwith the switch here on the microphone (indicate how to work the switch).
(After the recorder is working)... There are three matters rad liketo ask you about:
1. Key actors in (name of state's) education policymaking that youfeel we should be sure to talk with,
2. Any reports or other documents you think would be helpful to usin getting a clearer picture of educata policy in this state, and
3. I'd like you to give me a little background onpolicies in this state. (Indicate one of the seven SPMs.)
Page Ap -2
t. 4
Perhaps you have some questins about the project before we begin?(Remember that review and pnalvsis of overall policy frameworks and basiceducation policy goalA are the key terms in our explanation of theproject).
OK, let's talk about the key education policy people in this state.If we could only do 8 or 10 interviews on education policy issues in thisstate, who would you suggest that we talk to? (Ask about knowledgeablepeople in each of the seven policy areas: governance, revenuegeneration, resource allocation, program definition, personnelcertification, student assessment, and curriculum materials development).
Let's talk a bit about printed material which might help us get ahandle on policy and practice in this state. Can you put me onto anygood reports or sumnaries of education policy in this state/ (Probe forhelp regarding each of the seven policy areas, as well as generalinformation about issues and practices).
Could we turn now to a bit of background in the area of (particularpolicy area). I know this state has and
(name a couple of policy elements)in this area. How would you describe the overall framework of(particular policy area) policy?
What do you feel are the most important goals or objectives ofpolicy in this area?
Have there been major changes in this area in the last few years?(What brought those changes about?)
Are you personally happy with the way these policies are working?
CLOSING STATEMENT:
Thank you for your time (this morning)--you have been extremelyhelpful. We would like to come back to talk with you again at a laterdate, after we've had a chance to review the available written materialand talked to some of the other key people. Sy that time, I hope we'llhave a pretty good idea about how our six states differ, and you couldhelp me check on our interpretation of the major education issues andgoals in this state. At that pofnt, we'd be happy to provide you Wthsome information about our overall analysis, if you'd be interested.
Page Ap -3
5(13
APPENDIX 2.
SECOND ROUND INTERVIEW PROTOCOL
ALTERNATIVE STATE EDUCATION POLICY MECHANISMS PROJECT
INTERVIEW PROTOCOL
INTRODUCTORY STATEMENT:
To those interviewed previously: Since we last talked I have metwith the other team members on our state-level education policy researchprojeet. We had a chance to compare notes on the different approaches toK-12 education policy being used in our six state sample.
Now we would like to ask you, along with the others we havepreviously interviewed, to respond to a common set of questions so thatwe can compare policies and programs across the states.
To those not previtiusly interviewed: As I mentioned in our letter,I am part of a team funded by tne National Institute of Education to takea look at state-level education policy in six states. Preliminaryinterviews were held ln each state a few months ago. The peopleinterviewed in this state identified you as a person we should be sure totalk with in order to get a full understanding of K-12 education policyin this state.
Since doing our preliminary interviews, the research team met todiscuss the various approa::hes to K-12 education policy being taken inour slx sample states. We have developed a common set of questions to beused in each state SO that we can more fully understand the similaritiesand differences in approach across the sample states.
If you don't mind, I would like to tape record our interview.
*** TURN ON TAPE RECORDER ***
Although the specifics differ from state to state, our preliminarywork indicates that similar basic issues are being worked on in moststates. I would like to go over some of these issues with you--they aredescribed on the pages of this notebook.
*** GIVE RESPONDENT THE NOTEBOOK ***
Page Ap -4
5-'4
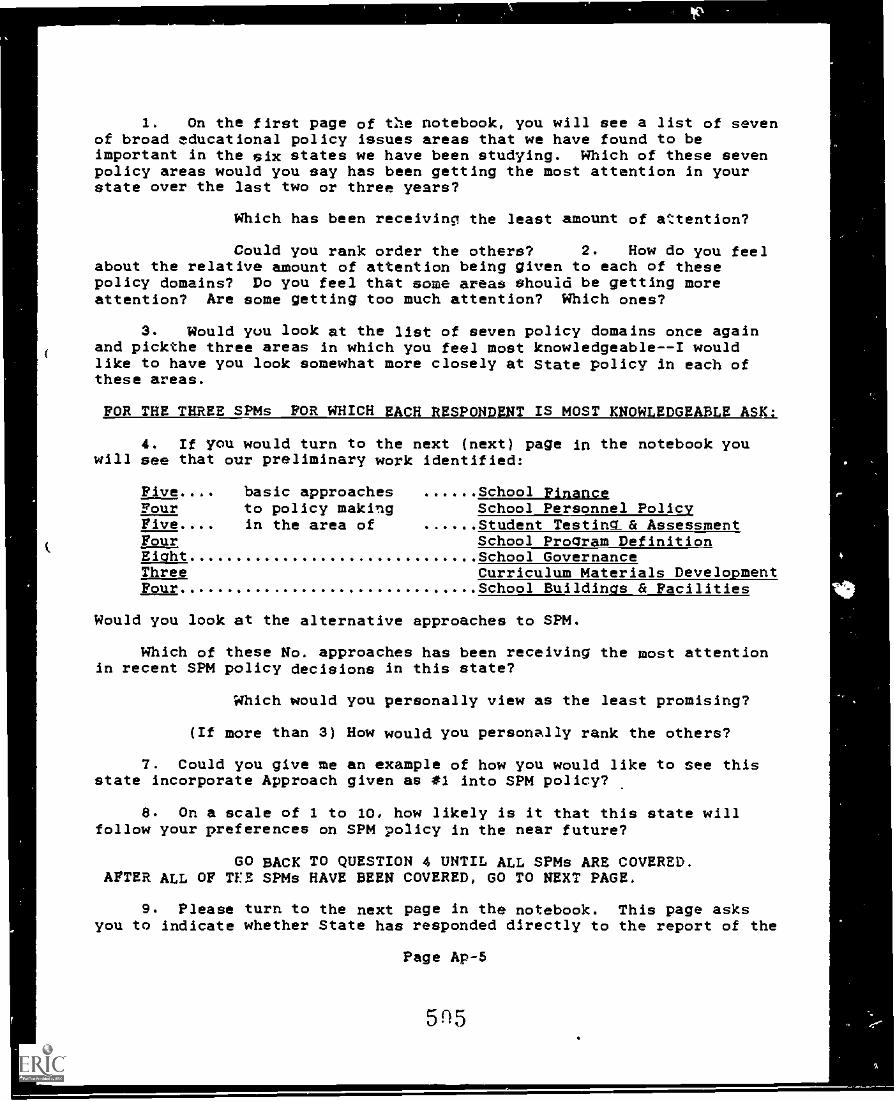
1. On the first page of the notebook, you will see a list of sevenof broad educational policy issues areas that we have found to beimportant in the six states we have been studying. Which of these sevenpolicy areas would you say has been getting the most attention in yourstate over the last two or three years?
Which has been receiving the least amount of attention?
Could you rank order the others? 2. How do you feelabout the relative amount of attention being given to each of thesepolicy domains? Do you feel that some areas should be getting moreattention? Are some getting too much attention? Which ones?
3. Would you look at the list of seven policy domains once againand pickthe three areas in which you feel most knowledgeable--I wouldlike to have you look somewhat more closely at State policy in each ofthese areas.
FOR THE THREE SPMs FOR WHICH EACH RESPONDENT IS MOST KNOWLEDGEABLE ASK:
4. If you would turn to the next (next) page in the notebook youwill see that our preliminary work identified:
Five..., basic approaches School FinanceFour to policy making School Personnel PolicyFive..., in the area of Student Testing_& AssessmentFour School Program DefinitionEight School GovernanceThree Curriculum Materials DevelopmentFour School Buildings & Facilities
Would you look at the alternative approaches to SPM.
Which of these No. approaches has been receiving the most attentionin recent SPM policy decisions in this state?
Which would you personally view as the least promising?
(If more than 3) How would you personally rank the others?
7. Could you give me an example of how you would like to see thisstate incorporate Approach given as #1 into SPM policy?
8. On a scale of 1 to 10, how likely is it that this state willfollow your preferences on SPM policy in the near future?
GO BACK TO QUESTION 4 UNTIL ALL SPMs ARE COVERED.AFTER ALL OF TEE SPMs HAVE BEEN COVERED, GO TO NEXT PAGE.
9. Please turn to the next page in the notebook. This page asksyou to indicate whether State has responded directly to the report of the
Page Ap-5
5 115
4
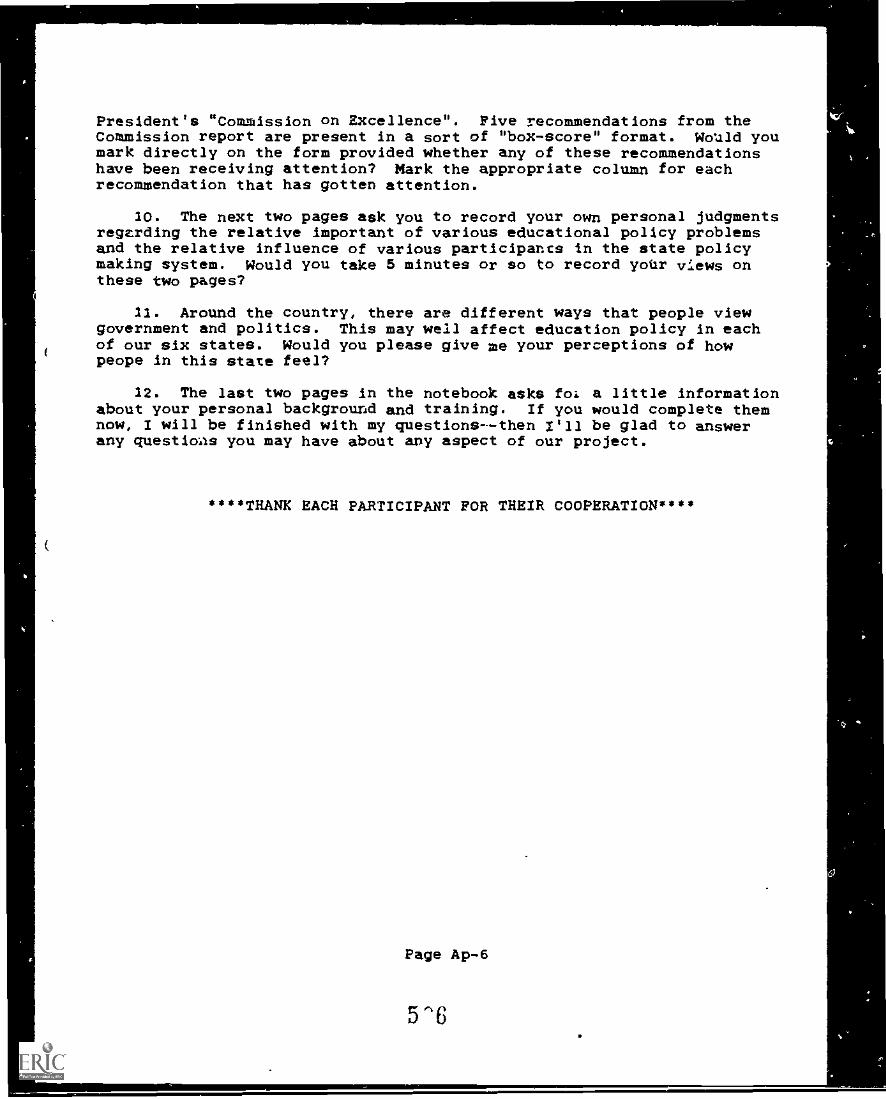
President's "Commission on Excellence". Five recommendations from theCommission report are present in a sort of "box-score" format. Would youmark directly on the form provided whether any of these recommendationshave been receiving attention? Mark the appropriate column for eachrecommendation that has gotten attention.
10. The next two pages ask you to record your own personal judgmentsregarding the relative important of various educational policy problemsand the relative influence of various participates in the state policymaking system. Would you take 5 minutes or so to record yotr views onthese two pages?
11. Around the country, there are different ways that people viewgovernment and politics. This may well affect education policy in eachof our six states. Would you please give me your perceptions of howpeope in this state feel?
12. The last two pages in the notebook asks fol a little informationabout your personal background and training. If you would complete themnow, / will be finished with my questions--then /'ll be glad to answerany questioas you may have about any aspect of our project.
****THANK EACH PARTICIPANT FOR THEIR COOPERATION****
Page Ap -6
5 '6
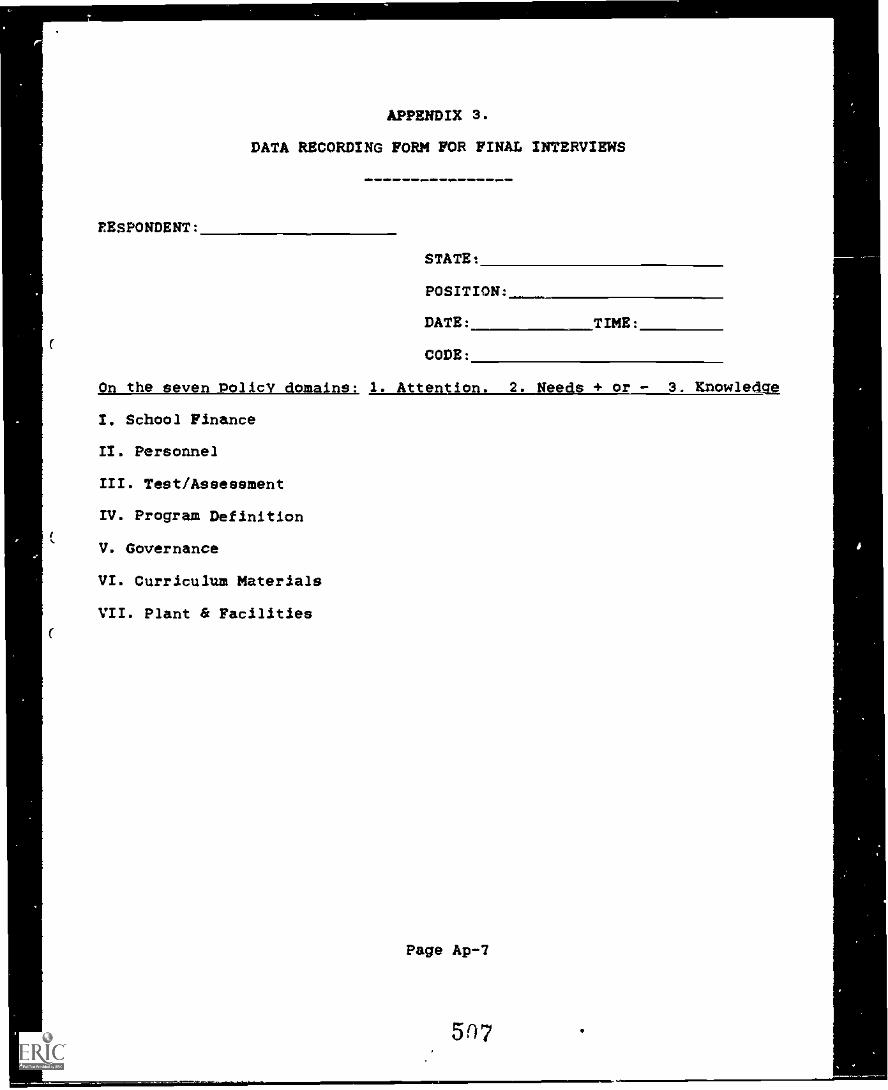
RESPONDENT:
APPENDIX 3.
DATA RECORDING PORK POR FINAL INTERVIEWS
STATE:
POSITION:
DATE: TIME:
CODE:
On the seven Policy domains: 1. Attention. 2. Needs + or - 3. Knowledge
I, School Finance
II. Personnel
III. Test/Assessment
IV. Program Definition
V. Governance
VI. Curriculum Materials
VII. Plant & Facilities
Page Ap -7
507
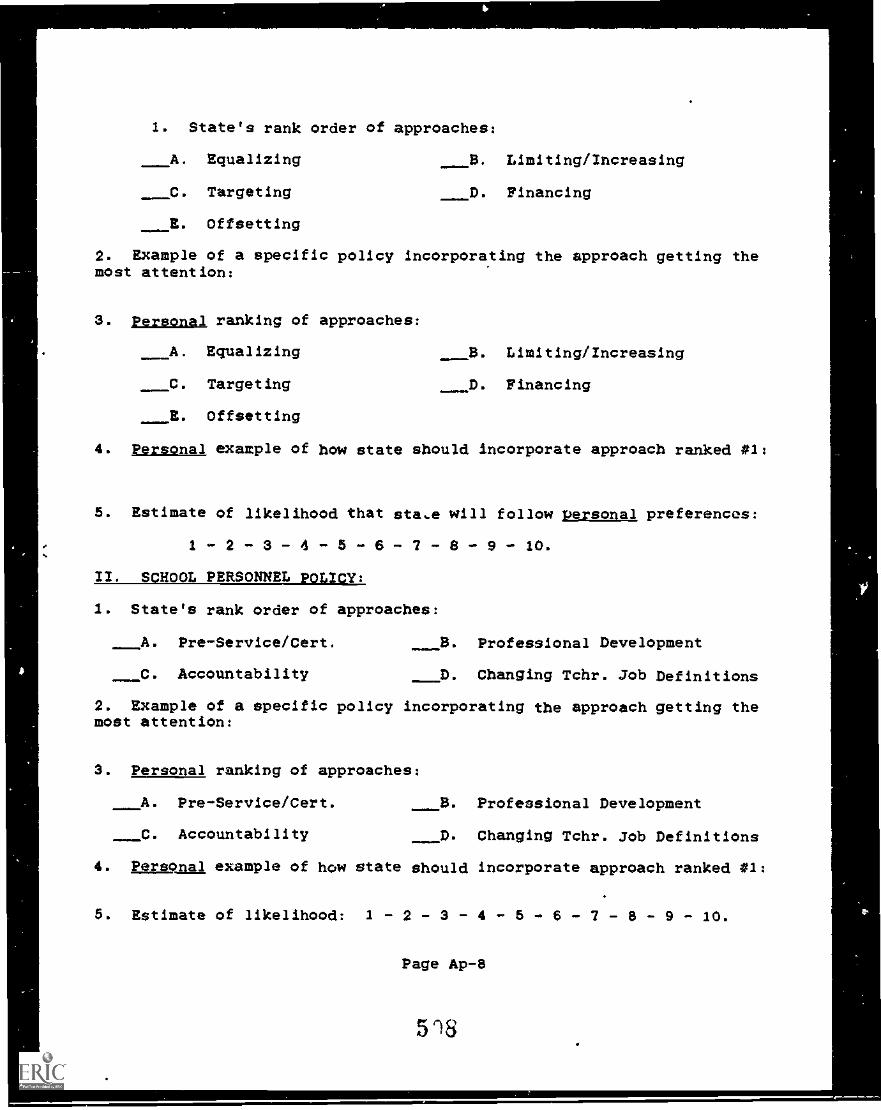
1. State's rank order of approaches:
A. Equalizing B. Limiting/Increasing
C. Targeting D. Financing
E. Offsetting
2. Example of a specific policy incorporating the approach getting themost attention:
3. Personal ranking of approaches:
A. Equalizing B. Limiting/Increasing
C. Targeting D. Financing
E. Offsetting
4. Personal example of how state should incorporate approach ranked *1:
5. Estimate of likelihood that sta,e will follow personal preferences:
1 - 2 - 3 - 4 - 5 - 6 - 7 - 6 - 9 - 10.
II. SCHOOL PERSONNEL POLICY:
1. State's rank order of approaches:
A. Pre-Service/Cert, B. Professional Development
C. Accountability D. Changing Tchr. Job Definitions
2. Example of a specific policy incorporating the approach getting themost attention:
3. Personal ranking of approaches:
A. Pre-Service/Cert. B. Professional Development
C. Accountability D. Changing Tchr. Job Definitions
4. Personal example of how state should incorporate approach ranked #1:
5. Estimate of likelihood: 1 - 2 - 3 - 4 - 5 - 6 - 7 - 8 - 9 - 10.
Page Ap -8
518
C.
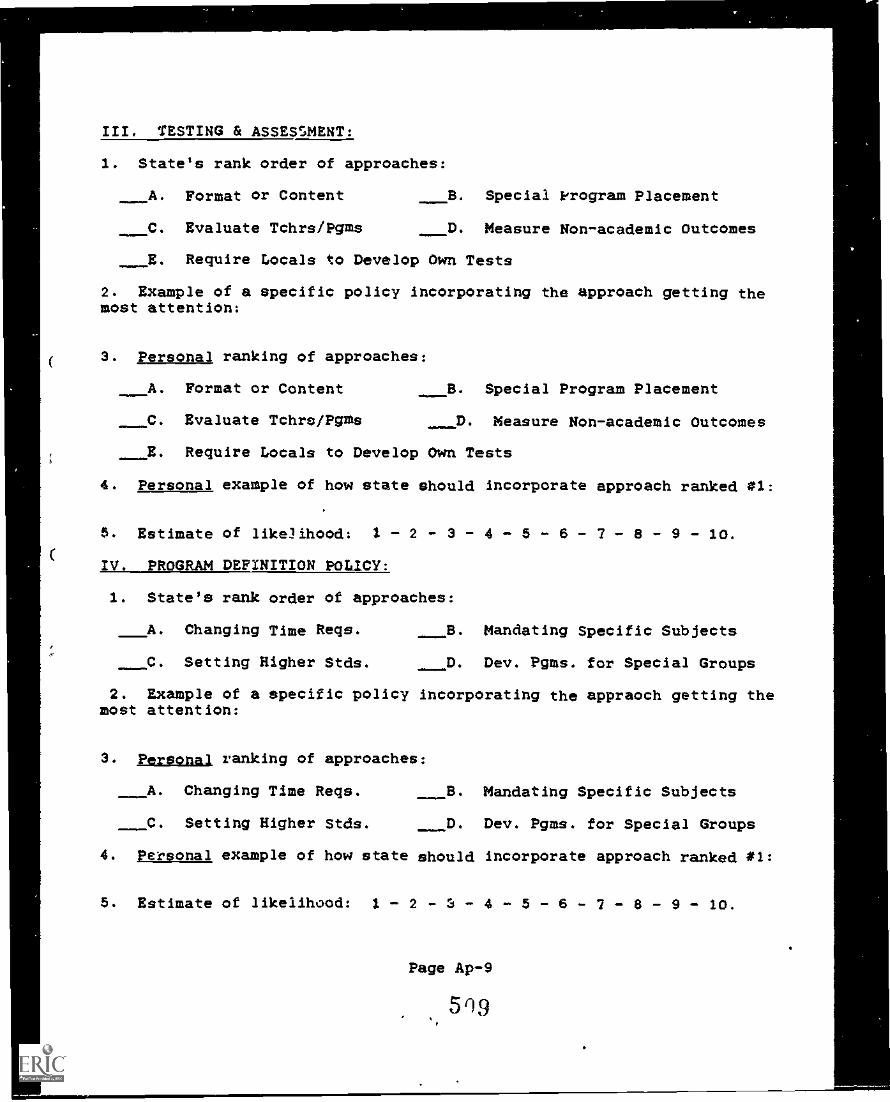
III. TESTING & ASSESSMENT:
1. State's rank order of approaches:
A. Format or Content B. Special Program Placement
C. Evaluate Tchrs/Pgas D. Measure Non-academic Outcomes
E. Require Locals to Develop Own Tests
2. Example of a specific policy incorporating the approach getting themost attention:
3. Personal ranking of approaches:
A. Format or Content B. Special Program Placement
C. Evaluate Tchre/Pgms D. Measure Non-academic Outcomes
E. Require Locals to Develop Own Tests
4. Personal example of how state should incorporate approach ranked *1:
6. Estimate of like3ihood: 2 - 2 - 3 - 4 - 6 - 6 - 7 - 8 - 9 - 10.
IV. PROGRAM DEFINITION POLICY:
1. State's rank order of approaches:
A. Changing Time Reqs. B. Mandating Specific Subjects
C. Setting Nigher Stds. D. Dev. Pgms. for Special Groups
2. Example of a specific policy incorporating the appraoch getting themost attention:
3. Personal ranking of approaches:
A. Changing Time Reqs. B. Mandating Specific Subjects
C. Setting Nigher Stds. D. Dev. Pgms. for Special Groups
4. Personal example of how state should incorporate approach ranked *1:
5. Estimate of likelihood: 1 - 2 - 3 - 4 - 5 - 6 - 7 - 8 - 9 - 10.
Page Ap -9
51)9
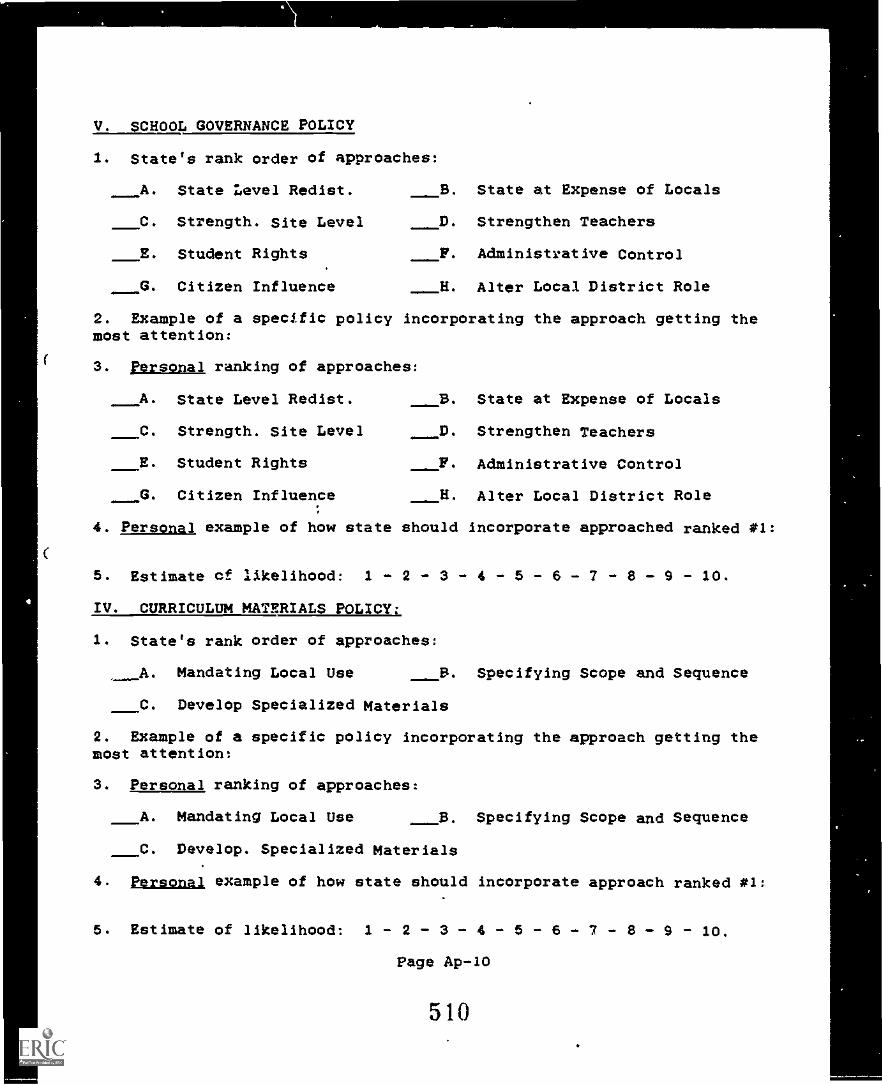
V. SCHOOL GOVERNANCE POLICY
1. State's rank order of approaches:
A. State Level Redist. B. State at Expense of Locals
C. Strength. site Level D. Strengthen Teachers
E. Student Rights F. Administrative Control
G. Citizen Influence H. Alter Local District Role
2. Example of a specific policy incorporating the approach getting themost attention:
3. Personal ranking of approaches:
A. State Level Redist. B. State at Expense of Locals
C. Strength. Site Level D. Strengthen Teachers
E. Student Rights F. Administrative Control
G. Citizen Influence H. Alter Local District Role
4. Personal, example of how state should incorporate approached ranked *1:
5. Estimate of likelihood: 1 - 2 - 3 - 4 - 5 - 6 - 7 - 8 - 9 - 10.
IV. CURRICULUM MATERIALS POLICY:
1. State's rank order of approaches:
A. Mandating Local Use S. Specifying Scope and Sequence
C. Develop Specialized Materials
2. Example of a specific policy incorporating the approach getting themost attention:
3. Personal ranking of approaches:
A. Mandating Local Use B. Specifying Scope and Sequence
C. Develop. Specialized Materials
4. Personal example of how state should incorporate approach ranked *1:
5. Estimate of likelihood: 1 - 2 - 3 - 4 - 5 - 6 - 7 - 8 - 9 - 10.
Page Ap -10
510
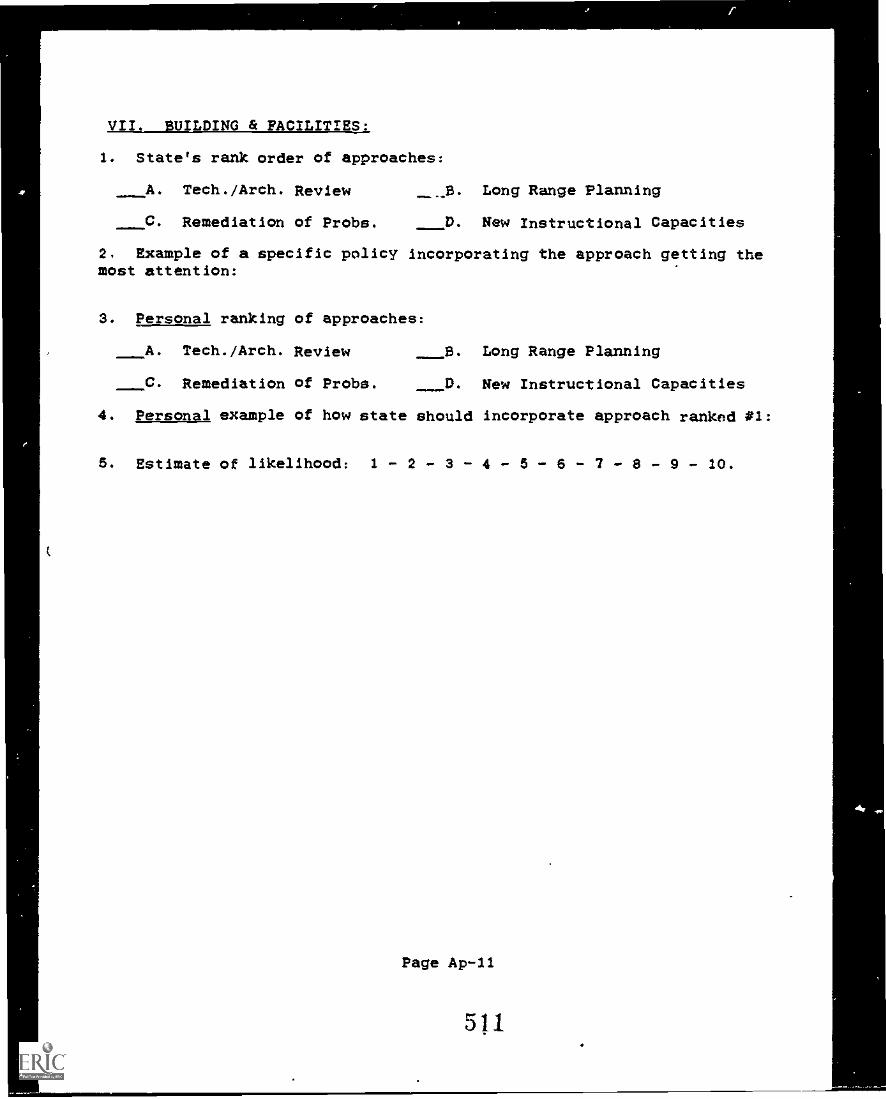
V/I. BUILDING & FACILITIES:
1. State's rank order of approaches:
A. Tech./Arch. Review E. Long Range Planning
C. Remediation of Probs. D. New Instructional Capacities
2. Example of a specific policy incorporating the approach getting themost attention:
3. Personal ranking of approaches:
A. Tech./Arch. Review E. Long Range Planning
C. Remediation of Probs. D. New Instructional Capacities
4. Personal example of how state should incorporate approach ranked #1:
5. Estimate of likelihood: 1 - 2 - 3 - 4 - 5 - 6 - 7 - 8 - 9 - 10.
Page Ap -11
511
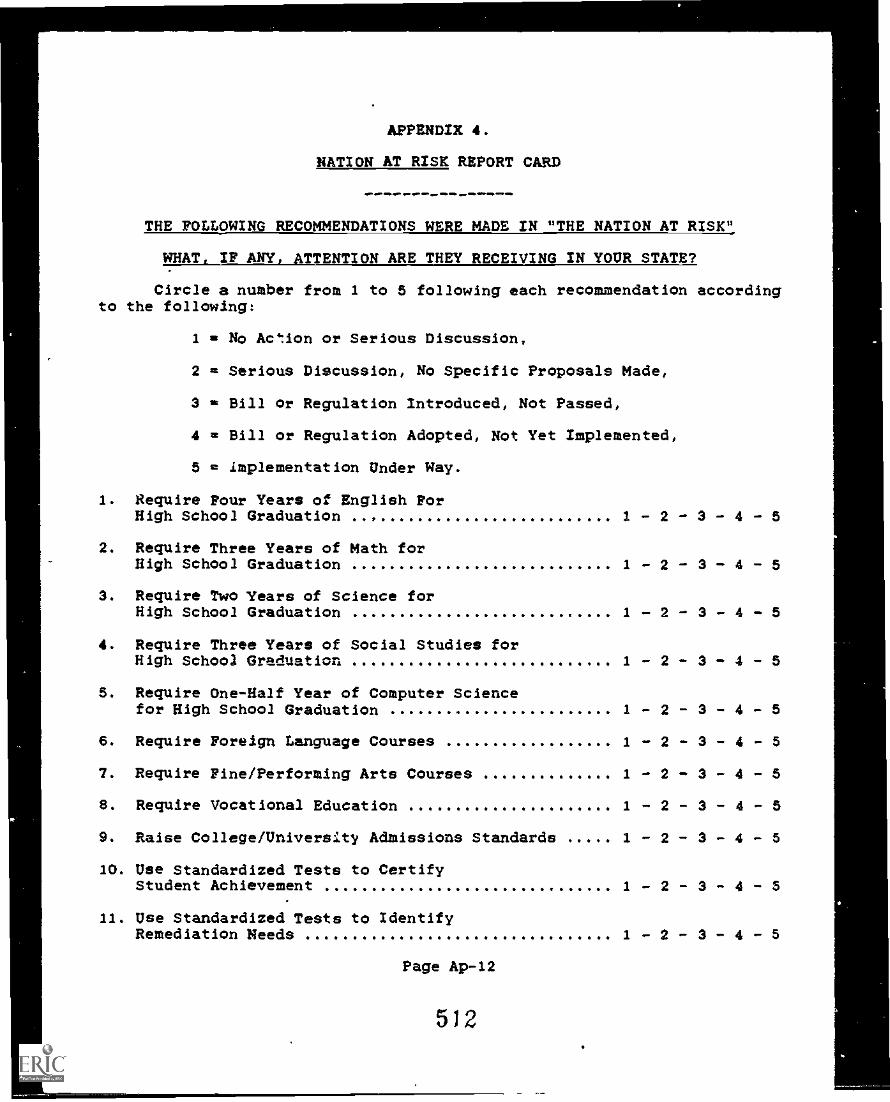
APPENDIX 4.
NATION AT RISK REPORT CARD
THE FOLLOWING RECOMMENDATIONS WERE MADE IN "THE NATION AT RISK"
WHAT, IF ANY, ATTENTION ARE THEY RECEIVING IN YOUR STATE?
Circle a number from 1 to 5 following each recommendation accordingto the following:
1 No Action or Serious Discussion,
2 = Serious Discussion, No Specific Proposals Made,
3 = Bill or Regulation Introduced, Not Passed,
4 = Bill or Regulation Adopted, Not Yet Implemented,
5 = implementation Under Way.
I. Require Four Years of English ForHigh School Graduation 1 - 2 - 3 - 4 - 5
2. Require Three Years of Math forHigh School Graduation 1 - 2 - 3 - 4 - 5
3. Require Two Ytars of Science forHigh School Graduation 1 - 2 - 3 - 4 - 5
4. Require Three Years of Social Studies forHigh School Graduation 1 - 2 - 3 - 4 - 5
5. Require One-Half Year of Computer Sciencefor High School Graduation 1 - 2 - 3 - 4 - 5
6. Require Foreign Language Courses 1 - 2 - 3 - 4 - 5
7. Require Fine/Performing Arts Courses 1 - 2 - 3 - 4 - 5
S. Require Vocational Education 1 - 2 - 3 - 4 - 5
9. Raise College/University Admissions Standards 1 - 2 - 3 - 4 - 5
10. Use Standardized Tests to CertifyStudent Achievement 1 - 2 - 3 - 4 - 3
11. Use Standardized Tests to IdentifyRemediation Needs 1 - 2 - 3 - 4 - 5
Page Ap-12
512
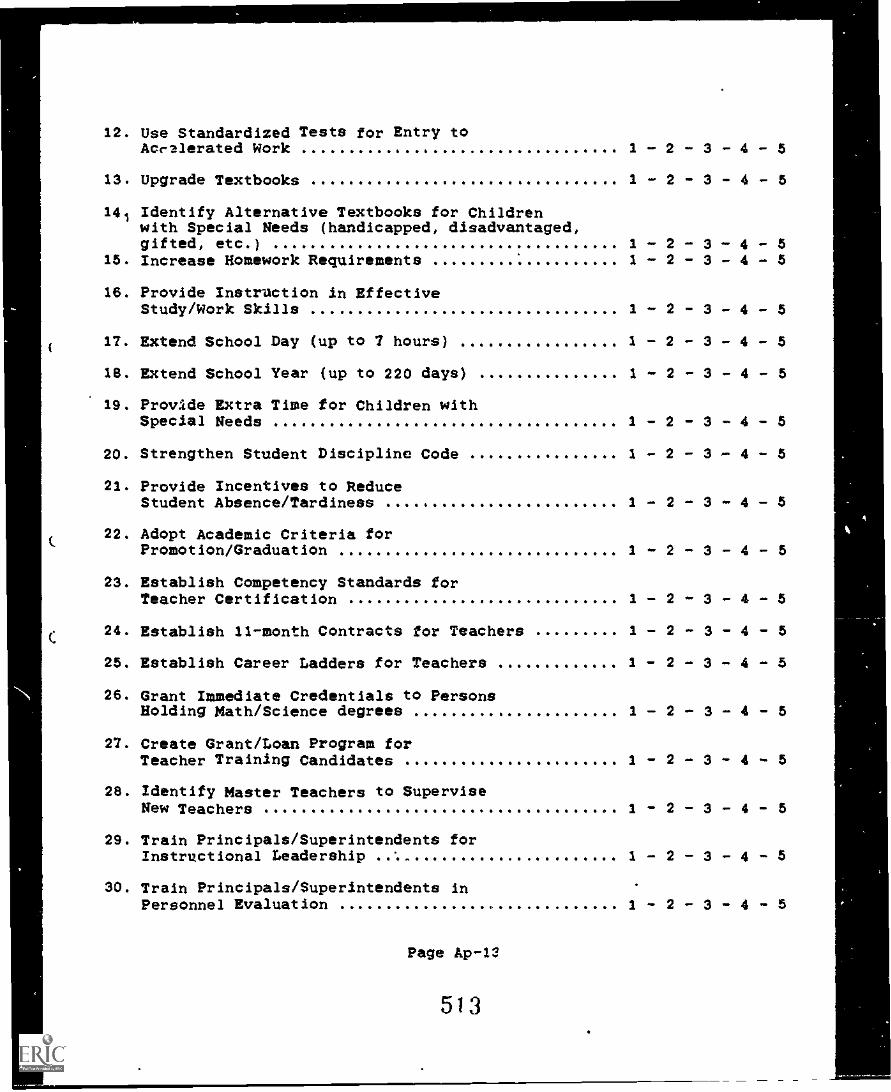
12. Use Standardized Tests for Entry toAcr2lerated Work 1 - 2 - 3 - 4 - 5
13. Upgrade Textbooks
141 Identify Alternative Textbooks for Childrenwith Special Needs (handicapped, disadvantaged,gifted, etc.)
1 - 2 - 3 - 4 - 5
1 - 2 - 3 - 4 - 515. Increase Homework Requirements 1 - 2 - 3 - 4 - 5
16. Provide Instruction in EffectiveStudy/Work Skills 1 - 2 - 3 - 4 - 5
17. Extend School Day (up to 7 hours) 1 - 2 - 3 - 4 - 5
18. Extend School Year (up to 220 days) 1 - 2 - 3 - 4 - 5
19. Provide Extra Time for Children withSpecial Needs 1 - 2 - 3 - 4 - 5
20. Strengthen Student Discipline Code 1 - 2 - 3 - 4 - 5
21. Provide Incentives to ReduceStudent Absence/Tardiness 1 - 2 - 3 - 4 - 5
22. Adopt Academic Criteria forPromotion/Graduation 1 - 2 - 3 - 4 - 5
23. Establish Competency Standards forTeacher Certification 1 - 2 - 3 - 4 - 5
24. Establish 11-month Contracts for Teachers 1 - 2 - 3 - 4 - 5
25. Establish Career Ladders for Teachers 1 - 2 - 3 - 4 - 5
26. Grant Immediate Credentials to PersonsHolding Math/Science degrees 1 - 2 - 3 - 4 - 5
27. Create Grant/Loan Program forTeacher Training Candidates 1 - 2 - 3 - 4 - 5
28. Identify Master Teachers to SuperviseNew Teachers 1 - 2 - 3 - 4 - 5
29. Train Principals/Superintendents forInstructional Leadership 1 - 2 - 3 - 4 - 5
30. Train Principals/Superintendents InPersonnel Evaluation 1 - 2 - 3 - 4 - 5
Page Ap -12
513
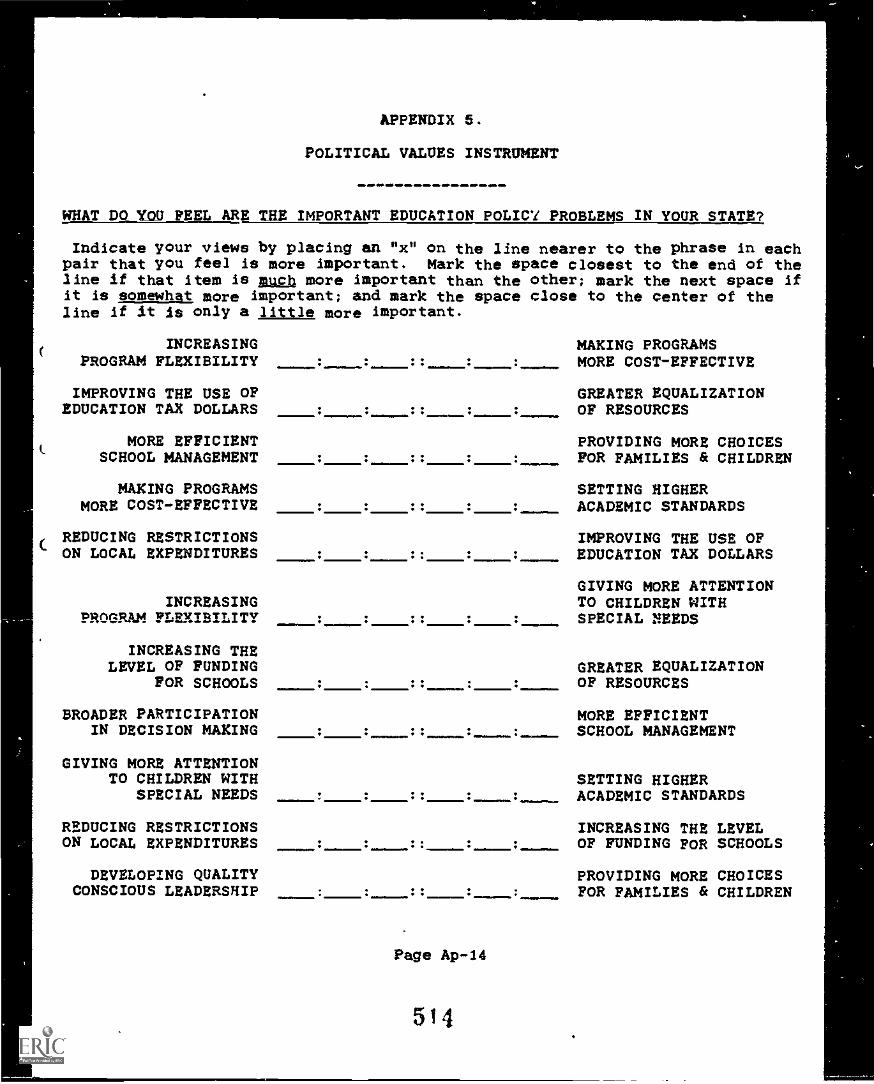
APPENDIX 5.
POLITICAL VALUES INSTRUMENT
WHAT DO YOU FEEL ARE Tag IMPORTANT EDUCATION POLICY PROBLEMS IN YOUR STATE?
Indicate your views by placing an "x" on the line nearer to the phrase in eachpair that you feel 19 more important. Mark the space closest to the end of theline if that item is much more important than the other; mark the next space ifit is somewhat more important; and mark the space close to the center of theline if it ls only a little more important.
INCREASINGPROGRAM FLEXIBILITY
IMPROVING THE USE OFEDUCATION TAX DOLLARS
MORE EFFICIENTSCHOOL MANAGEMENT
MAKING PROGRAMSMORE COST-EFFECTIVE
REDUCING RESTRICTIONSON LOCAL EXPENDITURES
INCREASINGPRoGRAM ?LEXIBILITY
INCREASING THELEVEL OF FUNDING
FOR SCHOOLS
BROADER PARTICIPATIONIN DECISION MAKING
GIVING MORE ATTENTIONTO CHILDREN WITH
SPECIAL NEEDS
REDUCING RESTRICTIONSON LOCAL EXPENDITURES
DEVELOPING QUALITYCONSCIOUS LEADERSHIP
MAKING PROGRAMS. : : : MORE COST-EFFECTIVE
1111.. =1 GREATER EQUALIZATIONOF RESOURCES
PROVIDING MORE CHOICES: FOR FAMILIES & CHILDREN
SETTING HIGHERACADEMIC STANDARDS
_ . . . . IMPROVING THE USE OFEDUCATION TAX DOLLARS
GIVING MORE ATTENTIONTO CHILDREN WITHSPECIAL NEEDS
GREATER EQUALIZATIONOF RESOURCES
MORE EFFICIENT. . . SCHOOL MANAGEMENT
SETTING HIGHERACADEMIC STANDARDS
INCREASING THE LEVELOF FUNDING FOR SCHOOLS
PROVIDING MORE CHOICESFOR FAMILIES & CHILDREN
Page Ap -14
514
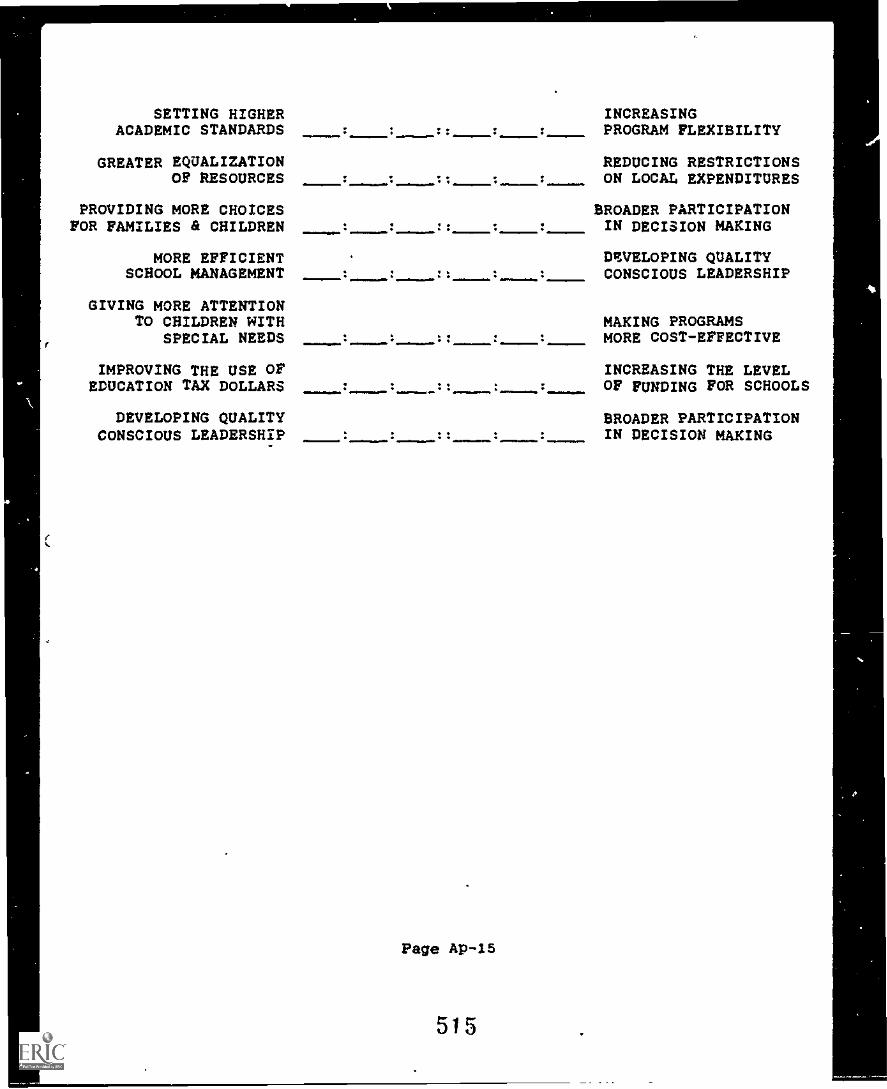
SETTING HIGHERACADEMIC STANDARDS :
GREATER EQUALIZATIONOF RESOURCES
PROVIDING MORE CHOICESFOR FAMILIES & CHILDREN
MORE EFFICIENTSCHOOL MANAGEMENT
GIVING MORE ATTENTIONTO CHILDREN WITH
SPECIAL NEEDS
IMPROVING THE USE OFEDUCATION TAX DOLLARS
DEVELOPING QUALITYCONSCIOUS LEADERSHIP
INCREASINGPROGRAM FLEXIBILITY
.
eaffiemel11.
Page Ap -15
515
REDUCING RESTRICTIONSON LOCAL EXPENDITURES
BROADER PARTICIPATIONIN DECISION MAKING
DSVELOPING QUALITYCONSCIOUS LEADERSHIP
MAKING PROGRAMSMORE COST-EFFECTIVE
INCREASING THE LEVELOF FUNDING FOR SCHOOLS
BROADER PARTICIPATIONIN DEC/SION MAKING
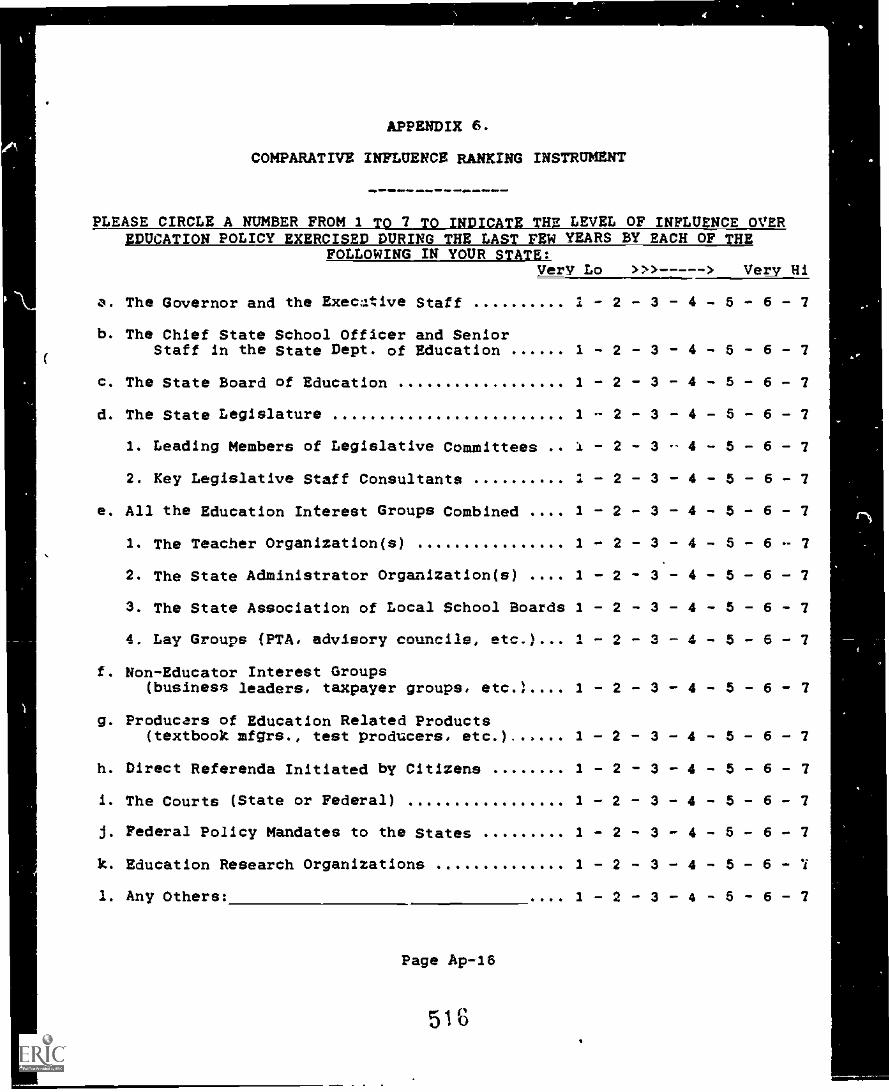
COMPARATIVE INFLUENCE RANKING INSTRUMENT
PLEASE CIRCLE A NUMBER FROM 2 TO 7 TO INDICATE THE LEVEL OF INFLUENCE OVEREDUCATION POLICY EXERCISED DURING THE LAST FEW YEARS BY EACH OF THE
FOLLOWING IN YOUR STATE:Very Lo >>> > Very Hi
a. The Governor and the Execative Staff I - 2 - 3 - 4 - 5 - 6 - 7
b. The Chief State School Officer and SeniorStaff in the State Dept. of Education 1 - 2 - 3 - 4 - 5 - 6 - 7
c. The State Board of Education 2
d. The State Legislature 2
2. Leading Members of Legislative Committees
2. Key Legislative Staff Consultants 1
e. All the Education Interest Groups Combined 2
I. The Teacher Organization(s) 2
2. The State Administrator Organization(s) 2
3. The State Association of Local School Boards 2
4. Lay Groups (PTA, advisory councils, etc.) 1
f. Non-Educator Interest Groups(business leaders, taxpayer groups, etc ) 2
g. Producars of Education Related Products(textbook mfgrs., test producers, etc.) 2
h. Direct Referenda Initiated by Citizens 2
1. The Courts (State or Federal) 2
j. Federal Policy Mandates to the States 2
k. Education Research Organizations 2
1. Any Others: .... 2
Page Ap -16
516
- 2 - 3 - 4 - 5 - 6 - 7
- 2 - 3 - 4 - 5 - 6 - 7
- 2 - 3 -- 4 - 5 - 6 - 7
- 2 - 3 - 4 - 5 - 6 - 7
- 2 - 3 - 4 - 5 - 6 - 7
- 2 - 3 - 4 - 5 - 6 - 7
- 2 - 3.- 4 - 5 - 6 - 7
- 2 - 3 - 4 - 5 - 6 - 7
- 2 - 3 - 4 - 5 - 6 - 7
- 2 - 3 - 4 - 5 - 6 - 7
- 2 - 3 - 4 - 5 - 6 - 7
- 2 - 3 - 4 - 5 - 6 - 7
- 2 - 3 - 4 - 5 - 6 - 7
- 2 - 3 - 4 - 5 - 6 - 7
- 2 - 3 - 4 - 5 - 6 -
- 2 - 3 - 4 - 5 - 6 - 7
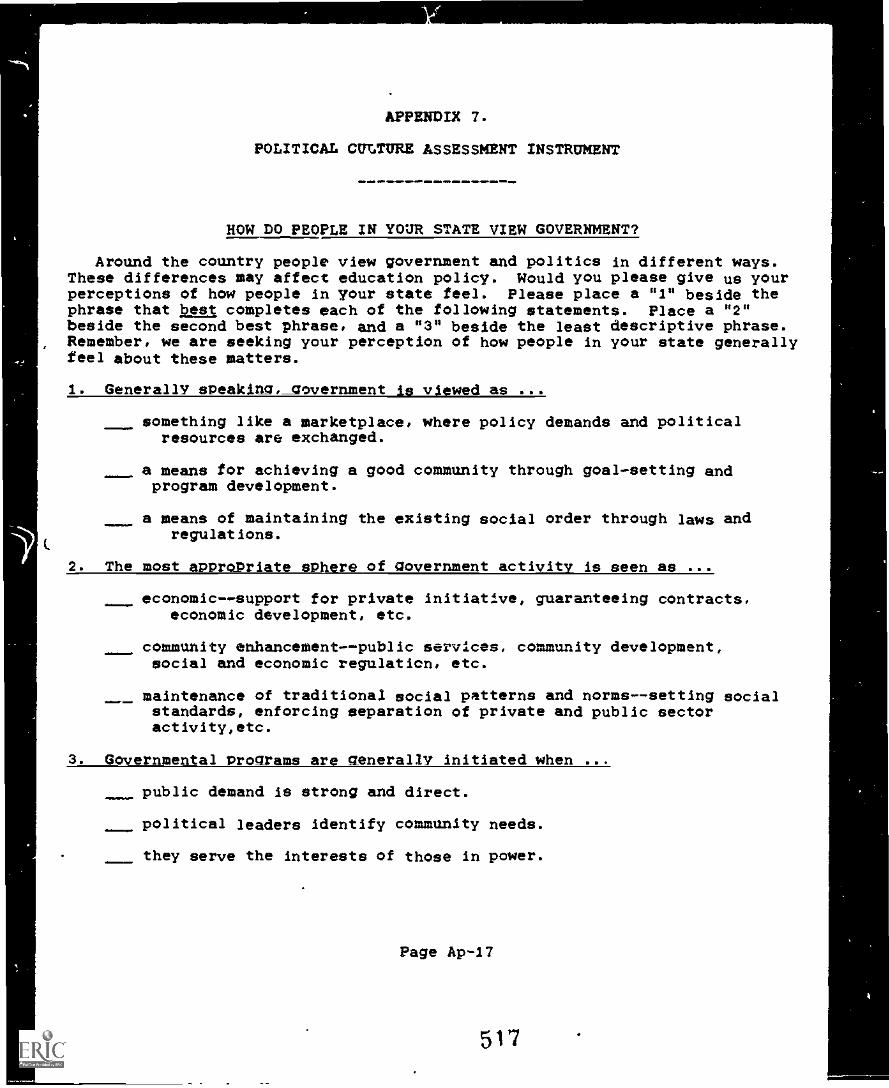
APPENDIX T.
POLITICAL CULTURE ASSESSMENT INSTRUMENT
HOW DO PEOPLE IN YOUR STATE VIEW GOVERNMENT?
Around the country people view government and politics in different ways.These differences may affect education policy. Would you please give us yourperceptions of how people in your state feel. Please place a "1" beside thephrase that best completes each of the following statements. Place a "2"beside the second best phrase, and a "3" beside the least descriptive phrase.Remember, we are seeking your perception of how people in your state generallyfeel about these matters.
1. Generally sPeaking,_government is viewed as ...
something like a marketplace, where policy demands and politicalresources are exchanged.
a means for achieving a good community through goal-setting andprogram development.
a means of maintaining the existing social order through laws andregulations.
2. The most appropriate sphere of government activity is seen as ...
011 eoonomic--support for private initiative, guaranteeing contracts,economic development, etc.
community enhancementpublic services, community development,social and economic regulation, etc.
maintenance of traditional social patterns and normssetting socialstandards, enforcing separation of private and public sectoractivity,etc.
3. Governmental Programs are generally initiated when ...
public demand is strong and direct.
political leaders identify community needs.
they serve the interests of those ln power.
Page Ap -17
517
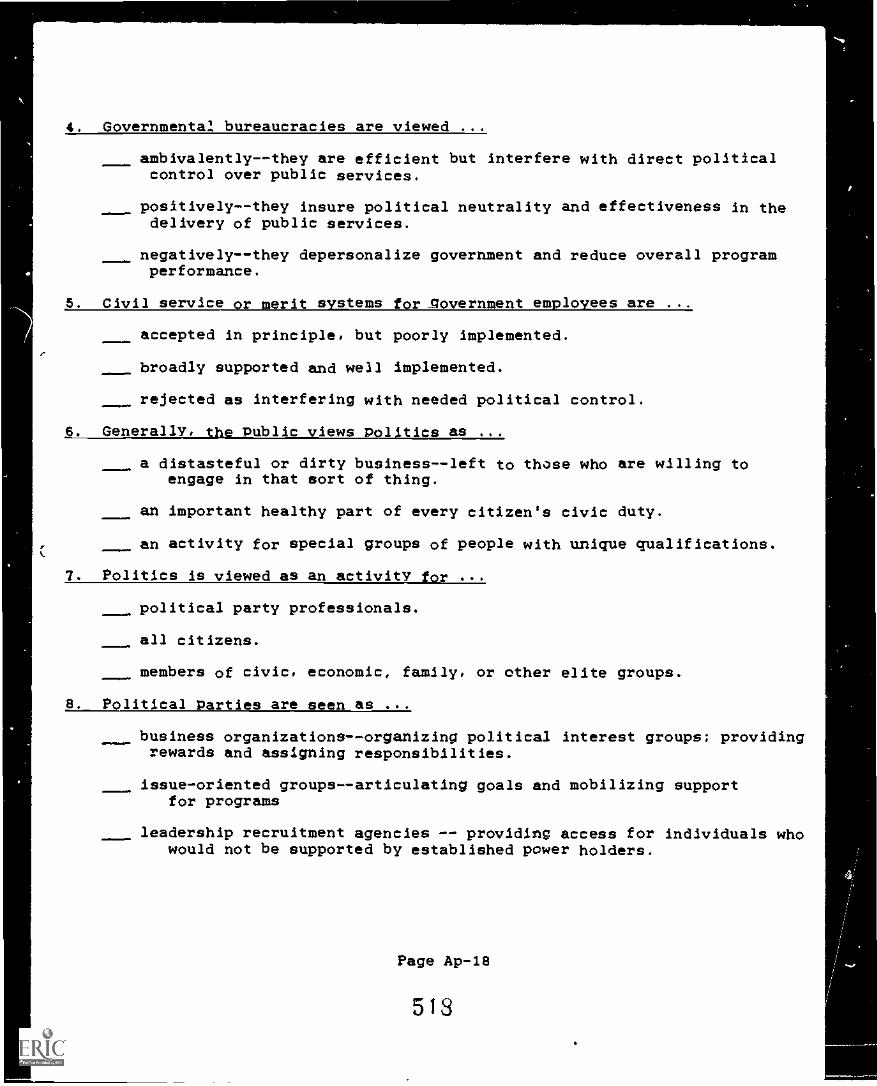
4. Governmental bureaucracies are viewed ...
ambivalently--they are efficient but interfere with direct politicalcontrol over public services.
positively--they insure political neutrality and effectiveness in thedelivery of public services.
negatively--they depersonalize government and reduce overall programperformance.
5. Civil service or merit systems for government employees are ...
accepted in principle, but poorly implemented.
broadly supported and well implemented.
rejected as interfering with needed political control.
6. Generally, the Public views Politics as ...
a distasteful or dirty business--left to these who are willing toengage in that sort of thing.
an Important healthy part of every citizen's civic duty.
an activity for special groups of people with unique qualifications.
7. Politics is viewed as an activity for ...
political party professionals.
all citizens.
members of civic, economic, family, or other elite groups.
8. Political Parties are seen as ...
business organizations--organizing political interest groups; providingrewards and assigning responsibilities.
Issue-oriented groupsarticulating goals and mobilizing supportfor programs
leadership recruitment agencies -- providing access for individuals whowould not be supported by established power holders.
Page Ap-18
513
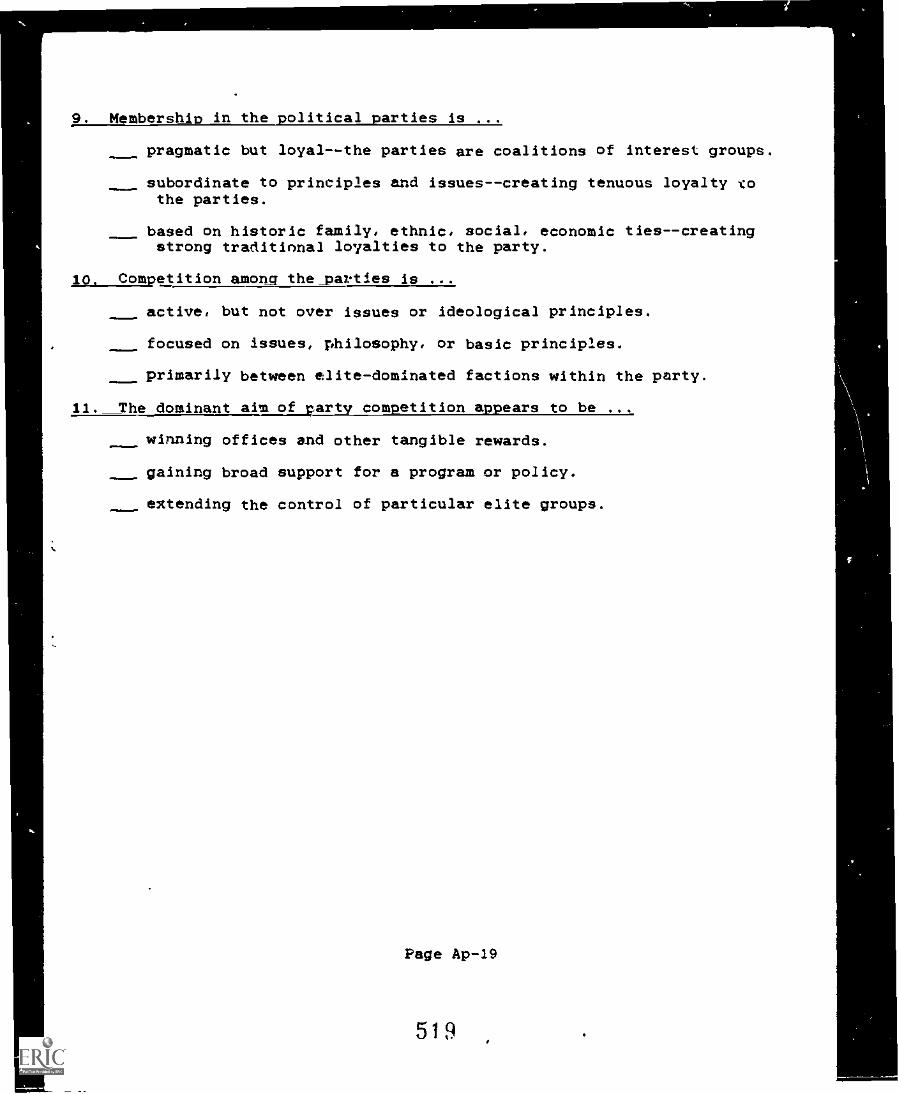
9. Membership in the political parties is ...
pragmatic but loyalthe parties are coalitions of interest groups.
subordinate to principles and issues--creating tenuous loyalty vothe parties.
based on historic family, ethnic, social, economic ties--creatingstrong traditional loyalties to the party.
10. Competition among the parties is ...
active, but not over issues or ideological principles.
focused on issues, philosophy, or basic principles.
primarily between elite-dominated factions within the party.
11. The dominant aim of narty competition appears to be ...
winning offices and other tangible rewards.
gaining broad support for a program or policy.
extending the control of particular elite groups.
Page Ap -19
519
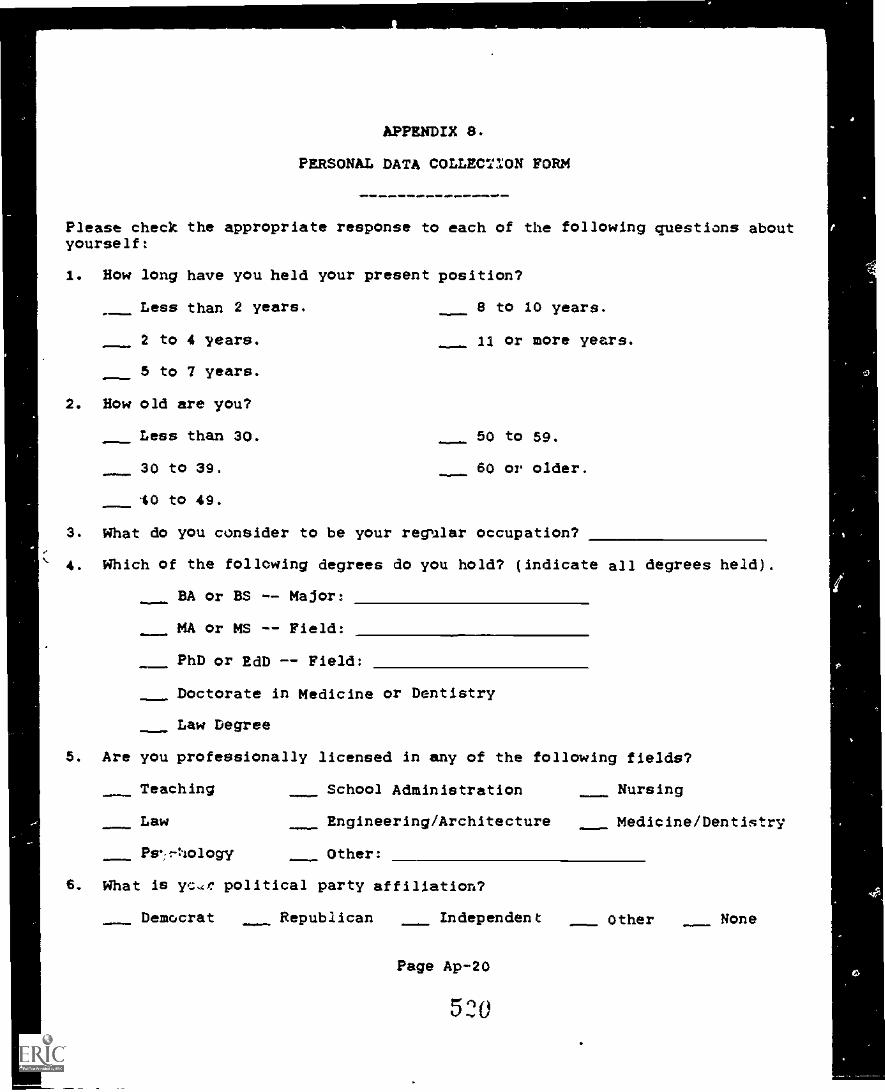
PERSONAL DATA COLLECTION FORM
Please check the appropriate response to each of the following questions aboutyourself:
1. How long have you held your present position?
Less than 2 years. 6 to 10 years.
2 to 4 years. 11 or more years.
5 to 7 years.
2. How old are you?
Less than 30. 50 to 59.
30 to 39. 60 or older.
40 to 49.
3. What do you consider to be your reglilar occupation?
4. Which of the following degrees do you hold? (indicate all degrees held).
BA or BS -- Major:
MA or MS -- Field:
PhD or EdD -- Field:
Doctorate in Medicine or Dentistry
Law Degree
5. Are you professionally licensed in any of the following fields?
Teaching School Administration Nursing
Law Engineering/Architecture Medicine/Dentistry
Pw;rhology Other:
6. What is yc,a: political party affiliation?
Democrat Republican Independent Other None
Page Ap-20
520
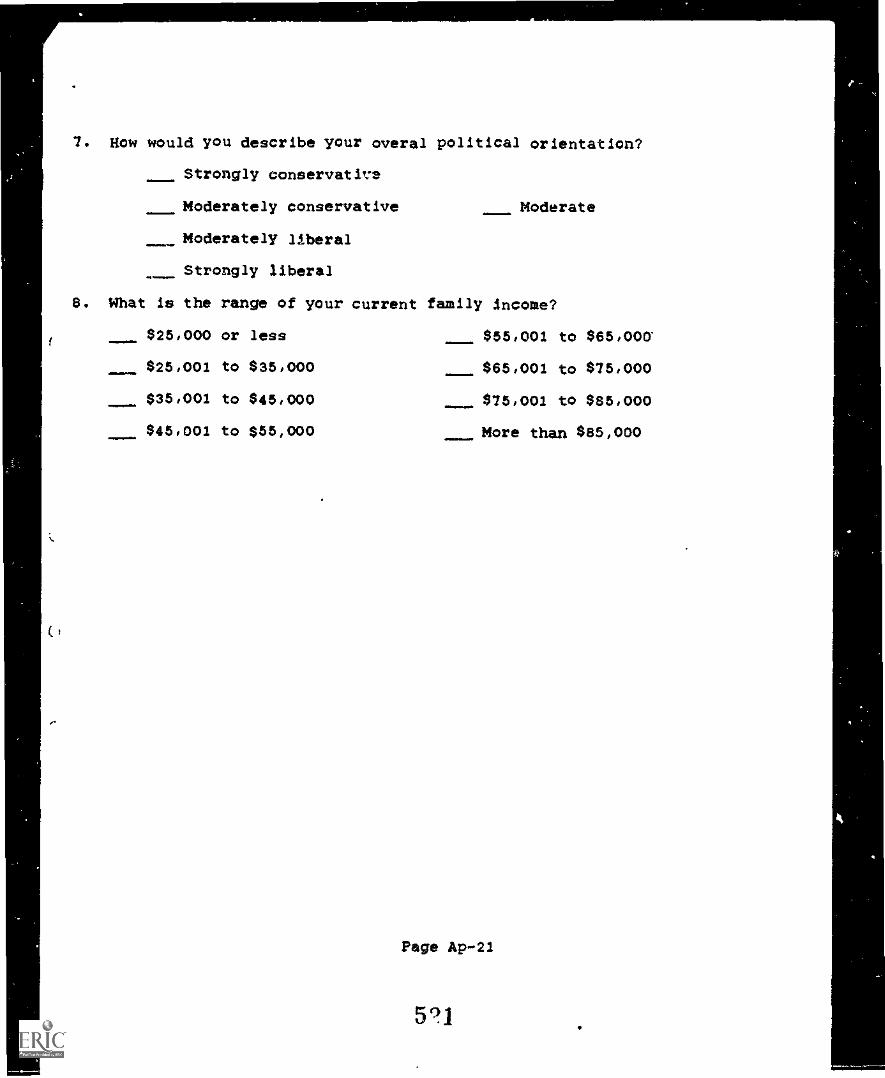
7. How would you describe your overal political orientation?
Strongly conservative
Moderately conservative Moderate
Moderately liberal
Strongly liberal
8. What Is the range of your current family Income?
$25,000 or less
$25,001 to $35,000
$35,001 to $45,000
$45,001 to $55,000
$55,001 to $65,00a
$65,001 to $75,000
$75,001 to $85,000
More than $85,000
Page Ap -21
591
APPENDIX 9.
DATA RECORDING FORM FOR STATE EDUCATION CODES
STATE CODE INDEX BY SPMs
Code: State:
Public Value
Section Description SPM EF EO OU - - CH
Page Ap-22
59')
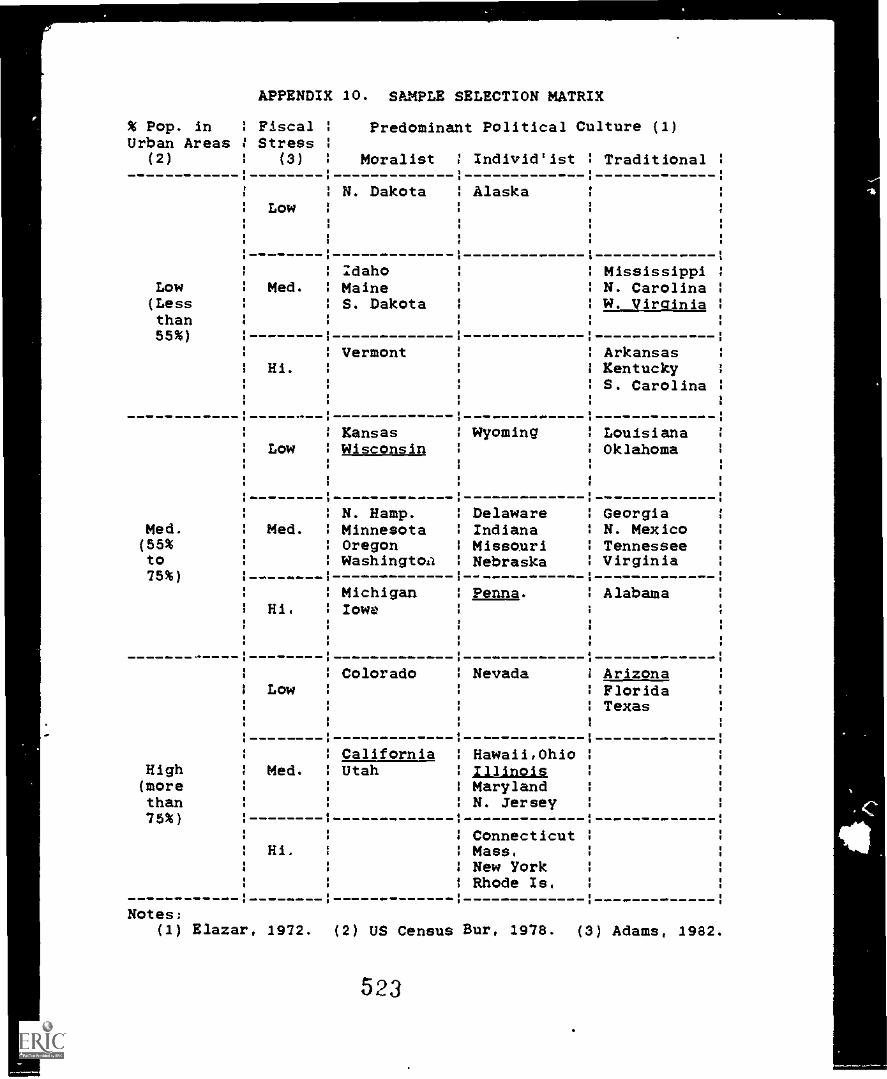
% Pop. inUrban Areas
(2)
Low(Lessthan55%)
Med.(55%to75%)
:
1
1
:
1
,
:
1
:
,
1
,
,
,
,
1
,
,
:
1
1
APPENDIX
Fiscal 1
Stress :
(3) :
1 1
L ow 1
,
,
,
,
1 1
:
Med. :
1
1
:
Hi. ,
1
,
1
1
Low :
:
1
:
Med. :
1
:
:
10. SAMPLE
Predominant
Moralist
N. Dakota
IdahoMaineS. Dakota
Vermont
KansasWisconsin
SELECTION MATRIX
Political
: Individ'ist
: Alaska
,
,
.
.
.'
,'
1
1
,
.
.
1
1
1 Wyoming
,
,
,
,
1
: Delaware: IndianaI Missouri: Nebraska
Culture
:
,
,
,
I
,
,
1
:
:
:
1
:
1
I
1
1
1
1
1
1
1
:
:
1
:
.1
,
1
(1)
Traditional :
1
1
,
,
,
1
Mississippi 1
N. Carolina :
W. Virginia :
1
,Arkansas '
Kentucky 1
S. Carolina :
.
1
LouIslana 1
,Oklahoma '
,
,
,
,
1
GeorgiaN. Mexico ',
,Tennessee '
Virginia ',
1
Alabama 1
,
,
.
1
N. Ramp.MinnesotaOregonWashingtoa
1
1
,
.
.
;
Hi:
:
,
,
1
1
MichiganIowe
1
:
1
,
1
-
Penna.
1
:
,
1
;
High :
(morethan I
75%) 1
1
1
:
:
Notes:(1) Elazar,
Low
Med.
Hi .
1972.
:
,
,
,
I
1
:
I
,
,
,
1 1
,
.
.
,'
,'
1
Colorado
California
:
1
1
:
:
I
:
1
1
1
1
1
Nevada
Hawall,OhloIllinois
;
1
:
1
1
:
1
:
,
:
:
1
(3)
ArizonaFlorida :
Texas 1
.
.
1
.
,
,'
,'
,'
1
,
,
,
,
,'
1
1
Adams, 1982.
Utah
(2) US Census
MarylandN. Jersey
ConnecticutMass,New YorkRhode Is.
Bur, 1978.
523