DOCUMENT RESUME ED 140 789 Coscarelli, William C. Inquiry ... · Coscarelli, William C.. TITLE....
32
DOCUMENT RESUME ED 140 789 IR 004 830 AUTHOR Coscarelli, William C. . TITLE Inquiry in Development; Efficiency and Etfectiveness of Algorithmic Representations in a Laboratory Stituation. PUB DATE Apr 77 NOTE 34p.; Paper presented at the annual meeting of the Association for Educational Communications and Technology (Miami, Florida, April 25-29,1977) EDMS PRICE EF-$0.83 6-d-$2.06 Plus Postage. DESCRIPTORS *Algorithms; *Chemistry InstructiOn; Critical Thinking; *Educational Research; Plow Charts; *In'Structional Design; Laboratory.Training; *Teaching Methods; fime Factors (Learning) IDENTIFIERS Watson Glaser Critical Thinking Appraisal ABSTRACT This study, part of an instructional development project, explores the effects of three different representations of functional algorithms in an introductory chemistry laboratory. Intact classes were randomly assigned to a flowchart, list, or standard prose representation of the procedures (algorithms). At the completion of 11 laboratory sessions, data were collected on critical thinking ability as measured by the Watson-Glaser Critical'Thinking Appraisal. Laboratory instructor& estimates of completion time for each lab were obtained. Analysis indicates that mode of representation produces no significant difference between groups on critical thinking ability. However, a differential effect in laboratory completion times was found. Appended is a sample of each type offunctional algorithm employed. (STS) 44(********************************************************************* *' Documents acquired by ERIC include many informal unpublished * materials rot available from other sources. mac makes eyery effort,* * to obtain the best copy available. Nevertheless, items of marginal * * reproducibilityare often encountered and this affects the quality * * of the microfiche and.hardoopy reproductions ERIC makes available * * via the ERIC rocument Reproduction Service (EDRS). EDRS is not * responsible for the quality of the original document. Reproductions * * supplied by EDRS are the best that can be made from the original. * ***********************************************************************
Transcript of DOCUMENT RESUME ED 140 789 Coscarelli, William C. Inquiry ... · Coscarelli, William C.. TITLE....

DOCUMENT RESUME
ED 140 789 IR 004 830
AUTHOR Coscarelli, William C.. TITLE Inquiry in Development; Efficiency and Etfectiveness
of Algorithmic Representations in a LaboratoryStituation.
PUB DATE Apr 77NOTE 34p.; Paper presented at the annual meeting of the
Association for Educational Communications andTechnology (Miami, Florida, April 25-29,1977)
EDMS PRICE EF-$0.83 6-d-$2.06 Plus Postage.DESCRIPTORS *Algorithms; *Chemistry InstructiOn; Critical
Thinking; *Educational Research; Plow Charts;*In'Structional Design; Laboratory.Training; *TeachingMethods; fime Factors (Learning)
IDENTIFIERS Watson Glaser Critical Thinking Appraisal
ABSTRACTThis study, part of an instructional development
project, explores the effects of three different representations offunctional algorithms in an introductory chemistry laboratory. Intactclasses were randomly assigned to a flowchart, list, or standardprose representation of the procedures (algorithms). At thecompletion of 11 laboratory sessions, data were collected on criticalthinking ability as measured by the Watson-Glaser Critical'ThinkingAppraisal. Laboratory instructor& estimates of completion time foreach lab were obtained. Analysis indicates that mode ofrepresentation produces no significant difference between groups oncritical thinking ability. However, a differential effect inlaboratory completion times was found. Appended is a sample of eachtype offunctional algorithm employed. (STS)
44(**********************************************************************' Documents acquired by ERIC include many informal unpublished* materials rot available from other sources. mac makes eyery effort,** to obtain the best copy available. Nevertheless, items of marginal ** reproducibilityare often encountered and this affects the quality ** of the microfiche and.hardoopy reproductions ERIC makes available ** via the ERIC rocument Reproduction Service (EDRS). EDRS is not* responsible for the quality of the original document. Reproductions ** supplied by EDRS are the best that can be made from the original. ************************************************************************

-11
INQUIRY IN DEVELOPMENT:,
Efficiency and effectiveness of algorithmic representationsin a laboratory situation
U.S DEPARTMENT oF HEWN.EDUCATION 41NOLFATIENATIONAT.INSTIWTE OF .
EDUCATION .
Willi C C lliTINS 00(UMENT NAS DEE* REPRO.0VCE0 EXAMY AS RECEIVED i ROMDIE PERSON OR OROAN1TATI0NoR WIN-ATINO sT POINTS OF VIEW OR OPINIONSSTATED 00 NOT NECESSAAKT REPRE-SENT OFFICIAL NATIONAL INSTITUTE OFEDUCATION plat reoN oR POLICY
oin r
c,
f
am C. oscare , Project Director)ivision of Development and Special Projects
Audio-Visual Center, Indiana UniversityBloomington, Indiana 47401
,
ABSTRACT.
e
...
As developer's we often find ourselves shifting from one roleto another throughout the.scope of a project. At first, constrainedby real worlu limitationi-we seek strategies that improve precisionin our work. Later, we mdy wavier why certain stPategies'are moreeffective and explore these cfakstions. It is not a matter of whichis better --'prediction or understanding -- for these are separateand distinct issues and should be judged accordingly, This paperprimarily addresses the praxiological question, a question ofalternatives (which?) rather than the theoretical or scientific-question'(why?). Yet, in a serendipitous way those questions ofalternatives may lead to statements of understanding. We often hopethey do, but we will not have failed if they do not.
This study explored the effects of three different represen-tations of functional algorithms in an introductory chemistry-laboratory. Inlact classes were randomly assigned to a flowchart;list, or standard prose representation of the procedures(algorithms). At the completion of 11 laboratory sessions data werecollected on critical thinking ability as measured by the Watson-Glaser Critical Thinking Appraisal. Additionally, laboratoryinstructors' estimates of completion time for.each lab were obtained.Analysis indicates that mode of representation produces no signifi-cant difference between groups on critical thinking ability. However,a differential effect in laboratory completion times was found.
:
,
,Paper presented at the Annual Meeting, .
Aisociation for/Educational Communications and Technology,Miami, Florida, April 25-29, 1977
2

I ,
TABLE OF CONTENTS
BACKGROUND OF THE DEVELOPMENT PROJECT 1
FINAL PRO6UCT OF THE PROJECT 2a. Components 2b. Measurement of student-performance , 3c. Algorithmization of procedures 4
A tRAMEWORK FOR THE PROBLEM 5a. Definitions 5b. Alternative reprerentations 9'c. Possible consequences 11
PURPOSE OF THE STUDY ., 11
a. Statement of the problem 12b. Researchable questions 12c.- Independent variables 12d. Dependent variables 14e. Design N. 15f. Instrumentation 16
1. Indepehdent variable 162. Dependent variable 16
g. Sample 18h.- Procedunes 16
,
RESULTS -, 17a, Effect of representations on critical thinking 18b. Effect of representation on completion time 18c. Effect of representation on grade for
qualitative analysis lab 18
DISCUSSION 19
CONCLUSION 21
REFERENCES.
APPENDIX IQualitative analysis: Flowchart RepresentationQualitative analysis: List-form RepresentationQualitative analysis: Standard Prose Representation
't
-
,
3 7

4
INQUIRY 11,11 DEVELOPMENT:
Efficiency and effdctiveneis- of algorithmic representationsin a labcrratory situation
William C. Coscarelli
//
9
BACKGROUND OF THE DEVELOPMENT PROJECT
In the fall of 1974, a single and eparate two-credit chemistry
'laboratory course was created dt India a University for students
.iaking one of two possible lecture co rsei, Chemistry 100 or
Chemistry 10j. Chemistry 100 is a q4-s4mester terminal course
f /designed primarily for students maSoring inljberal aTts, business,
or education. In the first third/ofipie course, basic topics such1
,
as atomic theory, bonding, and tP 'reeiLdimensional molecular strUc-
ture are discussed. The middle /third deals with\lirge molecules\
/I
and bioloeical chemistry. The'final third examines topics uf con-/
temporary interest including drugs, food additives, pollution, etc.
Littte, if any mathematics si used in this course. Chemistry 101,/ I
I/
is the first semester of a .t'o-semestdr sequence designed for non-
science majors and those nivarious allied health fields who doI
nilt need more than two siimesters of chemistry. In this course,
the basics of atomic t/heor31, uonding ttructure, etc., are studied.
in more detail. Addit/ionailly, mote, calculations, the gas laws,
( ,
.chemical equilibrium,lpherhical reactivity, oxidation-reduction,
isomerism, and introductOy organic chemistry are presented.i v /
There is no chemistty, prierequisite for C100, C101, or the labora-
tory course. Despit te yhe differences in the needs and tIckgrounds;
of students enrolles:1 in C100 and C101, a laboratory course had to
be designed whicb.would serve both groups. These differences in

course content and emphasis do quite clearly ,produce students having
dif'ferent backgrounds of chemical knowledge. Since no one back-
gi.ound can be assumed, the laboratory course has to provide any
information necessary for the successful completion°of an exPeri-
merit. During the fall*se04ster of 1974, the course was presented
ua, #
rather traditional format and the problems with this approach
became evident.. In the Sprtng.semester of 1975, a concerted effort
was made to develop the course.00,the aslistance of the Division
of Development and Special Projects at Indiana University.
FINAL PRODUCT OF THE PROJECT*
a. ComOonents
From the results of a 'student qilionnaLre and i knowledge
of the level of performance which the students had achieved (as
assessed from the results of various exams conducted throughout
the semester), a basic instructional format was designed and
applied to 'each of the experiments and study exercises used
throughout the coarse. Each laboratory experiment or exercise
-was presented in a Learning Activity'Package (LAP) form. These
packages contain seven components and range in length from 13 to
41, single-spaced typewritten pages. The sections are described
as follows: (1) Introduction: Each experiment is introduced by
describing the nature of the problem to be investigated.
(2) Objectives: A detailed list of objectives is provided and
divided into three sections: (a) Entry behavioi.s (those tasks
.which 'the students are expected to be able to perform before they
begin the experiment), (b) procedures (those taslcs which pertain
to procedural aspects), and (c) instruction and results (those

3
.tasks which deal with background material, calpilations, inter-
protatiOn of.results, etc.). (3) Instruction: A discussion of
the princiOes, calculations, etc., which ar fnVolved with the
experiment is provi.ded. Often, more than one type of instructional
approach, suchs prose, programmed instruction, praCtice problems
in the text,. .4 used in thie,section. The physical length and com-
plexity of this material varies from one experiment to aiiother.
(4) Procedures: A detailed discussion of the nature bf the:pro-
cedures section is provided below. (5) Data and_Report Sheets:
*These are sections 'cin which data are recorded, results are calCu-
lated, and interpretations and conclusions are made. (6) Advanced
Study Assignments: Exercises are specially designed to prepare
students for the experiment by covering background material as
well as experimental-Methods whenever necessary.- Completion' of
the Advanced Study AsOgnment ensures that the student will be
familiar with the experiment. Consequently, the student will not
have to spend any laboratory time getting organized. (7) Practice,
Post Test: This consists of a series of questions designed to
allow the studenf to evaluate his progress in learning and applying
the principles in.the experiment. Answers are provided, the
material in the instruction section and the questions in the
advanced study assignment and practice post test are keyed by
number to the objecfives.
b. Measurement of Student. Performance
Evaluation of student performance is made in several ways
during the course of the semester. (l) A pretest over various
arithmetic skills is given at the beginning of the semester.
6

44
From the results of this test, students are advised to complete
various remedi.al exercises. (2) Advanced sfudy assignments and
reports are graded week4,1- Students can follow their progress,
and determine their areas of weakness. (3) Practice post tests0. $ ,
included with the lab material are used by the student himself
for his own evaluation. They provide immediate feedback.
(4) Four examinations are given during the course. The first is
a short exam whose,purpose is to acquaint students with the type'
,
of test items and to show them how exam questions cover the objec-,
tives. The other three are full-length exams which include questions
at the knowledge leyel, questions which require application of,.
principles, and questions which require analysis of information or
synthesis of ideas. Laboratory work constitutes 70 percent of the-.,
student's grade, while exams total 30 :e.cent.
c. Algorithmization of Procedures
The general package as described above, seemed quite capable4
1of dealing with many of the problems which the studdlits,faced. It
did not, however, address the-problem ofAtudent afixiety and lack
of confidence. The students are limiZed to two hours per labora-
tory session. In order to collect the quantity of information
required to male observations, to perform calculations, and to-----74
reach conclusions in an experiment, the student must complete his
procedure and he must believe that his inforfiation is"correct and
complete. Students enrolled in this course generally lack experience
in a laboratory and experimental situation. They are also unfamiliar
- with the practice of organizing themselves so that tasks can be
completed in a reasonable peridd of time. These factors combine
7

5
to cause uncertainty, anxiety, and a certain number of errors.
In order to alleviate these problems and to insure early success
and self-confidence, the procedures or algorithms were preiented
in a flowchart form. These flowcharts served various purPoses:
-(1) To simplify otherwise complicated procedures; (2) To make pro-
cedures more organized and efficient, especially when several steps
tri one section of a procedure are repeated over and over; (3) To
reduce procedures to a series of short steps, so that attention is
focused on one aspect at a time; (4) To ask questions, and require
that decisions be thade at any appropriate times during the pro-
cedure. An example of a flowchart appears in Appendix I. ,This
- algorithm was designed for a portion of a qualitative analysis
eXperiment ir; which a mixture is being tested for chloride and
iodide ions. Since these ions interfere with each other, a
separation procedure is required, making the analysis relatively
complicated.
A FRAMEWORK FOR THE PROBLEM
a. Definitions
Each laboratory procedure the student performs is a sequence
of operations that leads to the solution of a problem, in short,
an algorithm) In addition, these operations or algorithms
1Landa defined the algorithm as "Oecise, generally comprehen.-sible prescription for carrying out a defined sequence of elementaryoperations in order to solve any problem belonging to a certainclass." The algorithm has three characteristics:
1) Specificity--direct instructions that preclude chantecomponents in the choice of actions.
2) Generality--any member belonging to the defined classcan,be substituted.
3) Resultivity,-the same result is always produced in thepresence of the appropriate data set.
Others (Brecke, 1975; Merrill, 1975; Gerlach, et al, 1975) haveadopted similar definitions. 8

maintain different levels of control with respect to a given task.
Viewed from the point of intended goals there are.two types
of algorithms: algorithms of transformation and algorithms of
identification. The algorithm of identification producei a judg-
1
ment of the initial objects' belonging. to a cdrtain class, e.g.1,f,
identifying the ions in a solution. The algorithm of transformation1
produces a change of state in the initial object, e.g., combining
hydrogen and oxygen to form water.
Viewed from the point of control there are also two types of1
algorithms. A functional algorithm exists whin no other control
of the system is necessary by additional systems. A controllingl
algorithm exists to provide a functional algorithm with a set of 1
proxedures for coping with unspecified (by the iunctioning algoriihm)1
circumstances, e.g., if a student is using a functional algorithm
to identify the ions in a solution and notes a reaction occurring
that is not in the procedures, he can turn to another set of pro-.
cedures or his teacher to provide the procedures for coping with
this unexpectedi circumstance. The procedure he turns to, either
in another book.or through the teacher, is the controlling algo-,
rithm. It should be noted that the concepts of "functional" and1
"controlling" algorithms are relative. A system that controls
a functional algorithm may be functional itself, requiring assis-
tariee from another algorithm in the event of a circumstance
occurring that it is not equipped to handle.
Table 1 illustrates the relationship between the goal of
the algorithm and the level of control exercised by the
algorithm. 9

Goal
Identification._
Transformation
7
Level of Control
Functional Controllin9
Table 1
R
-Given that wç have determined that a problem a student ist .
facing can be solve via an algorithm we can develop apprbaches. i.
,
to teaching these algorithms. Whether We wish to teach an
algorithm of,addition, ion identification, or sentence classifi-,
cation, we can choose from five basic techniques (as outlined by
Lando):
(1) Teach the algorithm of soluiion--We can provide the
student With the algorithm to solve the problem. 'This
would entail description Of steps and decision points with
alternative courses of action outlined.
(2) Teacha search algorithm to identify other algorithms--
All possible operotions and their sequences are given to
the student without eiplaining the algorithm of solution,
e.g., try switch 'a' arid sb'; if 'x' happens then do 'y.'
If not, -try 'z,' etc. In carrying out these operations...,
the algorithm of solution is discovered.
(3) Teach general methods of searching which are non-
algoriihmic,in nature-.:The algorithm is neither explained
or provided. -he student is given instructions that
could lead to the discovery of the algorithm, e.g., "try
10

8
different sequences," "identify the parts." This approach
leaves open the possibility of not discovering the algorithm.
(4) Teach separate rules of action--Teach the rules that
apply to the situation, without any specific orddr, e.g,
"turn knob A," "move bishop on the diagohal."
(5) Don't explain the algorithm or rules--This implies a
structured environment to allow the student a chance to
carry out search trials.
These five categories identify the possible alternativei
available to the instructional developer in specifying instruc-.
tional strategies utilizing an algorithmic approach. One suspects
that certain strategles are more effective and/or efficient under
certain conditions, e.g.,.situations placing a premium on tim'e to
completion and low error rate for a task would most likely require
the teaching of an algorithm of solution.,
'For the developer, acting as inquirer, these categories
represent the nucleus of a concentrated research effort in iden-
tifying optimum strategies for tasks given real world constraints,
e.g., "low error rate," "learn search strategies." Indeed, the
focus of the present study is to examine some of the effects of
presenting an algorithm of solution to the learner.
Because we were dealing with a relatively naive population
(at least in chemistry' knowledge) with a high anxiety level and
because we did not have a large amount of time.available for
each lab we placed a premium on a strategy that would reduce
error rates and increase efficiency. Additionally, we decided
that until the students were more sophisticated we should provide
11

:
them with the algorithm of solution for each problcm rither than
attempt tO have them derive the appropriate algorithm. (In our
laboratory situatlon we were presenting functional algorithms of
identification and transformation.)
Initially we chose to use flowcharts to represent the
algorithms. As Lewis et al (1), note:.. .
"Flowcharts have compelling advantages over their prosecounterparts. From the user's point of view,theysimplify the reasoning process in several ways. Instead
*of leaving him to find his own way through a masi oftiresome prose, they.present him with a minimum sequenceof simple (yes/no) questions. Moreover, each questionis unambiguous and relevant...There is never any needfor the user to wonder if,the sentence (or question) heis reading is relevant to his own case. And there isnever any need for him to wonder what he should consider
. next, because each answer automatically routes him tothe next relevant question." ,
Finally, Lewis, et al (2), have demonstrated the advantage of
flowcharts in decreasing task.completion time and decreasing
error rates.
b. Alternative Representations
Just as there are more ways than one to skin a cat, theret
are more ways than one to represent an algorithm. Each represen-
tation can vary in terms of readibility, structural clarity,
effort required to.produce copy, and space required for printing (3).
Classically, sta.ndard prose has been the method of representing
an algorithm in the laboratory situation. However, written.instruc-. 0 ,
tions are often presented in ways that are difficult to understand
(3, 4, 5). Prose instructions require the reader to process all
informalion regardless of relevance to the task. This alone could
lead to confusion and an improper solution to the task; especially
when the task itself is fairly complex. Furthermore, this complexity
12
10
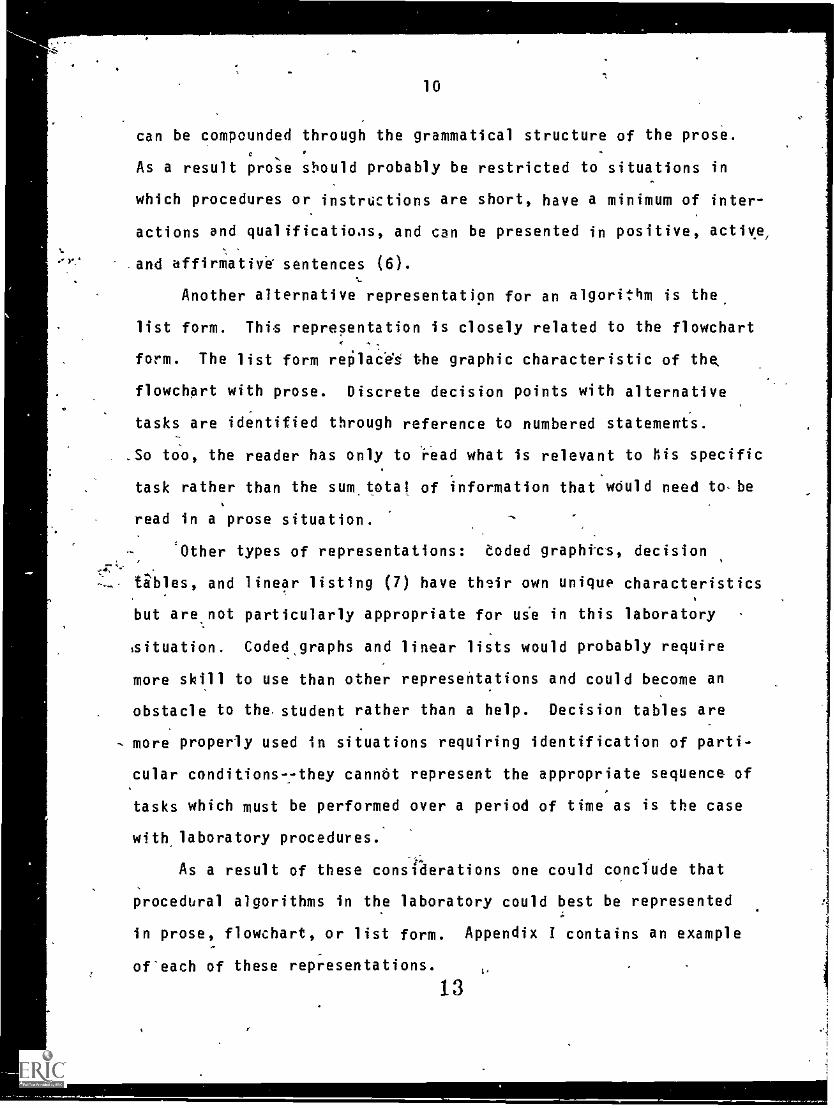
can be compounded through the grammatical structure of the prose.,
As a result proie should probably be restricted to situations in
which procedures or instructions are short, have a minimum of inter-
actions and qualificatioas, and can be presented in positive, actixe,
and affirmative sentences (6).-,_
Another alternative representatipn for an algorithm is the
list form. This representation is closely related to the flowchart.. ,
. '.form. The list form replacd§ the graphic characteristic of the
flowchart with prose. Discrete decision points with alternative
tasks are identified through reference to numbered statements.. ,
.So too, the reader has only to read what is relevant to his specific
task rather than the sum.totat of information that would need to.be
read in a prose situation.
,
-..,
. fibles, and linear listing (7) have their own unique characteristics
but are..not particularly appropriate for uie in this laboratory
$situation. Coded.graphs and linear lists would probably require
more skill to use than other representations and could become an
obstacle to the.student rather than a help. Decision tables are
- more properly used in situations requiring identification of parti-
cular conditions--they cannot represent the appropriate sequence of.
.
'Other types of representations: coded graphtcs, decision
tasks which must be performed over a period of time as is the case
with.laboratory procedures.'
t"As a result of these considerations one could conclude that
procedural algorithms in the laboratory could best be represented.
;
in prose, flowchart, or list form. Appendix 1 contains an example-
of'each of these representations.
r,

.
..
,
. 11
c. Possible Cosequences
Because each representation has its own unique characteristics
one might suspect that use of a given representation would have
specific consequences on the manner in which a problem i s resolved
Research to date in the use of algorithmic representations has
generally been limited to an examination of the efficiency of the--
.algorithm in completing a procedural task as well as decreasing
. error rates (8). Only recently.has an attempt been made to assess
higher order effects of these "ready-made algorithmic prescriptions.",
Coscarelli, Visscher, and Schwen (9) discovered that zritical
thinking ability was developed by presenting an algorithm to the
student in a flowchart repre,sentatton. While there exists Ao\
generally accepted explanation for this phkomenon it is possible
that the mode of representation (in this case,a flowchart).provides
the learner with a generalized model with which to approach prob-
lem solving. Carpenter in Solomon (10) observed that media are
not simply envelopes into which letters of various kinds can be
slipped. The medium itself may be a message with a codi and grammar
..
.....N..
of its own. Soloman has also suggested ihat media can affect cog-..
nition much as language can structure thought. Ntgrlsequently, the
manner of representation could have a serendipitous side-effect,\:
that of increasing overall' problem solving skills. \......
PURPOSE. OF THE STUDY
The purpose of the prqsent study will be to explore, in a
chemistry laboratory situation, the effect of different represen-
tations of functional algorithms on critical thinking ability and..
,
laboratory efficiency. 14 1

12-
a. Stafement of-the Problem
As we-tiave seen earlier, each representation of an algorithm
has its owg particular-characteristics. Furthermore, there seems.
to be scime evidence/that these,repreSentations can affect the _7 \
efficienc)60th whick'ac task tS.compjeted as well .as modify cog- ,
,
nitive skills.-_, As a retiqt we are.posing two reSearthable questlons
in relation-to the,USe of flopchart, list form and prose represen-,......
1
tations of an algorithmic \process.
b. Researchable" QuestIOns
(1) Will the type of repreSentation affect the time
necessary to coOklete
(2) Will the type of .representation'äffect critical
thi-gking ability as Measured on a standardized
test of critical thinking?
c. Independent Vartables
-The independent variat4a,will be the manner of fepresentation
of the algorithms. The'variablewili have three va-lues tkes-e
are based on a systematic variation of three rules for represen-
tation, i.e., each statement in the algorithm provides informatjon
critical to performing each.step In the procedure, statements may
'contain one or more than one task, decision points may be repre-
sented via flowchart symbols, referral to numbered statements,
or standard prose.
As an algorithm defines each step of a procedure and accounts
for any:possible occurrence, e.g, ."if a precipitate occurs, add
2 ml. of NaNO3; if no precipitate occurs, centrifuge the solution;"
the representations will vary the characteristics of the manner in
15

,
.,
..
r
13
which each step is presented to the student. Each step in the
representations wilt contain only information necessary for the
completion of one task, e.g., "add 1 ml. of H20 to the testtube."
For the flowchart and list form representation each statement will-.,
contain only one task. (A statement is defined as the basic unit
of 14presentation. For the flowchart this will be the area in a
box, for the rule-set l_numbered.command, and for the standard
prose representation this will be a sentence.) The.standard rotose.
-!..
representation will often have more than one task in a unit, e.g.,
."After you have added 1 mi. of H20 to the'testtube, stirand
filter the solution.":!.
The three values of the independent variable are :FLOWCHART
REPRESENTATION (Group I)
(1) Each statement contains only one task.
(2) At decision points alternatives are indicated
graphically in accordance with IOS Standard 102P--
,"Information Processing-Flowchart Symbols."
LIST FORM REPRESENTATION (Group !I)
(1) Each statement con.tains only one task.
(2) At decision points-alternatives are indicated
. through referral to numbered statements.
(NB: It is the difference between Groups I and II that is of major
interest. These groups vary only one waythe representation of
the decision points and the alternatives.)
STANDARD LABORATORY REPRESENTATION (Group III):
(1) Each statement may contain more than one task.1
,
e
(2) At decision points alternaAves are indicated .
through unnumbered statements.
16
,

..?
..
4
1
14
Table 2 sumtharizes.the variations between groups.
e'
GROUPRULE I II
-.
III
1. CRITICAL TO TASK
2. ONLY ONE TASK
3. FLOWCHARTREPRESENTATION
X
x
X
x
x
0
x
a
0
TABU 2
d. Dependent Variables
There are two dependent varialoles in the preSent study:
score on the Watson-Glaser Critical Thinktng Appraisal (W-G)
and time spent in performing the laboratory exe.rcise:
"The degree of skill in critical think.ing ability will be.
:,..
defined in terms of the score on the W-G. Watson and,
Glaser (1964)
-concluded that critical thinking can be viewed as a "composite of..-;,
attitudes, knoOledge, and skills." This compOsite includes:,
(1),Attitudes of inquiry that involve an ability to'recogniza the'
existence of problems and an acceptance of the general need for.
evidence in support of what is asserted to be true.
(2) Knowledge of the nature of valid inferences, abstractions,
and generalizations in which the weight or accuracy of different
kinds of evidence are logkally determined.
(3) Skills in employing and applying the above attitudes and.- ..
knowledge. More spec,ifically, a person witA a high degree of
critical thinking skills would be able to do the following:,
t
1
:17
t
.,
'0,
,
,

4
0
15
(1) Define a problem.
(2) Select pertinent info/mation for the solution
of a problem.,.
(3) Recognize stated and unstated assumptions.
(4) Formulate and setect relevant ind promising
hypotheses.
45),Draw valid conclusions and judge the vality
'of inferences. (Dressel and*Mayhew, 1954).
Indepenlent studies (Hilule, 1943; Morse and McCune, 1957; Hovland,
1959; R4st, 1960, 1962) have verfie.d.the construct valiaity.,of the
W-G as almeastere of critical thiniing. Watson and Glaser (1964)
report a:41it-half r'iliability coefficient corrected by the
Spearman-drown formula of ,85 for libera.i arts freshmen:.A
The time spent in performing thq laboratory exercise was
measured by the two lab instructors in each 10. Xhey 'Were asked
to estimate the average time spent by the students in completing
each lab exerbise.
e. Design
The present study is a pretest-posttestAesign. Table 3
illutrates this design.
0 r
TABLE 3
18
0
X2 0
X3 0, .
I.
1
16
f. Instrumentation
1. independent variables
For each of the values of the independent variable three
representation schemes were devised in accordance with the Niles
specified for each value. Appendix I lists an example of flow-
chart, rule:set, and standard laboratory xepresentations.
2.. dependent.variables
The measure for critical thinking skill was a single score
on the W-G. The measure for time spent in performing the lab
exercise was a'primarily subjective estimate made by-the
laboratory instructors.
g. Sample .
Approximately 190 students in an introductory laborato.ry
chemistry codrSe at Indiana University-Bloomington served as
respondents in the extieriment. Ten in.tact classes were randomly
c, assigned to one of the three.treatment groups. This produced a.
nested design wfth classei nested-Uji-aj treatment. Four'classes
totaling 82 students used the flowchart representation,, 3 classes
totaling 56 students used the lisi-form, and 3 classes totaling
52 students received the standard prose representation.
h. Procedures-
Previous to the first laboratory session students wire
instructed to purdhase a particular color coded lab manual. The
use of tAis codtng procedure allowed the experimenter to assure
that tkere was no intermixing of representations in a given
laboratory session:
All students were given the W-G during the first week of
classes before instrUction had begun. At the end cif 11 lab
19

17.
sessions the- W-G was administered. Alternate forms of the W-G
were randomly assigned to treatment.groups in'the pretest situation
and then reversed for posttesting. It was felt that this would
help control for practice effects that might occur if the same
forms were used for both administrations- Additionally, both forms
were msed on the pretest to help assess differences attributable
to each form. (It was found that the scores differed in accordance
with published standards and were properly equated in all analyses.),
In addition, estimates of completion time were collected from the
lall instructors..
-,
RESULTS
As was noted earlier the selection and assignment of intact
clasves prodtced a nested design. Ideally one vould kegin the
analysis using an analysis of covariance (ANCOVA) with a nested
design. However, due to time limitations and the general lack of
an acceptable computer program, the SPSS ANCOVA program, which does. .
not provide for a nested design, was run to determine the effects
,)
et:
a.
of mode of representation on critical thinking.ability. (It should
be noted that a series of one-way analyses of variance were per-
formed to deterinine that all treatment groups were not significantly
different on the pretest.) The ANCOVA-procedure was selected to
provide addittonal precision in estimating the effect of the
,'treatments by controlling for critical thinking ability as assessed'
by the pretest.21
1
2 The .correlation between pre and post 61tical,thinking scoreswas a-pproximately .48.
20,

tc,ts,
A
18
a. Effect of Representation on Critical Thinking Ability
The results of the ANCOVA protedure are reported in table 4.
SOURdESUM OFSQUARES df
MEANSQUARE F
SIGNIFLCANCEOF F
COVARIATEPRETEST 4402.674 1 4402.674 58.323 .0111
MAIN EFFECTSREPRESENTATIONS 25.929 2- 12.964 .172 .842
4.t
EXPLAINED 4403.982 3 1467.994 19.447 .001
RESIDUAL 14046.734 186 75.488
TOTAL ( 78444.716 189 97.591
TABLE 4
b. Effect of.Representation on ComOletion Time
The results of the various representations on completion time
are found in Figure 1.
INSERT FIGURE 1 ABOUT HERE
The X-axis represents the average completion time for each lab :
session as reported by the lab instructors... Eactrmark along this
axis represents an individual laboratory session. The Y-axis
represents deviations from the average.laboratory completion time.
A positive score indicates that the time of completion was greater
than average; a negative score indicates completiontiMs was less
than aver!ge. The units along this axis represent minutes.
c. Effect on Grade for Qualitative Analysis Lab
Because there appears to be a highly differgntial effect
between representations during the third and fourth labs an analysip
21

,
FIGURE I
Average Completion Time per Treatment
- Algorithm-------- List-Form
r- ---. Prose/ M/ 1o
ii / 1
ILI / I
2 // 1.
..
I=
Z0t
/
,ea. ii==42 , ,-'7
-...
1 .-- a10 ,,, .,..... /
ILI... ---1 Vr- / .
O I /U .
..4 .. i 1 /cr ,:
, , ,,, A /w ,
4,,, ...i I //> ,
1 /,..----
V
r
23

19
of variance was added to assess the effect of mode of representation
on the grade for these labs. Table 5 reports the results of this
analysis. ANCOVA procedures were not deemed necessary (though
could bg added later) due to the low correlation between pretest
score and grade on these labs (.14).
4MiiiSOURCE df
SUM OFSQUARES
Mi4ANSQUARES F F Prob.
BETWEEN GROUPS
WITHIN GROUPS
TOTAL '
2
180
182
317.4583
15806.789
16124.4372
158.7292
87.8166
1.808 :167
DISCUSSION
TABLE 5'.
The present results suggest that there may 'be no connection
between mode lisfepresentation and critical thinking.ability. If
this is the case one might question the hypothesis of Solomon that
media can influence cognition much as lahguage structuresy*waht.
However, one might also conjectuee that the strengt6 of the treat-
ment was insufficient to cause a change in overa.11 problem solving
skills. To be sure, the effects of any of the representations
6)uld be mediated by the availability of lab instructors and fellow
students who could provide additional guidance (controlling algo-
rithms) in difficult situations. This would diminish the effect of
the representation in structuring new thought processes.
In an earlier study (Coscarelli, et al), critical thiMing--as
defined by another measure, was enhanced by a flowchprt representation.
24

20
If the transfer effect found in that situation existed; the
question raised now is: Did the depen&ent variable in that study
measure critical thinking? If not, what dtd it measure? These
questions are worth further exploration. x
For the time being, the theoretical question must remain
. unanswered; but the praxiological one of serendipitfus side effects,
may be one step closer to resolution. In a reaT-world laboratory
situation there may not be much hope of generating critical thinking
via representation mode.
,
representation modes. Generally speaking, the flowchart group
performed poorly compared to other representations on the initial
labs, moved on to demonstrate efficiency and then tapered off,.
For the prose group the resylt was the reverse before tapering.
yXe list-form group proved the most stable across all labs.
One might hypothesize that these results Can best be explained
as a function of familiarity and algorithmic difficulty. For the
istudents using the flowchart representations, an initial period
of adjustment to.an unfamiliar mode of representation wat necessary.
Those using representations more nearly parallel to standard prose
faund initial adjustment quite elementary. However, dpon encountering
the qualitative experiments, perhaps the most difficult of the labs,
the flowchart provided a definite advantage to the student in
. clarifying i complex series of instructions Additionally, an
analysis of the score for these labs indicates there exists no
In the area of efficiency we found an interesting effect among
lsignificant difference between groups. In this instance, one
could argue that the Ilse of flowcharting provides an efficieut
25'.

21
and effective method of representing a functional algorithm of
identification.
Interestingly enough the list-form remained most constant
across,labs in approaching the average time of completion. Later,
in a final laboratory experiment where students were required to
develop their own set of procgdures for a lab exercise; students
would tend to list the procedures in the manner in which they had
received instruction, i.e., flowcharts used in the flowchart group,
etc. However, if the procedures were not detailed in the mode of
instruction they were almost always presented io a list-form.; This,I
despite a lack of interaction with the list-form.representation,-
may indicate a generalized mode of thinking among students in
approaching a complex prc_edure. Agatn, it remains a question
open to further exploration.
Finally, the tapering effect found after the first four labs
may be due to the students' ability to deal with the environment,
not as the naive respondents they were upon entering the course,
but as relatively_ sophisticated chemists. As they became more
assured and knowledgeable it would be possible for them to move
fromlhe crutch of a specific representation mode and attend to
the complexities of the individual task; transcending the repre-
sentation scheme.
CONCLUSION
We have seen that the mo e of representation foi algorithmic
situations may not provide increase in a generalized skill such
as critical thinking but t t it may have an advantageous effect
on more specific merWes o efficiency and effectiveness (as
26 ,
I.

a.
-
22
'measured by tasks closely,related to the use of the procedure) in
coMplex,situations. What we may have seen is that the mode of
_.
representation can be a useful tool or hindrance depending on the,
A..: niqe,
'6.4....
comprexity of the task and as with so many other things task.com-
plexity is a relative matter, i.e., lab procedures initially found
difficult may be di'fficult to factors beyond the stope of the
algorithm involved such as situation familiarity, confidence, etc.:
For these situations a flowchart or list-form may prove most use-
ful. In other situations-where complexity is not an issue, repre-0
sentations are equalized and might best be selected -using an
affective criteria of student preference.
i
,
-
-,
27
,
N
.II..

-
REFERENCE NOTES
1. 'Lewis, B.N., Horabin, I.S., and Gane, C.P. (1867). 'Flowcharts, logical trees and algorithms for rules and regulations.London: Her Majesty's Stationery Office,
2. Lewis, B.N., Horabin, I.S., and Gane, C.P. (1967). Casestudies in the use of algorithms. Oxford: Persammon Press.
3. Chapanis, A. (1965). Words, words, words. Human Factors,7, -7.
4. Houghton, J. (1968). Round holes not circular orifices.London: The London and Southern Junior Gas Association.
5. Jones, S. (1864). Why can't leaflets be logical? New Society,102, 16-17.
s.
6. Davies, I.K. and Packer, D.G. (969). Decision tables, algo-rithms, heuristics and continuous prose: models for writincomplex rules, procedures and instruction. Paper presenteat,the ErgoRomic Research Society Conference. London.
7. Gerlach, V., Reiser, R., Brecke, F. (1975). Rule learningand systematic instruction in undergraduate pilot training.Technical Report #51201, College of Education, Arizona StateUniversity, Tempe, Arizona.
8.. Lewis, et al (1967): Oxford.
9. Coscarelli, W., Visscher, M., and Schwen, T. (1976). Algo-rithmization and transfer of learning. Paper presenteli atthe annual meeting of the American Educational Research ,
Association, San Francisco: April, 1976.
10. Solomon, G. (19.72). Can we affect cognitive skills throughvisual media? An hypothesis and initial findings. Audio-Visual Communication Review, 20(4).
REFERENCES
Brecke, R., Gerlach, V., and Shipley, B. (1975). Algorithms:a new tool for educational technology. Paper presented atthe annuaT meeting of the American 'Educational ResearchAssociation, Washington, D.C.
Lancia, L. (1974). Algorithmization in learning and instruction.Englewood Cliffs, N.J.: Educational Technology Publications.
Merlill, P. (1974). Algorithmic organization in teaching_andlearning: the literature and research in the U.S. Paperpresented at the annual meeting of the American EducationalResearch Association, Chicago, Illinois.
28
.c

t
.."
'I.
.APPENDIX I
N
1
,I
,
29

.1
,,
So
,
'QUALITATIVE ANALYSIS: FLOWCHART REPRESENTATION
START
I Sdect two test bibes It .
To fest tube # I. add1 mi. of a 50-50mixture of 0.1 M Na0and 01 hi NaTo test tube #2, addI ml. of unknown soln.
I
Add 1 mi. of 6 M HNO3and I ml. cf 0.1 MAgNO3 to etch
Yes
IAdd I ml. 6 M HNO3
a t.
G other anionand I absen
o totests'
:
centifuge
iMd a few nom diaPsof 0.1 M AgNO3 tosummate
itantrifugei
I SAYE PRECIPITATE I
6
q)IAdd 1 ml. 6 M NH3 toAn and stir
.,,.:.., Y
r:sit4ntriWee ISAYE SUPERNATE
Fdd PA- 2 ml. 6 MHNO3 to summate
I
MO I% - 2 mt. 6 MHNO3 to dear iquid-
Special Test for l'
cr and l' absentDo other anion bsts
31

QUALITATIVE ANALYSIS: LIST-FORM REPRESENTATION
1. Select two test tubes.2. Add 1 ml of a 50-50 misturb M NaC1 and 0.1 MNal to test tube kl.3. Add 1 ml of the unknown,to test tube #2.4.. Add 1 ml of 6 M -1INO3 to each test tube.S. AddLrnL of 0.1 M(AgNO3 to each test tube.6. If a precipitate'occurs, go to statement #9v7. If no precipitat occurs, go to statement #8,
8. Cl- and I are.abent. Go tb statement #39.. A 1 ml 6 M HNO3.=
10. if the precipit4te remains, g6 to statement #12.11. If no precipitate remaihs', go to statement 118412. Centrifuge the'solution.13. Add a few drops of 0.1 M A003 to supernate..14. If a precipitate occurs; gid to statement 1112.15. rf no precipitate occurs, go to statement #16,16. Centrifuge the solution.17. Save the precipitate.
".18. Ade& 1 ml 6 M NH3 to precipitate.'19. Stir solution.20. If the pretipitate remains, go to statement 1122.21. If no precipitate,remains, go to statement 1127.22. Centrifuge the solution.23. Save the supernate.24. Add 1 1/2-2 ml 6 M HNO3 to supernate.25. If a white precipitate occurs, go tO statement 1130.26. If no white precipitate occurs, go to statement 1133.27. Add,1 1/2-2 ml of 6 M HNO%-to clear liquid.28. If a white precipitate ocdurs, go to statement 1135.29. If no white precipitate ,occurs, go to statement 1137.30. Cl- p Jsent.31- Perform special test of I-.32. Go to statement #38.33. Cl- present.34. Go to statement #31.-,35. Cl- present,and I- present.36. Go to statement 1136.37. CP. absent and I- absent.38. STOP39. Proceed to other anion tests
t.
32
.4
V.

1.4
QUALITATIVE ANALYSIS: STANDARD PROSE RiPRESENTATION
Select 2 test tubes adding 1 ml of a SO-50 misture of 0.1.M NaC1 and 0.1 M Nal to the first test tub'§ and 1.m1 of theunknown to the second. Then add 1 ml 6 M HNO7 and 1 ml of 0.1M AgNO3 to each test tube. If no precipitate-occursyou havedetermined that Cl- and I are absent and you should proceed tothe-other anion tests. If a precipitate occurs add 1 ml of6 M HNO3. Xf the precipitate disappears; Cl- and I are absentand you should proceed to the other anion tests. If theprecipitate remains, centrifuge the solution and add a fewdrops of 0.1 M AgNO3 to the supernate. If a precipitate occurs,centrifuge the solution again and add a few more drops of the0.1 M AgNO3. Continue to do this until no precipitate occurs.At this point,centrifuge the solution and save the precipitate.
Add 1 ml of 6 M NH3 tothe preeipitate and stir. If 'noprecipitate remains add 1 1/2-2 ml 6 M 11NO3 to the clear liquid.If a white precipitate occurs Cl- is present and I is absent..If a white precipitate does not occur, Cl- and I are absent.If, afteT adding the 6 M NH3 a precipitate does.remain,centrifuge the solution and save the supernate. Add 1 1/2-2 M1of 6 M HNO3 to the supernate. If no white precipitate formsCl- Is absent. If'a white precipitate forms, Cl- is present.In either case, it is necessary to perform the special test for I.
33

A FINAL NOTE
/;
. Because of the nature of this study I must also
acknOwledge t1e contributions of.Marty Visscher who was
my client in the development of this course and Tom Schwenr
who served as consultant and teacher throughout the pro-
ject. The chemistry (excuse the pun).of the team led to
a synergistic whole that will not be duplicated for some-
time to come. .
i
a
I,
34
t
.-