DOCUMENT RESUME CE 049 284 - ERIC · the UVCE institutions have 130 vocational-education...
34
DOCUMENT RESUME ED 289 057 CE 049 284 AUTHOR Roth, Gene L., Ed.; Walter, Richard, Ed. TITLE The Trade and Industrial Education Research Committee. Proceedings of the Carousel Session, American Vocational Conference (Las Vegas, Nevada, December 1987) . INSTITUTICN American Vocational Association, Alexandria, VA. Trade and Industrial Education Div. PUB DATE Dec 87 NOTE 34p. PUB TYPE Collected Works - Conference Proceedings (021) -- Reports - Research/Technical (143) EDRS PRICE MF01/PCO2 Plus Postage. DESCRIPTORS *Cognitive Styl6; Comparative Analysis; *Computer Assisted Instruction; Conference Proceedings; Drafting; Educational Research; Learning Strategies; Teacher Attitudes; *Teacher Educator Education; *Teaching Styles; *Trade and Industrial Education; *Vocational Education Teachers IDENTIFIERS *Computer Assisted Design ABSTRACT This document presents three papers dealing with trade and industrial education research. "Educating the Vocational Teacher Educator" (Clyde Knight) reports a study to identify needs of vocational teacher educators to improve existing programs and make necessary changes in doctoral programs. "The Relationship between Perceived Learning Style and Teaching Style of Occupational Educators" (Ray Sanders, Michael Galbraith) presents findings of a study to examine the perceptual learning modalities of junior college occupational educators and how they thought they learned best and to compare this learning style preference to the teaching methodologies used in their instructional situations. "A Comparison of Beginning Drafting Achievement between Students Using Traditional Equipment and Students Using Computer Aided Design and Drafting Equipment" (Dennis Murphy) reports that no significant difference was found in the achievement of beginning drafting competencies between students using traditional drafting tools compared to students using computer-aided design and drafting tools. (YLB) *********************************************************************** Reproductions supplied by EDRS are the best that can be made from the original document. ***********************************************************************
Transcript of DOCUMENT RESUME CE 049 284 - ERIC · the UVCE institutions have 130 vocational-education...

DOCUMENT RESUME
ED 289 057 CE 049 284
AUTHOR Roth, Gene L., Ed.; Walter, Richard, Ed.TITLE The Trade and Industrial Education Research
Committee. Proceedings of the Carousel Session,American Vocational Conference (Las Vegas, Nevada,December 1987) .
INSTITUTICN American Vocational Association, Alexandria, VA.Trade and Industrial Education Div.
PUB DATE Dec 87NOTE 34p.PUB TYPE Collected Works - Conference Proceedings (021) --
Reports - Research/Technical (143)
EDRS PRICE MF01/PCO2 Plus Postage.DESCRIPTORS *Cognitive Styl6; Comparative Analysis; *Computer
Assisted Instruction; Conference Proceedings;Drafting; Educational Research; Learning Strategies;Teacher Attitudes; *Teacher Educator Education;*Teaching Styles; *Trade and Industrial Education;*Vocational Education Teachers
IDENTIFIERS *Computer Assisted Design
ABSTRACTThis document presents three papers dealing with
trade and industrial education research. "Educating the VocationalTeacher Educator" (Clyde Knight) reports a study to identify needs ofvocational teacher educators to improve existing programs and makenecessary changes in doctoral programs. "The Relationship betweenPerceived Learning Style and Teaching Style of OccupationalEducators" (Ray Sanders, Michael Galbraith) presents findings of astudy to examine the perceptual learning modalities of junior collegeoccupational educators and how they thought they learned best and tocompare this learning style preference to the teaching methodologiesused in their instructional situations. "A Comparison of BeginningDrafting Achievement between Students Using Traditional Equipment andStudents Using Computer Aided Design and Drafting Equipment" (DennisMurphy) reports that no significant difference was found in theachievement of beginning drafting competencies between students usingtraditional drafting tools compared to students using computer-aideddesign and drafting tools. (YLB)
***********************************************************************Reproductions supplied by EDRS are the best that can be made
from the original document.***********************************************************************

/////////////e dff 40 # te 1 / / / , 4, / ,
N. 4/ i 4/ # "t / , / 4# / / /0LPY 4, # A , / OS* / 0 / / / #i1.4143/4401//:///1/4%,
4, ffeelP6C) 41e 44e 4, li1/41* ? / / / 4#° *le #0,/ 44e1W,/, o/ , , 4,i /c P, /ce A" *OW AP / 4# 4/ 1 4"i 4' k", 19eVOW / 4,639, 4, if i #
/ / 40".44e4", ffif / ittP,',/ teC141:, 44"614 # if 4/ # /
l' / 4e0be4eve400 441/4/4"4,14/. 4, s i if/ / / 4, / "zet144° "trig, i 4, 40* // .#0 i / 40cvezcvAe4eeet do if 00 .#s .#0' i / //test"eioecst 4000 o/ i i/ / / / / 40 i i iete4ot / 4,# i / so 4, 4/. i , i ifr,ev440t 4te /
4#i / / / # i i 40fcte/e§be t /i / / / , , i , i 4444, 4, / 0/ / off 4, 49 ff de 40, 4, , 9/ // / / / 4, 40* / / 4$, / 1A.
"PERMISSION TO REPRODUCE THIS , / 4" 41SuOffice a Educational Rematch and Improvement
U.S. DEPARTMENT OF EDUCATIONMATERIAL HAS BEEN GRANTED BY
ED ATIONAL REURCES INFORMATIONCENTER (ERIC) 4 4" i 4,
4 ?,\0 ' ,* This document has been reproduced asreceived from the person or organizationoriginating it. 4, "te , ,4*
(-? "# reproduction aualdY4
TO THE EDUCATIONAL RESOURCES e ff0 Minor changes have been made to improve
If ill °;:; °I; 79Points of viewOf opnion s slat ed in this docu-ment do not necesaanly represent official
INFORMATION CENTER (ERIC)."
P , , de i , / / ? , / / 41'® # // 441* ie / / 4" 4" 49 / 4/i , 4ff / / ff / e ,s,
02 0 ST Yp Hip. /1)
Foreward
The Trade and Industrial Education Research Committee is a standing
committee of the Tradeand Industrial Education Division of the American
Vocational Association, The mission of thii!oOMMI:tpee is to promote
41systematic inquiry as a means of improving the 41.114Uyeltrade and
t,t2
industrial education programs and services. The committee accomplishes
this mission through the organization of T&I research sessions at the
annual American Vocational Association Conference and the development and
dissemination of timely reports and monographs related to trade and
industrial education.
This document contains three papers that were presented at the Trade
and Industrial Education Research Committee's carrousel session at the 1987
American Vocational Association Convention, Las Vegas, Nevada. These
papers were selected for inclusion in this document following a blind
juried review by members of the T&I Research Committee. The T&I Research
Committee would like to thank the respondents to our call for papers.
These are the researchers who have made the annual T&I Research session a
reality.
Gene L. Roth, Ct.
Trade and Industri 4ncation Research Committee
3

Trade and Industrial Education Research Committee Members
Term Expires 1987 gonvention Term Expires 1988, Convention
Dr. Robert McCough (Region 1) Dr. Scott Whitener (Region 1)International Vocational-Technical Training Center for Occupational EducationWestinghouse Corporation. Ferris State CollegeBox 866
America City Building, 014'1 4 e'
Columbia, MD 21043
Dr. Patrick O'Reilly (Region 2)Vocational-Technical EducationVirginia Polytechnic Institute& State University
Blacksburg, VA 24061
Dr: William E. SchoonmakerUniversity of MinnesotaCollege of Education
Division of Industrial Education425 VoTech BuildingSt. Paul, MN 55108
(Region 3)
Dr. Gonzalo Garcia, Jr. (Region 4)Texas A&M UniversityDept. of Industrial Vocational
Technical EducationRoom 620 Harrington
College Station, TX 77843
Dr. Craig Anderson (Region 4)School of Occupational & Adult Educ.College of EducationOklahoma State UniversityStillwater, OK 74078
Dr. Robert Miller (Region 5)Northern Arizona UniversityCollege of Design & TechnologyBox 6003Flagstaff, AZ 86011
Big Rapids, MI 49307
:
Richard Waleer (Region 1)Dept. of VocStional-Technical Educ.State University of New YorkOswego, NY 13126
Dr. Hugh Swogger (Region 2)Dept. of Vocational & Career Devel.College of EducationGeorgia State UniversityAtlanta, GA 30303
Dr. William Wolansky (Region 3)Science and TechnologyIndustrial Education DepartmentIowa State UniversityAmes, IA 50011
Dr. Rick Sullivan (Region 4)Department of Industrial EducationCentral State UniversityEdmond, OK 73034
Dr. Warren Suzuki (Region 5)Oregon State University
Dept. of Vocational & Technical Educ.Corvallis, OR 97331-2404

"Arm Expires 1989 Convention
Dr. C. William Garner (Region 1)Rutgers University
State University of New JerseyGraduate School of EducationNew Brunswick, NJ 08903
Dr. Dennis TesolowskiClemson UniversityCollege of EducationDepartment of IndustrialClemson, SC 29631
(Region 2)
Education
Dr. Jack Wamble (Region 3)Southeast Missouri State UniversityCollege of Science and Technology
Dept. of Industrial Technology &Education
Cape Girardeau, MO 63701
Dr. Jay T. Smith (Region 4)Jackson State UniversitySchool of Science & Technology
Dept. of Technology & Industrial ArtsJackson, MS 39217
Dr. Doug Hammer (Region 5)Utah State UniversityCollege of Engineering
Industrial Tech & Educ. Dept.Logan, UT 84322
stn Expires 1990 Convention
Don McKay (Region 3)
Dept. of Industrial Education & TechnologyIowa State UniversityAmes, IA 50011
Hervey ;R. GIlloway (Region 5)Trade & Industrial EducationThree Capitol MallEducation Building WestLittle Rock, AR 72201-1083
Dr. Steve Chi-Yin Yuen (Region 4)Dept. of Industrial & Vocational EducationUniversity of Southern MississippiHattiesburg, MS 39406
Dr. Norman Peterson (Region 3)University of Missouri103 Industrial Education
Columbia, MO 65211
Chairperson: Dr. Gene L. Roth (until 1988 convention)Northern Illinois UniversityOffice for Vocational, Technical and Career Education155 Gabel HallDeKalb, IL 60115
Chair-Elect: Richard WalterDept. of Vocational-Technical EducationState University of New YorkOswego, NY 13126
Secretary: Don McKay (until 1988 convention)Dept. of Industrial Education and TechnologyIowa State UniversityAmes, IA 50011

TABLE OF CONTENTS
Title ,. .
.
. -,
Educating the Vocational Teacher Educator
Cryd6 Knight
The Relationship Between Perceived Learning Styleand Teaching Style of Occupational Educators
Ray SandersMichael W. Galbraith
A Comparison of Beginning Drafting AchievementBetween Students Using Traditional Equipment andStudents Using Computer Aided Design and DraftingEquipment
Dennis Murphy
Section
A
B
C

,-.
SECTION A
Educating the Vocational Teacher Educator
Clyde Knight
7

EDUCATING THE VOCATIONAL TEACHER - EDUCATOR
By
Clyde Belin KnightTrade & Industrial Education and
Chairman of the Graduate Studies Committeefor the School of Occupational & Adult Education
College of EducationOklahoma State University406 Classroom Building
Stillwater, OK 74078-0406
Approved by the Research CommitteeSchool of Occupational & Adult Education
Funded by the College of EducationOklahoma State University
Stillwater, OklahomaAugust, 1987
1

Educating the Vocational Teacher-Educator
Introduction
--....,With the increasing national interest 1v10, criticism of teacher
education programs the past few years, institutions responsible for
training vocational teachers and developing their programs for teacher
education need to be closely examined to determine if problems exist in the
selection and education of the vocational teacher-educator. This study
analyzes current developmental practices and ways to improve vocational
educator education.
Problem
Though the Holmes and Carnegie Reports of 1986 addressed the problems
of educating teachers, identifying teacher-education programs which succeed
or fail, they have not addressed educating the teacher educator.
Specifically, the problem is a lack of unity or coherence in requirements
for the development of current vocational teacher-educators and suggestions
to improve the development of successful vocational teachers for these
technically-oriented, rapidly changing times.
Research Questions
This study answered the following:
1. What background experiences have teacher-educators in doctoral
degree-granting universities had to prepare them to be vocational teacher-
educators?
2. What specific educational experiences have they had to prepare
them to be vocational teacher-educators?
2

3. What special xgrk experiences did they have to prepare them to be
vocational teacher-educators?
{4. What university Bourses did.thOhave, to 'specifically prepare
them to become vocational teacher-educators?
5. What curriculum changes (specific courses and other experiences)
would they recommend for educating future vocational teacher-educators?
Population
The population for this study is the 36 major vocational teacher-
educator education institutions with five or more vocational disciplines
that grant a doctoral degree (identified in Adams and Biehms, 1984,
Information Monograph No. 1, printed by the University Council for
Vocational Education). Eighteen of the identified institutions were
members of the University Council for Vocational Education (UCVE), and 18
were not, so group differences are also noted.
Purpose
This study identifies needs of present and future vocational teacher-
educators in order to improve existing programs and to make any necessary
changes in doctoral programs.
Findings
In the eight vocational certification disciplines (Agriculture,
Business and Office, DE/Marketing, Health, Home Economics, Industrial Arts,
Technical Education, and Trade and Industrial) of their 18 institutions,
the UVCE institutions have 130 vocational-education certification
specializations. The other 18 institutions have 117.
3
10

Head teacher-educators from UCVE institutions returned 78 (60%) of the
surveys, and ner.,-bnVEs returned 44 (37%) for a total of 122. Coordinators
from the 18 UCVE institutions returned'16188%) of the surveys, and non-
UCVE returned 11 (61%) for a. total of 27.
The lengths of service as a teacher-educator ranged from zero to 30
years with 14 mean average years of experience. The years of experience as
a teacher before becoming a teacher-educator ranged from zero to 21 with a
seven year mean average.
Only 18% of the vocational teacher-educators had vocational education
courses in secondary school; 70% have baccalaureate degrees, and 60% have
master's in the specialization for which they are teacher-educators.
Nine of the 122 (7%) head teacher-educators held baccalaureate
degrees, 40 (33%) held master's degrees, and 73 (60%) held doctorate
degrees when they were hired as teacher-educators. Forty-eme of the 122
identified their first choice reasons for pursuing a doctoral degree as "to
be a vocational teacher-educator," and 38 specified "to be a college
professor of their vocational discipline." For becoming a teacher-
educator, 105 of the 122 teacher educators listed teaching experience as
one of their most valuable work experiences; teacher educators in all eight
disciplines believed the four higher education experiences most beneficial
to them in rank order were: 1) research techniques, 2) curriculum
development, 3) advanced methods of teaching, and 4) principles/foundations
of vocational education. (See Table I for the top 14 of 43 items.)
The 27 coordinators identified 27 different courses that should be
required for all teacher educators. In rank order the top five are: 1)
History, Principles, and Philosophy of Vocational Education (19), 2)

Research (12), 3) Program Planning/Curriculum Development (11), 4)
Evaluation of Vocational Education (10), and 5) Statistics (8). Tame I
shows some major disagreements as sell as agreements as to the most
valuable courses and experiences` or developing career terther-educators
and what the university vocational coordinators report as presently
required courses. The 122 teacher-educators recommended 39 kinds of
assons or specific experiences that should be included in a doctoral
program of study for developing the vocational teacher-educators. (Items
listed by more than one teacher educator are in Table II.)
Conclusions/Recommendations
Occupational experience in the vocational discipline is most important
in the development of teacher educators. Teaching experience before
becoming teacher educators is an important work experience. A master's
degree in vocational teacher-education (in the specific discipline) is an
important part of the educational background for teacher-educators.
Therefore, speci.:',c core courses identified by all disciplines should be
analyzed and updated to include these experiences needed by all teacher
educators.
The 27 institutional coordinators listed courses and experiences now
required which were different from those the 122 vocational teacher-
educators believed should be course requirements and/or seminar experiences
for preparing vocational teacher-educators.
The top ten most helpful college courses and experiences identified by
the 122 teacher educators and the 27 vocational education coordinators as
being currently required should be considered for all teacher - educator
doctoral programs.
5
12

Institutions offering doctoral programs for developing teacher
educators should study all items listed on Tables I and II to be sure their
programs are not overlooking important teacher-educator competencies.
A specific foundations or "capstone" course should be established for
the best possible professional preparation of teacher-educators.
National standards for educating vocational teacher-educators should
be established.
Selected References
Adams, D.A. and Diehm, E.A. (January, 1984). Vocational teacher education
Programs in =a United States. University Council for Vocational
Education.
Carnegie Forum's Task Force on Teaching as a Profession. (1986). A nalian
prepared: Teacher* gsm Ihn 21st century.
Erekson, T. and Gloeckner,. G. (December, 1986). University teaoking in
industrial education,: Demographic factors. Dallas, TX.
The Holmes Group. (1986). Tomorrow's teachers: A report. East Lansing,
MI.
Watts, D. (January-February, 1974). Teacher educators should be
certified. Journal Di: Teacher Education, 3i, 30.
For the complete report--all research and findings--contact the author.
Clyde B. Knight, 416 Classroom Building, Oklahoma State University,
Stillwater, OK 74078-0406.
6
13

TABLE I
Courses and Higher Education Experiences Most Beneficialin Developing Teacher-Educator Abilities Reported by
Teacher Educators and Required DoctoralCourses Reported by Coordinators
RankOrderby
Teacher
Educators
Courses or Experiences Teacher Voc RankEducator Educator OrderN-122 Coord by
N-27 Coord
1.. Research Techniques 44 12 2
2. Curriculum Development/Program Planning 42 11 3
3. Methods of Teaching (advanced) 30 0 0
4. Principles/philosophy of Voc Ed 25 19 1
5. Professional Vocational Teacher 18 1 10Education Courses
6. Student/Teaching Supervisor 17 1 10
7. Administrative Courses 14 1 10
8. Graduate Assistantship (intern) 13 1 10
9. Statistics 13 8 6
10, Evaluation of Voc Ed 10 10 4
11. Specialization Courses 10 2 9
12. Supervision of Voc Ed 8 1 10
13. Seminars with Graduate Students 5 9 5
14. MS degree in Teacher Education 7 1 10
Educational Psychology 6 2 7
a Ethics/Social Issues 0 3 8
s Seminar in Teach( Education 0 3 8
*These items are not listed by teacher educators. (The teacher educatorslisted 43 items; the vocational coordinators 27).
7
14

TABLE II
Lessons and Experiences that Should be Includedin Doctoral Programs of Study for Developing
Vocational Teacher-Educators
RankOrderNo.
1.
2.
3.
4.
5.
6.
7.
8.
9.
10.
11.
12.
13.
14.
15.
16.
17.
18.
19.
20.
21.
22.
23.
24.
25.
26.
27.
28.
29.
30.
31,
32.
Lesson or Experiencebl)<
4.44.400Z
ata
b04-)..14
-..:
1+1=
4.)....4atCJ=
c.)1.14
(1)E0=
.4Ua)
E--,\<-'0t4.40
(1)(-.
'IC)LL3 .-4
Wl'.1 }iLa 0(-. E--,
Curriculum/program development 2 3 4 1 3 6 - 5 24Graduate assistantship or internship 5 1 - 2 6 2 2 6 24Design/direct research project 4 4 - 3 2 2 1 3 19Supervise student teachers 2 3 2 5 5 - 2 19Intern with SDVTE 1 5 5 5 - - 2 18Professional issues/universityexpectations
2 3 1 - 2 2 - 8 18
Scholarly writing 2 n 3 1 1 4 6 - 17Supervise/evaluate programs 4 2 1 2 1 2 5 17Attend AVA (and other professionalmeetings)
1 2 3 2 1 1 10
Teach and grade college courses - 1 7 - - 8Advanced teaching methods 3 3 - 1 7Conduct/plan in-service workshop 1 - - 1 1 - 2 5Develop educational philosophy - - 3 1 1 - - - 5Seminars with Ed.D. landidates 4 - 1 - - - ,Teach undergraduate courses 2 - - 1 1 - - 4Develop a new course for teacher-education program
1 - - 1 2 - - - 4
Intern in research 2 - - - - - a 4Processes for admission to teachereducation
- 2 - 2 4
Publish or perish 2 - 1 Mb - - 3Internship in AV TS - 1 - - 1 - - 1 3Communication skills (written and oral) - - - - 2 - 1 3Public relations d 1 3Require all teacher-education basiccourses
- 1 1 - 1 Mb Oa - 3
Student organizations - 1 IN 1 - 2Time/stress management 1 1 - - - - 2Advisory committee development - - 1 - - 1 - 2Administration experience/role 1 1 - - - 2Computer literacy - 1 - - - - 1 2Intern at national center - 1 - OP .0 ONO 1 2Intern in business and industry 1 - 1 - 2Certification processesRecruit students
Number of responses 43 33 27 10 41 41 9 46 250Total respondents 25 18 11 6 21 19 4 18 122
8 15

SECTION B
The Relationship Between Perceived Learning Style
and Teaching Style of Occupational Educators
Ray Sanders
Michael W. Galbraith
THE RELATIONSHIP BETWEEN PERCEIVED LEARNING STYLE
AND TEACHING STYLE OF OCCUPATIONAL EDUCATORS
By
Ray E. Sanders, M.S. (Presenter)
Instructor of Trade and Industrial EducationOklahoma State University
School of Occupational and Adult Education406 Classroom Building
Stillwater, OK 74078-0406405/624-6275
Michael W. Galbraith, Ed.DAssistant Professor of Higher and Adult Education
University of Missouri-Columbia
Department of Higher and Adult Education and Foundations301 Hill Hall
Columbia, MO 65211
314/882-8231
1
17

Relationship Between Perceived Learning Style
and Teaching Style of Occupational Educators
The analysis of teaching styles and learning styles is an important
area of inquiry which has received a considerable degree of attention over
the past two decades. While an awareness exists that educators communicate
an identifiable set of classroom behaviors known as a teaching style, less
emphasis is placed upon the teacher's own preferred learning style. As
Cornett (1983) suggests, "whatever the teacher's learning style, it will
have an effect on his or her teaching style" (p. 14). It was further
argued that teachers tend to teach the way they learn. This relationship
has not been examined in occupational education.
Learning style refers to the preferred way that individuals transform
and assimilate information; its how the learner constructs meaning out of
stimuli (Kolb, 1984). Every indiviaual has a unique learning style,
however, this style may be adjusted depending on the learning task
confronting them and the teaching style being used. At best, styles are
overall patterns that give general direction to learning behavior (Cornett,
1983).
Learning styles can be examined from three broad perspectives:
cognitive, affective, and physiological. The cognitive aspects of learning
style includes the way an individual processes, decodes, encodes, stores,
and retrieves information (Kirby, 1979; Kolb, 1976, 1980. This cognitive
aspect is characterized by the learners ability to focus or scan, randomly
or sequentially, concretely or abstractly, the information. Each of these
pairs of cognitive processes can be represented on a continuum, and given
2
18

times and the various instructional situation a switch in orientation can
occur.
Another way of examining learning styles can be from an affective
aspect. This aspect of learning style includes emotional and personality
characteristics related to motivation, locus of control, interests,
persistenne, responsibility and sociability (Messick, 1976; McCarthy,
1981). Depending upon the learner, praise and external reinforcement may
have a positive effect on the learning process while at other times the
effect may be negative.
Finally, the physiological aspects of learning style which relate to
sensory perception and environmental characteristics, can be examined (Dunn
& Dunn, 1978; Barbe & Swassing, 1979). James and Galbraith (1985) refer to
this aspect of extracting information from the environment by the senses as
a perceptual learning style. Their learning style composition is comprised
of seven elements: print, aural, interactive, visual, haptic, kinesthetic,
and olfactory. Research of Galbraith and James (1984) has indicated that
learners do have a dominant preferred learning modality but utilize other
sensory modes to extract and process information as well.
The diagnosis of the cognitive, affective, and physiological aspects
of learning style can be very complex or very simple, depending on the
chosen instrument. Price (1983) and Cornett (1983) have provided excellent
overviews of the various learning style instruments available that can
assist educators and learners in their diagnosis and assessment.
As indicated, every individual has a preferred way of processing
information. On the other hand, each individual involved in the process of
instruction has a dominant and preferred teaching style. A teaching style
3

is an identifiable set of classroom behaviors associated with and carried
out by the instructor. The chosen teaching style "is the operational
behavior of the teacher's educational philosophy" (Conti & Welborn, 1986,
p. 20).
However, this does not mean "they cannot add to or modify that style
as circumstances warrant" (Cornett, 1983, p. 28). Modification of the
teaching style may contribute to a more successful experience for the
learner and the instructor. The more teachers learn aLout their dominant
teaching and learning styles as well as the preferred learning styles of
their learners, the more they can provide an explanation of what is
happening in the learning situation and why.
The purpose of this study was to examine the perceptual learning
modalities of junior college occupational educators and how they thought
they learned best and to compare this learning style preference to the
teaching methodologies that were utilized in their instructional
situations. In this investigatioh of perceptual learning style and
teaching style comparison, the following research questions were
formulated:
1. Is there a significant relationship between perceptual modalities
and teaching methods of junior college occupational educators?
2. Is there a significant relationship between perceptual modalities
and teaching methods of junior college occupational educators by
related major area of study, sex, years of teaching experience,
and highest educational degree attained?
One hundred thirty-six educators (n=136) from ten junior colleges in
three large southwestern states participated in the study. Respondents
4
20
comprised of 32 females and 106 males. Diversity of the subjects existed
in terms of age, years of teaching, and the level of educational
attainment.
Inatt.lentatig0
A survey questionnaire was utilized to gather the data from the
subjects of the study. The questionnaire consisted of three components;
information of personal data, perceptual learning style preference, and
teaching methods/techniques used. The personal data section asked
questions concerning the major area of teaching, sex, years of teaching
experience, and the highest educational degree attained. The second
section was a perceptual learning style inventory developed by James and
Galbraith (1984). It asked the respondents to check the
strategies/techniques through which they thought they learned best. Based
on their responses, they were categorized into one of seven perceptual
learning modalities: visual, aural, interactive, print, kinesthetic,
haptic, and olfactory. The third part of the questionnaire asked the
respondents to check the methods/techniques that they used the majority of
the time in their own instructional situations. Their selected
methods/techniques were then categorized into seven teaching styles:
visual, aural, interactive, print, kinesthetic, haptic and olfactory. This
part of the questionnaire was developed by the authors using the items from
the James and Galbraith (1984) inventory which were modified and translated
into a list of teaching methods/techniques.
Data, Analysis
To answer the proposed research questions of the study, perceptual
learning styles were determined and ranked from the most preferred to the
5

least preferred for the entire group of subjects and for each individual
subgroup by major teaching area, sex, years of teaching experience, and
highest educational degree attained. Rext, the teaching styles of the
entire group and each respective subgroup were determined and ranked from
most used to least used. The Spearman's rho procedure was employed to
determine if a correlation existed between the perceptual learning and
teaching styles, ranks for the entire group and for each subgroup. This
statistical technique examined the degree to which the rank scores on the
two variables were linearly related. An alpha level of .05 was selected.
Findings
The findings in Table I indicate that the learning styles and teaching
styles of the 138 junior college educators were almost identical in their
rank order. Only the modalities of visual and interactive had different
rankings for the overall group. The modality of visual had a ranking of
two for the learning style and three for the teaching style. Interactive
had a ranking of three for the learning style and a two for the teaching
style. All other modalities were identically ranked for both the teaching
style and learning style of the subjects surveyed. Utilizing the rank
orders, Spearman's rho was calculated to determine the linear relationship
of the two variables (rs=.964, df=6, p<.05). According to the finding, a
very high positive correlation existed between the junior college educators
in the manner in which they preferred to learn and the methodologies which
were utilized in their teaching. No significant difference existed between
the two variables for the overall group of junior college educators.
Table 2 indicates the Spearman's rank order correlations of perceptual
learning styles and teaching styles by major teaching area, sex, years of
6
22

teaching experience, and educational degree attained. According to
teaching areas, the Spearman's rho was calculated for each of the five
areas of study that the junior college educators taught in.
A very high positive correlation also existed between perceived
learning style and teaching style for most of the areas studied.
Exceptions included: the teaching area of agriculture, educators with 21
or more years of teaching experience, and educators with high school listed
as the highest educational degree attained.
References
Barbe, W., and Swassing, R. (1979). Teaching through modality strengths:
Lument2 mag Practices. Columbus: Zaner-Bloser.
Conti, G., and Welborn, R. (1986). Teaching-learning styles and the adult
learner. =elm Learning: An _Omnibus 2f Loctice and Research,
R(8), 20-24.
Cornett, C. E. (1983). ghat you should know 112111 teaching gnit learning
styles. Bloomington: Phi Delta Kappa.
Dunn, R., and Dunn, K. (1978). Teaching students through their
individualized ,learning styles. Reston: Reston.
Galbraith, M. W., and James, W. B. (1984). Assessment of dominant
perceptual learning styles of older adults. Educational. erontologv:
An International Journ00 1Q(6), 449-457.
James, W. B. and Galbraith, M. W. (1985). Perceptual learning styles:
Implications and techniques for the practitioner. Lifelong Learningi
An Omnibus Df Practice Ang Research, am, 20-23.
7
23

vmmii11:1=MMINMI,11=1.
Kirby, P. (1979). Cognitive style. learning style. And transfer .01/1.1
acaulsition. Columbus: National Center for Research in Vocational
Education.
Kolb, D. A. (1976). Ihg learning style ihyentorv. Boston: McBer and Co.
Kolb, D. A. (1980. EXPgrignfill learning; Experie.nce AA A source Al
learning Ang development. Englewood Cliffs: Prentice-Hall.
McCarthy, B. (1981). Mg 41_-11.111 systega Teaching 12 learning .PtYles with
right/left mode techniques. Oak Brook: Excel.
Messick, S. and Associates (1976). Individuality Af jamming. San
Francisco: Jossey -Bass.
Price, G. (1983). Diagnosing learning styles. In R.M. Smith (Ed.),
Reining adults lgain b211 2 learn (pp. 49-55). San Francisco:
Jossey -Bass.
8
24

Table 1
Rank Order of Perceptual Learning Styles
and Teaching Styles of
:7! IA A de,
11:-A)
Modality Learning Style Teaching Style
VisualAural
InteractivePrint
KinestheticHapticOlfactory
2 34 4
3 2
1 1
6 6
5 5
7 7
9
25

Table 2
Spearman's Rank Order Correlations of Perceptual Learning Styles
and Teachirig Styles ty.Major Teaching Area,, Sex,
Years of Teaching Experience, and Educational Degree Attained
Variable of Subjects Correlation
Teaching Aria
Agriculture 9 .714Business 35 1.000*Engineering & industrial 54 .902*Human service 4 .839*Health 13 .893*Other 22 .964*
Female 32 .893*Male 106 .964*
Years 21 Teaching gxperiencg
0-5 30 .964*6-10 32 .929*11-15 35 .964*16-20 22 .929*21 & over 19 .665
Educational Degree
High school 9 .696Associate 23 .839*Bachelors 37 .964*Master 66 1.000tDoctorate 3 .938*
'p <.05
10
26
`I"
,
SECTION C
A Comparison of Beginning Drafting Achievement
Between Students Using Traditional Equipment and
Students Using Computer Aided Design and Drafting Equipment
Denni_ Murphy
p 7

4 P:1k:
A COMPARISON OF BEGINNING DRAFTING ACHIEVEMENT
BETWEEN STUDENTS USING TRADITIONAL EQUIPMENT
AND STUDENTS USING COMPUTER AIDED DESIGN AND DRAFTING EQUIPMENT
By
Dennis W. Murphy
Department of Industrial Technology and EducationCollege of EngineeringUtah State UniversityLogan, Utah 84322
1
A Comparison of Beginning Drafting Achievement
Between Students Using Traditional Equipment
s Aand Students Using Computer lid4'4.Desigh::and DraftingAuipment
Introduction
Drafting has been accomplished using very time consuming, almost
artistic talents, in order to construct geometric shapes and lines that are
universally understandable. Information contained in drawings has been
transferred from engineer to drafter communicated to the tool maker and
implemented into production. Changes or revisions to the drawings are time
consuming and often require complete re-drawing of a "plate" in order to
maintain clarity. Re-drawing is necessary to eliminate smudges, poor
erasing and basic placement of features and dimensions.
There are certain objectives that students strive to maintain in a
drafting environment. Giesecke (1984) suggests four such objectives that
the student should preserve.
1. Accuracy. No drawing is of maximum usefulness if it is not
accurate.
2. Speed. Time is money" in industry and there is no demand for
the slow drafter or engineer.
3. Legibility. The drafter or engineer should remember that the
drawing is a means of communication to others and that it must be clear and
legible in order to serve its purpose well.
4. Neatness. If a drawing is to be accurate and legible, it must
also be clean; therefore, the student should develop a habit of neatness.
2
29

New computer technology has eliminated some of the problems associated
with drafting. Smudging, line-density and most problems related to basic
object placement are elimiWed., The computer is consistent and inherently
make no errors. Changes are easily accomplished ;using a computer drafting
station. Drafting is a comprehensive, integrated decision-making process
that requires many steps to completion of the final drawing. The drawing
in both traditional and Computer Aided Design and Drafting are multi-step
processes that are contingent upon dedication and expertise of the drafter.
Then why not use only computer drafting stations?
First, computer drafting stations are expensive. They cost many times
more than the equipment required to do manual drafting. Secondly, the
computer drafting station requires skill and .training in operation.
Literacy with the CAD/D station requires the operator to learn about the
hardware and software packages used in the drafting process. Thirdly, the
computer drafter must still formulate many of the processes needed by the
traditional drafter. Included in the process are, sketching, layout,
perspective, dimension and size. A fourth element is a lack of complete
Computer Aided Drafting acceptance. The questions are then asked, "Is
there a significant difference achieved in drafting competencies, knowledge
and skill between students using traditional drafting tools and students
using Computer Aided Design and Drafting (CAD/D) tools?" Secondly, "Is
there a need for CAD/D?" "CAD is revolutionizing the drafting-design
field. CAD is rapidly finding its way into industry, changing the methods
used to produce drawings. The basic tools are being replaced by the
computer." (Bertoline, 1985). Consequently, this study was designed to
3
30

investigate whether computer drafting tools could be as effective in
teaching drafting as the manual process.
Null Hypothesis
tlThere is no significant difference in the: achievement of beginning
drafting competencies be4eetns41,dent8 using traditional drafting tools
compared to students using CAD/D tools.
Methods and Procedures
This study compared the effectiveness of two methods of drawing in a
beginning drafting class. The instructional modes consisted of a
traditional drafting control group and a CAD/D experimental group. Scores
on a pre-test, given during the first lab period for both groups and a
post-test were given to show any losses or gains in knowledge achievement.
The experiment was conducted during Fall quarter, 1986, at Utah State
University. The students in both the control and experimental groups were
advised as to the nature of the experiment. An identical test was
administered as a pre-test and post-test. A "hands-on" final practical
exam, given during the final week of class evaluated skill acquired during
the final week of class evaluated skill acquired during the quarter.
Data Analysis and Findings
A pre-test given during the first lab period for the control group
(traditional) and the experimental group (CAD/D) netted these results using
a standard t-test.
Pre-teat (figure 1)
Number of observations in group one? 16
Number of observations in group two? 16
Mean of group one? 48.69
4
31
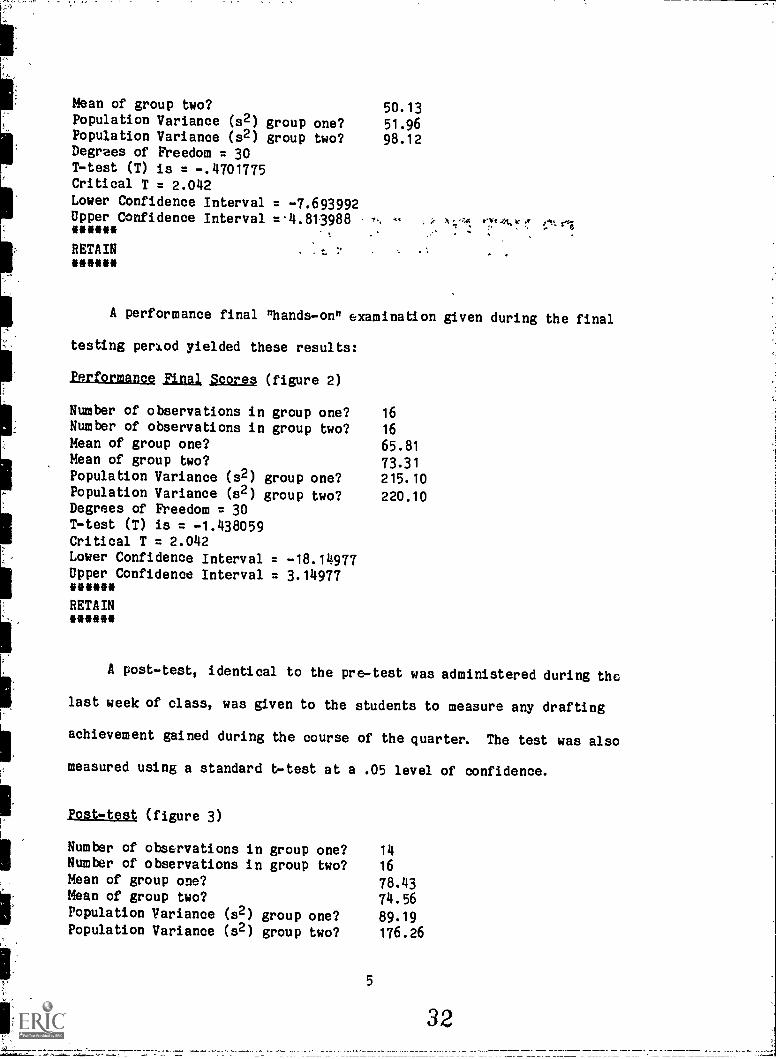
Mean of group two?
Population Variance (82) group one?Population Variance (82) group two?Degrees of Freedom = 30T-test (T) is = -.4701775Critical T = 2.042Lower Confidence Interval = -7.693992Upper Confidence Interval =4.813988*umRETAIN*mu . t.
50.13
51.9698.12
A performance final "hands-on" examination given during the final
testing period yielded these results:
Performance Final Scores (figure 2)
Number of observations inNumber of observations inMean of group one?Mean of group two?
Population Variance (82)Population Variance (82)Degrees of Freedom = 30T-test (T) is = -1.438059Critical T = 2.042Lower Confidence IntervalUpper Confidence Interval**umRETAIN******
group one?group two?
group one?
group two?
= -18.14977= 3.14977
16
16
65.81
73.31215.10
220.10
A post-test, identical to the pre-test was administered during the
last week of class, was given to the students to measure any drafting
achievement gained during
measured using a standard
Post-test (figure 3)
Number of observations inNumber of observations inMean of group one?Mean of group two?
Population Variance (82) group one?Population Variance (82) group two?
the course of the quarter. The test was also
t-test at a .05
group one?group two?
5
level of confidence.
14
16
78.4374.56
89.19
176.26
32

Degrees of Freedom = 28
T-test (T) is = .9073386Critical T = 2.048
Lower Confidence Interval = -4.865177Upper Confidence Interval = 12.60518*****1
RETAINum*
.
Conclusions and Findings
The results of the pre-test, performance final and post-tests indicate
that there is no significant difference in the drafting competencies
between students using traditional drafting tools and those students using
CAD/D tools. All of the t-tests retained the null hypothesis and therefore
we accept the findings. One interesting observation was that tyle students
using CAD/D tools were required to learn both drafting techniques and the
computer operation during the course of their study. While accomplishing
this task, the experimental group maintained the same degree of proficiency
as the control group. We would recommend that this study be repeated to
further validate its results.
References
Bertoline, G. R. (1985) Fundamentals pi ga. First Edition. Albany, NY:
Delmar Publishers, Inc.
Giesecke, F. E. (1984) Engineering gramtios. Third Edition. NeW York,
NY: Macmillan Publishing Co.
I6
33

;.1
PRETESTGROUPS 1 AND 2PLUS AVERAGES
<FIGURE 1 )
111111
j?
5 7 9 11 13CC
4 6 5 10 12 14 16STUDENTS
5 Not
Ica r
yi
eo ft
40 t
7,
LEGEND
GROUP 1OROUP 2
egit
PER MAN E FINALGROUPS 1 AND 2
(FIGURE 2)LEGEND
1033 GROUP 1no GROUP 2
1 3 5 T 1 Z. 15 AvE6 6 10 12 14 16
STUDENTS
34
POSTTESTGROUPS 1 AND 2
(FIGU 3)
iii11111111
1 3 5 7 9 1 13 5 ANE2 4 a a 10 12 14 16
STUDENTS
LEGE4D
OROUP 1GROUP 2