Document Project Readiness by Estimate Class
18
2011 AACE INTERNATIONAL TRANSACTIONS EST.604.1 EST.604 Document Project Readiness by Estimate Class Using PDRI Syed H. Zaheer, P.Eng. and Craig Fallows ABSTRACT— One of the key issues estimating department managers face: Is the estimate being developed too early where maturity and quality of engineering deliverables and the project definition rating criteria does not support the class of estimate required? This paper describes a cost and time effective work process which combines PDRI scores for various individual estimate classifications to develop a ‘Project Readiness Indicator’ curve, correlating the PDRI scores to estimate classifications by AACE International. This approach, using AACE International estimate classifications and CII PDRI, will facilitate the user to: 1. Assess and document project readiness by class of estimate at MTO (material take off) freeze date; 2. Facilitate developing an action plan re: deficiencies to achieve the class of estimate required. The approach is cost effective and can be achieved with in-house resources in a time effective manner. Once an action plan is established, or implemented, the process can be repeated to assess if the desired score is achieved.
Transcript of Document Project Readiness by Estimate Class
2011 AACE INTERNATIONAL TRANSACTIONS
EST.604.1
EST.604
Document Project Readiness by Estimate Class
Using PDRI
Syed H. Zaheer, P.Eng. and Craig Fallows
ABSTRACT— One of the key issues estimating department managers face: Is the estimate being
developed too early where maturity and quality of engineering deliverables and the project definition
rating criteria does not support the class of estimate required?
This paper describes a cost and time effective work process which combines PDRI scores for various
individual estimate classifications to develop a ‘Project Readiness Indicator’ curve, correlating the PDRI
scores to estimate classifications by AACE International.
This approach, using AACE International estimate classifications and CII PDRI, will facilitate the user to:
1. Assess and document project readiness by class of estimate at MTO (material take off) freeze
date;
2. Facilitate developing an action plan re: deficiencies to achieve the class of estimate required.
The approach is cost effective and can be achieved with in-house resources in a time effective manner.
Once an action plan is established, or implemented, the process can be repeated to assess if the
desired score is achieved.
2011 AACE INTERNATIONAL TRANSACTIONS
EST.604.2
Table of Contents
Abstract .............................................................................................................................................. 1
Table of Contents ................................................................................................................................ 2
List of Tables ...................................................................................................................................... 2
List of Figures ..................................................................................................................................... 2
Introduction ........................................................................................................................................ 3
Why this topic? .................................................................................................................................. 3
Estimate Classifications .......................................................................................................... 4
Accuracy ranges ..................................................................................................................... 4
Maturity of Engineering Deliverables ...................................................................................... 7
PDRI (Project Definition Rating Index) ..................................................................................... 8
Relating Estimating Classes to PDRI ........................................................................................ 12
Assess & document project readiness by Estimate Classification using PDR ............................ 16
Conclusion .......................................................................................................................................... 17
References .......................................................................................................................................... 18
List of Tables
Table 1 – Estimate Classification ........................................................................................................ 4
Table 2 – Accuracy Ranges ................................................................................................................. 5
Table 3 – Engineering Deliverables Maturity Matrix ........................................................................... 8
Table 4 – PDRI Hypothetical Scoring Matrix ........................................................................................ 13
List of Figures
Figure 1 – Estimating Funnel .............................................................................................................. 6
Figure 2 – Estimate Accuracy Illustration ............................................................................................ 7
Figure 3 – Project Readiness Indicator Curve ...................................................................................... 17

2011 AACE INTERNATIONAL TRANSACTIONS
EST.604.3
Introduction
One of the key issues estimating department managers face: Is the estimate being developed too early
where maturity and quality of engineering deliverables and the project definition rating criteria does
not support the class of estimate required?
This paper describes a cost and time effective work process to address this issue using available
practices in the public domain:
1. AACE International Recommended Practice No 18R-97 for Cost Estimate Classification System
2. The Construction Industry Institute (CII) Project Definition Rating Index (PDRI)
The authors have completed a study which combines PDRI scores for the various individual estimate
classifications to develop a ‘Project Readiness Indicator’ curve, correlating the PDRI scores to estimate
classifications by AACE International.
This approach, using AACE International estimate classifications and CII PDRI, will facilitate the user to:
3. Assess and document project readiness by class of estimate at MTO (material take off) freeze
date ;
4. Facilitate developing an action plan re: deficiencies to achieve the class of estimate required.
The approach is cost effective and can be achieved with in-house resources in a time effective manner.
Once an action plan is established, or implemented, the process can be repeated to assess if the
desired score is achieved.
Why This Topic?
The estimating department managers have a functional commitment to the quality of estimates
produced within their organization.
The single largest impact on quality of estimates (estimate accuracy) is project scope definition. For
this reason it is important to numerically quantify engineering progress (assessment of completeness
of engineering deliverables) vs. the estimating accuracy requested as well as class of estimate
requested.
An understanding of the following topics is required to assess project readiness by estimate
classifications using PDRI:
I Estimate classifications
II Accuracy ranges
III Maturity of engineering deliverables
IV PDRI (Project Definition Rating Index)
V Relating estimate classes to PDRI scores.
VI Assess and document project readiness by estimating classifications using PDRI
2011 AACE INTERNATIONAL TRANSACTIONS
EST.604.4
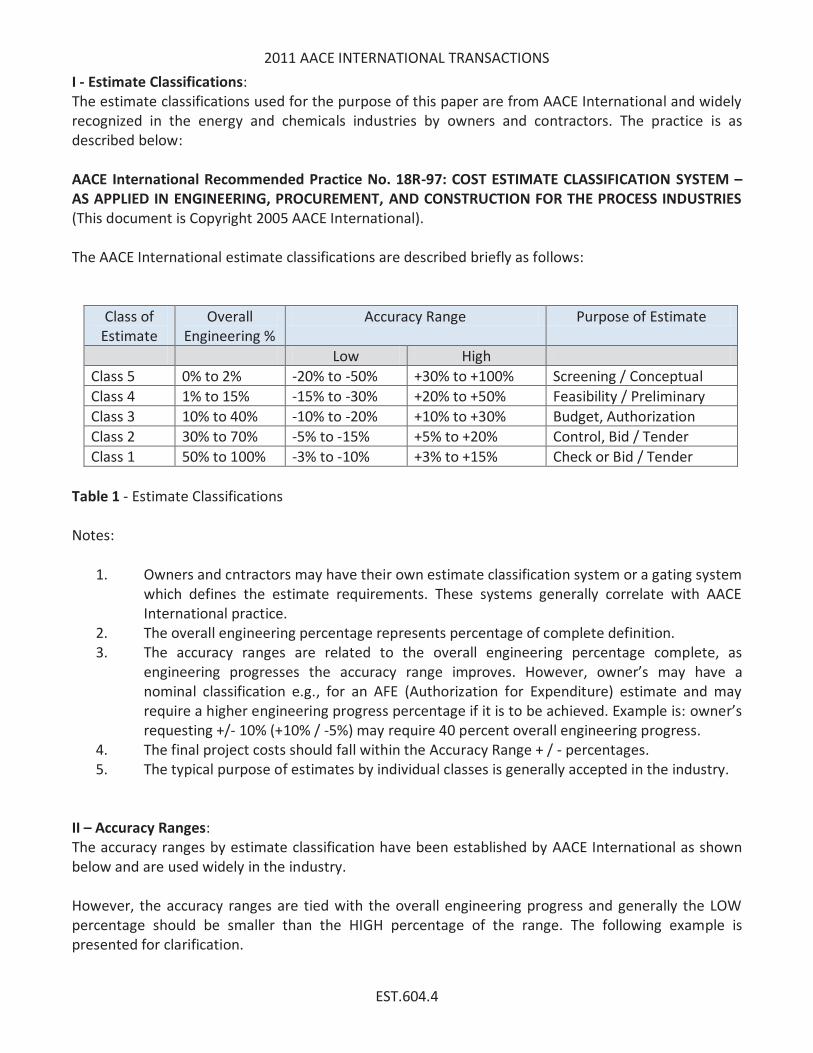
I - Estimate Classifications:
The estimate classifications used for the purpose of this paper are from AACE International and widely
recognized in the energy and chemicals industries by owners and contractors. The practice is as
described below:
AACE International Recommended Practice No. 18R-97: COST ESTIMATE CLASSIFICATION SYSTEM –
AS APPLIED IN ENGINEERING, PROCUREMENT, AND CONSTRUCTION FOR THE PROCESS INDUSTRIES
(This document is Copyright 2005 AACE International).
The AACE International estimate classifications are described briefly as follows:
Class of
Estimate
Overall
Engineering %
Accuracy Range Purpose of Estimate
Low High
Class 5 0% to 2% -20% to -50% +30% to +100% Screening / Conceptual
Class 4 1% to 15% -15% to -30% +20% to +50% Feasibility / Preliminary
Class 3 10% to 40% -10% to -20% +10% to +30% Budget, Authorization
Class 2 30% to 70% -5% to -15% +5% to +20% Control, Bid / Tender
Class 1 50% to 100% -3% to -10% +3% to +15% Check or Bid / Tender
Table 1 - Estimate Classifications
Notes:
1. Owners and cntractors may have their own estimate classification system or a gating system
which defines the estimate requirements. These systems generally correlate with AACE
International practice.
2. The overall engineering percentage represents percentage of complete definition.
3. The accuracy ranges are related to the overall engineering percentage complete, as
engineering progresses the accuracy range improves. However, owner’s may have a
nominal classification e.g., for an AFE (Authorization for Expenditure) estimate and may
require a higher engineering progress percentage if it is to be achieved. Example is: owner’s
requesting +/- 10% (+10% / -5%) may require 40 percent overall engineering progress.
4. The final project costs should fall within the Accuracy Range + / - percentages.
5. The typical purpose of estimates by individual classes is generally accepted in the industry.
II – Accuracy Ranges:
The accuracy ranges by estimate classification have been established by AACE International as shown
below and are used widely in the industry.
However, the accuracy ranges are tied with the overall engineering progress and generally the LOW
percentage should be smaller than the HIGH percentage of the range. The following example is
presented for clarification.
2011 AACE INTERNATIONAL TRANSACTIONS
EST.604.5
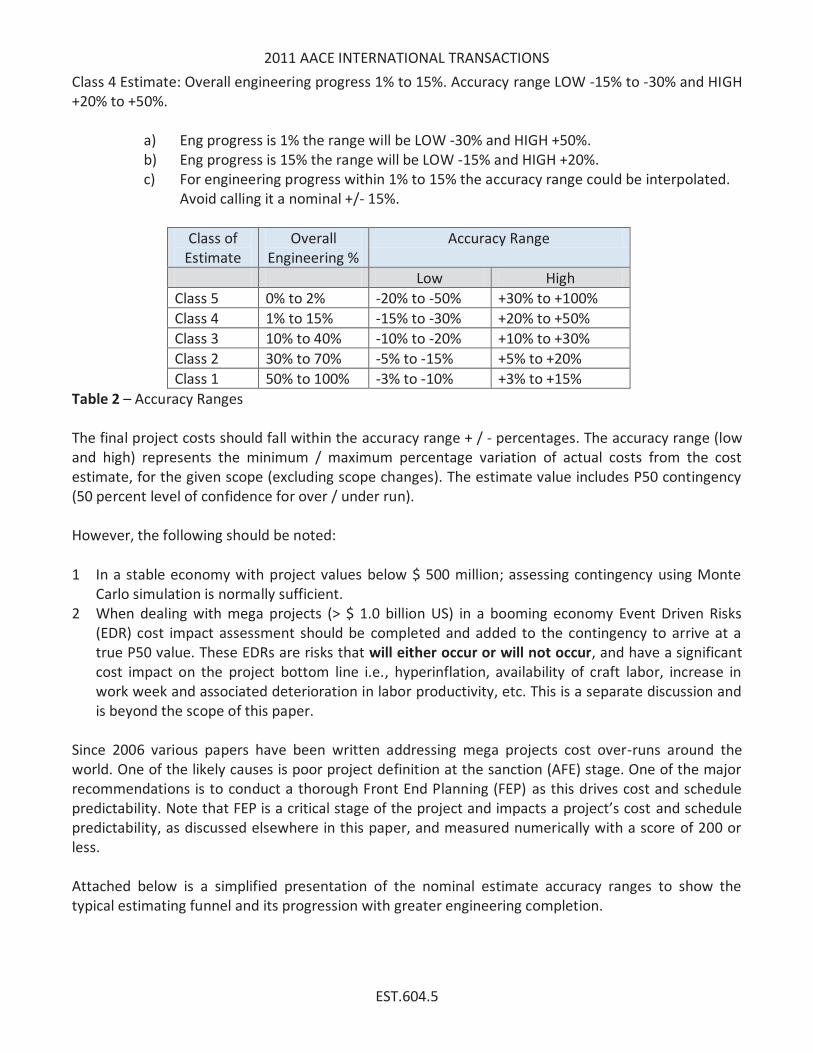
Class 4 Estimate: Overall engineering progress 1% to 15%. Accuracy range LOW -15% to -30% and HIGH
+20% to +50%.
a) Eng progress is 1% the range will be LOW -30% and HIGH +50%.
b) Eng progress is 15% the range will be LOW -15% and HIGH +20%.
c) For engineering progress within 1% to 15% the accuracy range could be interpolated.
Avoid calling it a nominal +/- 15%.
Class of
Estimate
Overall
Engineering %
Accuracy Range
Low High
Class 5 0% to 2% -20% to -50% +30% to +100%
Class 4 1% to 15% -15% to -30% +20% to +50%
Class 3 10% to 40% -10% to -20% +10% to +30%
Class 2 30% to 70% -5% to -15% +5% to +20%
Class 1 50% to 100% -3% to -10% +3% to +15%
Table 2 – Accuracy Ranges
The final project costs should fall within the accuracy range + / - percentages. The accuracy range (low
and high) represents the minimum / maximum percentage variation of actual costs from the cost
estimate, for the given scope (excluding scope changes). The estimate value includes P50 contingency
(50 percent level of confidence for over / under run).
However, the following should be noted:
1 In a stable economy with project values below $ 500 million; assessing contingency using Monte
Carlo simulation is normally sufficient.
2 When dealing with mega projects (> $ 1.0 billion US) in a booming economy Event Driven Risks
(EDR) cost impact assessment should be completed and added to the contingency to arrive at a
true P50 value. These EDRs are risks that will either occur or will not occur, and have a significant
cost impact on the project bottom line i.e., hyperinflation, availability of craft labor, increase in
work week and associated deterioration in labor productivity, etc. This is a separate discussion and
is beyond the scope of this paper.
Since 2006 various papers have been written addressing mega projects cost over-runs around the
world. One of the likely causes is poor project definition at the sanction (AFE) stage. One of the major
recommendations is to conduct a thorough Front End Planning (FEP) as this drives cost and schedule
predictability. Note that FEP is a critical stage of the project and impacts a project’s cost and schedule
predictability, as discussed elsewhere in this paper, and measured numerically with a score of 200 or
less.
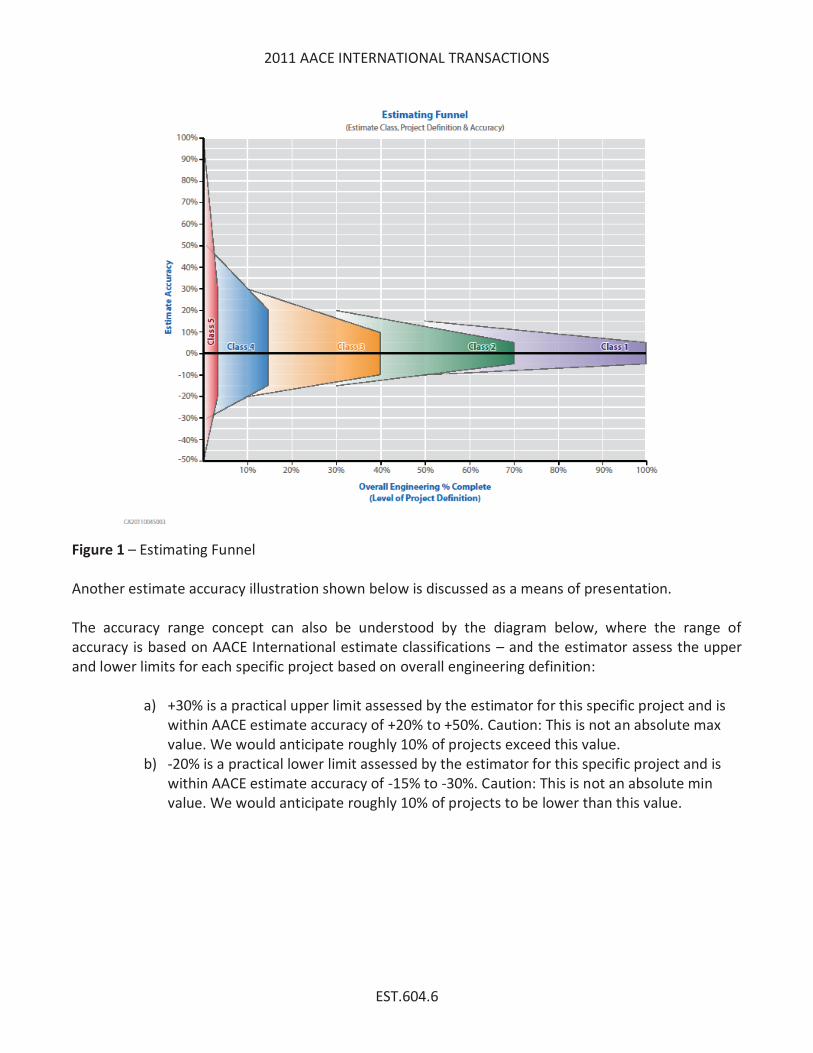
Attached below is a simplified presentation of the nominal estimate accuracy ranges to show the
typical estimating funnel and its progression with greater engineering completion.
2011 AACE INTERNATIONAL TRANSACTIONS
EST.604.6
Figure 1 – Estimating Funnel
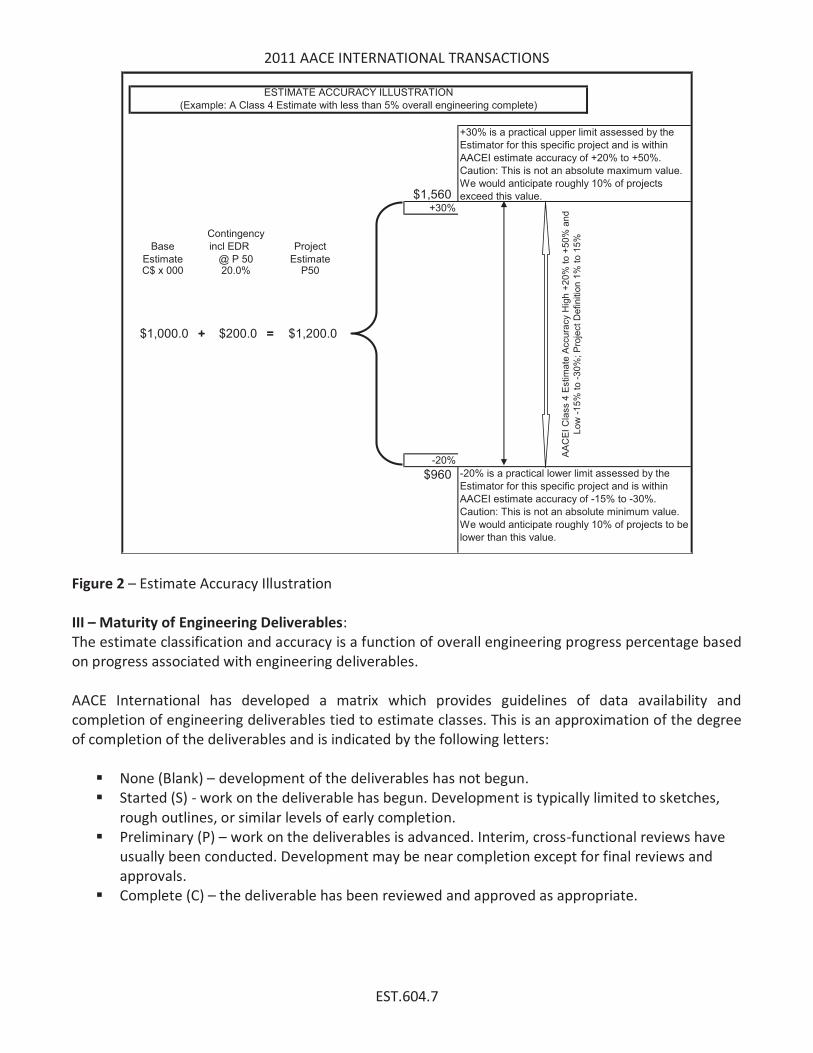
Another estimate accuracy illustration shown below is discussed as a means of presentation.
The accuracy range concept can also be understood by the diagram below, where the range of
accuracy is based on AACE International estimate classifications – and the estimator assess the upper
and lower limits for each specific project based on overall engineering definition:
a) +30% is a practical upper limit assessed by the estimator for this specific project and is
within AACE estimate accuracy of +20% to +50%. Caution: This is not an absolute max
value. We would anticipate roughly 10% of projects exceed this value.
b) -20% is a practical lower limit assessed by the estimator for this specific project and is
within AACE estimate accuracy of -15% to -30%. Caution: This is not an absolute min
value. We would anticipate roughly 10% of projects to be lower than this value.
2011 AACE INTERNATIONAL TRANSACTIONS
EST.604.7
$1,560+30%
Contingency
Base incl EDR Project
Estimate @ P 50 EstimateC$ x 000 20.0% P50
$1,000.0 + $200.0 = $1,200.0
-20%
$960 -20% is a practical lower limit assessed by the
Estimator for this specific project and is within
AACEI estimate accuracy of -15% to -30%.
Caution: This is not an absolute minimum value.
We would anticipate roughly 10% of projects to be
lower than this value.
ESTIMATE ACCURACY ILLUSTRATION
(Example: A Class 4 Estimate with less than 5% overall engineering complete)
AA
CE
I C
lass 4
Estim
ate
Accu
racy H
igh
+2
0%
to
+5
0%
an
d
Lo
w -
15
% t
o -
30
%;
Pro
ject
Defin
itio
n 1
% t
o 1
5%
+30% is a practical upper limit assessed by the
Estimator for this specific project and is within
AACEI estimate accuracy of +20% to +50%.
Caution: This is not an absolute maximum value.
We would anticipate roughly 10% of projects
exceed this value.
Figure 2 – Estimate Accuracy Illustration
III – Maturity of Engineering Deliverables:
The estimate classification and accuracy is a function of overall engineering progress percentage based
on progress associated with engineering deliverables.
AACE International has developed a matrix which provides guidelines of data availability and
completion of engineering deliverables tied to estimate classes. This is an approximation of the degree
of completion of the deliverables and is indicated by the following letters:
§ None (Blank) – development of the deliverables has not begun.
§ Started (S) - work on the deliverable has begun. Development is typically limited to sketches,
rough outlines, or similar levels of early completion.
§ Preliminary (P) – work on the deliverables is advanced. Interim, cross-functional reviews have
usually been conducted. Development may be near completion except for final reviews and
approvals.
§ Complete (C) – the deliverable has been reviewed and approved as appropriate.

2011 AACE INTERNATIONAL TRANSACTIONS
EST.604.8
The AACE International matrix is used as a guideline to explain the basic data/engineering deliverables
in relation to the estimate classifications, which also provides an understanding to the overall
engineering progress and its relationship to the estimate accuracy.
Table 3 – Engineering Deliverables Maturity Matrix
IV –PDRI (Project Definition Rating Index):
a) Overview:
The PDRI tool has been developed by CII (Construction Industry Institute). This is used in evaluating
the detailed scope phase completeness during front end planning. This methodology allows the project
team to identify elements that require further definition.
The basic concept of PDRI is to assess whether we have engineering definition to develop MTO
(material take off) to proceed with an AFE (authorization for expenditure) estimate. The CII project life
cycle is as follows:
ESTIMATE CLASS Class 5 Class 4 Class 3 Class 2 Class 1
General Project Data
Project Scope Description General Preliminary Defined Defined Defined
Plant production / facility capacity Assumed Preliminary Defined Defined Defined
Plant Location General Approximate Specific Specific Specific
Soils & Hydrology None Preliminary Defined Defined Defined
Integrated Project Plan None Preliminary Defined Defined Defined
Project Master Schedule None Preliminary Defined Defined Defined
Escalation Strategy None Preliminary Defined Defined Defined
Work Breakdown Structure None Preliminary Defined Defined Defined
Project Code of Accounts None Preliminary Defined Defined Defined
Contracting Strategy Assumed Assumed Preliminary Defined Defined
Engineering Deliverables
Block Flow Diagrams S / P P / C C C C
Plot Plans S P / C C C
Process Flow Diagrams (PFDs) S / P P / C C C
Utility Flow Diagrams (UFDs) S / P P / C C C
Piping & Instrument Diagrams (P&Ids) S P / C C C
Heat & Material Balance S P / C C C
Process Equipment List S / P P / C C C
Utility Equipment List S / P P / C C C
Electrical One Line Diagrams S / P P / C C C
Specifications & data sheets S P / C C C
General equipment arrangement drawings S P / C C C
Spare parts listings S / P P C
Mechanical Discipline drawings S P P / C
Electrical Discipline drawings S P P / C
Instrument Discipline drawings S P P / C
Civil/Structural Discipline drawings S P P / C
2011 AACE INTERNATIONAL TRANSACTIONS
EST.604.9
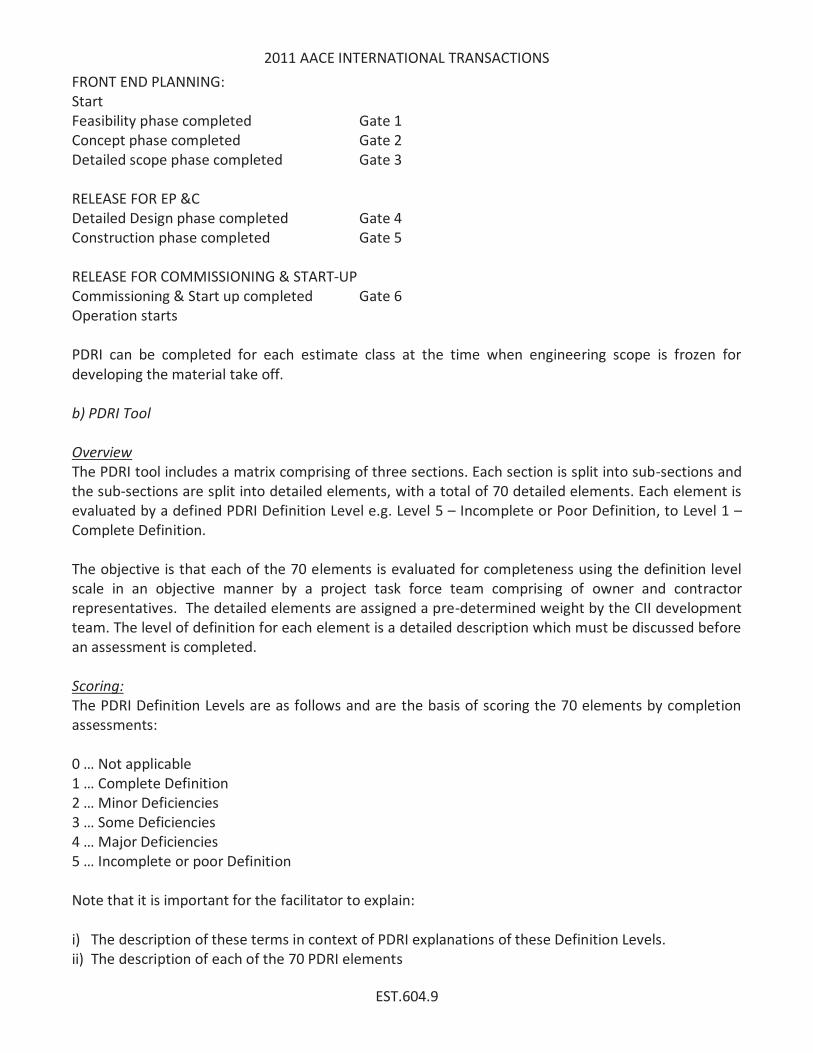
FRONT END PLANNING:
Start
Feasibility phase completed Gate 1
Concept phase completed Gate 2
Detailed scope phase completed Gate 3
RELEASE FOR EP &C
Detailed Design phase completed Gate 4
Construction phase completed Gate 5
RELEASE FOR COMMISSIONING & START-UP
Commissioning & Start up completed Gate 6
Operation starts
PDRI can be completed for each estimate class at the time when engineering scope is frozen for
developing the material take off.
b) PDRI Tool
Overview
The PDRI tool includes a matrix comprising of three sections. Each section is split into sub-sections and
the sub-sections are split into detailed elements, with a total of 70 detailed elements. Each element is
evaluated by a defined PDRI Definition Level e.g. Level 5 – Incomplete or Poor Definition, to Level 1 –
Complete Definition.
The objective is that each of the 70 elements is evaluated for completeness using the definition level
scale in an objective manner by a project task force team comprising of owner and contractor
representatives. The detailed elements are assigned a pre-determined weight by the CII development
team. The level of definition for each element is a detailed description which must be discussed before
an assessment is completed.
Scoring:
The PDRI Definition Levels are as follows and are the basis of scoring the 70 elements by completion
assessments:
0 … Not applicable
1 … Complete Definition
2 … Minor Deficiencies
3 … Some Deficiencies
4 … Major Deficiencies
5 … Incomplete or poor Definition
Note that it is important for the facilitator to explain:
i) The description of these terms in context of PDRI explanations of these Definition Levels.
ii) The description of each of the 70 PDRI elements
2011 AACE INTERNATIONAL TRANSACTIONS
EST.604.10
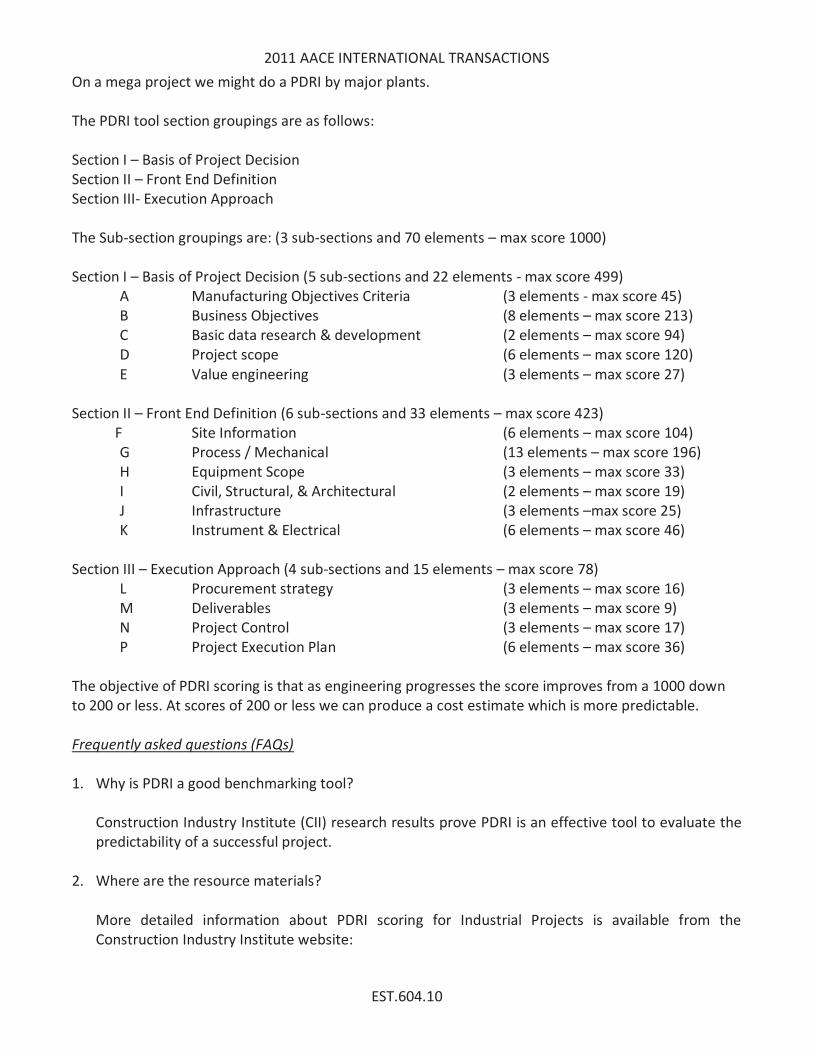
On a mega project we might do a PDRI by major plants.
The PDRI tool section groupings are as follows:
Section I – Basis of Project Decision
Section II – Front End Definition
Section III- Execution Approach
The Sub-section groupings are: (3 sub-sections and 70 elements – max score 1000)
Section I – Basis of Project Decision (5 sub-sections and 22 elements - max score 499)
A Manufacturing Objectives Criteria (3 elements - max score 45)
B Business Objectives (8 elements – max score 213)
C Basic data research & development (2 elements – max score 94)
D Project scope (6 elements – max score 120)
E Value engineering (3 elements – max score 27)
Section II – Front End Definition (6 sub-sections and 33 elements – max score 423)
F Site Information (6 elements – max score 104)
G Process / Mechanical (13 elements – max score 196)
H Equipment Scope (3 elements – max score 33)
I Civil, Structural, & Architectural (2 elements – max score 19)
J Infrastructure (3 elements –max score 25)
K Instrument & Electrical (6 elements – max score 46)
Section III – Execution Approach (4 sub-sections and 15 elements – max score 78)
L Procurement strategy (3 elements – max score 16)
M Deliverables (3 elements – max score 9)
N Project Control (3 elements – max score 17)
P Project Execution Plan (6 elements – max score 36)
The objective of PDRI scoring is that as engineering progresses the score improves from a 1000 down
to 200 or less. At scores of 200 or less we can produce a cost estimate which is more predictable.
Frequently asked questions (FAQs)
1. Why is PDRI a good benchmarking tool?
Construction Industry Institute (CII) research results prove PDRI is an effective tool to evaluate the
predictability of a successful project.
2. Where are the resource materials?
More detailed information about PDRI scoring for Industrial Projects is available from the
Construction Industry Institute website:
2011 AACE INTERNATIONAL TRANSACTIONS
EST.604.11
§ For an overview of PDRI, review: RR113-11 — Project Definition Rating Index (PDRI)
§ For an in-depth look, review publication: IR113-2 — PDRI: Project Definition Rating Index –
Industrial Projects, Version 3.2
3. When should we schedule a PDRI session?
From an estimating perspective a PDRI should be performed for each classification of estimate
completed. The timing of the PDRI should be when the engineering is frozen for developing the
material take off to be used in the estimate. The most significant effort is when the estimate is
being prepared for AFE or funding approvals, generally a Class 3 estimate.
The primary objective of the effort is whether the project is well enough defined for cost and
schedule predictability.
4. Why do clients want the score to be at or below 200?
CII has collected considerable historical data on successful and unsuccessful jobs. Projects with a
score at or below 200 have a higher probability of meeting budget and schedule. That is why an
owner management team would like to have their projects reach this level of definition before
they approve or sanction major funding, i.e., proceed with ordering materials and construction.
Some owners may sanction projects with PDRI scores greater than 200.
5. Does a score below 200 guarantee success?
No! There are many other factors that can influence the outcome. For example good engineering
and construction planning can be undermined by unforeseen field labour and material escalation.
6. Can the PDRI score reverse (be less favourable) in a subsequent session on the same project?
Yes! Large changes in scope of work can cause the level of project definition to decline.
7. Can you reach a score of 200 with FEED Phase deliverables supporting a Class 4 estimate?
This is highly unlikely as PDRI and estimate class are linked with overall engineering progress based
on deliverables. A favourable score could not be achieved without doing sufficient engineering and
producing deliverables. Often this cannot be reached during FEED but is more feasible during
detailed engineering and planning.
8. What are some of the procedural actions for a PDRI session?
§ The facilitator could be a project manager / engineer, but someone well conversant with the
project.
§ The scribe should be a person familiar with the process, PDRI elements definitions, and the
PDRI spread sheet.
§ The attendees should be client and contractor representatives, preferably project managers
and discipline leads.
2011 AACE INTERNATIONAL TRANSACTIONS
EST.604.12
§ The session should include an overview of the process and describing the elements and how
assessments should be performed. Generally the initial session lasts 4 to 6 hours, but
subsequent update sessions should be of shorter durations.
9. What follow-up activities are there?
At the end of each session the basic challenge is: What can we do to improve the score?
PDRI results for each element identify where to concentrate future efforts. Simply look at the best
score you could achieve then rank the elements by priority and answer the question: Which
elements can improve the score the most with the least effort?
The facilitator can issue a separate report to the team following the session. The team then focuses
it energy on the target deliverables. It’s the principle of identifying and picking the “low hanging
fruit”!
10. Are other Front End Loading (FEL) index and tools available?
Yes. Independent Project Analysis (IPA), a third party service provider, is sometimes requested by
clients.
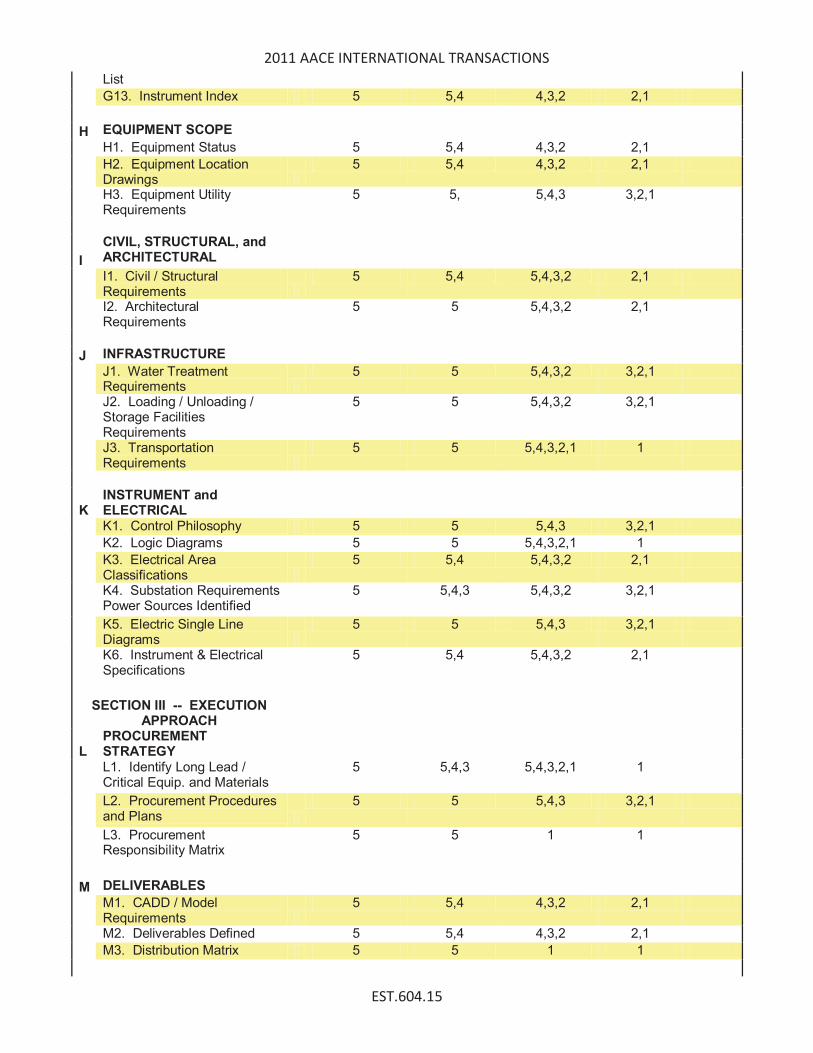
V – Relating Estimate Classes to PDRI
This section focuses on the “hypothetical” scoring for each estimate classification using PDRI in
combination with AACE International engineering deliverables matrix discussed above.
The definition levels (5, 4, 3, 2, and 1) of the PDRI, discussed earlier, are shown for each PDRI element
by estimate class.
The intent is to establish a minimum and maximum score envelope for each estimate classification.
2011 AACE INTERNATIONAL TRANSACTIONS
EST.604.13
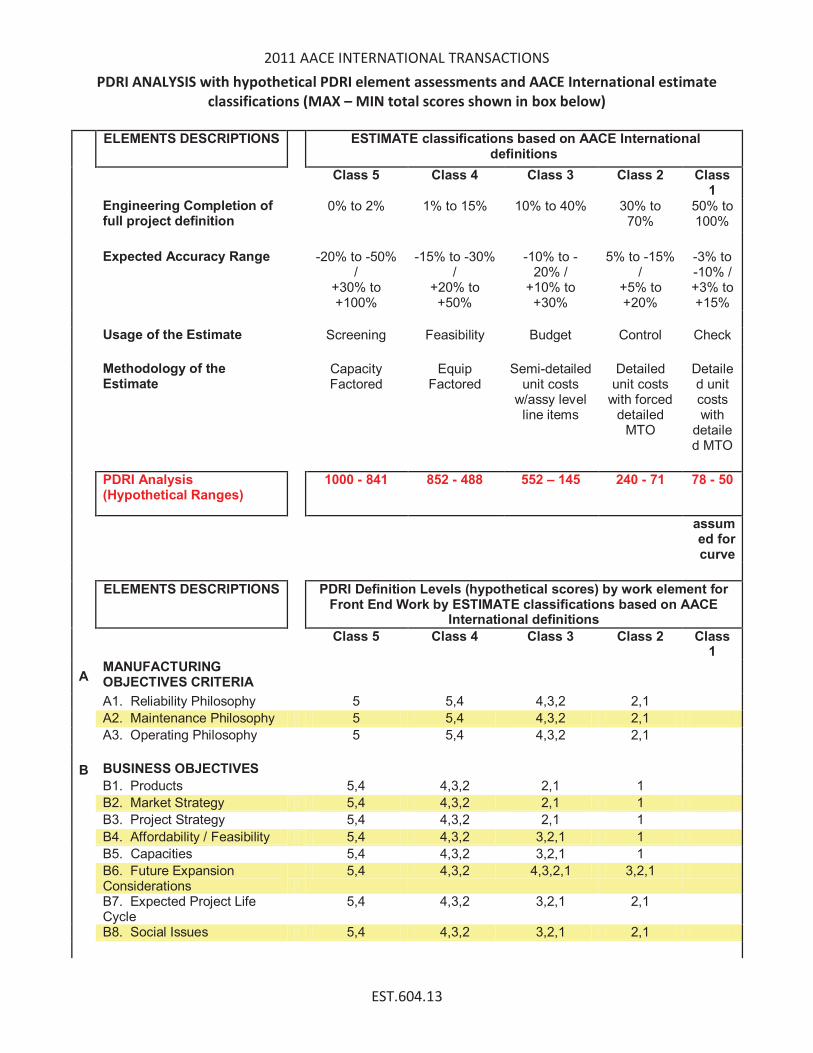
PDRI ANALYSIS with hypothetical PDRI element assessments and AACE International estimate
classifications (MAX – MIN total scores shown in box below)
ELEMENTS DESCRIPTIONS ESTIMATE classifications based on AACE International
definitions
Class 5 Class 4 Class 3 Class 2 Class
1 Engineering Completion of
full project definition 0% to 2% 1% to 15% 10% to 40% 30% to
70% 50% to 100%
Expected Accuracy Range
-20% to -50% /
+30% to +100%
-15% to -30% /
+20% to +50%
-10% to - 20% /
+10% to +30%
5% to -15% /
+5% to +20%
-3% to -10% / +3% to +15%
Usage of the Estimate Screening Feasibility Budget Control Check
Methodology of the Estimate
Capacity Factored
Equip Factored
Semi-detailed unit costs
w/assy level line items
Detailed unit costs
with forced detailed
MTO
Detailed unit costs with
detailed MTO
PDRI Analysis (Hypothetical Ranges)
1000 - 841 852 - 488 552 – 145 240 - 71 78 - 50
assumed for curve
ELEMENTS DESCRIPTIONS PDRI Definition Levels (hypothetical scores) by work element for Front End Work by ESTIMATE classifications based on AACE
International definitions
Class 5 Class 4 Class 3 Class 2 Class
1
A MANUFACTURING OBJECTIVES CRITERIA
A1. Reliability Philosophy 5 5,4 4,3,2 2,1
A2. Maintenance Philosophy 5 5,4 4,3,2 2,1
A3. Operating Philosophy 5 5,4 4,3,2 2,1
B BUSINESS OBJECTIVES
B1. Products 5,4 4,3,2 2,1 1
B2. Market Strategy 5,4 4,3,2 2,1 1
B3. Project Strategy 5,4 4,3,2 2,1 1
B4. Affordability / Feasibility 5,4 4,3,2 3,2,1 1
B5. Capacities 5,4 4,3,2 3,2,1 1
B6. Future Expansion Considerations
5,4 4,3,2 4,3,2,1 3,2,1
B7. Expected Project Life Cycle
5,4 4,3,2 3,2,1 2,1
B8. Social Issues 5,4 4,3,2 3,2,1 2,1
2011 AACE INTERNATIONAL TRANSACTIONS
EST.604.14
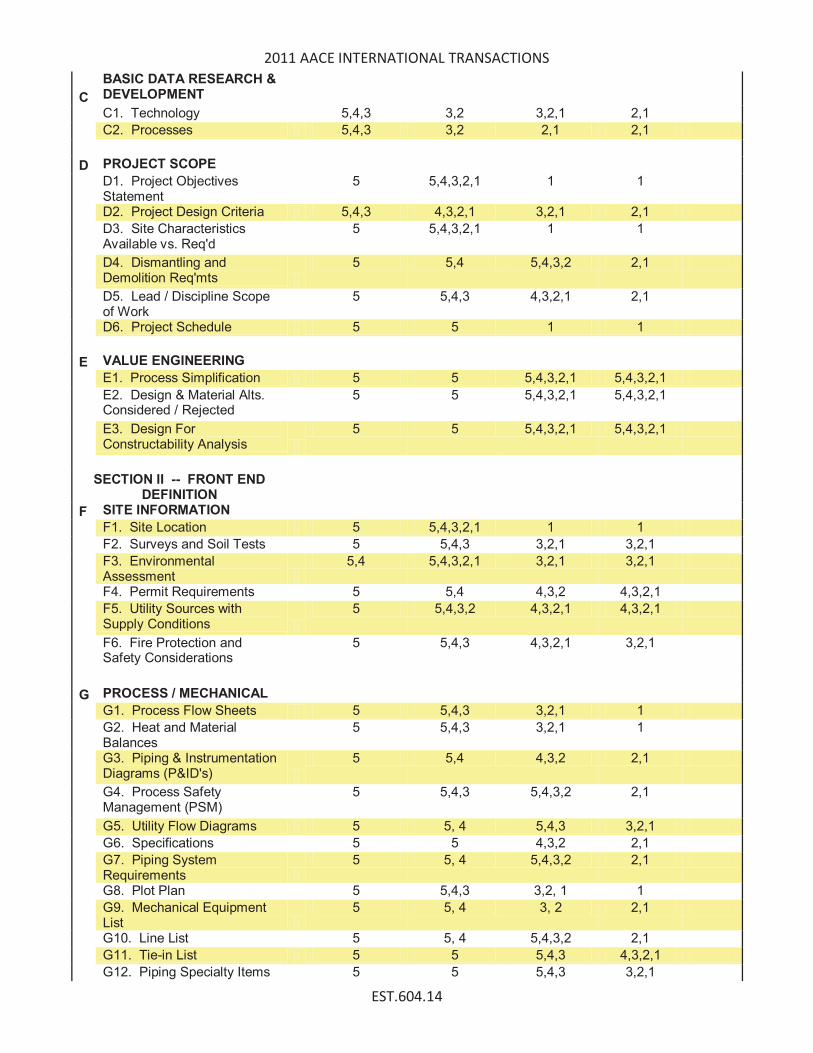
C
BASIC DATA RESEARCH & DEVELOPMENT
C1. Technology 5,4,3 3,2 3,2,1 2,1
C2. Processes 5,4,3 3,2 2,1 2,1
D PROJECT SCOPE
D1. Project Objectives Statement
5 5,4,3,2,1 1 1
D2. Project Design Criteria 5,4,3 4,3,2,1 3,2,1 2,1
D3. Site Characteristics Available vs. Req'd
5 5,4,3,2,1 1 1
D4. Dismantling and Demolition Req'mts
5 5,4 5,4,3,2 2,1
D5. Lead / Discipline Scope of Work
5 5,4,3 4,3,2,1 2,1
D6. Project Schedule 5 5 1 1
E VALUE ENGINEERING
E1. Process Simplification 5 5 5,4,3,2,1 5,4,3,2,1
E2. Design & Material Alts. Considered / Rejected
5 5 5,4,3,2,1 5,4,3,2,1
E3. Design For Constructability Analysis
5 5 5,4,3,2,1 5,4,3,2,1
SECTION II -- FRONT END
DEFINITION
F SITE INFORMATION
F1. Site Location 5 5,4,3,2,1 1 1
F2. Surveys and Soil Tests 5 5,4,3 3,2,1 3,2,1
F3. Environmental Assessment
5,4 5,4,3,2,1 3,2,1 3,2,1
F4. Permit Requirements 5 5,4 4,3,2 4,3,2,1
F5. Utility Sources with Supply Conditions
5 5,4,3,2 4,3,2,1 4,3,2,1
F6. Fire Protection and Safety Considerations
5 5,4,3 4,3,2,1 3,2,1
G PROCESS / MECHANICAL
G1. Process Flow Sheets 5 5,4,3 3,2,1 1
G2. Heat and Material Balances
5 5,4,3 3,2,1 1
G3. Piping & Instrumentation Diagrams (P&ID's)
5 5,4 4,3,2 2,1
G4. Process Safety Management (PSM)
5 5,4,3 5,4,3,2 2,1
G5. Utility Flow Diagrams 5 5, 4 5,4,3 3,2,1
G6. Specifications 5 5 4,3,2 2,1
G7. Piping System Requirements
5 5, 4 5,4,3,2 2,1
G8. Plot Plan 5 5,4,3 3,2, 1 1
G9. Mechanical Equipment List
5 5, 4 3, 2 2,1
G10. Line List 5 5, 4 5,4,3,2 2,1
G11. Tie-in List 5 5 5,4,3 4,3,2,1
G12. Piping Specialty Items 5 5 5,4,3 3,2,1
2011 AACE INTERNATIONAL TRANSACTIONS
EST.604.15
List
G13. Instrument Index 5 5,4 4,3,2 2,1
H EQUIPMENT SCOPE
H1. Equipment Status 5 5,4 4,3,2 2,1
H2. Equipment Location Drawings
5 5,4 4,3,2 2,1
H3. Equipment Utility Requirements
5 5, 5,4,3 3,2,1
I
CIVIL, STRUCTURAL, and ARCHITECTURAL
I1. Civil / Structural Requirements
5 5,4 5,4,3,2 2,1
I2. Architectural Requirements
5 5 5,4,3,2 2,1
J INFRASTRUCTURE
J1. Water Treatment Requirements
5 5 5,4,3,2 3,2,1
J2. Loading / Unloading / Storage Facilities Requirements
5 5 5,4,3,2 3,2,1
J3. Transportation Requirements
5 5 5,4,3,2,1 1
K INSTRUMENT and ELECTRICAL
K1. Control Philosophy 5 5 5,4,3 3,2,1
K2. Logic Diagrams 5 5 5,4,3,2,1 1
K3. Electrical Area Classifications
5 5,4 5,4,3,2 2,1
K4. Substation Requirements Power Sources Identified
5 5,4,3 5,4,3,2 3,2,1
K5. Electric Single Line Diagrams
5 5 5,4,3 3,2,1
K6. Instrument & Electrical Specifications
5 5,4 5,4,3,2 2,1
SECTION III -- EXECUTION
APPROACH
L PROCUREMENT STRATEGY
L1. Identify Long Lead / Critical Equip. and Materials
5 5,4,3 5,4,3,2,1 1
L2. Procurement Procedures and Plans
5 5 5,4,3 3,2,1
L3. Procurement Responsibility Matrix
5 5 1 1
M DELIVERABLES
M1. CADD / Model Requirements
5 5,4 4,3,2 2,1
M2. Deliverables Defined 5 5,4 4,3,2 2,1
M3. Distribution Matrix 5 5 1 1
2011 AACE INTERNATIONAL TRANSACTIONS
EST.604.16
N PROJECT CONTROL
N1. Project Control Requirements
5 5,4 4,3,2 2,1
N2. Project Accounting Requirements
5 5,4 4,3,2 2,1
N3. Risk Analysis 5 5 5,4,3,2,1 1
P PROJECT EXECUTION PLAN
P1. Owner Approval Requirements
5 5,4,3 3,2 2,1
P2. Engineering / Construction Plan and Approach
5 5 5,4,3,2,1 1
P3. Shut Down / Turn-Around Requirements
5 5 5,4,3,2,1 1
P4. Pre-Commissioning Turnover Sequence Requirements
5 5 5,4,3,2 1
P5. Start-up Requirements 5 5 5,4,3,2 3,2,1
P6. Training Requirements 5 5 5,4,3,2 3,2,1
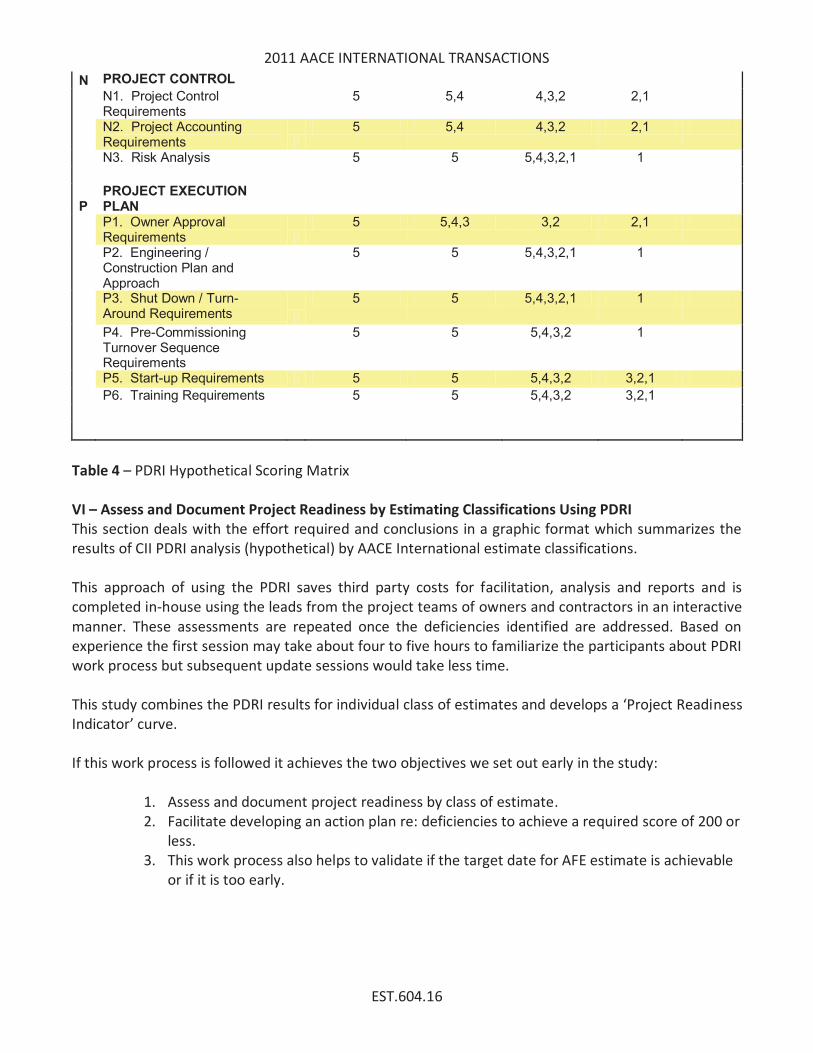
Table 4 – PDRI Hypothetical Scoring Matrix
VI – Assess and Document Project Readiness by Estimating Classifications Using PDRI
This section deals with the effort required and conclusions in a graphic format which summarizes the
results of CII PDRI analysis (hypothetical) by AACE International estimate classifications.
This approach of using the PDRI saves third party costs for facilitation, analysis and reports and is
completed in-house using the leads from the project teams of owners and contractors in an interactive
manner. These assessments are repeated once the deficiencies identified are addressed. Based on
experience the first session may take about four to five hours to familiarize the participants about PDRI
work process but subsequent update sessions would take less time.
This study combines the PDRI results for individual class of estimates and develops a ‘Project Readiness
Indicator’ curve.
If this work process is followed it achieves the two objectives we set out early in the study:
1. Assess and document project readiness by class of estimate.
2. Facilitate developing an action plan re: deficiencies to achieve a required score of 200 or
less.
3. This work process also helps to validate if the target date for AFE estimate is achievable
or if it is too early.

2011 AACE INTERNATIONAL TRANSACTIONS
EST.604.17
Figure 3 – Project Readiness Indicator Curve
The following notes will help in understanding the “Project Readiness Indicator” curve:
1. The PDRI score for a well defined FEED package is 200 points. A score lower than 200
shows increasingly better definition. Note that this score should be achieved at
engineering freeze date for AFE (generally Class 3) estimate MTOs.
2. The overall engineering completion (also defined as the full project definition) should
directionally be in the 33 percent to 35 percent to get a 200 score on PDRI scale for a
well defined FEED package.
Conclusion:
Based on the discussions in this paper we have shown that a relationship between PDRI and estimate
classifications can be established. This correlation will aid the estimating department managers in
ensuring that the maturity and quality of engineering deliverables and the project definition rating
criteria both support the class of estimate required.
i … Assess and document project readiness by class of estimate
2011 AACE INTERNATIONAL TRANSACTIONS
EST.604.18
The PDRI facilitated session, at engineering freeze date for MTO, using client and contractor
representatives provides the necessary documentation to provide an answer to the key issue faced by
the estimating manager.
This session must evaluate all the 70 elements of PDRI for completeness using the PDRI definition level
scoring guidelines and the detailed description for each element in the PDRI literature. The outcome of
this PDRI session should result in a score of 200 or less for engineering to have been sufficiently
advanced to support a good quality AFE estimate.
It is expected that each individual PDRI session is documented with all the assessments completed.
ii … Facilitate developing an action plan re: deficiencies to meet the requirements
The facilitator, after a group assessment of all 70 elements of PDRI, should be able to identify elements
which are deficient and prioritize those elements which could be advanced with minimum engineering
efforts to achieve a score of 200 or less.
Iii … Cost effective approach
We have also discussed in this paper that the PDRI sessions could be performed in a cost effective
manner, using in-house resources, while saving third party costs.
REFERENCES
1. Recommended Practice 18R-97: Cost Estimate Classification System – as Applied in Engineering,
Procurement and Construction for the Process Industries, AACE International, Morgantown, WV,
revised January 15, 2011.
2. Project Materials Management Primer, Construction Industry Institute (CII), Research Summary 7-
2, Austin, TX, 1982.
Syed Hasan Zaheer, P.Eng.
Fluor Canada Ltd.
Craig Fallows
Fluor Canada Ltd.