Document Produced under Grant - Asian … 9: Flood Damage Curve Prevention and Coping Costs .....40...
106
Document Produced under Grant This document does not necessarily reflect the views of ADB or the Government concerned, and ADB and the Government cannot be held liable for its contents. Project Number: 45206 May 2016 Grant 0299-NEP: Water Resources Project Preparatory Facility Final Report – Volume 4 Appendix F Mawa Ratuwa Annexes 6 to 8 Prepared by Lahmeyer International in association with Total Management Services Pvt. Ltd. For Ministry of Irrigation, Government of Nepal Department of Irrigation, Government of Nepal
Transcript of Document Produced under Grant - Asian … 9: Flood Damage Curve Prevention and Coping Costs .....40...

Document Produced under Grant
This document does not necessarily reflect the views of ADB or the Government concerned, and ADB and the Government cannot be held liable for its contents.
Project Number: 45206 May 2016
Grant 0299-NEP: Water Resources Project Preparatory Facility
Final Report – Volume 4 Appendix F Mawa Ratuwa Annexes 6 to 8
Prepared by
Lahmeyer International in association with Total Management Services Pvt. Ltd.
For Ministry of Irrigation, Government of Nepal Department of Irrigation, Government of Nepal

WRPPF-Package 3: Flood Hazard Mapping & Preliminary Preparation of Risk Management Projects i Final Report May 2016
Volume 4: Appendix F Lahmeyer International in association with Total Management Services
ANNEX 6: MAWA RATUWA PRIORITY BASIN PREFEASIBILITY COST-
BENEFIT ANALYSIS REPORT

WRPPF-Package 3: Flood Hazard Mapping & Preliminary Preparation of Risk Management Projects ii Final Report May 2016
Volume 4: Appendix F Lahmeyer International in association with Total Management Services
ABBREVIATIONS
ADB Asian Development Bank AEP Annual Exceedance Probability APL Annual Probability of Loss BoQ Bill of Quantity BCR Benefit-Cost Ratio CBA Cost-Benefit Analysis CBS Central Bureau of Statistics CC Climate Change DAP Di-ammonium phosphate DEM Digital Elevation Model DoI Department of Irrigation DWIDP Department of Water Induced Disaster Prevention EIRR Economic Internal Rate of Return EIRR Financial Internal Rate of Return EM-DAT Emergency Events Database ENPV Economic Net Present Value EWS Early Warning System FHFRM Flood Hazard/Flood Risk Map FHR Flood Hazard Rating FNPV Financial Net Present Value GIS Geographical Information System IRR Internal Rate of Return kcals Kilo-calories MoHA Ministry of Home Affairs NPR Nepalese Rupees NPV Net Present Value RCC Reinforced Concrete SER Shadow Exchange Rate SERF Shadow Exchange Rate Factor SWRF Shadow Wage Rate Factor TLU Tropical Livestock Unit VDC Village Development Committee
Assumed Rate of Exchange: NPR 106 ~ US$ 1

WRPPF-Package 3: Flood Hazard Mapping & Preliminary Preparation of Risk Management Projects iii Final Report May 2016
Volume 4: Appendix F Lahmeyer International in association with Total Management Services
ANNEX 6
MAWA RATUWA PRIORITY BASIN: PREFEASIBILITY COST-BENEFIT ANALYSIS REPORT
CONTENTS
I. METHODOLGY OF THE CBA ............................................................................................... 1
II. HOUSING AND INFRASTRUCTURE .................................................................................... 3
General Description of Mawa Ratuwa Priority Basin .......................................... 3 Estimate of Housing and Infrastructure Affected ................................................ 3 Estimate of the Quality of Housing ...................................................................... 8 Estimate of the Loss of Value of Housing to Floods ......................................... 11 Estimate of the Cost of Damage to Building Occupants ................................... 14 Estimate of the Damage to Public Infrastructure .............................................. 15 Estimate of Infrastructure Direct Losses Without and With-Project .................. 16 Indirect Benefit from Increased Infrastructure Development With-project ........ 20
Indirect Benefit from Increased Infrastructure Development With and Without-project ................................................................................................................ 20
III. AGRICULTURE .................................................................................................................... 22
IV. MORTALITY AND MORBIDITY ........................................................................................... 31
V. LIVESTOCK ......................................................................................................................... 34
VI. FLOOD PREVENTION AND COPING COSTS ................................................................... 37
VII. CBA WITH IMPACT OF CLIMATE CHANGE ..................................................................... 42
CBA in Financial Prices ..................................................................................... 42 CBA in Economic Prices ................................................................................... 45
VIII. RESULTS AND SENSITIVITY ANALYSIS OF THE CBA ................................................... 51
Summary of the Financial and Economic Indicators ......................................... 51 Sensitivity Analysis ............................................................................................ 52 Poverty .............................................................................................................. 54

WRPPF-Package 3: Flood Hazard Mapping & Preliminary Preparation of Risk Management Projects iv Final Report May 2016
Volume 4: Appendix F Lahmeyer International in association with Total Management Services
LIST OF FIGURES
Figure 1: Housing Affected, Damaged/Destroyed by Flood Return Period ................................. 7 Figure 2: Proposed Flood Mitigation Measures ......................................................................... 17 Figure 3: Flood Damage Curve Without and With-project: Housing and Infrastructure ............ 19 Figure 4: Flood Damage Curve Without and With-project: Agriculture ...................................... 29 Figure 5: Mortality and Morbidity Rates by Magnitude of Flood Damage .................................. 32 Figure 6: Flood Damage Curve Without and With-project: Casualties ...................................... 33 Figure 7: Livestock Mortality Rates by Magnitude of Flood Damage ........................................ 35 Figure 8: Flood Damage Curve Without and With-project: Direct Loss of Livestock Value ....... 36 Figure 9: Flood Damage Curve Prevention and Coping Costs .................................................. 40

WRPPF-Package 3: Flood Hazard Mapping & Preliminary Preparation of Risk Management Projects v Final Report May 2016
Volume 4: Appendix F Lahmeyer International in association with Total Management Services
LIST OF TABLES
Table 1: Population and Land Use .............................................................................................. 3 Table 2: Change in House Numbers, 1992-2012 ....................................................................... 4 Table 3: Estimated Distribution of Houses by Flood Envelope, 2010 ......................................... 5 Table 4: Historical House Damage ............................................................................................. 5 Table 5: Linear Regression, Houses Affected on Flood Return Period and Housing Density ... 6 Table 6: Regression of Proportion of Poor Quality Housing on Proportion of VDC Area in
Flood Risk Area ............................................................................................................ 9 Table 7: Revision of Estimated Number of Poor Quality Houses in Flood Affected Areas ...... 10 Table 8: Housing by House Quality Class: Priority Basins ....................................................... 10 Table 9: Reduction of House Depreciated Value in Response to FHR .................................... 13 Table 10: Numbers of Displaced, Assisted and Re-settled Households .................................... 14 Table 11: Summary of Without-project Direct Costs by Flood Return Period: Infrastructure ..... 16 Table 12: Number and Distribution of Unprotected Houses With-project ................................... 18 Table 13: Summary of With-project Direct Costs by Flood Return Period: Infrastructure .......... 19 Table 14: Processed Without and With-project Direct and Indirect Benefits from Infrastructure21 Table 15: Without-project, Without-flood Gross Margins for Paddy Rice Technologies ............. 23 Table 16: With-project, Without-flood Gross margins for Paddy Rice Technologies .................. 24 Table 17: Present Without-project and Expected Future With-project Cropping Pattern ........... 25 Table 18: Expected Loss of Yield of Rice Depending on Flood Date ......................................... 25 Table 19: Gross Margin and Production on Flood Affected Land by Flood Return Period: With
and Without-Project. ................................................................................................... 27 Table 20: Summary of Without-project Direct Costs by Flood Return Period: Agriculture ......... 28 Table 21: Summary of With-project Direct Costs and Indirect Benefits by Flood Return Period:
Agriculture ................................................................................................................... 28 Table 22: Processed Without and With-project Direct and Indirect Benefits from Agriculture ... 30 Table 23: Estimate of Mortality and Morbidity by Magnitude of Flood Damage ......................... 31 Table 24: Numbers of Dead, Missing and Injured by Modelled Basin, 1991-2015 .................... 32 Table 25: Annual Probability of Casualties Saved ...................................................................... 33 Table 26: Processed Without and With-project Indirect Loss from Livestock............................. 36 Table 27: Summarised Food Budget Per Capita ........................................................................ 38 Table 28: Estimate of Crop Production Required to meet Annual Dietary requirement ............. 39 Table 29: Without-project Direct and Indirect Costs of Flood Prevention and Coping ............... 39 Table 30: With-project Direct and Indirect Costs of Flood Prevention and Coping .................... 40 Table 31: Processed Without and With-project Direct and Indirect Costs: Prevention and
Coping ......................................................................................................................... 41 Table 32: Cost: Benefit Analysis – Floods with Climate Change: Constant 2015 Financial
Prices, NPR million ..................................................................................................... 44 Table 33: Estimate of SER, SERF and SCF for Nepal, 2010-2015 ............................................ 46 Table 34: Import Parity Price for Rice ......................................................................................... 48 Table 35: Economic Conversion Factors for Costs and Benefits of Flood Management Project48 Table 36: Cost-Benefit Analysis – Floods with Climate Change: Constant 2015 Economic
NPR million ................................................................................................................. 50 Table 37: Financial and Economic Indicators: Mawa Ratuwa .................................................... 51 Table 38: Impact of Change in FHR on Economic IRR .............................................................. 52 Table 39: Impact of Change in Houses and Agricultural Area Affected on Economic IRR ........ 52 Table 40: Impact of Change of Houses Affected on Economic IRR ........................................... 53 Table 41: Mawa Ratuwa Priority Basin Historical Flood Damage Data 1992-2015 ................... 55

WRPPF-Package 3: Flood Hazard Mapping & Preliminary Preparation of Risk Management Projects 1 Final Report May 2016
Volume 4: Appendix F Lahmeyer International in association with Total Management Services
I. METHODOLGY OF THE CBA
1. A general model was prepared for the calculation of incremental avoided losses and
incurred benefits between the without-project situation and the with-project (with flood
management) situation for all six Priority Basins. Based on this model (which is described in
the Mid-term Report but has since been modified), this report describes the result of a
prefeasibility cost-benefit analysis for Mawa Ratuwa Priority Basin.
2. The model estimates direct losses (losses incurred directly as a result of the flood
event) and indirect losses and benefits (losses and benefits incurred as a result of changes in
market conditions, technology and investment) under the flood regimes expected in the
without-project present and future with-project situations. Indirect losses and benefits are
estimated under the headings of infrastructure, agriculture, human mortality, livestock mortality
and a miscellaneous heading entitled “prevention and coping mechanisms”. The discussion of
project benefits in this report is broadly organized under these headings.
3. The model incorporates the expected costs of the proposed flood management project.
4. The incremental benefit of the flood management project is the difference between
avoided losses in the without and with-project situations, plus indirect benefits obtained as a
result of the proposed project. Avoided losses are weighted by the probability of their future
occurrence and benefits independent of flood events are scheduled with reference to the flood
management project time frame. Then, by subtracting the investment and operational costs of
the flood management project from its expected benefits, an incremental benefit stream is
derived. This is analyzed to obtain the usual project performance indicators of net present
value (NPV), internal rate of return (IRR) and benefit-cost ratio (BCR).
5. The expected benefit from saving of human life and injury as a result of the flood
management project is also calculated. The numeraire used is expected numbers of casualties
saved during the duration of the project. There is no need to express this in monetary terms.
6. The data required to mobilize the model are the hydrological characteristics of floods
of different probabilities (1 in 2 year (50% probability), 1 in 5 year (20%), 1 in 10 year (10%), 1
in 25 year (4%), 1 in 50 year (2%) and 1 in 100 year (1%)) and infrastructure and land use data
within each of the “flood envelopes” impacted by these floods of defined probability, both
without and with-project. The impact of floods with intermediate probabilities is interpolated.
7. The Flood Hazard Rating (FHR) is a product of the predicted depth, velocity and debris
content of floods within flood envelopes. Duration is not included in the rating. This does not
matter because flood duration is usually less than one day in the Priority Basin area. The FHR
is a quantitative, continuous variable. The higher the rating, the greater the risks to human life,
and also of flood damage to property. The damage impact as determined by the FHR is
weighted in two ways. The first is required to estimate the flood impact on housing, so the %
of houses located in areas of low, moderate, significant and extreme FHR areas is multiplied
by the FHR of each class. The weighted FHR for agricultural areas follows a similar procedure,
but weighting by the area in each FHR class. It is attempted to preserve the dimension of the
FHR by giving the flowing values to each rank:

WRPPF-Package 3: Flood Hazard Mapping & Preliminary Preparation of Risk Management Projects 2 Final Report May 2016
Volume 4: Appendix F Lahmeyer International in association with Total Management Services
Low: FHR=<0.75 Moderate: FHR=1.25 Significant: FHR=2.0 Extreme: FHR=>3.0
8. The weighted values are then used in Lookup Tables to give an estimate of damage to
house (by four different types of house and public infrastructure) and yield reduction of paddy
rice. The Lookup Tables are shown in Table 9 and Table 18.
9. The model must be run with the hydrological characteristics of expected future floods
taking into account climate change. With climate change, the estimated flood envelope of a
flood of defined probability is usually larger and the FHR is higher. This has implications for
both project costs and benefits.
10. The model must also be run in financial and economic prices. Therefore for each
Priority Basin a financial and economic valuation of the proposed flood management project is
calculated for the with-climate change scenario and the project indicators are calculated in
economic and financial prices.
11. Cost-benefit analysis is required at pre-feasibility level for six Priority Basins to
contribute to six separate Concept Papers for the development of possible flood management
projects. The requirement for stand-alone documentation for each Priority Basin leads to
repetition in the reports. However, in order to be useful to develop each potential project to
feasibility level this is inevitable.

WRPPF-Package 3: Flood Hazard Mapping & Preliminary Preparation of Risk Management Projects 3 Final Report May 2016
Volume 4: Appendix F Lahmeyer International in association with Total Management Services
II. HOUSING AND INFRASTRUCTURE
A. General Description of Mawa Ratuwa Priority Basin
12. Mawa Ratuwa is a medium sized Priority Basin with a predicted historical 1 in 100 year
flood envelope of 4,500 ha. At 4.7 persons per ha overall population density is much higher
than East and West Rapti and even Lakhandehi. This is because 62% of the Priority Basin
population live in Damak Municipality and may be considered potentially urban. In 2012 35%
of the Damak population appeared to be concentrated within the 13% of the Damak
Municipality area that falls in Mawa Ratuwa basin. The population density here could approach
25 persons per ha. Housing is concentrated in the 1 in 2 year flood envelope which is generally
normal for all Priority Basins. The arable area is 78% of the total 1 in 100 year envelope so the
proportion of river channel and uncultivable bare areas is relatively small. All is classified as
agricultural and is presumed to be in farms. The amount of agricultural land per rural house is
large at 1.9 ha, but there is no opportunity to expand the cultivated area so agricultural
productivity growth would have to be through intensification. Table 1: shows estimated
population and land use statistics by flood envelope.
Table 1: Population and Land Use
Flood envelope of historical floods
1 in 2yr
1 in 5yr
1 in 10yr
1 in 25yr
1 in 50yr
1 in 100yr
Population 19,000 20,000 19,000 19,000 21,000 21,000
Urban 12,000 13,000 12,000 12,000 13,000 13,000
Rural 7,000 7,000 7,000 7,000 8,000 8,000
Population density, persons per ha 5.38 5.21 4.73 4.51 4.83 4.71
Houses in incremental envelope ha 4,365 156 37 - 279 106
Area, ha 3,529 3,840 4,013 4,215 4,346 4,456
Arable area, ha 2,674 2,947 3,100 3,276 3,390 3,486
Agricultural area, ha 2,671 2,943 3,096 3,272 3,386 3,482
Agricultural land as % of arable 100% 100% 100% 100% 100% 100%
Agricultural ha per rural house 1.71 1.84 1.81 1.91 1.86 1.88
B. Estimate of Housing and Infrastructure Affected
13. A flood management project should seek to reduce direct loss of infrastructure (mostly
private housing and supporting public infrastructure) from flood events. Annual damage to
infrastructure from historical floods is well documented in MOHA/DWIDP reports, but on its
own the historical record is an inadequate guide to the infrastructure that would be affected by
a flood event of exactly the same hydrological characteristics today, because of the increase
in investment, particularly housing numbers, within the affected area over time. A method to
disaggregate flood risk and flood vulnerability over time was developed to make forecasts for
future infrastructure losses on the basis of the present infrastructure stock.

WRPPF-Package 3: Flood Hazard Mapping & Preliminary Preparation of Risk Management Projects 4 Final Report May 2016
Volume 4: Appendix F Lahmeyer International in association with Total Management Services
14. The Consultants obtained the number of houses by VDC and ward for 1991 from GIS
imagery sources1 and compared it with the number of houses reported by VDC and ward in
the Population and Housing Census 2011. Housing in VDC associated with the Mawa Ratuwa
modeled basin increased by about 230% during the period. See Table 2: .
Table 2: Change in House Numbers, 1992-2012
VDC
Change in Number of Houses 1992-2012
Total by VDC in model basin,
1992
Number in 1:100 year envelope,
1992
Total by VDC in model basin,
2012
Number in 1:100 year envelope,
2012
Chulachuli 895 42 1,289 58
Damak N.P 1,668 722 6,877 3,089
Itahara 756 347 800 351
Jurkiya 107 - 546 -
Khajurgacchi 135 69 404 174
Kohabara 1,617 310 2,343 646
Lakhanpur 2,058 136 4,695 270
Rajghat 273 34 424 53
Sijuwa 494 153 971 302
Total 8,003 1,813 18,349 4,943
15. Then, it was assumed that the same proportion of 2012 house numbers would be
located in flood-prone areas as observed in 1992. This is expected to be a conservative
estimate, because with increasing housing density in the project area as a whole, the
proportion of housing in areas at risk from flooding should increase rather than decline. The
figures suggest a 273% increase in housing in the historical 1 in 100 year flood envelope in
the last 20 years: an average annual growth rate of 5.7%. The data suggest a disproportionate
expansion of housing, most probably of the poorer members of society, into flood-risk areas.
Continuing the trend of growth, an average rate of growth of housing over the life of the project
might conceivably be 2.25% per annum or 175% over a 25-year period. At the end of this
period the average area per house would still be only about 0.53 ha. This is important when
considering the future development that a flood management project would protect, even
excluding growth stimulated by the protection itself: see section I for further development of
this.
16. More can be done with the data. The area of the 1 in 100 year flood envelope is known
by VDC and ward and the number of houses is estimated (also by ward) so the housing density
at ward level in 2012 can be calculated. Then, taking the incremental area between the flood
return period classes and applying the housing density applicable to each ward, the number
of houses in each flood envelope can be calculated. See Table 3. It is apparent that 88% of
1 Source: Esri, Digital Globe Earthstar Geographics

WRPPF-Package 3: Flood Hazard Mapping & Preliminary Preparation of Risk Management Projects 5 Final Report May 2016
Volume 4: Appendix F Lahmeyer International in association with Total Management Services
2012 house numbers are estimated to be located in the 1 in 2 year envelope – the vast majority
of houses are exposed to regular flood events.
Table 3: Estimated Distribution of Houses by Flood Envelope, 2010
VDC 1 in 100yr
to 50yr 1 in 50yr to 25yr
1 in 25yr to 10yr
1 in 10yr to 5yr
1 in 5yr to 2yr
1 in 2yr
Total houses,
2010
Chulachuli 2 4 - 0 5 46 58
Damak N.P 70 176 - -75 115 2,803 3,089
Itahara 8 23 - 18 7 295 351
Jurkiya - - - - - - -
Khajurgacchi 2 6 - 7 3 157 174
Kohabara 8 21 - 18 7 592 646
Lakhanpur 7 16 - 41 8 198 270
Rajghat 1 2 - 1 0 49 53
Sijuwa 9 31 - 27 11 225 302
Total 106 279 - 37 156 4,365 4,943
% 2% 6% 0% 1% 3% 88% 100%
Area in ha 110 293 - 184 123 3,862 4,572
17. A number of possible explanations can be suggested for this distribution. Firstly, the 1
in 2 year flood envelope accounts for 85% of the area inside the 1 in 100 year envelope, so
most of the estimated 4,940 houses in the flood plain will be located within it. Secondly,
changes in flood risk may have subsequently exposed houses to a greater risk than perceived
when they were first sited. Thirdly, the 2012 housing estimate is based on the known 1992
distribution, but some houses may have been destroyed by floods in the last 20 years.
18. The importance of this information is that it enables the number of houses affected by
historical flood events, reported between 1991-2015, to be matched more precisely with the
year in which each reported flood occurred. See Annex 1 for the Mawa Ratuwa flood reports,
which were compiled from MOHA/DWIDP data. This information may be of further use at
feasibility study stage, particularly after obtaining confirmation and supporting details from local
sources,
19. The team’s Consultant Hydrologists calculated the annual maximum flow in the Mawa
Ratuwa and the likely return period of the resulting flood, which was presumed to be the
maximum flood for the year. For Mawa Ratuwa, hydrological data was only available for the
period 1991-2009. Historical floods after this year could not be assigned a return period.
However, for annual maximum historical floods 1991-2009 an indicative return period could be
assigned, and then matched to the infrastructure losses reported in the historical record. See
Table 4.
Table 4: Historical House Damage
Year Houses damaged Return period House population Housing Density, ha per house
1993 28 1.9 718 1.37 2002 9 1.9 490 1.03 1991 17 2.1 332 0.41 2004 7 2.4 520 1.19 2005 115 3.5 1,091 1.26

WRPPF-Package 3: Flood Hazard Mapping & Preliminary Preparation of Risk Management Projects 6 Final Report May 2016
Volume 4: Appendix F Lahmeyer International in association with Total Management Services
Year Houses damaged Return period House population Housing Density, ha per house
1999 286 5 1,842 2.01 2009 312 7.2 1,463 2.23 2000 381 13 2,013 2.07 1996 658 19 2,537 4.20
20. Housing density was difficult to derive, and required matching the ward area reported
as affected by the flood (not easy, because the historical flood record is incomplete in this
respect, particularly for the larger floods, see Annex 1) with the interpolated number of houses
by ward in the year of the flood. Each flood affected several or even many wards, and so
housing density in each ward provided a weight for the total reported affected area.
21. Then a linear regression was carried out, with number of houses damaged or destroyed
as the independent variable and flood return period and housing population as the explanatory
variables. The result is reported in Table 5. The level of explanation is high (R2=0.96) and the
coefficients of the explanatory variables are significant at 5% probability. The relationship is
useful, because it provides a basis for estimating the number of houses affected by a flood of
any given magnitude up to 1:20yr - providing the house population is known.
Table 5: Linear Regression, Houses Affected on Flood Return Period and Housing Density
22. The number of houses damaged or destroyed from the 2012 housing stock was then
estimated using the derived coefficients and compared with the house population and affected
housing, as shown in Fehler! Verweisquelle konnte nicht gefunden werden.. The house
“population” by flood envelope is reported in Table 3 the Table shows incremental house
numbers by envelope, clearly the population would be cumulative. Affected houses are
located in those wards reported as affected by historical flood events as shown in Table 4.
Only a proportion of affected houses are actually damaged or destroyed, as specified by the
regression equation. The equation subsumes variations in house quality and variation in the

WRPPF-Package 3: Flood Hazard Mapping & Preliminary Preparation of Risk Management Projects 7 Final Report May 2016
Volume 4: Appendix F Lahmeyer International in association with Total Management Services
flood hazard index during a flood event. Clearly some houses in a flood-affected area will resist
a flood while others are damaged or destroyed.
Figure 1: Housing Affected, Damaged/Destroyed by Flood Return Period
23. With frequent flood events, not all the population of houses is affected. A possible
explanation is that houses are preferentially located in the 1:2yr envelope (rather than
envelopes of more infrequent but more severe floods) because floods over the whole envelope
are not in fact an alternate year event. That they are not is strongly suggested by the historical
flood damage record. Small floods, resulting from local rainfall in sub-basins close-by, are a
manageable hazard for house owners and farmers. Flood damage records 1992-2015 do not
report a 1:2yr flood (as classified by return periods from historical events) in any Priority Basin
much larger than a few hundred hectares affecting only one or two wards.
24. However, as flood return period increases, a greater proportion of the house population
of the envelope is affected. Admittedly, the Mawa Ratuwa historical record does not give
access to a flood event with return period greater than 1 in 19 year, but this is hardly surprising
in a data set covering only 17 years. The interpolation up to 1:50yr and 1:100yr events is
unsupported by observation but the model suggests that as a result of an historical 1 in 100
year event, about 4,200 houses would be affected out of the housing stock of about 4,940
units, or about 85%. Of these, about 1,550 houses would be destroyed.
25. The calculation of houses damaged or destroyed was prepared outside the model for
the calculation of avoided losses and incurred benefits, but Figure 1 provides the essential
input for each flood envelope of the number of houses affected by the specified flood event
and the proportion of those that are damaged or destroyed.
26. It may also be observed that the historical growth of housing is an indicator of the rate
of change of investment in the basin modeled area in the future. As discussed in paragraph
58, the CBA takes account of this by assuming this investment will double over the life of the

WRPPF-Package 3: Flood Hazard Mapping & Preliminary Preparation of Risk Management Projects 8 Final Report May 2016
Volume 4: Appendix F Lahmeyer International in association with Total Management Services
project. Over the last 20 years the housing stock appears to have expanded in ward areas at
about 5% per annum (see Table 2: ), so the assumption is reasonable.
C. Estimate of the Quality of Housing
27. The Population and Housing Census 2012 compiles a count of housing at VDC level
by type of foundation and type of wall material. The Census does not provide cross-tabulated
data on number of houses by foundation and wall type but this is unimportant because the
interest for this study is to derive a rating of house quality for the VDC as a whole. This was
done as follows.
Foundation quality is rated as follows: Class 1: Cement bonded bricks and stone Class 2: Mud bonded bricks and stone and RCC pillars Class 3: Wooden pillars Class 4: Other foundations and not stated
Wall quality is rated as follows:
Class 1: Cement bonded bricks and stone Class 2: Mud boned brick and stone Class 3: Wood and/or planks Class 4: Bamboo, unbaked brick, others and not stated
Class 1, 2, 3 and 4 are then summed and weighted by the total housing stock to get an aggregate housing quality classification for each VDC in Priority Basins.
28. The total area of each VDC is known from the Census. The proportion of each VDC in
the flood-affected area (using the historical 1 in 100 year return period) of each Priority Basin
is known from the Study GIS. Reason suggests that house quality should be poorer on flood
plains than in non-flood affected areas: with the growth of population, households with fewer
resources are marginalized in higher risk areas, the investment in housing at risk from flooding
will be lower and past flood damage will lower the value of the housing stock. The data
available enables a test of this assumption: the higher the proportion of a VDC in the flood
affected area then the higher the proportion of poor quality housing in the VDC.
29. To test the assumption, the proportion of poor quality housing (Class 3 and 4 together)
was regressed on the proportion of VDC area within the area affected by floods in 1 in 100
year. The results below show a positive correlation at 90% probability (and in fact close to 95%
probability) that the proportion of “poor quality” housing (Classes 3 and 4 combined) is greater in VDCs with a higher proportion of village area on land prone to flooding.

WRPPF-Package 3: Flood Hazard Mapping & Preliminary Preparation of Risk Management Projects 9 Final Report May 2016
Volume 4: Appendix F Lahmeyer International in association with Total Management Services
Table 6: Regression of Proportion of Poor Quality Housing on Proportion of VDC Area in Flood Risk Area
30. For every percentage increase in VDC area at risk from flooding the proportion of poor
quality houses increases by 0.29%. Also, the highly significant intercept shows that in the
VDCs associated with the Priority Basins, at least 52% of housing will be of poor quality, even
if little or none of the VDC falls in the flood-affected area. It is straightforward to use this
relationship to revise the proportion of poor quality housing by VDC area (depending on the
proportion of the VDC within the flood-affected area) and introduce this proportion in the
calculation of the value of houses damaged or destroyed by floods.
31. It may be argued that the introduction of an estimate of the proportion of poor quality
housing into the VDC area, instead of using the known and perfectly robust statistic for that
VDC from the Population and Housing Census, introduces an estimate where no estimate is
required. Using the Census figures directly would, overall, classify 52% of housing within the
flood-affected areas as poor quality (that is, the same as reported by the Population and
Housing Census for those VDC). But it has already been shown that statistically this would be
an under-estimate of poor quality housing in flood-affected areas. Furthermore, the error would
inflate the estimated value of losses from floods because a larger proportion of good quality
housing would be assumed damaged/destroyed in a flood event. And finally, and more
importantly, a poverty analysis would under-estimate the proportion of poor quality housing
affected by floods, and therefore under-estimate the proportion of relatively poor households
benefiting from flood management.
32. Having obtained the coefficients from the whole data set of all the VDC associated with
all Priority Basin areas (Table 6), they were then applied to the percentage of each VDC within
the flood affected areas in order to obtain an estimate of the proportion of poor quality housing,
see the tabulation below.

WRPPF-Package 3: Flood Hazard Mapping & Preliminary Preparation of Risk Management Projects 10 Final Report May 2016
Volume 4: Appendix F Lahmeyer International in association with Total Management Services
Table 7: Revision of Estimated Number of Poor Quality Houses in Flood Affected Areas
Total number of houses in VDC 2012
Number of houses on flood plain,
2012
Class 3 & 4 houses from
Housing Census
Revised Class 3 & 4
houses change
% change
East Rapti 78,519 3,976 1,873 2,297 424 23%
West Rapti 46,092 5,103 3,058 3,275 217 7%
Mawa Ratuwa 42,622 5,436 3,533 3,342 -190 -5%
Biring 25,956 1,923 1,305 1,218 -86 -7%
Lakhandehi 35,095 3,567 2,550 2,398 -152 -6%
Mohana 41,465 2,282 1,257 1,293 36 3%
Total 269,749 22,287 13,575 13,823 248 2%
33. About 8% of households in VDC (that contain some part of the Priority Basins) are on
the flood plain. Using the VDC data from the Population and Housing Census, 61% of these
would be classified as poor quality (Class 3 or 4). Adjusting the estimate of poor quality housing
for the proportion of VDC within the flood plain increases this overall to 62%.
34. This may seem a meager adjustment, but there are differences between Priority basins.
Both East and West Rapti have significant upward adjustments to the numbers of poor quality
houses. Not all Priority Basins show the expected relationship after applying the adjustment.
The Population and Housing Census shows that Mawa Ratuwa, Biring and Lakhandehi have
a very large proportion of poor quality housing (bamboo walls on wooden pillar foundation) in
the VDCs (65-71%); adjusting this proportion by coefficients derived from the whole data set
actually reduces the high proportion observed by the Population and Housing Census. But the
reduction is small compared with the strong upward adjustment required for East and West
Rapti. So for Mawa Ratuwa, Biring and Lakhandehi the unadjusted housing quality classes
can be used when estimating housing damage from floods.
35. It is straightforward to re-compile the adjusted data into the four classes of housing
already classified (taking into account both foundation and wall quality), see Table 8. These
percentages of house quality were used in the general model to represent the value of the
current housing stock. The building classes “public buildings” and “other buildings” originally
considered important in the flood damage estimate were eliminated. There is no data on their
distribution in Priority Basins and their location in the flood plain is unlikely, though there are a
few reports of schools and clinics affected by floods in the MOHA flood damage records. Such
buildings can be located as part of feasibility study preparation.
Table 8: Housing by House Quality Class: Priority Basins
East Rapti West Rapti Mawa Ratuwa Biring Lakhandehi Mohana
Class 1 22% 6% 27% 26% 25% 31%
Class 2 22% 30% 11% 10% 8% 11%
Class 3 33% 35% 32% 26% 33% 55%
Class 4 24% 30% 29% 38% 35% 3%

WRPPF-Package 3: Flood Hazard Mapping & Preliminary Preparation of Risk Management Projects 11 Final Report May 2016
Volume 4: Appendix F Lahmeyer International in association with Total Management Services
36. A feasibility study would also field-sample and classify the housing stock in more detail.
The CSO classification may be sub-divided to capture differences in quality of housing
construction rather than be based simply on building materials.
D. Estimate of the Loss of Value of Housing to Floods
37. Houses in the four classes at were assigned a depreciated value as follows:
Class 1: NPR 454,250 Class 2: NPR 337,500 Class 3: NPR 300,563 Class 4: NPR 200,357 The derivation of these rates is described in the Socio-economic Report for each Priority Basin. At feasibility stage these rates should be checked carefully by field survey on a sample of houses in the flood affected area. The result of the cost-benefit analysis is expected to be sensitive to the values of housing damaged and destroyed. 38. It is also necessary to identify the level of damage a house will sustain under floods of
pre-defined characteristics. This is difficult and, without empirical data, contentious.
Nevertheless, note from section A that the number of houses damaged or destroyed under
floods of defined return period and known housing stock has already been specified by
regression coefficients derived from observed data. The remaining issue is only to identify the
level of damage and the proportion of damaged/destroyed houses actually destroyed. The
Project GIS was used to establish the number of houses within each FHR area. Obviously this
could only be done for the 1992 housing stock – the location of housing in 2012 is unknown.
The FHR is useful to do this, see

WRPPF-Package 3: Flood Hazard Mapping & Preliminary Preparation of Risk Management Projects 12 Final Report May 2016
Volume 4: Appendix F Lahmeyer International in association with Total Management Services
40. Table 9. Note the loss of value of public infrastructure due to flood damage is discussed
below in paragraphs 48 and 49.
41. Obviously no damage is assumed with a rating of 0: there is no velocity, no depth and
no debris. It is assumed a Class 4 house will be destroyed when the rating equals 1.5, which
signifies a flood of 0.4 m depth. 0.75 m/sec velocity and debris factor of 1. This is classified as
a “significant” flood hazard.

WRPPF-Package 3: Flood Hazard Mapping & Preliminary Preparation of Risk Management Projects 13 Final Report May 2016
Volume 4: Appendix F Lahmeyer International in association with Total Management Services
Table 9: Reduction of House Depreciated Value in Response to FHR
FHR Class 4 Class 3 Class 2 Class 1 Public Infrastructure
0 0% 0% 0% 0% 0%
0.5 0% 0% 0% 0% 6%
0.6 10% 5% 4% 4% 13%
0.7 20% 10% 8% 8% 19%
0.8 30% 15% 12% 12% 25%
0.9 40% 20% 16% 16% 31%
1 50% 25% 20% 20% 38%
1.1 60% 30% 24% 24% 44%
1.2 70% 35% 28% 28% 50%
1.3 80% 40% 32% 32% 56%
1.4 90% 45% 36% 36% 63%
1.5 100% 50% 40% 40% 69%
1.6 100% 55% 44% 44% 75%
1.7 100% 60% 48% 48% 81%
1.8 100% 65% 52% 52% 88%
1.9 100% 70% 56% 56% 94%
2 100% 75% 60% 60% 100%
2.1 100% 80% 64% 64% 100%
2.2 100% 85% 68% 68% 100%
2.3 100% 90% 72% 72% 100%
2.4 100% 95% 76% 76% 100%
2.5 100% 100% 80% 80% 100%
2.6 100% 100% 84% 84% 100%
2.7 100% 100% 88% 88% 100%
2.8 100% 100% 92% 92% 100%
2.9 100% 100% 96% 96% 100%
3 100% 100% 100% 100% 100%
3.1 100% 100% 100% 100% 100%
3.2 100% 100% 100% 100% 100%
3.3 100% 100% 100% 100% 100%
3.4 100% 100% 100% 100% 100%
3.5 100% 100% 100% 100% 100%
42. Class 3 housing is more resilient and will survive a FHR up to 2.5, classified as
“extreme”. Classes 1 and 2 are assumed to resist up to a FHR of 3. Without empirical data,
the amount of damage sustained to the house at lesser FHRs is only conjecture, so the
percentage of damage sustained to the depreciated value of the house is assumed to be in
direct proportion to the FHR.
WRPPF-Package 3: Flood Hazard Mapping & Preliminary Preparation of Risk Management Projects 14 Final Report May 2016
Volume 4: Appendix F Lahmeyer International in association with Total Management Services
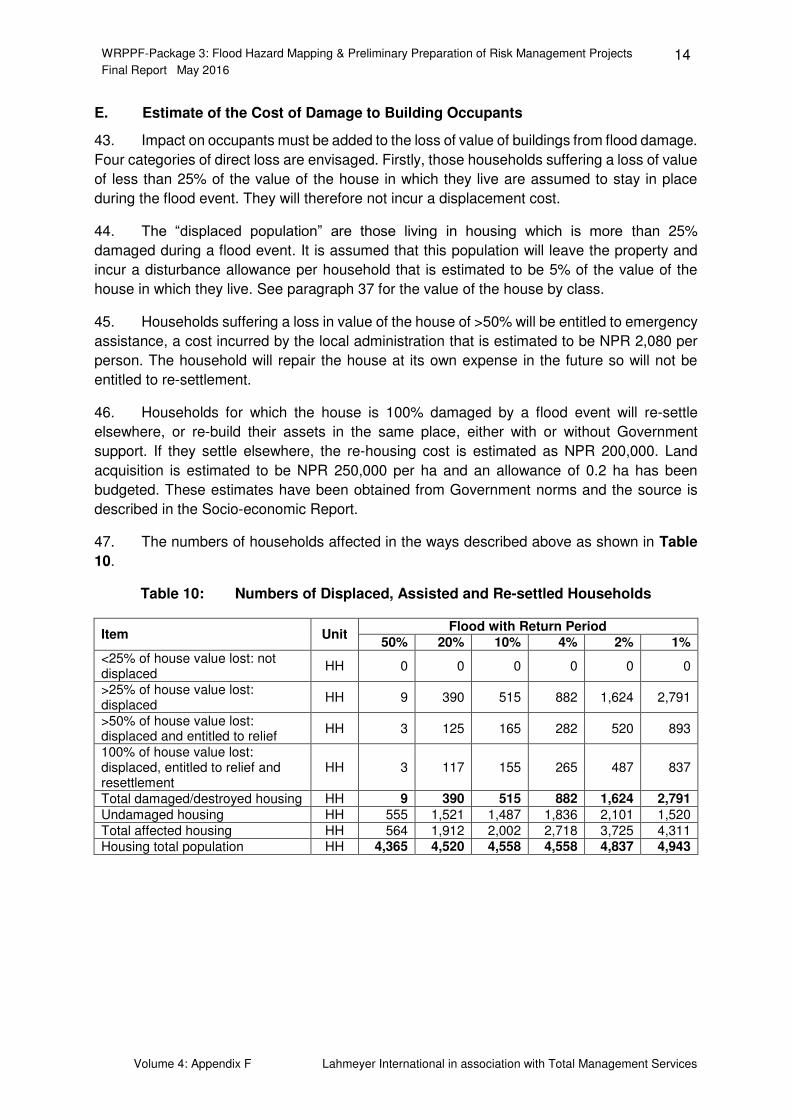
E. Estimate of the Cost of Damage to Building Occupants
43. Impact on occupants must be added to the loss of value of buildings from flood damage.
Four categories of direct loss are envisaged. Firstly, those households suffering a loss of value
of less than 25% of the value of the house in which they live are assumed to stay in place
during the flood event. They will therefore not incur a displacement cost.
44. The “displaced population” are those living in housing which is more than 25%
damaged during a flood event. It is assumed that this population will leave the property and
incur a disturbance allowance per household that is estimated to be 5% of the value of the
house in which they live. See paragraph 37 for the value of the house by class.
45. Households suffering a loss in value of the house of >50% will be entitled to emergency
assistance, a cost incurred by the local administration that is estimated to be NPR 2,080 per
person. The household will repair the house at its own expense in the future so will not be
entitled to re-settlement.
46. Households for which the house is 100% damaged by a flood event will re-settle
elsewhere, or re-build their assets in the same place, either with or without Government
support. If they settle elsewhere, the re-housing cost is estimated as NPR 200,000. Land
acquisition is estimated to be NPR 250,000 per ha and an allowance of 0.2 ha has been
budgeted. These estimates have been obtained from Government norms and the source is
described in the Socio-economic Report.
47. The numbers of households affected in the ways described above as shown in Table
10.
Table 10: Numbers of Displaced, Assisted and Re-settled Households
Item Unit Flood with Return Period
50% 20% 10% 4% 2% 1%
<25% of house value lost: not displaced
HH 0 0 0 0 0 0
>25% of house value lost: displaced
HH 9 390 515 882 1,624 2,791
>50% of house value lost: displaced and entitled to relief
HH 3 125 165 282 520 893
100% of house value lost: displaced, entitled to relief and resettlement
HH 3 117 155 265 487 837
Total damaged/destroyed housing HH 9 390 515 882 1,624 2,791
Undamaged housing HH 555 1,521 1,487 1,836 2,101 1,520 Total affected housing HH 564 1,912 2,002 2,718 3,725 4,311 Housing total population HH 4,365 4,520 4,558 4,558 4,837 4,943

WRPPF-Package 3: Flood Hazard Mapping & Preliminary Preparation of Risk Management Projects 15 Final Report May 2016
Volume 4: Appendix F Lahmeyer International in association with Total Management Services
F. Estimate of the Damage to Public Infrastructure
48. There will be damage to public infrastructure within the flood envelope, particularly for
large-magnitude floods. Physical quantities of made and local roads, bridges, power lines and
telephone lines were estimated on a per unit per house basis: i.e. the quantity of public
infrastructure is based on the numbers of houses within the flood envelope. In Mawa Ratuwa
Priority Basin it is assumed there are:
0.5 metres of made road per housing unit 15 meters of un-made road per housing unit 0.005 bridges adequate for motor vehicles 2.5 meters of power line per housing unit and 5 meter of telephone line per housing unit.
49. The value of public infrastructure as a percentage of total infrastructure (including
housing) value is estimated to be 10%. The value of public infrastructure damaged by a flood
is the equivalent to the cost of repairing or replacing it after a flood event. Construction cost is
estimated to be:
Made roads: NPR 5.20 million per km Farm roads: NPR 1.04 million per km Bridges: NPR 0.50 million each Power 33 kva NPR 3.12 million per km Telephone lines: NPR 1.04 million per km
The assumed repair or replacement cost as a percentage of the construction cost is shown in

WRPPF-Package 3: Flood Hazard Mapping & Preliminary Preparation of Risk Management Projects 16 Final Report May 2016
Volume 4: Appendix F Lahmeyer International in association with Total Management Services
Table 9.
G. Estimate of Infrastructure Direct Losses Without and With-Project
50. A summary of direct losses without-project is presented by flood return period in Table
11. Note that all valuations in the following tables specifying losses by flood event are in
financial, not economic prices. Damage to housing is in all events the greatest loss, but
displacement costs are also significant. In the event of severe damage to the housing stock
the costs of relief and re-settlement are also high. These costs may not actually be incurred if
Government resources are inadequate, particularly the cost of provision of new housing and
land for the re-settled population. Nevertheless, it is important to identify relief and resettlement
as a significant potential cost.
Table 11: Summary of Without-project Direct Costs by Flood Return Period: Infrastructure
Item Unit Flood with Return Period
50% 20% 10% 4% 2% 1%
Damage to housing NPR m 1.99 94.96 125.37 214.70 395.27 679.44
Displacement costs NPR m 0.14 6.17 8.14 13.94 25.66 44.11
Relief and resettlement NPR m 0.69 31.43 41.50 71.07 130.84 224.90
Damage to infrastructure NPR m 0.20 9.86 13.02 22.29 41.04 70.55
Total Direct Cost NPR m 3.02 142.42 188.02 322.01 592.81 1,018.99
51. The detailed procedure and priorities adopted to define the with-project intervention is
not described in this report. Sufficient to say the sub-project proposal is for embankment
protection for five discrete areas comprising 1,502 ha or 34% of the Mawa Ratuwa basin area
as shown in Figure 2. In addition, Early Warning Services, shelter housing and non-structural
works will be provided. This Final Report includes an estimate of benefits from avoided losses
of property and life from Early Warning Systems, which will be established at all project sites
and Shelter Houses which will be established at East Rapti, Biring and Mawa Ratuwa. These
facilities were un-costed in the draft Final Report.

WRPPF-Package 3: Flood Hazard Mapping & Preliminary Preparation of Risk Management Projects 17 Final Report May 2016
Volume 4: Appendix F Lahmeyer International in association with Total Management Services
Figure 2: Proposed Flood Mitigation Measures

WRPPF-Package 3: Flood Hazard Mapping & Preliminary Preparation of Risk Management Projects 18 Final Report May 2016
Volume 4: Appendix F Lahmeyer International in association with Total Management Services
52. Note that Early Warning and Shelter Houses (where established) will primarily benefit
the basin population that will not be protected by embankments: this is a significant benefit
where the proportion of the unprotected basin population is large. The assumption is that, with-
project, the Early Warning System will reduce displacement costs per affected household
(located outside embankment protection) by 50% and the mortality and morbidity rates of the
same population will be reduced by half. Shelter Houses will reduce the costs of emergency
relief (to the households that will later return to damaged houses) by half: this reduction
represents a reduction of organization costs (relief will be more aerially focused) and reduced
costs of temporary accommodation (whether met by households or government). The
population with destroyed houses will still require re-settlement.
53. The known numbers of houses in 1992 within the protected areas were counted and
adjusted upwards to obtain an estimate of 2012 house numbers using the growth rates already
calculated and indicated in Table 2: . This number was subtracted from the estimated total
number of houses affected by floods in the Mawa Ratuwa basin in 2012 to give the number
that will continue to be exposed to flood damage with-project. This allows the calculation of
incremental flood damage without and with-project within the CBA model.
Table 12: Number and Distribution of Unprotected Houses With-project
Growth rate of housing
in the period 1992-2012
Number in protected
area in 1992
Number in protected
area in 2012
Number of houses
remaining unprotected
Chulachuli 137% 0 - 58 Damak N.P 428% 178 762 2,327 Itahara 101% 176 178 173 Jurkiya 163% 13 26 - Khajurgacchi 253% 81 174 0 Kohabara 208% 67 140 506 Lakhanpur 199% - 270 Rajghat 155% - 53 Sijuwa 197% 2 4 298 Total 517 1,283 3,686
54. With-project direct infrastructure losses are shown in Table 13. This Table should be
compared with Table 11: the difference between the value estimates is the incremental benefit
from protecting houses and infrastructure.

WRPPF-Package 3: Flood Hazard Mapping & Preliminary Preparation of Risk Management Projects 19 Final Report May 2016
Volume 4: Appendix F Lahmeyer International in association with Total Management Services
Table 13: Summary of With-project Direct Costs by Flood Return Period: Infrastructure
Item Unit Flood with Return Period
0.50 0.20 0.10 0.04 0.02 0.01
Damage to housing NPR m 1.48 70.27 92.77 158.88 292.50 502.78
Displacement costs NPR m 0.05 2.28 3.01 5.16 9.49 16.32
Relief and resettlement NPR m 0.49 22.46 29.65 50.77 93.47 160.67
Damage to infrastructure NPR m 0.15 7.30 9.63 16.50 30.37 52.21
Total Direct Cost NPR m 2.17 102.30 135.06 231.31 425.84 731.98
55. Graphing without and with-protect costs by flood event, a flood-damage curve results
and the difference between the two graphs is the incremental benefit (saved loss) attributed to
the project. See Figure 3.
Figure 3: Flood Damage Curve Without and With-project: Housing and Infrastructure
56. The incremental benefit from the project is expressed in the CBA calculation as an
annual probability of avoided direct loss (APL). The without and with-project loss to events up
to 1:100yr is calculated by interpolating the graph between 1:2yr, 1:5yr, 1:10yr, 1:25yr, 1:50yr
and 1:100yr and multiplying by the probability of each event occurring. The sum of the loss
induced by each event: 1:2yr, 1:5yr, 1:6yr…1:100yr is the annual probability of loss that is
constant for each year. The combination of adjustment of the expected loss by the probability
of loss occurring in each year, and then discounting that APL in the CBA means that avoided
loss is smaller than might be expected.
-
200,00
400,00
600,00
800,00
1.000,00
1.200,00
2 5 10 25 50 100
Pre
dic
ted
da
ma
ge
, N
PR
mil
lio
n
Probability of flood return
Direct loss from floods without and
with-project: Housing and
Infrastructure
Without project direct
loss of present
infrastructure
With project present
direct loss of present
infrastructure

WRPPF-Package 3: Flood Hazard Mapping & Preliminary Preparation of Risk Management Projects 20 Final Report May 2016
Volume 4: Appendix F Lahmeyer International in association with Total Management Services
H. Indirect Benefit from Increased Infrastructure Development With-project
57. There will be an indirect benefit from increased investment in existing infrastructure in
the with-project situation, as the affected population improves the house stock and existing
public infrastructure is up-graded as a result of increased security from flood events. With-
project, there may also be an increase in the affected population, resulting in the construction
of new housing. It was assumed that the flood management intervention would stimulate a
10% increase in new investment in the with-project area (defined as the size of the flood
envelope under a without-project 1:100yr flood). This indirect benefit is not flood-dependent:
with flood management it will take place over the whole project area. However, new investment
is time dependent and it is assumed it takes place incrementally over the whole project life of
25 years.
I. Indirect Benefit from Increased Infrastructure Development With and Without-
project
58. Finally, it is necessary to take into account the change in housing and infrastructure in
the basin modeled area over time with-project. The losses and benefits described above are
based on assumptions about present infrastructure. Even the direct benefit described in
paragraph 57 is about incremental improvement of the present, existing investment. Assuming
the project life is 25 years (the benefits from protecting existing infrastructure are unlikely to
justify a more expensive, longer-term project) and acknowledging that population in the Terai
is growing by about 2% per annum taking into account in-migration (see paragraph 15 for an
assessment of growth in the Mawa Ratuwa Priority Basin); then it is reasonable to assume
that socio-economic conditions will change in time both without and with-project. Population
will increase annually, land use will intensify and investment per unit area will increase. That
being so, it is reasonable to scale up the direct benefits to the project to take this indirect benefit
of protecting as yet undeveloped assets in the future into account. It is assumed that without
and with-project direct losses would double after 25 years in the future. Direct losses are simply
recalculated using this factor and processed to calculate annual probability of loss as described
in paragraph 56. Then, instead of using a constant value for APL for each year of project life,
it can be interpolated between APL in the present and APL in the future.
59. The manipulations described in sections G, H and I above are summarized in Table
14. Comparing this Table with the cost-benefit analysis in Table 32: it should be clearer how
APL and indirect benefits are handled in the financial and economic analysis. Note that
probability-adjusted valuations in the Tables below are given in financial, not economic prices.

WRPPF-Package 3: Flood Hazard Mapping & Preliminary Preparation of Risk Management Projects 21 Final Report May 2016
Volume 4: Appendix F Lahmeyer International in association with Total Management Services
Table 14: Processed Without and With-project Direct and Indirect Benefits from Infrastructure
Flood envelopes
APL INCREMENT
AL APL
2 5 10 25 50 100
50% 20% 10% 4% 2% 1%
Without project direct loss of present infrastructure NPR m 3.02
142.42
188.02
322.01 592.81
1,018.99 162.21
With project present direct loss of present infrastructure NPR m 2.17
102.30
135.06
231.31 425.84 731.98 116.52 45.69
Without project direct loss of present and future infrastructure NPR m 6.04
284.83
376.04
644.01
1,185.62
2,037.99 324.41
With project present direct loss of present and future infrastructure NPR m 4.34
204.61
270.12
462.62 851.68
1,463.96 233.03 91.38
Indirect benefit from increased investment NPR m
13.07 44.32 46.43 63.02 86.36 99.96
Independent of flood events

WRPPF-Package 3: Flood Hazard Mapping & Preliminary Preparation of Risk Management Projects 22 Final Report May 2016
Volume 4: Appendix F Lahmeyer International in association with Total Management Services
III. AGRICULTURE
60. The general model calculates the avoided direct loss of crops and the indirect benefit
of the flood management project using the same historical and with climate change flood
envelopes as described above. Avoided direct loss is the value of the crop lost to flood, indirect
benefit is the increase in agricultural economic activity that comes as a result of with-project
flood management.
61. Key data is the agricultural area within each flood envelope, which is obtained from the
Project GIS output. The data suggest that the area of agriculture in the flood envelopes is large
and will be an important source of damage. However, the argument put forward in paragraphs
23 and 24 suggests that the not all the envelope area will be affected. Floods with a frequent
return period will affect a relatively small proportion of the area defined in the developed, while
floods that return infrequently will affect a much larger proportion. Consistency requires that
the affected agricultural area should be adjusted for each flood return period, as was done to
calculate infrastructure damage, but the statistical evidence in the historical flood record for
doing so is lacking (see Annex 1). However, to avoid inflating benefits it was decided to adjust
the affected agricultural area downwards in the same proportion as shown in Figure II-1
between the total and affected housing population. Therefore, in the without-project situation,
12% of the agricultural area is assumed to be affected by a 1 in 2 year event, rising to 85%
during a 1 in 100 year event.
62. After adjusting the total agricultural area to the affected agricultural area, the cropping
pattern and cropping intensity in the affected area must be established. The general model
allows for four crops in the cropping pattern. In Mawa Ratuwa, paddy rice is the most important
crop during the flood period of July to September (see Socio-economic Report). Rice is
cultivated under the technologies:
improved rice with irrigation
improved rice rainfed
traditional rice with irrigation
traditional rice rainfed
63. Crop gross margins have been prepared for each of the four technologies in the
without-project, without flood situation and the with-project, without flood situation. They are
presented in the Socio-economic Report and summarized in Table 15: 15 and Fehler!
Verweisquelle konnte nicht gefunden werden.16.
.

WRPPF-Package 3: Flood Hazard Mapping & Preliminary Preparation of Risk Management Projects 23 Final Report May 2016
Volume 4: Appendix F Lahmeyer International in association with Total Management Services
Table 15: Without-project, Without-flood Gross Margins for Paddy Rice Technologies

WRPPF-Package 3: Flood Hazard Mapping & Preliminary Preparation of Risk Management Projects 24 Final Report May 2016
Volume 4: Appendix F Lahmeyer International in association with Total Management Services
Table 16: With-project, Without-flood Gross margins for Paddy Rice Technologies

WRPPF-Package 3: Flood Hazard Mapping & Preliminary Preparation of Risk Management Projects 25 Final Report May 2016
Volume 4: Appendix F Lahmeyer International in association with Total Management Services
64. A cropping pattern was defined for the project area with reference to District statistics,
also described in the Socio-economic report and summarized in Table 1717. This provides a
basis for weighting the gross margins given in Table 15: 15 and Fehler! Verweisquelle
konnte nicht gefunden werden. to provide a composite gross margin for both the present
flood affected project area and the future with-project area, taking into account the expected
change in crop technology as a result of flood management.
Table 17: Present Without-project and Expected Future With-project Cropping Pattern
Without-project With-project
Irrigated Rainfed Irrigated Rainfed
Improved rice 49% 22% 60% 21%
Traditional rice 4% 25% 3% 16%
65. In order to prepare gross margins for flood envelopes, the impact of floods on the
baseline gross margins was assessed. The expected yield reduction under specified FHRs
was defined, taking into account planting date and growth stage of the crop, see Table 1818.
The Table specifies that floods during July will affect the crop at recently planted stage and
cause a considerable yield reduction. A flood from mid-August through to the end of September
will cause comparatively little damage. Luckily, the dates of floods are known for Mawa Ratuwa
(see Annex 1) and these were used to weight the anticipated yield reduction by growth stage
to a basin-specific yield loss.
Table 18: Expected Loss of Yield of Rice Depending on Flood Date
FHR July 1st to
31st Aug 1 to Aug 15
Aug 15 to Sept 30
Weighted expected yield
loss as function of FHR and historical
flood dates
0 0% 0% 0% 0%
0.5 60% 20% 10% 38%
0.6 60% 20% 10% 38%
0.7 60% 20% 10% 38%
0.8 60% 20% 10% 38%
0.9 70% 20% 10% 44%
1 70% 20% 10% 44%
1.1 70% 20% 10% 44%
1.2 70% 20% 10% 44%
1.3 70% 20% 10% 44%
1.4 70% 20% 10% 44%
1.5 70% 20% 10% 44%
1.6 70% 20% 10% 44%
1.7 70% 20% 10% 44%
1.8 100% 80% 40% 76%
1.9 100% 80% 40% 76%
2 100% 80% 40% 76% 2.1 100% 80% 40% 76%
2.2 100% 80% 40% 76%
2.3 100% 80% 40% 76%

WRPPF-Package 3: Flood Hazard Mapping & Preliminary Preparation of Risk Management Projects 26 Final Report May 2016
Volume 4: Appendix F Lahmeyer International in association with Total Management Services
FHR July 1st to
31st Aug 1 to Aug 15
Aug 15 to Sept 30
Weighted expected yield
loss as function of FHR and historical
flood dates
2.4 100% 80% 40% 76%
2.5 100% 80% 40% 76%
2.6 100% 100% 100% 100%
2.7 100% 100% 100% 100%
2.8 100% 100% 100% 100%
2.9 100% 100% 100% 100%
3 100% 100% 100% 100%
3.1 100% 100% 100% 100%
3.2 100% 100% 100% 100%
3.3 100% 100% 100% 100%
3.4 100% 100% 100% 100%
3.5 100% 100% 100% 100%
66. The FHR for each flood envelope was defined, based on the proportion of the
agricultural area affected by low, moderate, significant and extreme ratings. Note that to
establish agricultural losses, the weighting is done by area. To establish damage to housing,
the weighting was done by number of buildings affected by FHR (see paragraph 38).
67. Then, the FHR of each flood envelope was used to specify the expected yield reduction,
using Table 18 as an Excel LOOKUP table. Having defined the yield reduction, the gross
margins then were revised for the four crops under flood conditions of 1:2yr 1:5yr, 1:20yr,
1:50yr and 1:100yr depending on the (weighted by area) FHR for each envelope.
68. The issue of loss of both crop value and loss of inputs is treated as follows. Yield cannot
be negative, but if it is zero the crop will not be harvested, so variable costs will be incurred
only up to the date of flood. This is simulated by a calculation of pre-flood variable costs that
exclude the cost of harvesting. In the case of zero yield, gross margin will be negative to the
value of the variable costs incurred up to the point of flooding.
69. It is also necessary to do a similar calculation for the with-project situation. The
proposed with-project intervention shown in Figure 2 will protect 1,286 ha of agriculture at a
return period of 1:50yr with climate change. The balance of the agricultural area in the basin
will continue to be flood-affected. The CBA model adds the value of production from both areas
and subtracts the value of the production in the without project situation to calculate the net
benefit with-project.
70. The gross margins show that a small increase in the use of inputs is expected in the
protected area with-project: farmers will intensify production if they are more confident that
flood damage will be reduced by flood management. It is also assumed there will be some
intensification of the cropping pattern, with a greater area put to improved rice and irrigation;
see Table 19. The Socio-economic Report gives details on the assumptions made. With-
project changes in gross margins and cropping pattern are important because intensification
will be an indirect benefit of flood management.
71. Note that with-project, with-project gross margins apply only to the protected area and
that within that area no flood damage is assumed. With-project, without-project gross margins

WRPPF-Package 3: Flood Hazard Mapping & Preliminary Preparation of Risk Management Projects 27 Final Report May 2016
Volume 4: Appendix F Lahmeyer International in association with Total Management Services
continue to be applied on the whole unprotected area and within that, on the flood affected
area, the without-project gross margins with floods are applied.
72. The weighted gross margin and production per ha for the affected agricultural area (see
paragraph 61) without and with-project are shown in Table 19:. On the with-project protected
area, the gross margins and production per ha shown in Fehler! Verweisquelle konnte nicht
gefunden werden. are applied, weighted by the proportion of technologies shown in Table
17. The gross margin is estimated as NPR 18,008 per ha and the production is estimated to
be 4.08 tons per ha. On the with-project area outside the protected area but unaffected by
floods the gross margins and production shown in Fehler! Verweisquelle konnte nicht
gefunden werden.16 are applied, again weighted by the proportion of technologies shown in
Table 17. The gross margin is estimated as NPR 15,947 per ha and the production is estimated
to be 3.66 tons per ha.
Table 19: Gross Margin and Production on Flood Affected Land by Flood Return Period: With and Without-Project.
Without-project
cropping pattern
Flood envelopes
2 5 10 25 50 100
50% 20% 10% 4% 2% 1%
Gross margin, NPR per ha
Improved irrigated 49% 18,096 -
21,321 -
49,761 -
21,321 -49,761
-49,761
Improved rainfed 22% 16,438 -
17,986 -
42,825 -
17,986 -42,825
-42,825
Traditional irrigated 4% 13,814 -
20,538 -
45,325 -
20,538 -45,316
-45,325
Traditional rainfed 25% 11,647 -
17,221 -
38,050 -
17,221 -38,050
-38,050
Weighted gross margin, NPR/ha
15,948 -
19,531 -
45,129 -
19,531 -45,129
-45,129
kg of crop per ha
Improved irrigated 49% 4,073 2,285 996 2,285 996 996
Improved rainfed 22% 3,557 1,996 870 1,996 870 870
Traditional irrigated 4% 3,542 1,987 866 1,987 866 866
Traditional rainfed 25% 2,976 1,670 728 1,670 728 728
Weighted production, kg/ha 3,664 2,056 896 2,056 896 896
NB The weighted FHR for a 1:25 year flood at Mawa Ratuwa was estimated as lower than the 1:10yr and the 1:50yr. However, there is little difference in the FHR between events equal to and greater than 1:5yr. Thus flood envelope area accounts for most of the difference between estimated crop losses during different flood events.
73. The appropriate gross margin per ha and production per ha can then by multiplied by
affected and unaffected agricultural area in each without and with-project flood envelope and
in the with-project situation the production from the protected area is added. By subtracting
gross margin for each flood return period in the without and with-project situation the
incremental direct loss can be calculated. By subtracting gross margin without-project from
gross margin with-project for each flood envelope the indirect benefit of increased cropping
intensity with-project can also be estimated. The without and with-project direct losses and
indirect benefit are summarized in Table 20: and Table 21:.

WRPPF-Package 3: Flood Hazard Mapping & Preliminary Preparation of Risk Management Projects 28 Final Report May 2016
Volume 4: Appendix F Lahmeyer International in association with Total Management Services
Table 20: Summary of Without-project Direct Costs by Flood Return Period: Agriculture
Item Unit Flood with Return Period
50% 20% 10% 4% 2% 1%
Total Agriculture area ha 2,971 3,071 3,242 3,242 3,498 3,593
Agricultural area affected ha 351 1,252 1,423 2,134 2,623 3,054
Protected agric. Area ha - - - - - -
Gross margin without flood NPR m 47.39 48.98 51.70 51.70 55.78 57.30
Gross margin with flood NPR m 47.39 4.58 1.23 -78.63 -104.44 -129.23
Total direct loss with flood NPR m - 44.40 50.47 130.33 160.23 186.54
Total indirect benefit NPR m - - - - - -
Production without flood tons 10,887 11,253 11,878 11,878 12,816 13,165
Production with flood tons 10,887 9,241 9,590 5,970 5,554 4,710
Change in production tons - -2,013 -2,288 -5,907 -7,263 -8,455
Table 21: Summary of With-project Direct Costs and Indirect Benefits by Flood Return Period: Agriculture
Item Unit Flood with Return Period
50% 20% 10% 4% 2% 1%
Unprotected Agriculture area ha 1,921 1,984 2,065 2,002 2,211 2,263
Affected agricultural area ha 227 808 906 1,318 1,658 1,924
Protected agric. Area ha 1,051 1,088 1,177 1,240 1,286 1,330
Gross margin without flood NPR m 49.55 51.22 54.12 54.25 58.43 60.04
Gross margin with flood NPR m 49.55 22.54 21.97 -26.24 -42.86 -57.45
Total direct loss with flood NPR m - 28.68 32.15 80.49 101.29 117.49
Total indirect benefit NPR m 2.16 2.24 2.42 2.55 2.65 2.74
Production without flood tons 12,135 12,542 13,238 13,238 14,284 14,673
Production with flood tons 12,135 11,094 11,614 9,172 9,167 8,738
Change in production tons - -1,449 -1,624 -4,066 -5,117 -5,936
74. Direct losses can be graphed on the standard flood damage curve, as shown in Figure
4.

WRPPF-Package 3: Flood Hazard Mapping & Preliminary Preparation of Risk Management Projects 29 Final Report May 2016
Volume 4: Appendix F Lahmeyer International in association with Total Management Services
Figure 4: Flood Damage Curve Without and With-project: Agriculture
76. The losses under each flood event are then weighted by the probability of the event
occurring, the sum of the damages being the annual probability of loss (APL). A small
refinement can improve APL. Bearing in mind that APL is calculated on the basis of the present
cropping pattern and technology, it can be inflated slightly as cropping intensity increases and
technology improves over the life of the project. See paragraph 58 above.
77. Indirect benefit quantifies the difference in value of production between different (future
without and future with-project) technologies. It is not dependent on flood probability and is
applicable to the whole of the affected area.
78. This Final Report includes an estimate of avoided losses with-project from periodic
floods that cause total land destruction by erosion and reduction of land quality by
sedimentation. This estimate is included at the request of DWIDP. The historic flood record
does not give sufficient information to link loss of land and sedimentation of land with floods of
different return periods (see Annex, penultimate column: the data is nearly always missing).
Nevertheless, it is common knowledge that such losses from floods occur regularly and it is
reasonable to make an estimate of resulting losses. DWIDP have asked the Consultant to take
into account a total area affected over 25 years of 10 ha at Mawa Ratuwa, of which 50% is
totally lost and 50% affected by sedimentation. DWIDP estimates an annual loss of NPR 0.25
million: this has been incorporated into the CBA as a direct annual loss, which is avoided with-
project.
79. The manipulations described in the paragraphs above are summarized in Table 22:.
Comparing this Table with the cost-benefit analysis in Table 32:32 it should be clearer how
APL and indirect benefits are handled in the financial and economic analysis.
-
50,00
100,00
150,00
200,00
2 5 10 25 50 100
Pre
dic
ted
dir
ect
lo
ss,
NP
R m
illi
on
Probability of flood return
Direct Loss from Floods Without and With-
project: Agriculture
Without project direct loss
of present production
With project direct loss of
present production

WRPPF-Package 3: Flood Hazard Mapping & Preliminary Preparation of Risk Management Projects 30 Final Report May 2016
Volume 4: Appendix F Lahmeyer International in association with Total Management Services
Table 22: Processed Without and With-project Direct and Indirect Benefits from Agriculture
Flood envelopes
APL INCREMENTAL
APL 2 5 10 25 50 100
50% 20% 10% 4% 2% 1%
Without project direct loss of present production
NPR m - 44.40 50.47 130.33 160.23 186.54 48.25
With project direct loss of present production
NPR m - 28.68 32.15 80.49 101.29 117.49 30.64 17.61
Without project direct loss of present and future production
NPR m - 88.81
100.94 260.66 320.45 373.07 96.50
With project direct loss of present and future production
NPR m - 57.36 64.30 160.99 202.59 234.98 61.28 35.22
With project indirect net benefit from crop intensification and crop area expansion
NPR m 2.16 2.24 2.42 2.55 2.65 2.74 Independent of flood events, dependent on
cropped area

WRPPF-Package 3: Flood Hazard Mapping & Preliminary Preparation of Risk Management Projects 31 Final Report May 2016
Volume 4: Appendix F Lahmeyer International in association with Total Management Services
IV. MORTALITY AND MORBIDITY
80. The historical flood record includes reports of loss of life, missing persons and injuries.
Loss of life and missing persons as a result of flooding is probably more consistently reported
than destruction and damage to property. Reports of injury in the same record are rarer;
probably floods cause more psychological damage (which is unreported) than physical injury.
81. It is difficult to demonstrate any relationship between flood return period and the
number of deaths reported. This is because flood deaths frequently occur as a result of “risk-
taking” behavior. Risk-taking is an individual situation uncorrelated with loss of property, the
total numbers of people affected by a flood and the return period of the flood.
82. The parameters mortality and morbidity are expressed as a percentage of a population
– the population has to be known before a death or injury rate can be calculated. Thus flood
events associated with deaths but with no reported affected population are useless for analysis
of mortality. But this can be turned into an advantage for analysis because this set of data
includes risk-taking behavior, for example misjudged attempts to ford rivers in spate.
83. A data set of 505 flood records for the period 1991-2015 that included an estimate of
the affected population was available from the Basin Ranking Study previously carried out
under this project. A composite measure of magnitude was calculated, sufficient to classify
floods as low, high, very high and extreme in damage impact, but no flood return periods were
available. 95 records included reports of death, missing persons or injury. Summing these
reports by damage magnitude gave an estimate of mortality, mortality and missing persons,
and mortalities, missing persons and morbidity, as shown in Table 23:.
Table 23: Estimate of Mortality and Morbidity by Magnitude of Flood Damage
Magnitude of flood damage
Events Affected persons
Dead People
Missing People
Injured People
Mor-tality
Mortality &
missing
Mortality, missing
and Morbidity
Low 373 222,110 43 9 26 0.019
% 0.023% 0.035%
High 91 233,618 55 14 6 0.024
% 0.030% 0.032%
Very high 32 425,852 170 9 50 0.040
% 0.042% 0.054%
Extreme 8 154,933 125 7 37 0.081
% 0.085% 0.109%
84. The results are intuitively reasonable, with all three rates increasing with flood damage
magnitude. The rates can be expressed as incidents per 10,000 people, which is slightly easier
to visualize, and plotted on a graph, see Figure 5:. There are very few records of extreme
events and it is not known if any of them represent a flood of 1:100yr return period. Assuming
extreme events of flood damage are related to 1:50yr events, the graph can be interpolated
for an estimate of the number of deaths, missing persons and injuries expected in the range
of return periods that are of interest to the CBA. But the approach is not rigorous because rates
are only implicitly linked to flood return periods.

WRPPF-Package 3: Flood Hazard Mapping & Preliminary Preparation of Risk Management Projects 32 Final Report May 2016
Volume 4: Appendix F Lahmeyer International in association with Total Management Services
Figure 5: Mortality and Morbidity Rates by Magnitude of Flood Damage
85. A total analysis of river basins (and of those, only the modeled, lower areas) is
described above, which gives no indication of the relative risk of death or injury from floods
between basins. An indication of this is given in Table 24:, which shows that East Rapti and
Narayani have high historical numbers of dead or injured people per 10,000 of the present total
population. But the proportion of these who are actually flood affected is not known (it is likely
to much smaller than the 2011 total population), so there is no evidence to hand to justify
adjusting the rates calculated in Table 23: to reflect different mortality rates between basins.
Table 24: Numbers of Dead, Missing and Injured by Modelled Basin, 1991-2015
Modelled basin Dead Missing Injured Total 2011 population Affected per 10,000
Aurahi 3 2 - 5 160,141 0.312
Bakraha 1 - - 1 140,450 0.071
Balan 3 - - 3 146,598 0.205
Banganga - - - - 183,690 -
Biring 8 5 - 13 133,313 0.975
Budhi - - - - 285,219 -
Chaudhar 17 - - 17 95,216 1.785
Chisang 1 - 1 2 141,650 0.141
Dodha 4 - - 4 139,851 0.286
E-Rapti 139 21 100 260 763,318 3.406
Gagan 2 - 12 14 110,596 1.266
Ialbakeya 43 - 1 44 357,479 1.231
Jalad - - - - 194,498 -
Jhim 6 - - 6 91,285 0.657
Kamal 1 - - 1 37,946 0.264

WRPPF-Package 3: Flood Hazard Mapping & Preliminary Preparation of Risk Management Projects 33 Final Report May 2016
Volume 4: Appendix F Lahmeyer International in association with Total Management Services
Modelled basin Dead Missing Injured Total 2011 population Affected per 10,000
Kandra - - - - 57,236 -
Kankaii 6 - - 6 56,831 1.056
Karnali 10 11 - 21 196,681 1.068
Khando - - - - 88,009 -
Khutiya - - - - 51,250 -
Lakhandehi 28 - - 28 190,174 1.472
Mohana 4 - - 4 166,675 0.240
Narayani 114 - 5 119 533,619 2.230
Ratuwa 1 - - 1 161,013 0.062
W-Rapti 2 - - 2 292,112 0.068
86. Having made an estimate of likely dead, missing and injured per 10,000 flood affected
people it is easy enough to apply these rates to the flood affected population as defined in
paragraph 43 - 47, taking care to disaggregate the rates and specify dead, missing and injured
separately. Combined, the statistic is referred to as “casualties”. A flood damage curve can be prepared as shown in Figure 6.
Figure 6: Flood Damage Curve Without and With-project: Casualties
87. The same data can be used to establish an annual probability of casualties without and
with-project using the Annual probability of Loss method described in paragraph 56. The
difference between the APL without and with project basically represents the number of
casualties the project expects to avert per year of its existence. There is no need to express
this in monetary terms; it can stand alone as a project indicator, along with NPV, IRR etc.
Table 25: Annual Probability of Casualties Saved
Without-project pa With-project pa
Saved pa attributable to project
Lives saved 3.09 1.14 1.95
Injuries saved 0.41 0.15 0.26
Missing saved 1.10 0.41 0.69
Casualties 4.60 1.70 2.90
-
5,00
10,00
15,00
20,00
25,00
30,00
35,00
40,00
2 5 10 25 50 100To
tal
nu
mb
er
of
pe
op
le k
ille
d,
mis
sin
g a
nd
in
jure
d
Flood return period
Flood Direct Damage: Casualties
Without project casulaties
With project casualties

WRPPF-Package 3: Flood Hazard Mapping & Preliminary Preparation of Risk Management Projects 34 Final Report May 2016
Volume 4: Appendix F Lahmeyer International in association with Total Management Services
V. LIVESTOCK
88. The same procedure as described for quantifying the probability of mortality and
morbidity was used to estimate the probability of the death of livestock during a flood event.
There is no problem about allowing for risk-taking behavior by livestock; but the main problem
remained, which was how to establish the “affected” livestock population to allow a mortality rate to be calculated. This was complicated by the fact that the historical flood record specifies
only “livestock” deaths. There is obviously a huge difference in value if each livestock unit represented one head of cattle rather than one head of poultry. Further, it is known that poultry
suffer disproportionately compared to other livestock types from flood events.
89. The procedure used required estimating the livestock herd of each flood-affected
household. This was assisted by the study Poverty, Livestock and Household Typologies in
Nepal, Maltsoglou and Taniguchi, PPLPI Working Paper 13, FAO 2004, though the
Consultants modified the estimates therein to be relevant to specific Priority Basins. The study
notes that the statistics for the period show that 86% of households in the Terai are livestock
owners and gives sufficient additional information to show that the mean household herd size
is 2.2 Tropical Livestock Units (TLU) composed of 8% cattle (2 head), 8% sheep and goats
(two head), 8% pigs (two head) and 77% chickens (20 head). Bearing in mind that one TLU
must then equal 11.82 head of the household livestock herd, this is sufficient to calculate the
affected population of animals by type, against which “livestock” deaths can be disaggregated
and measured. The disadvantage of the method is that it does not take into account bias in
livestock death: as mentioned above, chickens die in floods more frequently than other
domestic animals.
90. Figure 7: shows that “livestock” mortality in flood events can be deduced from the
MOHA/DWIDP database as about 300 head per 10,000 for extreme events. The calculation
for deriving this statistic required, for each reported flood:
adjusting the affected households to derive the number of affected households owning
livestock
deriving the numbers of affected households owning cattle, shoats, pigs and poultry
disaggregating livestock deaths according to the composition of the household herd
expressing reported mortality per 10,000 head by livestock type for reported floods of
low, high, very high and extreme events as shown in Figure 7:7.

WRPPF-Package 3: Flood Hazard Mapping & Preliminary Preparation of Risk Management Projects 35 Final Report May 2016
Volume 4: Appendix F Lahmeyer International in association with Total Management Services
Figure 7: Livestock Mortality Rates by Magnitude of Flood Damage
92. Returning to the general model, it was then straightforward to estimate the affected
livestock herd in both TLU and number of head (owned by the affected population in the Priority
Basin and expressed as households) and calculate expected fatalities for each flood envelope
by applying the mortality rates shown in Figure 5:.
93. These fatalities could then be valued because the composition of the household’s herd had been estimated (see paragraph 89). Multiplying by price per head of family herd by type
and summing gives a value of about NPR 10,000 per head. The higher value of poultry in the
household herd is given its weight here, though there is still no way to account for bias in
mortality between types of stock. A flood damage curve was established, as shown in Figure
8.

WRPPF-Package 3: Flood Hazard Mapping & Preliminary Preparation of Risk Management Projects 36 Final Report May 2016
Volume 4: Appendix F Lahmeyer International in association with Total Management Services
Figure 8: Flood Damage Curve Without and With-project: Direct Loss of Livestock Value
94. The annual probability of loss was estimated as shown in Table 26:. This was
disappointingly low after so many convoluted calculations, but likely to be realistic when one
considers that most livestock deaths from flood events are probably of chickens. No
adjustment for anticipated indirect benefits was made – households are unlikely to improve or
invest in more livestock as a result of improved flood management.
Table 26: Processed Without and With-project Indirect Loss from Livestock
Flood envelopes
APL INCRE-
MENTAL APL
2 5 10 25 50 100
50% 20% 10% 4% 2% 1%
Without-project livestock loss
NPR m - 0.32 3.57 5.98 31.11 57.86 3.43
0.89 With-project livestock loss
NPR m - 0.24 2.64 4.43 23.02 42.82 2.54
-
10,00
20,00
30,00
40,00
50,00
60,00
70,00
2 5 10 25 50 100
Va
lue
of
Liv
est
ock
lo
ss,
NP
R m
illi
on
Flood return period
Direct Loss from Floods Without and With
project: Livestock
Without-project livestock
loss
With-project livestock loss

WRPPF-Package 3: Flood Hazard Mapping & Preliminary Preparation of Risk Management Projects 37 Final Report May 2016
Volume 4: Appendix F Lahmeyer International in association with Total Management Services
VI. FLOOD PREVENTION AND COPING COSTS
95. Residents living in flood risk areas incur flood damage prevention costs before flood
events. Prevention costs cover flood proofing of houses, bank stabilization by tree and grass
planting and maintenance, and establishment and maintenance of live fencing to check floods.
The measures taken may be individual or cooperative. In the without-project situation it is
assumed that between five and ten person days per annum are spent per (affected) house in
flood proofing and a further 50 days per hectare in “built up” areas (as specified on the land
use map) carrying out bank stabilization and live fencing. There will be minor material costs
but only labor has been costed.
96. Costs of coping after flood events are much more significant. These costs relate to
house repair after flood damage. Although the value lost by flood damage has already been
estimated as an infrastructure cost, an additional cost is incurred by the owner in making good
that damage: the situation is analogous to the negative gross margin incurred as a result of
losing both the crop and the inputs required to grow that crop up to the point of destruction.
Only damaged houses are repaired, destroyed houses are replaced through re-settlement
measures already costed (see paragraph 46. Repairing damage is assumed to cost about 10%
of depreciated house value for a house sustaining <25% damage and 25% of depreciated
house value for a house sustaining >25% damage.
97. Repairing in-field infrastructure after a flood event is a significant cost to be added to
the loss of crop production and operating costs. Paddy bunds must be re-made (40 person
days per ha), water points for both irrigation and water supply repaired (ten days per ha), cattle
sheds re-constructed (ten days per unit) and areas affected by sedimentation reclaimed (200
days per ha). By far the greatest cost is the repair of paddy bunds and land reclamation.
98. The cost of labor is the opportunity cost of paddy cultivation without flood impact as
calculated in the gross margin (see Table 15: ). This is quite high, but reasonable if most
households are owner-occupiers of land rather than hired laborers.
99. Indirect coping costs are also incurred within post-flood food markets. It is well known
that the price of staples rises in flood-affected areas as crop losses are substituted for by food
purchases; demand for food rises and supply falls. The situation can be analyzed with
reference to The Food Balance Sheet for Nepal, FAO 2011, available from FAOStat. Table
27: shows the average food supply consumed per person per year in 2011, which provided
2,530 kcals per capita per day. This diet would cost about NPR 170 per capita per day in 2015
prices if all food were purchased in markets reported in the Agricultural Yearbook 2010/11.

WRPPF-Package 3: Flood Hazard Mapping & Preliminary Preparation of Risk Management Projects 38 Final Report May 2016
Volume 4: Appendix F Lahmeyer International in association with Total Management Services
Table 27: Summarised Food Budget Per Capita
Item
Food '000 tons
Food supply quantity
(kg/capita/yr)
% of food
supply
Food supply (kcal/capita/day)
Rs/kg (2010/11),
Agric Yrbook Tab 9.1
Rs/kg 2015
(inflated with CPI)
Food supply quantity
(kg/capita/day)
Cost of
daily diet 2015
Cereals 5,066 186.6 33% 1609 35 49 0.51 25
Roots 2,176 80.1 14% 150 100 139 0.22 30
Sugar 961 35.4 6% 28 83 116 0.10 11
Pulses 288 10.6 2% 92 104 145 0.03 4
Nuts 53 2.0 0% 13 - 0.01 -
Oilseeds 20 0.7 0% 5 69 96 0.00 0
Vegetable oils 273 10.1 2% 243 133 185 0.03 5
Vegetables 3,048 112.2 20% 74 110 153 0.31 47
Fruit 1,460 53.8 10% 65 120 167 0.15 25
Stimulants 11 0.4 0% 1 - 0.00 -
Spices 167 6.2 1% 57 - 0.02 -
Beverages 48 1.8 0% 4 - 0.00 -
Meat 330 12.2 2% 44 225 313 0.03 10
Butter/ghee 39 1.4 0% 34 456 634 0.00 2
Eggs (kg) 31 1.1 0% 4 155 216 0.00 1
Milk (kg) 1,348 49.6 9% 103 40 55 0.14 7
564.2 2,526 169
100. This estimate can be used to calculate the amount of food stuff required per capita per
year in crop equivalent, allowing for processing, feed, seed and waste. The figure of most
interest is the annual requirement of 315 kg of cereal per person; in the study area most of this
will be obtained as paddy. The amount of paddy produced with flood is known (see Table 20:)
as well as the displaced population (see Table 10). The incremental demand for paddy by the
displaced will increase the price of paddy depending on the price elasticity of demand, which
for a staple food is very low. One could imagine that for every 1% increase in demand price
will increase by 1%. The paddy price will therefore increase in direct ratio to the increase in
demand as a result of a flood event. This might be only 1-2% for floods with a return period of
1:2yr and 1:5yr, but for a 1:50yr prices might rise by 15%. Whatever the price increase, it must
be borne by the flood-affected population. A similar calculation could be done for the supply
and demand of other food crops if they were grown in the flood-affected area.

WRPPF-Package 3: Flood Hazard Mapping & Preliminary Preparation of Risk Management Projects 39 Final Report May 2016
Volume 4: Appendix F Lahmeyer International in association with Total Management Services
Table 28: Estimate of Crop Production Required to meet Annual Dietary requirement
Item
Amount required for per
annum kg per capita
Adjustment Ratio
Kg of raw product
per annum per capita
Cereals 187 paddy milling ratio 169% 315.4
Roots 80 feed/seed/waste 129% 103.3
Sugar 35 8 kg gur per 100kg cane 8% 442.5
Pulses 11 feed/seed/waste 129% 13.7
Nuts 2 feed/seed/waste 129% 2.6
Oilseeds 1 feed/seed/waste 129% 0.9
Vegetable oils 10 35 kg from 100 kg seed 286% 28.9
Vegetables 112 feed/seed/waste 129% 144.7
Fruit 54 feed/seed/waste 129% 69.4
Stimulants 0 -
Spices 6 -
Beverages 2 -
Meat 12 waste and by products 129% 15.7
Butter/ghee 1 waste and by products 129% 1.8
Eggs (kg) 1 Waste 129% 1.4
Milk (kg) 50 Waste 129% 64.0
101. A summary of flood prevention and coping costs without and with project is given in
Table 29: and Table 30: and expressed on a flood damage curve in Figure 9:.
Table 29: Without-project Direct and Indirect Costs of Flood Prevention and Coping
Item Unit Flood with Return Period
50% 20% 10% 4% 2% 1%
Costs of flood prevention NPR m 1.07 2.45 2.49 3.20 4.33 4.87
Costs of flood coping
Repair of housing NPR m 0.50 22.49 29.69 50.85 93.61 160.90
Repair of paddy bunds and field structures NPR m 1.51 5.38 6.12 9.18 11.28 13.14
Repair of water points NPR m 0.57 1.92 2.01 2.73 3.74 4.33
Repair of cattle sheds NPR m 0.01 0.27 0.36 0.62 1.14 1.96
Repair of miscellaneous NPR m 0.01 0.27 0.36 0.62 1.14 1.96
Areas affected by sedimentation NPR m 0.01 0.02 0.02 0.03 0.04 0.04
Reclamation of sedimentation areas NPR m 0.75 2.69 3.06 4.59 5.64 6.57
Increased expenditure in food markets NPR m 0.00 0.25 0.41 1.95 7.12 24.76
Total NPR m 4.41 35.74 44.53 73.76 128.03 218.53

WRPPF-Package 3: Flood Hazard Mapping & Preliminary Preparation of Risk Management Projects 40 Final Report May 2016
Volume 4: Appendix F Lahmeyer International in association with Total Management Services
Table 30: With-project Direct and Indirect Costs of Flood Prevention and Coping
Item Unit Flood with Return Period
50% 20% 10% 4% 2% 1%
Costs of flood prevention NPR m 0.49 1.47 1.47 1.97 2.81 3.18
Costs of flood coping
Repair of housing NPR m 0.37 16.64 21.97 37.63 69.27 119.07
Repair of paddy bunds and field structures NPR m 0.97 3.48 3.90 5.67 7.13 8.27
Repair of water points NPR m 0.42 1.42 1.49 2.02 2.77 3.20
Repair of cattle sheds NPR m 0.00 0.20 0.27 0.46 0.84 1.45
Repair of miscellaneous NPR m 0.00 0.20 0.27 0.46 0.84 1.45
Areas affected by sedimentation NPR m 0.00 0.01 0.01 0.02 0.02 0.03
Reclamation of sedimentation areas NPR m 0.49 1.74 1.95 2.83 3.57 4.14
Increased expenditure in food markets NPR m 0.00 0.29 0.49 1.81 6.14 19.04
Total NPR m 2.74 25.46 31.81 52.86 93.40 159.82
Figure 9: Flood Damage Curve Prevention and Coping Costs
102. All these costs are flood dependent and the annual probability of loss must be
calculated in the usual way (see paragraph 56) and an adjustment made for the expected
increased economic activity over time as the population increases (see paragraph 58). A
summary of the input to the cost-benefit analysis (see Table 32:) is given in Table 31:.
-
50,00
100,00
150,00
200,00
250,00
2 5 10 25 50 100
To
tal
nu
mb
er
of
pe
op
le k
ille
d,
mis
sin
g a
nd
in
jure
d
Flood return period
Direct and Indirect Losses from Floods With
and Without-project: Prevention and Coping
Without project cost of
present prevention and
coping
With project cost of present
coping and prevention

WRPPF-Package 3: Flood Hazard Mapping & Preliminary Preparation of Risk Management Projects 41 Final Report May 2016
Volume 4: Appendix F Lahmeyer International in association with Total Management Services
Table 31: Processed Without and With-project Direct and Indirect Costs: Prevention and Coping
Flood envelopes
APL INCREMENTAL
APL
2 5 10 25 50 100
50% 20% 10% 4% 2% 1%
Without project cost of present prevention and coping
NPR m 4.41 35.74 44.53 73.76 128.03 218.53 42.04
With project cost of present coping and prevention
NPR m 2.7 25.5 31.8 52.9 93.4 159.8 29.84 12.20
Without project cost of present and future prevention and coping
NPR m 8.81 71.48 89.06 147.53 256.07 437.05 84.08
With project cost of present and future coping and prevention
NPR m 5.5 50.9 63.6 105.7 186.8 319.6 59.68 24.40
103. This Final Report includes an estimate of benefits with-project from riverside plantations
for timber and firewood. This project component was not considered at draft final stage and is
now included at the request of DWIDP. DWIDP have asked the Consultant to assume riverside
plantations of 100 ha at each of the six project sites. DWIDP estimates an annual benefit of
NPR 20,000 per annum per ha or NPR 2 million per annum. The Consultants have used the
DWIDP benefit estimate and allowed for nursery, planting and maintenance cost and the
development of woody biomass yield over the life of the project. The benefit stream from
riverside plantations has been incorporated into the CBA as a direct annual benefit.

WRPPF-Package 3: Flood Hazard Mapping & Preliminary Preparation of Risk Management Projects 42 Final Report May 2016
Volume 4: Appendix F Lahmeyer International in association with Total Management Services
VII. CBA WITH IMPACT OF CLIMATE CHANGE
A. CBA in Financial Prices
104. The ToR require that the impact of climate change on flood management investment
proposals be evaluated. This requires estimating equivalent probabilities of future floods from
the probability of historical floods and substituting them in the APL calculation. A suitable
equation to relate the two probability curves has been defined in the hydrological studies for
Mawa Ratuwa Basin as:
CC Return period = 0.763 (Historical Return period)^0.941
105. As a result of applying this equation to historical return periods, floods with defined past
probability will be estimated to occur more frequently in the future. There is however an issue
with curve-fitting for floods with a higher probability than 50%, which are expected to recur less
frequently. This CBA, which is concerned with estimating the impact of floods with a lower
probability than 50%, ignores this anomaly.
106. Information is also given from the hydrological studies on the characteristics of floods
that will occur in the future with the probability of 1 in 2 year, 1 in 5 year …etc. Floods with defined past probability will be estimated to occur more frequently in the future but they will
also be more aggressive. This analysis therefore must: (i) substitute the new probabilities of
floods with climate change into the APL equation (as described in paragraph 56) and (ii) revise
direct losses (both without and with-project) on the basis of the new flood envelope
characteristics for future floods with climate change. The general model has two switches to
do this: one to activate the new probabilities and one to activate the new flood characteristics.
Combining increased probability of floods with increased flood aggression leads to the CBA
results shown in Table 32:32 and Table 36 in financial and economic prices respectively.
107. Note that taking into account the increased aggression and periodicity of floods with
climate change, the casualty rate increases by 113%. This is because of the increased
population affected by floods (vulnerability) as well as the increased area, aggression and
periodicity (risk) of floods.
108. It is also necessary to review future crop yields with-climate change; this has not been
done and should be a matter for the feasibility study.
109. Incremental avoided direct losses (without-project and with-project) and indirect project
benefits with the investment and maintenance cost are compiled in Table 32: which shows the
CBA using the benefits calculated in the preceding sections matched to the costs of the
proposed flood management project (NPR 1,187.43 m). Prices are in constant 2015 financial
NPR million.
110. The length of embankment proposed at Mawa Ratua is 21 km and it has been assumed
this will be constructed over a period of two years and expected to have a life of 25 years.
Scheduling of investment costs and benefits is important, given the heavy discounting of future
benefits by (i) adjusting for APL and (ii) discounting with the assumed social discount rate of
10%. Up-front costs will be given a higher weighting than downstream benefits.

WRPPF-Package 3: Flood Hazard Mapping & Preliminary Preparation of Risk Management Projects 43 Final Report May 2016
Volume 4: Appendix F Lahmeyer International in association with Total Management Services
111. The Management, Operation and Maintenance (MOM) cost is assumed to be 1% of
investment costs, following DWIDP directions. In practice MOM would be carried out on an “as needed” basis.
112. The embankment is designed to protect 1,502 ha from the impact of a 1:50 year flood
taking into account climate change. In practice engineers consider that the freeboard
allowance would protect a greater area from a 1:100 year flood taking into account climate
change. It follows that the area subjected to a historical flood of the same magnitude would
also be protected. For this reason benefits include protection of the area up to the extent of the
1:100 year flood envelope for both historical floods and predicted floods taking into account
climate change.
113. It is interesting to look at the composition of benefits. Indirect benefits from
infrastructure protection are similar in magnitude to avoided direct losses. In addition some of
the benefits of coping strategies are indirect, even though they are linked to magnitude of flood,
e.g. costs arising from increased food prices. This is intuitively reasonable in an area with few
assets to speak of and some development potential.
114. Benefits from avoided casualties are expressed as persons “saved”, which is more transparent (and more methodologically and philosophically defendable) than expressing
saved casualties in value terms. Mawa Ratuwa is a relatively large project and is expected to
save about 67 casualties (most of which would be fatalities) during the 25 year life of the
project.
115. Trans-boundary issues (i.e. impacts on the other side of the international border with
India below the basin modeled area) are not included in the CBA. This should be handled at
feasibility level.

WRPPF-Package 3: Flood Hazard Mapping & Preliminary Preparation of Risk Management Projects 44 Final Report May 2016
Volume 4: Appendix F Lahmeyer International in association with Total Management Services
Table 32: Cost: Benefit Analysis – Floods with Climate Change: Constant 2015 Financial Prices, NPR million

WRPPF-Package 3: Flood Hazard Mapping & Preliminary Preparation of Risk Management Projects 45 Final Report May 2016
Volume 4: Appendix F Lahmeyer International in association with Total Management Services
B. CBA in Economic Prices
116. The shadow exchange rate (SER) is the economic price of foreign currency and
shadow exchange rate factor (SERF) is the conversion rate of officially valued currency to
economically valued currency. Both are used in economic cost benefit analysis to re-value
traded goods to a commensurate economic value with non-traded goods (shadow
exchange rate approach, as used in this analysis) or to estimate the closely related
standard conversion factor (SCF) which is used to adjust the financial value of non-traded
goods (the conversion factor approach) to value them equivalently to traded goods. Either
method eliminates the effect of the premium paid on traded goods over non-traded goods
through national trade policy, where imports are normally taxed and exports are
sometimes (though rarely) subsidised.Table 33: shows these estimates for Nepal for the
period 2009/10 - 2013/14.
117. The calculation rests on identifying the proportion of import duties and tariffs as a
percentage of imports. Exports are treated similarly. Trade elasticities are used to perform
the final part of the calculation and provide weights for the relative importance of imports
and exports depending on consumer preference in the economy. Trade elasticities are
derived from macro-economic studies: a reference is quoted.
118. The result for 2014/15 is a SCF of 0.92, a SERF of 1.09 and a SER of NRP 107
per US$. There is no obvious change in the estimates of SERF and SCF during the last
five years.

WRPPF-Package 3: Flood Hazard Mapping & Preliminary Preparation of Risk Management Projects 46 Final Report May 2016
Volume 4: Appendix F Lahmeyer International in association with Total Management Services
Table 33: Estimate of SER, SERF and SCF for Nepal, 2010-2015
Items Variables/Equations Source Comments Unit 2010/11 2011/12 2012/13 2013/14 2014/15
Total imports M 1/ Nepal Foreign Trade Statistics 2071/72 CIF, converted from US$ at OER
million
390,300
506,700
613,600
716,100
786,200 Special transactions SM no data million Other nonresponsive imports NM negligible million
Net Imports dM=M-SM-NM million
390,300
506,700
613,600
716,100
786,200
Total exports X Nepal Foreign Trade Statistics 2071/72 FOB, converted from US$ at OER
million 62,700 72,100 77,400 89,600 85,200
Special transactions SX no data million Reexports RX no data million Other nonresponsive goods NX no data million Net exports dX=X-SX-RX-NX million 62,700 72,100 77,400 89,600 85,200
Trade deficit dQ=dM-dX million
327,600
434,600
536,200
626,500
701,000 Import tariffs IT Budget Speeches (FY 2014/15 to 2001/02), MinFin million 34,314 40,906 54,328 64,122 70,487 Net tariff equivalent of Quantitative Restrictions (QR)
TR not applicable: zero million
Import tariff rate tm=(IT+TR)/dM 8.8% 8.1% 8.9% 9.0% 9.0% Export taxes XT Budget Speeches (FY 2014/15 to 2001/02), MinFin million 1,399 2,485 2,604 3,859 5,718 Net tax equivalent of QRs XX not applicable: zero million Export subsidies XS not applicable: zero million Export tax rate tx=(XT+XX-XS)/dX 0.4% 0.6% 0.5% 0.6% 0.8% Elasticity of supply (exports) es Tokarick (2010) 2/ 0.52 0.52 0.52 0.52 0.52 Elasticity of demand (imports) ed Tokarick (2010) 2/ -1.23 -1.23 -1.23 -1.23 -1.23 Weight on supply Ws=es/[es-{ed*(dM/dX}] 0.0636 0.0567 0.0506 0.0502 0.0438
Weight on demand Wd=-{ed*(dM/dX)} / [es -{ed*(dM/dX)}]
0.9364 0.9433 0.9494 0.9498 0.9562
Official exchange rate OER IMF3/ local /US$ 75 72 81 88 98 Using Official Exchange Rate
Shadow exchange rate SER = Ws*OER*(1-tx) + Wd*OER*(1+tm)
local /US$ 81 77 88 95 107
Shadow exchange rate factor SERF = SER/OER 1.08 1.08 1.08 1.08 1.09
Standard conversion factor SCF = OER/SER 0.92 0.93 0.92 0.92 0.92
Sources
1/ http://www.customs.gov.np/en/annual.html
2/ Country calculations from A Method for Calculating Export Supply and Import Demand Elasticities, Stephen Tokarick, IMF Working Paper 2010
3/ International Monetary Fund, World Economic Outlook Database, April 2015

WRPPF-Package 3: Flood Hazard Mapping & Preliminary Preparation of Risk Management Projects 47 Final Report May 2016
Volume 4: Appendix F Lahmeyer International in association with Total Management Services
119. The recent ADB PPTA Innovation for More Food with Less Water (ADB TA 7967-
REG) estimated a Shadow Wage Rate Factor (SWRF) of 0.8. The SWRF is intended to
account for the opportunity cost of labour and was adopted in this study without criticism,
though local variation can be expected in the SWRF depending on in and out-migration;
at feasibility stage a suitable estimate would have to be made for each Priority Basin.
120. A tabulated estimate for a conversion factor for investment costs for flood
protection works has been deleted from this Final Report (costs changed significantly). It
was based on the Engineer’s original BoQ. The estimate suggests that, after increasing
foreign costs by the SERF to allow for the foreign exchange premium, eliminating transfer
costs and price contingencies, deducting taxes and adjusting by the SWRF, the economic
cost of flood protection is lower than its financial cost. Note that the economic cost estimate
does not include land compensation and resettlement costs. These are transfer costs and
are not to be included in the economic price. The conversion factor for civil works at Mawa
Ratuwa is about 0.86.
121. A conversion factor for maintenance was been estimated separately.
122. A conversion factor was not available for housing and public infrastructure.
Probably much house construction is done exclusive of tax, the unskilled labour
component is high and mostly local materials (stone, brick, bamboo and wood) are used
in construction. A conversion factor of 1 was used. The factor chosen is in fact critical to
the value of economic benefits from the project, given that a substantial proportion of
avoided losses with-project relate to local housing. Conversion factors for public
infrastructure are also estimates.
123. Economic valuation of rice cultivation was done in the study Building Climate
Resilience of Watersheds in Mountain Eco-Regions Project TA 7883-NEP, 2012, though
the study is now dated. The main issue is the conversion factor for paddy rice: 1.25, based
on import parity price assessment. This seems high and up-dating is required, see Table
34:. The conversion factor for the value of paddy rice adopted is 1.0. The choice of this
factor is also important for the value of economic benefits.

WRPPF-Package 3: Flood Hazard Mapping & Preliminary Preparation of Risk Management Projects 48 Final Report May 2016
Volume 4: Appendix F Lahmeyer International in association with Total Management Services
Table 34: Import Parity Price for Rice
Item Financial Economic
India Long grain parboiled rice 25% broken, Bihar State FOB 1/ 325 325
Quality adjustment -0.025% -8 -8
Freight and insurance 15 15
cif Terai Cities, US$ 332 332
cif Terai Cities OER NPR 103 to US$ 34,183
cif Terai Cities SER NPR 106.09 2/ 35,209
Add Import duty at 0.1 3/ 3,418
37,601 35,209
Add Handling and storage at 0.06 2,256 2,324
Add transport cost, 50 km, NPR 10 per km/ton 500 515
40,358 38,047
Deduct costs from Farm gate: comprising: 16,870 16,924
Threshing, bagging and storage (included in gross margin) - -
Transport farm to market 5/ 1,000 1,030
Milling ratio, 67% 14,070 14,070
Milling cost, NPR 1.00 per kg of paddy 4/ 1,000 1,000
Item Financial Economic
Mill gate to wholesale 800 824
Import parity at farm gate 23,488 21,123
Farm gate price (threshed and bagged paddy) 21,000 21,000
Conversion 101%
1/ http://www.riceauthority.com/prices/
2/ SERF is assumed to be 1.03
3/ http://www.customs.gov.np/upload/documents/HS%202072_20150915105900.73(2015
4/ Milling price assumed to be NPR 1.00 per kg. It is assumed no VAT is payable on rice milling
5/ Transport cost of NPR10/ton/km is assumed
124. A summary of the economic conversion factors used are given in Table 35:.
Table 35: Economic Conversion Factors for Costs and Benefits of Flood Management Project
Item Economic Financial
Exchange Rate (ER) at beginning November 2015 (US$ 1= NPR) 106.00
Shadow Exchange Rate (SER) at end January 2014 107.00
Shadow Exchange Rate Factor (SERF) 1.09
Standard Conversion Factor (SCF)1/ 0.92
Shadow Wage Rate Factor (SWRF)1/ 0.80 1.00
Civil works
Investment costs 0.86 1.00
Maintenance costs 0.86 1.00
Housing

WRPPF-Package 3: Flood Hazard Mapping & Preliminary Preparation of Risk Management Projects 49 Final Report May 2016
Volume 4: Appendix F Lahmeyer International in association with Total Management Services
Item Economic Financial
Class 1 1.00 1.00
Class 2 1.00 1.00
Class 3 1.00 1.00
Class 4 1.00 1.00
Emergency relief 1.00 1.00
Rehousing 1.00 1.00
Land acquisition 1.00 1.00
Infrastructure
Pukka roads 1.00 1.00
Katcha roads 1.00 1.00
Bridges adequate for motors 1.00 1.00
Power lines 1.00 1.00
Telephone lines 1.00 1.00
Paddy Cultivation 2/
Nursery costs
Seed 0.91 1.00
Fertiliser & crop protection 0.91 1.00
Tools, pump set 0.91 1.00
Labour 0.80 1.00
Planting/Transplanting
Tools, sprayer 0.91 1.00
Labour 0.80 1.00
Cultivation
DAP 0.95 1.00
Urea 0.94 1.00
Potash 1.21 1.00
Crop protection & capital charge 0.97 1.00
Labour for cultivation 0.80 1.00
Ox cultivation 0.91 1.00
Mechanical cultivation 0.91 1.00
Labour for harvest 0.80 1.00
Materials for harvest 1.00 1.00
Land and water charges 1.00 1.00
Paddy Rice 1.00 1.00
Rice straw 0.91 1.00
Funeral costs 1.00 1.00
Medical costs 0.91 1.00
Cattle 1.00 1.00
Sheep and goats 1.00 1.00
Pigs 1.00 1.00
Poultry 1.00 1.00
1. Note: SCF and SWRF is based on 2014 review undertaken by Innovation for More Food with Less Water ADB TA 7967-REG.
2/ Economic prices for Paddy cultivation from taken from Building Climate Resilience of Watersheds in Mountain Eco-Regions Project TA 7883-NEP, 2012
125. Applying these coefficients results in the CBA expressed in constant 2015
economic NPR million, see Table 36.

WRPPF-Package 3: Flood Hazard Mapping & Preliminary Preparation of Risk Management Projects 50 Final Report May 2016
Volume 4: Appendix F Lahmeyer International in association with Total Management Services
Table 36: Cost-Benefit Analysis – Floods with Climate Change: Constant 2015 Economic NPR million

WRPPF-Package 3: Flood Hazard Mapping & Preliminary Preparation of Risk Management Projects 51 Final Report May 2016
Volume 4: Appendix F Lahmeyer International in association with Total Management Services
VIII. RESULTS AND SENSITIVITY ANALYSIS OF THE CBA
A. Summary of the Financial and Economic Indicators
126. The Table below summarizes the key indicators in both financial and economic
prices using predicted floods with climate change.
Table 37: Financial and Economic Indicators: Mawa Ratuwa
Financial Economic
NPV -130.85 44.69
IRR 9% 11%
BCR 0.88 1.05
127. The economic value of NPV is positive, indicating that the present value of the net
income from the project exceeds the costs. Economic IRR exceeds the discount rate: IRR
represents the rate of interest that drives the value of the NPV to zero, so this means the
project is achieving a rate of return higher than the required rate of 10%. Benefit: Cost
Ratio is the ratio between the discounted (using the adopted discount rate) stream of costs
and the stream of benefits over the project life. The BCR greater than unity implies the
present value of future benefits is greater than the present cost of implementation. In
economic terms the project is (only just) viable.
128. There is a marked difference between project indicators derived from historical
flood data and derived from flood data estimated with climate change. This is partly
explained by the expected increase in flood area and FHR with climate change for a given
return period, but mostly due to the increase in probability of occurrence of a flood of given
return period: for example a flood that historically occurred once every 50 years might be
expected to occur once in every 30 years in the future. It is necessary to remark that the
project is neither financially nor economically viable if historic flood probabilities are used
to calculate APL.
129. At pre-feasibility level it can be concluded that the project as proposed is
economically viable, but the risk attached to measurement of benefits (and the probability
of future floods with climate change) is significant: benefits may be greater or lesser than
those estimated.

WRPPF-Package 3: Flood Hazard Mapping & Preliminary Preparation of Risk Management Projects 52 Final Report May 2016
Volume 4: Appendix F Lahmeyer International in association with Total Management Services
B. Sensitivity Analysis
130. Switching values (the change in costs and benefits required to return an NPV of
zero) have been calculated in economic prices using historical flood data. Benefits would
have to be reduced to 96% of estimated levels and costs increased by 105% to return an
NPV of zero. These are small margins of confidence.
131. Sensitivity analysis was considered necessary to test the assumptions made on
the resilience of houses and crops to the FHR. There is no empirical data available to
match vulnerability with flood risk, so the assumptions need to be tested. The easiest way
to do this is to adjust the FHR – not that the rating itself, which is based on risk, is in doubt
but because an increase or decrease in the rating simulates a change in the estimate of
vulnerability of infrastructure and crops. If the rating is adjusted but avoided loss changes
little then it is possible that vulnerability has been wrongly estimated. Table 38: suggests
some sensitivity: a 120% increase in both area and structure ratings will raise the IRR by
a couple of points. This indicates that if the FHR is increased than project economic IRR
also increases: the more aggressive the flooding, then the greater the benefit from
protecting the land. This is obviously the result hoped for.
Table 38: Impact of Change in FHR on Economic IRR
Weighted Flood Hazard Area Rating %
change
IRR= 11% 120% 110% 100% 90% 80%
Flo
od
Hazard
S
tructu
re
Rating %
120% 13% 12% 11% 16% 9%
110% 13% 12% 11% 16% 9%
100% 12% 11% 11% 15% 8%
90% 12% 11% 10% 15% 8%
80% 12% 11% 10% 15% 8%
132. A sensitivity analysis can also be carried out to investigate the effect of the
proportion of the area of the flood envelope impacted by flood events of different
magnitude. The data suggest for example that a relatively small proportion of the 1 in 5
year flood envelope is reported as damaged during a 1 in 5 year event; for events of
greater return periods this proportion rapidly increases. See paragraphs 22. Again, the
IRR is moderately sensitive to the area of flood impact estimated for floods of different
periodicities. The correct estimate of the affected area, which is difficult, is important for
an accurate estimate of IRR. But even quite large reductions of the affected area still return
a positive IRR, and the IRR increases strongly if the affected area is under-estimated.
Table 39: Impact of Change in Houses and Agricultural Area Affected on Economic IRR
Total buildings affected, % change
120% 110% 100% 90% 80%
Agricu
ltura
l are
a a
ffecte
d,
% c
hang
e 120% 13% 12% 12% 12% 12%
110% 12% 12% 11% 11% 11%
100% 11% 11% 11% 10% 10%
90% 10% 10% 10% 9% 9%
80% 9% 9% 9% 8% 8%

WRPPF-Package 3: Flood Hazard Mapping & Preliminary Preparation of Risk Management Projects 53 Final Report May 2016
Volume 4: Appendix F Lahmeyer International in association with Total Management Services
133. Data analysis (see Figure 1 and associated text) showed that not all houses in an
affected area were damaged/destroyed by a flood event commensurate with the predicted
size of its envelope. For frequently returning floods, only a small proportion is likely to be
affected, whereas for more infrequent floods a much higher proportion suffer damage. But
the data to demonstrate this effect is very weak. The proportion can be combined in a data
table with the number of total buildings affected, see Table 40:. The sensitivity analysis
shows that an 80% reduction in the estimate of buildings damaged or affected by a given
flood event will not reduce the IRR to an unacceptable level (so long as the total buildings
are well estimated), so the project indicator is fairly resilient to weaknesses in the data
used.
Table 40: Impact of Change of Houses Affected on Economic IRR
Total buildings affected, % change
120% 110% 100% 90% 80%
Affecte
d
build
ings
dam
age
d, %
change
120% 13% 13% 12% 12% 11%
110% 13% 12% 11% 11% 10%
100% 12% 11% 11% 10% 9%
90% 11% 10% 10% 9% 9%
80% 10% 9% 9% 8% 8%
134. Sensitivity analysis is also available for the impact on the amount of public
infrastructure affected by floods of different return periods and the amount spent on repair
of damaged houses after flood events. The results of the cost-benefit analysis do not
appear to be very sensitive to the former and insensitive to the latter.
135. The reduction in the casualty rate at Mawa Ratuwa as a result of the project is
obviously very sensitive to the mortality and morbidity rates estimated (see section IV).
The rates are derived from a much larger data set and can only be indicative for the project
area. The reduction in casualties is also dependent on the population living on the flood
plain. While the latest census is recent, it was conducted by ward, not by geophysical area
and considerable manipulation of data was required to establish the floodplain population
(see section B). A feasibility study would establish this population more accurately.
136. The assumption made on the future growth of housing and infrastructure in the
area of flood management was found to be important (see paragraph 58) to project return.
This suggests that for a greater impact of the project itself, attention should be paid to
other aspects of development in the project area, for example ensuring that improvements
in public infrastructure are targeted to the project area to encourage settlement and
development.

WRPPF-Package 3: Flood Hazard Mapping & Preliminary Preparation of Risk Management Projects 54 Final Report May 2016
Volume 4: Appendix F Lahmeyer International in association with Total Management Services
C. Poverty
137. The flood management project proposed can be assumed to be pro-poor, even
from the general data gathered during a pre-feasibility study. It is likely to target
beneficiaries that have marginalized themselves to relatively high-risk areas in order to
gain access to resources, particularly land, that they cannot obtain elsewhere. The
evidence for this is (i) the apparent substantial growth on flood plains over the last 20 years
of housing and agricultural land use (see paragraph 15 and 16) and (ii) the probability
that housing is of lower quality on the flood plain areas than elsewhere (see paragraphs
32 to 35).
138. If this is so, the project is not so much about protection of existing assets, which
are expected to be relatively low, but about encouraging growth of assets of the beneficiary
group. The cost-benefit analysis suggests that indirect benefits are an important
component of total project benefits; these are benefits not directly connected with flood
events but realized through market mechanisms as a result of project investment.
139. If the generation of indirect benefits is important to project success, then this
implies that flood proofing is necessary to allow the development of fixed assets. While
support to existing coping mechanisms is laudable and relatively cheap (for example Early
Warning Systems) these tend to reduce direct costs of flooding rather than increase fixed
assets of the poor. Improving coping mechanisms saves lives and movable assets but do
not get people out of the vicious cycle of poverty that causes them to live on flood plains
in the first place.
140. Following the argument that any project in flood-prone areas will be pro-poor,
because the poorest are marginalized into living in high-risk areas, NPV and IRR only have
to be demonstrated to be greater than 0 and the discount rate respectively. In this respect
the proposed project at Mawa Ratuwa performs adequately in economic terms at pre-
feasibility level. There is no hesitation in recommending further study at feasibility level as
a necessary stage in future implementation.

WRPPF-Package 3: Flood Hazard Mapping & Preliminary Preparation of Risk Management Projects 55 Final Report May 2016
Volume 4: Appendix F Lahmeyer International in association with Total Management Services
Table 41: Mawa Ratuwa Priority Basin Historical Flood Damage Data 1992-2015
SOURCED FROM MOHA/DWIDP RECORDS
District-VDC VDC area in
basins, ha basin 1 basin
2 Place Flood date Duration
(Days) Dead
People Missing People
Injured People
Affected People
Affected households
Destroyed Houses
Damaged Houses
Sheds destroyed
Persons Evacuated
Affected Routes
(m)
Farming and
Forest affected
(Ha)
Land lost ha
Livestock Death
JHAPA-DAMAK MUNICIPALITY 7,065 Ratua - Ward no-13.
14 September
1991 3 0 0 0 73 13 0 0 0 3.4 0
JHAPA-DAMAK MUNICIPALITY 7,065 Ratua - Dudhe Khola
15 September
1991 0 0 0 0 22 4 0 0 0 5.4 0
JHAPA-DAMAK MUNICIPALITY 7,065 Ratua - Birtachowk-13 20 July 1993 0 0 0 0 76 4 0 0 0 0 0
JHAPA-DAMAK MUNICIPALITY 7,065 Ratua -
WardNo:1,3,5,12, 13, 19,20.
10 September
1993 0 0 0 0 1134 24 0 0 0 135 0
JHAPA-DAMAK MUNICIPALITY 7,065 Ratua -
04 June 1995 0 0 0 4 0 0 0 0 0 54 0
14 July 1996 3 5532 431 214 653
JHAPA-DAMAK MUNICIPALITY 7,065 Ratua - Golatar basti-7 14 July 1996 0 0 0 0 0 13 0 0 0 13 0
JHAPA-LAKHANPUR 2,632 Ratua - ward-5 02 July 1999 0 0 0 0 0 0 0 0 0 68 0
JHAPA-LAKHANPUR 2,632 Ratua - Likhuwa 03 July 1999 0 0 0 0 0 10 0 0 0 0 7 0
JHAPA-DAMAK MUNICIPALITY 7,065 Ratua -
25 August 1999 0 0 0 0 0 0 25 0 0 3 0
JHAPA-KOHABARA 3,624 Ratua -
25 August 1999 0 1 0 0 0 0 0 0 0 0 0
JHAPA-LAKHANPUR 2,632 Ratua - 28 July 2000 0 0 0 0 210 0 0 0 0 240 0
JHAPA-DAMAK MUNICIPALITY 7,065 Ratua -
06 August 2000 0 0 0 0 0 60 6 0 0 0 0
JHAPA-DAMAK MUNICIPALITY 7,065 Ratua -
06 August 2000 0 0 0 0 0 0 11 0 0 0 0
JHAPA-KOHABARA 3,624 Ratua - ward no-1,2,3,8,4
06 August 2000 0 0 0 0 0 200 98 0 0 0 0
ILAM-CHULACHULI 6,857 Kamal Ratua
09 August 2000 0 0 0 0 248 6 0 0 0 0 16
MORANG-RAJGHAT 3,337 Ratua - 24 July 2002 0 0 0 0 540 3 0 16 0 0 0
JHAPA-LAKHANPUR 2,632 Ratua - ward-1, 2, 5, 6 26 July 2002 0 0 0 0 135 3 0 0 0 30 0
MORANG-ITAHARA 3,632 Bakraha Ratua 27 July 2002 0 0 0 0 0 0 0 0 0 9 0
MORANG-MAHADEVA 1,025 Ratua - 27 July 2002 0 0 0 0 0 0 0 0 0 6 0
MORANG-RAJGHAT 3,337 Ratua - ward-2, 3, 5 27 July 2002 0 0 0 0 65 3 0 16 0 44 0

WRPPF-Package 3: Flood Hazard Mapping & Preliminary Preparation of Risk Management Projects 56 Final Report May 2016
Volume 4: Appendix F Lahmeyer International in association with Total Management Services
District-VDC VDC area in basins, ha
basin 1 basin 2
Place Flood date Duration (Days)
Dead People
Missing People
Injured People
Affected People
Affected households
Destroyed Houses
Damaged Houses
Sheds destroyed
Persons Evacuated
Affected Routes
(m)
Farming and
Forest affected
(Ha)
Land lost ha
Livestock Death
MORANG-ITAHARA 3,632 Bakraha Ratua 27 July 2002 0 0 0 0 0 0 0 0 0 9 0
MORANG-RAJGHAT 3,337 Ratua - ward-6 29 July 2002 0 1 0 0 0 0 0 0 0 0 0
JHAPA-KOHABARA 3,624 Ratua -
21 August 2002 0 0 0 0 340 0 0 0 0 81.26 0
JHAPA-DAMAK MUNICIPALITY 7,065 Ratua -
Ward no. 1,11,15,16. 07 July 2004 4 0 0 0 0 0 0 0 0 0 0
JHAPA-GAURADAHA 60 Ratua - Ward no. 2 09 July 2004 1 0 0 0 0 0 0 0 0 0
JHAPA-DAMAK MUNICIPALITY 7,065 Ratua -
Ward no. 1, 3, 5, 10, 13, 17, 18, 19
07 August 2005 0 0 0 655 98 0 85 0 135 15
JHAPA-DAMAK MUNICIPALITY 7,065 Ratua - Ratuwa khola 16 July 2008 0 0 0 65 0 1 0 0 0 0
JHAPA-KOHABARA 3,624 Ratua - 22 July 2008 1 0 0 22 0 4 0 0 0 0
JHAPA-KOHABARA 3,624 Ratua - Ward No. 2,3,5
16 August 2009 0 0 0 65 0 12 0 0 0 0
JHAPA-DAMAK MUNICIPALITY 7,065 Ratua - Ward No.5,12
25 August 2009 3 0 0 0 0 0 0 0 0 0
JHAPA-KHAJURGACHHI 1,005 Ratua -
25 August 2009 1 0 0 0 0 0 0 0 0 0
JHAPA-LAKHANPUR 2,632 Ratua - Ward No. 1
25 August 2009 1 0 0 0 0 0 0 0 0 0
JHAPA-DAMAK MUNICIPALITY 7,065 Ratua - Ward No.12
20 June 2010 1 0 0 0 0 0 0 0 0 0
JHAPA-KHAJURGACHHI 1,005 Ratua - Ward No. 8
21 June 2010 3 1 0 0 0 0 0 0 0 0 0
JHAPA-DAMAK MUNICIPALITY 7,065 Ratua - Ward no. 1
27 June 2010 0 0 0 5 0 1 0 0 0 0
JHAPA-DAMAK MUNICIPALITY 7,065 Ratua - Ward No.16 16 July 2010 0 0 0 1820 2 0 0 0 0 0
JHAPA-LAKHANPUR 2,632 Ratua -
Ward No. 2,3,4,5,7,9 17 July 2010 2 0 0 0 1620 0 300 0 0 0 0
JHAPA-DAMAK MUNICIPALITY 7,065 Ratua - Ward No. 1,2,3,5 19 July 2010 0 0 0 1890 2 0 0 0 0 0
JHAPA-LAKHANPUR 2,632 Ratua - Ward No. 5 20 July 2010 0 1 0 0 0 0 0 0 0 0
ILAM-CHULACHULI 6,857 Kamal Ratua 20 July 2010 0 0 0 52 10 0 0 0 2 0
ILAM-CHULACHULI 6,857 Kamal Ratua Ward No.3,5
25 August 2010 0 0 0 142 27 14 0 0 670 0
MORANG-ITAHARA 3,632 Bakraha Ratua Ward No. 3,4,5,7
27 August 2010 1 0 0 1890 0 50 0 0 1 0
MORANG-ITAHARA 3,632 Bakraha Ratua Ward No. 3,4,5,7
27 August 2010 1 0 0 1890 0 50 0 0 1 0
ILAM-CHULACHULI 6,857 Kamal Ratua Chulachuli-3 18 July 2011 1 0 0 0 0 0 0 0 0
ILAM-CHULACHULI 6,857 Kamal Ratua Chulachuli-3,4,5 20 July 2011 0 0 0 0 0 0 0 0 0
JHAPA-GAURADAHA 60 Ratua - Gauradaha-4
16 August 2011 0 1 0 0 0 0 0 0 0

WRPPF-Package 3: Flood Hazard Mapping & Preliminary Preparation of Risk Management Projects 57 Final Report May 2016
Volume 4: Appendix F Lahmeyer International in association with Total Management Services
District-VDC VDC area in basins, ha
basin 1 basin 2
Place Flood date Duration (Days)
Dead People
Missing People
Injured People
Affected People
Affected households
Destroyed Houses
Damaged Houses
Sheds destroyed
Persons Evacuated
Affected Routes
(m)
Farming and
Forest affected
(Ha)
Land lost ha
Livestock Death
JHAPA-GAURADAHA 60 Ratua - Gauradaha-7
20 August 2011 1 0 0 0 0 0 0 0 0
JHAPA-KOHABARA 3,624 Ratua - Kohabara-2
24 August 2011 0 1 0 0 0 0 0 0 0
MORANG-JHURKIYA 1,829 Bakraha Ratua Jhurakiya-1
11 September
2011 1 0 0 0 0 0 0 0 0
ILAM-CHULACHULI 6,857 Kamal Ratua Chulachuli-3 16 July 2012 0 0 0 2 2 0 2 0 0
ILAM-CHULACHULI 6,857 Kamal Ratua Chulachuli-3 16 July 2012 0 0 0 1 1 0 0 0 0
ILAM-CHULACHULI 6,857 Kamal Ratua Chulachuli-3 16 July 2012 0 0 0 1 1 0 0 0 0
ILAM-CHULACHULI 6,857 Kamal Ratua Chulachuli-3 16 July 2012 0 0 0 0 0 0 0 0 0
JHAPA-KOHABARA 3,624 Ratua - Korabari-2
08 June 2013 0 0 0 0 0 0 0 0.366666667 0
MORANG-MAHADEVA 1,025 Ratua - Mahadeva-1
08 June 2013 0 0 0 0 0 0 0 4 0
JHAPA-DAMAK MUNICIPALITY 7,065 Ratua - Damak-12 09 July 2013 0 2 0 0 0 0 0 0 0
JHAPA-DAMAK MUNICIPALITY 7,065 Ratua - Damak-12 11 July 2013 0 0 0 0 0 0 0 0 0
MORANG-RAJGHAT 3,337 Ratua - Rajghat-6 11 July 2013 1 0 0 0 0 0 0 0 0
MORANG-ITAHARA 3,632 Bakraha Ratua Itahara-5
05 September
2013 0 0 0 2 2 0 0 0 0
JHAPA-DAMAK MUNICIPALITY 7,065 Ratua - Damak-14
06 September
2013 1 0 0 0 0 0 0 0 0
MORANG-RAJGHAT Ratua Ratua 08 July 2003 0.34
JHAPA-KHAJURGACHHI Ratua Ratua 12 July 2004 7 7

WRPPF-Package 3: Flood Hazard Mapping & Preliminary Preparation of Risk Management Projects i Final Report May 2016
Volume 4: Appendix F Lahmeyer International in association with Total Management Services
ANNEX 7: SOCIO-ECONOMIC SURVEYS AND SOCIAL SAFEGUARDS
MAWA RATUWA BASIN

WRPPF-Package 3: Flood Hazard Mapping & Preliminary Preparation of Risk Management Projects ii Final Report May 2016
Volume 4: Appendix F Lahmeyer International in association with Total Management Services
ANNEX 7
SOCIO-ECONOMIC SURVEYS AND SOCIAL SAFEGUARDS MAWA RATUWA
BASIN
CONTENTS
I. SOCIO-ECONOMIC SURVEY ............................................................................................... 1
A. Introduction ................................................................................................................... 1
1. Priority Basins ..................................................................................................... 1
2. Methodology of the Socio-economic Surveys .................................................... 2
3. Socio-economic Survey ...................................................................................... 5
B. Social Safeguards ........................................................................................................ 5
C. Socio-economic Conditions in representative areas in Mawa Ratuwa Basin .............. 5
1. Demography ....................................................................................................... 6
2. Landownership and Livelihood ........................................................................... 7
3. Livelihood ............................................................................................................ 8
4. Poverty and Food Sufficiency ............................................................................. 9
D. Floods Pattern and Its Impact ..................................................................................... 12
E. Perception Survey and Findings................................................................................. 13
1. Perception on Vulnerability due to Flood .......................................................... 13
2. Perception on Compensation to Flood Affected Household ............................. 15
3. Perception on Resettlement Program .............................................................. 16
4. Perception on Land Acquisition ........................................................................ 17
F. Climate Change and its Impact on Flood ................................................................... 19
G. Community Experience on Flood Patterns, Impact and Suggestions ........................ 19
H. Conclusions on Findings from the Socio-economic Surveys ..................................... 21
II. SOCIAL SAFEGUARDS ...................................................................................................... 22
I. Description of the Proposed Project and Assessment of the Situation of Indigenous Peoples .................................................................................................... 22
A. Description of the Project: .......................................................................................... 22
1. Assessment of the Situation of Indigenous Peoples in the Project Areas: ....... 22
B. Social Impact Assessment: ........................................................................................ 23
C. Information Disclosure, Meaningful Consultation and Participation: .......................... 23
D. Beneficial Measures ................................................................................................... 24
E. Mitigative Measures .................................................................................................... 24
F. Capacity Building of the Government Institutions and Indigenous Peoples Organizations in the Project Area ............................................................................... 25
G. Grievance Redress Mechanism ................................................................................. 25
H. Monitoring, Reporting and Evaluation ........................................................................ 25
III. POVERTY ASSESSMENT .................................................................................................. 26
IV. RESETTLEMENT FRAMEWORK: COMMENTS ON SAFEGUARDS REQUIREMENT ... 27
A. Project Description and Background of the Resettlement Framework....................... 27
B. Scope of Land Acquisition and Resettlement ............................................................. 27
C. Socioeconomic Information and Profile ...................................................................... 27
D. Information Disclosure, Consultation, and Participation ............................................. 28
E. Grievance Redress Mechanisms ............................................................................... 28
F. Legal Framework ........................................................................................................ 28

WRPPF-Package 3: Flood Hazard Mapping & Preliminary Preparation of Risk Management Projects iii Final Report May 2016
Volume 4: Appendix F Lahmeyer International in association with Total Management Services
G. Entitlements, Assistance and Benefits ....................................................................... 29
H. Relocation of Housing ................................................................................................ 30
I. Income Restoration and Rehabilitation ...................................................................... 30
J. Financing Plan ............................................................................................................ 30
K. Institutional Arrangements .......................................................................................... 30
L. Assessment of the Additional Views on the Potential Social Impacts of Possible Land Acquisition and Resettlement ............................................................................ 31
LIST OF FIGURES
Figure 1: New Provinces and Priority Basins............................................................................... 2
Figure 2: Representative Sites for Social Surveys ...................................................................... 6
LIST OF TABLES
Table 1: Household by Ethnicity ................................................................................................. 6
Table 2: Household Head by Gender/Sex .................................................................................. 7
Table 3: Household Size and Population by Sex ....................................................................... 7
Table 4: Land Ownership ........................................................................................................... 8
Table 5: Farming Systems .......................................................................................................... 8
Table 6: Primary Livelihood Patterns .......................................................................................... 9
Table 7: Understanding of Poverty ............................................................................................. 9
Table 8: Food Sufficiency ......................................................................................................... 10
Table 9: Information on Expenses covered by Income or Not ................................................. 10
Table 10: Construction material of Houses Walls ...................................................................... 11
Table 11: Construction material of Houses Roof ........................................................................ 11
Table 12: Primary Sources of Lighting ....................................................................................... 11
Table 13: Availability of Toilet Facilities ...................................................................................... 12
Table 14: Major Flooding Problems ............................................................................................ 12
Table 15: Whether Directly Affected by Floods .......................................................................... 12
Table 16: Plans to Relocate Residence due to Floods .............................................................. 13
Table 17: Houses Collapsed due to Floods................................................................................ 13
Table 18: Houses Forced to Relocate to New Area due to House Collapse ............................. 13
Table 19: Vulnerability by Household Head Gender .................................................................. 14
Table 20: Vulnerability of Different Groups to Flooding by Gender ............................................ 14
Table 21: Causes of Vulnerability ............................................................................................... 14
Table 22: Importance of Early Warning Systems ....................................................................... 15
Table 23: Perception on Compensation to flood Affected Household ........................................ 15
Table 24: Compensation Requirement Reasons ....................................................................... 15
Table 25: Perception on Resettlement Programs for Flood Affected Households ..................... 16
Table 26: Reasons for Resettlement Programs Required for Flood Affected Households ........ 16
Table 27: Perception on Community Contributions to the Resettlement Program..................... 17
Table 28: Reasons for Community Involvement in Resettlement Program ............................... 17
Table 29: Land Acquisition Mechanism for Proposed Projects .................................................. 18
Table 30: Perception on Villagers Willingness to Participate in Voluntary Land Acquisition ..... 18
Table 31: Mechanism for Involuntary Land Acquisition .............................................................. 18
Table 32: Presence of Climate Change Impacts ........................................................................ 19
Table 33: Impact of Climate Change on Flooding Patterns........................................................ 19
Table 34: Population of Major Indigenous Ethnic Groups in the Surveyed Area ....................... 23
Table 35: Compensation Entitlement Matrix for Reducing Negative Impact .............................. 29

WRPPF-Package 3: Flood Hazard Mapping & Preliminary Preparation of Risk Management Projects 1 Final Report May 2016
Volume 4: Appendix F Lahmeyer International in association with Total Management Services
I. SOCIO-ECONOMIC SURVEY
A. Introduction
1. The methodology for socio-economic survey adopted for this study is discussed below.
The information gathered provides one of the inputs into the selection of priority flood
management projects so that they can be targeted at vulnerable and flood affected
communities in the Terai area which are affected by frequent floods.
2. This methodology was adopted for all six Priority Basins in the study. The requirement
for stand-alone documentation for each Priority Basin leads to repetition in the reports.
However, in order to be useful to develop each potential project to feasibility level this is
inevitable.
1. Priority Basins
3. The socio-economic surveys focused on priority basins which were screened and
selected using various criteria, the methodology for which has been described in Appendix D.
Six priority basins were selected and agreed in discussions with DWIDP. The priority basins
are distributed across the new provinces which were declared in the new Nepal Constitution
adopted in September 2015 and shown in Fehler! Verweisquelle konnte nicht gefunden
werden.. The six priority basins are:
Biring (new Province No 1)
Mawa Ratuwa (new Province No 1)
Lakandehi (new Province No 2)
East Rapti (new Province No 3)
West Rapti (new Province No 5)
Mohana (new Province No 7)

WRPPF-Package 3: Flood Hazard Mapping & Preliminary Preparation of Risk Management Projects 2 Final Report May 2016
Volume 4: Appendix F Lahmeyer International in association with Total Management Services
Figure 1: New Provinces and Priority Basins
4. In spite of the difficult disruptive situation experienced in Nepal from July 2015 to
February 2016, field visits to assess the prevailing socio-economic conditions were carried out
in five of the six priority basins. These are Biring, Mawa Ratuwa, West Rapti, East Rapti and
Mohana. There were security concerns in Lakhandehi basin where political unrest was more
serious and a less rigorous approach was adopted for this basin. Nevertheless, a field visit
was carried out when the situation had become more stable.
2. Methodology of the Socio-economic Surveys
5. Socio-economic data related to the total population of the VDCs and municipalities,
number of households, ethnicity and caste communities in the project area was compiled from
the Central Bureau of Statistics data available from the 2011 census. In the priority basins, up
to ten percent of the total number of households in the targeted VDC or Municipality Ward
were selected for field survey interviews. Furthermore, five key informants comprising the
District DWIDP Officer, Head of the District Disaster Committee at the District Administration
Office, VDC Secretary, Chief of Municipalities and the Municipality Ward Secretary were also
interviewed.
6. Based on interviews and conversations with key informants as well as results of the
hydrodynamic modelling, vulnerable flood affected areas were identified which were
representative of the potential sites which could be considered for flood mitigation works.
Socio economic household surveys were then targeted at communities in these areas. The
preliminary interviews concentrated on eliciting information on ethnicity, development
backwardness, marginalization and poverty as the main indicators. Information was also
sought on the historical incidence of flooding and its effects. The most vulnerable communities

WRPPF-Package 3: Flood Hazard Mapping & Preliminary Preparation of Risk Management Projects 3 Final Report May 2016
Volume 4: Appendix F Lahmeyer International in association with Total Management Services
were then targeted for detailed socio-economic interviews. The Household Survey data was
used to assess the flood hazard, socio-anthropological and economic vulnerability of
communities in potential flood mitigation project sites. It is anticipated that proposed mitigation
projects will be prioritised in such areas.
7. The field visits were conducted by a team of four enumerators and one socio-economic
expert who visited the identified areas for carrying out household surveys where potential
project sites may be prioritised. The enumerators were selected from the local community.
Priority was given to enumerators who had a good educational background and were from
dominant ethnic groups living in the potential project sites within the priority river basins.
Where this was not possible, enumerators were selected from the local area within the river
basin who were fluent in speaking and understanding the local language of the dominant
community in the area to carry out the household surveys. Two days of orientation and training
were conducted for the enumerators before proceeding with the household survey. Close
monitoring and supervision of the enumerators was done by the socio-economic expert whilst
they carried out the household surveys. The household surveys were conducted over a period
of 15 to 20 days at each site depending on the total number of households to be interviewed
and the distances within the flood prone areas identified from local knowledge and the results
of the hydraulic modelling.
8. The photos below show the enumerators interviewing the inhabitants.
In Biring Basin
In Mawa Ratuwa Basin

WRPPF-Package 3: Flood Hazard Mapping & Preliminary Preparation of Risk Management Projects 4 Final Report May 2016
Volume 4: Appendix F Lahmeyer International in association with Total Management Services
In West Rapti Basin
9. The socio-economic field survey team under the supervision of the socio-economic
expert employed three primary methods to acquire the required information for socio-
economic analysis. Firstly, extensive reviews were carried out of relevant official documents
by the local administration agencies as well as publications of the Central Bureau of Statistics,
government line agencies and independent experts which included reports and documents.
10. Secondly, questions related to social, economic, anthropological and social safe
guards were directed to key informants in order to gain insights on demography, population,
education, health, water, sanitation, irrigation, income, expenditure, land assets, house types,
production, ethnicity, religion, language, poverty, climate change, floods types and frequency
of floods events. Perceptions on land acquisition, resettlement and community self-help
contributions were also obtained in the identified areas. As a result of this preliminary
assessment, two sets of questionnaires were prepared and printed; for the Key Informant
Interview (KII) and Household Survey (HHS) respectively.
11. Thirdly, the study used an ethnographic approach which weights the different criteria
expected to be relevant for site selection. The purpose of this is to target where household
surveys should be carried out in order to maximise efficiency and effectiveness. For this pre-
identification process, stakeholder consultations and informal conversations (semi-structured
individual interviews) were carried out before the finalization of the Household Surveys. The
team identified the key social and demographic characteristics of communities in the areas
and also assessed the socio-anthropological and economic conditions in the river basin. The
team also assessed the presence of vulnerable groups which were pre-identified as poor
households, female headed households, households with disabled persons, households with
a majority of elderly persons and children, households with a single source of income
(agriculture only) and expatriates (newly migrated, internal refugees, resettled persons etc.).
The team also assessed the community capacity and coping mechanisms for flood hazards.
Only then were the household surveys undertaken.
12. In addition to this, stakeholder meetings which included representatives of the DWIDP
District Office, Peoples Embankment Program District Office, District Irrigation Office, District
Disaster Committee, VDC and Sub-metropolitan or Municipalities were also carried out to
obtain information on policy issues as well as socio-economic issues affecting the potential
selected sites and communities.

WRPPF-Package 3: Flood Hazard Mapping & Preliminary Preparation of Risk Management Projects 5 Final Report May 2016
Volume 4: Appendix F Lahmeyer International in association with Total Management Services
3. Socio-economic Survey
13. Socio-economic household surveys were carried out in potential project site areas in
the priority basins.
14. One set of questionnaire for conducting the Key Informant Interviews (KII) and a
separate set of questionnaire for conducting Household Surveys (HHS) were formulated and
used in the surveys.
15. Primary data from the questionnaires were studied and inferences have been drawn
from the analysis of the data.
16. The key findings from the surveys are:
o The main focus should be on saving of human life and settlement.
o A key feature of any protection works is that people can live without fear of flooding and this will translate to numerous intangible benefits.
o There are significant marginalized communities living in the floodplain who are affected by flooding whose main income is from subsistence farming.
o Most people are in support of voluntary land acquisition and resettlement programs as a tradeoff for more security from flooding.
o Climate change effects have been observed in recent years with a greater incidence and magnitude of flooding.
B. Social Safeguards
17. The information gathered from socio-economic surveys provides one of the inputs into
the selection of priority flood management projects so that they can be targeted at vulnerable
and flood affected communities in the Terai area which are affected by frequent floods.
18. Social safeguards are necessary to ensure that impacted communities have adequate
mitigation measures put in place to safeguard their interests. Representative areas in the basin
where there is potential for flood mitigation works to be carried out were surveyed and key
indicators identified relating to ethnicity, poverty, vulnerability as well as people’s willingness to support such projects which may require an element of land acquisition. The aim is to
identify and address flood hazard issues and discuss potential control measures and any
potential displacement of indigenous peoples as well as other people by flooding at
representative sites.
19. Social safeguards based on pilot surveys in representative areas of the basin are
described in subsequent sections.
C. Socio-economic Conditions in representative areas in Mawa Ratuwa Basin
20. The socio-economic status of the representative area shown in Figure 2: is presented
with a focus on indicators including demographic characteristics, land ownership, poverty,
primary livelihood, the status of food sufficiency, types of houses, type of wall and roof, primary
lighting sources, availability of toilet facilities. Several sites were observed during the socio-
economic surveys. Account was taken of the impact on social vulnerability on socially
marginalized and backward groups, ethnicity, human displacement, human casualty,

WRPPF-Package 3: Flood Hazard Mapping & Preliminary Preparation of Risk Management Projects 6 Final Report May 2016
Volume 4: Appendix F Lahmeyer International in association with Total Management Services
displacement of cultural heritage etc as well as intensity of damages due to floods and the
economic benefit.
Figure 2: Representative Sites for Social Surveys
1. Demography
21. Households in the project surveyed area are composed of three different castes and
ethnic groups. They consist of the Brahmin, Chhetri and Taajpuriya groups. Of the total
households surveyed, 25.6 percent are ethnic or indigenous groups. The Taajpuriya are the
major ethnic group in this study area. The Brahmin and Chhetri groups are in the majority and
consist of 37.2 percent each of the total households surveyed.
Table 1: Household by Ethnicity
Total Percentage
Brahmin 16 37.2
Chhetri 16 37.2
Taajpuriya 11 25.6
Total 43 100.0
Source: Field Survey 2015

WRPPF-Package 3: Flood Hazard Mapping & Preliminary Preparation of Risk Management Projects 7 Final Report May 2016
Volume 4: Appendix F Lahmeyer International in association with Total Management Services
22. During the survey, heads of households were also recorded. According to the field
survey, the male headed household accounted for about 97.7 percent of the total as compared
to 2.3 percent of female headed households in the study area. Hence males are dominant
household heads which means that the role of the male is important in household decisions.
Table 2: Household Head by Gender/Sex
Total HHs Percentage
Male headed household 42 97.7
Female headed household 1 2.3
Total 43 100
Source: Field Survey 2015
23. The population of the sample household was 271, with the male and female population
composition at 54 percent and 46 percent respectively. The average family household size
was found to be 6.3 which is higher than national level i.e. 4.8 household size. This data
revealed that the female population was lower than the male population which is an opposite
trend to the national level census population data.
Table 3: Household Size and Population by Sex
Total Population Percentage
Male 147 54.2
Female 124 45.8
Total 271
Household size 6.3
Source: Field Survey 2015
2. Landownership and Livelihood
24. Land is one of the important resources for livelihood. It is also major source of
agricultural production as well as fixed property. Land is the primary source of livelihood for
most of the Nepali people and the field survey shows that the surveyed area comprises of a
large proportion of farmers who have more than 1 Bigha of agriculture land. The data shows
that 24 households i.e. 55.8 percent of households have more than 1 Bigha land whereas 25.6
percent have less than 1 Bigha land. The majority seem to have larger sized land holdings.
Similarly 11.6 percent of households have 1 Bigha land whereas about 7 percent of the
respondents have no agricultural land. Furthermore, the disaggregated data shows that 9.1
percent of households have less than 5 kattha land. Similarly, 54.5 percent have 5 to 10 kattha
land whereas 36.4 percent of households have more than 10 kattha but less than 20 kattha
land. This shows that significant numbers of households in the basin are classified as being
better off rather than vulnerable groups in terms of land access and economic status in
comparison to the other priority basins. In this context, 1 Bigha is made up of 20 katthas and
is equal to 0.677 hectares and 1.5 Bigha is equal to 1 hectare. This shows that a significant
proportion of the respondents have less than one hectare of land.

WRPPF-Package 3: Flood Hazard Mapping & Preliminary Preparation of Risk Management Projects 8 Final Report May 2016
Volume 4: Appendix F Lahmeyer International in association with Total Management Services
Table 4: Land Ownership
Total HHs Percentage
> 1 Bigha 24 55.8
1 Bigha 5 11.6
< 1 Bigha 11 25.6
No land 3 7.0
1 to 4.9 Kattha 1 2.3
5 to 10 Kattha 6 14.0
> 10 Kattha 4 9.3
Note: 1 Bigha Land = 20 katthas =0.677 Hectares of Land or 1.5 Bigha Land = 1 Hectares of Land
Source: Field Survey 2015
25. As mentioned above most of the households have less than 1 Bigha of land. This has
an impact on their crop production and farming system. It was observed that most of the
household practice an integration of subsistence as well as commercial farming which has an
impact on their cropping systems. Therefore when asked what their cropping pattern was,
about two thirds of the respondents said that they were single crop cultivators. Single crop
cultivators accounted for about 74.4 percent of the respondents whereas only 18.6 percent
were multiple crop cultivators. The remaining 7% said that they were not cultivators of any
crop. Of the multiple crop cultivators, 9.3 percent cultivated paddy and wheat and 9.3 percent
cultivated paddy and maize. 74.4 percent of the households only cultivated paddy as their
primary crop.
Table 5: Farming Systems
Total HHs Percentage
Single crops 32 74.4
Multiple crops 8 18.6
Not cultivation 3 7.0
Paddy 32 74.4
Paddy and Wheat 4 9.3
Paddy and Maize 4 9.3
Source: Field Survey 2015
26. Most of the households or respondents said that their cropping patterns or farming is
an integrated mix of subsistence as well as commercial. Subsistence farming accounts for
only 18.6 percent of the households.
3. Livelihood
27. The above data shows that 83.7 percent of the respondents practice integrated
farming. Thus the primary occupation of the sample households is agriculture but their
secondary or alternative livelihood is wage labour. Agriculture accounts for about 53.5 percent
of the livelihood in the study area. This shows that more than half of the household are
dependent on agriculture for their livelihood and survival but in the field, it was observed that

WRPPF-Package 3: Flood Hazard Mapping & Preliminary Preparation of Risk Management Projects 9 Final Report May 2016
Volume 4: Appendix F Lahmeyer International in association with Total Management Services
both riverbank erosion and inundation are major problems leading to erosion of their
agriculture land and destruction of their cultivated paddy due to inundation. Hence the
proposed project is highly important in this study area. The second major occupation or form
of livelihood is wage labour, which accounts for 23.3 percent of the primary livelihood source.
Occupational services like carpentry, tailoring, masons etc. account for 4.7 percent. Similarly,
trading and business accounts for 11.6 percent. Households whose primary livelihood is
through private services account for 4.7 percent with the remaining 2.3 percent of households
involved in government services. The data shows that most of the household in the study area
are in a better economic condition compared to the other priority basins. However, despite this
statistic, there are also a significant number economically marginalized people belonging to
the Taaipuriya ethnic group.
Table 6: Primary Livelihood Patterns
Total HHs Percentage
Agriculture 23 53.5
Trading and Business 5 11.6
Private Job 2 4.7
Wage Labour 10 23.3
Occupational Job 2 4.7
Government service 1 2.3
Source: Field Survey 2015
4. Poverty and Food Sufficiency
28. The sample survey tried to map out the villagers understanding of the issue of
economic vulnerability i.e. meaning of poverty. In this context most of the villagers or
household said that lack of cash money and agriculture land are indicators of poverty. Those
who do not have these two resources fall under the category of poor. Therefore most of the
respondents in the study area placed equal emphasis on these items. About 28 percent of the
respondents attributed economic vulnerability to the lack of ownership of land followed by 25.6
percent who placed emphasis on the lack of money. The lack of education which meant a lack
of social capital was also identified by 21 percent of the respondents as an indicator of poverty.
Households who are unable to earn to fulfil their basic needs are also classified as poor and
accounted for 4.7 percent. Interestingly some respondents identified that those household who
lack social relationship and prestige are also classified as poor and this accounts for 2.3
percent. Similarly. 4.7 percent of respondents identified the lack of permanent services as an
indicator of poverty.
Table 7: Understanding of Poverty
Total HHs Percentage
Lack of money 11 25.6
Land 12 27.9
Lack of education 9 20.9
Lack of social relationship/ prestige 1 2.3
lack of services 2 4.7
lack of food 2 4.7
Source: Field Survey 2015

WRPPF-Package 3: Flood Hazard Mapping & Preliminary Preparation of Risk Management Projects 10 Final Report May 2016
Volume 4: Appendix F Lahmeyer International in association with Total Management Services
29. One of the major indicators of the economically vulnerable and non-vulnerable
households is food sufficiency in study area. Here, the households which produce food for
less than three months are considered as highly vulnerable households. The total percentage
of households having less than three months food sufficiency is 11.6 percent. Similarly, 23.3
percent of the households have less than 9 months of food sufficiency. Households with food
surplus accounted for 11.6 percent. This shows that there is a significant number of food deficit
households in the proposed project site which is one of the major indicators of vulnerability.
Table 8: Food Sufficiency
HH Number Percentage
Less than 3 months 5 11.6
3 to 9 months 10 23.3
10 to 12 months 19 44.2
Surplus (whole year) 5 11.6
Did not respond 1 2.3
Source: Field Survey 2015
30. When asked about household income and expenses more than half of the respondent
said that their income was not enough for covering their expenses. 35 percent of the
households responded that their income was usually insufficient to cover their expenses and
46.5 percent said that their income was just enough to cover their expenses. However, 16.3
percent of the respondents viewed their income as being more than enough and enabled them
to save some of their earnings. Most of the respondents whose incomes were insufficient to
meet their expenses were engaged in agriculture and wage labour as their primary source of
livelihood.
Table 9: Information on Expenses covered by Income or Not
HHs Number Percentage
Usually not enough 15 34.9
just enough to cover 20 46.5
usually have some left 7 16.3
Did not respond 1 2.3
Source: Field Survey 2015
31. The walls of houses were constructed with bricks in 53% of the houses in the surveyed
group. Similarly, bamboo or rattan constructed walls accounted for 25.6 percent of the
households whereas timber or wood accounted for 9.8 percent. The construction material of
the walls is an indicator of the poverty levels in the study area, but equally a reflection of the
flood vulnerability experienced in the area with respondents reluctant or not interested in
construction of concrete types walls. This view was confirmed by the surveyed group during
discussions organized by the socio-economic expert during the field visits.

WRPPF-Package 3: Flood Hazard Mapping & Preliminary Preparation of Risk Management Projects 11 Final Report May 2016
Volume 4: Appendix F Lahmeyer International in association with Total Management Services
Table 10: Construction material of Houses Walls
HHs Number Percentage
Concrete 3 7.0
Bricks 23 53.5
Timber or Wood 3 7.0
Bamboo or Rattan 11 25.6
Did not respond 3 7.0
Source: Field Survey 2015
32. The roofing material used in their houses consisted of tin in 88.4 percent of the houses
in the surveyed group and thatch in 7 percent. Interestingly, only 4.6 percent of the group said
that they had RCC roofing in the surveyed area.
Table 11: Construction material of Houses Roof
HHs Number Percentage
Concrete 2 4.6
Thatch 3 7.0
Tin 38 88.4
Source: Field Survey 2015
33. The primary source of lighting in the surveyed area is solar energy. It accounts for 30.2
percent whereas an integrated system of electricity from the electricity grid and solar systems
accounts for 46.5 percent of the lighting source.
Table 12: Primary Sources of Lighting
HHs Number Percentage
Electricity from electric grid 6 14.0
Solar 13 30.2
Both electricity and Solar 20 46.5
Did not respond 4 9.3
Source: Field Survey 2015
34. The sample survey shows that 7 percent of households do not have enclosed toilet
facilities and use the open spaces as toilets. Of the 88.4 percent of households who confirmed
they had toilet facilities, 60.5 percent had internal toilets and 39.5 percent had external pit
latrines.

WRPPF-Package 3: Flood Hazard Mapping & Preliminary Preparation of Risk Management Projects 12 Final Report May 2016
Volume 4: Appendix F Lahmeyer International in association with Total Management Services
Table 13: Availability of Toilet Facilities
HHs Number Percentage
Yes 38 88.4
No 3 7.0
Did not respond 2 4.7
Toilet 23 60.5
Fence pit latrine 15 39.5
Open space 3 7
Source: Field Survey 2015
D. Floods Pattern and Its Impact
35. One of the aims of this study is to map flood hazards and assess its impact on the
community at the societal level. The field survey shows that the major problem at the surveyed
sites is inundation. Inundation was cited by 61 percent of the respondents as a major problem
and only 7 percent viewed river bank erosion as the major problem, whereas 25.6 percent of
the respondents thought both riverbank erosion and inundation were the major flood problems.
Table 14: Major Flooding Problems
HHs Number Percentage
Inundation 3 7.0
Riverbank erosion 26 60.5
Both 11 25.6
Did not respond 3 7.0
Source: Field Survey 2015
36. The field survey shows that about 21 percent of respondents or households are directly
affected by flooding whereas 67.4 percent are not directly affected by flooding. However, the
data revealed that a few respondents were physically injured in previous floods. They were in
favour of construction of dikes or flood embankments.
Table 15: Whether Directly Affected by Floods
HHs Number Percentage
Directly affected 9 20.9
Not affected 29 67.4
Not answer 5 11.6
Source: Field Survey 2015
37. Among the directly flood affected households, 77.8 percent household made plans to
move their residence to safer zones within the village. The other 22.2 percent did not express
any interest or were unable to move due to a lack of a safer alternative site.

WRPPF-Package 3: Flood Hazard Mapping & Preliminary Preparation of Risk Management Projects 13 Final Report May 2016
Volume 4: Appendix F Lahmeyer International in association with Total Management Services
Table 16: Plans to Relocate Residence due to Floods
HHs Number Percentage
Yes 7 77.8
No 2 22.2
Source: Field Survey 2015
38. Only 4.7 percent of the respondents said that their houses had completely collapsed
during floods as a result of inundation or bank erosion. The depth of flooding was in excess of
1m during 2015. Houses constructed from bamboo and rattan were damaged during the
floods.
Table 17: Houses Collapsed due to Floods
HHs Number Percentage
Yes 2 4.7
No 36 83.7
Did not respond 5 11.6
Source: Field Survey 2015
39. Only 2.3 percent of the respondents said that they had been forced to relocate due to
flood damage to their houses. However the others who were affected by flooding said that
even though they did not feel compelled to relocate, they were wary of the flooding and
damage to their houses. They felt that flood mitigation measures in their area were necessary.
Table 18: Houses Forced to Relocate to New Area due to House Collapse
HHs Number Percentage
Yes 1 2.3
No 37 86.0
Not answer 4 9.3
Source: Field Survey 2015
E. Perception Survey and Findings
40. The perception of people, particularly vulnerable people, on some of the issues
relevant to the project such as the importance of flood early warning systems, compensation
for flood affected displaced people, resettlement of displaced people, best-way of land
acquisition for project and climate change are presented below.
1. Perception on Vulnerability due to Flood
41. A majority of 65.1 percent of the respondents viewed that female headed households
are more vulnerable to floods than male headed households. During discussions in field visits,
the respondents said that female headed household tended to be economically weaker and
their houses were predominantly constructed using bamboo and rattan which were more
prone to damage during floods. About 23.3 percent of respondents said that both male and
female households are equally vulnerable during floods.

WRPPF-Package 3: Flood Hazard Mapping & Preliminary Preparation of Risk Management Projects 14 Final Report May 2016
Volume 4: Appendix F Lahmeyer International in association with Total Management Services
Table 19: Vulnerability by Household Head Gender
HHs Number Percentage
Male headed HHs 2 4.7
Female headed HHs 28 65.1
Both 10 23.3
Did not respond 3 7.0
Source: Field Survey 2015
42. Similarly, on the issue of vulnerability of different categories of people based on
gender, most of the respondents thought that both males and females were equally vulnerable
during flooding. A significant proportion also thought that girls and indigenous females were
more vulnerable than their male counterparts.
Table 20: Vulnerability of Different Groups to Flooding by Gender
Male Percentage Female Percentage Both Percentage
Did not respond
Percentage
Children 5 11.6 18 41.9 20 46.5
Adult 8 18.6 35 81.4
Elder People
12 27.9 31 72.1
Indigenous 1 2.3 18 41.9 20 46.5 4 9.3
Dalit 2 4.7 5 11.6 30 69.8 6 14.0
Poor 3 7.0 32 74.4 8 18.6
Source: Field Survey 2015
43. About 63 percent of respondents thought that poverty was the main cause of
vulnerability due to flooding. As discussed previously, the primary source of livelihood or
occupation in the area is agriculture and most of the respondents said that their agricultural
production was only sufficient to survive for less than 9 months. This meant that they fell below
the poverty line due to the lack of a good alternative form of livelihood. About 14 percent of
the respondents cited the lack of an alternative form of livelihood as the main cause of
vulnerability in these communities. Residing in flood prone areas was cited by 23.3 percent of
the respondents as the major cause of vulnerability due to flooding. Unfortunately, most poor
people resided in flood prone areas as they had no other alternative.
Table 21: Causes of Vulnerability
HHs Number Percentage
Residing in flood prone area 10 23.3
Poverty 27 62.8
Lack of alternative livelihood 6 14.0
Source: Field Survey 2015
44. Over 76.7 percent of the respondents strongly agreed with the importance of an early
warning system that would enable them to move to a safe zone in time before the flood event
inundated their area. Currently, there is no provision of an early warning system in the project

WRPPF-Package 3: Flood Hazard Mapping & Preliminary Preparation of Risk Management Projects 15 Final Report May 2016
Volume 4: Appendix F Lahmeyer International in association with Total Management Services
area and there is no knowledge or formal application of such practices on a local level. Most
of the respondents wanted the installation of a modern early warning system with sirens to
enable them to evacuate safely and prevent human casualties.
Table 22: Importance of Early Warning Systems
HHs Number Percentage
Strongly agree 33 76.7
Agree 7 16.3
Did not respond 3 7.0
Source: Field Survey 2015
2. Perception on Compensation to Flood Affected Household
45. The survey responses highlighted the overwhelming view of 86 percent of the
respondents that compensation and a relief program was important and necessary to
rehabilitate the flood affected households to enable them to achieve normalcy. Only 4.7
percent of respondents felt that compensation was not necessary.
Table 23: Perception on Compensation to flood Affected Household
HHs Number Percentage
Required 37 86.0
Not required 2 4.7
Did not respond 4 9.3
Source: Field Survey 2015
46. The reasons for requiring compensation for flood affected people were varied with 55.8
percent citing survival as their reason, 21 percent of respondents citing resettlement as their
reason, 16.3 percent citing humanitarian reasons and 7 percent citing safeguard against
poverty as their reason. It is clear that a compensation and resettlement program will be
necessary in the project area.
Table 24: Compensation Requirement Reasons
HHs Number Percentage
To Survive 24 55.8
Humanitarian 7 16.3
Save from poverty 3 7.0
For resettlement 9 20.9
Source: Field Survey 2015
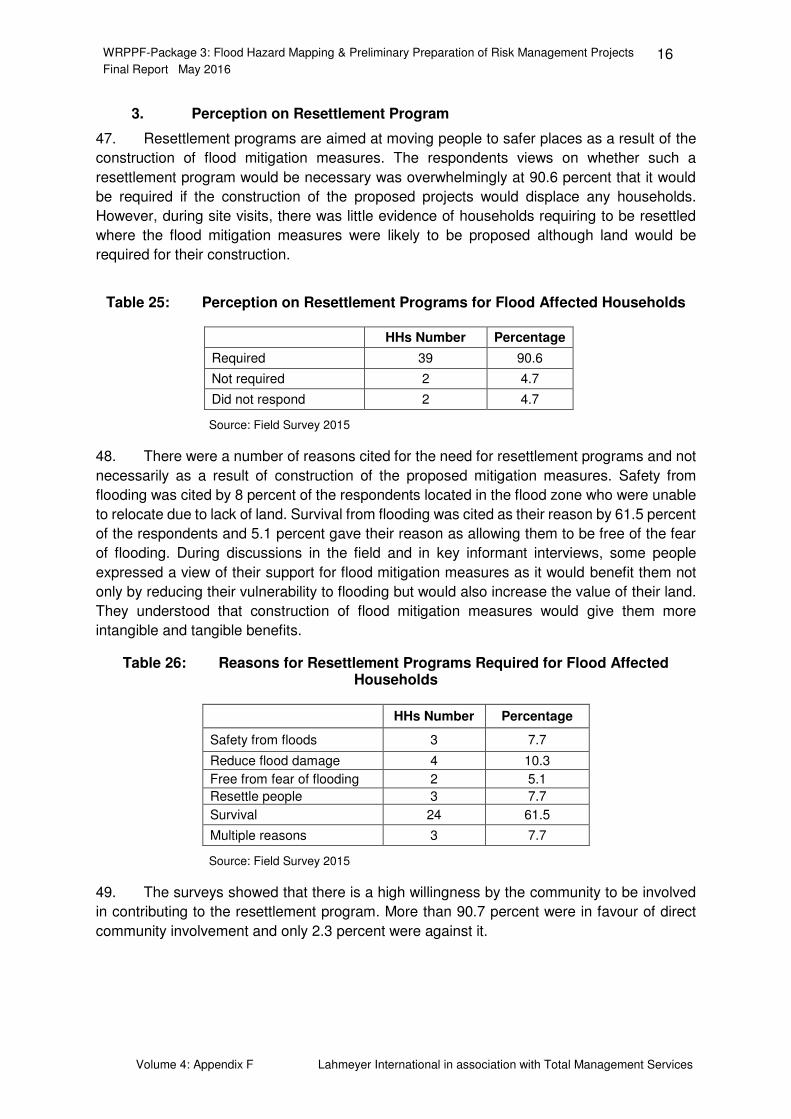
WRPPF-Package 3: Flood Hazard Mapping & Preliminary Preparation of Risk Management Projects 16 Final Report May 2016
Volume 4: Appendix F Lahmeyer International in association with Total Management Services
3. Perception on Resettlement Program
47. Resettlement programs are aimed at moving people to safer places as a result of the
construction of flood mitigation measures. The respondents views on whether such a
resettlement program would be necessary was overwhelmingly at 90.6 percent that it would
be required if the construction of the proposed projects would displace any households.
However, during site visits, there was little evidence of households requiring to be resettled
where the flood mitigation measures were likely to be proposed although land would be
required for their construction.
Table 25: Perception on Resettlement Programs for Flood Affected Households
HHs Number Percentage
Required 39 90.6
Not required 2 4.7
Did not respond 2 4.7
Source: Field Survey 2015
48. There were a number of reasons cited for the need for resettlement programs and not
necessarily as a result of construction of the proposed mitigation measures. Safety from
flooding was cited by 8 percent of the respondents located in the flood zone who were unable
to relocate due to lack of land. Survival from flooding was cited as their reason by 61.5 percent
of the respondents and 5.1 percent gave their reason as allowing them to be free of the fear
of flooding. During discussions in the field and in key informant interviews, some people
expressed a view of their support for flood mitigation measures as it would benefit them not
only by reducing their vulnerability to flooding but would also increase the value of their land.
They understood that construction of flood mitigation measures would give them more
intangible and tangible benefits.
Table 26: Reasons for Resettlement Programs Required for Flood Affected Households
HHs Number Percentage
Safety from floods 3 7.7
Reduce flood damage 4 10.3
Free from fear of flooding 2 5.1
Resettle people 3 7.7
Survival 24 61.5
Multiple reasons 3 7.7
Source: Field Survey 2015
49. The surveys showed that there is a high willingness by the community to be involved
in contributing to the resettlement program. More than 90.7 percent were in favour of direct
community involvement and only 2.3 percent were against it.

WRPPF-Package 3: Flood Hazard Mapping & Preliminary Preparation of Risk Management Projects 17 Final Report May 2016
Volume 4: Appendix F Lahmeyer International in association with Total Management Services
Table 27: Perception on Community Contributions to the Resettlement Program
HHs Number Percentage
Yes 39 90.7
No 1 2.3
Did not respond 3 7.0
Source: Field Survey 2015
50. The main reason given for the overwhelming support by 74.4 percent of respondents
for direct community contribution to the resettlement program was for noble causes i.e.
humanitarian and to solve the flooding problem of the village by construction of flood mitigation
measures. About 7.7 percent felt that their contribution was for the survival of the flood affected
villagers.
Table 28: Reasons for Community Involvement in Resettlement Program
HHs Number Percentage
For Humanitarian 7 17.9
For Survival 3 7.7
It is problem of the village and therefore need to contribute towards their safety and protect the village
29 74.4
Source: Field Survey 2015
4. Perception on Land Acquisition
51. The field surveys indicated that the best route for land acquisition for construction of
flood mitigation measures in the area which was supported by 79.1 percent of the respondents
was through voluntary measures. This would be supported because it would be for the good
of the village and would result in saving the village from flooding. A number of respondents
wanted to support the government locally and be involved in the construction of the proposed
flood mitigation measures in the study area and their voluntary contribution would make
construction of the proposed project easier.
52. However, 14.4 percent of the respondents thought that compulsory involuntary
acquisition of land would be necessary. Interestingly, during the field visit discussions and key
informant interviews, a view was expressed that the people who had responded in support of
compulsory land acquisition were more likely not to be affected by flooding and the people
affected by flooding were more in support of giving up their land voluntarily, particularly if part
of their remaining land would benefit from such flood mitigation measures.

WRPPF-Package 3: Flood Hazard Mapping & Preliminary Preparation of Risk Management Projects 18 Final Report May 2016
Volume 4: Appendix F Lahmeyer International in association with Total Management Services
Table 29: Land Acquisition Mechanism for Proposed Projects
HHs Number Percentage
Voluntary 34 79.1
Involuntary 6 14.4
Did not respond 3 7.0
Source: Field Survey 2015
53. The discussion above shows that the villagers or the community were ready to
participate in voluntary land acquisition whereby they would be willing to voluntarily give up
land for construction of flood mitigation projects. A majority of 79.1 percent of the respondents
were ready to participate in voluntary land acquisition. About 56 percent respondents said that
their major reason to participate in voluntary land acquisition was to save villagers and their
village from flooding. Similarly, 26.5 percent of respondents said that they were ready for such
purposes to support the government in construction of the flood mitigation project in the area
and 17.6 percent said that they would be willing to participate in the voluntary scheme for
noble humanitarian purposes. The ability to acquire land without the need to provide
compensation would be of benefit to the government to fast track the implementation of the
project.
Table 30: Perception on Villagers Willingness to Participate in Voluntary Land Acquisition
HHs Number Percentage
Yes 34 79.1
No 6 14.0
Did not respond 3 7.0
Reasons for Willingness for Voluntary
To save villagers from flood hazards 19 55.9
For humanitarian 6 17.6
To support the government 9 26.5
Source: Field Survey 2015
54. Of the 14 percent who said that compulsory purchase would be necessary, a majority
were willing to accept half the compensation rate for the land required for construction of the
flood mitigation measures. However, 33.3 percent would demand full compensation. The
remaining 16.7 percent were ready to agree to provide the land as per the government policy
which could include participation in the voluntary scheme when the project was being
implemented.
Table 31: Mechanism for Involuntary Land Acquisition
HHs Number Percentage
Full compensation 2 33.3
Half compensation 3 50.0
Ready to provide as per government policy 1 16.7
Source: Field Survey 2015

WRPPF-Package 3: Flood Hazard Mapping & Preliminary Preparation of Risk Management Projects 19 Final Report May 2016
Volume 4: Appendix F Lahmeyer International in association with Total Management Services
F. Climate Change and its Impact on Flood
55. Climate change is one of the major issues which will have a major impact on the nature
of flooding and its impact in the future. The field surveys showed that 93 percent of the
respondents agreed that climate change was having an impact in their area and only 4.7
percent felt that climate change did not have any impact in their village. This data indicates
that climate change has had an impact on the life of villagers in remote areas of Nepal and
almost all of the village people were aware of climate change issues.
Table 32: Presence of Climate Change Impacts
HHs Number Percentage
Impact 40 93.0
No impact 2 4.7
Did not respond 1 2.3
Source: Field Survey 2015
56. More than 93 percent of the respondents agreed that the nature of floods had changed
in recent times and climate change had had an impact on the flooding patterns in their area.
Only 4.7 percent did not agree.
Table 33: Impact of Climate Change on Flooding Patterns
HHs Number Percentage
Impact 40 93.0
Not impact 2 4.7
Did not respond 1 2.3
Source: Field Survey 2015
G. Community Experience on Flood Patterns, Impact and Suggestions
57. During the field visit, the community or peoples experience on the flooding pattern
experienced in the area was discussed. The general experience was that floods with a return
period of 8 to 10 years were experienced on a regular basis with recent major floods
experienced in 2006, 2012 and 2015. There was one human casualty in 2006. River bank
erosion and inundation were identified as major problems.
58. During discussions with some elderly respondents and key informants, the pattern of
flooding commences with flood waters entering from Ward 7 of Lakhanpur VDC and extending
upto 6 km inland from the riverbank and inundating their village. This results in most of the
houses being inundated for a few days. During the floods of 2015, the depth of inundation was
1 m.
59. Most of the villagers said that the major crop lost during flooding is cultivated paddy.
Stored grain is also lost due to flood inundation. Floods also destroys their houses as well as
agriculture land and in addition, most of the flood affected people had health issues and were
affected by cough, diarrhoea, fever etc.
WRPPF-Package 3: Flood Hazard Mapping & Preliminary Preparation of Risk Management Projects 20 Final Report May 2016
Volume 4: Appendix F Lahmeyer International in association with Total Management Services
60. Flooding in the area also affected school going children who experienced hindrance in
their study due to their school infrastructure being submerged by flood waters as well as the
road network becoming impassable. Similarly, drinking water sources are also affected by
flooding with many wells being inundated during the rainy seasons.
61. The elderly residents, while sharing their experiences, said that in the past, the
government did not properly address the peoples’ demands. Their main suggestion to the
government was for them to not only focus on the economic benefits while considering the
viability of constructing flood mitigation works and should consider the intangible benefits while
selecting projects because from a social development perspective, the intangible benefits
were more meaningful to the villagers in terms of improving the quality of their lives than purely
tangible benefits. In this context, the DWIDP policy book published in 20151 states that one
of the major objectives is to place emphasis on minimization of human casualties and loss on
human settlements which echoed by the respondents. They also said that flood protected land
which had flood embankments constructed would increase its value between 3 to 5 times as
compared to unprotected land because people would feel more secure and were more likely
to invest in their farms and businesses and adopt better technologies for better productivity.
1 For detail please see DWIDP Disaster Management Policy 2072 BS (2015).

WRPPF-Package 3: Flood Hazard Mapping & Preliminary Preparation of Risk Management Projects 21 Final Report May 2016
Volume 4: Appendix F Lahmeyer International in association with Total Management Services
H. Conclusions on Findings from the Socio-economic Surveys
The main demand of residents in the study area is that the government should focus
on saving of human life and settlements. They are the intangible benefits because they
are immeasurable. Similarly, the main contribution of flood mitigation measures is that
people can live without fear of flooding, particularly when flood embankments are
constructed. Such projects generate far more intangible benefits than tangible benefits
and the government should be focussed on such types of intangible benefit in any flood
mitigation project as it is directly related to saving human casualties and minimising
societal vulnerability.
Although the surveyed potential project sites are dominated by Brahmins, the
Taajpuriyas are a major ethnic group resident in the area. Similarly, other ethnic groups
as well as untouchable groups are also present in the area but were not recorded
during the survey. Therefore the proposed project would be beneficial to high castes
as well as ethnic groups.
The primary form of livelihood in the area is agriculture and there are a few landless
households and a significant number of residents have less than 5 kattha land. The
other major form of livelihood in the area is wage labour.
The field surveys show that the residents in the potential project sites are highly
interested in the voluntary land acquisition and resettlement program in return for flood
safety to their village and relocation to a safer area. However, a few villagers have
expressed their unwillingness to participate in voluntary land acquisition and
resettlement programs.
During the field surveys, the villagers said that in recent times, floods with return period
of 8 to 10 years have been observed in Mawa Ratuwa. The major flooding problems
in the river basin are inundation and riverbank erosion.
The impact of climate change has manifested itself in floods at higher return periods
occurring more frequently than in the past.

WRPPF-Package 3: Flood Hazard Mapping & Preliminary Preparation of Risk Management Projects 22 Final Report May 2016
Volume 4: Appendix F Lahmeyer International in association with Total Management Services
II. SOCIAL SAFEGUARDS
A. Description of the Proposed Project and Assessment of the Situation of Indigenous Peoples
1. Description of the Project:
62. The pilot social safeguard survey is to ensure that impacted communities have
adequate mitigation measures put in place to safeguard their interests. Representative areas
in the basin where there is potential for flood mitigation works to be carried out were surveyed
and key indicators identified relating to ethnicity, poverty, vulnerability as well as people’s willingness to support such projects which may require an element of land acquisition. The
aim is to identify and address flood hazard issues and discuss potential control measures and
any potential displacement of indigenous peoples as well as other people by flooding at
representative sites. In this context, the negative impact of climate change on flooding
frequency and magnitude has been highlighted by the people in the area as well as
government officials during the group discussion. The pilot socioeconomic survey also shows
a similar theme from discussions with residents. It is therefore considered that there will be
beneficial impacts through control of the floods in the area.
63. The surveyed area’s people argued that if flooding is controlled they will benefit hugely. A concern expressed was that many previous projects have been selected on the basis of
tangible benefits only. However, the people in the surveyed areas argued that the main
contribution by flood mitigation projects is that it removes their fear from flood as well as
minimizing or eliminating human casualties and protecting settlements from inundation.
Similarly, another benefit highlighted was an increase in agricultural production due to the
safety of their agriculture land. Furthermore, the surveyed area respondents said that flood
embankments, if constructed, will contribute to an increase in the value of land on the one
hand and on the other, it will provide them with confidence to prepare agricultural production
plans and invest in year round irrigation systems which will contribute to enhancing their
livelihood. This is the general perception and view of the people in the basin. During the
discussions, indigenous people argued that the proposed project will not adversely affect them
in the future. Therefore, the social safeguard team expectation is that the proposed project will
not affect the indigenous people adversely.
2. Assessment of the Situation of Indigenous Peoples in the Project Areas:
64. In the surveyed area there are six groups of indigenous peoples. They are the Tamang,
the Gurung, the Rai, the Magar, the Newar and the Tharus as noticeable ethnic groups.
Similarly, this river basin has a small numbers of other indigenous peoples who also live there.
The Tharu are the major dominant group in this river basin. Apart from these indigenous
communities, there are a substantial number of Dalits living in the area. The Dalits are a
marginalized and poor community. All of these indigenous groups have their own languages
and cultural traditions which are distinct from the hill pahariya people. The table below shows
the major indigenous peoples at the surveyed site.

WRPPF-Package 3: Flood Hazard Mapping & Preliminary Preparation of Risk Management Projects 23 Final Report May 2016
Volume 4: Appendix F Lahmeyer International in association with Total Management Services
Table 34: Population of Major Indigenous Ethnic Groups in the Surveyed Area
Dhangadi Sub-metropolitan Malakheti
Population Percentage Population Percentage
Total Population
101970 23814
Magar 2336 2.3 302 1.3
Tharu 30151 29.6 2717 11.4
Tamang 753 0.7 128 0.5
Newar 1585 1.6 307 1.3
Rai 253 0.2 43 0.2
Gurung 285 0.3 71 0.3
Source: Central Bureau of Statistics, Population by Caste/Ethnicity and Mother Tongues, 2011.
65. During discussions in the field, most of people argued that these ethnic groups have
also changed due to the cultural contact with other Hindu high caste social groups.
B. Social Impact Assessment:
66. The potential social impact assessment at the representative potential project site was
carried out during the course of the study. A small focus group discussion with the flood
affected indigenous peoples and DWIDP district officials of the Peoples’ Embankment (Janata Ko Tatabandhan) program in the surveyed area was conducted. The discussions revealed
that flood embankment projects will have a high positive impact by preventing flooding as well
as not having an adverse effect even long after the completion of the project. In other words,
the project will enhance their livelihood systems. Agriculture is the dominant source of
livelihood in this river basin. Hence agriculture land prevention from the flooding problems,
including prevention of riverbank erosion definitely contributes to enhancing their livelihood
due to increase in production and proper utilization of agriculture land. In addition they said
that it will also minimize human casualties and destroying human settlements which would be
one of the major contributions of project. Similarly, such projects will not affect indigenous
cultural identities, practices, and habitats. Furthermore during discussions with affected
peoples and concerned officials, they viewed that female headed households and females are
more vulnerable groups than males due to the floods because female households are less
well-off or weaker in economic status than male dominated households because of their low
incomes and restricted opportunities for other livelihood sources other than agriculture. In
general it is assumed that other sites in the basin will also have similar situations.
C. Information Disclosure, Meaningful Consultation and Participation:
67. Information on the purpose project needs to be been disclosed and consultation
undertaken by the Socio-economist and Social Development Specialist (Social Safeguard
specialist) by meeting the leaders, activists and development workers of the major dominant
ethnic groups of the surveyed site. In other words, during the proposed project’s research fieldwork, efforts have been made to meet the general requirement of the ADB by undertaking
meaningful consultation with indigenous peoples to ensure their informed participation in the
process to ensure positive impacts on them by involving them to the maximum extent. The
focus group discussions carried out in the communities with men and women and key

WRPPF-Package 3: Flood Hazard Mapping & Preliminary Preparation of Risk Management Projects 24 Final Report May 2016
Volume 4: Appendix F Lahmeyer International in association with Total Management Services
informant interviews with indigenous leaders, activists, VDC secretary, sub-metropolitan
officer, DWIDP, DOA, and development workers have also helped to disclose the relevant and
adequate information among the indigenous peoples and solicited their views to implement
such projects for their optimal benefits.
68. The community consultation process has been gender inclusive (i.e. indigenous
women, indigenous farmers, leaders were also consulted). At the same time, efforts were also
made to listen to the most marginalized/disadvantaged sections of the indigenous people, i.e
the free Kamayia and the small farmers of the indigenous communities. These freed bonded
labourers have been resettled by the government by entitling them to a small patch of land.
This land is not however, sufficient for their year round livelihood. Therefore now, there is a
need for institutional income generating alternative skill development as well as support for
cash crops. In cash crops, especially in vegetable farming, it is important because it enhances
their economic status through selling them in the market. As mentioned above the potential
Malakheti site has an annual problem of inundation and therefore, construction of flood
embankments would contribute to enhancing the livelihood of the Free Kamayia Tharus. The
surveys showed that if the project is constructed at the surveyed area, there will be a
disproportionate benefit for the indigenous people, both in terms of intangible and tangible
benefit. Given these facts, the Socio-economist and Social Development Specialist assumed
that such types of benefit will occur at all protected sites. However, community consultations
at all proposed project sites have not been carried out.
D. Beneficial Measures
69. The field interactions with the indigenous groups have shared that if the project is
constructed in the surveyed area it will have a positive social and economic impact on them
because they have expectations that it will help them to be safe from flood hazards. In general
it is assumed that a similar situation will be experienced at all the proposed project sites. Such
a project will contribute to protecting their agriculture land from floods. It will also remove their
mental anxiety and fear of flood hazards. Thus they feel that the proposed project will provide
them with psychological safety which is also assumed in the communities living at all proposed
project sites. Furthermore they expect that after the project completion there will be no more
human casualties and destruction of human settlements, houses and livestock. Similarly, the
project will contribute to increasing their land values. Historically, their experience has been
that land which is protected by flood embankments has increased its value between 3 to 5
times.
E. Mitigative Measures
70. The surveys show that if a project is constructed at the surveyed site it will contribute
to reducing poverty among the affected indigenous communities. This has been confirmed by
the discussions with indigenous peoples and DWIDP (Janata ko Tatbandhan) officials. Hence,
they are willing to participate in the proposed project construction. Similarly, most of the flood
affected indigenous peoples opinion reveals that participating in the proposed project
construction will help to increase their household income as well as ensuring long term
benefits from protection of their agriculture land and utilizing land that is currently inundated.

WRPPF-Package 3: Flood Hazard Mapping & Preliminary Preparation of Risk Management Projects 25 Final Report May 2016
Volume 4: Appendix F Lahmeyer International in association with Total Management Services
F. Capacity Building of the Government Institutions and Indigenous Peoples Organizations in the Project Area
71. The consultation with the responsible officials of the proposed project area revealed
that the government officials need some sort of orientation on the indigenous/social inclusion
issues as per new Nepal constitution because they are not fully aware of the special features
of social inclusion incorporated in the constitution. It was observed during the fieldwork at the
surveyed site that some of the local indigenous ethnic leaders are aware of the legal provisions
subscribed to and adopted by the Nepali Government on indigenous peoples and indigenous
rights from the international conventions/documents such as the International Labour
Organization Convention (ILO) 169 adopted in 1989. But they are also not fully aware of the
new constitutions provisions on this issue fully. Hence an orientation program is needed to be
conducted for indigenous people in the potential project sites. It has been found in the field
that there are some indigenous peoples’ organizations at the surveyed site and may exist at other potential sites as well.
G. Grievance Redress Mechanism
72. The surveyed area indigenous peoples argued that there is a need to establish a
grievance redress mechanism at the DWIDP district office. For its institutional development
and support a detailed study needs to be carried out. Furthermore this office will help to create
awareness of flood hazards among the indigenous poor farmers. As a result it will contribute
to the meaningful participation of indigenous people in the project construction or
implementation at potential project sites.
H. Monitoring, Reporting and Evaluation
73. The DWIDP District office or Janata ko Tatbandhan has to be responsible for
implementation, monitoring and evaluation of the indigenous peoples’ action plan under the technical/institutional guidance of project support unit (PSU) at the centre which will be staffed
by a Consultant Monitoring and Evaluation Specialist. But the surveyed area people argued
that this river basin needs to collect the baseline data and the needs assessment of the
indigenous peoples. Similarly, there is the need to adopt a “participatory approach towards
monitoring and evaluation” at all stages of the project including the design stage because
the indigenous peoples can contribute to effectively monitoring and evaluating government
structured systems. Such practices will definitely empower everyone of this river basin.

WRPPF-Package 3: Flood Hazard Mapping & Preliminary Preparation of Risk Management Projects 26 Final Report May 2016
Volume 4: Appendix F Lahmeyer International in association with Total Management Services
III. POVERTY ASSESSMENT
74. The sample socioeconomic survey shows that in the surveyed areas, most of the
affected people’s own production covers less than 9 months of their requirements which was
reinforced during group discussions with the affected people. Officials from the VDC, sub-
metropolitan office also expressed a similar view. They said that the Tharus are good farmers
but most of the Tharus have less than 10 Kattha land. The government only provides less than
2 Kattha land to resettle and rehabilitate the Free Kamayia Tharu or previously bonded
labourers. Hence, a lack of access to land and diminished production which is only sufficient
for less than nine months is reflected in the poverty levels of the Tharus in this river basin.
Consequently, their traditional knowledge on agricultural production is not properly utilized.
Similarly, the Free Kamayia in the surveyed area are also affected by flood inundation during
the rainy season and floods frequently damage their cultivated paddy. It is therefore better to
provide them with alternative forms of livelihood. It has been suggested that alternative income
generating skills training is necessary to enhance their livelihood. Similarly, people belonging
to the untouchable caste as well as other indigenous people have less than 1 Bigha land.
There are no year round irrigation systems or access to reliable sources of water and hence
they are reliant on rainfed farming. As a result, they always face food deficit due to a lack of
year round irrigation system. For most of the affected people, their primary source of livelihood
is agriculture and their incomes are insufficient to meet their annual expenditure. The walls of
their houses are constructed from bamboo or rattan and timber or wood with mud. A significant
number of houses have roof tiles but the majority of people have tin roofs with a small number
of well off people having concrete roofs. The main indicators of poverty as expressed by the
affected people are lack of sufficient land, less production, lack of livestock and cash money.
Likewise a lack of education, love and social relationships i.e. social capital are also major
indicators of poverty. This set of circumstances are evident throughout the basin.

WRPPF-Package 3: Flood Hazard Mapping & Preliminary Preparation of Risk Management Projects 27 Final Report May 2016
Volume 4: Appendix F Lahmeyer International in association with Total Management Services
IV. RESETTLEMENT FRAMEWORK: COMMENTS ON SAFEGUARDS REQUIREMENT
A. Project Description and Background of the Resettlement Framework
75. The objective of the ADB resettlement framework (2009) is to minimize involuntary
resettlement. Similarly, enhancement or at least restoration of their livelihoods of all displaced
persons in real terms relative to pre-project levels is suggested as well as an improvement in
the standards of living of the displaced poor and other vulnerable groups. Therefore the
proposed project concept has identified infrastructure development or construction as an
important component for the flood hazard control and mitigation of this river basin. This
infrastructure development will need support jointly from the ADB and the government. Hence
before implementation of the proposed project, it is necessary to identify and estimate the
scale of physical dislocation (relocation, loss of residential land, or loss of shelter) and
economic displacement (loss of land, assets, access to assets, income sources, or means of
livelihoods) as a result of involuntary acquisition of land, or involuntary restrictions on land
use. From the discussion with people and field surveys at the representative site, it is not
anticipated that there will be significant resettlement needs but there may be the need for land
acquisition for the development of the flood embankment. Therefore considering this
constraint, a serious effort and plan needs to made to develop a resettlement plan (as per the
ADB guideline 2009) at later stages of the project. For this plan a detailed survey of the
infrastructural facilities required at the proposed project sites may be needed.
B. Scope of Land Acquisition and Resettlement
76. Upon the finalization of the survey for the infrastructural support, a detailed social
impact assessment/ the baseline (census) survey will have to be carried out by a short-term
Social Development Consultant which will assess the scope of land acquisition (with maps)
and estimate the volume of compensations by summarizing the key effects in terms of assets
acquired and displaced persons/households. There may be other Government mechanisms
which may also be appropriate but will need a realistic re-assessment of land values.
C. Socioeconomic Information and Profile
77. The pilot short-term Social Development Consultant will have to provide the results of
the social impact assessment and socioeconomic survey. This pilot survey should cover the
disaggregated information on gender, vulnerability and other social groupings. It should also
cover the people and communities affected by the proposed project. They will have to be
defined, identified and enumerated. Similarly, likely impacts of land and asset acquisition on
the people and communities affected will need to be described by taking social, cultural, and
economic parameters into account. The project’s impacts on the poor, indigenous and/or ethnic minorities will also have to be discussed. Resettlement impacts and the socioeconomic
situation, impacts, needs, and priorities of vulnerable groups and related data will also need
to be collected to provide a realistic assessment. Such an assessment has been conducted
at the representative survey site.

WRPPF-Package 3: Flood Hazard Mapping & Preliminary Preparation of Risk Management Projects 28 Final Report May 2016
Volume 4: Appendix F Lahmeyer International in association with Total Management Services
D. Information Disclosure, Consultation, and Participation
78. Each resettlement plan will need to be prepared and implemented in close consultation
with the stakeholders and will involve group discussions and group meetings particularly with
the persons likely to be affected in the proposed project areas. The survey at the
representative site shows that before submitting detailed project plans, copies of the draft
resettlement plans will have to be disclosed to the public in project information centers to be
set up at DWIDP offices (Central and District) and released to any requester including project-
affected persons, indigenous organizations and NGOs.
E. Grievance Redress Mechanisms
79. The surveyed area people argued that a Grievances Redress Committee (GRC) needs
to be constituted. Hence it is recommended to constitute such a committee. It has been
suggested that this committee needs to convene under the chairmanship of the village
development committee (VDC) Chairperson or the Secretary of the VDC and consisting of two
representatives (one man and one woman) of affected persons, affected dominant indigenous
groups, indigenous organization representative and a representative from the Project or
DWIDP as members of this committee. The affected persons may submit their concerns or
grievances verbally or in writing to the GRC. The GRC will facilitate the process for the
concerned parties to agree on an action plan to resolve the grievances that are found to be
genuine.
F. Legal Framework
80. Resettlement (as per necessity) will need to be implemented in accordance with the
policy on involuntary resettlement of the Asian Development Bank (ADB) and the Nepali
Government’s Land Acquisition and Resettlement Policy. However, in Nepal, although the Land Acquisition Act (LAA) is the major legal document for handling acquisition and
compensation, it has no provision for granting compensation to project affected people who
do not have ownership of land. Furthermore, LAA does not have provisions to (i) address the
difficulties caused by delays in compensation to Project Affected Families (PAFs), (ii) ensure
that vulnerable groups, ethnic minorities and other people affected by the project are capable
of making proper use of compensation money to resettle to a living standard not less than that
existed prior to the project, and (iii) provide practical provisions of land for land option despite
it being mentioned in the LAA 1977. Thus, the LAA 1977 is inadequate to effectively deal with
the problem of involuntary resettlement. Besides the LAA 1977, there are other related Acts.
However, they also do not address the issues of people affected by development projects. But
as a majority of development projects are donor funded, there is considerable variation in the
resettlement programs policies. As per ADB/NPC 2006 reports, donors are compelled to
formulate and implement their own project specific resettlement policies by adopting whatever
is there already. This requirement, together with a lack of adequate resettlement policies in
the country is mainly responsible for emergence of such variation in the resettlement
programs. Given this circumstance, the DWIDP offices can also address the inadequacies of
government land acquisition and resettlement policies/laws by developing its resettlement
policies as per the ADB guidelines. For this the DOI and or DWIDP need to be institutionally
ready to comply with the legal and policy requirements of ADB and the government vis-à-vis
resettlement.

WRPPF-Package 3: Flood Hazard Mapping & Preliminary Preparation of Risk Management Projects 29 Final Report May 2016
Volume 4: Appendix F Lahmeyer International in association with Total Management Services
G. Entitlements, Assistance and Benefits
81. The resettlement framework is applicable to all resettlement effects arising from land
acquisition or conversion or any other effects that arise from the project construction works.
The surveyed area people argued that those affected will be entitled to maintain at least their
standard of living at pre-project level and to receive compensation for all types of losses. This
compensation must include land, standing crops, trees, structures and any other assets at full
replacement value. But due to the physiological effects of removal of the fear factor, economic
benefits and increased value of land property arising from the construction of the proposed
project, affected people may voluntarily contribute the land required for construction of the
project. In this context it has been found that almost all people of the surveyed area were
ready to voluntarily contribute the land for project construction and similar to the experience
in other areas, it is anticipated that this will be replicated at other proposed sites. Affected
people, including those with no land titles, may need to contribute in kind in terms of labour.
The table below summarizes the types of loss and entitlements of the affected persons (in
case the project requires private land for building the necessary infrastructures development)
on the basis of the surveyed area peoples’ opinion.
Table 35: Compensation Entitlement Matrix for Reducing Negative Impact
Type of Loss Entitled Unit Entitlement/Compensation
Loss of land and
assets for the
proposed project infrastructure development or construction
Landowner and
tenant
a. The legal owners will get compensation at replacement cost determined through agreement between affected people and the project implementation unit.
b. If there are tenants, compensation will be divided between tenants and owners but this will be finalized share of compensation distribution with consultation of concern people before final agreement.
Voluntary
contribution of land for building the infrastructure
by owner to project
Landowner Internal agreement between the landowner and the project implementation unit with ‘no coercion’ clause witnessed by a neutral party, i.e., NGO or VDC chairperson/secretary acceptable to the project and the participating parties.
Loss of standing
crops and trees on
the land acquired for infrastructure
Crop owners and
others
a. Legal owners will get compensation at replacement cost/value as determined through agreement between affected people and the project implementation unit
b. If there is a tenant, make a provision at least tenant will get 50% of the compensation and the other 50% will go to the absentee landowner.
Loss of community
or common property
Structure owners
or users
If such structures are identified the resettlement plan will include measures to avoid, mitigate, or compensate impacts. If identified only during construction, compensation should be provided at replacement cost as determined by the Grievances Resolution Committee.
Loss of land and
income-generating
assets by non-titled
persons
Property
users/owners
identified during
baseline survey
Those persons with no title to the land who have been using/owning the affected property will get compensation/assistance at replacement cost determined through agreement between the affected people and the project implementation unit.
Temporary impact or damages during
Construction
Property owner
and others
The contractor will be required to pay to the affected peoples or communities compensation as determined by the Grievances Resolution Committee.
AP = affected persons, NGO = nongovernment organization, VDC = village development Committee

WRPPF-Package 3: Flood Hazard Mapping & Preliminary Preparation of Risk Management Projects 30 Final Report May 2016
Volume 4: Appendix F Lahmeyer International in association with Total Management Services
H. Relocation of Housing
82. As indicated above and field discussions as well as the sample survey show that no
major resettlement will be necessary for the proposed projects. However, there will be a need
for the project to acquire the private land for the construction of the infrastructural facilities.
Similarly, it will have to develop a planned scheme for the relocation of housing of the affected
people (if any but the sample socioeconomic survey shows that it is unlikely to be the case in
the proposed potential sites in this river basin). If there is such a case, an extensive
consultation with the community and the affected people will need to be done. But in most of
the cases, a replacement cash compensation will itself help to solve such problems related to
displaced persons.
I. Income Restoration and Rehabilitation
83. The land acquisition may have a slightly greater effect on the livelihoods of
marginal/small farmers. Under the proposed project adequate replacement cost/value paid to
the affected/displaced persons for both the loss of the land/assets and standing crops will help
them to restore their income at the pre-project level and get rehabilitated by themselves with
that support. But during discussions in the surveyed areas, it was suggested that if there was
a provision for income generating skill development training either by the contractor or the
DOI/DWIDP, then it would help the affected people to restore their income.
J. Financing Plan
84. The cost of land compensation/replacement value, monitoring of resettlement plans
and conducting such skills training for income generation will need to be included in the budget
of the proposed project.
K. Institutional Arrangements
85. It is recommended that the construction works of the proposed projects should
commence only after full compensation for all entitlements has been paid, if not voluntarily
donated, and ownership of land is transferred in the name of the project. The sample survey
shows that most of the peoples in the surveyed area were ready to participate in voluntary
land acquisition and it is expected that a similar situation will prevail at other potential project
sites. The Project Co-ordination Office (PCO), with a designated officer, will have to guide,
monitor, and report on land acquisition. Similarly, one authorized officer will need to be
appointed and he/she would be responsible and be held accountable for supervising the
resettlement plan preparation and its implementation. Alternatively, a resettlement specialist
should be hired for institutional development and project management to assist in supervising
the resettlement activities. At each proposed project level social assessment needs to be done
as a baseline survey to determine the category of land/assets, their value at the prevailing
rate, the likely resettlement impacts, based on which a short resettlement plan will be prepared
by the concerned agency with necessary land survey and social impact assessment
undertaken by private firms during the detailed design stage. It will be better to prepare the
complete resettlement plan after the baseline survey and study because it will help with
efficient and effective implementation of the project.
WRPPF-Package 3: Flood Hazard Mapping & Preliminary Preparation of Risk Management Projects 31 Final Report May 2016
Volume 4: Appendix F Lahmeyer International in association with Total Management Services
L. Assessment of the Additional Views on the Potential Social Impacts of Possible Land Acquisition and Resettlement
In addition it is also worth sharing and discussing the affected people’s views with the views of the dominant groups like the Brahmins and Chhetri at this preliminary stage
of the proposed project on the potential social impacts of possible land acquisition and
resettlement plans.
It is also suggested that if community property such as the community forest may be
damaged, it should also be compensated through negotiations with the community that
uses it in the presence of the representatives of the VDC and the District Forest Office.
Alternatives for rebuilding or relocating such community places or common property
such as the Chautaro (community resting place) can be suggested and the community
will be more likely to accept it.
The pilot survey shows that even people not affected by flooding are ready to make
voluntary contributions of the required amount of land for the proposed flood mitigation
measures if they are confident that construction of such flood embankments to control
flooding from Mawa Ratuwa river will be implemented due to the increased intangible
and tangible benefits that will accrue as well as the potential increase in land values
after completion of the flood protection project.

WRPPF-Package 3: Flood Hazard Mapping & Preliminary Preparation of Risk Management Projects i Final Report May 2016
Volume 4: Appendix F Lahmeyer International in association with Total Management Services
ANNEX 8: ENVIRONMENTAL CONSIDERATIONS

WRPPF-Package 3: Flood Hazard Mapping & Preliminary Preparation of Risk Management Projects ii Final Report May 2016
Volume 4: Appendix F Lahmeyer International in association with Total Management Services
ANNEX 8
ENVIRONMENTAL CONSIDERATIONS
CONTENTS
I. PROJECT DESCRIPTION ..................................................................................................... 1
II. ENVIRONMENTAL CONCERNS .......................................................................................... 3
A. Inundation area ............................................................................................................. 3
B. Land use change by construction of the embankments ............................................... 3
C. Cultivated land protected by the embankment ............................................................. 3
D. Water Logging .............................................................................................................. 3
E. Protection of houses ..................................................................................................... 4
III. MITIGATION MEASURES ..................................................................................................... 5
A. Compensation for loss of cultivated and households ................................................... 5
B. Compensation to loss of vegetation and forest area .................................................... 6
IV. CONCLUSION ....................................................................................................................... 7
LIST OF FIGURES
Figure 1: Distribution of the flood mitigation infrastructures in the Mawa Ratuwa basin ............. 1
LIST OF TABLES
Table 1: Proposed flood mitigation infrastructures ..................................................................... 2
Table 2: Land use occupied by the embankment [ha] ................................................................ 3
Table 3: Houses prevented from the flooding ............................................................................ 4

WRPPF-Package 3: Flood Hazard Mapping & Preliminary Preparation of Risk Management Projects 1 Final Report May 2016
Volume 4: Appendix F Lahmeyer International in association with Total Management Services
I. PROJECT DESCRIPTION
1. A combination of embankments, spurs, and check dams are proposed to mitigate flood
risk in the Lakhandehi basin. The followings are the details of the proposed flood mitigation
infrastructure:
2. A total of about 21 km long embankments are proposed to prevent flooding in the
Mawa Ratuwa basin. These embankments are strategically sited on both banks of the Mawa
Ratuwa River and distributed in 2 VDCs and 1 Municipality of Jhapa District, and 4 VDCs of
Morang District. The distribution of the embankments are presented in the map below.
Figure 1: Distribution of the flood mitigation infrastructures in the Mawa Ratuwa basin

WRPPF-Package 3: Flood Hazard Mapping & Preliminary Preparation of Risk Management Projects 2 Final Report May 2016
Volume 4: Appendix F Lahmeyer International in association with Total Management Services
3. Spurs – a total of 38 sloping spurs and 64 solid spurs are proposed to be constructed
to prevent bank erosion. These will be located on both sides of the Mawa Ratuwa river.
4. Check dams – 52 check dams are proposed to be located in upstream areas on
tributaries of the Mawa Ratuwa river to reduce sediment flow.
5. Details of the mitigation works are presented in the table below:
Table 1: Proposed flood mitigation infrastructures
SN Description of work Location Unit Quantity
1 Embankment/Revetment Left Bank Km 11.00
Right Bank Km 10.0
Total Km 21.0
2 Solid Spur Left Bank Nos 30
Right Bank Nos 34
Total Nos 64
3 Slopping Spur Left Bank Nos 20
Right Bank Nos 18
Total Nos 38
4 Check Dam Nos 52

WRPPF-Package 3: Flood Hazard Mapping & Preliminary Preparation of Risk Management Projects 3 Final Report May 2016
Volume 4: Appendix F Lahmeyer International in association with Total Management Services
II. ENVIRONMENTAL CONCERNS
A. Inundation area
6. The primary purpose of the flood embankments is to reduce the impact of flooding to
the population, as well as to the social and economic entities. The embankment design was
based on the flood modeling scenario of 50 year return period taking climate change into
account. Furthermore, three parameters of flooding were considered for the design –
maximum flood depth, maximum flood velocity and max flood hazard. Under these scenarios,
the study has revealed that the proposed embankments will reduce the inundated area by
1502 ha.
B. Land use change by construction of the embankments
7. A total of about 21 ha will be required for construction of the embankment. The sites
for the embankment are located in areas which are currently cultivated as a result of which,
about 14.4 ha of cultivated land will be lost directly to the embankments. The table below
shows current land use on the area that will to be occupied by the embankments
Table 2: Land use occupied by the embankment [ha]
SN Land use Area [ha]
1 Agriculture 14.4
2 Bare area 1.6
3 Built-up area 0.8
4 River Floodplain 4.4
Grand Total 21.1
C. Cultivated land protected by the embankment
8. Though 21 ha of cultivated land will be lost directly for construction of the
embankments, a large area of cultivated land will also be prevented from the flooding and
inundation. Of the 1502 ha protected, about 1286 ha of cultivated land will be prevented from
flooding in a 50 years plus climate change scenario.
D. Water Logging
9. The embankments will protect some low-lying lands. These embankments do not
disturb existing streams. However, they might disturb some natural drainages that flush out
rain water and surface water to the Mawa Ratuwa River. As a result of this, water logging
around the embankments may take place. The drainage network and cross drainage to
dispose the water collected from the area around the embankment shall be designed taking
the terrain, rainfall and water use into account.

WRPPF-Package 3: Flood Hazard Mapping & Preliminary Preparation of Risk Management Projects 4 Final Report May 2016
Volume 4: Appendix F Lahmeyer International in association with Total Management Services
E. Protection of houses
10. The flood modelling simulation has shown that a large number of house will be
inundated by the flooding. The proposed embankments are expected to prevent the flooding
of about 1258 houses in the Mawa Ratuwa basin. The VDCs and Wards where houses would
be protected are shown in the table below.
Table 3: Houses prevented from the flooding
VDC Ward No.
1 3 6 8 9 12
Damak Municipality
Itahara
Jhurkiya
Khajurgachhi
Kohabara
Sijuwa

WRPPF-Package 3: Flood Hazard Mapping & Preliminary Preparation of Risk Management Projects 5 Final Report May 2016
Volume 4: Appendix F Lahmeyer International in association with Total Management Services
III. MITIGATION MEASURES
A. Compensation for loss of cultivated and households
11. Loss of land for construction of infrastructure is expected to be the most significant
impact of this project. The permanent acquisition of land can have long term impacts. The
cultivated land and settlements are usually owned by local residents which needs to be
adequately compensated
Land Acquisition Act 1977, article 13 (1) has made a provision for paying compensation in
cash. However cash compensation could produce negative impacts in terms of proper use
of cash on families who are not used to large cash flow. Also, those households severely
affected by loss of large amounts of land can be left with no productive resources. In such
conditions which may require special rehabilitation assistance, priority should be given to
land-for-land compensation provided, if so desired by affected families and if ailani
(unclaimed land) or other government land is available.
After the acquisition of land if the remaining portion is considered too small to be viable for
cultivation or other use, the owner will have the option to relinquish the remainder of that
parcel or landholding if they desire so. Such a limit should be decided after the detailed
socio-economic survey based on the area boundaries set by the final design. Affected
families who choose to relinquish the whole parcel of affected land will be entitled to
assistance with the identification and purchase of replacement land or cash compensation
at replacement cost for the entire parcel or landholding.
There is a provision for paying compensation for the loss of crops, trees and damage to
walls under the Land Acquisition Act of 1977. Attempts shall be made to protect trees
standing on the privately owned land to be acquired, by paying separate compensation to
avoid large scale cutting of trees in the project area, thereby maintaining a favorable
environment.
Construction works shall, as far as possible, be planned to allow for the harvesting of
standing crops before land is acquired. Where crops cannot be harvested or the
destruction of crops is unavoidable, cash compensation shall be paid, based on market
values.
In order to replace the loss of farmland, if any affected household purchases farmland in
another place within 1 year from the date of receiving compensation, the land registration
fees for the purchased replacement land of equal amount or equal price and all
government taxes and duties related to the acquisition and registration of affected assets
will be borne by the project.
Special attention shall be given to protect the interests of economically and socially
vulnerable groups, such as women-headed households, the poor, the old, minority ethnic
groups, and the landless. Neither caste, religion nor the ethnic affiliation should be a bar
to compensation and rehabilitation assistance.

WRPPF-Package 3: Flood Hazard Mapping & Preliminary Preparation of Risk Management Projects 6 Final Report May 2016
Volume 4: Appendix F Lahmeyer International in association with Total Management Services
B. Compensation to loss of vegetation and forest area
12. Acquisition of forest area and removal of vegetation will be carried out for construction
of the flood mitigation infrastructures.
Vegetation/forest inventory shall be carried out where embankments are proposed to be
constructed.
The government has made it mandatory to plant 25 saplings for each lost tree. Therefore,
the inventory has to identify all the trees that had to be removed for the project, and plant
sapling during the construction and operation phase of the project. Furthermore, emphasis
shall be given to minimize removal of the tree.
The forest area that are lost to the construction needs to be compensated by carrying out
compensatory plantation in the barren land and waste land in coordination with district
forest office.

WRPPF-Package 3: Flood Hazard Mapping & Preliminary Preparation of Risk Management Projects 7 Final Report May 2016
Volume 4: Appendix F Lahmeyer International in association with Total Management Services
IV. CONCLUSION
13. About 21 km long embankments are proposed to control the flooding of the Mawa
Ratuwa basin. A large part of the land on which the embankments are proposed to be
constructed is cultivated land and 14.4 ha of the cultivated land will be lost to the construction.
However, these embankments are expected to prevent flooding of about 1502 ha of land of
which 1286 ha is cultivated land for a 50 year plus climate change scenario. Furthermore
about 1258 houses in 5 VDCs and Damak municipality will also be protected from the flooding.