Document of The World Bankdocuments.worldbank.org/curated/en/514671468300575864/...Document of The...
89
Document of The World Bank Report No: ICR00001801 IMPLEMENTATION COMPLETION AND RESULTS REPORT (IDA-32170, IDA-32171, IDA-3217A) ON A CREDIT IN THE AMOUNT OF SDR 15.5 MILLION (US$21.4 MILLION EQUIVALENT) TO THE REPUBLIC OF MADAGASCAR FOR A MICROFINANCE PROJECT IN SUPPORT OF THE FIRST PHASE OF THE MICROFINANCE PROGRAM September 30, 2011 Finance and Private Sector Development AFCS4 Africa Region Public Disclosure Authorized Public Disclosure Authorized Public Disclosure Authorized Public Disclosure Authorized Public Disclosure Authorized Public Disclosure Authorized Public Disclosure Authorized Public Disclosure Authorized
Transcript of Document of The World Bankdocuments.worldbank.org/curated/en/514671468300575864/...Document of The...

Document of The World Bank
Report No: ICR00001801
IMPLEMENTATION COMPLETION AND RESULTS REPORT (IDA-32170, IDA-32171, IDA-3217A)
ON A
CREDIT
IN THE AMOUNT OF SDR 15.5 MILLION (US$21.4 MILLION EQUIVALENT)
TO THE
REPUBLIC OF MADAGASCAR
FOR A
MICROFINANCE PROJECT
IN SUPPORT OF THE FIRST PHASE OF
THE MICROFINANCE PROGRAM
September 30, 2011
Finance and Private Sector Development AFCS4 Africa Region
Pub
lic D
iscl
osur
e A
utho
rized
Pub
lic D
iscl
osur
e A
utho
rized
Pub
lic D
iscl
osur
e A
utho
rized
Pub
lic D
iscl
osur
e A
utho
rized
Pub
lic D
iscl
osur
e A
utho
rized
Pub
lic D
iscl
osur
e A
utho
rized
Pub
lic D
iscl
osur
e A
utho
rized
Pub
lic D
iscl
osur
e A
utho
rized
ii
CURRENCY EQUIVALENTS
(Exchange Rate Effective December 31, 2010)
Currency Unit = Malagasy Ariary (MGA) MGA 2,000 = US$1
US$1.54 = SDR 1
FISCAL YEAR January 1 – December 31
ABBREVIATIONS AND ACRONYMS
AGEPMF Project Coordination Unit APIMF Apex Microfinance Professional Association APL Adaptable Program Loan APMF Microfinance Apex Association AROA Adjusted Return on Assets BCM Banque Centrale de Madagascar CAS Country Assistance Strategy CECAM Caisses d’Epargne et de Crédit Agricole Mutuels (Agricultural Savings and
Credit Cooperative) CEM Country Economic Memorandum CGAP Consultative Group to Assist the Poor CNAPS Social Security Administration CSBF Commission de Supervision Bancaire et Financière DCA Development Credit Agreement DID Développement International Des Jardins FM Financial Management FSAP Financial Sector Advisory Program FSS Financial Self Sufficiency GNI Gross National Income IBFI International Banking and Finance Institute IBRD International Bank for Reconstruction and Development ICR Implementation Completion and Results Report IDA International Development Association IMF International Monetary Fund IO Intermediary Outcome IRAM Institut de Recherches et d’Application des Méthodes de développement ISR Implementation Status and Results Report KPI Key Project Indicator M&E Monitoring and Evaluation MAP Madagascar Action Plan MEC Mutuelle d’Epargne et de Crédit MFI Microfinance Institution MGA Madagascar Ariary MTR Mid-Term Review

iii
NPL Non-Performing Loan OSS Operational Self Sufficiency PAD Project Appraisal Document PAR Portfolio at Risk PASEF Financial Services Project PCU Project Coordination Unit PDO Project Development Objective PIU Project Implementation Unit PP Project Paper PPF Project Preparation Facility RFTAP Rural Finance Technical Assistance Project ROA Return on Assets ROE Return on Equity SDI Subsidy Dependence Index SDR Special Drawing Rights SLA Savings and Loan Association SSA Sub-Saharan Africa TA Technical Assistance TOT Training of Trainers TTL Task Team Leader UNCDF United Nations Capital Development Fund WOCCU World Council of Credit Unions
Vice President: Obiageli Katryn Ezekwesili
Country Director: Haleh Z. Bridi
Sector Manager: Michael J. Fuchs (Acting)
Project Team Leader: Korotoumou Ouattara
ICR Team Leader: Zahia Lolila

iv

v
REPUBLIC OF MADAGASCAR Microfinance Project
CONTENTS
Data Sheet A. Basic Information B. Key Dates C. Ratings Summary D. Sector and Theme Codes E. Bank Staff F. Results Framework Analysis G. Ratings of Project Performance in ISRs H. Restructuring I. Disbursement Graph
1. Project Context, Development Objectives and Design ........................................................... 1
2. Key Factors Affecting Implementation and Outcomes ........................................................ 12
3. Assessment of Outcomes ...................................................................................................... 19
4. Assessment of Risk to Development Outcome ..................................................................... 35
5. Assessment of Bank and Borrower Performance ................................................................. 36
6. Lessons Learned .................................................................................................................... 41
7. Comments on Issues Raised by Borrower/Implementing Agencies/Partners ....................... 42
Annex 1: Project Costs and Financing ......................................................................................... 43
Annex 2: Outputs by Component ................................................................................................ 45
Annex 3. Economic and Financial Analysis ................................................................................. 57
Annex 4. Bank Lending and Implementation Support/Supervision Processes ............................. 65
Annex 5. Beneficiary Survey Results ........................................................................................... 67
Annex 6. Stakeholder Workshop Report and Results ................................................................... 68
Annex 7. Summary of Borrower's ICR and/or Comments on Draft ICR ..................................... 69
Annex 8. Comments of Cofinanciers and Other Partners/Stakeholders ....................................... 70
Annex 9. List of Supporting Documents ...................................................................................... 71
Map ............................................................................................................................................... 73

vi
List of Tables Table 1. Grouping of PDO Indicators and Intermediate Indicators ............................................... 4 Table 2. Project Statements of Objectives ..................................................................................... 4 Table 3. List of Original and Revised Targets at Restructuring (2007) by PDOs ......................... 5 Table 4. List of Original & Revised Indicators at Restructuring (2007) - Project Outcome
Indicators .......................................................................................................................... 6 Table 5. Financing Breakdown by Component ........................................................................... 10 Table 6. Breakdown of sources of funds (US$) ........................................................................... 10 Table 7. Additional Financing Cost Breakdown & Disbursement Rate (December 2010) by
Component ..................................................................................................................... 11 Table 8. Achievement of Performance Indicators of MFI Networks (Pre and Additional
Financing Eras) ............................................................................................................... 22 Table 9. Overall Weight ............................................................................................................... 23 Table 10. Top Ten Countries in Borrowers and Savers by Penetration Rates ............................. 23 Table 11. Rating of Project Efficiency (Pre-Additional Financing and Additional financing eras)
........................................................................................................................................ 28 Table 12. MFI Networks’ Profitability/Sustainability Index (December 31, 2010) .................... 30 Table 13. Operating Efficiency Trend of the Supported MFIs .................................................... 31 Table 14. Summary of Overall Outcome Ratings of PDOs ......................................................... 32 Table 15. Outreach Impact on Access to Finance ........................................................................ 33 Table 16. MFI Penetration Rate ................................................................................................... 34 Table 17. Results Framework - Outputs by Component - PDOs ................................................. 45 Table 18. Results Framework - Outputs by Component – IO Indicators .................................... 49 Table 19. Performance of Individual MFI networks (Additional financing era 2007 – 2010) .... 52 Table 20. Impact on Beneficiaries as reported in the AGEPMF Impact Study report 2005 (Pre-
Additional Financing Period) ......................................................................................... 54 Table 21. Consolidated Financial Analysis for the five MFI Networks in December 2010 ....... 57 Table 22. List of Legal Instruments prepared .............................................................................. 59 Table 23. Classification of MFIs (Level 1 – 3) including Capital Adequacy Requirements ....... 60 Table 24. List of new Licenses Issued and Classification of MFIs (2008 – 2010) to MFIs (from
level 1 to 2 & 3) .............................................................................................................. 61

vii
A. Basic Information
Country: Madagascar Project Name: MG-Microfinance
Project ID: P052186 L/C/TF Number(s): IDA-32170,IDA-32171,IDA-3217A
ICR Date: 06/30/2011 ICR Type: Core ICR
Lending Instrument: APL Borrower: GOVERNMENT OF MADAGASCAR
Original Total Commitment:
XDR 12.1 M Disbursed Amount: XDR 14.7M
Revised Amount: XDR 15.5 M Environmental Category: C Implementing Agencies: AGEPMF CSBF Cofinanciers and Other External Partners: The PAD anticipated contributions from other donors as explained below. These pledges were not channeled through the project, and there is no evidence to substantiate whether they were given to MFIs directly or not. Interviews with beneficiary MFIs indicated that UNCDF provided direct support to some of the MFI networks to support women’s credit programs. Contribution from the government was stopped at the time of project restructuring in 2007 at the request of the authorities who had difficulties to honor their commitments. Government: MGA1.8 million (US$913,860) Savings and Loan Association Networks: US$0.2 million UNCDF: US$0.7 EU: US$0.7 Developpement International Desjardins US$0.3 Total Financing including IDA US$20.4 million
B. Key Dates
Process Date Process Original Date Revised / Actual
Date(s)
Concept Review: 09/24/1997 Effectiveness: 10/28/1999 10/28/1999
Appraisal: 11/09/1998 Restructuring(s): 10/22/2002
Approval: 05/20/1999 Mid-term Review: 06/30/2006 02/19/2004
Restructuring(s): 02/23/2007
Closing: 12/31/2004 12/31/2010
C. Ratings Summary C.1 Performance Rating by ICR
Outcomes: Moderately Satisfactory

viii
Risk to Development Outcome: Moderate
Bank Performance: Moderately Satisfactory
Borrower Performance: Moderately Unsatisfactory C.2 Detailed Ratings of Bank and Borrower Performance (by ICR)
Bank Ratings Borrower Ratings
Quality at Entry: Satisfactory Government: Moderately Unsatisfactory
Quality of Supervision: Moderately Satisfactory Implementing Agency/Agencies:
Unsatisfactory
Overall Bank Performance:
Moderately Satisfactory Overall Borrower Performance:
Moderately Unsatisfactory
C.3 Quality at Entry and Implementation Performance Indicators
Implementation Performance
Indicators QAG Assessments (if
any) Rating
Potential Problem Project at any time (Yes/No):
Yes Quality at Entry (QEA):
None
Problem Project at any time (Yes/No):
Yes Quality of Supervision (QSA):
Moderately Satisfactory
DO rating before Closing/Inactive status:
Moderately Satisfactory
D. Sector and Theme Codes
Original Actual
Sector Code (as % of total Bank financing)
Central government administration 6 6
Micro- and SME finance 94 94
Theme Code (as % of total Bank financing)
Gender 13 13
Improving labor markets 13 13
Regulation and competition policy 25 25
Rural markets 24 24
Small and medium enterprise support 25 25 E. Bank Staff
Positions At ICR At Approval
Vice President: Obiageli Katryn Ezekwesili Callisto E. Madavo
Country Director: Haleh Bridi Michael N. Sarris
Sector Manager: Michael J. Fuchs Paul Murgatroyd (Acting)

ix
Project Team Leader: Korotoumou Ouattara Herminia Martinez
ICR Team Leader: Zahia Msuya Lolila-Ramin
ICR Primary Author: Zahia Msuya Lolila-Ramin F. Results Framework Analysis
Project Development Objectives (as stated in the Project Appraisal Document) The original Project Development Objective was to provide increased financial services to the low-income population not served by the traditional banking sector through (a) the formulation of regulations governing microfinance; improvement in business laws applicable to microfinance, notably on collateral, and the establishment of a supervision mechanism for microfinance institutions (MFIs); (b) the design and testing of a training system for microfinance; and (c) the establishment and expansion of MFIs, particularly the savings and loan associations (SLAs). This in long-term will contribute to improved standard of living and productivity. Revised Project Objectives as approved by original approving authority Project objectives were not revised. However they are written differently in the PAD, restructuring document and in the credit and financing agreements (see details under section 1.4, Table 1). Although the wording is different, the three elements of improving long term access, policy and capacity in the microfinance sector remained unchanged and relevant. In the Development Credit Agreement (DCA), the objective included three intermediate outcomes that would be achieved under each component of the project: (i) The establishment of legal and regulatory framework for microfinance operations; (ii) The expansion of microfinance skills (capacity); and (iii) The development of strong and sustainable microfinance institutions through inter alia establishment of a refinancing mechanism. (a) PDO Indicators Below is a summary of achievement of PDO indicators which is complemented by a detailed results framework in Annex 2.
Project Development
Objectives (PDO)
Baseline Value
Original Target Values
(from approval documents)
Formally revised Target Values
Actual Values Achieved at Completion or Target
Years
PDO Indicator 1:*
Enabling legal and regulatory environment for doing microfinance business in Madagascar exists
(Text) -Several legal impediments exist for MFIs operating in Madagascar (including lack of legal supervisory
-Microfinance laws and regulations that reflect international best practice are
-Microfinance laws are effective and regulations that reflect international best practice are adopted including
- Based on the banking law number 95-030 and law number 96-020 (1996) on mutualist financial institutions, prudential and operating rules for mutualist

x
Project Development
Objectives (PDO)
Baseline Value
Original Target Values
(from approval documents)
Formally revised Target Values
Actual Values Achieved at Completion or Target
Years
framework for microfinance institutions and prudential norms). -Usury law exists restricting growth of microfinance sector.
issued, adopted and implemented. -Liberalization of interest rates in microfinance and simplification of legal procedures for collateral seizure.
prudential norms to facilitate effective supervision of microfinance institutions. -Liberalization of interest rates is effective and microfinance collateral is recognized in legal procedures for collateral seizure
and non mutalist MFIs were issued including: 11 regulations; 2 decrees; 8 instructions and 1 legislation to improve microfinance sector. These were developed based on microfinance international best standards. - A law was passed giving the Central bank supervisory role of MFIs with clear mandate. - Microfinance collateral is legally recognized and procedures for collateral seizure were developed based on international best practice. - The usury law was prepared but has not yet been submitted to the Parliament for endorsement due to the transitional nature of the government.
Date achieved 20-May-1999 31-Dec-2004 31-Dec-2010 31-Dec-2010
Comments
Target achieved. The introduction of simplified microfinance prudential norms on capital adequacy, credit risk, limitation on exposures (to staff/Board members) and clarity on regulatory roles and codes of conduct have improved operations of the microfinance sector. The regulator is satisfactorily enforcing the laws; MFIs are adequately trained and are effectively in compliance with the norms. A streamlined registration procedure and supervision mechanism of microfinance institutions is in place for the different types of MFIs (level 1 - 3). Microfinance database and credit bureau managed by the regulator (Central Bank) is operational and has been linked with the credit bureau for banks. This has reinforced regulator’s capacity to supervise and manage risk for the entire financial sector. Although the old usury law has not formally been abolished, MFIs and other financial institutions are not obliged to adhere to it and in fact they currently set competitive market interest rates. (See Annex 3, Table 22, Table 23 and Table 24 for the full list of laws and legal instruments prepared).
PDO Indicator 2:*
Increased access to financial services by low income populations
Value (Quantitative)
3 SLA (microfinance networks) with 59 branches and 22818 members
About 72,500 low income families access financial services provided by SLAs/MFIs - 102 SLAs in operation
Existing five viable SLA networks with 200 SLAs in operation reach about 300,000 members of which 50% are women and 25% from disadvantaged groups
Five SLA Networks (comprised of 236 decentralized MFI branches) exist and are reaching 391538 members with diversified products (savings, loans, pension transfer) of which 51 percent are women.

xi
Project Development
Objectives (PDO)
Baseline Value
Original Target Values
(from approval documents)
Formally revised Target Values
Actual Values Achieved at Completion or Target
Years
-Total savings reach US$2.9 million and -Total outstanding loans US$3.5 million.
Total savings reach US$25 million and Total outstanding loans US$23 million. All MFIs are operationally self-sufficient and profitable.
A total of US$ 29million in savings was mobilized Loan portfolio had outstanding loans valued at US$23 million. The five MFI networks are on average operational self sufficiency (106%) and on average are financially self sufficient (103%).
Date achieved 20-May-1999 31-Dec-2004 31-Dec-2010 31-Dec-2010
Comments (incl. %
achievement)
Target achieved. Membership target was exceeded by 30 percent. About 51 percent of beneficiaries are women. Reported beneficiaries comprise all members (savers only, savings and credit, savings and pension receivers). The total beneficiaries reported comprised 48,022 active loan accounts at closing in December 2010. Savings is prerequisite to loans which in this case indicate that there were more savers than borrowers among the beneficiaries.
PDO Indicator 3:*
Greater efficiency in judicial system for microfinance Institutions (Results are reported under PDO #1)
(Text) Results are reported under PDO #1
Results are reported under PDO #1
Results are reported under PDO #1
Results are reported under PDO #1
Date achieved 20-May-1999 31-Dec-2004 31-Dec-2010 31-Dec-2010
Comments Results are reported under PDO #1
PDO Indicator 4:
Increased productivity and improved standards of living of MFI clients
Value (Text)
No baseline data Impact study to confirm improved standards of living
An impact study (2005) confirmed that standard of living of beneficiaries had improved and land productivity had increased. Sixteen intermittent studies including feasibility studies for expansion were prepared.
Date achieved 20-May-1999 31-Dec-2004 31-Dec-2010
Comments (incl. % achievement)
This impact study was conducted before the 2007 restructuring of the project. The study findings indicate that standards of living of beneficiaries had improved. The study confirmed that overall 57 percent of the interviewed beneficiaries reported that their standards of living had improved as a result of participating in the project. Rural farmers reported that they were able to increase their land surface holding and bought fertilizers and inputs which increased productivity. In Lac Alaotra about 54 percent of interviewed beneficiaries were able to buy improved agriculture equipment, and 48 percent increased their land holding (at appraisal Lac Alaotra was reported to have high incidence of land seizure by money lenders - loan sharks) who were the main source of credit1. In Fianarantsoa, 40 percent reported increased number of livestock holding. Overall 40 percent of the interviewed beneficiaries reported increased revenues, 39 percent had increased
1 Restructuring paper for Additional Financing 2007.

xii
Project Development
Objectives (PDO)
Baseline Value
Original Target Values
(from approval documents)
Formally revised Target Values
Actual Values Achieved at Completion or Target
Years
school enrolment for their children due to income from their businesses. Overall 33 percent reported improved daily diet and 29 percent improved health status of their families. Focus group discussion reported that some borrowers were able to make home improvements due to profits gained from their businesses. Some were able to buy consumer goods like radios, television and fridges. The instability during the additional financing phase (2007 – 2010) made it difficult to undertake another study towards the end which could have provided updated evidence of the improved productivity and beneficiaries’ standard of living.
PDO Indicator 5:
Appropriate supervisory methodologies for MFIs established (Results are reported under PDO #1)
(Text) Results are reported under PDO #1
Results are reported under PDO #1
Results are reported under PDO #1
Results are reported under PDO #1
Date achieved 20-May-1999 31-Dec-2004 31-Dec-2010 31-Dec-2010
Comments
Results are reported under PDO #1
(b) Intermediate Outcome Indicators
Intermediate Outcome Indicator
Baseline Value
Original Target Values
(from approval documents)
Revised Target Values
(as approved by original approving
authority)
Actual Values Achieved at Completion or Target Years
IO Indicator 1: Prudential rules are issued for all MFIs (Results are reported under PDO #1)
(Text) Results are reported under PDO #1
Results are reported under PDO #1
Results are reported under PDO #1
Results are reported under PDO #1
Date achieved 20-May-1999 31-Dec-2004 31-Dec-2010 31-Dec-2010
Comments Results are reported under PDO #1
IO Indicator 2:* Two existing SLAs (Fianaransoa and Toamasina) are strengthened and two new networks are created in Tana and Antsiranana and perform well (Results are reported under PDO #2)
Value (Quantitative)
Results are reported under PDO #2
Results are reported under PDO #2
Results are reported under PDO #2
Results are reported under PDO #2
Date achieved 20-May-1999 31-Dec-2004 31-Dec-2010 31-Dec-2010
Comments (incl. % achievement)
Results are reported under PDO #2
IO Indicator 3: Build Capacity of microfinance through training
Value (Text)
Only few Malagasy have had formal training and can properly manage an MFI
80 persons attend one or more microfinance courses
Training program delivers specially designed and adapted technical modules to practitioners from all MFIs in the country. Evaluation of program confirms increased knowledge
A total of 19 training sessions including Training of Trainers (TOT) were organized through an umbrella microfinance apex association (APMF) for more than 100 MFI staff and practitioners. CSBF trained about 50 staff/Board members of MFI networks on the

xiii
Intermediate Outcome Indicator
Baseline Value
Original Target Values
(from approval documents)
Revised Target Values
(as approved by original approving
authority)
Actual Values Achieved at Completion or Target Years
and skills for proper management of MFIs.
new laws, prudential norms and internal risk control. CSBF staff benefited from; Exchange visits to Indonesia, Sydec Dakar and Boulder. They benefited from seminars offered by the World Bank on financial management/procurement, seminar on Basel norms; IBFI - banking accounting; FIS/BIS managing supervisions /financial risk, Credit Risk management; internship in Swiss Mutualist banks (RAIFFEISEN), K-REP Kenya; Indonesia bank Rakiat and NGO BINA SWADYA etc. AGEPMF resident consultants (DID Canada) offered various in-house training to staff/Board of MFI networks on governance, internal control systems, credit risk management etc. Evaluations reports confirm improved capacity of MFI practitioners (see training reports attached).
Date achieved 20-May-1999 31-Dec-2004 31-Dec-2010 31-Dec-2010
Comments
Targets achieved with positive impact at all levels (sector , Central bank, MFI networks staff & Board etc) as evidenced by solid capacity of MFI networks in credit risk and operations management and the effective regulation/supervision of MFIs by the regulator. There is evidence of increasing number of microfinance specialists in the country who provide consultancy services. MFI practitioners interviewed confirmed that there are sufficient courses in microfinance in Madagascar compared to 1999 where most of the trainings were conducted abroad.
IO Indicator 4:* Financial Self Sufficiency (FSS) (Core Indicator)
Value (Text)
N/A N/A FSS for all MFIs to be measured (< 100% for all MFI networks)
The five MFI networks achieved 103% average financial self sufficiency
Date achieved 20-May-1999 31-Dec-2004 31-Dec-2010 31-Dec-2010
Comments (incl. % achievement)
Target achieved satisfactorily. OSS & FSS were added as core mandatory indicators. Average OSS achieved was 106 percent (against 122 percent baseline (2006*) set at restructuring2 and against international best practice of 100 percent breakeven point. The OSS targets established at restructuring were based on a good trend performance of prior years (before additional financing) but they proved to be ambitious during the turbulent era of additional financing. Average FSS achieved of 103 percent is quite good3 as international best practices have proved that institutional development of rural MFIs can
2 There was no OSS target established for 2010 during restructuring as the project was to end in 2009. Also no FSS targets were established as this core indicator was added after restructuring was completed. 3 No targets were established for FSS.

xiv
Intermediate Outcome Indicator
Baseline Value
Original Target Values
(from approval documents)
Revised Target Values
(as approved by original approving
authority)
Actual Values Achieved at Completion or Target Years
take up to 15 years to become fully financially self sufficient (breakeven at 100% FSS) due to high start-up costs (fixed/operating) particularly in remote rural settings dealing mainly with agriculture loans as was the case in this project. The FSS is an excellent measure of efficiency and efficacy of MFIs as it takes into account costs of funds and inflationary effects as opposed to OSS which focus on coverage of operational costs. At closing the FSS achieved for two MFIs (Diana and Fianarantsoa) was far above the breakeven point. These two networks are the best performers with Diana being the main source of loans to other MFI networks at 12% interest rate which is slightly below average market rate of 15%. The FSS for three MFI Networks were slightly below the 100% breakeven point (OTIV Tana 94.5%; Alaotra Mangoro 99.14% and Toamasina 97.16%). OTIV Tana which covers semi urban settings had high incidence of borrowing from commercial banks which comes with high cost of funds. Also commercial borrowing shrunk in 2009/10 due to financial crisis. (See Annex 2 for a thorough performance assessment of OSS & FSS for the five MFI networks).
IO Indicator 5: Portfolio At Risk (PAR) (Core Indicator)
Value (Text)
N/A NPL to be measured
MFI networks have NPL of 10% against the industry norm of 5%..
Date achieved 20-May-1999 31-Dec-2010 31-Dec-2010
Comments
PAR (NPL) was core mandatory indicator added later to the project. NPL ratio decreased by 4% from 14% observed in 2009 during the financial and political crisis. This means an estimated overall average repayment rate of 90 percent (30 days past due loans) against 95 percent estimated target during restructuring in 2007. Loan underwriting was slowed down in 2009/2010 to focus on risk management and loan recovery. Overall MFIs made profits with 17 percent Return on Equity (ROE) in 2010 albeit the worries on portfolio at risk. The microfinance sector as a whole in sub-Saharan Africa (SSA) suffered losses and raising NPL in 2009 – 2010 (see sub-Saharan Africa (SSA) microfinance performance details under section 3.2 – 3.4)..
IO Indicator 6: Number of active loan accounts – Microfinance (Core Indicator) Value
4,027 70,212 48022
Date achieved 20-May-1999 31-Dec-2010 31-Dec-2010
Comments (incl. % achievement)
Target achieved at 68%. Loan underwriting which was steady prior to 2009 crisis was substantially decreased in 2010. Despite the decrease, the networks remained profitable and were on average operationally self sufficient (106%). This figure includes only loan accounts as opposed to overall beneficiaries’ number which include borrowers and savers (including pensioners).
IO Indicator 7: Active loan accounts for women) (Core Indicator)
Value 1562 4,505 18715
Date achieved 20-May-1999 31-Dec-2010 31-Dec-2010
Comments
Target achieved and exceeded. Loans to women groups were above 50%. Special associations were established to accommodate the needs of women from the low income groups. The women tailored program has been mainstreamed to core products of MFI networks.

xv
G. Ratings of Project Performance in ISRs
No. Date ISR Archived
DO IP Actual Disbursements
(USD millions) 1 06/30/1999 Satisfactory Satisfactory 0.00 2 11/22/1999 Satisfactory Satisfactory 1.88 3 05/15/2000 Satisfactory Satisfactory 2.35 4 10/16/2000 Satisfactory Satisfactory 3.12 5 05/29/2001 Satisfactory Satisfactory 4.12 6 11/29/2001 Satisfactory Satisfactory 5.73 7 05/15/2002 Satisfactory Unsatisfactory 6.32 8 09/26/2002 Satisfactory Unsatisfactory 6.74 9 04/28/2003 Satisfactory Satisfactory 7.69
10 11/06/2003 Unsatisfactory Satisfactory 9.46 11 03/02/2004 Unsatisfactory Satisfactory 9.56 12 05/11/2004 Unsatisfactory Satisfactory 10.12 13 11/18/2004 Satisfactory Satisfactory 10.66 14 06/13/2005 Satisfactory Satisfactory 12.98 15 12/13/2005 Highly Satisfactory Satisfactory 13.90 16 06/26/2006 Highly Satisfactory Satisfactory 15.34 17 12/29/2006 Highly Satisfactory Satisfactory 15.80 18 06/25/2007 Highly Satisfactory Satisfactory 16.22 19 10/31/2007 Satisfactory Satisfactory 16.35 20 06/12/2008 Satisfactory Satisfactory 17.80 21 12/19/2008 Satisfactory Moderately Satisfactory 19.23 22 06/19/2009 Moderately Satisfactory Moderately Satisfactory 19.29 23 12/29/2009 Moderately Satisfactory Moderately Satisfactory 19.29 24 05/31/2010 Moderately Satisfactory Moderately Satisfactory 19.29 25 03/27/2011 Moderately Satisfactory Moderately Satisfactory 20.98
H. Restructuring (if any)
Restructuring Date(s)
Board Approved PDO
Change
ISR Ratings at Restructuring
Amount Disbursed at
Restructuring in USD millions
Reason for Restructuring & Key Changes Made
DO IP
10/22/2002 U S 6.94
The political crisis made it necessary to restructure the project and enable the Bank finance all activities at 100% without government contribution to allow for effective implementation. Government contribution was not easily forthcoming and that affected implementation.

xvi
Restructuring Date(s)
Board Approved PDO
Change
ISR Ratings at Restructuring
Amount Disbursed at
Restructuring in USD millions
Reason for Restructuring & Key Changes Made
DO IP
2007 HS S 16.22
Additional financing was to bridge the gap required to prepare the Financial Services Project (PASEF) program through which the subsequent phases of the microfinance adaptable program loan (APL) were to be undertaken.
I. Disbursement Profile

1
1. Project Context, Development Objectives and Design
1.1 Project Description
1. The microfinance project was the first phase of a 15-year microfinance program aimed at fostering a sustainable microfinance system to address the lack of financial services for lower income population and contribute to the national objective of poverty reduction. A study on poverty changes4 in Madagascar revealed that poverty rose from an already high level of 70 percent in 1993, to 73.3 in 1997, before falling to 71.3 in 1999. This pattern of change, which corresponded to the evolution of macroeconomic policy during that period, was restricted primarily to urban areas. Populations in rural areas witnessed persistent increases in poverty despite market reforms, as structural constraints including remoteness and low land productivity affected their ability to escape poverty. Small scale agricultural households were hit particularly hard. Access to financial services was limited as all banks were state owned and failing. Attempts to develop credit operations to smallholder farmers had not been successful, as the banking sector, mainly the public banks which were to lend to low-income clients, had ill-adapted products, high costs, and poor recovery rates.
2. Rationale for Bank Assistance: The Microfinance program was designed to increase access to finance for low income population, and improve policy and capacity in the microfinance sector. This was to be achieved through the establishment of an appropriate legal, regulatory and supervisory framework for microfinance, the expansion of microfinance skills, and the development of strong and sustainable local institutions. The program built on successful experiences piloted under the World Bank-financed Rural Finance Technical Assistance Project (RFTAP) (Cr. 2459-MAG), designed in 1993, which developed a new approach of delivering savings-based credit through the creation of savings and loan associations (SLAs) also known as financial cooperatives. Recognizing that traditional approaches to rural finance were ineffective and paid little attention to savings, RFTAP aimed to promote a sustainable savings and loan movement at the grass-roots level that would provide sound financial services to its members and over time link up with formal institutions. Under RFTAP, between 1993 and 1997, a law was promulgated and three microfinance networks totaling 54 SLAs/financial cooperatives were created with about 175 members per SLA on average and average savings of US$15-US$20 per person. These SLAs were subsequently licensed as microfinance institutions (MFIs) under the new law. The experience brought to light the importance of capacity building in microfinance and the time needed for MFIs to break even and become sustainable. Experience had also proved that this type of intervention required sustained support over a long period of time to support policy development and implementation. Thus, an Adaptable Program Loan (APL) was chosen as the instrument to support the program over a 15-year period in three five-year tranches with the aim to ensure long-term viability of SLAs (or MFIs). Phase I would support the development of a legal/regulatory and supervisory framework for microfinance institutions (MFI); the design and testing of a national training program in microfinance; and the establishment of SLAs in four of Madagascar's six provinces. Phase II would support the
4 Stefano Paternostro et al, 2001, Cornell Food and Nutrition Policy Program Working Paper No. 120

2
consolidation of the SLAs by expanding coverage in the areas where they were established, and, if feasible, penetrate into other areas to reach a sustainable scale and cost structure. It would also implement a microfinance training program. Phase III would finally help strengthen the financial core of SLA networks and support its evolution into full-fledged self-sustainable financial institutions.
3. The Microfinance program supported the Government's objective of reducing widespread poverty, which was at the center of the Country Assistance Strategy (CAS, document number 16249-MAG, February 1997). Improving access to financial services—a frequently cited constraint to agricultural and entrepreneurial activity in Madagascar—was to support the CAS objectives of rural development as well as private sector development. Government’s aim was to improve financial intermediation to support investment and growth. Microfinance was seen as a vehicle for financial deepening and a means to compensate for the failure of the banking sector in providing financial services to people with limited resources. The project was to help alleviate poverty by making financial services (both credit and savings facilities) available to an increasing number of lower income populations, especially small-scale farmers, artisans, traders and women. This would help increase productivity, incomes, and living conditions. The program also supported the CAS objectives of sustainability, capacity building, stakeholder consultation, donor collaboration and continuous learning (building on the pilot RFTAP).
1.2 Context at Appraisal
4. At appraisal, the Malagasy financial system was embryonic, and represented a constraint to investment and economic activity. In 1998, the system comprised six commercial banks (two state-owned, being privatized), a savings bank, three insurance companies (two state-owned), four savings and loans associations (SLAs) also known as financial cooperative networks, and two small donor-supported microfinance institutions (MFIs). Madagascar’s financial sector reforms led to the closing of many rural bank branches and further widened the gap in access to financial services by the poor and people in the rural areas. The Government was aware of the financial sector constraints. It was committed to address them by pursuing macroeconomic policies that ensured price stability, which is a precondition for financial sector development. Equally, it was committed to further liberalize the sector. The Government's strategy for microfinance was spelled out in its Letter of Development Policy of April 1999: the objective of improving access to financial services was part of the financial sector strategy. Reflecting this commitment, the Government had encouraged private initiatives in support of MFI development and enacted legislation promoting and regulating MFIs under the Rural Finance Technical Assistance Project (RFTAP) upon which the microfinance project was built.
1.3 Original Project Development Objectives (PDO) and Key Indicators (as approved)
5. The original Project Development Objective was to provide increased financial services to the low-income population not served by the traditional banking sector. The project aimed to set up an appropriate policy framework for the development of microfinance and to help establish microfinance institutions. The Project development objective was to be measured through the following key outcome Indicators:

3
a) Enabling laws and regulations for MFIs
b) Greater efficiency in the judicial system (through improved legal texts and legal procedures)
c) Appropriate supervisory methodologies for MFIs established
d) Outreach to low-income families (about 72,500 low-income families accessing financial services provided by SLAs)
e) Increased productivity and improved standards of living of the beneficiary households
1.4 Revised PDO (as approved by original approving authority) and Key Indicators, and reasons/justification
6. The PDO remained unchanged throughout the project. However, it was expressed differently in the original PAD, the restructuring paper and DCA.
7. The Key Outcome Indicator for assessing the achievement of the PDO for this project is, therefore, indicator #2 which is “increased access to financial services by low income population.” More than 70 percent of the project budget and the level of effort were directed to support this objective.
8. Some of the targets were changed and new indicators introduced during project implementation (See Table 4). The results framework for this ICR is based on the revised indicators adopted in 2007 when the project was restructured as well as core indicators (Operational Self Sufficiency (OSS) & Portfolio at Risk (PAR) or Non Performing Loans - NPL) which were added later. All baseline values are as of June 1999 except for mandatory core indicators which did not have a baseline as they were added towards the end of the project. The analysis in section 3.2 has taken into account the targets for operational self-sufficiency (OSS) which were established in the restructuring paper (2007).
9. The justification of overall outcome rating under section 3.4 has been split for two periods of project implementation (before and after additional financing) and a weighted method has been adopted for this assessment. The same method has been used in sections 3.2 and 3.3 to rate achievement of PDOs and project Efficiency/Efficacy. Although the PDO of the project was never changed, the analysis has adopted the weighting method in order to effectively recognize the outcomes achieved during the two separate eras (Pre Additional Financing period and the Additional Financing period that started in 2007 when the project was restructured and lasted until 2010.
10. The results framework has several similar indicators (project development objectives - PDOs & intermediate outputs - IOs). Some adjustments were made for improved analysis and reporting. Two PDO indicators were, thus, combined and two intermediate outcome indicators were matched with relevant PDO indicators for analysis of results (see table below).

4
Table 1. Grouping of PDO Indicators and Intermediate Indicators
Grouping of indicators Comment on adjustments PDO Indicator #1 Enabling legal and regulatory environment for doing microfinance business in Madagascar exists
PDO Indicator #3: Greater Efficiency in judicial system for microfinance institutions
Results for PDO #3 are reported under PDO Indicator #1
PDO Indicator #5: Appropriate supervisory methodologies for MFIs established
Results for PDO #5 are reported under PDO Indicator #1
Intermediate Outcome Indicator #1: Prudential rules are issued for all MFIs
Results for IO#1 are reported under PDO Indicator #1.
PDO Indicator #2 Increased access to financial services by low income populations
Intermediate Outcome Indicator #2: Two existing SLAs (Fianarantsoa and Toamasina) are strengthened and two new networks are created in Tana and Antrisanana and perform well
Results for IO #2 are reported under PDO Indicator #2
Table 2. Project Statements of Objectives
Objective as stated in the PAD
Objective as stated in the DCA
Objective as stated in the
Project Paper – Additional financing
Objectives as stated in Project
Agreement
To provide increased financial services to the low-income population not served by the traditional banking sector.
To assist the Borrower in a) Carrying out the first phase of its program to provide about 80,000 low-income families engaged in small-scale farming, livestock, fishing, commerce, and handicrafts production activities with long-term access to financial services thereby improving their productivity, income and living standards and conditions. b) The establishment of legal and regulatory framework for microfinance operations c) The expansion of microfinance skills and d) The development of strong and sustainable microfinance institutions through inter alia establishment of a refinancing mechanism.
To increase long-term access to financial services to low-income populations in Madagascar.
Providing increased financial services to the low-income population not served by the traditional banking sector.

5
11. Although the objective is expressed differently the three elements of improving long term access, policy and capacity in the microfinance sector which were core to the original PAD objective remained unchanged and relevant. These three elements were consistently used in the Implementation Status and Results (ISR) reports and have been used to judge the achievement of PDOs for this Implementation Completion and Results (ICR) Report. Improving “access” carries more weight than the other two elements since more than 70 percent of the budget and most of the level of effort was directed to support this objective than the other two. Some of the targets were changed and new indicators introduced during project implementation (see table below). The results framework for this ICR is based on the revised framework adopted in 2007 when the project was restructured as well as mandatory corporate indicators which were added later. The end-of project targets in the results framework are thus those in the project paper of 2007. All baseline values are as of June 1999 except for mandatory core indicators which did not have a baseline as they were added towards the end of the project. ICR reporting on the Outcomes at completion is based on revised targets where applicable.
12. Project outcome indicators as well as other key performance indicators (KPIs) and targets were revised during restructuring in 2007 as explained before and summarized in the table below.
Table 3. List of Original and Revised Targets at Restructuring (2007) by PDOs
PDO Indicators Original target at appraisal in
1999 Revised target in 2007
PDO 1: Enabling laws and regulations for MFIs
Microfinance law and regulations that reflect international best practice are issued, adopted and implemented
Microfinance law is effective and regulations that reflect international best practice are issued, adopted, and implemented
PDO 2: Increased access to financial services by low income populations
About 72,500 low income families access financial services provided by SLAs/MFIs
Existing five SLA networks are viable and able to offer services to 300,000 members
PDO 3: Greater efficiency in judicial system (through improved legal texts and procedures)
Liberalization of interest rates in microfinance and simplification of legal procedures for collateral seizure
Liberalization of interest rates is effective and microfinance collateral is recognized in legal procedures for collateral seizure
PDO 4: Increased productivity and improved standards of living of microfinance clients
Impact study to confirm improved standards of living
Impact study to confirm improved standards of living of SLA members
PDO 5: Appropriate supervisory methodologies for MFIs established
All licensed MFIs are adequately supervised by the authorities
N/A

6
Table 4. List of Original & Revised Indicators at Restructuring (2007) - Project Outcome Indicators
Intermediate Outcome (IO)
Indicators
Original target at appraisal in 1999
Revised target in 2007
IO indicator 1 Prudential rules are issued for all MFIs Appropriate laws and regulations are
passed and implemented for all MFIs.
Appropriate laws and regulations are passed and implemented for all MFIs.
IO Indicator 2* Two existing SLAs (Fianaransoa and Toamasina) are strengthened) and two new networks are created in Tana and Antsiranana and perform well.
149 SLAs exist in at least 4 provinces. Total membership; 72,469 members included 23,351 in disadvantaged groups. Total savings is US$3.5 and total loans is US$4.4 million. MFIs are profitable.
Five SLA networks with 200 SLAs in operation reach about 300,000 members of which 50% are women and 25% from disadvantaged groups Total savings reach US$25 million and Total outstanding loans US$23 million. All MFIs are operationally sustainable.
IO Indicator 3* Build Capacity of microfinance through training 80 people attended one or more
external courses. Training program tested and evaluated. 22 field agents and 46 professional staff are trained each year
Training program delivers specially designed and adapted technical modules to practitioners from all MFIs in the country*. Evaluation of program confirms increased knowledge and skills for proper management of MFIs.
IO Indicator 4** Core
N/A Financial Self Sufficiency (FSS)**
IO Indicator 5** Core
N/A Portfolio At Risk (PAR or NPL)**
IO Indicator 6** Core
N/A Outstanding Microfinance Loan Portfolio**
IO Indicator 8** Core
N/A Number of active loan accounts – Microfinance**
IO Indicator 9** Core
N/A Active loan accounts for women**
* Revised indicator at restructuring ** New mandatory Core World Bank Indicators were introduced after 2007
1.5 Main Beneficiaries
13. The main beneficiaries were the low income populations, particularly those in the rural areas. The project was supposed to help make financial services available in four out of six provinces in Madagascar to low-income households that lacked access to banking services, thereby expanding their incomes and reducing poverty. MFI networks were particularly targeted including women’s savings and credit groups to help them reach an estimated 72,500 low-income families (about 300,000 people) with adapted financial services. Another group of beneficiaries were the Central Bank of Madagascar (BCM) through the Banking Commission (CSBF) for supervision of microfinance, and the umbrella

7
microfinance Professional Association (APIMF) for the training program.
1.6 Original Components
The project had originally four technical components and one administrative component:
Component 1: Improve legal, judicial and regulatory framework (US$0.61 million)
14. Success in the development of microfinance in Madagascar was dependent on the ability of the government to improve the legal regulatory and judicial and supervisory framework. Project funds were made available to (i) support preparation and enactment of laws and regulations that supported development of an inclusive microfinance sector based on international best practices; and (ii) establish competencies at the Secretariat of the Banking Supervisory Commission for inspection of MFI networks rather than delegating this function to an outside entity. This involved preparation of laws and decrees, intensive training of supervisory authorities (courses, seminars, study tours and internships), MFI Board members and MFI staff on the new regulatory framework, including prudential norms, regulators roles, internal control, risk management and reporting.
Component 2: Develop MFIs (US$13.5 million)
15. This component was allocated 82 percent of the International Development Association (IDA) funding to support the development of five microfinance networks. The funding was primarily used to finance resident technical assistance from international microfinance capacity building providers (DID, WOCCU, IRAM) to strengthen the capacity of MFIs to become efficient and viable financial structures. Funding also supported operational expenses for the apex organization, vehicles and equipment, start-up costs for MFIs branches, including expenses associated with the construction of office buildings, staff salaries for the first year of operations, as well as training of staff and the Board.
Component 3: Build Capacity in microfinance (US$0.5 million)
16. This component aimed to address the long-term goal of increasing the microfinance capacity in the country through existing local training institutes and the umbrella association for microfinance institutions. The funding supported training needs assessment, design of the curriculum and training materials, study tours, internships, workshops and seminars for practitioners. The training program was to breed a cadre of trained trainers and trained staff managing the MFIs.
Component 4: Studies (US$0.92 million)
17. This component was to support a number of audits, impact studies and feasibility studies. Audits included financial and management audits of MFIs and the project coordination agency (AGEPMF).
Component 5: Project coordination (US$0.90 million)
18. Project coordination was undertaken by the Executive Secretariat of AGEPMF, an

8
independent agency created by Government decree. The Secretariat was made up of an Executive Secretary, technical and administrative staff with responsibility of coordinating overall project implementation. It is to be noted that a separate agreement was signed between the Central Bank and IDA to allow CSBF - the unit in charge of microfinance development at the Central Bank - to oversee implementation of component 1 (policy reforms) of the project.
1.7 Revised Components
19. Project components were not changed. As explained before (section 1.4 above) targets and some indicators were revised at restructuring in 2007 for the additional financing. Also additional core indicators were introduced (FSS & PAR or NPL).
20. Targets under component 1 were revised to: (i) support the implementation of the Microfinance law rather than a financial cooperative law passed previously as well as the adoption of prudential regulations that were in line with industry best practice, and (ii) strengthen the capacity of the Central Bank (CSBF) to properly supervise MFIs licensed under the new law. A 10 percent of the additional financing went to this component to help CSBF execute its mandate effectively. At closing, 32 percent of budget was utilized with outstanding commitments yet to be paid.
21. Targets under component 2 were revised to help MFIs (i) increase their membership to 300,000 clients of which 50 percent would be women and 25 percent from disadvantaged groups, (ii) increase savings to US$25 million, and credit outstanding to US$23 million, and (iii) achieve operational self-sufficiency (OSS) for all partner MFI networks. Most of the additional financing (74 percent) was allocated to this component and 95 percent of these funds were utilized by the closing date in December 2010.
22. Targets for component 3 were revised to include training of trainers (TOT) curriculum and modules which was done with help from CGAP.5 Only 1.8 percent of the additional budget was allocated to this component of which 88 percent was spent at closing.
23. New targets for Operational Self Sufficiency (OSS) were established in 2007 during restructuring for additional financing. Additional core indicators (FSS & PAR or NPL) were introduced later.
1.8 Other significant changes (in design, scope and scale, implementation arrangements and schedule, and funding allocations)
24. The political crises and implementation of FSAP recommendations which were all unforeseen at the design stage changed the scope of the project and directly contributed to the lengthy implementation period of eleven years. The microfinance project was initially planned to close on December 31, 2004. The project closing date was extended five times with the final closing date being December 31, 2010. The project was restructured in 2002
5 CGAP = Consultative Group to Assist the Poor is a leading microfinance think-tank involved in setting standards and providing training in microfinance.

9
due to unsatisfactory performance on implementation resulting from the first political crisis and again in 2007 to implement FSAP recommendations as explained below. Restructuring and preparation of the additional financing also contributed to the lengthy implementation period.
25. The first two closing date extensions were for one year each from December 31, 2004 to December 31, 2005 and then to December 31, 2006. These extensions were justified by consequences of the December 2001 Presidential elections crisis that led to a slowdown in project activities and disbursement; hence the need for reallocation of project funds including increasing the amount of the authorized allocation for the project coordination unit (AGEPMF).
26. The third extension was from December 31, 2006 to June 30, 2009. The scope of the project changed when FSAP (2005) recommended that microfinance project be part of the larger financial sector project (PASEF). In 2005, the World Bank/IMF Financial Sector Assessment (FSAP) Report had identified persistent lack of access to finance for micro, small and medium enterprises (MSMEs) and the need to design a broader financial sector program that would support banks and non bank financial institutions including microfinance. When the Government of Madagascar was ready to implement these recommendations in 2006 through a sector wide Financial Service Project (PASEF), an agreement was reached with the Bank to consolidate operations and have Phases 2 and 3 of the microfinance APL folded into the PASEF. The microfinance project had achieved overwhelming results at this stage (end 2006) and MFIs had proved to be making very good progress towards sustainability.
27. This third extension to June 2009 (at the request of the Government of Madagascar) allowed the project to complete some key activities and to continue to provide support to the microfinance sector in the absence of a phase 2 APL due to IDA constraints. The microfinance project was, thus, restructured in 2007 when additional financing of US$5 million was approved as bridge finance to facilitate smooth transition of microfinance project to PASEF which was still in preparation as a Specific Investment Loan (SIL). This ensured continued financial support and technical assistance to avoid a serious risk of systemic failure of the microfinance sector if assistance was to be stopped abruptly (the networks supported under the project accounted for over 70 percent of all microfinance savings in the country).6 The supplemental credit was approved by the Board of Executive Directors on April 10, 2007 and was ratified by the Parliament of Madagascar end-June 2007. Tables below show project financing provided during the life of the project including sources of funds.
6 Refer to ISR #18 of the microfinance project for more details.

10
Table 5. Financing Breakdown by Component
1.9 Original
Financing (SDR)
Additional Financing
(SDR)
Total Financing
(SDR)
Total Financing
(US$) A. Improve legal, judicial, and regulatory framework
416,300 340,000 756,300 1,164,702
B. Develop MFIs 8,005,938 2,520,000 10,525,938 16,209,945
C. Build Capabilities in Microfinance
725,193 60,000 785,193 1,209,197
D. Conduct Studies 610,337 110,000 720,337 1,109,319
E. Coordinate Project 982,328 360,000 1,342,328 2,067,185
Equipment 70,000 10,000 80,000 123,200
PPF 0
Totals 10,810,096 3,400,000 14,210,096 21,883,548
Project burn rate at closing 100% (in 2006)
86% December
2010 & 94% April 30, 2011
Exchange rate used: SDR 1 = US$ 1.54 Slight variations are observed on the total budget due to the exchange rate effects. Extension to spend beyond closing date was approved up to April 2011 which resulted to 94 percent burn rate when the credit closed.
Table 6. Breakdown of sources of funds (US$)
From 1999 to
2004 2005 2006 2007 2008 2009 2010 Cumulative %
IDA (US$) 8,321,835 2947917 1265815 5041595 2281996 82031 1628848 17,032,603 93
Government (US$)
913,890 20,081 5078 34676 22117 995,842 5
Other Sources (Short Term Debt)
796,152 1,300 -386860 14038 -235911 143328 332,046 2
TOTAL 10,031,877 2,971,303 886,040 554,881 2,070,211 227,368 1,630,858 18,360,491 100
Source: Project documents (AGEPMF progress report – April 2011) Notes: Conversion rate US$1 = MGA 2000. Totals are slightly different from project documents due to exchange rate fluctuations. It is not clear in the report what the source of the short term (ST) debt was. Also Government contribution quoted beyond the APL phase (may include the office space and salary of project coordinator who was government employee)
28. The fourth closing date extension period was from July 1, 2009 to June 30, 2010, which was followed by the fifth and last extension of six months to December 31, 2010. These two extensions were due to the political crisis that hit Madagascar following a coup in March 2009 and were to allow the project to remain open through the crisis period. The crisis led to the country operating under World Bank Operational Policy OP 7.30 which caused interruption in project activities due to lack of funds in the designated/special accounts.
29. Finally when the OP 7.30 was waived (for a select group of projects including this project), it was crucial to have a six months extension to facilitate payment of all the arrears that were due to diverse entities, including partner microfinance institutions as well as

11
project staff. The disbursement ratio reached 94 percent at end of April 2011 after the four-month grace period given to the project for disbursement.
Table 7. Additional Financing Cost Breakdown & Disbursement Rate (December 2010) by Component
1.10 Additional Credit
(Restructuring Stage 2007)
Actual Expenditures (Additional Financing)
December 31, 2010
Burn Rate on
Additional Financing (December 31, 2010)
Percentage of
Additional Financing to
Each Component
A - Improve legal, judicial, and regulatory framework
0. 2 0.07 32% 10%
B – Development of MFIs
1.6 1.55 95% 74%
C - Equipment 0.01 0.01 90% 0.30%
D - Build Capabilities in Microfinance
0.04 0.03 88% 1.80%
E - Conduct Studies 0.07 0.05 75% 3.20%
F - Coordinate Project 0.23 0.16 68% 11%
TOTAL FINANCING 2 2 86% Exchange rate used: US$ 1 = SDR 1.54 Slight variations are observed on the total budget due to the exchange rate effects.
30. The Development Credit Agreement (APL phase 1) was amended once during implementation on January 23, 2003 to update the disbursement table and provide, inter alia, for a temporary 12-month increase in the disbursement percentages of certain categories of expenditures, increased the amount of the authorized allocation for the project implementation unit (AGEPMF) special account, and provide for the regular preparation and transmission of financial monitoring reports.
31. A major change on project management took place in 2007 during the restructuring for additional financing7 when the Government was allowed to nominate one of its staff to become the Executive Secretary of the PIU.
7 See Project Paper on Proposed Additional Financing (Report # 38892). This decision was made to support Governments’ agenda on implementation of Paris Declaration on “Harmonization and Alignment for Development Results”

12
2. Key Factors Affecting Implementation and Outcomes
2.1 Project Preparation, Design and Quality at Entry
32. The Microfinance program was prepared at a time when Madagascar was in need of alternative instruments to complement macro reforms and spur equitable growth. In the 1990s when the economic reforms supported by the World Bank were shaping the macroeconomic future of the country, financial sector reforms left the majority of the population, particularly the poor and rural areas, without access to financial services.
33. The project design supported the financial sector CAS (document number 16249 of February 1997) goal which was to improve savings and support economic expansion, and raise the low level of financial services, especially outside key urban centers. Project preparation took into account the Bank's financial sector reviews and worldwide experience that identified reasons for insufficient and ineffective provision of financial services in Madagascar to lower income clients.
34. The design was intended to mitigate key constraints to financial access; particularly the access gap for the poor in rural areas. The design was cognizant that: (i) private commercial banks were lending only to well-established clients because of limited competition in the sector, their business philosophy and negative perception of country risk; (ii) transaction costs of microfinance programs were high; (iii) low-income clients generally lacked collateral and were unknown to the banks, which made it difficult to assess their ability and willingness to repay; and (iv) the legal and judicial systems were not developed and contract enforcement was difficult.
35. Project design was anchored upon lessons emanating from the financial sector reform process and from a tested rural finance approach through the RFTAP pilot project and what other donors were doing in the country. As already mentioned, the lending instrument, a 15-year APL was quite appropriate as the project’s aim was to address the long term institutional and policy constraints that hindered access, which needed time to bear results. For a program that aimed at supporting microfinance institutions (MFIs) to become sustainable, international experience has proved that long time is required to achieve such a goal.
36. The project was kept relatively simple by focusing on microfinance issues rather than expanding its mandate to other sectors of the financial system such as banking and insurance. The project was designed to allow for gradual expansion to the rest of the country based on feasibility studies and the pre-identified triggers (see PAD April 1999)
37. Assessment of risk by project team was adequate at project preparation. The team properly identified risks related to the appropriateness of reforms, adequacy of training being offered, and interest of populations to become microfinance clients. For example the design of the microfinance reform agenda focused on improving the existing banking laws to fit the needs of the microfinance sector instead of pushing for a new and parallel reform agenda, which could have taken long time with risk of laws not being passed expeditiously (as was the case with a new law on usury which is yet to be passed after eleven years of project

13
implementation). Expansion to new provinces and sites was to be preceded by feasibility studies to appraise economic potential, clients demand and supply capacity required for effective interventions.
38. The design was cognizant of the risks associated with poor institutional and absorption capacity of key stakeholders to implement reforms and to develop a sustainable microfinance program that targeted the low-income segments. The design embedded intensive technical assistance and capacity building in the core components of the project to mitigate these risks. One of the outstanding design features was the emphasis on institutional and capacity development, legal and regulatory reforms as a foundation for building a sound and sustainable microfinance practice in the country. This resulted for most of the project indicators being qualitative with just a few on quantitative mainly focusing on the microfinance outreach and portfolio quality.
39. However, the design failed to assess the risks of the other phases of the APL not materializing as well as political instability in the country. Although the microfinance program took off from a stable political environment in 1999, the PAD did not foresee the political unrests that twice hit the country and hampered the speed of program implementation. Nevertheless, during the two political crises of 2001/2002 and 2009, MFIs remained resilient and continued to operate, albeit under difficult conditions and increased risk to their loan portfolio. This resilience is attributed to the design of the project which put core functions of MFIs’ management in the hands of their member-shareholders.
40. The design of the additional financing also failed to see the risks associated with allowing8 the Government to nominate a public servant to lead a team of experts paid by the project on terms that were not similar to those of the government. The design did not spell out a strict selection criteria for such a nominee which could have also ensured that the nominee had competencies required to lead a complex financial sector project.
2.2 Implementation
41. Project implementation started on a good footing. However, after relatively good progress made during the first two years, implementation progress was downgraded to unsatisfactory. The implementation period between 2001 – 2009 experienced significant grueling events (political crisis and restructuring in 2002, MTR in 2004 leading to the an extension of the closing date, the death of the project coordinator and recruitment of replacement, restructuring for additional financing and the second political crisis and financial crisis in 2009) that triggered ad-hoc changes which impacted the speed and relatively the quality of project implementation.
42. The political crisis in December 2001 affected the speed of implementation and posed certain institutional risk to MFIs. Several microfinance networks experienced liquidity constraints due to the freezing of their reserves by the monetary authorities that were unable to redeem the treasury bonds on schedule. MFIs also suffered from a high proportion of non-
8 See Project Paper on a Proposed Additional Financing ( Report #38892 MG)

14
performing loans resulting from exogenous factors in the borrowers’ business environment. In addition, one of the MFI (Toamasina) temporarily lost its technical support when the contract for the technical assistance agency (provided by DID Canada) expired in the middle of the crisis and could not be renewed. The project coordinator also died. Project activities slowed down until another qualified coordinator was hired. The project was restructured as well as some of the MFIs, and the closing date was extended. The mid-term review in February 2004 thoroughly appraised the request by members to split the Toamasina microfinance networks into two (Tamatave and Lac Alaotra) to ease implementation. The technical assistance program was also redesigned to accommodate these changes.
43. The political crisis of 2009 negatively affected the profitability and sustainability levels of MFIs. It also resulted in delays in implementation that led to two extensions of closing dates. Some of the MFIs that were operationally self sufficient experienced losses. The overall ratio of Non Performing Loans (NPL) reached peak levels (14 percent in 2009 against the sector norm of five percent). This reduced both the operational and financial self sufficiency ratios of the MFIs. The project which was rated highly satisfactory (2005 – June 2007) and satisfactory (December 2007-December 2008) was subsequently downgraded to moderately satisfactory. Risk mitigation strategies (curtailing loan underwriting, intensive savings mobilization, revised/tight loan appraisal/client risk assessment etc.) applied by MFIs reversed the performance in 2010 to an overall positive profitability (overall) and sustainability indices. The NPL ratio was reduced to 10 percent (4 percent positive leap in just one year). This was an indication that technical assistance provided to MFI networks by international technical assistance providers was well assimilated and had increased risk management capacity of local MFI staff.
44. Government’s commitment for the microfinance project remained generally strong during the life of the project especially through positive policies and strategies for the microfinance sector. However, some factors subject to government control affected project implementation. Government counterpart funds were often disbursed late due to bureaucracy and liquidity problems at the treasury resulting mainly from the political crisis. On government’s request the counterpart funds were waived during the 2007 restructuring to speed implementation.
45. The transition government in power after the 2009 political crisis has not been an effective partner in project implementation. Recommendations made by several supervision missions and audit reports were neither effectively followed upon nor implemented as per the signed agreements between IDA and the government. This contributed to the deterioration of project management and coordination (in the last three years) under the leadership of the PIU coordinator who is a government employee.
46. Poor leadership at the PIU also affected the quality and speed of project implementation after 2007. Project reports were often submitted late and auditors’ recommendations were not implemented. Auditor’s recommendations (2009) had reiterated the need to hire an internal auditor and procurement specialist to fill the vacant position left by the previous staff who had left the project. This was not implemented despite several recommendations made by World Bank supervision missions. Inefficiencies were noticed in internal control systems (undocumented equipment transfers and weak procurement capacity).

15
Poor staff morale was evident during the ICR mission. 9 The ICR mission observed unsecured project documents in unlocked offices in the office building which is shared with non project staff. There are also allegations of improper conduct by the Project Coordinator (Anonymous email communications were sent to the World Bank and were shared with INT- the Integrity Unit).
47. Despite the deteriorating leadership at the PIU, implementation of key project activities continued and most of the targets were achieved, even exceeded in certain cases. Fortunately, the policy component (component 1) which was directly implemented by the Central Bank was smoothly implemented and contributed to the impressive results achieved under that component. Also, the MFI Networks whose technical capacity had improved over the years, and their financial resources (owners’ equity) had significantly grown (savings and retained earnings) used their own funds and human capital to implement project activities under the “improved access component” (component 2) and produced outstanding results. As explained in other sections, the reason for the final closing date extension (June 30, 2010 to December 30, 2010) was to facilitate reimbursements of outstanding contracts to consultants as well as MFI Networks who had used their own funds during the crisis to implement activities (earmarked for funding by IDA’s additional financing). Most of the credit for the project results achieved since 2007 when the project was restructured for additional financing goes to the Central Bank and the MFI Networks who were resilient and consistent with implementation amidst the deteriorating leadership at AGEPMF.
2.3 Monitoring and Evaluation (M&E) Design, Implementation and Utilization
48. The M&E design of the project was generally adequate and had sufficient indicators to monitor progress towards achieving outcome and impact of the PDO. Quantitative and qualitative indicators were defined to be tracked by the different key stakeholders (MFI networks, Central bank and APIMF for training). For example, the resident technical assistance (TA) providers were given contracts based on the performance of the MFI networks. The indicators for these performance-based contracts went beyond those indicated in the PAD to include for example measuring knowledge transmitted from the TA providers to local personnel. This encouraged speedy transfer of knowledge to Malagasy staff who today is instrumental in managing these viable MFI networks. The nature of the project which had significant level of effort on institutional and capacity building, legal and regulatory made it necessary to have many qualitative indicators and few quantitative ones to monitor outreach and portfolio quality (one component out of four of the project).
49. The design, however, failed to define specific units of measure meant for the “increased productivity and improved standards of living of the beneficiary households”, which would have helped objective tracking of social impact in these two areas. The impact study10 for the project could have benefited from such a framework to better inform and influence improvements of the project design during the second restructuring in 2007. The
9 Staff claimed of delayed approvals for resources required to effectively implement project activities (e.g. computers, vehicles and office space etc.). 10 AGEPMF Impact Study – FACET BV, Supporting Small Enterprises: Rapport de l’étude d’Impact de la micro finance a Madagascar

16
monitoring and evaluation (M&E) design was also vague on the issue of women targeting. Although the system scored highly on clarity regarding the 50 percent share of women beneficiaries, the design did not provide objective selection criteria for the 25 percent (from this segment) which was to come from the most disadvantaged groups. At restructuring in 2007, the system could also have clarified and provided quotas for “site or short and fixed or long term savings/deposits” as this could have improved the measure of efficiency on institutional development of MFIs. For example the Diana microfinance network which had high share of long term deposits (85 percent of total savings) also had higher efficiency and efficacy ratios (OSS 158 percent & FSS 122 percent) suggesting a correlation between long term savings and institutional sustainability.
50. Overall, the project could have benefited if more than one impact study were conducted throughout the eleven years, including one towards the last year of project implementation (under the additional financing). The design fell short of social and poverty indicators to be tracked which would have helped to sharpen social targeting progressively. The methodology for such tracking was also not defined. As a result, the impact study (2005) had a limited scope and was not able to effectively inform and influence the design of subsequent phases. Notwithstanding the weaknesses, the nature of the project which provided financial services to thousands of micro-borrowers mainly in rural areas and for activities in sectors such as agriculture, fishing, trade and agro-equipment, posed a challenge to measure overall increased farm productivity, income and employment creation impact. Annual surveys and another impact study towards the end could have shed more light on social impact of beneficiaries, but the political unrest made this a difficult task to undertake.
51. M&E implementation was adequate especially on the well-identified indicators of MFI networks’ outreach; institutional development, portfolio quality and risk management, legal, regulatory and judicial framework and on capacity building. Although majority were qualitative, the quantitative ones on MFI networks performance were very focused and objectively targeted and were based on microfinance sector internationally accepted norms/best practices used to measure performance and sustainability aspects of MFIs and microfinance programs. Data was collected from several sources including microfinance institutions, AGEPMF, the Central Bank and APIMF (the professional association for MFIs). Project reports were periodically verified by external auditors, Financial Management and supervision missions.
52. M&E utilization was collaborative and participatory, which helped to redirect certain project operational plans as was the case when reports from one MFI network prompted the need for splitting into two for effective implementation. Quarterly reports from microfinance networks to AGEMPF (the coordinating unit) were used to revise work plans, including additional technical assistance to MFIs based on individual strategic needs. In several occasions especially towards the end of the project reports from the project and the Government were late or not produced. As such views from the Borrower (Government) were not effectively utilized in project implementation and planning especially in the last

17
three years of implementation.11 The final activity report (December 2010) from AGEPMF was received late (in May 2011), and the completion report from the Government was not received as input to the ICR. Also, data from some of the MFIs that do not have a computerized portfolio tracking system needed to be verified by project staff and the auditor before they could be utilized for analysis and incorporated in the ICR for reporting. Despite these shortfalls, the M&E reports were useful for the ICR preparation and they provided an opportunity to share microfinance best practices with counterparts during the data collection exercise.
2.4 Safeguard and Fiduciary Compliance
53. The project was classified as Category C which triggered no safeguard policies.
54. Fiduciary compliance with the Bank policy and procedural requirements were satisfactory in general. Project financial reports were received regularly and judged satisfactory by the Bank. Annual program audits (Project coordination and MFI Networks) were conducted and reports produced on time with comprehensive auditors’ expertise opinion. In most cases, audit recommendations were implemented swiftly by the Project coordination unit (AGEPMF) and the Government. IDA financial management specialists were involved in program implementation, including in the restructuring and monitoring of the implementation of key audit recommendations. The Bank’s team undertook several post procurement reviews which uncovered ineligible expenses made by the project coordinator on one occasion.
55. Financial management: AGEPMF was generally capable of fulfilling financial management requirements. However, due to the political crisis the project run out of money when its special/designated account could not be replenished because the country was under OP 7.30. For about a year, project staff could not perform their fiduciary duties due to a lack of funds. Fortunately, the project team that was kept in place during the crisis resumed its monitoring and fiduciary activities when the project was finally granted an extension of the closing date to December 2010. Nonetheless, some recommendations made by auditors in previous audit reports were not properly addressed. For example, the hiring of a full-time internal auditor did not take place as recommended due to refusal by the Project Implementation Unit (PIU) leadership to implement these recommendations despite repeated requests from the supervision missions.
56. Procurement: The Project Coordination Unit (AGEPMF) and the Government complied with procurement guidelines in general although towards the end of the project there were problems noticed in compliance with auditor’s recommendations. The auditors had recommended hiring of a procurement officer to replace the one who left the project during the crisis which was not implemented as already explained.
57. Borrower Commitment and stakeholder involvement. The project was requested and actively supported by the Malagasy government and consultations with the private sector
11 It is to be noted that in 2007, the Government was an effective partner in the restructuring for additional finance including in 2008 launching of the Financial Sector Project (PASEF).

18
and civil society were extensive. The Government's strategy for microfinance was spelled out in its Letter of Development Policy of April 1999. The objective of improving access to financial services was part of the financial sector strategy. Reflecting this commitment, the Government had encouraged private initiatives in support of MFI development and enacted legislation promoting and regulating MFIs under the Rural Finance Technical Assistance Project (RFTAP) upon which the microfinance project was built. The Government had committed MAG 1.8 million as contribution although this was later stopped at the Government’s request who had difficulties respecting its commitment for many IDA projects in Madagascar including microfinance. The co-financing (government contribution) was, thus, waived by IDA at project restructuring in 2007 in order to speed up implementation.
58. Sustainability and Risk assessment: As mentioned in prior sections, the identification and assessment of risks were appropriate, as well as the proposed risk mitigation measures. The main risks identified were: (i) the possibility that CSBF would apply the sophisticated bank supervision tools to supervise MFIs; (ii) the structure and decentralized nature of MFIs would make supervision labor-intensive and costly for CSBF; (iii) the lack of capacity within (SLAs) MFIs; (iv) the lack of interest from the population to join SLAs due to government subsidized programs which offered grants or interest free loans to the poor; (v) the delayed implementation of the policy and regulatory framework for MFIs; (vi) the poor risk management systems by MFIs; and (vii) the SLAs not reaching intended growth and outreach (membership, deposit and loan volumes). All these risks were rated modest except item (iv) which was negligible. The overall risk rating was, therefore, modest.
59. Adequacy of participatory process: The process during the design stage was adequately participatory, with all important stakeholders involved, especially the SLAs and the Central Bank that later played a critical role in making the key components of the project (policy and access) successful. Consultations were held with the private sector, including consulting firms, research and training institutions, and key donors. Other donors pledged about US$1.9 million to the project. Participation by the primary beneficiaries, the members of SLA’s and MFI networks was sought. MFI networks were very committed to the project and they proved to be effective partners throughout implementation and much so during the political crises. This commitment was demonstrated through the willingness to share costs (US$0.2 at design stage) and to gradually take full responsibility of managing rural banks without donor subsidy.
2.5 Post-completion Operation/Next Phase
60. As already mentioned, the microfinance project was not implemented as originally planned. Towards the end of the first phase of the 15 years APL, the FSAP report recommended that a broad financial sector program be designed to take into account the evolving dynamics in the financial sector. Non bank financial institutions were growing and increased financial intermediation was necessary. The new financial sector program was to support other financial services, support development of new products/segments (pension, insurance, bank downscaling, leasing, payment systems and microfinance institutions in general). The microfinance project was to be mainstreamed into the new financial sector program with a broader scope. The remaining two phases of the microfinance program were,

19
thus, folded into the Financial Services Project (PASEF) that became effective in November 2008. To date, however, implementation of PASEF has stalled due to project coordination problems.
3. Assessment of Outcomes
3.1 Relevance of Objectives, Design and Implementation
61. Relevance of objectives is rated Satisfactory. The microfinance project design was anchored upon the Government of Madagascar’s goals of poverty reduction and equitable growth that required increased focus to rural development. The project objective of increasing financial services to low-income populations who do not have access to commercial banks was and remain relevant to the overall government priorities and policies as well as to those of the Bank especially as political strife continue to increase the vulnerability of the low-income populations. The access gap is still high as only 35 percent of low income households (about 80 percent of the population) have access to depository services and 2 percent to formal credit channels (IMF, 2006).
62. The project is in line with the objectives of the CAS (2007-2011) and the Madagascar Action Plan (MAP 2005-2012). One of the objectives of the MAP is to “improve access to affordable rural financing” through the establishment of more microfinance institutions in rural areas to increase outreach to the low-income population at affordable cost. One of the MAP targets is to achieve rural banking penetration of 12 percent by 2012. Government’s financial sector and microfinance sector strategies continue to reinforce the need for broadening and deepening financial services to the low-income population particularly in rural areas. The microfinance strategy targets to have 50 percent of women as beneficiaries of the microfinance services offered in the country.
63. The project components were relevant and consistent with project objectives as they were aligned to support improvements in access, policy and capacity which are critical for a healthy microfinance sector development. The project design defined realistic outcome indicators and activities at policy, sector and MFIs levels which were practical and responsive to the immediate and long-term development needs of stakeholders involved in the implementation of the microfinance project. For example the component on policy agenda influenced change in laws that created a strong legal, regulatory, judicial and institutional foundation required for developing a sound microfinance sector. Aligned with the banking law (1996), the Central Bank was given the supervisory role of MFIs with clear mandate including definition of prudential norms for regulation of the different types of microfinance institutions. These factors facilitated an orderly growth of the microfinance sector in Madagascar.
64. The design was cognizant of the need for balance between institutional and capacity development as a fundamental for improved access to financial services. The component on development of microfinance institutions supported construction of rural branches provided the technical assistance and capacity building to MFIs which significantly contributed to the increased access to financial services for the low-income population especially in isolated areas. Implementation arrangement which was done through decentralized systems managed

20
by shareholders (low-income population) increased customer loyalty and contributed to MFIs growth. Financial services (savings facilities, access to pension funds and credit) were within the proximity of the low-income population as most of the branches were constructed in isolated areas with economic and social potential.
65. This decentralized implementation was a determinant on the reduced cost of borrowing (interest rate in the microfinance industry is on average 15 percent compared to more than 80 percent which was charged in the informal sector in 1999)12 and increased outreach to thousands of low income population with diversified products. The project impact study13 reported that microfinance institutions were the only source of financing (57 percent of the 597 respondents in four provinces) in the localities covered by the survey. Focus group discussions (ICR mission) indicated that MFIs are the preferred depository of funds by the low-income population. Supported MFI networks continued to play a critical role in mobilizing local savings (US$28 million). “Inter MFIs network lending14 among MFI networks and high growth rates on savings (savings are growing at more than 20 percent per year) contributed to the increased financial intermediation and access as envisaged in the project design”. The accessibility measure of within 10-30 radius kilometers was used to derive the high banking penetration rate.15
66. The component that dealt with building capacity in microfinance sector was quite effective as implementation was done through an umbrella microfinance association (APMF) which ensured a wider outreach and systematic institutionalization of the capacity development in the country. The implementation arrangement for this component was in compliance with the national microfinance strategy which prompted the creation of the umbrella association as a vehicle to coordinate microfinance capacity development in the country. The design of the training and institutionalization of the curriculum was supported by CGAP which ensured that this was implemented according to international standards. Implementation of this component was instrumental in creating microfinance capacity, a public good (human capital) in the private sector that have revolutionized the microfinance practices in Madagascar.
67. Although the project had design weaknesses on tracking and measuring social impacts and at restructuring in 2007 had established ambitious sustainability indicators (operational self sufficiency) for MFIs, the project objectives, design and implementation arrangement remains relevant and is well aligned to support the goals of reducing widespread (75 percent) poverty in Madagascar by continuing to establish microfinance institutions and policy reforms initiated by the World Bank-financed Rural Finance Technical Assistance Project (RFTAP, Cr. 2459-MAG), designed in 1993. The project implementation is tailored towards achieving indicators that will contribute towards achieving government’s goals of financial
12 PAD description. 13 AGEPMF Impact Study 2005 by FACET BV. 14 Lending among MFI networks of average US$425,000 per year is reported in the last three years which was a slow lending period. Normally the average is above US$500000 per year. 15 AGEPMF: Impact Study2005 by FACET BV.

21
deepening in rural areas.16
68. Despite the effects of the current political crisis which had a negative impact on the economy, the primary sector has been resilient with an exceptional rice harvest in 2009 (up by 40 percent from 2008 levels), and the project contributed to this – more than 50 percent of agriculture activities financed by the project in rural areas were for rice farming. Support to the financial sector reform agenda contributed to the rapid growth of the microfinance sector as improved laws continue to facilitate ease and organized entry and sound supervision by the regulatory authorities.
3.2 Achievement of Project Development Objectives (PDOs)
69. The achievement of the PDOs is rated Moderately Satisfactory.
70. The key objective of the project was to increase access to financial services to the low-income population not served by the traditional banking sector.
71. The key achievement of this objective was improved access to financial services by low income population particularly in rural areas. The project established decentralized financial institutions (MFI networks) mainly in rural areas (85 percent of supported MFIs are rural based). 236 MFI branches (against 59 in 1999) were in place offering credit17 and savings services to 391,538 (against 22 818 in 1999) low-income members at affordable cost in Toamasina, Lac Aloatra, Fianarantsoa, Antsiranana (Diana), and Antananarivo. These branches are affiliated to five microfinance networks. Through affiliations the MFIs created optimal scale and lowered operational costs which contributed to their positive progress towards sustainability. At project closing, all MFI networks were on average operationally self sufficient and some had even achieved financial self sufficiency (FSS) above the 100 percent breakeven point (see Annex 2 for details).
72. As indicated earlier, it took more than 10 years to implement the project. The APL financing instrument was dropped for subsequent phases of the project to be implemented under a SIL and the additional financing introduced a new phase to the project. These factors make it necessary to use the weighting method in order to objectively appreciate outcomes at each stage. The same method has been used to rate project efficiency and overall outcome of PDO in sections 3.3 and 3.4 respectively. A combination of key outreach, sustainability (OSS) and social indicators18 has been applied in the rating.
16 Government’s goal in the MAP is to increase bank penetration rate from 6 percent (2005) to 12 percent by 2012. 17 Loans financed activities in trade, agriculture including equipments, transportation (bicycles, animal pulling carts etc), warehouse construction, hording of agriculture produce for post harvest boom prices (warehouse receipts) etc. 18 No targets were established but in comparison to the non project participants (see a summary of impact study results in Annex 2, Table 20), the project scores highly on social improvements by beneficiaries.

22
Table 8. Achievement of Performance Indicators of MFI Networks (Pre and Additional Financing Eras)
Indicator Pre Additional Financing Era (1999 – 2006) Additional Financing Era(2007 – 2010)
Baseline Targets
* Achievements
**
Percent Change (against targets)
PDO Rating
Targets***
Achievements 2010**
Percent Change (against targets)
PDO Rating
Number of SLAs (MFI Branches)
59 102 157 53% HS 225
236 4.8% S
Number of Members
22818 72469 171900 37% HS 332055
391538 17% HS
Savings (MGA 000)
1675 227 24322 Above 10000%
HS 52000 57403 10% HS
Outstanding Loan (MGA 000)
1103 836 16000 Above 1000%
HS 46364
45819 (1.2%) MU
Operational Self Sufficiency*
0 n/a 156% 156% HS 122% 106 (14%) U
Improved Standard of Living Indicators
Access to portable water****
n/a 85% HS n/a
Utilization of latrines
n/a 89.4% HS n/a
Capacity to pay for medication in case of need****
n/a HS n/a
Frequency of protein consumption (meat, fish, eggs) ****
n/a 72% HS n/a
Net schooling rate****
n/a 100% of 94% interviewed
HS n/a
% of families with children who are not schooling ****
n/a 6% HS n/a
OVERAL PDO RATING
HS
MS
Source *: PAD – Report #38892. Source**: AGEPMF progress report, April 2011 Source***: Project Paper #38892 MG Exchange rate : 1US$ = 2000 MGA ****No targets were established in the PAD. Impact study interviewees attributed these improvements to the support provided by the project (loans, savings, training etc).
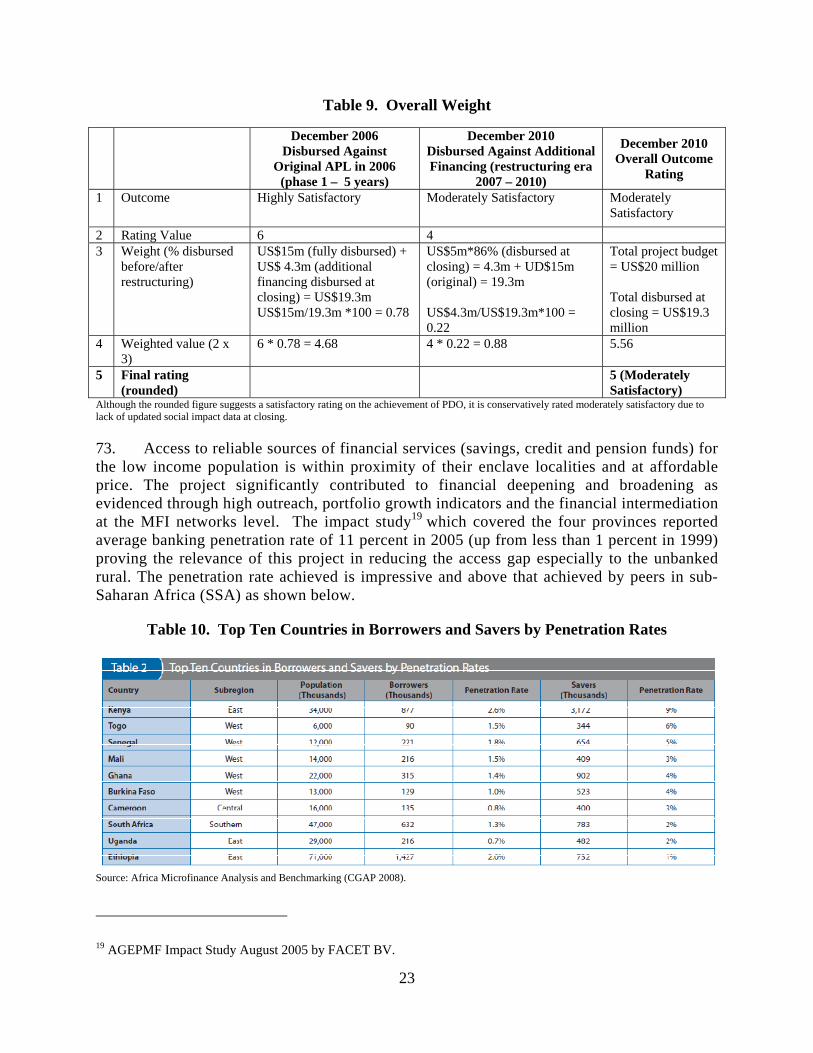
23
Table 9. Overall Weight
December 2006 Disbursed Against
Original APL in 2006 (phase 1 – 5 years)
December 2010 Disbursed Against Additional Financing (restructuring era
2007 – 2010)
December 2010 Overall Outcome
Rating
1 Outcome Highly Satisfactory Moderately Satisfactory Moderately Satisfactory
2 Rating Value 6 4 3 Weight (% disbursed
before/after restructuring)
US$15m (fully disbursed) + US$ 4.3m (additional financing disbursed at closing) = US$19.3m US$15m/19.3m *100 = 0.78
US$5m*86% (disbursed at closing) = 4.3m + UD$15m (original) = 19.3m US$4.3m/US$19.3m*100 = 0.22
Total project budget = US$20 million Total disbursed at closing = US$19.3 million
4 Weighted value (2 x 3)
6 * 0.78 = 4.68 4 * 0.22 = 0.88 5.56
5 Final rating (rounded)
5 (Moderately Satisfactory)
Although the rounded figure suggests a satisfactory rating on the achievement of PDO, it is conservatively rated moderately satisfactory due to lack of updated social impact data at closing.
73. Access to reliable sources of financial services (savings, credit and pension funds) for the low income population is within proximity of their enclave localities and at affordable price. The project significantly contributed to financial deepening and broadening as evidenced through high outreach, portfolio growth indicators and the financial intermediation at the MFI networks level. The impact study19 which covered the four provinces reported average banking penetration rate of 11 percent in 2005 (up from less than 1 percent in 1999) proving the relevance of this project in reducing the access gap especially to the unbanked rural. The penetration rate achieved is impressive and above that achieved by peers in sub-Saharan Africa (SSA) as shown below.
Table 10. Top Ten Countries in Borrowers and Savers by Penetration Rates
Source: Africa Microfinance Analysis and Benchmarking (CGAP 2008).
19 AGEPMF Impact Study August 2005 by FACET BV.

24
74. Credit to small-scale rice growers’ and other agro-business improved food security as reported in the impact study and provided an additional source of income for the low-income population through employment (67 percent of the 372 members interviewed reported employing one or more persons). The impact study reported that enterprises financed through loans from the supported MFIs created the much needed employment in rural areas especially seasonal jobs in the rice paddy farms (see results framework in Annex 2 for details).
75. The average loan size was below US$500 which bodes well with poverty targeting goal of the project demonstrating that the supported MFIs did not drift from their original mission of social targeting. MFIs demonstrated their commercial orientation through diversification, appropriate pricing and efficiency which rendered them sustainable and attracted commercial sources of funds as well as “inter MFI network lending”,20 which has increased financial intermediation and further expanded the outreach.21
76. An approach to targeting vulnerable population was developed and integrated in MFIs lending operations, which contributed to increased access and portfolio growth for women. Savings and Credit Associations (about 234 women associations of six to ten members were formed and mainstreamed in the core operations of MFIs) for the poorest—particularly women in very isolated areas—were created and have been mainstreamed to the core operations of the microfinance networks as originally envisaged. These associations mainly targeted the low income women who had no prior experience with savings and credit in rural areas in most of the provinces (four out of six). Intensive training to these groups was part of the support provided under this objective to ensure inclusive access was achieved.
77. Outreach and portfolio indicators were steadily growing and they exceeded PAD targets under the two periods (pre and post additional financing eras) except for outstanding loans which were below targets at closing as explained in the tables above. For example, membership growth was 18 percent and savings 10 percent above additional financing targets at closing – and women membership target of 51 percent was effectively achieved. Access to loans was steadily growing (except in 2009/10 due to temporary portfolio risk management policies introduced) with outstanding portfolio worth US$23 million at closing. The retired populations in remote areas are able to access their monthly pension payments through MFIs in their respective villages hence less travelling cost and more available funds to spend. Given this broad and deep access to financial services as illustrated by these indicators, the project clearly fulfilled this objective well.
78. Although the objective was achieved, the MFI networks’ are facing a serious operational risk due to the high non performing loan (NPL) ratio (core indicator). The NPL rate of 10 percent, which decreased from 14 percent in 2009, is still above the 5 percent international industry standard. This is approximately 90 percent overall repayment rate. Notwithstanding the effects of the political and financial crisis, the high NPL rate is a
20 The volume of lending among MFI networks was more than 60% of total external debt of all MFI networks (2006 – 2010). 21 Interviews during ICR data collection confirmed that MFIs borrow funds from investment funds (Oiko Credit etc) and have negotiated lines of credit with banks while inter MFI lending is largely practiced.

25
concern over MFI networks’ portfolio quality.
79. The MFIs made an overall reasonable profits in 2010 (US$ 1.2 million up from a loss of US$ 1.3 million in 2009) and had a positive average return on asset – ROA of 3.1 percent with a good return on equity of 17 percent. Even though proper risk management policies are in effect (including rigorous recovery campaigns and curtailed loan underwriting), the good move already made towards achieving financial sustainability could be undermined if the NPL rate is not drastically reduced in the short run. Madagascar MFIs are not alone in this challenge of rising portfolio risk. CGAP (Microfinance MIX data)22 reported a concern over portfolio quality of banks and non bank institutions in SSA which had negative ROA ratios (-2.4 percent and -0.9 percent respectively for banks/non bank NGOs in 2010.
80. The unpredictable trend on sustainability indices for some of the individual MFI networks (see Annex 2 and Sections 3.3 & 3.4 of this report for details), does reinforce the persmism regarding sustained positive sustainability indices for some of the MFI networks should another external shock occur. The trickle down effects of the political and financial crisis are yet to fully emerge which could undermine the achieved levels of financial sustainability. A realistic assessment of the trickle down effects of the crisis (political and financial crisis) on the performance of microfinance institutions would be best done two years after the shock (towards the end of 2011).
81. The MFI Networks are fragile and susceptible to political risk due to the noticeable government interference in their operations. The usury law is still effective (legally) even though it is no longer practiced. Although financial institutions are allowed by the Government and indeed they charge competitive interest rates, this can only be legally binding with a duly signed law.
82. The PAD did not provide a benchmark upon which the social impact on beneficiaries would be assessed. Several studies23 including the impact study (2005) and ICR focused group discussions indicate improved standards of living of the low-income population. However, these studies were not objectively designed to exclusively measure income changes and comparison of parities between project beneficiaries and non project peers in similar environments. Post implementation studies targeting beneficiaries of supported MFIs with proper benchmarking methodologies will be needed to objectively confirm this success and develop means of attrition to the project.
The intermediate outcomes of the project
83. The first intermediate outcome of the project was to improve the microfinance policy, legal and regulatory framework. This was to be achieved through preparation of laws, regulations and improvements in business laws applicable to microfinance, notably on collateral, and the establishment of a supervision mechanism for MFIs. An effective legal
22 CGAP (Microfinance MIX data) report: Sub-Saharan Africa Microfinance Analysis and Benchmarking Report May 2011 23 Building Inclusive Financial Sectors in Africa (January 2009); Madagascar Enterprise Survey (2009); The Impact of Microfinance on small Informal Enterprises in Madagascar by Flore Gubert et al (May 2011)

26
and regulatory framework and supervisory mechanism for microfinance institutions exist thanks to the law (2005-016) that offers regulatory best practices. The Banking Commission (CSBF) undertakes on-site as well as off-site supervisions of all licensed MFIs. When Law 2005-016 was introduced in 2005, only eleven MFIs approved by the CSBF were in compliance.24 Today, all registered MFIs comply mainly due to strict disciplinary measures and the imposition of fines.
84. The Banking law of 1996 was improved to accommodate specific needs of the microfinance sector. A new law (law #2005-016) was enacted giving the Central Bank (CB) a supervisory role for MFIs. Several legal instruments were prepared and passed which improved operations of microfinance institutions including: three circulars describing the minimum capital requirements and periodic reporting of MFIs as well as the registration process for the different levels of MFIs (level 1- 3). A total of 11 regulations, two decrees, eight instructions and legislation were issued all based on international best practices. Decree #2007-012 was passed describing the dissolution of MFIs including the judicial process and the rights of creditors etc. The Central Bank is capable to enforce application of these regulations and MFIs are in full compliance.
85. The law defining procedures for collateral registration and seizure (in case of loan default) was adopted and has improved the business environment for MFIs that have been able to successfully fight legal cases in court to seize collateral for delinquent loans as reported during the ICR meetings by the MFI branch management. This law has effectively helped the implementation of recovery policies instituted by MFIs geared to curb the NPL risk – the result was a reduction by 4 percent in just one year (14 percent in 2009 to 10 percent in 2010).
86. The passing of a law giving the Central Bank supervisory role for MFIs strengthened the credibility of MFIs in the financial sector leading to noticeable increasing partnerships between private lenders (Oikocredit was among the few Investment Funds mentioned to have provided lines of credit to some of the supported MFIs). Inter MFI network lending (a total of US$1,274,497 worth of inter MFI lending outstanding loans between 2008 – December 2010 was reported) is significant though at a low pace in 2010.
87. Additional supervision conducted by the Federation of MFI networks is a good complement to the supervision of the Central Bank and has proved to be very efficient in enforcing discipline among the affiliates of the MFI networks. A holistic approach to address financial access gaps through a combination of policy reforms, institutional building and MFI development was instrumental in instilling discipline and soundness required for the embryonic but fast growing microfinance sector.
88. A law to formally abolish usury was prepared with support from the project but is yet to be submitted for approval by the Parliament due to the transitional nature of the government. Although financial institutions including microfinance are allowed to charge competitive rates (in fact they charge competitive rates), this can only be formalized with
24 2008 Annual Report – inclusive finance program MAG 00609-31. January 2009.

27
official passing of the law.
89. The second Intermediate Outcome of the project was to strengthen the microfinance capacity to better build an inclusive financial sector. This was to be achieved through studies and training of microfinance professionals and members. The capacity of microfinance staff and Board members was significantly improved as demonstrated by improved quality in portfolio risk management and a positive move towards sustainability of MFI networks. With additional financing, the curriculum in microfinance was developed and tested and eventually institutionalized through the microfinance professional association. Post training evaluations and interviews in the field confirmed that capacity of the Board and staff was significantly improved due to learning and specialized courses offered by CGAP with support from the project. Targeted courses were offered to MFIs by Resident Advisors (including DID Canada, WOCCU, CIDR France etc) directly impacting Board members and staff of beneficiary MFIs. The regulator also offered tailored courses to Board members and practitioners on the new legal/regulatory framework. More than 100 Board members and practitioners benefited from these tailored in-house courses offered by their respective Resident Advisors and the regulator.
90. More than 20 structured courses 25 for groups were offered to more than 300 microfinance practitioners in Madagascar. Additional training was offered through study tours in Africa and Europe involving internships for regulators (about four staff of the Central Bank) in other supervisory institutions (mainly in France and in BCEAO – the Central Bank of West Africa Monetary Union). Unlike in 1999 when the project was started, local microfinance consultants are easily available and some training courses that were earlier offered only outside Madagascar are now offered locally by training institutions that benefited from training of trainer (TOT) programs offered in collaboration with CGAP. The microfinance associations (APIMF) through which most of the courses were institutionalized was being transformed in 2010 to increase its mandate to cover all institutions offering microfinance products (including banks offering microfinance products).
3.3 Efficiency
91. The efficiency of project investments is rated Satisfactory. At appraisal, “benefits from project investments were to be seen in the operation of healthy MFIs, widespread access to financial services by low-income people, important volumes of savings and credit, decrease in subsidies, and confidence in the institutions that serve their needs”. Based on this definition the microfinance project is judged to be efficient.
92. The same aggregate method used in section 3.2 is applied below to arrive at an objective rating of project’s efficiency. In addition, the OSS which was also included in the previous analysis has been used as a primary indicator in measuring project’s efficiency (see table below). The OSS analysis is complemented by other measures of efficiency which are not aggregated as there was no benchmarks established in the PAD or there was no
25 The curriculum cover a range of topics for MFI staff and Board Members in the areas of: governance, credit risk management, internal control and supervision, loan underwriting, new products development, marketing management, business planning, accounting and financial management.

28
substantiated data to facilitate objective aggregation for the two implementation periods. Additional analysis using other measures of efficiency applied in the microfinance industry are also provided in this section (see Annex 2 and Annex 3) to complement the efficiency measure rating for this project.
Table 11. Rating of Project Efficiency (Pre-Additional Financing and Additional financing
eras)
MFI Networks OSS
Pre Additional Financing Era 1999 – 2006)
OSS Additional Financing Era (2007 –
2010) Comments
Baseline
1999
Target (April PAD 1999)
Achieve-ment 2006*
Rating of Project
Efficiency
Targets (Project Paper March 2007)**
Achieve-ments
2007***
Rating of Efficiency (based on targets)
Lac Alaotra 0 60% 142% HS 175% 99.14% MU Almost at 100 breakeven point
OTIV Antananarivo
0 42% 140% HS 148% 98.91%
MU Almost at 100 breakeven point
Diana (Antsiranana)
0 19% 156% HS 174% 157.59% HS Below project paper targets but has achieved breakeven points for OSS and FSS.
Toamasina* 0 n/a 95%*** S 120% 97.16%
MU Almost at 100 breakeven point
Fianarantsoa* 0 22% 79%*** MS 132% 122.45% HS Below project paper targets but has achieved breakeven points for OSS and FSS.
Overall Rating of Project Efficiency
S S Satisfactory
Notes: *In the absence of PAD target for Toamasina (1999) the S rating was arrived based on baseline value of zero and comparison with performance of peers who were above breakeven point. Fianarantsoa is rated MS for the same reasons. **Project paper for additional financing had set ambitious OSS targets which were based on an excellent performance of the previous phase (prior to the political and financial crisis). ***Source: Project data

29
December 2006 Disbursed Against
Original APL in 2006 (phase 1 – 5 years)
December 2010 Disbursed Against
Additional Financing (restructuring era 2007 –
2010)
December 2010 Overall Outcome Rating
1 Efficiency Satisfactory Satisfactory Satisfactory 2 Rating Value 5 5 3 Weight (% disbursed
before/after restructuring)
US$15 million (fully disbursed) + US$4.3 million (additional financing disbursed at closing) = US$19.3 million US$15 million/19.3 million * 100 = 0.78
US$5 million * 86% (disbursed at closing) = 4.3 million + UD$15 million (original) = 19.3 million US$4.3 million / US$19.3 million * 100 = 0.22
Total project budget = US$20 million Total disbursed at closing = US$19.3 million
4 Weighted value (2 x 3) 5 * 0.78 = 3.9 5 * 0.22 = 1.1 5 5 Final rating on
Efficiency (rounded) Satisfactory
See additional analysis on MF sector efficiency/efficacy measures as they relate to this project below.
93. IDA financing of US$20 million (APL and Additional financing) helped to narrow the access gap and impacted a large number of low income population (391531) with financial services which they would not otherwise have obtained. The project helped mobilize high level of local savings (US$23 million) and provided thousands of micro loans (Outstanding loans US$23 million) to low income population. Loan products were diverse and competitively priced (average interest rate of 15 percent) as demonstrated by positive returns on assets (average ROA 3.1 percent26 and adjusted for subsidies AROA of 2.36 percent) which is an objective measure of returns from the outstanding loan portfolio. The IDA financing supported innovations as new products including pension payment system were developed and mainstreamed in the microfinance system. Membership continued to grow on average 21 percent per year even during the crisis which demonstrates customers’ loyalty to the MFI networks. The sustained membership growth created the required scale for breakeven and efficiency.
94. In addition, the PAD (Annex 3) had developed a subsidy dependence index (SDI) model to be used to assess and quantify subsidies given to the SLA network. SDI was meant to measure the increase in the average interest on-lending rate required to compensate a MFI for the elimination of subsidies (Subsidies given to MFIs under the project included investment in civil works - construction of office buildings, office equipment and training, recurrent costs and technical assistance) in a given year while keeping its return on equity (ROE) equal to the approximate no concessional borrowing cost. The project had a ROE of 17 percent demonstrating MFIs ability to generate returns using their own investments. At project restructuring in 2007, SDI model was replaced by an operational self sufficiency ratio (OSS) considered to be in line with best practices in assessing performance of microfinance institutions. Later FSS was introduced as another measure of efficiency and MFIs achieved
26 Despite the reduced loan underwriting due to operational risk, the returns were positive and above that achieved by peer MFIs in SSA (average negative 0.9) during the same period of post financial crisis.

30
an average 103 percent which is above the breakeven point (see details in Annex 2).
95. The best practice in evaluating microfinance institutions which is endorsed by CGAP considers OSS & FSS as the best measure of efficiency in microfinance27. An operational self sufficiency ratio of 100 percent or more would be proof that subsidies had been used efficiently to allow MFIs to cover their operating costs with revenues generated from their lending activities. The 100 percent FSS (financial self sufficiency) would be proof that the MFIs are able to cover operating costs, plus cost of funds (funds from the private sources) and can withstand inflationary effects (volatile interest rates) at the sector level. The PAD also provided a definition of cost-effectiveness of the project. For example, activities financed by MFIs were expected to be economically and financially viable to enable repayment of loans on time with effective interest rates. The project had a PAR or NPL of 10 percent at closing which means that roughly a 90 percent repayment rate against the PAD target of 95 percent was achieved. Through the project-supported MFIs the low-income population borrowed at competitive market rates (average 15 percent per annum).
Table 12. MFI Networks’ Profitability/Sustainability Index (December 31, 2010)
Return on
Assets (RoA)
Adjusted Return on
Assets (ARoA)
Profit or (loss)
(in 000Ariary)1
Operational self sufficiency(OSS)
Financial Self
Sufficiency
Antananarivo 0,62% - 0,26% 166,158 99% 94.41% Toamasina 0,79% 0,79% 130,566 97.16% 97,16%Lac Aloatra 4.37% 4.37% 523,860 99.14% 99.14% Diana (Antsiranana)
11,4% 8,7% 1,408,362 157.59% 122%
Fianarantsoa 1,69% 0,59% 245,771 122.45% 115%
All five MFI networks
3.01% 2.36% 2,474,717 106% 103%
Source: Project data & Audit Report (2010): Note: 1 US$ = 2000 MGA (Madagascar Ariary)
96. The efficiency indicators above for all MFI networks prove that the networks are economically viable business entities with the ability to generate positive returns (ROE & ROA) as confirmed by the 3.1 percent average return on assets 28 , 106 percent average operational self sufficiency and 103 percent financial self sufficiency rates at project closing. This is impressive considering that loan underwriting was curtailed during the political and financial crisis, which generated some loss of interest income.
97. The sustained level of savings which were priced below (average 5 percent) the lending rate (15 percent) helped MFIs make profits albeit the high NPL due a reasonable spread of 10 percent. This underscores the high level of efficiency on portfolio planning, new products development and innovation (including pension funds payment—commission fees from pension funds transfers) by the MFI networks.
27 Refer to the CGAP guidelines manual on evaluating performance of microfinance institutions. 28 CGAP/MIX data reported poor average Return on Assets (of below 1 percent) for financial institutions in SSA including MFIs in 2010 – and that ratio was not adjusted for subsidy as is the case in the project.

31
98. A quick cost analysis revealed interesting scenario for this project indicating that the self managed decentralized microfinance systems model adopted by the project was the most efficient approach to respond to the access gap in the country. The average operating cost per beneficiary29 was US$25 in the last three years of project implementation which is far below sector standards for microfinance institutions 30 in SSA. Towards the end of the project (2009 -2010) most of the operating costs were borne by the MFIs (own equity) as IDA’s subsidy decreased.
Table 13. Operating Efficiency Trend of the Supported MFIs
2008 2009 2010
Number of members 264,400 332,840 391,538
Operating Costs (US$) 51324 56959 43251
Cost per member 26 28 22
99. The project’s efficiency and efficacy was also measured using gross national income (GNI) against average outstanding loans and savings at closing in December 2010 in order to assess the efficacy of the project - how deeply the project targeted the poor. The GNI for Madagascar in 2010 was about US$232 and was used as a denominator. The balance of average loans as percentage of per capita GNI rate of 206 percent was achieved (against average outstanding loans MAG 954000 – US$477). The balance of average savings as percentage of per capita GNI was 33 percent (average savings balance of MAG 147000 – US$73). The CGAP/Microfinance Information Exchange (MIX) classifies lenders as being MFIs if their average outstanding loan balance is not above 250 percent of per capita GNI of the country. The project scores very highly on efficacy through poverty targeting particularly on savings which yielded significant impact (wealth creation through mobilized savings and by inculcating the savings culture) for the low income segments in rural areas as depicted by the achieved GNI comparators.
100. The self-management aspect of these cooperative types of MFI networks contributed to the efficiency because operating costs were low due to the voluntary work of the Board members. Focus group meetings during the ICR mission also indicated that an average of two jobs per loan was created with higher than five seasonal jobs per loan in rice farming. A structured employment survey could shed light on employment impact and other socio-economic spending (education, health, assets acquisition) by borrowers.
101. Based on the above analysis, the PAD definition, the performance of Peer institutions in SSA and the international best practice norms on how to assess microfinance program/projects the project was efficient and efficacy against all odds, hence, the overall efficiency rating of Satisfactory.
29 Costs are adjusted for subsidy and inflationary effects. 30 CGAP and Microfinance Gateway studies estimate average cost per microfinance borrower in SSA to be above US$100 per client especially for the rural enclave environments like the rural Madagascar.

32
3.4 Justification of Overall Outcome Rating
102. The overall outcome rating of the project is Moderately Satisfactory.
103. Although the project PDO was not revised the weighted method has been used to arrive at an objective overall rating of MS. The project was complex with a lengthy implementation period of eleven years including two restructuring and additional financing in 2007. At restructuring stage in 2007 most of the phase 1 APL targets were already achieved (see table below) and the project performance was rated Highly Satisfactory after an early restructuring in 2002 due to the first political crisis. However under the additional financing era (2007 – 2010) many problems were encountered as explained in prior sections and the project was rated Moderately Satisfactory at closing in December 2010.
104. The overall weighted rating method has therefore been adopted in order to objectively arrive at a balanced overall rating for the entire project life without undermining the levels of effort and achievements under each period. The weighted outcomes from Sections 3.2 and 3.3 are included in this overall weight rating. The US$15 million allocated under the first phase of the 15 years APL was fully disbursed before restructuring, and 86 percent of the additional financing of US$5 million was disbursed at closing in December 2010 (94 percent when disbursement was stopped in April 2011).
Table 14. Summary of Overall Outcome Ratings of PDOs
December 2006 Disbursed Against
Original APL in 2006 (phase 1 – 5 years)
December 2010 Disbursed Against
Additional Financing (restructuring era 2007 –
2010)
December 2010 Overall
Outcome Rating
1 Outcome Efficiency
Highly Satisfactory Satisfactory
Moderately Satisfactory Satisfactory
Moderately Satisfactory Satisfactory Combined (MS)
2 Rating Value 5 4 3 Weight (%
disbursed before/after restructuring)
US$15 million (fully disbursed) + US$ 4.3 million (additional financing disbursed at closing) = US$19.3 million US$15 million /19.3 million * 100 = 0.78
US$5 million * 86% (disbursed at closing) = 4.3 million + US$$15 million (original) = 19.3 million US$4.3 million /US$19.3 million * 100 = 0.22
Total project budget = US$20 million Total disbursed at closing = US$19.3 million
4 Weighted value (2 x 3)
5 * 0.78 = 3.9 4 * 0.22 = 0.88 4.78
5 Final rating (rounded)
Moderately Satisfactory
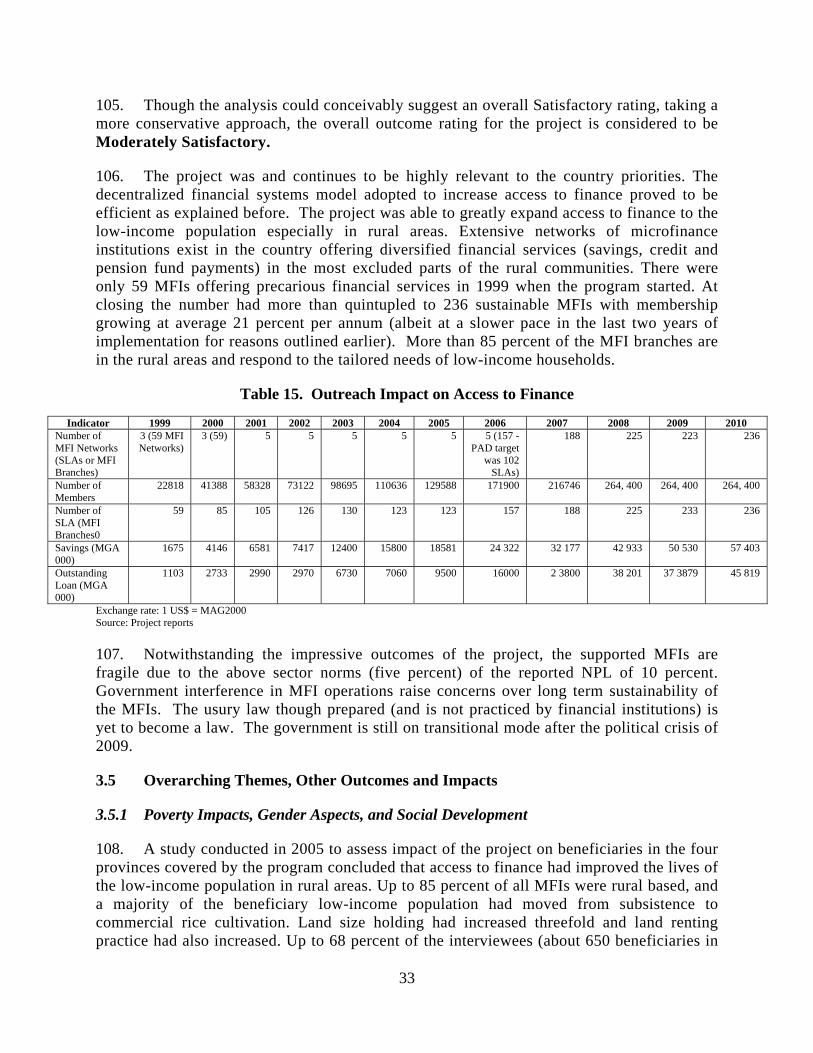
33
105. Though the analysis could conceivably suggest an overall Satisfactory rating, taking a more conservative approach, the overall outcome rating for the project is considered to be Moderately Satisfactory.
106. The project was and continues to be highly relevant to the country priorities. The decentralized financial systems model adopted to increase access to finance proved to be efficient as explained before. The project was able to greatly expand access to finance to the low-income population especially in rural areas. Extensive networks of microfinance institutions exist in the country offering diversified financial services (savings, credit and pension fund payments) in the most excluded parts of the rural communities. There were only 59 MFIs offering precarious financial services in 1999 when the program started. At closing the number had more than quintupled to 236 sustainable MFIs with membership growing at average 21 percent per annum (albeit at a slower pace in the last two years of implementation for reasons outlined earlier). More than 85 percent of the MFI branches are in the rural areas and respond to the tailored needs of low-income households.
Table 15. Outreach Impact on Access to Finance
Indicator 1999 2000 2001 2002 2003 2004 2005 2006 2007 2008 2009 2010 Number of MFI Networks (SLAs or MFI Branches)
3 (59 MFI Networks)
3 (59) 5 5 5 5 5 5 (157 -PAD target
was 102 SLAs)
188 225 223 236
Number of Members
22818 41388 58328 73122 98695 110636 129588 171900 216746 264, 400 264, 400 264, 400
Number of SLA (MFI Branches0
59 85 105 126 130 123 123 157 188 225 233 236
Savings (MGA 000)
1675 4146 6581 7417 12400 15800 18581 24 322
32 177 42 933 50 530 57 403
Outstanding Loan (MGA 000)
1103 2733 2990 2970 6730 7060 9500 16000 2 3800 38 201 37 3879 45 819
Exchange rate: 1 US$ = MAG2000 Source: Project reports
107. Notwithstanding the impressive outcomes of the project, the supported MFIs are fragile due to the above sector norms (five percent) of the reported NPL of 10 percent. Government interference in MFI operations raise concerns over long term sustainability of the MFIs. The usury law though prepared (and is not practiced by financial institutions) is yet to become a law. The government is still on transitional mode after the political crisis of 2009.
3.5 Overarching Themes, Other Outcomes and Impacts
3.5.1 Poverty Impacts, Gender Aspects, and Social Development
108. A study conducted in 2005 to assess impact of the project on beneficiaries in the four provinces covered by the program concluded that access to finance had improved the lives of the low-income population in rural areas. Up to 85 percent of all MFIs were rural based, and a majority of the beneficiary low-income population had moved from subsistence to commercial rice cultivation. Land size holding had increased threefold and land renting practice had also increased. Up to 68 percent of the interviewees (about 650 beneficiaries in

34
the four provinces) met the eligibility criteria of social targeting defined in the PAD. Agriculture and commerce were the main sources of income (34 percent and 28 percent respectively). The most impressive impact was on financial deepening with 57 percent of beneficiaries reporting that they had no other source of finance except from the project supported MFIs. Warehouse receipt credit was introduced in 2004, which provided cash for other social spending instead of selling the produce at low prices during the harvest.
Table 16. MFI Penetration Rate
Province MFI Branch Penetration Rate
Fianarantsoa Mahasoabe 7.90% Fianarantsoa A/sy Itenina 5.90% Fianarantsoa Mananjary 7.10% Tana Ambohitrarivo 14.80% Tana Ankazondandy 15.00% Toamasina Rantabe 15.20% Toamasina Ampasimbe 9.40% Toamasina Soliraf 12.00% Toamasina Mahanoro 12.60% Lac Alaotra Ambatondrazaka 10% Lac Alaotra Ambohidratrimo 13%
Source: Impact Study - AGEPMF 2005)
109. Interviews with beneficiaries in October 2010 revealed that proximity to a secure savings system was important to them especially for women and that contributed to the high volumes of the savings mobilized by MFIs. The training offered to women solidarity groups and to MFIs’ Board members in topics ranging from: member managed institutions, MFIs governance, financial management, and credit approval/risk management, etc., positively impacted the beneficiaries and played a big role in MFIs’ ability to contain risk during the crisis and remain sustainable.
3.5.2 Institutional Change/Strengthening
110. The project was instrumental in fostering the development of an appropriate legal/regulatory and supervisory institutional framework for the microfinance industry which is cornerstone for building a healthy microfinance sector. A now fully fledged Microfinance Supervision Unit exists at the Central Bank (CSBF) providing the critical oversight required for the rapidly growing sector. The unit has competent staff and was instrumental in drafting microfinance laws and regulations that conform to international guidelines as well as undertaking off and on-site supervisions of MFIs to help keep the sector sound and viable. An effective supervision of network members by their apex organization is institutionalized at the MFI networks’ level to complement regulator’s supervisory role.
111. The project addressed the issue of information asymmetry in the financial sector through support to create a credit bureau for MFIs, which is now linked to that of

35
commercial banks for better risk management in the entire financial sector.
112. The tailored Technical Assistance offered to MFIs by internationally renowned institutions (e.g. DID Canada, IRAM & CIDR France) did strengthen MFIs’ institutional capacity to manage risk and growth in the long run as evidenced by positive sustainability indices reported.
113. The training curriculum developed with help from CGAP for microfinance practitioners have been institutionalized at the apex microfinance association (APIMF). Regular courses were offered to practitioners with a fee. MFIs have also institutionalized the materials and tools developed for them as part of technical assistance. Board members training curriculum is standardized for all the MFI networks which facilitates learning and human resource sharing among MFI networks.
3.5.3 Other Unintended Outcomes and Impacts (positive or negative)
114. The recent partnership of MFIs with the social security administration (CNAPS) to provide retiree pensions is an unintended development. This private public partnership facilitates access to retirees of their only source of income for most of them, and saves them from travelling long distances to get their pensions. This partnership has the potential to help MFIs diversify their services and broaden their outreach to a wider segment of the unbanked. A cautionary note about this partnership is the necessity to limit state interference in the operations of private MFIs at the risk of undermining their sustainability. Commissions paid to MFIs that do not cover their costs to distribute pension funds as they are dictated by the government and not based on profitability of the product. Also, the state should not be the one to pay the membership fees of less than US$1 for retirees. Voluntary membership fees from the retirees is the best guarantee for these MFIs which are financial cooperative to grow and retain these members in the long run and offer them more services.
115. Rapid growth and good performance of the microfinance sector was not expected in such a short time. In 2005 when IMF and The World Bank conducted the FSAP, it was clear that the microfinance sector had matured enough to be part of the larger financial sector program. PASEF was designed to scale up lessons from this program in the optic of financial inclusion where all financial institutions would participate in weaving the quilt to narrow the financial access gap.
3.6 Summary of Findings of Beneficiary Survey and/or Stakeholder Workshops
116. Not applicable.
4. Assessment of Risk to Development Outcome
117. Risk to development outcome is Moderate. Most MFI networks are on average operational and financially sustainable and have demonstrated that they can run their business without donor subsidies. Overall, the legal framework in place is facilitative and allows for healthy competition, which has reduced cost of lending (from above 80 percent to an average of 15 percent per annum) to the low-income population. The flexibility of the Government to allow the application of market interest rates (before passing of the new usury

36
law) has contributed to this positive trend. MFIs have shown their resilience through the financial and several political crises. The achievements of the project should continue to be sustained through support to be provided under the PASEF project.
118. However, there are concerns that delays in getting PASEF project operational would undermine the momentum gained by the MFI networks. MFIs are currently suffering from operational risk that must be contained in the short-run to sustain the achieved levels of operational sustainability. In the medium- to long–term, it is doubtful how these MFIs will thrive and sustain their operations amidst unforeseeable external shocks and the notable government interference in their operations. This interference especially regarding the pricing of pension fees channeled through the MFIs raised concerns over independence of the MFI networks and their long term sustainability. In one Province, it was reported that the government is forcing MFIs to adhere to networks out of political motives. Although the concerned MFIs have succeeded in contending this move, it is likely that future interference will undermine the effort made towards achieving development outcome.
5. Assessment of Bank and Borrower Performance
5.1 Bank Performance
5.1.1 Bank Performance in Ensuring Quality at Entry
119. Quality at entry is rated Satisfactory. Possible risks were identified at the beginning and practical mitigation measures were clearly spelt out. For example, the issue of poor capacity which was articulated early on did affect program implementation and the milestones on completion dates. The project was built upon a solid foundation laid by the reform program (RFTAP Cr. 2459-MAG) that preceded microfinance project. This facilitated smooth take off and implementation of the microfinance project while capitalizing on lessons learned. The project targeted the most vulnerable segment in the market with tailored products and through adapted channels (MFIs Networks) owned and managed by members. This model proved pertinent especially during several political crises as members took charge to mitigate operational risk and preserve their investments.31
120. The quality could have been improved by defining units of measure for social indicators related to increased income and productivity of micro borrowers. The Subsidy Dependence Index was provided in the PAD as a model to measure farm productivity. However, some of the useful aspects of the model could have been incorporated in the M&E framework to facilitate objective data collection and reporting on productivity during implementation.
5.1.2 Quality of Bank Supervision
121. Quality of supervision is rated moderately satisfactory. Supervision missions were undertaken at least twice a year during project life except at time of political turmoil when
31 During the political crisis of 2009 most commercial banks closed down but MFIs continued to operate albeit reduced lending operations with relatively minimal losses.

37
Bank missions were suspended. During 11 years of project implementation, there were only three task team leaders (TTL), which is a relatively low turnover of Bank team leaders. Moreover, the TTL at project closing provided continuity by her presence as a team member at project negotiations. The task team produced comprehensive aide memoires and identified issues for management decisions including the need to restructure the project in 2002 after the political crisis and in 2007 after FSAP study. After agreeing to fold the subsequent phases of the APL into another project, the team sought additional financing to bridge the gap between the end of the microfinance project and the beginning of PASEF. Financial management was able to identify financial management weaknesses that lead to refund of ineligible sum to the World Bank by the project coordinator. Issues were promptly brought to Management’s attention and solutions sought.
122. The task team remained pragmatic and flexible by responding positively to MFIs request to create five networks instead of the four originally planned and Government’s request to eliminate counterpart funding. However, Bank Management did not always respond as swiftly as desired especially towards the end of the project and this contributed to the delays getting PASEF project implementation underway or otherwise suspended.
123. Supervision teams could have revised the operational self sufficiency targets set in the restructuring paper to reflect the operating environment of the MFIs in 2009 after the political/financial crisis. Also the supervision teams could have instituted a progressive approach to measure social impact after the original design instead of relying on periodic impact studies.
5.1.3 Justification of Rating for Overall Bank Performance
124. The overall Bank performance is rated moderately satisfactory. Supervision missions, financial management & midterm reviews were implemented according to plans and timely recommendations provided to project stakeholders. Government requests were given due attention including the request to provide additional financing to the project to fill the gap until the effectiveness of the PASEF Project.
125. The decision to replace the APL with the PASEF and a new funding instrument (SIL) for consolidation purposes was in part responsible for the prolonged project implementation period of 11 years (1999-2010). Restructuring had to be done in 2007 to reflect these changes and add a bridge finance of US$5 million to the project. The political crises triggered OP 7.30 measures by the World Bank and disbursements were put on hold and also created some delays in implementation.
126. A limited waiver to OP 7.30 was granted (to few projects including the microfinance project) during 2010, and the project was extended for six months to December 2010 to facilitate smooth closure. However, the World Bank was unable to swiftly enforce recommendations of various Aide Memoires (brought to their attention prior and after the crisis) including those of the last ISR (December 2010) mission which called for immediate suspension of the microfinance project or immediate replacement of the project coordinator. Although negotiations with the Government have led to an agreement to replace the project coordinator (who will oversee implementation of PASEF), the World Bank did not send a

38
timely and sounding message to the government and this contributed to the un orderly closing of the microfinance project and the delayed take off of the successor project (PASEF) through which the microfinance project is to be scaled up.
5.1.4 Government Performance
127. Government performance is rated moderately unsatisfactory. The Government was committed to the project and showed effective participation in project implementation between 1999 and 2002 when the first political crisis occurred. There were regular yearly meetings of the Management Board of the project Coordinating Agency (AGEPMF). The Board who played the role of a steering committee was made up of the main stakeholders including several State ministries (finance, justice and decentralization) as well as the Central Bank and representatives of the MFIs. There has also been goodwill by the Government to promote microfinance in the country as evidenced by important legal and regulatory reforms in addition to the creation of a supervision unit at the Central Bank. Also, the laws intended to improve the business climate (usury) were prepared although they have not been submitted to the parliament for adoption due to the transitional nature of the current government.
128. On the other hand, the notable interference of the Government on MFIs operation is an issue of concern as it will affect their long term sustainability. Also the Government decision32 (supported by the World Bank) to appoint a public servant as a project coordinator in 2006 did not serve the project well. The selection process for this appointee was limited to government employees only and was not very competitive. The new coordinator showed very quickly that he did not have the competencies required to manage the microfinance project. Soon after he came on board, the project experienced considerable slow down in implementation and disbursement rates went down. Also, many recommendations made by IDA’s supervision missions as well as auditor’s recommendations were not implemented nor followed through by the Government.
129. The aide memoires (2009 and November 2010) and the ISR report (December 31st, 2010) highlighted governance issues and low staff morale due to poor leadership at AGEPMF. The final audit reports (December 2010) reiterated the issue of mismanagement of project equipment, which was reported in the previous audit. The previous concern regarding undocumented transfer of project equipments to the Ministry of Finance was raised again in end of year audits (December 2010). The previous audit had recommended that a full-time internal auditor be recruited for the project and this was never implemented.
130. The project coordinator (government employee) was alleged to be conducting activities that compromise integrity of the World Bank. For example he was directly involved in the management of a government run Pension Fund (CNAPs) program which was parallel implemented with the microfinance project. This exposed IDA to a certain degree of reputational risk. The pension fund program was implemented through some MFIs who were not partners of the project. MFIs were not given the option to determine commissions rate
32 This was supported by the World Bank as stipulated in the Project Paper for Additional Financing in 2007 (Report #38892)

39
that would cover operational costs for this product. This interference could potentially undermine the efforts of these MFIs to fully achieve financial sustainability. Despite repeated recommendations by the World Bank supervision missions, this practice was not discontinued.
131. The transitional Government which took over after the coup of 2009 has not been an effective partner. Recommendations made by IDA’s supervision missions that were further reiterated in the last aide memoire to allow smooth closing of the project and resolve governance issues at the highest level of the project coordination unit have not been acted upon.
132. As a consequence, the government’s completion report of the project was not prepared as requested. A final progress report from the project management was submitted but that does not substitute for the required government report. This poor collaboration from the government during the last three years of the project had a big influence on the tardy pace of implementation of the successor program (PASEF which was launched in 2008 but has not begun implementation).
133. These issues continue to be discussed with the Malagasy authorities for an effective resolution and fortunately, the disruptions brought by the new coordinator did not undermine the good achievements already made after seven years of project implementation especially the performance of project supported MFIs. In the end, the disbursement rate for additional financing was 86 percent at closing (94 percent in April 2011). This was made possible when the MFIs were reimbursed for the expenses they made with their own funds during the crisis period. The extension to spend (to April 30, 2011) was given to facilitate smooth closure.
5.1.5 Performance of Implementing Agency
134. The rating is moderately unsatisfactory mainly due to governance and leadership issues at the project implementation unit during the closing years. Project results were achieved successfully thanks to the effective implementation by the Central Bank (policy component) and MFI Networks (access component) as mentioned earlier.
135. Implementation of the microfinance project was coordinated by an agency specifically created (AGEPMF) to assume that role. Day-to-day management of project activities was delegated to the AGEPMF Secretariat with the Executive Secretary assuming the role of project coordinator. AGEPMF was also in charge of recruiting technical assistant providers (DID and IRAM) to capacity building of MFI networks. The Central Bank of Madagascar (CSBF) was the implementing agency for the preparation of prudential regulations and supervision of MFIs under the Legal/Regulatory component. AGEPMF coordinated the work of the Ministries of Finance and of Justice on the Legal and Regulatory Component.
136. For the first eight years of project implementation, the team at the executive secretariat of AGEPMF was made up of a team of private sector recruited staff. Coordination activities were undertaken successfully by three different coordinators. Annual work programs, budgets, and other fiduciary functions proceeded in a satisfactorily manner.

40
Leadership problems at AGEPMF during the last three years of the project affected disbursement and procurement which slowed down considerably. As explained in the preceding section, the misappropriations of funds by the project coordinator led to a refund of ineligible expenses to IDA. Six months before the project original closing date of the additional financing (June 30, 2009), only about half of the additional funds had been disbursed.
137. Fortunately, most of the key technical assistance activities planned for MFIs had taken place, and MFIs were able to survive on their own funds during the crisis period. Due to delays in implementing the procurement plan, some activities could not be completed (equipment purchase, technical audits and rating exercise for MFIs networks). The Government Implementation Completion and Results (ICR) report was not completed. The final audit reports (December 2010) highlighted improper transfer of project assets to the government. This is not quantified in the audit reports.
138. Recruitment of external auditors for the project and MFIs was not done on time and audit reports were not available before the end of June prompting an extension of ICR submission date (audit reports were received after mid July 2011). These audits were necessary to confirm financial data from MFIs and assert whether previous audit recommendations had been followed by AGEPMF.
5.1.6 Justification of Rating for Overall Borrower Performance
139. Overall Borrower Performance is rated Moderately Unsatisfactory. The government contributed to the design and implementation of a program that impacted the poor in Madagascar. Government provided counterpart funding in the first few years of program implementation and provided the building to house the project coordination staff. MFIs benefited from Government’s reforms that laid the grounds for a healthier microfinance industry in Madagascar. AGEPMF run a smooth operation for many years, during which the bulk of the technical assistance to MFIs was provided and made them fairly resilient. The Central Bank’s performance was satisfactory. With strong leadership and highly competent staff, CSBF adapted to the evolving situation in the microfinance industry and issued regulations that conform to international standards.
140. While the Government of Madagascar executed its mandate well for many years, the current transitional Government has shown less good will and the consequences of this lack of effective partnership heighten concerns over long term sustainability of microfinance project. Government’s interference regarding pension funds payments channeled through MFIs as well as political involvement in the decision of retail MFIs to affiliate to a particular Unions or apex organization are worrying developments. If allowed to continue, these actions can pose a threat to the operation of all MFIs in the country. Although discussions are under way, the Government did not act swiftly to implement the recommendations of the last Aide Memoire considered necessary to provide a solid foundation for the PASEF program. Restructuring of PASEF program would need to validate the renewed government commitment to effective partnership.

41
6. Lessons Learned
141. Several lessons emerged from this assessment of the microfinance project:
142. Long term approach to capacity building: The long term approach (15-year three phase APL) which ended being one prolonged phase was an excellent design feature that contributed to effective achievement of project PDOs. Eleven years of implementing the microfinance project proved the importance of allocating enough time for programs that combine reforms and institutional building in order to achieve results. The program ended with far reaching impact to the poor especially on the wealth creation (savings mobilization) and loans as well as institutions able to provide services in a future in a sustainable manner.
143. Gender dimension: Targeted interventions can contribute to inclusive financial systems by increasing participation and welfare of vulnerable groups as observed in this project. Solidarity groups for women were instrumental in helping women members to mobilize savings for wealth creation. Outstanding loans to women increased over time to more than 50 percent of total loans mainly due to intensive training and mentorship provided through special programs. The model did crowd in other donors including the United Nations Capital Development Fund (UNCDF) who supported MFIs to promote gender finance.
144. Governance: Good governance for member owned institutions such as the financial cooperative has been a key to achieving sustainability. In the absence of technical assistants and project funds during the two crises, it took good leadership from volunteer management board members to safeguard members’ assets (savings) and institute risk management measures to ensure sustained growth (policies to curtail loans, increased fees on loan applications, increased capitalization of dividends from savings etc.).
145. Smart subsidies: The importance of “smart subsidies approach”33 (direct support to cover costs of partner MFIs including branch buildings, technical assistance/institutional building of MFIs and operating costs) in microfinance operations as an incentive in mobilization of owners’ equity for the development of sustainable grassroots institutions cannot be underestimated. The project showed that targeted smart subsidies can leverage/facilitate increased access to financial services to low-income populations. IDA funds subsidized the five microfinance networks and not the cost of funds to beneficiaries (interest rates) which could have distorted the market. Subsidies supported technical assistance, leveraged MFIs’ fixed costs (construction of MFI branches) as well as operating start-up costs. At closing, the project had supported the creation of 236 MFIs (compared to just 59 at the design stage) by focusing its support on institution strengthening rather than lines of credit or subsidized interest rates. The approach has indeed proven successful with operationally self sufficient MFIs with potential to cater to the needs of the poor in years to come.
146. Recommendations of supervision: Where issues for management action are raised in supervision reports, it is important for management to make quick decisions and take stern
33 In microfinance sector it is important to subsidize the institutions and not clients cost of borrowing.

42
position (including to either close the project or suspend funding) to send a strong message to the borrower and rectify the situation before the damage is too big. If the recommendations of supervision missions (during the last three years of implementation) were taken into account on time, the issue of poor management at the PIU could have received due attention from the government. This could have facilitated orderly closure of the microfinance project and timely take off of the PASEF project that is expected to scale up lessons.
147. Government appointee as head of project implementation unit (PIU) can undermine effective implementation especially when technical competencies are not matched with project requirements as was the case in this project. Project staff including top leadership should be hired on merit and rewarded competitively to avoid staff conflict which could lead to low morale as was the case in this project. Also in case of inefficiency –it becomes difficult for the World Bank to fire or replace a government employee. The Executive Secretary of the PIU was a government appointed employee who supervised project remunerated staff with better terms than those of government employees.
148. Supervision of affiliates by the MFI networks can effectively complement that of the regulator especially in the conflict affected countries. During the political crisis, the MFI networks were resilient and continued to supervise their affiliates when the Regulator was not able to do so due to political insecurity in the provinces. This can only work when complementary supervision is anchored upon a sound legal and regulatory framework (including clear definition of prudential norms and supervision methodologies for the different types of MFIs) is in place, and the stakeholders are appropriately trained as was the case in Madagascar for this project.
7. Comments on Issues Raised by Borrower/Implementing Agencies/Partners
7.1 Borrower/implementing agencies
149. The Borrower/Implementing agency did not prepare a completion report.
7.2 Cofinanciers
150. There was a pledge of about US$1.9 from other donors (EU, UNCDF, DID) as parallel funding which was not recorded. ICR mission was informed that these contributions were estimates based on donors’ interest and intention at the time of appraisal. As such there was no contractual obligation between IDA and other donors. Discussion with MFIs visited revealed that UNCDF provided direct funding to some of the MFIs in support of training women groups through the Savings and Loan Associations (SLAs) established with support from the project.
7.3 Other partners and stakeholders
151. Not applicable.
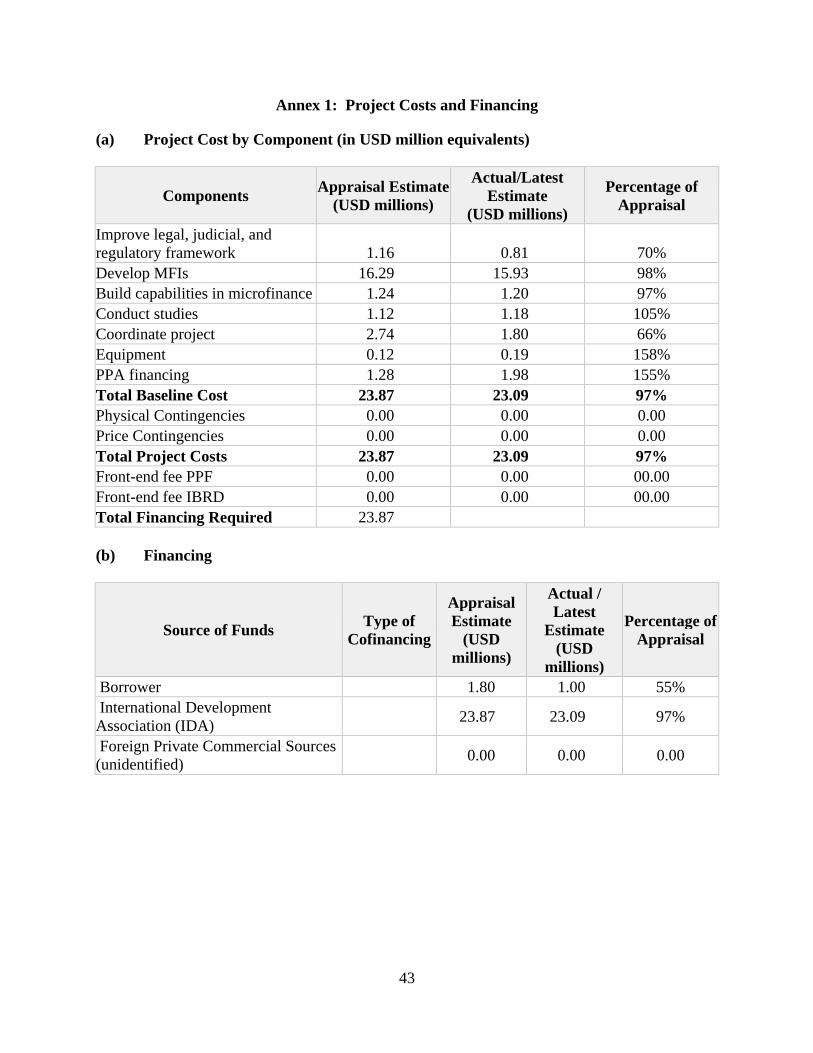
43
Annex 1: Project Costs and Financing
(a) Project Cost by Component (in USD million equivalents)
Components Appraisal Estimate
(USD millions)
Actual/Latest Estimate
(USD millions)
Percentage of Appraisal
Improve legal, judicial, and regulatory framework 1.16 0.81 70% Develop MFIs 16.29 15.93 98% Build capabilities in microfinance 1.24 1.20 97% Conduct studies 1.12 1.18 105% Coordinate project 2.74 1.80 66% Equipment 0.12 0.19 158% PPA financing 1.28 1.98 155% Total Baseline Cost 23.87 23.09 97% Physical Contingencies 0.00 0.00 0.00 Price Contingencies 0.00 0.00 0.00 Total Project Costs 23.87 23.09 97% Front-end fee PPF 0.00 0.00 00.00 Front-end fee IBRD 0.00 0.00 00.00 Total Financing Required 23.87 (b) Financing
Source of Funds Type of
Cofinancing
Appraisal Estimate
(USD millions)
Actual / Latest
Estimate (USD
millions)
Percentage of Appraisal
Borrower 1.80 1.00 55% International Development Association (IDA)
23.87 23.09 97%
Foreign Private Commercial Sources (unidentified)
0.00 0.00 0.00

44
(c) Financing by Component including Additional Finance
Original Financing
(SDR)
Additional Financing
(SDR)
Total Financing
(SDR)
Total Financing
(US$) A. Improve legal, judicial, and regulatory framework
416,300 340,000 756,300 1,164,702
B. Develop MFIs 8,005,938 2,520,000 10,525,938 16,209,945C. Build Capabilities in Microfinance
725,193 60,000 785,193 1,209,197
D. Conduct Studies 610,337 110,000 720,337 1,109,319E. Coordinate Project 982,328 360,000 1,342,328 2,067,185Equipment 70,000 10,000 80,000 123,200PPF 0Totals 10,810,096 3,400,000 14,210,096 21,883,548Project burn rate at closing
100% (in 2006)
86% December
2010 & 94%
April 30, 2011
Notes: Exchange rate used: SDR 1 = US$ 1.54. Slight variations are noted between PAD and actual due to exchange rate effects. PPF relates to the original financing Phase 1 of original APL ended on 12-30-2006 and all funds were disbursed. The burn rate for Additional Financing was 86 percent at closing in 12/30/2010. The project was granted extension to April 2011 to disburse commitments which brought the burn rate to 94 percent in April 30th.

45
Annex 2: Outputs by Component
Unlike in the datasheet, the detailed results framework below has maintained the PDOs and IOs as were defined in the original PAD and at restructuring in 2007. This will provide an understanding of the status quo (at design) and the evolving complexity as PDOs, Intermediate Outcomes and targets became comingled at design and after restructuring in 2007. As explained in the main text of this report, the targets were revised up-wards during restructuring in 2007 to take into account the evolving needs of the sector and of the MFI networks.
Table 17. Results Framework - Outputs by Component - PDOs
Project Development
Objectives (PDO)
Baseline Value
Original Target Values
(from approval documents)
Revised Target Values
(as approved by original approving
authority)
Actual Values Achieved at Completion or Target
Years
PDO Indicator 1:*
Enabling laws and regulations for MFIs
Value (Text)
Several legal impediments exist for MFIs operating in Madagascar
Microfinance law and regulations that reflect international best practice are issued, adopted and implemented
Microfinance law is effective and regulations that reflect international best practice are adopted
At closing, laws and regulations were adopted and published defining prudential regulations governing microfinance institutions relating to capital adequacy, liquidity, risk ratios, financial reporting, internal controls, and governance issues including limitation to credit for the Board, and emergence and dissolution of MFIs. The banking law (1996) was modified to fit the requirements of MF sector. The Central Bank (CB) issued 11 regulations including 2 decrees, 8 instructions and I legislation based on international best practices. This improved the supervisory framework for MFIs in the country. The CB’s supervisory capacity was improved and staffs are capable to enforce application of these regulations and MFIs are in full applicant.
Date achieved 20-May-1999 20-May-1999 13-March-2007 31-December-2010
Comments (incl. %
achievement)
Targets achieved with clear long term impact as demonstrated by CB’s ability to nurture entry and growth of MFIs in an embryonic and growing MF sector in Madagascar.
PDO Indicator 2:*
Increased access to financial services by low income populations
Value
2 MFI Networks
About 72,500 low income families
Existing five SLA networks are viable
5 viable MFI Networks exist in four provinces with 236

46
Project Development
Objectives (PDO)
Baseline Value
Original Target Values
(from approval documents)
Revised Target Values
(as approved by original approving
authority)
Actual Values Achieved at Completion or Target
Years
(Quantitative/Text)
with 59 SLAs/MFIs exist and reach 30000 clients
access financial services provided by SLAs/MFIs
and able to offer services to 300,000 members
MFI branches offering diversified financial services to 391538 members.
Date achieved 20-May-1999 20-May-1999 13-March-2007 31-December-2010
Comments (incl. %
achievement)
Targets achieved and in some cases exceeded in this PDO which consumed more than 70% of total project budget. All MFI Networks are on average operational self sufficient (106%) and financially self sufficient (103%). MFI Networks have broader and deep outreach with 236 branches offering diversified financial and non financial services (savings, credit pension payments & training to women groups) to 391538 low income families of which 51% are women. Most of the MFI branches (85 percent) are in remote rural areas.
PDO Indicator 3:*
Greater efficiency in judicial system (through improved legal texts and procedures)
Value (Text)
Usury law exist restricting growth of microfinance sector.
Liberalization of interest rates in microfinance and simplification of legal procedures for collateral seizure
Liberalization of interest rates is effective and microfinance collateral is recognized in legal procedures for collateral seizure
The MF law on collateral procedures aligned with international best standards was passed. However the law to abolish usury though fully prepared, is yet to be submitted to the Parliament for processing to become a law.
Date achieved 20-May-1999 20-May-1999 13-March-2007 31-December-2010
Comments (incl. % achievement)
Target partially achieved. The new MFI law aligned with international best standards was passed taking into
account all categories of institutions operating in the country but law could be improved to clarifying the role of CSBF in case of dissolution of an MFI.
The old usury law has not formally been abolished but it is not in application. MFIs and
other financial institutions are not obliged to adhere to the out-dated usury law and in fact they currently set competitive market interest rates. The drafted usury law is expected to be submitted to the Parliament and passed in 2011 though it is doubtful if this will happen due to the transitional nature of the government.
PDO Indicator 4:
Increased productivity and improved standards of living of microfinance clients
Value (Text)
No baseline
Impact study to confirm improved standards of living
Impact study to confirm improved standards of living
An Impact study was conducted and it confirms that standards of living of beneficiaries were improved. This was complemented by 16 intermittent studies including feasibility studies geared on expansion to new provinces, new MFI branches & products etc).
Date achieved 20-May-1999 20-May-1999 31-December-2010

47
Project Development
Objectives (PDO)
Baseline Value
Original Target Values
(from approval documents)
Revised Target Values
(as approved by original approving
authority)
Actual Values Achieved at Completion or Target
Years
Comments (incl. % achievement)
The impact study (2005) indicated that low income population have socially and economically benefited from the program through increased access as evidenced by a high bank penetration rate reported (average 11 percent) and diversified products that are offered by MFIs (pension payment system, savings and loans including warehouse receipt for agricultural products) .
The major recommendation of this study was the need to increase women’s participation which led to a revised strategy (including setting a target of 50% during restructuring) to reinforce solidarity group lending complemented with specialized training for women groups. The study reiterated the need to remain focused on social targeting by ensuring that loan size did not deviate far above the GDP/capita which was fully observed. The feasibility study concluded the need to expand the program to cover more provinces due to the positive social impact observed for beneficiaries in the first two provinces.
In addition to savings mobilization the proximity of services to the low income segment is among some of the benefits mentioned during ICR data collection focused group meetings with beneficiaries.
This impact study was conducted before the restructuring of the project for additional financing. The study findings indicate that standards of living of beneficiaries had improved. The study confirmed that overall 57 percent of the interviewed beneficiaries reported that their standards of living had improved as a result of participating in the project. Rural farmers reported that they were able to increase their land surface holding and bought fertilizers and inputs which increased productivity. In Lac Alaotra about 54 percent of interviewed beneficiaries were able to buy improved agriculture equipment and 48 percent increased their land holding (at appraisal Lac Alaotra was reported to have high incidence of land seizure by money lenders - loan sharks) who were the main source of credit.34 In Fianarantsoa 40 percent reported increased number of livestock holding. Overall 40 percent of the interviewed beneficiaries reported increased revenues, 39 percent had increased school enrolment for their children due to income from their businesses. Overall 33 percent reported improved daily diet and 29 percent improved health status of their families. Focus group discussion reported that some borrowers were able to make home improvements due to profits gained from their businesses. Some were able to buy consumer goods like radios, television and fridges (See tables underneath this matrix for additional impact data). The instability during the additional financing phase (2007 – 2010) made it difficult to undertake another study towards the end which could have provided updated evidence of the improved productivity and beneficiaries’ standard of living. A thorough post implementation impact study will shed light on the extent of the socio-economic benefits accrued to the low income segment in Madagascar.
PDO Indicator 5:
Appropriate supervisory methodologies for MFIs established
Value (Text)
MFIs are not adequately supervised by the authorities
Appropriate laws and regulations are passed and implemented for all MFIs.
All licensed MFIs are adequately supervised by the authorities
A law was passed giving the Central bank supervisory role of MFIs with clear mandate. This resulted to an organized supervisory institutional framework of MF sector in the country.
Date achieved 20-May-1999 20-May-1999 13-March-2007 31-December-2010
34 Restructuring paper for Additional Financing 2007.

48
Project Development
Objectives (PDO)
Baseline Value
Original Target Values
(from approval documents)
Revised Target Values
(as approved by original approving
authority)
Actual Values Achieved at Completion or Target
Years
Comments (incl. % achievement)
Targets achieved and impact is visible in the financial sector. Different types of MFIs have a streamlined registration and supervision mechanism that is strictly adhered. MFIs are registered based on size and capital structure. The Banking Supervision Commission (CSBF) undertakes registration and supervision of MFIs level 2 & 3 (The two categories have high capital requirements). MFIs in level 1 are not subjected to strict regulations, but they are coordinated by the Ministry of Finance through a special MF unit -the National Microfinance Coordination Unit (CNMF). CSBF undertakes regular on and off-site supervisions of licensed MFIs. All level 2 & 3 MFIs are required to report on quarterly basis.(see attached document on list of laws and prudential regulations passed for more details).

49
Table 18. Results Framework - Outputs by Component – IO Indicators
Intermediate Outcome Indicator
Baseline Value
Original Target Values
(from approval documents)
Revised Target Values
(as approved by original approving
authority)
Actual Values Achieved at Completion or Target
Years
IO Indicator 1:
Prudential rules are issued for all MFIs
Value (Text)
Several legal impediments exist for MFIs operating in Madagascar
Appropriate laws and regulations are passed and implemented for all MFIs
Appropriate laws and regulations are passed and implemented for all MFIs
Aligned with the banking law (1996), new prudential regulations for all financial institutions, including microfinance organizations were issued by the CB and all FIs including MFIs are in full compliant.
Date achieved 20-May-1999 20-May-1999 13-March-2007 13-December-2010
Comments (incl. %
achievement)
Targets achieved. The regulator performed very well on this indicator as detailed prudential ratios for the different categories of MFIs were issued including chart of accounts – all based on international standards for microfinance industry. Prudential norms defines solvency requirements, risk concentration, lending to directors, equity investments and internal control, chart of accounts, capital adequacy, and publishing of accounts as well as licensing requirements for microfinance, external auditors, and liquidity.
IO Indicator 2:*
Two existing SLAs (Fianarantsoa and Toamasina) are strengthened and two new SLA networks are created in Tana and Antsiranana and perform well
Value (quantitative/
Qualitative)
2 MFI Networks with 59 SLAs/MFIs exist and reach 30,000 clients
102 SLAs in operation reach about 72,500 SLA members in the disadvantaged groups Total savings reach US$2.9 million and Total outstanding loans US$3.5 million.
Five SLA networks with 200 SLAs in operation reach about 300,000 members of which 50% are women and 25% from disadvantaged groups Total savings reach US$25 million and Total outstanding loans US$23 million. All MFIs are operationally sustainable
Five MFI Networks exist with 236 branches reaching 391,538 disadvantaged groups of which 51% are women. A total of US$28,701,759 in savings mobilized and US$22,909,588 of loans outstanding. All five MFI Networks are on average operationally self sufficient (106%).
Date achieved 20-May-1999 20-May-1999 13-March-2007 31-December -2010
Comments (incl. %
achievement)
Target achieved and exceeded as three new networks were created and all the five MFI Networks are also on average operational and financially Self Sufficient (103 percent).

50
Intermediate Outcome Indicator
Baseline Value
Original Target Values
(from approval documents)
Revised Target Values
(as approved by original approving
authority)
Actual Values Achieved at Completion or Target
Years
IO Indicator 3:*
Build capacity in microfinance through training
Value (quantitative/
Qualitative)
Only few Malagasy have had formal training and can properly manage an MFI
80 persons attend one or more microfinance courses.
Training program delivers specially designed and adapted technical modules to practitioners from all MFIs in the country. Evaluation of program confirms increased knowledge and skills for proper management of MFIs
A total of 19 training sessions were organized through an umbrella microfinance apex association (APMF) for more than 200 MFI staff and practitioners. Evaluations confirm improved capacity of MFI practitioners (see training reports attached in the portal).
Date achieved 20-May-1999 20-May-1999 13-March-2007 31-December -2010
Comments (incl. %
achievement)
Targets achieved with positive impact as evidenced by solid capacity of MFI networks in credit management including operational risk. Interview with participants during ICR data collection indicated a preference to structured courses offered by CGAP, Boulder and Turin Center as opposed to locally tailored modules. Also, exchange visits to peer institutions are preferred as they offer practical experience as opposed to classroom learning. Increased capacity in the field of microfinance sector was also reported with more locally available consultants and consulting firms specialized in microfinance development.
IO Indicator 4:**
Financial Self-Sufficiency
Value (quantitative/
Qualitative)
N/A N/A Financial Self-Sufficiency for MFI networks to be measured (< 100% for all MFI networks
MFI Networks MFI Networks have an average OSS of 106% and FSS 103%
Date achieved 20-May-1999 31-December-2010
13-March-2007 31-December-2010
Comments (incl. %
achievement)
Results achieved. No targets were set for this core mandatory indicator which was added but best practice is to achieve breakeven point of 100%. Only three MFI Networks are slightly behind schedule as explained in the text (OTIV Tana 94%, Mangoro 99.14% and Toamasina 97.16%).
IO Indicator 5:**
Portfolio at Risk (PAR)
Value (quantitative/ Qualitative)
N/A N/A Portfolio at Risk (PAR) of MFI Networks to be measured
10%
Date achieved 20-May-1999 13-March-2007 31-December-2010
Comments (incl. % achievement)
No targets were set on this core IO. This is NPL ratio > 90 days. There was a 4% decrease on this ratio from 14% reported in 2009. MFIs have revised credit policies to mitigate the rising NPL ratios. Less lending with more savings mobilization strategy is in effect since 2009. Given the financial crisis, this performance is acceptable when compared to the average reported by peer institutions in SSA. With an Average Return on Assets which is above 3% the MFIs are still profitable and viable regardless of the NPL which has been cyclic due to financial and political crisis.

51
Intermediate Outcome Indicator
Baseline Value
Original Target Values
(from approval documents)
Revised Target Values
(as approved by original approving
authority)
Actual Values Achieved at Completion or Target
Years
IO Indicator 6:
Outstanding Microfinance Loan Portfolio
Value US$ (quantitative/ Qualitative)
US$8.37 million US$23 million About US$22 million
Date achieved
20-May-1999 13-March-2007 31-December-2010
Comments (incl. % achievement)
Targets achieved at 99% of PAD targets. As explained above, loan underwriting is on hold to mitigate the NPL risk. Savings mobilized exceed loans (US$28.7 million) at closing indicating a sustained balance sheet growth amid reduced interest income due to slow loan underwriting.
IO Indicator 7:
No of active loan accounts -Microfinance
Value (quantitative/ Qualitative)
4 027 70,212 48,022
Date achieved
20-May-1999 13-March-2007 31-December-2010
Comments (incl. % achievement)
Number of active loans to members does not include group loans given to women’s savings and loan associations which was 1,562 in 1999 and 18,715 at closing. If added the baseline would be 5,589 and closing figure of 66737. Membership growth trend for all MFIs has been on average 21% per annum which is impressive.
IO Indicator 8:
Active Loan Accounts for Women
Value (quantitative/ Qualitative)
1562 4,505 18715
Date achieved 20-May-1999 13-March-2007 10-December-2010
Comments (incl. % achievement)
The reported numbers relate to women group loans. In addition to this, women constitute about 51% of total members which assumes that about the same ratio of total active loan is attributed to women members.
OI Indicator 9: (optional)
Percentage of project-supported institutions that are reporting on this indicator
Value (quantitative/ Qualitative)
Two MFI Networks with 59 branches
225 MFIs Five MFI Networks with 236 branches.
Date achieved 20-May-1999 10-December-2010 10-December-2010
Comments (incl. % achievement)
The Management Information System applied by some of the MFI Networks facilitates bi-monthly data synchronization between branches and the MFI Network. However, only one MFI Network has fully migrated to a real time portfolio synchronization system. All Networks have included migration to real time portfolio management system as a priority in their business plans (2010 -2013).
* = Revised indicator / **= New Core Indicator

52
Additional analysis on Efficiency/Efficacy
Table 19. Performance of Individual MFI networks (Additional financing era 2007 – 2010)
MFI Network 1: Volatile Performer – Lack Alaotra MFI Network
2007 Achieved/Proje
ct paper targets)
2008 Achieved /Project
Paper targets
2009 Achieved /Project
Paper targets
2010 (project was to end in 2009 – no
targets were established for
2010)
OSS 142%* Target
159% 109.29%
Target 163% 50.31% Target
175% 99.14%
FSS (targets n/a) 104.76% 50.31% 99.14% Profit or Loss (12-30-2010)-targets n/a
MGA 523,860,000 (US$261)
*Achieved for 2006 is considered as achieved for 2007 due to lack of substantiated information for this period
MFI Network 2: Moderate Performer - OTIV TANA MFI Network
2007 (Project paper
targets)
2008 Achieved
/Project Paper targets
2009 Achieved
/Project Paper targets
2010 (project was to end in 2009 – no targets were established for 2010)
OSS 140%* Target 142%
99.73% Target 145%
97.54% Target 148%
98.91%
FSS (targets n/a) 93.64% 92.62% 94.41% Profit or Loss (12-30-2010)-targets n/a
MGA 166,158,348.91
(US$83,000) *Achieved for 2006 is considered as achieved for 2007 due to lack of substantiated information for this period
MFI Network 3: High Performer – Diana MFI Network
2007 (Project paper
targets)
2008 Achieved
/Project Paper targets
2009 Achieved /Project Paper targets
2010 (project was to end in 2009 – no targets were established for 2010)
OSS 156%* Target
160%
131.21% Target 163%
131.18% Target 174%
157.59%
FSS (targets n/a) 108.82% 106.98% 122% Profit or Loss (12-30-2010)-targets n/a
MGA 1,408,362,000
(US$704,000) *Achieved for 2006 is considered as achieved for 2007 due to lack of substantiated information for this period

53
MFI Network 4: Moderate Performer – Toamasina MFI Network
2007
Achieved/Project paper targets
2008 Achieved
/Project Paper targets
2009 Achieved
/Project Paper targets
2010 (project was to end in 2009 – no targets were
established for 2010)
OSS 95%* Target
100%
89.96% Target 110%)
78.77% Target 120%
97.16%
FSS (targets n/a) N/A 86.86% 78.40% 97.16% Profit or Loss (12-30-2010)-targets n/a
MGA 130,566,350
(US$65,000)
*Achieved for 2006 is considered as achieved for 2007 due to lack of substantiated information for this period
MFI Network 5: Moderate Performer – Fianarantsoa MFI Network
2007 (Project paper
targets)
2008 Achieved /Project Paper targets
2009 Achieved
/Project Paper targets
2010 (project was to end in 2009 – no targets were established for
2010)
OSS 76%* Target 86% 77.47%
Target 104% 89.21% Target
132% 122.45%
FSS (targets n/a)
74.50% 84.74% 115.00%
Profit or Loss (12-30-2010)-targets n/a
MGA 245,770,547.75 (US$122,885)
*Achieved for 2006 is considered as achieved for 2007 due to lack of substantiated information for this period.
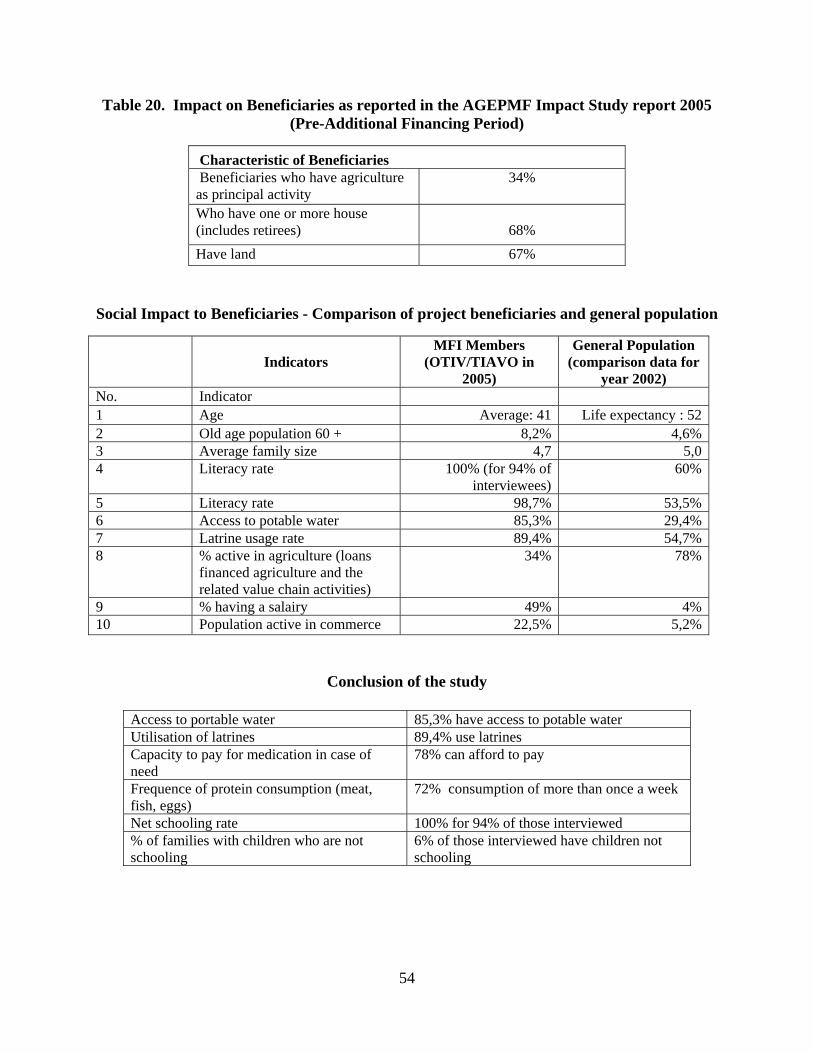
54
Table 20. Impact on Beneficiaries as reported in the AGEPMF Impact Study report 2005 (Pre-Additional Financing Period)
Characteristic of Beneficiaries Beneficiaries who have agriculture as principal activity
34%
Who have one or more house (includes retirees)
68%
Have land 67%
Social Impact to Beneficiaries - Comparison of project beneficiaries and general population
Indicators
MFI Members (OTIV/TIAVO in
2005)
General Population (comparison data for
year 2002) No. Indicator 1 Age Average: 41 Life expectancy : 522 Old age population 60 + 8,2% 4,6%3 Average family size 4,7 5,04 Literacy rate 100% (for 94% of
interviewees)60%
5 Literacy rate 98,7% 53,5%6 Access to potable water 85,3% 29,4%7 Latrine usage rate 89,4% 54,7%8 % active in agriculture (loans
financed agriculture and the related value chain activities)
34% 78%
9 % having a salairy 49% 4%10 Population active in commerce 22,5% 5,2%
Conclusion of the study
Access to portable water 85,3% have access to potable water Utilisation of latrines 89,4% use latrines Capacity to pay for medication in case of need
78% can afford to pay
Frequence of protein consumption (meat, fish, eggs)
72% consumption of more than once a week
Net schooling rate 100% for 94% of those interviewed % of families with children who are not schooling
6% of those interviewed have children not schooling

55
Impact on access to finance in rural areas (rural targeting)
Indicators % of rural MFI branches 73% % of members with agriculture as principal activity 34% % of members who joined one rural MFI branch 51% Agriculture produits offerts Rice cultivation, warehouse receipt finance
(stockage), equipment (especially in OTIV Lac Alaotra ). Crédit stockage ( Community village cereal banks) in Fianarantsoa since 2004.
% de rural banks 73%
Access to finance from other sources
New members Existing members Total Don’t have 56.9% 56.5% 56.6%Yes have access from other sources
43.1% 43.5% 43.4%
Grand Total 100.0% 100.0% 100.0%
Other sources of financing (outside the supported MFI Networks)
Type of institution (source of extra financing) Number Bank (BOA, BNI-CL) or other MFIs not supported by the project (CECAM, CEM)
163
Parents or family members 93Development projects (PSDR, Seecaline,..) 16Informal money lenders (loan sharks) 6
Depository of beneficiaries’ savings
Where do you deposit your savings? Number OTIV/TIAVO (supported MFI Networks) 198 Other financial institutions 25 Other 129 Grand Total 352
Main Sources of Revenue
Primary source Rural Urbain Grand Total Agriculture/livestock 47% 12% 34% Commerce 19% 29% 22% Artisanat/SME 8% 17% 12% Salaried 23% 36% 28% Labourers 2% 2% 2% Other 1% 5% 3% Grand Total 100% 100% 100%

56
Impact on Landholding by Beneficiaries
Region Surface : Fianarantsoa L’Alaotra Tana Toamasina Diana Grand Total< 10 acres 8 3 48 19 7 8510,01-40 acres 9 3 25 7 12 5640,01-80 acres 1 7 15 8 6 37> 80 acres 48 41 54 57 14 214Total people with land 66 54 142 91 39 392Pesants with no land 6 7 7 10 9 39
Impact on Social Targeting (Gender): Measure of Access to finance by Gender groups
Curent credit? Gender No yes TotalMen 54,59% 47,93% 52,69%Women 45,41% 52,07% 47,31%Total 100,00% 100,00% 100,00%

57
Annex 3. Economic and Financial Analysis
Measure of Efficiency
As explained in the main report, a Subsidy Dependence Index (SDI) was adopted as a measure of efficiency at design. However, at restructuring in 2007 the methodology of calculating the SDI was changed35 to Operational Self Sufficiency of 100 percent found to be in line with the microfinance sector best practice on measuring sustainability which takes into account profitability and sustainability indices. An MFI can have a high non-performing loan (NPL – core indicator) rate and make losses but when the Return on Assets (RoA) is positive it indicates that solvability and efficiency are well mitigated. This is the case with the five MFI Networks in Madagascar which had NPL of 10 percent at closing, reduced profits in 2009 due to the political and global financial crisis but had average Return on Equity (ROE) of 17.74 percent and a positive Adjusted RoA (2.36 percent) as described in the main report which indicate that these five MFI Networks have proved to be profitable, solvent, efficient and sustainable. A consolidated financial statement for 2010 of the five MFI Networks used to arrive at the above analysis is provided below.
Table 21. Consolidated Financial Analysis for the five MFI Networks in December 2010
Indicator Code
Calculation Details 2010 (MGA)
Return on Equity (ROE) A Net Operating Profit 2,474,717,247 B Total Equity 13,953,656,427 C Return on Equity (ROE) = (A÷ B) 17.74% Return on Assets D Total assets beginning of period 74,810,249,384 E Total assets end of period 89,501,118,726 F Average assets 82,155,684,055 G Return on Assets (ROA) = (A÷ F) 3.01% Inflation Adjustments
H Avg. Currency dominated assets 12,789,576,254 I Average liability 7,609,355,928 J Inflation rate 10.00% K Inflationary Adjustments = (H-I) x J
(RATI) 518,022,033
L Average outstanding principal for soft loans
671,638,913
M Market Interest rate 15% N Imputed interest amount at the
market rate (L x M) 100,745,837
Adjustment to Subsidy O Actual Interest paid on the loan (12%)
80,596,669.56
P Grants from AGEPMF 1, 444 ,152.75 Q R Cost of Fund adjustment for soft
loan + grants (R = N – O + P)
21,593,320.19
35 Refer to PAD Annex 3 and attachment to Annex 1 of Project Agreement (Credit #3217-1-MAG) Additional Financing for the SDI method used at design stage.

58
Indicator Code
Calculation Details 2010 (MGA)
S Market value of rental of branch premises
314,854,916
Adjustment for in kind Subsidy
T Rent actually paid 314,854,916
U Adjustment for in kind subsidy (AIS = S - T)
0
V Net profit for period 2,474,717,247.00 Adjusted Return on Assets (AROA)
W Total adjustments (K+R+U) 539,615,353.19 X Adjusted net profit (V-W) w 1,936,546,047 Y Adjusted Return on Assets
(AROA = X ÷ F) 2.36%
Z Accounting revenue for period excluding grants
17,943,922,845.00
Financial Self Sufficiency (FSS)
A' Expenses for period 16,934,580,644 B' Adjusted Expenses (A’+W) 17,474,195,997.19 OSS
Operational Self Sufficiency (Z ÷ A')
106%
`C’ FSS (Z ÷ B) 103% Source: Project data & Audit report 2010
Key assumptions:
a. Mid-term Business Plans of the five MFI networks envision building offices in lieu of renting. Rental costs will significantly be reduced in the next five years. This in turn will reduce variable operating costs and positively affect the Financial Self Sufficiency rate.
b. In kind contribution is not exhaustive as it does not include labor time of Board Members who mainly work on voluntary basis. If the model was to valorize in kind contribution, the FSS would be higher than that reported.
c. Although on average all the MFI networks have achieved operational and financial self sufficiency, the fluctuation is noticed in 2010 for three MFIs which are slightly below 100 percent just about 5 percent from reaching a 100 percent which is the breakeven point required). However the three MFIs have higher membership growth rate than others hence good performance in terms of outreach.
d. Data used for computations has been verified and is in accordance with the approved audit report (December 2010).
e. Only one MFI Network (OTIV Tana) borrowed from the market (MGA 671,638,913) at 12 percent rate in 2010. All other MFI Networks did not borrow in the last two years and are fully dependent on transformation of member savings to loans.
f. Return on Equity is 17 percent despite the volatility of MFI networks performance during this period. This does offer comfort against the high NPL ratio since it indicates that although MFIs are losing the interest income their own equity (including retained earnings which are capitalized etc) is productive.

59
Table 22. List of Legal Instruments prepared
This table provides a summary of decrees, orders, instructions, circulars and decisions taken by the regulator to improve the legal and regulatory framework in the microfinance sector.
Source: CSBF/Secrétariat Général/DRE/TSR/SPP

60
Table 23. Classification of MFIs (Level 1 – 3) including Capital Adequacy Requirements

61
Table 24. List of new Licenses Issued and Classification of MFIs (2008 – 2010) to MFIs (from level 1 to 2 & 3)
Year 2008

62
Year 2009

63
Year 2010


65
Annex 4. Bank Lending and Implementation Support/Supervision Processes
(a) Task Team members
Names Title Unit Lending Bertrand Ah-Sue Sr. Procurement Specialist AFTS2 David Freese Disbursement Officer LOAAF Gervais Rakotoarimanana Financial Management Specialist AFMMG Herminia Martínez Principal Operations Officer (TTL) AFTP1 Jean Delion Rural Development Specialist AFTA2 Jean-Bernard Maucor Economist AFTP1 Sidi Boubacar Counselor LEGAF T. Mpoy-Kamulayi Sr. Counsel LEGAF
Supervision/ICR Andres Jaime Sr. Financial Specialist (TTL) ECSPF Andrea Vasquez-Sanchez Sr. Program Asst. AFTFW Ann Christine Rennie Lead Financial Sector Specialist SASFP Astrid Manroth Senior Energy Specialist ECSS2 Edward Kabifya Gondwe Operations Analyst AFTFP Francois Marie Maurice Rakotoarimanana
Sr. Financial Management Specialist AFTFM
Jacqueline Veloz Lockward Program Assistant AFTFW Jean Charles Amon Kra Sr. Financial Management Specialist AFTFM Josiane V. Raveloarison Sr. Private Sector Development AFTFE Korotoumou Ouattara Sr. Financial Sector Specialist (TTL) AFTFW Lova Niaina Ravaoarimino Procurement Analyst AFTPC Magueye Dia E T Consultant AFTFW Mazen Bouri Sr. Private Sector Development AFTFE Nathalie Ramanivosoa Team Assistant AFCCI Saholy Andriambololomanana Senior Program Assistant AFMMG Sidonie Jocktane Executive Assistant AFMGA Sylvain Auguste Rambeloson Senior Procurement Specialist AFTPC Volana Andriamasinoro Program Assistant AFMMG
Zahia Lolila Sr. Financial Sector Specialist (ETC) ICR Primary Author
AFTFW
Ziva Razafintsalama Senior Rural Development Specialist AFTAR

66
(b) Staff Time and Cost
Stage of Project Cycle Staff Time and Cost (Bank Budget Only)
No. of staff weeks USD Thousands (including travel and consultant costs)
Lending FY98 179.39 FY99 167.49 FY00 12- -16.20 FY01 0.00 FY02 0.00 FY03 0.00 FY04 0.00 FY05 0.00 FY06 0.00 FY07 0.00 FY08 0.00
Total: 12- 330.68 Supervision/ICR
FY98 0.77 FY99 1.91 FY00 21 82.16 FY01 23 92.01 FY02 28 72.02 FY03 36 106.77 FY04 27 108.34 FY05 33 101.86 FY06 33 99.28 FY07 37 113.08 FY08 11 61.69 FY09 13 0.00
Total: 262 839.89

67
Annex 5. Beneficiary Survey Results
Not applicable.

68
Annex 6. Stakeholder Workshop Report and Results
Not applicable.

69
Annex 7. Summary of Borrower's ICR and/or Comments on Draft ICR
Report was not available. The Implementing Agency (AGEPMF) submitted activity report covering the entire period of program implementation with key deliverables to December 31, 2010. However, this is not a formal ICR report from the Government of Madagascar. The main highlights of the report from AGEPMF are listed below:
The project was instrumental in improving access to finance for the poor in rural areas. However, there is need to expand and cover the rest of the country since demand for financial services for the poor still remain largely un-met in the country.
World Bank procedures delayed implementation of activities at certain stages in program implementation. There is need to streamline World Bank procedures and speed up program implementation. There is a recommendation to improve communication between the implementing agency and the World Bank teams. Though not made explicit, this recommendation is related to program coordination issues which were raised in several Aide Memoires leading to IDA team at one point threatening to suspend the PASEF program if the coordinator was not removed.
PASEF program is expected to expand the impact to other parts of the country. There are concerns about delayed implementation of the follow-up phase (PASEF) program.
It will be necessary to reinforce the approach of performance-based contracts in supporting MFIs to avoid laxity.

70
Annex 8. Comments of Cofinanciers and Other Partners/Stakeholders
Not applicable.

71
Annex 9. List of Supporting Documents
Project Background, Objectives, PDOs, IOs, Targets Project Information Document (PID), Report 5929 (February 1999) Project Appraisal Document (PAD), Report 18959-MAG (April 26, 1999) Development Credit Agreement (DCA), No. 3217-MAG (June 10, 1999) Project Agreement (PA) with Central Bank of Madagascar, No. 3217-MAG (June 10, 1999) Proposed Portfolio Restructuring in a Post-Crisis Environment, No. P7561-MAG (October 22, 2002 Project Restructuring Paper, Report 38892-MG (March 13, 2007) Project Agreement, No. 3217-1-MAG (May 22, 2007) Financing Agreement, No. 3217-1-MAG Implementation Status and Results (ISR) Reports Financial Management (FM) Reports Project Financing ISRs & FM reports in the portal PAD, Restructuring Paper & DCA documents Project Audit Reports & MFIs Audit Report (2009 & 2010) Annual Progress Report: AGEPMF 2009 & 2010 Letter to AGEPMF from TTL/FM: Comments on Annual Audit Reports (2010) Component 1: Policy, Legal/Regulatory Annual Progress Report: AGEPMF 2009 & 2010 ISRs, PAD & Restructuring Paper Component 2: Access Annual Progress Report: AGEPMF 2009 & 2010 Annual Audit Reports (AGEPMF & MFIs) Portfolio Reports of MFIs Business Plans (Mid-Term 2010-2013) of MFIs. Component 3: Build Capabilities in Microfinance AGPM Progress Report (December 31, 2010) Interviews with APIMF (Apex association), sector practitioners and MFI staff & Board members ISRs of the project Component 4: Conduct Studies Audits for Project Implementation Unit (PIU) and MFI Networks 2010 Impact Study Report AGEPMF (2005): FACET BV Supporting Small Enterprises

72
Literature
1. Stefano Paternostro et al, 2001, Cornel Food and Nutrition Policy Program Working Paper No. 120
2. (2006) UNCDF Building Inclusive Financial Sectors in Africa, http://www.uncdf.org/english/microfinance/pubs/bluebook/pub/index.php?get_page=contents
3. (2009) CGAP Measuring Results of MF Institutions, http://www.cgap.org/gm/document-1.9.36551/Indicators_TechGuide.pdf
4. Government of Madagascar (2006), Madagascar Action Plan 2007-2012, http://siteresources.worldbank.org/INTMADAGASCAR/Resources/MAP
5. Microfinance Mix Data various surveys, reports and statistics for SSA, http://www.cgap.org
6. (2010) CGAP Advancing Savings Services: Resource Guide for Funders – A Technical Guide
7. (2008) CGAP: Africa Microfinance Analysis and Benchmarking Report 8. (2009) Sub-Saharan Africa Microfinance Analysis and Benchmarking Report,
http://www.cgap.org/gm/document-1.9.43711/2009_SSA_Microfinance_Analysis_Benchmarking_Report.pdf
9. (2010) CGAP: MIX Microfinance World: Sub-Saharan Africa Microfinance, http://www.cgap.org/gm/document-1.9.43711/2010_SSA_Microfinance_Analysis_Benchmarking_Report.pdf
10. Analysis and Benchmarking Report 2010, http://www.cgap.org/gm/document-1.9.43711/2010_SSA_Microfinance_Analysis_Benchmarking_Report.pdf
11. (2010) CGAP Financial Access Sub-Saharan Africa Factsheet, www.cgap.org/financialindicators
12. (2002), Memorandum and Recommendation by the President of the International Development Association to the Executive Directors on a Proposed portfolio Restructuring in a Post-Conflict Environment in the Republic of Madagascar, October 22, 2002, Report No. P7561-MAG.
13. (2007), Country Assistance Strategy for the Republic of Madagascar for 2007-2011, March 7, 2007, Report No. 38 135-MG, www-wds.worldbank.org/external/default/WDSContentServer/ WDSP/IB/2007/04/27/ 000020953_20070427084117/Rendered/PDF/38135.pdf.
14. (2010) Madagascar GNI, http://siteresources.worldbank.org/INTPROSPECTS/Resources/334934-1199807908806/Madagascar.pdf
15. Madagascar: Country Brief, http://go.worldbank.org/D41QD46W10.

VatomandryVatomandry
MahanoroMahanoro
VarikaVarika
MananjaryMananjary
TsivoryTsivory
BeraketeBerakete
BelohaBeloha
BetrokaBetroka
ManjaManja
MandabeMandabe
MorombeMorombe
AnkazoaboAnkazoabo
BerorohaBeroroha
SakarahaSakaraha
BetiokyBetioky
AndrokaAndroka
AmpanihyAmpanihy
Midongy-Midongy-AtsimoAtsimo
AmbohimahasoaAmbohimahasoa
AntalahaAntalaha
MaroantsetraMaroantsetra
MananaraMananara
MoramangaMoramanga
AntanifotsyAntanifotsy
Ambatofinan-Ambatofinan-drahanadrahana
MiandrivazoMiandrivazo
MalaimbandyMalaimbandy
Belo TsiribihinaBelo Tsiribihina
AndilanatobyAndilanatoby
AndilamenaAndilamena Soanierana-IvongoSoanierana-Ivongo
AndriamenaAndriamena
SoalalaSoalala
BesalampyBesalampy
AntsalovaAntsalova
KandrehoKandreho
AnkazobeAnkazobe
VohimarinaVohimarina
AmbilobeAmbilobe
MandritsaraMandritsaraMampikonyMampikony
BefandrianaBefandriana
BealananaBealanana
AmbanjaAmbanja
AmboasaryAmboasary
ToamasinaToamasina
AmbatondrazakaAmbatondrazaka
AntsirananaAntsiranana
MahajangaMahajanga
ToliaraToliara
FianarantsoaFianarantsoa
ManakaraManakara
FarafanganaFarafangana
AntsirabeAntsirabe
MorondavaMorondava
MiarinarivoMiarinarivoTsiroanomandidyTsiroanomandidy
SambavaSambava
AntsohihyAntsohihy
TolanaroTolanaroAmbovombeAmbovombe
IhosyIhosy
MaevatananaMaevatanana
AmbositraAmbositra
MaintiranoMaintirano
Fenoarivo-AtsinananaFenoarivo-Atsinanana
ANTANANARIVOANTANANARIVO
DIANADIANA
SAVASAVA
SOFIASOFIA
ANALANJIROFOANALANJIROFOBOÉNYBOÉNY
BETSIBOKABETSIBOKA
ANALAMANGAANALAMANGABONGOLAVABONGOLAVA
ITASYITASY
MELAKYMELAKYALAOTRAALAOTRA
MANGOROMANGORO
ATSINANANAATSINANANA
AMORON’I MANIAAMORON’I MANIA
HAUTE-MATSIATRAHAUTE-MATSIATRA
IHOROMBEIHOROMBEATSIMO-ATSIMO-
ANDREFANAANDREFANA
ANOSYANOSY
ANDROYANDROY
ATSIMO-ATSIMO-ATSINANANAATSINANANA
MENABEMENABE
VATOVAVY-VATOVAVY-FITOVINANYFITOVINANY
VAKINANKARATRAVAKINANKARATRA
MayotteMayotte(France)(France)
Ank
arat
a
Massi fMassi fTsaratananaTsaratanana
Androy Plateau
Cli
f f o
f A
ng
av
o
Cl i
f f o
f B o n g o l a
v a
MaromokotroMaromokotro(2,876 m)(2,876 m)
Pic BobyPic Boby(2,658 m)(2,658 m)
TsiafajovonaTsiafajovona(2,642 m)(2,642 m) Vatomandry
Mahanoro
Varika
Mananjary
Tsivory
Berakete
Beloha
Betroka
Manja
Mandabe
Morombe
Ankazoabo
Beroroha
Sakaraha
Betioky
Androka
Ampanihy
Midongy-Atsimo
Ambohimahasoa
Antalaha
Maroantsetra
Mananara
Moramanga
Antanifotsy
Ambatofinan-drahana
Miandrivazo
Malaimbandy
Belo Tsiribihina
Andilanatoby
Andilamena Soanierana-Ivongo
Andriamena
Soalala
Besalampy
Antsalova
Kandreho
Ankazobe
Vohimarina
Ambilobe
MandritsaraMampikony
Befandriana
Bealanana
Ambanja
Amboasary
Toamasina
Ambatondrazaka
Antsiranana
Mahajanga
Toliara
Fianarantsoa
Manakara
Farafangana
Antsirabe
Morondava
MiarinarivoTsiroanomandidy
Sambava
Antsohihy
TolanaroAmbovombe
Ihosy
Maevatanana
Ambositra
Maintirano
Fenoarivo-Atsinanana
ANTANANARIVO
DIANA
SAVA
SOFIA
ANALANJIROFOBOÉNY
BETSIBOKA
ANALAMANGABONGOLAVA
ITASY
MELAKYALAOTRA
MANGORO
ATSINANANA
AMORON’I MANIA
HAUTE-MATSIATRA
IHOROMBEATSIMO-
ANDREFANA
ANOSY
ANDROY
ATSIMO-ATSINANANA
MENABE
VATOVAVY-FITOVINANY
VAKINANKARATRA
Mayotte(France)
Mah
avav
y
Betsiboka
Bemarivo Sofia
LakeAlaotra
Mangoro Mania
Tsiribihina
Mananara
Onilahy
Man
drav
e
Mangoky
Fihere
chana
Menarand
ra
Manambaho
Mahajamba
I N D I A N
O C E A N
Mo z a m
b i q u e C
h a n n e l
Ank
arat
a
Massi fTsaratanana
Androy Plateau
Cli
f f o
f A
ng
av
o
Cl i
f f o
f B o n g o l a
v a
Maromokotro(2,876 m)
Pic Boby(2,658 m)
Tsiafajovona(2,642 m)
45°E 50°E
50°E
45°E
25°S
20°S
15°S
20°S
15°S
MADAGASCAR
0 40 80 120 160
0 120 Miles8040
200 Kilometers
IBRD 33439R
MAY 2011
MADAGASCAR
This map was produced by the Map Design Unit of The World Bank. The boundaries, colors, denominations and any other information shown on this map do not imply, on the part of The World Bank Group, any judgment on the legal status of any territory, o r any endo r s emen t o r a c c e p t a n c e o f s u c h boundaries.
SELECTED CITIES AND TOWNS
REGION CAPITALS
NATIONAL CAPITAL
RIVERS
MAIN ROADS
RAILROADS
REGION BOUNDARIES