
Document of The World Bank · Document of The World Bank ... Regional Vice President: Makhtar Diop...
66
Document of The World Bank Report No: ICR00003336 IMPLEMENTATION COMPLETION AND RESULTS REPORT (TF-91213) ON A GRANT IN THE AMOUNT OF US$ 5.0 MILLION TO THE REPUBLIC OF MOZAMBIQUE FOR A MOZAMBIQUE WATER PRIVATE SECTOR CONTRACTS - OBA FOR COVERAGE EXPANSION PROJECT December 17, 2014 Water Global Practice (GWADR) Country Department AFCS2 Africa Region Public Disclosure Authorized Public Disclosure Authorized Public Disclosure Authorized Public Disclosure Authorized Public Disclosure Authorized Public Disclosure Authorized Public Disclosure Authorized Public Disclosure Authorized
Transcript of Document of The World Bank · Document of The World Bank ... Regional Vice President: Makhtar Diop...

Document of
The World Bank
Report No: ICR00003336
IMPLEMENTATION COMPLETION AND RESULTS REPORT
(TF-91213)
ON A
GRANT
IN THE AMOUNT OF US$ 5.0 MILLION
TO
THE REPUBLIC OF MOZAMBIQUE
FOR A
MOZAMBIQUE WATER PRIVATE SECTOR CONTRACTS - OBA FOR
COVERAGE EXPANSION PROJECT
December 17, 2014
Water Global Practice (GWADR)
Country Department AFCS2
Africa Region
Pub
lic D
iscl
osur
e A
utho
rized
Pub
lic D
iscl
osur
e A
utho
rized
Pub
lic D
iscl
osur
e A
utho
rized
Pub
lic D
iscl
osur
e A
utho
rized
Pub
lic D
iscl
osur
e A
utho
rized
Pub
lic D
iscl
osur
e A
utho
rized
Pub
lic D
iscl
osur
e A
utho
rized
Pub
lic D
iscl
osur
e A
utho
rized
CURRENCY EQUIVALENTS
(Exchange Rate Effective as of November 13, 2014)
Currency Unit = New Meticais (Mtn)
US$1.00 = 30.85 Mtn
US$1.00 = SDR 0.68
FISCAL YEAR
July 1 – June 30
ABBREVIATIONS AND ACRONYMS
AdeM Aguas da Regiao de Maputo
AdM Aguas de Mozambique
ACGF Africa Catalytic Growth Fund
AFD Agence Française de Devéloppement
AusAID Australian Agency for International
Development
CRA Conselho Regulatorio de Aguas
DMF Delegated Management Framework
EIB European Investment Bank
EU European Union
FIPAG Fundo de Investimento e Património do
Abastecimento de Água
GPOBA Global Partnership on Output Based Aid
GMWSP Greater Maputo Water Supply Project
ICR Implementation Completion and Results Report
IFC International Finance Corporation
IMVA Independent Monitoring and Verification Agent
ISR Implementation Status Report
MCC Millennium Challenge Corporation
NWDP National Water Development Project
OBA Output Based Aid
PDO Project Development Objectives
TF Trust Fund
WASIS Water Services and Institutional Support Project

Regional Vice President: Makhtar Diop
Snr GP Director Junaid Kamal Ahmad
Country Director: Mark Lundell
Practice Manager: Jonathan S. Kamkwalala
Project Team Leader: Luiz Claudio Martins Tavares
ICR Team Leader: David Malcolm Lord

REPUBLIC OF MOZAMBIQUE
Mozambique Water Private Sector Contracts –
OBA For Coverage Expansion Project (P104945)
CONTENTS
Data Sheet
A. Basic Information
B. Key Dates
C. Ratings Summary
D. Sector and Theme Codes
E. Bank Staff
F. Results Framework Analysis
G. Ratings of Project Performance in ISRs
H. Restructuring
I. Disbursement Graph
1. Project Context, Development Objectives and Design ............................................... 1
2. Key Factors Affecting Implementation and Outcomes .............................................. 5
3. Assessment of Outcomes .......................................................................................... 11
4. Assessment of Risk to Development Outcome ......................................................... 18
5. Assessment of Bank and Borrower Performance ..................................................... 18
6. Lessons Learned ....................................................................................................... 22
7. Comments on Issues Raised by Borrower/Implementing Agencies/Partners .......... 24
Annex 1. Project Costs and Financing .......................................................................... 25
Annex 2. Outputs by Component ................................................................................. 26
Annex 3. Economic and Financial Analysis ................................................................. 29
Annex 4. Bank Lending and Implementation Support/Supervision Processes ............ 33
Annex 5. Beneficiary Survey Results ........................................................................... 34
Annex 6. Summary of Borrower's ICR ......................................................................... 42
Annex 7. List of Supporting Documents ...................................................................... 54


A. Basic Information
Country: Mozambique Project Name:
Mozambique Water
Private Sector
Contracts - OBA for
coverage expansion
Project ID: P104945 L/C/TF Number(s): TF-91213
ICR Date: 12/15/2014 ICR Type: Core ICR
Lending Instrument: SIL Grantee: FIPAG -
Original Total
Commitment: USD 6.00M Disbursed Amount: USD 4.77M
Revised Amount: USD 4.77M
Environmental Category: C
Implementing Agencies:
Aguas da Regiao de Maputo
Cofinanciers and Other External Partners:
B. Key Dates
Process Date Process Original Date Revised / Actual
Date(s)
Concept Review: 01/19/2007 Effectiveness: 07/01/2008
Appraisal: Restructuring(s): 02/12/2012
Approval: 06/19/2007 Mid-term Review:
Closing: 12/31/2011 06/30/2014
C. Ratings Summary
C.1 Performance Rating by ICR
Outcomes: Satisfactory
Risk to Development Outcome: Low or Negligible
Bank Performance: Moderately Satisfactory
Grantee Performance: Satisfactory
C.2 Detailed Ratings of Bank and Borrower Performance (by ICR)
Bank Ratings Borrower Ratings
Quality at Entry: Moderately
Unsatisfactory Government: Satisfactory
Quality of Supervision: Moderately Satisfactory Implementing Satisfactory

Agency/Agencies:
Overall Bank
Performance: Moderately Satisfactory
Overall Borrower
Performance: Satisfactory
C.3 Quality at Entry and Implementation Performance Indicators
Implementation
Performance Indicators
QAG Assessments
(if any) Rating
Potential Problem Project
at any time (Yes/No): No
Quality at Entry
(QEA): None
Problem Project at any
time (Yes/No): Yes
Quality of
Supervision (QSA): None
DO rating before
Closing/Inactive status: Satisfactory
D. Sector and Theme Codes
Original Actual
Sector Code (as % of total Bank financing)
Water supply 100 100
Theme Code (as % of total Bank financing)
Urban services and housing for the poor 100 100
E. Bank Staff
Positions At ICR At Approval
Vice President: Makhtar Diop Obiageli Katryn Ezekwesili
Country Director: Mark R. Lundell Michael Baxter
Practice
Manager/Manager: Jonathan S. Kamkwalala Jaime M. Biderman
Project Team Leader: Luiz Claudio Martins Tavares N. Jane Walker
ICR Team Leader: David Malcolm Lord
ICR Primary Author: Elisabeth Sherwood
F. Results Framework Analysis
Project Development Objectives (from Project Appraisal Document) The objective of the Grant is to increase piped-water access to the poor in the Recipient's
cities of Maputo, Beira, Nampula, Quelimane, and Pemba, by providing Output-Based
Payments to Private Operators.
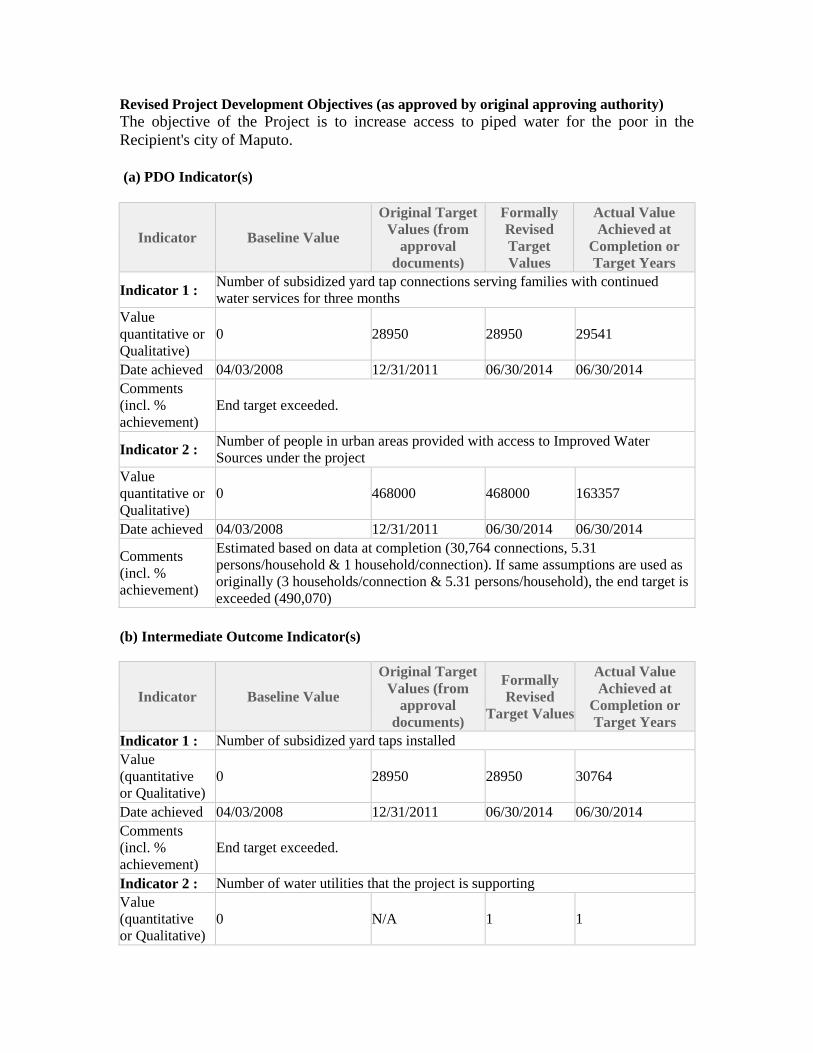
Revised Project Development Objectives (as approved by original approving authority)
The objective of the Project is to increase access to piped water for the poor in the
Recipient's city of Maputo.
(a) PDO Indicator(s)
Indicator Baseline Value
Original Target
Values (from
approval
documents)
Formally
Revised
Target
Values
Actual Value
Achieved at
Completion or
Target Years
Indicator 1 : Number of subsidized yard tap connections serving families with continued
water services for three months
Value
quantitative or
Qualitative)
0 28950 28950 29541
Date achieved 04/03/2008 12/31/2011 06/30/2014 06/30/2014
Comments
(incl. %
achievement)
End target exceeded.
Indicator 2 : Number of people in urban areas provided with access to Improved Water
Sources under the project
Value
quantitative or
Qualitative)
0 468000 468000 163357
Date achieved 04/03/2008 12/31/2011 06/30/2014 06/30/2014
Comments
(incl. %
achievement)
Estimated based on data at completion (30,764 connections, 5.31
persons/household & 1 household/connection). If same assumptions are used as
originally (3 households/connection & 5.31 persons/household), the end target is
exceeded (490,070)
(b) Intermediate Outcome Indicator(s)
Indicator Baseline Value
Original Target
Values (from
approval
documents)
Formally
Revised
Target Values
Actual Value
Achieved at
Completion or
Target Years
Indicator 1 : Number of subsidized yard taps installed
Value
(quantitative
or Qualitative)
0 28950 28950 30764
Date achieved 04/03/2008 12/31/2011 06/30/2014 06/30/2014
Comments
(incl. %
achievement)
End target exceeded.
Indicator 2 : Number of water utilities that the project is supporting
Value
(quantitative
or Qualitative)
0 N/A 1 1

Date achieved 04/03/2008 04/03/2008 06/30/2014 06/30/2014
Comments
(incl. %
achievement)
Target achieved.
G. Ratings of Project Performance in ISRs
No. Date ISR
Archived DO IP
Actual
Disbursements
(USD millions)
1 12/30/2008 Satisfactory Satisfactory 0.00
2 05/28/2009 Satisfactory Satisfactory 0.00
3 11/30/2009 Moderately
Unsatisfactory Satisfactory 0.00
4 06/21/2010 Moderately
Unsatisfactory
Moderately
Unsatisfactory 0.00
5 12/20/2010 Unsatisfactory Unsatisfactory 0.40
6 08/16/2011 Unsatisfactory Moderately Satisfactory 0.40
7 04/14/2012 Satisfactory Moderately Satisfactory 2.00
8 11/12/2012 Satisfactory Moderately Satisfactory 2.00
9 05/10/2013 Satisfactory Moderately Satisfactory 2.00
10 10/07/2013 Satisfactory Moderately Satisfactory 3.56
11 05/07/2014 Satisfactory Moderately Satisfactory 4.50
H. Restructuring (if any)
Restructuring
Date(s)
Board
Approved
PDO Change
ISR Ratings at
Restructuring
Amount
Disbursed at
Restructuring
in USD
millions
Reason for Restructuring &
Key Changes Made DO IP
02/12/2012 Y U MS 0.40 Corrective restructuring
If PDO and/or Key Outcome Targets were formally revised (approved by the original approving
body) enter ratings below:
Outcome Ratings
Against Original PDO/Targets Unsatisfactory
Against Formally Revised PDO/Targets Satisfactory
Overall (weighted) rating Satisfactory

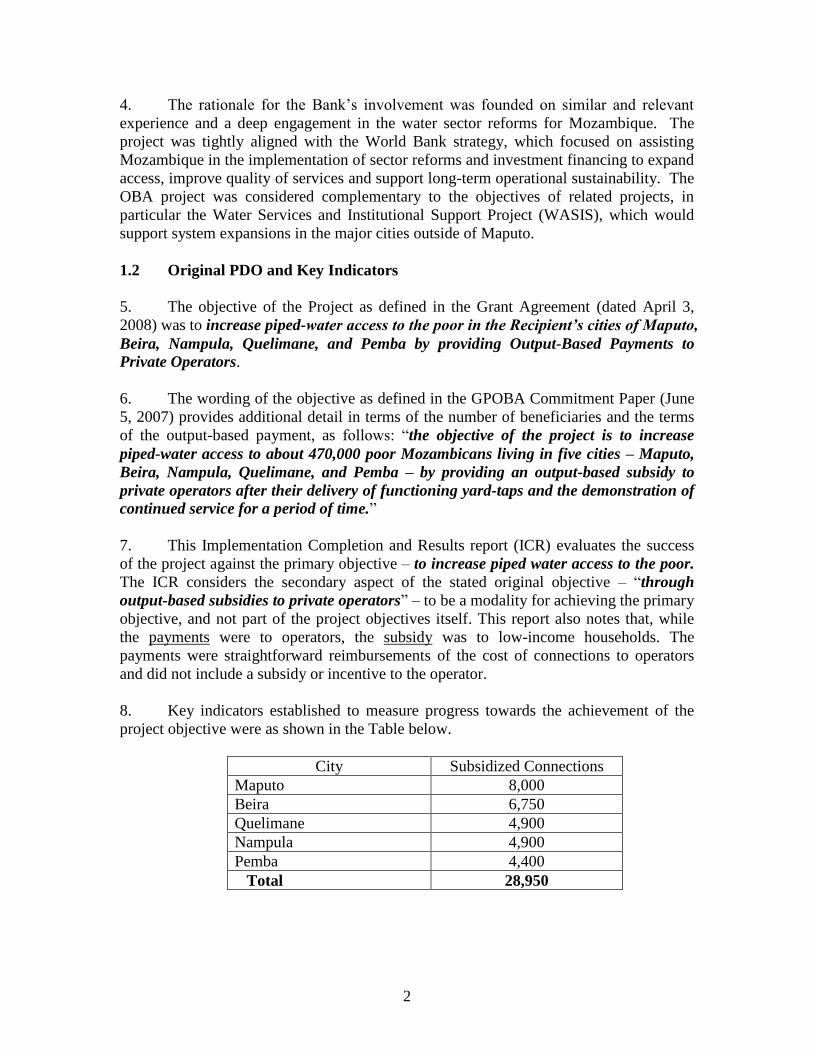
I. Disbursement Profile


1
1. Project Context, Development Objectives, and Design
1.1 Context at Appraisal
1. The Mozambique Water Private-Sector Contracts for Output-based Aid
Expansion Project was prepared in the context of an urban water supply sector that had
seen significant restructuring and rehabilitation following several decades of lack of
investment, due in part to civil war. The World Bank had engaged closely with the
Government of Mozambique beginning in 1998 with the National Water Development
Project (NWDP) I and with its follow-on, the NWDP II. These projects focused
investment in the five major cities of Maputo, Beira, Nampula, Quelimane, and Pemba
and piloted the delegated management framework (DMF) for urban water supply
operations. Under the DMF, a single asset holding company was established – the Fundo
de Investimento e Patrimonio do Abastecimento de Agua (FIPAG) – a private-sector
operator was engaged for the large urban water supply systems, and the independent
regulator was created, the Conselho Regulatorio de Aguas (CRA). At appraisal, access to
piped water service in urban areas was estimated to be approximately 37 percent.
2. Operations of the largest urban water supply system in the country – servicing
Maputo – had been bid out to Aguas de Mozambique (AdM), a private sector operator led
by Aguas de Portugal, in 2000 under a 14-year lease contract. AdM was also the operator
of the other four cities under management contracts expiring in 2007. It was expected
that operations for these cities would continue to be managed by the private sector, under
new lease contracts, which were under procurement at the time of appraisal. This was
expected to result in improved operational efficiencies and leveraging of private sector
investment to expand networks. In addition, the World Bank, jointly with FIPAG, was in
the process of preparing the Water Services and Institutional Support Project (WASIS),
which would support system expansions in the major cities outside of Maputo. WASIS
would leverage investments from other financiers, including the Millennium Challenge
Corporation (MCC), the Africa Catalytic Growth Fund (ACGF), and, later, the Australian
Agency for International Development (AusAID). In Maputo, large investments in
expansion of supply and network were being undertaken by the European Investment
Bank (EIB), the European Union (EU), and Agence Française de Développement (AFD).
3. It was within this context that the GPOBA grant was proposed to provide support
for the “last mile” of network extensions, i.e., subsidies for poor households who would
not otherwise be able to afford the cost of connecting to the network. At the time of
project preparation, households were expected to pay the full cost of connections, which
ranged from an average of US$167 equivalent per connection in Maputo to US$241
equivalent per connection in Beira. While projections showed that water tariffs would
likely cover operating costs in the target cities as long as the number of connected
households increased, tariffs were not structured in such a way to cross-subsidize new
connections. The project was intended to provide output-based payments for connections
supporting densification of the existing network and network expansion.
2
4. The rationale for the Bank’s involvement was founded on similar and relevant
experience and a deep engagement in the water sector reforms for Mozambique. The
project was tightly aligned with the World Bank strategy, which focused on assisting
Mozambique in the implementation of sector reforms and investment financing to expand
access, improve quality of services and support long-term operational sustainability. The
OBA project was considered complementary to the objectives of related projects, in
particular the Water Services and Institutional Support Project (WASIS), which would
support system expansions in the major cities outside of Maputo.
1.2 Original PDO and Key Indicators
5. The objective of the Project as defined in the Grant Agreement (dated April 3,
2008) was to increase piped-water access to the poor in the Recipient’s cities of Maputo,
Beira, Nampula, Quelimane, and Pemba by providing Output-Based Payments to
Private Operators.
6. The wording of the objective as defined in the GPOBA Commitment Paper (June
5, 2007) provides additional detail in terms of the number of beneficiaries and the terms
of the output-based payment, as follows: “the objective of the project is to increase
piped-water access to about 470,000 poor Mozambicans living in five cities – Maputo,
Beira, Nampula, Quelimane, and Pemba – by providing an output-based subsidy to
private operators after their delivery of functioning yard-taps and the demonstration of
continued service for a period of time.”
7. This Implementation Completion and Results report (ICR) evaluates the success
of the project against the primary objective – to increase piped water access to the poor.
The ICR considers the secondary aspect of the stated original objective – “through
output-based subsidies to private operators” – to be a modality for achieving the primary
objective, and not part of the project objectives itself. This report also notes that, while
the payments were to operators, the subsidy was to low-income households. The
payments were straightforward reimbursements of the cost of connections to operators
and did not include a subsidy or incentive to the operator.
8. Key indicators established to measure progress towards the achievement of the
project objective were as shown in the Table below.
City Subsidized Connections
Maputo 8,000
Beira 6,750
Quelimane 4,900
Nampula 4,900
Pemba 4,400
Total 28,950
3
1.3 Revised PDO and Key Indicators
9. The project was formally restructured1 in February, 2012. Restructuring included
a revision of the PDO, as follows: “The objective of the Project is to increase access to
piped water for the poor in the Recipient’s city of Maputo.” (Grant Agreement
Amendment No. 1, dated February 8, 2012; countersigned February 23, 2012.).
Specifically, this change included the removal of the four secondary cities and of the
modality of providing output-based payments to private operators.
10. At restructuring the total number of connections remained the same, but the
allocations for the four cities were transferred for implementation in Maputo. Revised
outcome indicators were therefore changed to reflect the new connection targets for
Maputo: 28,950 connections. In addition, in accordance with World Bank policy, the
number of beneficiaries was introduced as a PDO indicator, calculated according to the
assumptions at project design, i.e., that three households of an average size of 5.6 persons
would use each yardtap. The end-of-project beneficiary target was therefore 468,000
persons.
11. The project restructuring also included an extension of the closing date to June 30,
2014 (30 months) and a cancellation of US$ 1.0 million in grant funds. This was due to a
lower cost of connection in Maputo (US$ 167 per connection) compared to the secondary
cities (US $190 in Quelimane; US$ 238 in Pemba and Nampula; and US$ 241 in Beira),
and therefore fewer funds were required to connect the equivalent number of households.
12. The restructuring was initiated in response to a formal request from the
Government (dated March, 2010), to reallocate US$4.43 million from the secondary
cities to Maputo. The reallocation was proposed after the Government failed to engage
private-sector operators for the secondary cities in 2009. This had implications for the
project implementation, as the Grant Agreement specified that the recipient would
establish and maintain lease contracts with private operators in the target cities, and
therefore funding could not be provided to subsidize household connections as planned.
This was therefore a corrective restructuring, which accounted for challenges faced
during project implementation and enabled project activities to continue through a refined
focus on poor recipients in Maputo.2
1.4 Main Beneficiaries
13. The project was designed to target low-income / poor households. The original
number of project beneficiaries was as follows:
1 Restructuring paper dated January 12, 2012 – approved February 12, 2012. 2 It is not clear why payments for connections in the four secondary cities was not kept in the project
through a change in the terms of the grant agreement to enable payments to be made to FIPAG, given that
FIPAG took over operations of the secondary city systems following the failure of the lease bidding
process.

4
City Individual Beneficiaries
Maputo 143,520
Beira 107,325
Quelimane 68,640
Nampula 74,970
Pemba 74,088
Total 468,543
14. Following project restructuring, the project beneficiaries would be limited to
Maputo:
City Individual Beneficiaries
Maputo 468,000
1.5 Original Components
15. The original project consisted of three components: (i) the provision of payments
based on verified yardtap connections and three months of water service to low-income
households in Maputo; (ii) the provision of payments based on verified yardtap
connections and three months of water service to low-income households in the cities of
Beira, Quelimane, Nampula, and Pemba; and (iii) technical assistance for the verification
of outputs under components 1 and 2. Total project costs were US$ 6 million.3
1.6 Revised Components
16. Under the restructured project there was a single component that incorporated the
provision of payments based on verified yardtap connections and three months of water
service to low-income households in Maputo and the verification of those connections
and water service. Total project costs were US$ 5 million.
1.7 Other significant changes (in design, scope and scale, implementation
arrangements and schedule, and funding allocations):
17. Two changes were made to the operational manual during implementation in
order to improve implementation and the likelihood of the achievement of project
objectives. The Bank approved in early 2010 the extension of the project beyond the
Laulane service area, which had been the geographic focus of the project as originally
designed. Early implementation experience indicated that there were insufficient eligible
households within the service area to meet project objectives. Expansion of the
geographic area to all of Maputo and Matola enabled eligible households throughout the
city to benefit from the connection subsidy.
3 The US$ 6.0 million total project costs do not include an additional $170,000 financed by GPOBA for
direct World Bank supervision costs.

5
18. In early 2013, with 18 months of the implementation period remaining, FIPAG
requested an adjustment to the eligibility criteria for beneficiary households; this was
approved in June, 2013. The original criteria had been a positive list of housing
characteristics – i.e., if a residence displayed a minimum number of criteria (e.g., dirt
floors; no exterior wall on the property; no paint finishes on the walls of the house, etc.) –
which AdeM determined was eliminating households that should otherwise have
benefitted from the program. Eligibility was revised to be a negative list of housing
characteristics, the presence of at least three of which would disqualify a household.
Additional detail regarding the original and revised eligibility criteria are provided in
Annex 2.
2. Key Factors Affecting Implementation and Outcomes
2.1 Project Preparation, Design, and Quality at Entry
19. Project preparation was thorough, and the analysis indicates a high degree of
knowledge regarding water supply operations, costs, investment needs, and customer
behavior and willingness and ability to pay. Project preparation benefitted heavily from
the World Bank long-standing engagement in the sector and strong Government
commitment to the project and water sector reforms.
20. The design approach for subsidizing the cost of new yardtap connections for poor
households was sound and based on research evidence which indicated that customers
were willing and able to pay the monthly water tariffs but that connection costs were far
outside their ability to pay (providing an access barrier). As a result households were
using a combination of water sources – neighbors’ taps, public standposts, and water
from unprotected sources - which increased the amount of time spent for water collection
and increased risks associated with poor water quality. Surveys used for project
preparation showed that, given a choice, households would prefer to be connected to the
formal piped water network.
21. A weakness of the background analysis, however were the estimates related to
availability of treated water to meet demands from the new connections. Information
provided in the Commitment Paper indicated that water production would increase during
the early stages of implementation and furthermore water availability would also increase
as result of programs to reduce unaccounted-for-water. These assumptions however were
not realized and in fact, additional treated water came on-stream much later than
anticipated, and expected reductions in unaccounted-for-water were not achieved. This
had important impacts on implementation in Maputo.
22. In addition, project preparation did not look critically at the assumption that the
water supply systems in the secondary cities would be operated by the private sector,
through contracts that had not yet been established. This may have been the other side of
the coin of the team’s long-standing engagement in the sector – it was too close to the
goals of the delegated management framework and therefore did not see warning signs
that private participation might not work. As noted in the ISRs, the bidding process for

6
private lease contracts coincided with the onset of the global financial crisis, which
resulted in a reduced appetite for risk. In addition, it was likely too early to engage the
private sector at a reasonable price in the secondary cities: conflicts between FIPAG and
the private operator in Maputo were already in evidence, and assets and operations were
still in very poor condition in the secondary cities. The project’s risk framework under-
assessed the risk that private operators would be engaged and did not introduce
appropriate mitigation measures in the design.
23. The original and restructured project also specified that approximately 16 people
would benefit from each residential yardtap, and that therefore 468,000 people would
directly benefit from the project. This figure was derived from a government statistical
construct that, in low-income areas with piped water service, an average of three
households share a single yardtap. This assumption appeared valid at preparation;
however, given the intention of densifying the network, the ratio for sharing was reduced
during project implementation and many households in areas benefitting from subsidized
connections no longer needed to share neighbors’ connections. The final survey at
completion indicates that each yardtap was being used predominantly by a single
household, with some but limited sharing. For this reason, the target value for project
beneficiaries (468,000) was overestimated, and could not be reached through the
installation of 28,950 new yard tap connections, as planned.
24. Project preparation also under-assessed the readiness, capacity, and possibly
willingness of the incumbent operator in Maputo – AdM – to implement the project. As
of December, 2010 (30 months after effectiveness, and with only 12 months prior to
original closing date), AdM had only connected 1,917 households (of the 8,000 original
target) under the project. That said, the relationship between FIPAG and the joint venture
had seriously deteriorated at that point, and discussions were underway for FIPAG to buy
out the majority shareholder. Once AdM reverted to public-sector ownership – fully
operating under commercial principles – management re-engaged strongly in the project
and was able to complete nearly 7,000 qualifying connections in the year 2011. This
demonstration of progress and commitment to the project enabled the restructuring of the
project to move forward.
2.2 Project Implementation
25. As per the project design and procedures outlined in the operations manual, the
operator identified eligible households and provided connections through yardtaps. The
agreed connection costs were reimbursed by the project upon verification by the
Independent Monitoring and Verification Agent (IMVA). While the project exceeded the
final targets for connections, the implementation progress throughout was generally
lagging, and the connection rate varied significantly from month to month; depending
largely on the completion of new networks and the availability of funding for the
purchase of connection materials. During project implementation there were a number of
important factors which affected progress towards the achievement of the development
objectives. Those factors which contributed most significantly to successes or gave rise to
problems are discussed below.

7
26. Failure of the lease process with private sector operators in the secondary cities.
This issue was described above in the context of project preparation. Because project
implementation was structured around private-sector operators in those cities,
implementation could not proceed at all without the conclusion of contracting. This was
addressed through project restructuring, which removed the secondary cities from the
project and transferred connection outputs and objectives to Maputo.
27. Uncertainty regarding restructuring of the project. Implementation momentum
in Maputo built in 2011 was effectively lost due to delays in restructuring of the project,
as the implementing agency could not plan for or make connections after the original
closing date of the project without risking reimbursement. This was not possible until late
February, 2012 (2 months after the original closing date), at which point AdeM was able
to re-start the outreach and connection process. While the Bank team was well aware of
and documented the need for restructuring, the process was intentionally delayed until
implementation progress improved. Connection rates only started to substantially
increase in 2011, and by the close of that year the original targets were achieved, -
enabling the restructuring to proceed. The delayed process resulted in the submission of
a retroactive request for extension of the closing date and restructuring.
28. Water availability in Maputo. There were issues with respect to the completion of
complementary projects in water supply and network expansion, which were necessary
preconditions to water availability for new connections. There were indications up until
2012 that new connections could not be made at the expected rate due to the
unavailability of water. In addition, information provided by the verification agent
indicated that hours per day of water availability was falling in the initial service area –
from 8 hours per day in 2009 to as low as 5.1 hours per day in late 2010. Additional
water supply came on stream only in 2012, when availability increased to 17 hours per
day. This enabled AdeM (under new management) to substantially increase both OBA-
supported and unsubsidized connections.
29. Strict beneficiary targeting criteria. Initial beneficiary targeting included both a
geographic component (the area served by the Laulane distribution area) and a poverty
component, which used housing characteristics as proxies to identify very-low-income
households. The original connection target for Maputo (8,000 connections) could not be
met within the limited Laulane service area, and the Bank approved expansion of the
geographic area to the whole of Maputo and Matola in early 2010. The eligibility criteria
– which had been extensive and very specific and which were judged to exclude
numerous other low-income households – were amended in mid-2013, becoming a
negative list of housing quality criteria that would make a household ineligible for the
subsidy, while still ensuring support to very-low-income residents.
30. Universal lowering of connection fees. In September, 2010, the regulator (CRA)
changed the connection pricing policy by lowering residential connection fees to Mt.
2,000, including an option to pay that amount over a period of 18 months. This
represented a significant discount for new customers, who previously had to pay the total
8
cost of a new connection – Mt. 4,300 – prior to being connected. It should be noted that
the regulatory decision did not establish a way to pay for the un-paid portion of the cost
of connection. The impact of this decision on implementation was mixed. On the one
hand, it had a negative impact on AdeM’s cash flow, which had no source of funding for
the installation of new connections (see below). At the same time, the decision
significantly increased demand for new household connections, enabling AdeM to justify
expansion into new service areas. Where outside funding was available to pay for
network expansion, this likely assisted in the successful implementation of the project as
it brought many additional eligible households within reach of networks.
31. Cash-flow constraints and inability to pre-finance materials. Pre-financing of
materials for yardtap connections became a significant problem during implementation,
as AdeM’s cash flows were insufficient to bridge the up-to-nine-month period between
the purchase of materials and the reimbursement of 70 percent of the subsidy amount
after verification. Reimbursement of the remaining 30 percent of the subsidy amount
required additional time. The problem appears to have become worse after CRA’s
decision to set connection fees at Mt 2,000, with no funding source to cover the
remaining cost. The situation improved when AFD financing was finalized and FIPAG
was able to purchase a large stock of connection materials to jump-start the installation of
new connections across Maputo.4
2.3 Monitoring and Evaluation Design, Implementation, and Utilization
32. M&E Design: The project included a well-designed system for tracking and
recording implementation progress (number of connections), but had limitations with
regard to the measurement of associated outcomes. Baseline indicators were established
by the IMVA as part of the inception report in mid-2009, and the same agent consistently
tracked progress on those indicators as part of the verification exercise, reporting them on
a semi-annual basis to FIPAG. The system allowed monitoring both of outputs and of
core impacts related to water delivery.
33. Annex 6 of the Commitment Paper specified indicators that would be collected by
the IMVA on an annual basis. These were also included in the Operational Manual
prepared for the project and included:
Number of households benefiting from increased access (to piped water);
Average monthly consumption or use per OBA beneficiary at the household level;
Average expenditure on service by OBA beneficiaries as a percentage of total
household expenditure;
Average residential tariff for OBA beneficiaries;
Collection efficiency; and
4 The funds received by GPOBA were effectively recycled into the purchase of materials for other
connections. During the period in question, approximately 100,000 non-OBA financed connections were
undertaken by AdeM AFD funds were provided to FIPAG as a loan, and amounts used for the benefit of
AdeM are repaid by AdeM through its lease payments to FIPAG.

9
Average hours per day of access to service.
34. Expenditure on service and the average residential tariff for OBA beneficiaries
were not tracked through the M&E system, although it should be noted that the second
could be reviewed separately from the tariff bulletins published by CRA, and the first
could be calculated using monthly consumption and tariff data.
35. Monitoring and Evaluation Implementation: The indicators were tracked
consistently on a semi-annual basis by the verification agent. The information collected
provides a useful picture of water supply to low-income recipients of the OBA subsidy
over time in the different project areas. The quality of the data collected appears sound,
and the verification agent reported clearly the source of data and when adjustments were
made in source or methodology.
36. Monitoring and Evaluation Utilization: The focus during project
implementation was on ensuring that project outputs – connections to eligible low-
income households – were made in a timely manner. For that reason and due to on-going
delays, relatively little attention seems to have been paid to other indicators during
implementation. At the outset of the project it was reported that CRA (the regulator)
wished to use lessons from the project to design a connection subsidy program. In fact,
however, the regulator decided to reduce the connection fee prior to there being a critical
mass of experiences or lessons from this project.
37. The project-related data are effectively a subset of data that FIPAG tracks and
will continue to track related to water supply in all service areas, including areas which
are predominantly comprised of low-income households. These indicators are tracked in
order to monitor operator performance and to meet regulatory reporting requirements.
Safeguards and Fiduciary Compliance
38. Environmental and Social Safeguards: No issues arose during project
implementation with respect to environmental or social safeguards or fiduciary
compliance. The project was an EA Category C project, as it involved only installing
simple yard taps fed from water distribution pipes in the roadway adjacent to households.
No land acquisition was required, and the implementing agency’s contracting
arrangements included provisions for the restoration of pre-implementation conditions.
No environmental or safeguards issues were identified during implementation.
39. Procurement: No issues arose during project implementation with respect to
procurement, although difficulties in the selection/procurement of the verification agent
at the start of the project caused minor delays in project implementation. During project
preparation, an up-front procurement capacity assessment was carried out at AdM that
concluded that adequate capacity existed to procure necessary materials. Because of the
output-based nature of the project, the average cost of yardtap connections was confirmed
as part of project preparation, and no further assessments were required during
implementation.

10
40. Financial Management: No issues arose during project implementation with
respect to financial management. It was noted that FIPAG was slow in submitting
withdrawal requests to the Bank, and that therefore project disbursement information
does not reflect actual project implementation. These delays do not seem to have affected
FIPAG’s reimbursement to AdeM of connection costs.
Post-Completion Operations/Next Phase
41. There are no particular issues with respect to post-project operations for this
project. Low-income residential customers whose connections were subsidized through
the OBA project are fully incorporated into the AdeM customer database and are
considered to be the same as any other customer. Data on consumption, billing, and
collection is maintained within AdeM’s commercial databases, and customer follow-up
(delivery of bills, etc.) is managed at the service district level.
42. FIPAG and AdeM consider the project to have been a major success, having
contributed approximately 30,000 connections to low-income customers in Maputo
during a period where net connections increased by approximately 75,000.5 Many of
those customers would not have been able to have formal yardtap connections without
the program. FIPAG is preparing a follow-on OBA operation that would incorporate
lessons learned from this operation, including providing somewhat smaller subsidies for
connections for low-income households which would then be consistent with the pricing
structure established by CRA in 2010. Additional analysis will need to be done, in
particular, to assess the effectiveness and impacts of the 2010 pricing structure on the
operators. Depending on the timing of such an application, it may be useful to undertake
a follow-up analysis of consumption and payment information on customers of the first
program. In addition, it would be important to consider an efficient mechanism for
program outreach and beneficiary screening while avoiding the risk of disincentivizing
non-poor households from applying for connections.
3. Assessment of Outcomes
3.1 Relevance of Objectives, Design, and Implementation
Overall Relevance Rating: Substantial
43. Relevance of Original Objective: The original objective was consistent with the
development priorities and circumstances at the time of project preparation; the key
objective – increasing piped-water access for the poor – remains highly relevant at this
time. The current Country Partnership Strategy (CPS; 2012 – 2015) recognizes that water
service remains a major challenge in the country, and that – despite significant
5 AdeM made more than 100,000 new, non-OBA connections during the project period, however, it also
undertook a review of existing accounts, cancelling non-operational or non-payment accounts. The net
increase in non-OBA customers was approximately 75,000.

11
investments and expansion – service provision has not kept pace with rapid urbanization.
The original approach of providing services through private sector operators, was fair at
the time of project preparation, given progress in the establishment of the “delegated
management framework“ and related policies pursued by the government. However, it is
considered unnecessary to have specifically restricted the modality of OBA payments to
private operators, in the original PDO statement and Grant Agreement.
44. Relevance of Restructured Objective: The restructured objective was in line
with development priorities and appropriate for the circumstances at the time of project
restructuring and, as with the original objective, remains highly relevant at this time.
Expansion and improvement of urban water supply remains a key objective of the
Government and of the Bank – in particular in Maputo, for which the World Bank
approved in 2013 the US$ 173 million equivalent Greater Maputo Water Supply Project
(GMWSP), which will increase the production capacity of treated water by 25 percent, or
60,000 m3 per day. At current per-capita consumption and water loss rates, this is likely
to serve approximately an additional 318,000 residents.
45. The Government and the Bank are also preparing WASIS II, for further
investment in water system expansion in targeted secondary cities and to enable
continued support to the Government’s evolving institutional reforms. It is the intention
of the Government to include under WASIS II a component for connection subsidies to
low-income families. Currently, the Government and FIPAG still intend for the private
sector to manage water supply operations, and have engaged IFC to analyze potential
structures and to act as a transaction advisor.
Relevance of Design/Implementation
46. Relevance of Original Design: The project was designed to address the problem
of the “last mile” in piped water provision; i.e., how to support yardtap connections to
households who, while likely able to afford the cost of water consumption, are not able to
afford the cost of the installation of the yardtap itself, which ranged from US$167 to
US$241 per connection. The concept of subsidization of yardtap connections for low-
income households, while not pursued previously in Mozambique, was established
elsewhere. Final survey results carried out at completion indicate that ability to pay
connections fees is limited, and despite reduced connection fees and the introduction of
payment plans, it remains a barrier to access for many low-income families.
47. However, the modality of delivery in the original design – as part of lease
contracts with private-sector operators – was precipitate: private-sector appetite for
operations of water supply systems in secondary cities was overestimated. The
assumption that the water systems would be leased by the private sector was
inappropriately built into the original objective statement and design of the project,
considering that there were no clear mechanisms in the project to support that outcome or
to incentivize private sector operators.

12
48. Relevance of Restructured Design: Project restructuring in 2012 retained all
aspects of the original design and implementation arrangements, with the exception that
yardtap connections would be made in Maputo. The restructured design was highly
relevant to the development needs and priorities at the time, with major network
extensions being undertaken, as well as investments in the rehabilitation of water
treatment plants, which enabled additional treated water to be delivered to previously
unserved neighborhoods. In addition, the Maputo operator had been bought out by
FIPAG (the asset holder) one year before; while operating under commercial principles,
the new management’s goals with respect to the expansion of service to low-income
areas were fully aligned with the project. The subsidization of yardtap installation costs to
households remained highly relevant. However, there were significant challenges with
respect to implementation of the additional proposed 21,000 connections. These included,
in particular, the more difficult identification of eligible households in newly networked
areas.6 Nevertheless, the output connection target was reached, benefitting some of the
poorest segments of the population of Maputo.
3.2 Achievement of the Project Development Objectives
Original PDO Efficacy Rating: Low
49. As defined in the original project description, the project’s development
objectives were straightforward and tightly linked to the project outputs – i.e., the number
of output-based subsidies paid upon the installation of yardtaps and subsequent delivery
of water for three months. The following table summarizes the achievement of that
objective, broken down by target city and in aggregate, over the original 42-month
implementation period (up to the original closing date of December 31, 2011):
City
Objective:
Number of
yardtaps
Outcome/Output:
Number of
subsidized yardtaps
% achieved
Maputo 8,000 8,610 107%
Beira 6,750 0 0%
Quelimane 4,900 0 0%
Nampula 4,900 0 0%
Pemba 4,400 0 0%
Total 28,950 8,610 30%
50. The target values were exceeded for Maputo, but connections were not enabled in
the other four cities due to failure of the selection process for private operators. The
overall achievement of the original PDO is therefore assessed as low.
6 The initial 8,000 connections had been made in existing service areas, and therefore potentially
eligible households were more readily identified (i.e., they did not have connections even though their
neighbors did, and were therefore likely to be poor). In newly serviced / expansion areas, no households
had connections, and therefore very different outreach efforts had to be developed to identify potentially
eligible households.

13
Restructured PDO Efficacy Rating: Substantial
51. The restructured project was highly successful in increasing access to piped water
for the poor in Maputo. The project exceeded the restructured primary PDO indicator
target of 28,950 yardtaps providing at least 3 months of water service in the city of
Maputo. At completion a total of 30,764 yard tap connections had been made and verified
of which 29,541 connections were verified as receiving three months of water service.
52. A broader analysis of the achievement of development objectives also provides
very positive findings with respect to the targeting of beneficiaries and the actual and
perceived benefits of the project. Information provided by the verification agent on a
quarterly and semi-annual basis and as part of an end-of-project survey (see Annex 5)
documented the following additional information:
The project was highly successful in targeting very poor households who would
not otherwise have been able to connect to the formal water system. Eligibility
criteria heavily weighted toward very poor households ensured that connection
subsidies were correctly provided to households that could not otherwise afford to
connect; post-project evaluation results indicate that OBA beneficiaries continue
to fall in the lowest deciles of income distribution. In addition, results of the
survey show that improving access to the formal water supply system has not
resulted in displacement of low-income households; an estimated 98 percent of
beneficiaries remain in the homes that received the yardtap connections.
Water consumption among project beneficiaries is 25 percent higher than pre-
project estimates and 33 percent higher than non-connected low-income
households. In addition, water quality within the formal system has been
consistently acceptable (no water has failed fecal coliform tests), and therefore
beneficiaries are less likely to be at risk from contamination, compared to non-
connected households.
A significant impact/outcome from the project has been household time savings.
Various surveys indicate that, for households without a yardtap, between 55 and
106 minutes per day is required to fetch water. For beneficiary households, the
time spent fetching water was on average only 17 minutes per day. Beneficiary
households themselves estimated that, prior to obtaining a yardtap, they spent an
average of 58 minutes per day fetching water. This indicates a time savings of at
least 40 minutes per day, on average, per household.
Related to the above-noted household time savings, the household survey
indicated that those time savings accrued overwhelmingly to women and girls.
Households reported that approximately 65 percent of time savings benefitted
women, while an additional 20 percent benefited girls. Responses regarding the
use of time savings indicated that 47 percent of time savings was used for
studying, work or income generation, and child care.
Households report that they are satisfied with the water services. Based on the
findings from the post-project household survey, 93 percent of respondents

14
reported that they were satisfied with the water quality, while 76 percent are
satisfied with the service received (the primary complaint being the hours of water
availability).
53. Despite exceeding the connection targets and achieving clear and positive results,
as described above, the project did not reach the target value for the second PDO
indicator introduced at restructuring – i.e. a total of 468,000 people to be provided with
access to improved water sources under the project. This was not due to a failure of
project implementation, but rather was the result of the assumptions used to estimate the
target value. More specifically, the calculation of beneficiaries is a consequence of the
number of connections and the target value of 468,000 people evolved from assumptions
at project preparation which did not materialize. The key issue is the sharing rate,
derived from a government statistical construct used to estimate beneficiaries, which
assumes an average of three households accessing water from each yardtap connection in
low-income areas. Available data from the sample survey of OBA connections at closure
is not definitive, but indicates that, whilst sharing of yard tap connections does still occur,
it is of a smaller and limited scale. Therefore, in the absence of conclusive data on the
level of sharing, and using the best available information at completion, the ICR has
conservatively estimated the number of beneficiaries to be 163,357, based on 30,764
yardtaps installed, with average household size of 5.31, and one household per
connection.7
54. The assumption regarding the degree of sharing among beneficiary households –
which was unfortunately not adjusted in the Bank’s monitoring system – is the only
reason for a downgraded restructured PDO efficacy rating to Substantial (rather than
High). However, as this issue did not materially affect implementation of the project, and
the development objective of increasing access to piped water for the poor was achieved
through exceeding the design target number of household connections, it is considered a
minor shortcoming only.
55. This review also looked at connection patterns in non-program cities to see if any
comparisons could be made with program implementation and results in Maputo. The
fact that secondary cities were removed from the project as part of restructuring could
provide a useful comparison with the OBA project results. The following table
summarizes (i) GPOBA-subsidized connections in Maputo; (ii) new non-GPOBA
connections in Maputo; and (iii) new connections in the secondary cities over the project
period.
7 IMVA Semi-Annual Verification Report 10, for period January 2014 – June 2014.

15
New connections in selected cities, 2009 - 2014
2009 2010 2011 2012 2013 2014 Total
Maputo GPOBA 193 1,724 6,693 6,917 9,474 5,764 30,765
Maputo non-GPOBA 10,548 8,793 29,222 33,111 11,943 6,920 100,537
Beira 6,100 6,862 11,598 5,477 5,268 3,959 39,264
Pemba 2,556 3,086 2,212 1,528 1,414 1,099 11,895
Quelimane 2,885 2,588 3,084 928 1,470 1,240 12,195
Nampula 2,095 4,970 5,890 2,472 2,622 1,380 19,429
New connections in selected cities, 2009 – 2014
as a percentage of 2008 total connections
Total new connections % increase over 2008
connections
Maputo GPOBA 30,765 28%
Maputo non-GPOBA 100,537 93%
Beira 39,264 193%
Pemba 11,895 176%
Quelimane 12,195 171%
Nampula 19,429 146%
Total in selected cities 214,085 137%
56. On the surface, the above data could be interpreted that cities without the OBA
program experienced higher connection rates than Maputo. However, a number of factors
make it impossible to draw clear lessons or conclusions. These include:
No information is available regarding the income profile of non-OBA recipients.
While the rate of new connections was far higher in the secondary cities, the
inclusion of low-income households is likely to be significantly lower.
Existing coverage rates were extremely low in the secondary cities as of the
beginning of the review period; in addition, investments in water production and
networks had been in process for several years, with water and networks
becoming available during the project period.
Effective demand for new connections at all income levels was drastically
increased following the decision of the regulator in September, 2010 to reduce
fees charged to households for new connections.
Significant outside funding from international donors and financiers (including
under WASIS) was available for the purchase of connection materials in the
secondary cities, removing the problem of cash constraints for the purchase of
materials.

16
3.3 Efficiency
Project Efficiency Rating: Substantial
57. The efficiency of the project is rated substantial, reflecting the achievement of
significant results with reasonable costs. Delays in project implementation did not affect
the ability of the operator to achieve / exceed the target connection values within the
funds allocated for the project. The costs for independent monitoring and verification
agent (IMVA) remained within the allocation despite the time extensions, due to cost
savings associated with cancellation of their services for the four secondary cities. The
total costs for IMVA services for this project were very reasonable at around 4%8 of the
restructured Grant amount, which also included the beneficiary survey, carried out as
additional scope of works at completion.
58. The ex-post economic cost-benefit analysis – undertaken as part of the ICR –
shows positive results supporting the substantial efficiency rating. Costs included the full
cost of new connections supported by the project (i.e., portions paid by the recipient
household and the project) as well as pro-rata costs of tertiary networks related to each
connection. It was estimated that approximately one-third of project-supported
connections were infill – i.e., areas whose tertiary network was already built out – and
therefore tertiary network costs were not included for those connections. Benefits were
limited to the time savings of beneficiary households, who no longer have to access water
from public standposts, wells, or neighbors’ taps, and the value of additional water
consumed compared to the pre-project situation. Because indications of health
improvements related to the provision of yardtaps were hard to identify, and because it
was not possible to prove causality, health benefits were not estimated. A 14-year period
of benefits was projected.9
59. The ex-post estimate of the economic rate of return for the project is 31 percent.
At a 10 percent discount rate, the project’s net present value is estimated at US$ 5.9
million.10 Additional information regarding the economic analysis is provided in Annex 3.
60. By definition, the amount of GPOBA subsidy was US$150 per connection. Given
an assumed 5.31 persons per household, the per capita subsidy was US$28, which falls
below GPOBA’s required threshold and is considered good value for money.
8 A total US$212,096 was disbursed from the Grant under consultancy services category to cover IMVA
costs. 9 The original economic analysis projected benefits out for a 10-year period, with implementation
over a 2 ½-year period. However, because actual project implementation took significantly longer – with
half of the connections made in years 5 and 6 – the post-project economic analysis was extended to 14
years in order to establish an equivalent period for the evaluation of benefits. 10 The original economic analysis used a 12 percent discount rate, however, at this time a 10 percent
discount rate appears to be standard. At a 12 percent discount rate, the ex-post net present value is
estimated at US$ 4.6 million.
17
3.4 Justification of Overall Outcome Rating (combining relevance, achievement
of PDOs, and efficiency)
Overall Outcome Rating: Satisfactory
61. The overall outcome rating for the project is Satisfactory. This rating reflects
substantial, efficient achievement of key development objectives, particularly after
project restructuring.
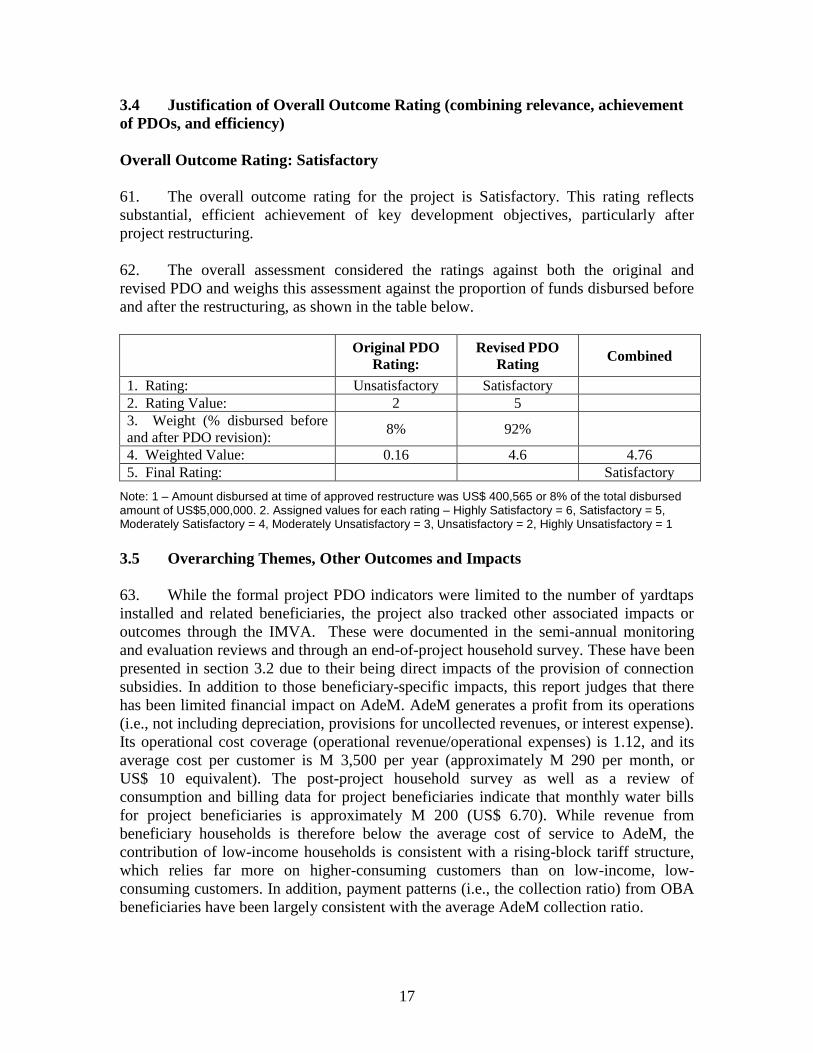
62. The overall assessment considered the ratings against both the original and
revised PDO and weighs this assessment against the proportion of funds disbursed before
and after the restructuring, as shown in the table below.
Original PDO
Rating:
Revised PDO
Rating Combined
1. Rating: Unsatisfactory Satisfactory
2. Rating Value: 2 5
3. Weight (% disbursed before
and after PDO revision): 8% 92%
4. Weighted Value: 0.16 4.6 4.76
5. Final Rating: Satisfactory
Note: 1 – Amount disbursed at time of approved restructure was US$ 400,565 or 8% of the total disbursed amount of US$5,000,000. 2. Assigned values for each rating – Highly Satisfactory = 6, Satisfactory = 5, Moderately Satisfactory = 4, Moderately Unsatisfactory = 3, Unsatisfactory = 2, Highly Unsatisfactory = 1
3.5 Overarching Themes, Other Outcomes and Impacts
63. While the formal project PDO indicators were limited to the number of yardtaps
installed and related beneficiaries, the project also tracked other associated impacts or
outcomes through the IMVA. These were documented in the semi-annual monitoring
and evaluation reviews and through an end-of-project household survey. These have been
presented in section 3.2 due to their being direct impacts of the provision of connection
subsidies. In addition to those beneficiary-specific impacts, this report judges that there
has been limited financial impact on AdeM. AdeM generates a profit from its operations
(i.e., not including depreciation, provisions for uncollected revenues, or interest expense).
Its operational cost coverage (operational revenue/operational expenses) is 1.12, and its
average cost per customer is M 3,500 per year (approximately M 290 per month, or
US$ 10 equivalent). The post-project household survey as well as a review of
consumption and billing data for project beneficiaries indicate that monthly water bills
for project beneficiaries is approximately M 200 (US$ 6.70). While revenue from
beneficiary households is therefore below the average cost of service to AdeM, the
contribution of low-income households is consistent with a rising-block tariff structure,
which relies far more on higher-consuming customers than on low-income, low-
consuming customers. In addition, payment patterns (i.e., the collection ratio) from OBA
beneficiaries have been largely consistent with the average AdeM collection ratio.

18
64. From the analysis of collected data, the results are inconclusive with respect to the
project’s impacts on (i) health outcomes and (ii) reduced expenditures on water. While
95 percent of respondents to the post-project household survey reported health
improvements as a result of the yardtap connection, no specific health information was
available to attribute impacts. In addition, when comparing beneficiary households, non-
beneficiary households with yard taps, and low-income households without a yardtap,
expenditures on water are roughly the same on an absolute basis. However, beneficiary
and non-beneficiary households with yardtaps consume between 25 and 33 percent more
water than low-income households without yardtaps, indicating considerable consumer
surplus accruing to households with yardtaps.
4. Assessment of Risk to Development Outcome
65. The risk to development outcomes is low. This assessment is based on the
incorporation of project beneficiaries into the general operations of the water utility and
the positive and improving performance of the water utility in the provision of water
services to the residents of Maputo and surrounding areas. In terms of the specific project
development outcomes (provision of yardtaps to low-income households), the post-
project review indicated that only a small percentage of beneficiary households – less
than three percent – have been disconnected from the system due to non-payment of
water bills. AdeM does struggle with key aspects of its operations – in particular,
unaccounted for water (UFW), which remains high, and operational cost recovery, which,
while positive, remains low. That said, service indicators – hours of water availability,
total customers, total water production and sales – have all notably improved over the last
decade due to a combination of management commitments, regulatory oversight, and
international financing for major system rehabilitation and investment. There is a robust
interaction between AdeM (the operator), FIPAG (the asset holder), CRA (the regulator),
and international financiers that supports adequate revenues for ongoing operations, the
maintenance of water quality and service standards, and planning and implementation of
necessary system rehabilitation and investment.
5. Assessment of Bank and Borrower Performance
5.1 Bank Performance
(a) Bank Performance in Ensuring Quality at Entry:
Rating: Moderately Unsatisfactory
66. Preparation of the project was noticeably thorough with respect to the costs and
benefits of the proposed project and the modalities for implementation. However, there
were areas where the Bank misjudged the risks to the project. As noted previously,
implementation difficulties were faced due to the assumption that private-sector operators
would be operating the secondary city water systems, and due to the assumption that
AdM (and later AdeM), in Maputo, would be able to rapidly identify eligible
beneficiaries in service areas with sufficient networks and water availability. The Bank’s

19
assessment of water availability appears to have been optimistic, based in part on
reductions in unaccounted-for-water that have still not occurred. Project design was
inadequate in that the achievement of the original objectives, as defined, was dependent
on actions over which the project had no influence (i.e., contracting a private operator).
67. This ICR also notes that monitoring and evaluation arrangements were not fully
developed during project preparation, and there was some discrepancy within the project
Commitment Paper with respect to the ultimate outcomes expected to be achieved
(beyond the formal objectives of yardtaps provided to low-income residents) and that
would be tracked by the project. That said, a monitoring and evaluation plan was
established as part of the inception report of the verification agent in mid-2009, and data
tracked were largely appropriate and useful.
(b) Quality of Supervision:
Rating: Moderately Satisfactory
68. The Bank team reviewed project implementation progress on a regular basis,
consistently fielding semi-annual supervision missions, which were part of
comprehensive sector wide supervision and preparation missions, which strengthened
integration and complementarity of the project towards sector development objectives.
The team leader and key members were consistent throughout the project period,
facilitating considerable institutional memory and proactively engaging in problem-
solving to facilitate progress.
69. The Bank team identified early on the problems related to the leasing of water
operations in the secondary cities and that the OBA subsidies could not be disbursed in
accordance with the grant agreement. Thereafter, a project restructuring was initiated in
order to enable the subsidies to be applied to low-income connections in Maputo.
Processing of the restructuring was intentionally delayed, as per guidance of Bank
management, until the original Maputo-specific objectives were achieved.
70. In addition, the Bank supervision team closely tracked implementation progress in
Maputo, focusing on AdeM’s proposals for reaching eligible households first within
existing networks and then in areas that would require new network extensions. The
implementing agency believes that this intense focus on outputs and on the grant
financing pushed them to make connections and extend to areas that they probably would
not have prioritized if not for the OBA program. The support from the Bank helped them
to meet internal and government service targets. Finally, the Bank responded to client
requests to make adjustments in implementation guidelines in order to reach intended
beneficiaries. These included the expansion of geographic areas eligible for connection
subsidies, and re-definition of household eligibility criteria, changing from a list of
required characteristics of house quality (i.e., indicators of poverty) as a proxy for income,
which AdeM believed was disqualifying many low-income residents who should
otherwise qualify, to a negative list of characteristics associated with higher income
households, the presence of three or more would make a household ineligible.

20
71. The Bank’s positive performance notwithstanding, this review notes areas where
more careful attention could have been paid. First, while the original project design target
of 8,000 yardtap connections for low-income residents in Maputo was clearly feasible
within the time frame, the restructured target of an additional 21,000+ yardtap
connections for Maputo was ambitious. AdeM struggled financially and in terms of
internal capacity to put in place the necessary infrastructure – physical and human
resources – to identify and connect the substantial increase of eligible beneficiaries.11 In
addition, at project restructuring the Bank’s internal M&E system required the
introduction of the number of individual beneficiaries as a PDO core indicator. As
discussed earlier, the 3:1 sharing ratio which was assumed to calculate the end target
value was not realized. M&E results during implementation had indicated that yardtap
sharing was declining among project beneficiaries (and the post-project household survey
and review of billing data confirm this), yet the 3:1 sharing assumption and thus end
target values were not adjusted in the Bank’s M&E framework, which unfortunately
resulted in a downgrading of the restructured efficacy rating (Substantial rather than
High) and is considered a moderate shortcoming contributing to a downgraded rating of
Bank supervision performance (Moderately Satisfactory rather than Satisfactory).
(c) Justification of Rating for Overall Bank Performance:
Rating: Moderately Satisfactory
72. The overall assessment of the Bank’s performance has been rated Moderately
Satisfactory. This reflects the Moderately Unsatisfactory Quality at Entry rating and the
Moderately Satisfactory Supervision rating, taking into consideration the Moderately
Satisfactory Overall Outcome rating.
5.2 Borrower Performance
(a) Government Performance:
Rating: Satisfactory
73. Government involvement in the project was limited, both by design and due to the
output-based nature of the project. Government support for the sector has been
longstanding, provided in the form of support for the structure and framework for the
sector, including its relative independence from political pressure. Government fully
supported the proposed project, including the leasing of secondary cities’ water systems.
11 The issue is not the lack of low-income residents in Maputo – there are many. However, it proved a
significant challenge to identify low-income residents (i) in areas served by AdeM; (ii) meeting the
eligibility criteria; (iii) still able to make the required initial deposits to connect to the system; and (iv) in a
manner that did not discourage households who did not meet the OBA criteria from connecting to the
system.

21
Government intervention was not required or requested at any point of time during the
project.
(b) Implementing Agency Performance
Rating: Satisfactory
74. As the original project was unimplemented in the secondary cities (i.e., there was
no implementing agency in those cities), the assessment of borrower performance is
based on implementation experience in the sole target city of the restructured project –
Maputo. Implementation was undertaken by the leaseholder for the Maputo water supply:
first Aguas de Mozambique (AdM), and, following the buyout of the shares of Aguas de
Portugal by FIPAG, by the renamed company, Aguas da Regiao de Maputo (AdeM).
75. As the implementing agency had very little experience connecting new customers
outside of the normal connection framework (e.g., household applies for a connection and
makes a substantial deposit on the full cost of connection, making it highly unlikely for
low-income households to apply), there was a steep learning curve in implementing the
project. Project implementation was initially very slow. This was in part due to the time it
took to develope internal procedures for identifying potential beneficiaries, assisting
households in the application process, and ensuring that yardtaps remained eligible
during the full verification process. However, the Bank supervision team also reports that
the private-sector operator was openly unwilling to make connections to low-income
customers despite the project. Only once it was clear that the private operator would be
bought out by FIPAG and removed from management did implementation begin to
progress.
76. The performance of the implementing agency (by that time under public sector
ownership) was exemplary during post-restructuring implementation, when nearly 22,000
low-income connections were completed in a period of two and a half years, or
approximately 4,400 connections every six months. AdeM faced serious constraints
regarding the capacity of potential beneficiaries (illiteracy, inability to amass the
approximately US$ 17 deposit12), low availability of water due to slower-than-expected
waterworks rehabilitation and programs to reduce unaccounted-for-water, and lack of
networks in areas with a higher concentration of potentially eligible households. AdeM
reports that in order to meet the implementation targets, among other measures they (i)
devised payment plans for households unable to afford the initial connection deposit; (ii)
assisted potential beneficiaries in the application process; and (iii) revised network
extension plans in order to access neighborhoods with low-income populations. The
borrower stated that their commitment to full implementation was due in part to the
12 At the time of project preparation, the total connection cost to households in Maputo was US$ 167
equivalent, consisting of US$ 150 in direct connection costs (material and labor) and a US$ 17 deposit,
calculated based on three-months of low-volume usage, which in effect acted as a security deposit against
non-payment of water bills. Under the OBA project, the project effectively paid for materials and labor,
while the household paid for the connection deposit.

22
desire not to “lose” potential grant funding, and in part due to the project’s implicit
support for government targets for extensions of water service.
77. It should be noted that AdeM’s commitment to project implementation came
despite serious financial disincentives resulting from: (i) an inability to finance the cost of
new connections from internal funds; and (ii) considerable unreimbursed staff and
materials costs in project implementation (e.g., for outreach, assistance, protective
materials against equipment theft in low-income areas, etc.). AdeM reports that it often
had to borrow at local, commercial rates to pre-finance equipment for periods between
six and nine months – at a 16 percent interest rate, this could be more than US$ 15
equivalent per connection. While AdeM did not monitor the additional costs associated
with project implementation and this review was not able to confirm such costs, these are
costs that are neither included in AdeM’s tariff, nor reimbursed in other ways.
(c) Justification of Rating for Overall Borrower Performance
Rating: Satisfactory
78. The overall performance of the Government and the Implementing Agency has
been rated as Satisfactory, taking into consideration the implementation strengths
discussed above, achievement of results and compliance with agreements, safeguard and
fiduciary controls, towards the achievement of the development outcomes.
6. Lessons Learned
79. The following lessons learned have been distilled from the project’s
implementation experience and challenges:
80. With respect to the output-based nature of the project:
81. Output-based payments do not inherently provide incentives for change in
behavior or investment. Whilst, the primary objective of this project was to increase
piped water access to the poor, implemented through the operator, OBA projects are
often intended to provide incentives to the private sector to undertake investments that
they might otherwise not engage in. This project subsidized low-income households to
connect to the water system, but was not designed to incentivize the operator to pursue
those connections. Under the arrangements for new connections at the time of project
design and initial implementation, an OBA payment was at a disadvantage compared to
“regular” connections: For a regular connection, the operator would be paid up-front for
the cost of the connection (Mt 4,300, or approximately US$ 167 at the time of design),
and there would be no risk to the operator. For an OBA connection, the operator had to
pre-finance the cost of the connection and face the risk that, after as much as a 6-month
or 9-month delay, he might not be fully reimbursed for its cost (or even reimbursed at all).
Furthermore, from the operator’s perspective, additional efforts are required to reach low-
income households, with limited benefits due to low consumption rates and potential
collection issues.

23
82. Only once the policy for payment arrangements for normal connections was
changed was there a real financial incentive for the operator to increase his efforts to
connect low-income households relative to non-beneficiary households. Under the new
policy, households only had to pay Mt 2,000 (US$ 78 equivalent) to receive a new
connection (and that could even be paid over an 18-month period), even though the cost
of providing that connection was still Mt 4,300. As no arrangements had been made to
cover the remaining cost, at that point the OBA payment became a more attractive
proposition to the operator.
83. Output-based programs need to assess ability of the recipient to pre-finance
investments and consider pre-financing support mechanisms. In the case of this
operation, the ability of the operator to pre-finance investments was not adequately
assessed. For the secondary cities, it was assumed that the lease bids received from
private operators would include pre-financing in the overall cost of their bids. Had the
lease arrangements moved forward, the cost of pre-financing would in theory have been
embedded in the overall cost structure. In Maputo, however, the existing operator was
under severe cash constraints for a variety of reasons, and struggled to pay for the initial
investments in connections. After the change in government policy regarding the cost of
connections to consumers, the cash constraints became worse – requests and expectations
for household connections increased considerably, while available cash to pay for those
connections reduced. Investment pre-financing can be a significant implementation
challenge, which can be addressed through a financial assessment during preparation and
the incorporation of support mechanism, where appropriate (e.g pre-financing advances
or ‘line of credit’ utilized under the Bank’s PforR instrument).
84. Verification procedures should focus on the ultimate objectives of the operation.
The operation included two stages of verification: the first was intended to verify the
existence of the connection, the availability of water, and the eligibility of the household
(i.e., that the household was very low income); the second was intended to verify the
ongoing provision of water and the billing of consumption to the household for a
minimum of three months. In practice, this resulted in a verification exercise every three
months. If the purpose of the second verification was to prove the sustainability of the
investment, it is unclear that three months of water supply and billing is adequate. A
single verification step, established at a reasonable time period after installation of the tap,
may have been more appropriate.
85. There needs to be a very strong understanding of the characteristics of the
intended beneficiaries. In the case of this operation, targeted beneficiaries were notably
poorer than the operator’s regular customers, but it was assumed that there would be no
appreciable differences in terms of providing them with yardtap connections. In fact, the
target beneficiaries generally faced significant challenges in amassing even the reduced
US$17 application/connection fee and meeting the bureaucratic requirements of applying
for a connection. In order to implement the program – in particular, at the scale required
after the project restructuring – the operator had to develop capacity to support
households with low levels of literacy and record keeping, in effect developing skills
24
normally seen in a social service or non-profit agency. The operator also developed
programs for the gradual payment of the US$17 application fee. It took a significant
amount of time for the operator to work through the challenges of the target beneficiaries,
which slowed implementation.
86. All the costs of program implementation accruing to the operator should be
factored into the OBA payments. The operator believes that it incurred significant costs
related to the implementation of the program that were not factored into the OBA
payments. These included staffing and time costs related to program outreach, financing
costs related to costs that intended beneficiaries were not able to pay, and pre-financing
costs for materials. While it could be considered that the OBA payments “leveraged”
these investments by the operator, in fact the operator could not afford to make the
investments, and there are no long-term returns on the investments given the low rates of
water consumption and collections by the beneficiaries.
87. Lessons learned that are applicable to any type of investment operation include:
88. There needs to be a full appraisal at the time of project restructuring. The
operator faced significant challenges in the full implementation of the project (i.e.,
meeting the target of 28,950 yardtap connections for very low-income households) in the
allocated time. One of the key reasons for this is likely that, while there were many very
low-income households within the formal Greater Maputo and Matola service areas, there
was not, initially, sufficient water to service them, and they were not within easy access
of existing networks. The operator has reported that in order to meet the objectives of the
OBA project, it re-prioritized network expansion plans so that it would be able to reach
more very low-income households. This had knock-on effects, though, due to the cost of
the new networks and the cash-flow impacts of the resulting demand for non-OBA
financed connections. A full appraisal at restructuring may have also shown that yardtap
sharing was not taking place at the assumed 3:1 ratio used to calculate the number of
beneficiaries. This also affected the economic returns to the project.
89. Implementation arrangements need to be realistic; assumptions regarding
implementation need to be linked to the relevant project, rather than to goals related to
other projects or programs. The failure to implement the program as initially designed
was due to the fact that implementation in the four secondary cities was dependent upon
the success in the leasing of water operations to private sector operators. These
transactions were not well advanced when the OBA project was appraised, and ultimately
failed due to a combination of factors. While it is unlikely that any arrangements could
have ensured success of the leasing process, that process was entirely independent of the
OBA project, and vice versa.
7. Comments on Issues Raised by Borrower/Implementing Agencies/Partners
(a) Grantee/Implementing agencies
(b) Cofinanciers/Donors

25
Annex 1. Project Costs and Financing
(a) Project Cost by Component (in USD Million equivalent)
Components
Appraisal
Estimate (USD
millions)
Restructuring
Estimate (USD
millions)
Actual/Latest
Estimate (USD
millions)
Percentage of
Restructured
Amount
A. Program for
Maputo 1.20 5.00 5.00 100%
B. Program for Beira,
Pemba, Quelimane,
and Nampula 4.43 0.00 - -
C. Verification of
completed yard tap
connections and
service delivery
0.37 0.00 - -
Total Project Costs 6.00 5.00 5.00 0.00
(b) Financing
Source of Funds
Appraisal
Estimate (USD
millions)
Restructuring
Estimate (USD
millions)
Actual/Latest
Estimate (USD
millions)
Percentage of
Appraisal
Global Partnership on
Output-based Aid (Trust
Fund Grant)
6.00 5.00 5.00 100%
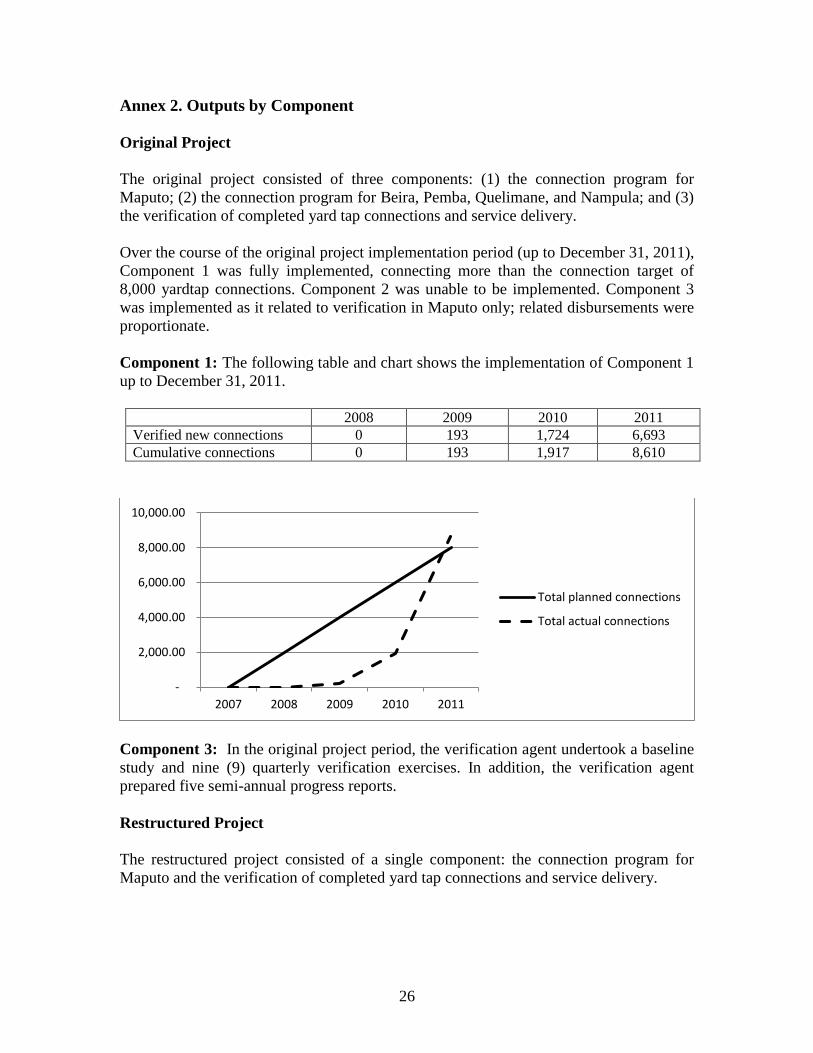
26
Annex 2. Outputs by Component
Original Project
The original project consisted of three components: (1) the connection program for
Maputo; (2) the connection program for Beira, Pemba, Quelimane, and Nampula; and (3)
the verification of completed yard tap connections and service delivery.
Over the course of the original project implementation period (up to December 31, 2011),
Component 1 was fully implemented, connecting more than the connection target of
8,000 yardtap connections. Component 2 was unable to be implemented. Component 3
was implemented as it related to verification in Maputo only; related disbursements were
proportionate.
Component 1: The following table and chart shows the implementation of Component 1
up to December 31, 2011.
2008 2009 2010 2011
Verified new connections 0 193 1,724 6,693
Cumulative connections 0 193 1,917 8,610
Component 3: In the original project period, the verification agent undertook a baseline
study and nine (9) quarterly verification exercises. In addition, the verification agent
prepared five semi-annual progress reports.
Restructured Project
The restructured project consisted of a single component: the connection program for
Maputo and the verification of completed yard tap connections and service delivery.
-
2,000.00
4,000.00
6,000.00
8,000.00
10,000.00
2007 2008 2009 2010 2011
Total planned connections
Total actual connections

27
Over the full implementation period of the restructured project (up to June 30, 2014), the
component was fully implemented. The following table and chart indicates
implementation progress.
2008 2009 2010 2011 2012 2013 2014
Verified new
connections 0 193 1,724 6,693 6,917 9,474 5,764
Cumulative
connections 0 193 1,917 8,610 15,527 25,001 30,765
It is important to note that the presentation of progress on an annual basis masks the high
degree of variability in the progress of implementation (on the monthly basis). Rather
than proceeding in a linear fashion, the installation of yardtap connections took place in
marked fits and starts as the operator accessed funds for materials and works.
In addition to the above yardtap connections completed, the verification agent undertook
ten (10) quarterly verifications and prepared five semi-annual progress reports during the
additional implementation period (January, 2012 – June, 2014). Following the close of
the implementation period, the verification agent undertook one additional verification
(of connections made during the implementation period) and a survey of beneficiary
households. That additional work was paid directly by FIPAG and is not included in the
project’s overall disbursement figures.
Eligibility Criteria
Eligibility criteria were established jointly by AdM staff and the verification agent, taking
into consideration program objectives of targeting poor households unconnected to water
systems. It was agreed that characteristics of potential beneficiaries’ dwellings would be
used to establish eligibility as a proxy for income, as income would be difficult to verify.
-
5,000.00
10,000.00
15,000.00
20,000.00
25,000.00
30,000.00
35,000.00
2007 2008 2009 2010 2011 2012 2013 2014
Total planned connections
Total actual connections

28
Initial guidelines established in the operations manual included pictures of six dwellings
– three considered to be eligible and three considered to be ineligible – but did not clearly
specify the housing criteria to be used. Shortly after the verification agent was engaged,
detailed eligibility criteria were established, which prescribed that beneficiary household
dwellings/property should exhibit four of the following eight characteristics, including
the mandatory characteristic of accessing water from a standpipe or a neighbor’s tap.
Eligibility Criteria: Four Characteristics Required
Characteristic Description
Water access From a standpipe or a neighbor’s tap
(mandatory)
House fence Nothing or vegetation
House roofing Zink or fiber cement
Doors and windows No armed doors or windows
House walls In straw or non-plastered blocks
House floor Dirt
Bathroom Outside the main house
Kitchen Outside the main house
Over time, it became clear that a considerable number of households were being excluded
from the program – despite obvious poverty – due to the existence of one or more of the
above criteria. For example, the property of a household living in poverty may effectively
have blockwork exterior property walls on three sides due to neighbors’ being wealthy
enough to erect their own property walls, which are of course shared by the adjacent
property. Other more common housing characteristics among poor households were the
existence of concrete floors and interior plastering of concrete blocks. As per the view of
FIPAG, some of the housing improvements are made possible through cultural practices
of incremental upgrading with support from community and family contributions. As
such, some of these improvements in the dwelling (although still very basic) can mask
the level of household poverty or distort this proxy for income.
In order to address these issues, FIPAG proposed and the World Bank provided its no-
objection to the following negative list of housing characteristics, the existence of three
of which would disqualify the household from the program:
Eligibility Negative List
Characteristic Description
House fence Plastered conventional wall with car gate
House roofing Concrete slab roof
Door and windows Windows with timber(ed) glass (panes) or net frame
(timber frames are acceptable)
House walls Outside wall fully plastered and/or painted
House floor Tiles or timber
Bathroom Inside the main house with taps or flushing system
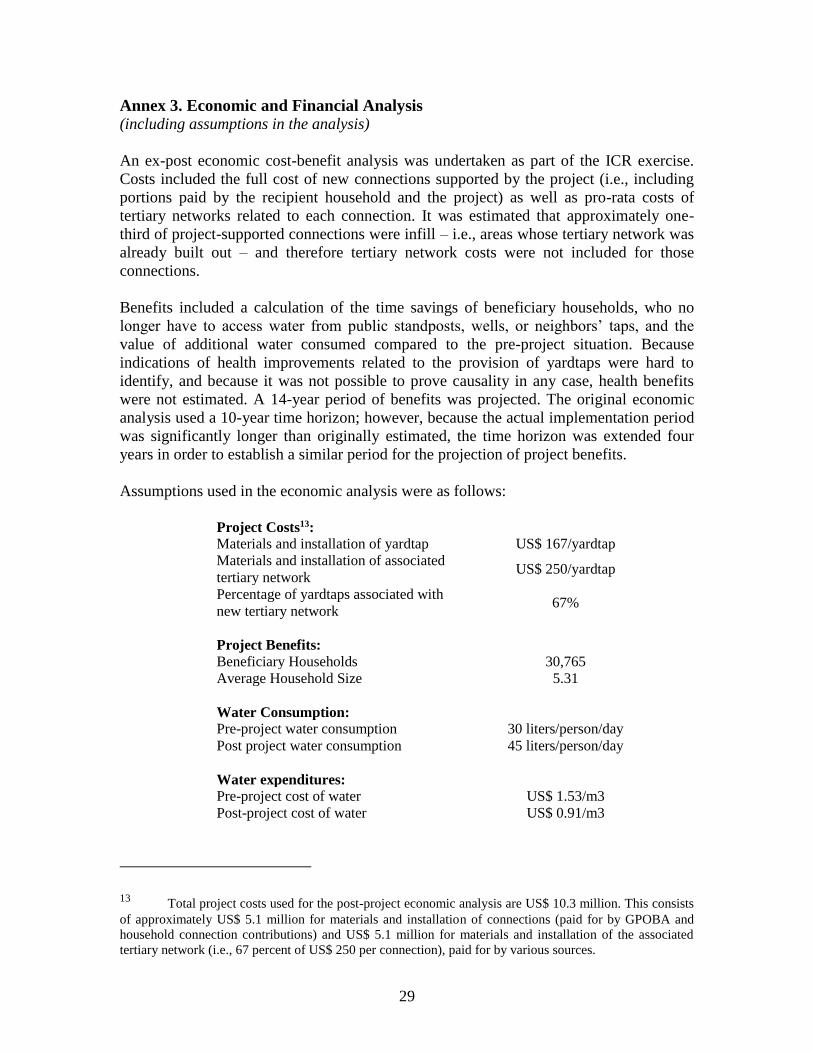
29
Annex 3. Economic and Financial Analysis (including assumptions in the analysis)
An ex-post economic cost-benefit analysis was undertaken as part of the ICR exercise.
Costs included the full cost of new connections supported by the project (i.e., including
portions paid by the recipient household and the project) as well as pro-rata costs of
tertiary networks related to each connection. It was estimated that approximately one-
third of project-supported connections were infill – i.e., areas whose tertiary network was
already built out – and therefore tertiary network costs were not included for those
connections.
Benefits included a calculation of the time savings of beneficiary households, who no
longer have to access water from public standposts, wells, or neighbors’ taps, and the
value of additional water consumed compared to the pre-project situation. Because
indications of health improvements related to the provision of yardtaps were hard to
identify, and because it was not possible to prove causality in any case, health benefits
were not estimated. A 14-year period of benefits was projected. The original economic
analysis used a 10-year time horizon; however, because the actual implementation period
was significantly longer than originally estimated, the time horizon was extended four
years in order to establish a similar period for the projection of project benefits.
Assumptions used in the economic analysis were as follows:
Project Costs13:
Materials and installation of yardtap US$ 167/yardtap
Materials and installation of associated
tertiary network US$ 250/yardtap
Percentage of yardtaps associated with
new tertiary network 67%
Project Benefits:
Beneficiary Households 30,765
Average Household Size 5.31
Water Consumption:
Pre-project water consumption 30 liters/person/day
Post project water consumption 45 liters/person/day
Water expenditures:
Pre-project cost of water US$ 1.53/m3
Post-project cost of water US$ 0.91/m3
13 Total project costs used for the post-project economic analysis are US$ 10.3 million. This consists
of approximately US$ 5.1 million for materials and installation of connections (paid for by GPOBA and
household connection contributions) and US$ 5.1 million for materials and installation of the associated
tertiary network (i.e., 67 percent of US$ 250 per connection), paid for by various sources.

30
Time savings:
Pre-project time spent gathering water 55 minutes/household/day
Post-project time spent gathering water 17 minutes/household/day
Value of time saved
Monthly minimum wage US$ 119.50
Discount for purposes of analysis 50%
Project implementation took place over a five-year period, from 2009 through 2014.
Actual implementation was used to estimate project costs during the period of
implementation; project benefits were assumed to begin accruing in 2010 for the initial
beneficiaries, with remaining beneficiaries coming on stream in line with implementation,
up to an end period of 2022 (a 14-year period for the economic analysis).
The calculation of costs and benefits resulted in the following. The stream of costs and
benefits is provided in the appendix to this annex.
The ex-post estimate of the economic rate of return for the project was calculated to be 31
percent. At a 10 percent discount rate, the project’s net present value is estimated at
US$ 5.9 million. As the original economic analysis used a 12 percent discount rate, the
net present value was also calculated using that rate, resulting in an NPV of US$ 4.6
million.
Economic Rate of Return 31%
Net Present Value (10% discount rate) US$ 5.9 million
Net Present Value (12% discount rate) US$ 4.6 million
These results were compared with the economic analysis undertaken at appraisal. That
analysis undertook a city-by-city economic analysis that indicated a range of economic
returns:
City Economic Return
Maputo 12%
Beira 53%
Nampula 48%
Pemba 27%
Quelimane 96%
There were several differences in the calculation of costs and benefits in the original
analysis. First, costs were expected to be significantly higher, as the per-yardtap cost of
tertiary network was estimated to be US$1,200/yardtap. This report cannot find any
justification for costs that high, particularly as the analysis stated that it was only for
related tertiary network, not for related increases in treatment or transmission. (The
revised cost for tertiary networks was estimated based on recent contracted costs in
Mozambique for tertiary network expansion of US$ 10 per linear meter, with an
assumption of 25 meters per houseplot.) Second, the benefits included a calculation of
health benefits – a reduction in treatment costs and an increase in productive days per

31
year. These benefits were, however, calculated to be very small – only a tiny percentage
of the value of time saved. The large majority of benefits from the initial economic
analysis were derived from time savings, however, most of those time savings accrue to
the household with the yardtap connections – the time savings accrued to the two families
who were assumed to share the connection were relatively small. The difference in the
estimated economic benefit estimated for Maputo between the appraisal analysis (12%)
and the ex-post analysis (31%) is due largely to lower investment costs in the associated
tertiary network, and to the fact that aggregate time savings were not significantly smaller
than originally assumed. This reduction in assumed costs results in significantly higher
estimate of benefits despite the substantial reduction in the total number of beneficiaries.
It should be noted that it is not entirely clear why the expected economic returns for
investments in Maputo were noticeably lower than for the other cities in the appraisal
analysis. The investment costs in other cities were somewhat higher than in Maputo,
while benefit streams were very similar.

32
Table: Calculation of Project Costs and Benefits
2009 2010 2011 2012 2013 2014 2015 – 2022
(annually)
Project Costs
Number of yardtap connections installed 193 1,724 6,693 6,917 9,474 5,764
Direct Costs of yardtap connections (US$) 32,231 287,908 1,117,731 1,155,139 1,582,158 962,588
Indirect Costs of associated Tertiary
Network (US$) 42,328 288,770 1,121,078 1,158,598 1,586,895 965,470
Total Project Costs: (US$) 64,559 576,678 2,238,809 2,313,737 3,169,053 1,928,058
Project Benefits
Time Saved:
Total time saved (hours per year) 22,308 243,881 1,216,746 2,789,835 4,684,361 6,445,620 7,111,843
Value of time saved (US$) 7,405 80,955 403,892 926,070 1,554,948 2,139,588 2,360,737
Consumer Surplus:
Additional water consumers (m3/year) 1,916 20,948 104,509 239,626 402,352 553,631 610,854
Value of additional water consumed (US$) 1,744 19,062 95,104 218,060 366,140 503,804 555,878
Total Project Benefits: (US$) 9,148 100,017 498,996 1,144,130 1,921,088 2,643,392 2,916,614
Net Project Benefits (55,410) (476,661) (1,739,813) (1,169,607) (1,247,965) 715,334 2,916,614
Economic Rate of Return: 30.7%
NPV (Discount rate of 10%): US$ 5.9 million
NPV (Discount rate of 12%): US$ 4.6 million

33
Annex 4. Grant Preparation and Implementation Support/Supervision Processes
(a) Task Team members
Names Title Unit Responsibility/
Specialty
Lending/Grant Preparation
N. Jane Walker Lead Water & Sanitation Specialist AFTU1 Team Leader
Yogita Mumssen GPOBA Transaction Advisor GPOBA
Luiz Claudio M. Tavares Sr. Water and Sanitation Specialist AFTU1
Midori Makino Sr. Financial Analyst AFTU1
Sudeshna Ghosh Banerjee Economist AFTPI
Priyanka Sood Consultant GPOBA
David Weston Consultant AFTU1
Slaheddine Ben-Halima Procurement Hub Coordinator AFTPC
Antonio Chamuco Sr. Procurement Specialist AFTPC
Joao Tinga Sr. Financial Management Specialist AFTFM
Arbi Ben-Achour Sr. Social Scientist AFTS1
John Boyle Sr. Environmental Specialist AFTS1
Devendra Bajgain Operations Officer AFTU1
Rildo Santos Language Program Assistant AFTU1
Salma Chande Team Assistant AFCS2
Supervision/ICR
Luiz Claudio Martins Tavares Lead Water & Sanitation Specialist GWADR Team Leader
David Malcolm Lord Water & Sanitation Specialist GWADR ICR Team Leader
Elisabeth Sherwood Consultant GWADR ICR Author
Ubaldo Daniel Coila Quispe Operations Analyst GSUOU GPOBA
Caroline van den Berg Lead Water Economist GWADR ICR Peer Review
Peter Hawkins Snr Water & Sanitation Specialist GWADR ICR Peer Review
Victor Vazquez Alvarez Water & Sanitation Specialist GWADR ICR Peer Review
Rildo Santos Language Program Assistant GSURR
Arlete Quiteria Comissario
Nkamate Program Assistant AFCS2
(b) Staff Time and Cost
Stage of Project Cycle
Staff Time and Cost (Bank Budget Only)
No. of staff weeks USD Thousands (including
travel and consultant costs)
Lending
FY08 0.92
Total: 0.92
Supervision/ICR
Total: 9.84 177.00
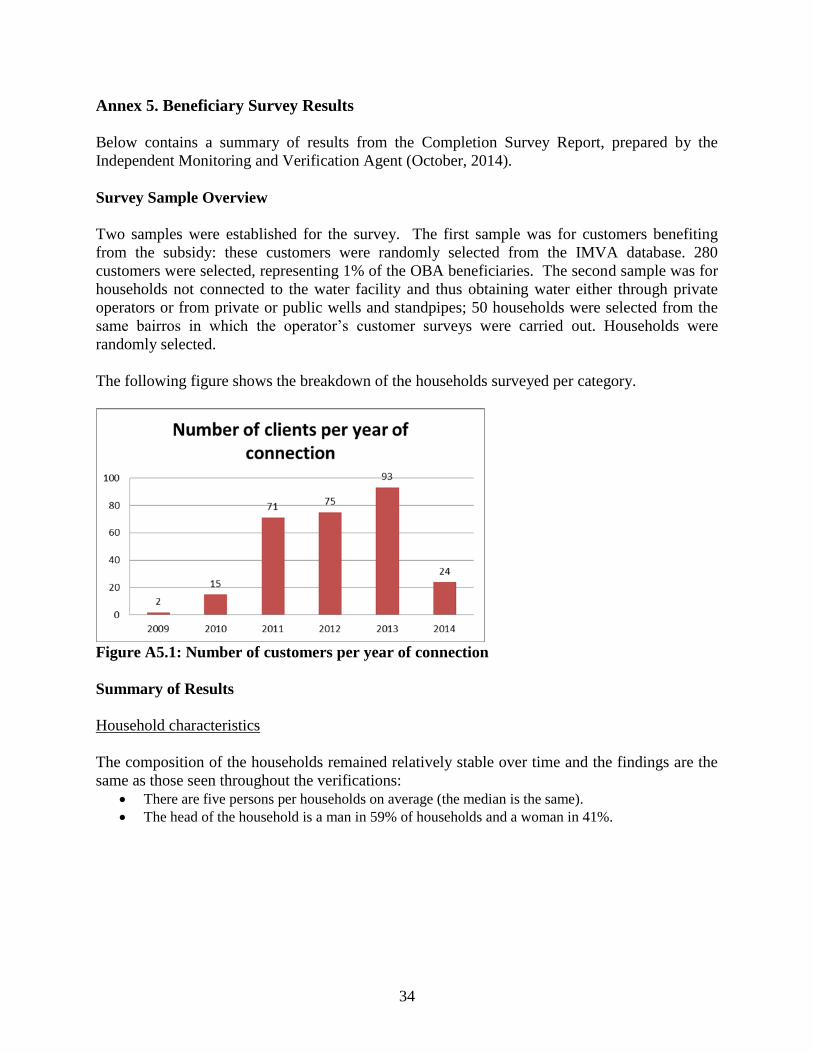
34
Annex 5. Beneficiary Survey Results
Below contains a summary of results from the Completion Survey Report, prepared by the
Independent Monitoring and Verification Agent (October, 2014).
Survey Sample Overview
Two samples were established for the survey. The first sample was for customers benefiting
from the subsidy: these customers were randomly selected from the IMVA database. 280
customers were selected, representing 1% of the OBA beneficiaries. The second sample was for
households not connected to the water facility and thus obtaining water either through private
operators or from private or public wells and standpipes; 50 households were selected from the
same bairros in which the operator’s customer surveys were carried out. Households were
randomly selected.
The following figure shows the breakdown of the households surveyed per category.
Figure A5.1: Number of customers per year of connection
Summary of Results
Household characteristics
The composition of the households remained relatively stable over time and the findings are the
same as those seen throughout the verifications:
There are five persons per households on average (the median is the same).
The head of the household is a man in 59% of households and a woman in 41%.

35
Figure A5.2: Status of the head of the household
The heads of the household are mostly single.
The vast majority of households own their own house:
Figure A5.3: Home ownership
Ownership for households without a connection is 10 percentage points lower than for the OBA
beneficiaries.
Survey results shows that 86% of the heads of the household are still the original customer
registered in the commercial database. Only 1% of those who are not listed as the customer
moved into the house after the connection had been installed.
Upgrading the connection
Only 0.7% of beneficiaries upgraded their connection. The vast majority of households are still
using a yard tap.
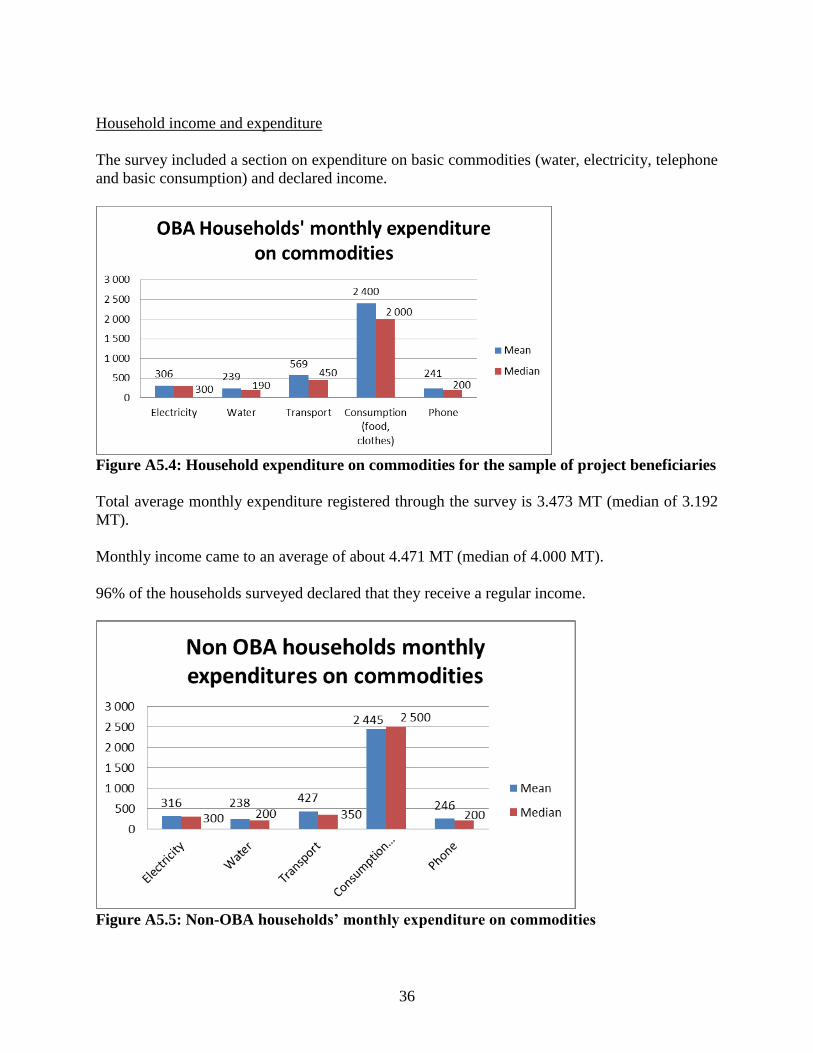
36
Household income and expenditure
The survey included a section on expenditure on basic commodities (water, electricity, telephone
and basic consumption) and declared income.
Figure A5.4: Household expenditure on commodities for the sample of project beneficiaries
Total average monthly expenditure registered through the survey is 3.473 MT (median of 3.192
MT).
Monthly income came to an average of about 4.471 MT (median of 4.000 MT).
96% of the households surveyed declared that they receive a regular income.
Figure A5.5: Non-OBA households’ monthly expenditure on commodities

37
Total average monthly expenditure amounts to 3.321 MT (median of 3.580 MT). Total monthly
income, came to an average of around 4.984 MT (median of 5.000 MT).
Service Level
84% of respondents stated that they had water every day over the previous month. For those
households that experienced water service interruptions, they were without water for an average
of 1.3 days over the previous week and 2.9 days over the previous month.
Measurements showed that it took an average of 46 seconds, i.e. 7 minutes, to obtain 200 liters
of water (the average daily water consumption of a household). These measurements correspond
to those taken during the Output Verification exercises (an average of 56 seconds for the 1,152
measurements conducted during the verifications).
Customer billing
97% of households stated that they receive a bill every month.
Surveyors viewed the last 3 monthly bills for 64% of these households. In 93% of the household
visited, the surveyors were shown at least one bill.
Customer satisfaction
Nearly all households (93%) were satisfied with the water quality.
76% of households are satisfied with the water supply service.
The water availability constraints each day is main reason for households’ lack of satisfaction
with the service. Following this is the water tariff and then water quality.
Households that did not benefit from the project
Water source
The alternative water source to a private connection used by non-connected households is the
standpipe and neighbor’s tap:

38
Figure A5.6: Primary water source for non-connected households
The households without a domestic water connection usually alternate between two main water
sources: the standpipe and neighbor’s tap (or several neighbors’ taps).
Satisfaction level
74% of the non-connected households surveyed are not satisfied with their current water source.
Figure A5.7: Reasons for dissatisfaction of non-connected households
Reasons for not being connected to the network

39
Figure A5.8: Reasons for not being connected to the network
Water Usage
Survey results showed an average daily water consumption of 40 liters per capita. This is 20%
lower than either the first 3 month or first 6 months’ water consumption measurements for all the
OBA customers verified during the project (where the average was 50 liters per capita per day).
The surveyor results showed that for non-OBA households the average daily per capita water
consumption of 31 liters (the median is the same).
Water usage trends
85% of the households confirmed, water usage has not changed over time.
Active customers
2.5% of OBA customers have been disconnected for failure to pay their bills and 1.7%
disconnected at their own request.
Difficulties paying the bills and level of debt
The survey shows that 77% of households stated they pay their bill every month and 30% of the
customers surveyed admitted finding it difficult to pay their bills.

40
29% of the respondents were able to estimate the debt they owed to the operator. The average
level of debt is 2,548 MT with a median of 1,153 MT. These levels of debt equate to about 8.5 to
3.9 months of water consumption, which is quite significant.
Water consumption trends
Results show that the longer the customer has been connected, the higher their monthly water
consumption.
Figure A5.9: Average monthly customer water consumption per year of connection
Figure A5.10: Customers’ monthly water consumption per number of available readings

41
Time saved collecting water
Figure A5.11: Beneficiaries of the time saved
42
Annex 6. Summary of Grantee's ICR
1. Project Context and Design 1.1 Project Context In context of implementation of the second Plan for Alleviation of Absolute Poverty -
PARPA II (2006-2009), for urban water supply it is expected that the coverage should
increase from the current 37% to 70% in the next ten years, in order to achieve the
Meeting the Millennium Development Goals (MDGs) in the water and sanitation sectors
by 2015. In 2007, Government of Mozambique established the Delegated Management
Framework (DMF) to allow participation of the private sector in the management of
water supply services in order to improve public services, as well as increased coverage
of the population.
Is important to remark that the Private Sector Participation (PSP) in urban water supply in
Mozambique started in 1999 with the incorporation of five cities in FIPAG, namely
Maputo, with a lease contract transferring for operation for fifteen years, and a
management contract for five years to Beira, Quelimane, Nampula and Pemba, between
the FIPAG and the company Águas de Mozambique (AdeM) Private Operator (World
Bank, 2009).
With the necessity of to increase the coverage rate especially for peri-urban areas the
Government of Mozambique represented by FIPAG, signed a Grant Agreement with the
World Bank to implement the project GPOBA (Global Partnership for Output Based Aid)
in April 2008.
GPOBA funding was provided to assist low-income households with subsidized yard
connections in Maputo. The subsidy from GPOBA is a grant and the amount financed is
the difference between the cost of the connection and the user contribution.
The objective of the GPOBA project was to increase piped-water access to over 468,000
poor Mozambicans living in five cities – Maputo, Beira, Nampula, Quelimane and Pemba
who could not afford to pay connection costs and were excluded from the network. This
objective was to be achieved by providing an output- based subsidy to private operators
after their delivery of: 1) functioning yard-taps; and 2) the demonstration of continued
service for a period of time. Approximately 29,000 yard-taps were to be installed. Each
yard tap was officially estimated to serve approximately three households.
In Maputo, these outputs have been provided by the existing incumbent operator, Águas
de Mozambique (now renamed Águas da Região de Maputo, AdRM), who hold a lease
contract to supply water services in Maputo until 2014. In Beira, Nampula, Quelimane
and Pemba, existing management contracts were close to expire at the time of this project
identification and should have been replaced by lease contracts which were to be bid out
on a lowest subsidy required basis (with pre-determined tariffs and lease fees). These
contracts were expected to be for 15 years and the OBA subsidies would be disbursed
during the first 5 years of the lease contracts.

43
However, the bidding process was cancelled and the water supply service provision
was handed over to the operational entities of FIPAG. As a result the OBA subsidies
amount could not be applied to Beira, Nampula, Quelimane and Pemba.
1.2 Project Design From the original project document the total project cost to extend the existing
system to over 468,000 people was about US$ 42 million. This included IDA and EIB
co-financing for extending the secondary and tertiary water supply networks to these
468,000 people, as well as the US$ 6 million in GPOBA subsidies for the connection
charge (the “last mile”) and user contributions in the form of guarantee deposits
(about 10% of the connection charge). This project was built upon previous IDA-
funded schemes that developed the initial production, treatment, and network facilities,
and developed the institutional framework on which this GPOBA-funded project
relied.
Table 1: Cost and Subsidy for the Yard Tap Connections
City
Total
yard
taps
Total Cost Total Subsidy
Cost per
yard
tap
Subsidy per
yard
tap
User deposit
per yard
tap
People
per
yard
tap 1)
Number
of
persons
Subsidy
per
person
Maputo 8000 $1,336,000 $1,200,000 $167 $150 $17 17.9 143,520 $8.4
Beira 6750 $1,626,750 $1,498,500 $241 $222 $19 15.9 107,325 $13.9
Nampula 4900 $1,166,200 $1,092,700 $238 $223 $15 15.3 74,970 $14.5
Pemba 4900 $1,166,200 $1,082,900 $238 $221 $17 15.1 74,088 $14.6
Quelimane 4400 $836,000 $756,800 $190 $172 $18 15.6 68,640 $11.0
28,950 $6,131,150 $5,630,900 468,543 $12.0 Note: 3 households per yard tap; household size varies per city between 5 – 6 people
For Maputo the original target was 8.000 yard connections to be executed by the Operator up to December 2011.
1.2.1. Institutional Framework FIPAG was the grant recipient and signatory. As per the Agreement an Operations
Manual was established by the recipient, which sets the implementation arrangements,
including the roles and responsibilities of FIPAG and AdeM (Private Operator), the
eligibility criteria for household to receive the subsidized connections, and the
arrangements for billing, disbursement arrangements and monitoring/verification.
1.2.2. – Outputs Monitoring and Subsidy Disbursement The criteria for selecting the eligible household connections were developed by FIPAG
and Águas da Região de Maputo and was approved by the World Bank in 2007 (section #
2, Grant No. TF091213). The table below indicates some of the criteria used for selection
of household eligible for the subsidy. Criteria were directly related to housing quality as a
proxy for poverty.

44
Table 2 - Criteria for the different type of housing
Types of housing related to suitable
applicants
Types of housing related to unsuitable applicants
One room blockwork dwelling A quality dwelling which indicates that the owner can
afford to pay the full cost of a water connection
Habitation constructed using re-cycled used
materials
A small house, but located on a large plot of cultivated
land which indicates that the owner can afford to pay the
full cost of a water connection
Habitation with blockwork walls but
without a paved floor
A large plot of land with garden and leisure centre which
indicates that the owner can afford to pay the full cost of a
water connection
As defined in the 70% of the subsidy were disbursed upon submission of working yard
tap connections. The remaining 30% of the subsidy were to be released after three months
of verified service provision. Monitoring and verification were the responsibility of
FIPAG as the Implementing Agency. FIPAG appointed an independent Monitoring
and Verification Agent using Bank procurement procedures.
Following an application from the customer, the Operator would assess the property for
eligibility, collect the advance payment from the customer and implement the yard tap
connection. An Independent Monitoring and Verification Agent (IMVA) would randomly
verify outputs. After verification the Operator will be eligible to receive 70% of the
subsidy payment. The remaining 30% of the subsidy payment would be claimed after the
first 3 months of satisfactory service provision supported by records and independent and
random verification by the IMVA.
2. Project Implementation
2.1. Phase 1 – 8.000 yard connections
After signature of the Grant Agreement on 3rd of April 2008, the project became effective
in July 2009 after the recruitment of the Independent Monitoring and Verification Agent.
To enable fulfillment of the prerequisites for disbursement of the Grant Funds FIPAG
started the process for selection of the IMVA using Bank procurement procedures in
January 2009. As only one expression of interest was received, the process was re-
advertised on February 18. The Contract between FIPAG and the JV
Hydroconseil/Salomon was signed on 20th July 2009.
The selected IMVA started immediately and produced in August 2009 the inception
report which includes the baseline situation on the targeted bairros and some concrete
selection criteria for targeting the subsidy for the poor households. The final version of
the inception report was submitted to the bank on the 2nd October 2009 and the
instruction to the operator for the start of works was given immediately. The operator
started the selection of the beneficiaries’ activities and submitted an action plan in
November 2009.

45
The first quarter activities for the Operator concerned October-December 2009 during
which only 193 yard connections where executed as an output. Although this number was
low it was deemed acceptable considering that the Operator was still experimenting
application of the selection criteria and mobilizing an adequate team. Expectation was
that they would mobilize to other bairros quickly. The verification for the said period was
implemented smoothly and the first payment to the Operator released in January 2010.
By the time the Operator was only working in one bairro with a connection rate of 97
connections per month.
The reasons put forward by the operator for this low performance were at this period the
long delay taken by the client to pay for the subsidized connection fee and the fact that
there were too few households meeting the selection criteria based of the fact that many
of them had already a private connection through a small private operator.
In the beginning of 2010 project status was still not high but still coherent with the
connection plan. Along 2010 FIPAG and operator have agreed to introduce tap on the
standard connection implemented under the GPOBA according to the standard of the
normal connection and expectation of the customers. Therefore the Operator presented
logistic problems respective to the provision of tap. This created a financial impact for
the operator because households would remove the tap when not in use to prevent theft.
This resulted in low success rate for the 30% certification and lower payments than
expected by the operator. This technical issue of the tap was resolved at the beginning of
2012 with the removal of the tap as a requirement for verification; the success rates for
the 30% verification have been above 95% ever since.
Figure 1: Success rate evaluation along project implementation
The number of connections per quarter improved in 2011; the Operator managed to
connect more than 2,500 clients in two consecutive quarters. By the end of 2011 the

46
Operator had managed to connect 8,610 new clients using the subsidy. Nine verification
processes had been finalized with a total amount of US$ 1,215,180 paid to the operator.
2.2. Phase 2 - Reallocation of the northern cities GPOBA funds to Maputo
With the cancellation of the bidding process for the northern cities (Beira, Quelimane,
Nampula and Pemba) FIPAG had requested the reallocation of GPOBA funds earmarked
for the northern cities to Maputo. Proposal was approved by the Bank in February 2012
and as a result the project would now cover a much larger area than originally planned
(from district 4 to the entire lease area of the operator in Maputo and Matola) and the
total number of targeted connections was increased from 8,000 to 28,850. With this
approval, activities where now expanded to all Maputo and Matola municipalities.
The activities in the beginning of 2012 had a decrease in performance due to lack of
information on the continuation of the GPOBA project as the Operator was given
information on its continuation in March 2012 only. Only 129 new connections were
submitted for verification for this first quarter of 2012. Although project activities were
now extended to all Maputo and Matola the Operator performance was characterized with
lower performance along all 2012 with a drastic improvement on the last quarter (from
900 to 6,000 connections) but still behind the plan for reaching the 28,850 connections
target. The year was closed with 8.660 additional connections approved, with a
noticeable effort made by AdRM to meet the plan.
By the end of 2013, 50 months of the project had passed and AdRM had managed to
connect 25.001 new clients using the subsidy, 17 verification processes and a total
amount of US$3,529,110 certified for payment. In the last quarter of 2013 the average
success rate was 93%. The main reason for rejection within certification of 70% of the
subsidy was the fact that many connections could not be found and were thus refused for
the subsidy.
Following a request from the Operator the Bank approved in June 2013, some changes in
the selection criteria agreed between FIPAG and the operator in September 2009.
Essentially the main changes approved where the reduction of the criteria from 8 to 6; the
consideration of 3 out of 6 parameters to be eligible; the change on the description of 3
indicators namely the water access, house fence, house walls and the house floor. Main
reason was that with the expansion of the project area to the whole of Maputo and
inclusion of Matola municipality rather than Laulane area only brought to light the fact
that poverty is characterized in different ways and these proposed changes in the
eligibility criteria would create space for a more inclusive GPOBA project. This change
of the selection methodology has not changed drastically the Operators performance.
At the project end after 56 months of operation AdRM has managed to connect 30,765
new clients using the subsidy, 20 verification processes where finalized and
US$ 4,559,670 certified to the Operator.
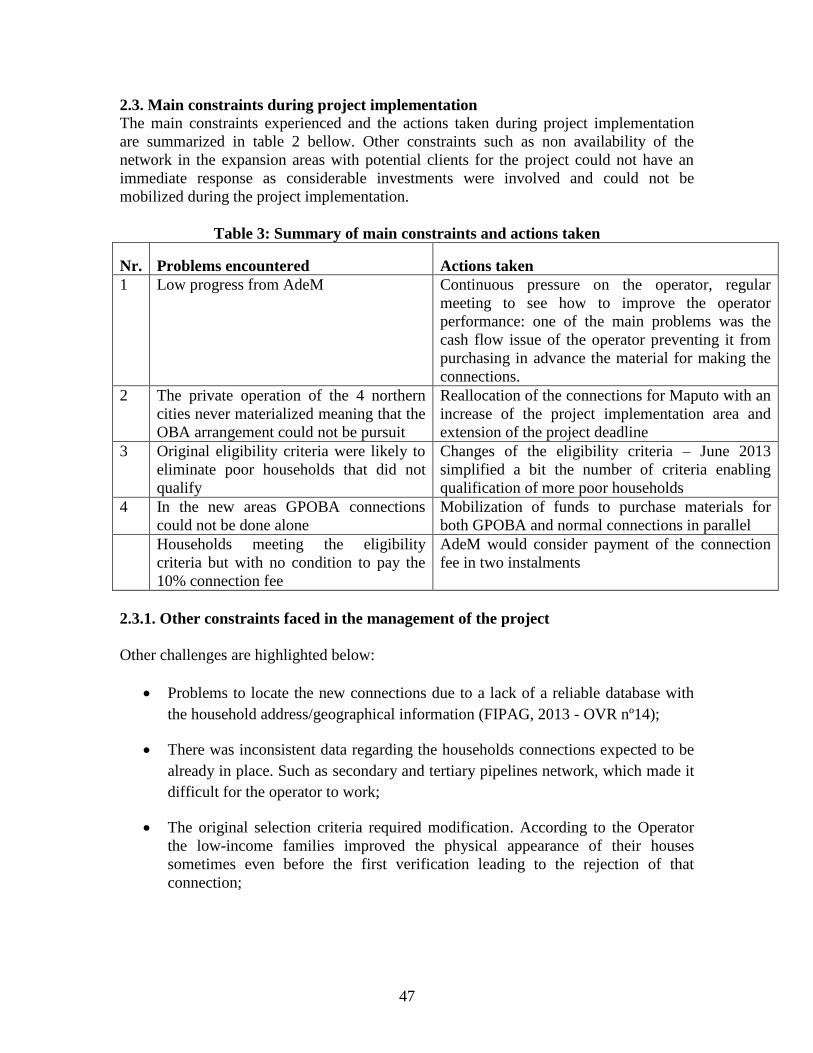
47
2.3. Main constraints during project implementation The main constraints experienced and the actions taken during project implementation
are summarized in table 2 bellow. Other constraints such as non availability of the
network in the expansion areas with potential clients for the project could not have an
immediate response as considerable investments were involved and could not be
mobilized during the project implementation.
Table 3: Summary of main constraints and actions taken
Nr. Problems encountered Actions taken
1 Low progress from AdeM Continuous pressure on the operator, regular
meeting to see how to improve the operator
performance: one of the main problems was the
cash flow issue of the operator preventing it from
purchasing in advance the material for making the
connections.
2 The private operation of the 4 northern
cities never materialized meaning that the
OBA arrangement could not be pursuit
Reallocation of the connections for Maputo with an
increase of the project implementation area and
extension of the project deadline
3 Original eligibility criteria were likely to
eliminate poor households that did not
qualify
Changes of the eligibility criteria – June 2013
simplified a bit the number of criteria enabling
qualification of more poor households
4 In the new areas GPOBA connections
could not be done alone
Mobilization of funds to purchase materials for
both GPOBA and normal connections in parallel
Households meeting the eligibility
criteria but with no condition to pay the
10% connection fee
AdeM would consider payment of the connection
fee in two instalments
2.3.1. Other constraints faced in the management of the project
Other challenges are highlighted below:
Problems to locate the new connections due to a lack of a reliable database with
the household address/geographical information (FIPAG, 2013 - OVR nº14);
There was inconsistent data regarding the households connections expected to be
already in place. Such as secondary and tertiary pipelines network, which made it
difficult for the operator to work;
The original selection criteria required modification. According to the Operator
the low-income families improved the physical appearance of their houses
sometimes even before the first verification leading to the rejection of that
connection;
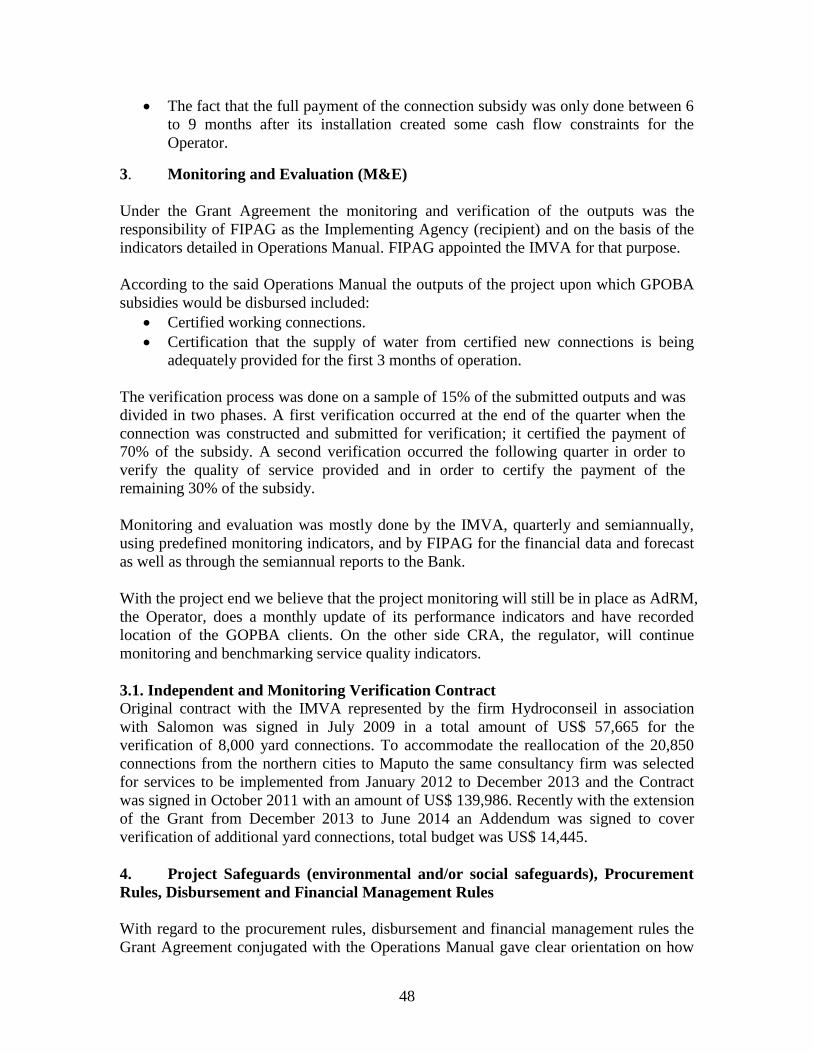
48
The fact that the full payment of the connection subsidy was only done between 6
to 9 months after its installation created some cash flow constraints for the
Operator.
3. Monitoring and Evaluation (M&E)
Under the Grant Agreement the monitoring and verification of the outputs was the
responsibility of FIPAG as the Implementing Agency (recipient) and on the basis of the
indicators detailed in Operations Manual. FIPAG appointed the IMVA for that purpose.
According to the said Operations Manual the outputs of the project upon which GPOBA
subsidies would be disbursed included:
Certified working connections.
Certification that the supply of water from certified new connections is being
adequately provided for the first 3 months of operation.
The verification process was done on a sample of 15% of the submitted outputs and was
divided in two phases. A first verification occurred at the end of the quarter when the
connection was constructed and submitted for verification; it certified the payment of
70% of the subsidy. A second verification occurred the following quarter in order to
verify the quality of service provided and in order to certify the payment of the
remaining 30% of the subsidy.
Monitoring and evaluation was mostly done by the IMVA, quarterly and semiannually,
using predefined monitoring indicators, and by FIPAG for the financial data and forecast
as well as through the semiannual reports to the Bank.
With the project end we believe that the project monitoring will still be in place as AdRM,
the Operator, does a monthly update of its performance indicators and have recorded
location of the GOPBA clients. On the other side CRA, the regulator, will continue
monitoring and benchmarking service quality indicators.
3.1. Independent and Monitoring Verification Contract
Original contract with the IMVA represented by the firm Hydroconseil in association
with Salomon was signed in July 2009 in a total amount of US$ 57,665 for the
verification of 8,000 yard connections. To accommodate the reallocation of the 20,850
connections from the northern cities to Maputo the same consultancy firm was selected
for services to be implemented from January 2012 to December 2013 and the Contract
was signed in October 2011 with an amount of US$ 139,986. Recently with the extension
of the Grant from December 2013 to June 2014 an Addendum was signed to cover
verification of additional yard connections, total budget was US$ 14,445.
4. Project Safeguards (environmental and/or social safeguards), Procurement
Rules, Disbursement and Financial Management Rules
With regard to the procurement rules, disbursement and financial management rules the
Grant Agreement conjugated with the Operations Manual gave clear orientation on how

49
those matters should be treated. In general there were no particular issues or problems
during project implementation. Procurement rules where used and respected for the
selection the IMVA as reported in 3.1 above.
5. Project Sustainability
Main project objective was to subsidize connection fee to the poor as the cost of the
connection was considered as the main barrier for water access. The water tariff structure
is already prepared to ensure sustainability as it is cross subsidized. This justifies the fact
that in general the GPOBA clients are being able to pay their bills.
To ensure sustainability AdeM undertook sensibilization campaigns along the project
implementation disseminating messages of how to save water.
In order to gather more data on post project behaviors and findings surveys was
contracted by FIPAG to the IMVA. The survey targeted a sample of 1% of total
connections implemented during the project and can be found in Annex I. Within this
sample we can state that project is sustainable as no GPOBA client has been disconnected
due to non payment.
Nevertheless there are some challenges left by the project that may define its
sustainability along the time which we should reflect on when considering similar
agreements in future and those are mainly related to billing and collection for this new
group of clients. In our view project should incorporate funds to develop tools/strategies
to deal with those possible post constraints.
For the future FIPAG want to increase piped-water access to low income households in
Maputo by providing an output-based subsidy to private operators. To achieve the desired,
FIPAG is designing project application for the extension of the current project.
6. Project Outcomes
Even with the considerable challenges during project implementation it was still possible
to achieve objectives in the 2 phases. With the last extension of the project it was even
possible to surpass the target by 1,915 new connections.
Table 1 bellow summarizes the project implementation and Operator performance from
November 2009 till June 2014.
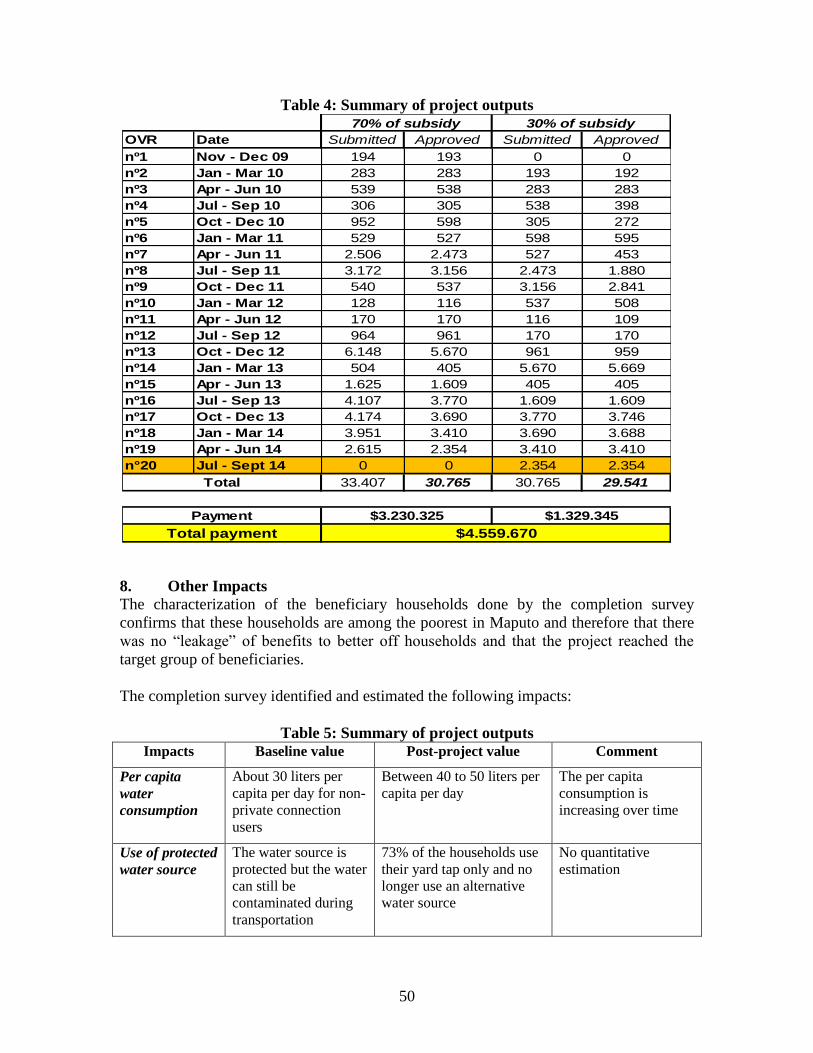
50
Table 4: Summary of project outputs
8. Other Impacts
The characterization of the beneficiary households done by the completion survey
confirms that these households are among the poorest in Maputo and therefore that there
was no “leakage” of benefits to better off households and that the project reached the
target group of beneficiaries.
The completion survey identified and estimated the following impacts:
Table 5: Summary of project outputs Impacts Baseline value Post-project value Comment
Per capita
water
consumption
About 30 liters per
capita per day for non-
private connection
users
Between 40 to 50 liters per
capita per day
The per capita
consumption is
increasing over time
Use of protected
water source
The water source is
protected but the water
can still be
contaminated during
transportation
73% of the households use
their yard tap only and no
longer use an alternative
water source
No quantitative
estimation
OVR Date Submitted Approved Submitted Approved
nº1 Nov - Dec 09 194 193 0 0 $20.265
nº2 Jan - Mar 10 283 283 193 192 $38.355
nº3 Apr - Jun 10 539 538 283 283 $69.225
nº4 Jul - Sep 10 306 305 538 398 $49.935
nº5 Oct - Dec 10 952 598 305 272 $75.030
nº6 Jan - Mar 11 529 527 598 595 $82.110
nº7 Apr - Jun 11 2.506 2.473 527 453 $280.050
nº8 Jul - Sep 11 3.172 3.156 2.473 1.880 $415.980
nº9 Oct - Dec 11 540 537 3.156 2.841 $184.230
nº10 Jan - Mar 12 128 116 537 508 $35.040
nº11 Apr - Jun 12 170 170 116 109 $22.755
nº12 Jul - Sep 12 964 961 170 170 $108.555
nº13 Oct - Dec 12 6.148 5.670 961 959 $638.505
nº14 Jan - Mar 13 504 405 5.670 5.669 $297.630
nº15 Apr - Jun 13 1.625 1.609 405 405 $187.170
nº16 Jul - Sep 13 4.107 3.770 1.609 1.609 $468.255
nº17 Oct - Dec 13 4.174 3.690 3.770 3.746 $556.020
nº18 Jan - Mar 14 3.951 3.410 3.690 3.688 $524.010
nº19 Apr - Jun 14 2.615 2.354 3.410 3.410 $400.620
n°20 Jul - Sept 14 0 0 2.354 2.354 $105.930
33.407 30.765 30.765 29.541 $2.504.835
Paid
Total payment $4.559.670
70% of subsidy 30% of subsidy
$3.230.325 $1.329.345Payment
Total

51
Time saved The standpipe users
spend about 50 to 100
minutes per day per
household fetching
water
Yard tap users spend
between 17 to 20 minutes
per day
The main beneficiaries
of the time saved are
women and girls
Health
improvements
A qualitative indication of
the general health
improvements in the
household after installation
of the yard tap
No quantitative
estimation of impact,
the main beneficiaries
are again women and
girls
The impacts are focused on women and girls according to the completion survey; women
and girls are the first responsible for the water chore and the main beneficiaries of the
time reduction for fetching water and of the improvement of health in the household.
9. World Bank Performance
FIPAG as the project recipient and implementing entity evaluates the World Bank
Performance as positive with a strong presence during all project duration.
Apart from the biannual reports submitted by FIPAG to the Bank with copies of the
semiannual reports from the IMVA, the Bank team dedicated enough time for discussions
on the project issues during their supervision missions.
The Bank provided advice in time to secure that objectives were met in a sustainable way.
A dedicated Task Team Leader with clear understanding of the project environment was
of great value as it enabled timely response and advice to problems encountered.
Following justification above the table below attempts to score the Banks performance
from 1 to 5 being 1-poor and 5 excellent.
Table 6: World Bank Performance score
Indicator Score Comments
Project Preparation 4
Project Supervision 5 Project supervision was done between once to twice
a year and had an important contribution for project
success
Provision of advice 5 Discussions with both FIPAG and Operator during
Banks supervision missions
Responses to project
request
3 Discussions and decisions on changes to selection
criteria could have happened earlier than June 2013
It is of pride to emphasize that along these years a lot of visits where paid to the project
by the Banks visitors apart from project team.

52
10. Borrower Performance
For this case there were not so many inputs required from the Government to the
implementing agency, nevertheless, there were also some complaints with regard to
delays in payments specially to the IMVA as payment was done out of the country and
Government procedures for corresponding taxes is long and could take more than 60 days.
Although project was not so demanding in skills and capacity there was always from the
FIPAGs a project coordinator and assistant to manage both contract with the Verification
Agent and AdeM’s performance.
In the first 2 years of the project implementation the Operators performance clearly
affected the disbursement performance of FIPAG with risks project cancellation. But it
was then possible to revert the scenario.
11. Lessons Learned
The thing that made this project get on its tracks and meet the objectives was the pressure
put to the Operator in a consistent and constructive way, with focus on the constraints and
way forward. Although the operator was sometimes very far behind schedule he did
manage to reach and overcome the objective.
As a lesson learned and considering this specific type of project we could refer to the
following:
Some time should be allowed for Operator to get familiarized with procedures
especially when these are new;
Implementing agencies should have the capacity to expand the project, as far as
agreed selection criteria are respected;
The Operator improved its ability to do high number of connections at the same
time, only with the GPOBA project they manage to do around 6,000 in a quarter;
Definition of eligibility criteria should take into account culture aspects;
The Operator may face problems with billing and profits collection particularly
from households benefited from the project, since many of the poor household
struggle to pay the monthly bill at the end of the month. For future projects it
should be considered the design and implementation of other collection strategies.
12. Project Costs and Financing
Project costs categories were only two and this simplified disbursement process from
FIPAG side. Financing conditions were also clear under the Grant Agreement.
Table 7 below summarizes information regarding (requested, approved) disbursements
from the GPOBA grant. No additional amounts are expected to be invoiced, or paid by
FIPAG from the Grant.

53
Table 7: Disbursement Summary
Category Description Allocated Disbursed Undisbursed
4 GPOBA Subsidy for Water Supply 4,350,000 4,559,670 -209,670
5 Consulting Services, including audits
(after Feb 2012) 650,000 212,096 437,904
Total 5,000,000 4,892,742 228,234
Total undisbursed amount is US$ 228,234 mainly resulting from savings under the
category 5- Consulting Services. This amount represents approximately 4% of total Grant,
thus disbursement can be classified as good.

54
Annex 7. List of Supporting Documents
1. GPOBA Commitment Document, 2007
2. GPOBA Project Restructuring Paper, 2012
3. GPOBA Grant Agreement, 2008
4. Amendment to the GPOBA Grant Agreement, 2012
5. GPOBA Project Operations Manual, 2009
6. GPOBA Output Verification Reports (OVRs), prepared quarterly by IMVA
7. GPOBA Semi-Annual Reports, prepared by IMVA
6. Water Sector Implementation Support Mission Aide-Memoires, 2010 – 2014
7. Project Implementation Status and Result (ISR) Reports
8. GPOBA Household Survey Report, 2014


