Document of The World Bank · Document of The World Bank ... BPR Business Process Re-engineering...
77
Document of The World Bank Report No: ICR00001676 IMPLEMENTATION COMPLETION AND RESULTS REPORT (IDA-H2660 IDA-H4380 TF-58248 TF-95296) ON A GRANT IN THE AMOUNT OF SDR 118.5 MILLION (US$175 MILLION EQUIVALENT) TO THE FEDERAL DEMOCRATIC REPUBLIC OF ETHIOPIA FOR A PRODUCTIVE SAFETY NETS APL II PROJECT IN SUPPORT OF THE SECOND PHASE OF THE PRODUCTIVE SAFETY NET PROGRAM December 29, 2010 Social Protection Unit Human Development Department Africa Region Public Disclosure Authorized Public Disclosure Authorized Public Disclosure Authorized Public Disclosure Authorized Public Disclosure Authorized Public Disclosure Authorized Public Disclosure Authorized Public Disclosure Authorized
-
Upload
trinhthuan -
Category
Documents
-
view
223 -
download
0
Transcript of Document of The World Bank · Document of The World Bank ... BPR Business Process Re-engineering...

Document of The World Bank
Report No: ICR00001676
IMPLEMENTATION COMPLETION AND RESULTS REPORT (IDA-H2660 IDA-H4380 TF-58248 TF-95296)
ON A
GRANT
IN THE AMOUNT OF SDR 118.5 MILLION (US$175 MILLION EQUIVALENT)
TO THE
FEDERAL DEMOCRATIC REPUBLIC OF ETHIOPIA
FOR A
PRODUCTIVE SAFETY NETS APL II PROJECT
IN SUPPORT OF THE SECOND PHASE
OF THE PRODUCTIVE SAFETY NET PROGRAM
December 29, 2010
Social Protection Unit Human Development Department Africa Region
Pub
lic D
iscl
osur
e A
utho
rized
Pub
lic D
iscl
osur
e A
utho
rized
Pub
lic D
iscl
osur
e A
utho
rized
Pub
lic D
iscl
osur
e A
utho
rized
Pub
lic D
iscl
osur
e A
utho
rized
Pub
lic D
iscl
osur
e A
utho
rized
Pub
lic D
iscl
osur
e A
utho
rized
Pub
lic D
iscl
osur
e A
utho
rized

CURRENCY EQUIVALENTS
(Exchange Rate Effective June 30, 2010)
Currency Unit = Birr (ETB) US$1.00 = 13.595 Birr US$1.00 = SDR 1.4789
FISCAL YEAR
Ethiopian Fiscal Year (EFY)
July 8 – July 7 EFY 02 ≈ IDA FY10
ABBREVIATIONS AND ACRONYMS
APL Adaptable Program Loan BOARD Bureau of Agriculture and Rural Development BOFED Bureau of Finance and Economic Development BPR Business Process Re-engineering CAS Country Assistance Strategy CIDA Canadian International Development Agency CSA Central Statistical Agency DCT Donor Coordination Team DFID DPPA DRF
UK Department for International Development Disaster Prevention an Preparedness Agency Drought Risk Financing
DRMFSS Disaster Risk Management and Food Security Sector DS Direct Support DWG Donor Working Group EC European Commission EFY Ethiopian Fiscal Year EKN Embassy of the Kingdom of the Netherlands ERR Economic Rate of Return ESMF Environmental and Social Management Framework FIC Federal Information Center FM FSCB
Financial Management Food Security Coordination Bureau
FSCD Food Security Coordination Directorate FSP Food Security Program GDP Gross Domestic Product GoE Government of Ethiopia HABP Household Asset Building Program HIV/AIDS IC
Human Immunodeficiency Virus/Acquired Immunodeficiency Syndrome Information Centre
ICR Implementation Completion Report IDA International Development Association IFPRI International Food Policy Research Institute IFR Interim Financial Report

IPM Integrated Pest Management ISR Implementation Status Report JCC Joint Coordination Committee JRIS Joint Review and Implementation Support KAC Kebele Appeals Committee KFSTF Kebele Food Security Task Force MDG Millennium Development Goals MDTF Multi Donor Trust Fund MOLSA Ministry of Labor and Social Affairs M&E Monitoring and Evaluation MOARD Ministry of Agriculture and Rural Development MOFED Ministry of Finance and Economic Development MOU Memorandum of Understanding NGO Non-Governmental Organization NRMD OFSP
Natural Resource Management Directorate Other Food Security Program
PASDEP Program for Accelerated and Sustained Development to End Poverty PASS Automated Payroll and Attendance Sheet System PDO Project Development Objective PPA Public Procurement Agency PIM Program Implementation Manual PSNP PW
Productive Safety Net Program Public Works
PWCU Public Works Coordination Unit PWFU Public Works Focal Units PWIA Public Works Impact Assessment RRM RRT
Rapid Response Mechanism Rapid Response Team
SIDA Swedish International Development Cooperation Agency SNNP Southern Nations and Nationalities People SWC Soil and Water Conservation TA Technical Assistance TLU Tropical Livestock Units UN United Nations USAID United States Agency for International Development USD United States Dollar WFP World Food Program
Vice President: Obiageli K. Ezekwesili
Country Director: Kenichi Ohashi
Sector Manager: Lynne D. Sherburne-Benz
Project Team Leader: Wolter Soer
ICR Team Leader: Wolter Soer/William Wiseman

ETHIOPIA
PRODUCTIVE SAFEY NETS PROJECT (APL II)
TABLE OF CONTENTS
Data Sheet A. Basic Information B. Key Dates C. Ratings Summary D. Sector and Theme Codes E. Bank Staff F. Results Framework Analysis G. Ratings of Project Performance in ISRs H. Restructuring I. Disbursement Graph
1. Project Context, Development Objectives and Design ............................................................. 12. Key Factors Affecting Implementation and Outcomes ............................................................. 43. Assessment of Outcomes ........................................................................................................ 114. Assessment of Risk to Development Outcome ....................................................................... 185. Assessment of Bank and Borrower Performance .................................................................... 196. Lessons Learned ...................................................................................................................... 237. Comments on Issues Raised by Borrower/Implementing Agencies/Partners ......................... 25Annex 1. Project Costs and Financing ........................................................................................ 26Annex 2. Outputs by Component ................................................................................................ 27Annex 3. Economic and Financial Analysis ............................................................................... 31Annex 4. Bank Lending and Implementation Support/Supervision Processes ........................... 34Annex 5. PSNP Monitoring and Evaluation Instruments and Impact Evaluation Findings........ 36Annex 6. Summary of Borrower's ICR and/or Comments on Draft ICR .................................... 40Annex 7. Comments of Cofinanciers and Other Partners/Stakeholders...................................... 58Annex 8. List of Supporting Documents ..................................................................................... 60 MAP IBRD 37166R .................................................................................................................... 66

i
A. Basic Information
Country: Ethiopia Project Name: Productive Safety Nets APL II
Project ID: P098093 L/C/TF Number(s): IDA-H2660,IDA-H4380,TF-58248,TF-95296
ICR Date: 12/20/2010 ICR Type: Core ICR
Lending Instrument: APL Borrower: REPUBLIC OF ETHIOPIA
Original Total Commitment:
USD 175.0M Disbursed Amount: USD 207.9M
Revised Amount: USD 200.0M
Environmental Category: B
Implementing Agencies: Food Security Coordination Directorate, Ministry of Agriculture and Rural Development (formerly: Food Security Coordination Bureau)
Cofinanciers and Other External Partners: Canadian International Development Agency (CIDA), DfID, European Union, Embassy of the Kingdom of Netherlands (EKN), Irish Aid, Swedish International Development Agency, US Agency for International Development, World Food Program B. Key Dates
Process Date Process Original Date Revised / Actual
Date(s)
Concept Review: 08/08/2006 Effectiveness: 04/05/2007 04/05/2007
Appraisal: 11/16/2006 Restructuring(s):
Approval: 01/09/2007 Mid-term Review: 09/30/2008 10/06/2008
Closing: 06/30/2010 06/30/2010 C. Ratings Summary C.1 Performance Rating by ICR
Outcomes: Satisfactory
Risk to Development Outcome: Negligible to low
Bank Performance: Satisfactory
Borrower Performance: Satisfactory
C.2 Detailed Ratings of Bank and Borrower Performance (by ICR) Bank Ratings Borrower Ratings
Quality at Entry: Satisfactory Government: Satisfactory Quality of Supervision: Highly Satisfactory Implementing Moderately Satisfactory

ii
Agency/Agencies: Overall Bank Performance:
Satisfactory Overall Borrower Performance:
Satisfactory
C.3 Quality at Entry and Implementation Performance Indicators
Implementation Performance
Indicators QAG Assessments
(if any) Rating
Potential Problem Project at any time (Yes/No):
No Quality at Entry (QEA):
None
Problem Project at any time (Yes/No):
No Quality of Supervision (QSA):
None
DO rating before Closing/Inactive status:
Satisfactory
D. Sector and Theme Codes
Original Actual
Sector Code (as % of total Bank financing)
Central government administration 1 1
Other social services 98 98
Sub-national government administration 1 1
Theme Code (as % of total Bank financing)
Nutrition and food security 29 29
Other social development 14 14
Participation and civic engagement 14 14
Social safety nets 29 29
Vulnerability assessment and monitoring 14 14 E. Bank Staff
Positions At ICR At Approval
Vice President: Obiageli Ezekwesili Hartwig Schafer (Acting)
Country Director: Kenichi Ohashi Ishac Diwan
Sector Manager: Lynne D. Sherburne-Benz Laura Frigenti
Project Team Leader: Wolter Soer Trina S. Haque/William Wiseman
ICR Team Leader: Wolter Soer/ William Wiseman
ICR Primary Author: Julie Van Domelen
iii
F. Results Framework Analysis
Project Development Objectives (from Project Appraisal Document) The objective of the proposed PSNP APL II is to continue to improve the efficiency, effectiveness and fairness of the program in terms of ensuring; (i) timely, well-targeted transfers, (ii) the quality and environmental impact of the public works, (iii) the complementarity between the PSNP and other food security interventions, (iv) the local accountability dimensions of the program, and (v) Ethiopia's ability to respond to drought. Revised Project Development Objectives (as approved by original approving authority) (a) PDO Indicator(s)
Indicator Baseline
Value
Original Target Values (from approval
documents)
Formally Revised Target
Values
Actual Value Achieved at Completion or Target
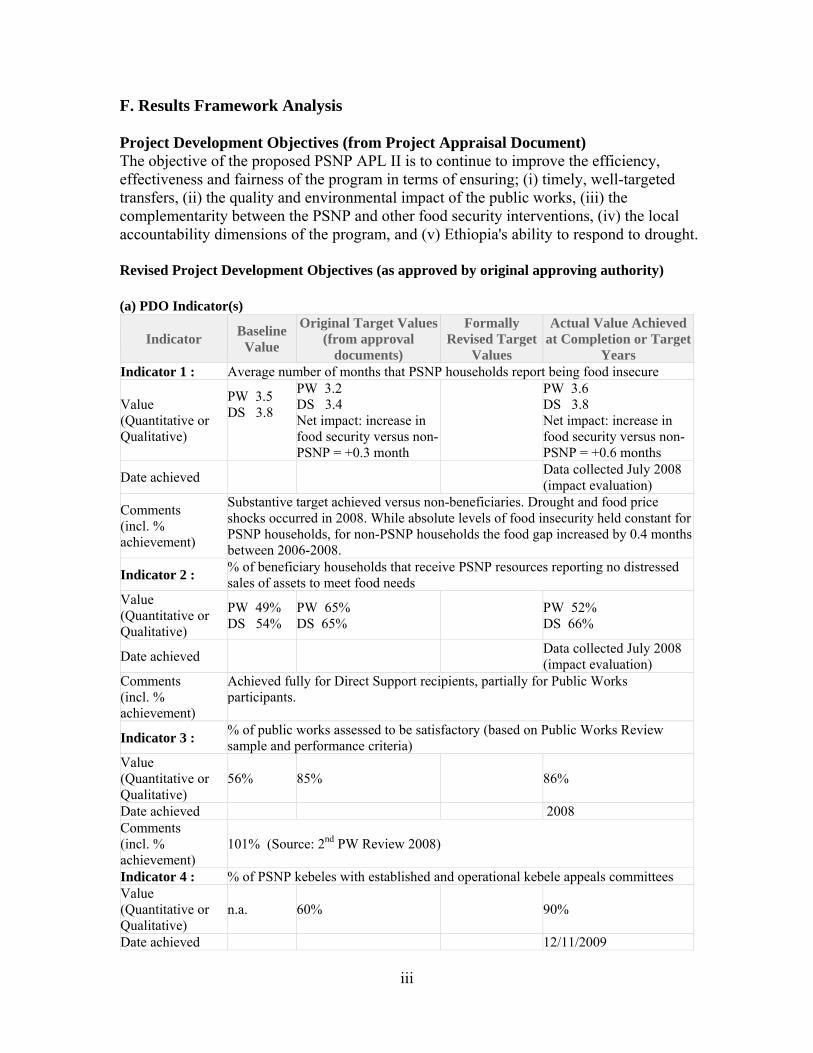
Years Indicator 1 : Average number of months that PSNP households report being food insecure
Value (Quantitative or Qualitative)
PW 3.5 DS 3.8
PW 3.2 DS 3.4 Net impact: increase in food security versus non-PSNP = +0.3 month
PW 3.6 DS 3.8 Net impact: increase in food security versus non-PSNP = +0.6 months
Date achieved Data collected July 2008 (impact evaluation)
Comments (incl. % achievement)
Substantive target achieved versus non-beneficiaries. Drought and food price shocks occurred in 2008. While absolute levels of food insecurity held constant for PSNP households, for non-PSNP households the food gap increased by 0.4 months between 2006-2008.
Indicator 2 : % of beneficiary households that receive PSNP resources reporting no distressed sales of assets to meet food needs
Value (Quantitative or Qualitative)
PW 49% DS 54%
PW 65% DS 65%
PW 52% DS 66%
Date achieved Data collected July 2008 (impact evaluation)
Comments (incl. % achievement)
Achieved fully for Direct Support recipients, partially for Public Works participants.
Indicator 3 : % of public works assessed to be satisfactory (based on Public Works Review sample and performance criteria)
Value (Quantitative or Qualitative)
56% 85% 86%
Date achieved 2008 Comments (incl. % achievement)
101% (Source: 2nd PW Review 2008)
Indicator 4 : % of PSNP kebeles with established and operational kebele appeals committees Value (Quantitative or Qualitative)
n.a. 60% 90%
Date achieved 12/11/2009

iv
Comments (incl. % achievement)
150% (Source: 2009 Roving Appeals Audit)
Indicator 5 :
% of households reporting direct benefit from community assets
Value (Quantitative or Qualitative)
PW 71% DS 48%
PW 85% DS 65%
PW 86% DS 67%
Date achieved Data collected July 2008 (impact evaluation)
Comments (incl. % achievement)
Achieved. PW = 101% ; DS = 103%
Indicator 6 : % of Other Food Security Program (OFSP) beneficiaries who also receive the PSNP
Value (Quantitative or Qualitative)
PW 67% DS 4% MTR reports baseline as PW – 46%
DS – 9%
PW 80% DS 20%
PW 50% DS 11%
Date achieved 6/10/2009
Comments (incl. % achievement)
Not achieved. Overall access to OFSP increased from 26% of surveyed households in 2006 to 36% in 2008, with a corresponding increase in PSNP beneficiaries being covered by OFSP. However, increase in OFSP beneficiaries was stronger among non-PSNP households, resulting in the falling relative percentages for PSNP beneficiaries out of the total OFSP recipients.
(b) Intermediate Outcome Indicator(s)
Indicator Baseline
Value
Original Target Values (from approval
documents)
Formally Revised Target
Values
Actual Value Achieved at Completion or Target
Years Component 1: Safety Net Grants Indicator 1 : % of program woredas completing 80% of cash distributions by end of July Value (Quantitative or Qualitative)
39% 70% 86%
Date achieved 12/11/2009 Comments (incl. % achievement)
Achieved – 123%
Indicator 2 : % of program woredas using 80% of capital and management/administrative budgets by end July
Value (Quantitative or Qualitative)
64% 80% 75%
Date achieved 6/30/2009

v
Comments (incl. % achievement)
94% ( final results affected slightly by results in the pastoral pilot woredas which were operating for the first time and in low capacity environments)
Indicator 3 : % of public works for which an ongoing management and maintenance mechanism has been established (based on Public Works Review sample and performance criteria)
Value (Quantitative or Qualitative)
0 50% 93%
Date achieved 2008 Comments (incl. % achievement)
Achieved – 186% (source: 2008 PW Review; 2009 data not collected)
Indicator 4 : % of program kebeles that have prepared and drawn on integrated community watershed management plans for public works activities
Value (Quantitative or Qualitative)
n.a. 65% 95%
Date achieved 2009 Comments (incl. % achievement)
Achieved – 146% (source: 2009 PW Planning Review)
Indicator 5 :
Program kebeles have information available and publicly displayed on program objectives, targeting criteria, appeals/grievance procedures
Value (Quantitative or Qualitative)
n.a 85% 77%
Date achieved 4/2010
Comments (incl. % achievement)
91% - partially achieved. Based on reporting by the Information Center on a sample of 81 woredas queried on the display of the PSNP posters (the posters provide information on program objectives, targeting criteria, appeals/grievance procedures, etc.)
Indicator 6 : Pastoral program piloted and assessed Value (Quantitative or Qualitative)
n.a. n.a. Pilot in 18 woredas completed, assessment carried out.
Date achieved Comments (incl. % achievement)
Achieved.
Component 2: Drought Risk Financing (given contingent nature of component, no intermediate outcome indicators defined) Component 3: Institutional Support
Indicator 7 : % of program woredas that are reporting to the Information Center fully and in a timely manner (annual average)
Value (Quantitative or Qualitative)
86% 90% 93%
Date achieved 2009 Comments (incl. % achievement)
Achieved - 103% (source 2009 Information Centre reports)

vi
Indicator 8 : % of federal and regional Rapid Response Teams (RRTs)that undertake regular visits to PSNP sites per year
Value (Quantitative or Qualitative)
Fed. RRT – 4 visits Reg. RRTs – 4 visits
Fed. RRT – 4 visits Reg. RRTs – 8 visits
Fed. RRT – 3 Reg. RRT – 3 on avg per year per region
Date achieved 2009
Comments (incl. % achievement)
Not achieved. 75% Fed. RRT; 38% Reg. RRT. More frequent RRT visits proved to be logistically challenging given the large number of participants from different agencies. RRTs are more effectively used as a monitoring instrument at the federal level. Regions have other regular monitoring mechanisms which also fulfill the functions of RRT.
Indicator 9 : Cumulative % of institutional support funds spent over the project’s 3 year implementation period (eg administration/management budget, and capacity building budget)
Value (Quantitative or Qualitative)
n.a. 80% 78%
Date achieved 12/2009 Comments (incl. % achievement)
Achieved. Some undercounting of institutional support expenditures as does not capture donors direct funding of TA.
G. Ratings of Project Performance in ISRs
No. Date ISR Archived
DO IP Actual
Disbursements (USD millions)
1 05/17/2007 Satisfactory Satisfactory 0.00 2 06/14/2007 Satisfactory Satisfactory 50.00 3 11/05/2007 Satisfactory Satisfactory 50.00 4 06/18/2008 Satisfactory Satisfactory 100.00 5 12/23/2008 Satisfactory Satisfactory 170.00 6 06/22/2009 Satisfactory Satisfactory 207.90 7 02/09/2010 Satisfactory Satisfactory 207.90
H. Restructuring (if any) Not Applicable

vii
I. Disbursement Profile

1
1. Project Context, Development Objectives and Design
1.1 Context at Appraisal 1. Chronic food insecurity has been a defining feature of rural poverty and vulnerability in Ethiopia. For over 30 years, the main response to drought has been emergency food aid. Over time, concerns arose about limitations of the emergency response to maintain a reliable safety net and develop more productive assets. By the early 2000s, a consensus emerged on the need to reform the emergency appeal system in favor of a more comprehensive approach to food security. Government, donors and civil society formed a New Coalition for Food Security and developed the Food Security Program (FSP) with three components: (i) resettling households from environmentally-degraded lands; (ii) a safety net for the chronically food insecure; and (iii) a package of agricultural and financial services to promote graduation out of food insecurity.
2. In 2005, the Government launched the Productive Safety Net Program (PSNP) for chronically food insecure households in historically food insecure rural woredas (districts) and kebeles (wards). The transition from emergency response to a more stable and predictable safety net sought the timely provision of adequate food and/or cash transfers to smooth consumption and avoid asset depletion; and the creation of productive and sustainable community assets that contribute to environmental rehabilitation, increased household productivity and improved access to infrastructure and services.
3. The first two phases of the PSNP were identified at the outset as: Phase I (2005-2006) to support the transition from the annual emergency appeal
system based on food transfers to a multi-annual predictable approach with the introduction of cash transfers. The bulk of transfers would be channeled as payments for labor on community-identified public works (PW), with a smaller portion retained as direct support transfers to the most vulnerable households. Phase I focused on testing and strengthening institutional arrangements and delivery systems.
Phase II (2007-2009) as a consolidation phase that would continue to strengthen technical capacity in all aspects of program implementation.
After the completion of Phase I, the need for a third phase was identified (2010-2014) to better integrate all activities under the Food Security Policy in order to accelerate households’ graduation out of chronic food insecurity. The formulation of the third phase was completed in 2009.
4. In a coordinated approach with several other major donors, the World Bank supported the initial start-up phase (2005-2006) through APL I, reaching 5 million beneficiaries in the first year and 7.2 million in the second. Despite some difficulties in implementation given the scale, complexity and use of Government systems, the first phase of PSNP was judged satisfactory in achieving its development objectives.
5. The context at appraisal of APL II confirmed that the rationale for Bank involvement remained strong. The Government reiterated its commitment to the PSNP, as reflected in the PSNP being a core component of the five year Program for Accelerated and Sustained Development to End Poverty (PASDEP) approved in 2006.

2
The World Bank’s Ethiopia Interim Country Assistance Strategy (May 2006) highlighted the PSNP as a central component for Bank support. The PSNP was also consistent with the rural growth agenda of the World Bank’s Africa Action Plan through its contributions to increasing infrastructure and reviving degraded lands as well as the local market stimulus expected from the shift to cash payments. The role of the World Bank was crucial, bringing in global experience and innovations in safety net design and environmental rehabilitation, as well leveraging other partners’ financing and facilitating donor coordination.
1.2 Original Project Development Objectives (PDO) and Key Indicators (as approved) 6. As stated in the APL II Project Appraisal Document (Section B.2), the development objective of the overall PSNP series is to contribute to reducing household vulnerability and improving resilience to shocks. This will be achieved through reform of the humanitarian emergency system to a development-oriented program. As cited in the Project Appraisal Document (Section B.3.1), the specific development objective of the PSNP APL II Project is “to continue to improve the efficiency, effectiveness and fairness of the program in terms of (i) ensuring timely, well-targeted transfers, (ii) the quality and environmental impact of the public works, (iii) complementarity between the PSNP and other food security interventions, (iv) local accountability dimensions of the program; and (v) Ethiopia’s ability to respond to drought.” 1
7. The following key PDO indicators were specified: a) the average number of months that PSNP households report being food insecure; b) % of beneficiary households that receive PSNP resources reporting no distress
sales of assets to meet food; c) % of public works assessed to be satisfactory; d) % of PSNP kebeles with established and operational kebele appeals committees; e) % of households reporting direct benefit from community assets; and f) % of Other Food Security Program (OFSP) beneficiaries who also receive the
PSNP.
1.3 Revised PDO (as approved by original approving authority) and Key Indicators, and reasons/justification 8. PDO was not revised.
1 The project development objective as stated in the Financing Agreement picked up the broader development objectives of the PSNP APL series: “the objective of the Project is to support the Recipient’s efforts under the PSNP Program to consolidate its transition away from reliance on relief-oriented assistance and to strengthen its initiatives in support of a development-oriented productive safety net.”

3
1.4 Main Beneficiaries 9. The main beneficiaries of the PSNP are food insecure households, defined primarily as households that have faced a 3 month food gap or more, located in the historically food insecure woredas of rural Ethiopia. At appraisal, the chronically food insecure caseload was estimated at up to 8 million people. An additional number of transient food insecure households would be covered in the case of shocks within PSNP woredas using a contingent risk financing mechanism. In addition, communities in one-third of rural woredas would benefit from basic infrastructure and environmental rehabilitation.
1.5 Original Components (as approved) Component 1: Safety Net Grants (total $838.5 million, of which IDA $145.0 million). 10. Labor-Intensive Public Works (PW) entail safety net transfers to households whose adults participate in public works sub-projects. Sub-projects are determined locally through an annual participatory planning process based on integrated watershed management guidelines and timed to create temporary employment during the agricultural lean season. PW household members may work up to 5 days per month.
11. Direct Support (DS) safety net transfers are provided to eligible households who cannot undertake public works. Target beneficiaries include orphans, pregnant and lactating women, elderly, HIV/AIDS affected, and female-headed households with young children.
12. A combined administrative and community targeting system is applied in the selection of eligible participants, as outlined in the targeting guidelines of the Program Implementation Manual. General criteria (e.g., households having at least 3 months of food insecurity over the last three years, households more recently made food insecure as a result of shocks, etc.) are applied by Community Food Security Task Forces, supplemented by local criteria for further refining the selection (e.g. household assets, support from family members etc.). Transfers for both PW and DS participants are provided for six months in the form of cash and/or food and equivalent to 3 kg of cereal or a cash amount which, at the outset of PSNP APL II, was set at 6 birr per day. Component 2: Drought Risk Financing (total $25million, of which IDA $25 million) 13. Drought Risk Financing (DRF) was an innovation in APL II to make the safety net more responsive to shocks. The DRF would put resources in place up-front to be used in the case of the onset of drought in PSNP woredas, providing an early response when needs surpassed the ability of existing program resources to address. The component would develop a rainfall-based index to empirically trigger and scale disbursements. Financing would be channeled using existing PSNP systems based on woreda contingency plans.

4
Component 3: Institutional Support (total $51.8 million, of which IDA $5.0 million) 14. This component supported institutional strengthening activities in three main areas:
a) Program management costs, capacity building and training to ensure availability of staff and other resources and training in PSNP procedures and other operational areas.
b) Monitoring and evaluation, including (i) technical supervision of public works, (ii) implementation of the computerized payroll system (PASS) in all PSNP woredas, (iii) roving audits of financial management, procurement and the appeals processes, (iv) intensification of the rapid response teams set up in APL I, (iv) studies and surveys, including a robust impact evaluation, and (v) design of DRF’s weather indexation.
c) Transparency and accountability initiatives to disseminate information on objectives and procedures among stakeholders, public posting of information, development of a PSNP website, a beneficiary assessment and design of a client card system.
1.6 Revised Components
N/A 1.7 Other significant changes
15. Additional financing of an IDA grant of US$25 million was approved on December 10, 2008 through the Ethiopia Food Crisis Response Program Project to enable the Government to maintain adequate coverage of the PSNP in 2009, thereby ensuring that the project development objectives of the PSNP could be met in a context of rapidly rising international food prices.
2. Key Factors Affecting Implementation and Outcomes
2.1 Project Preparation, Design and Quality at Entry
16. Design and appraisal of APL II was based on a strong analytical base, including extensive surveys and studies that served to evaluate APL I and unify Government and donor understanding of program performance and challenges to be addressed in Phase II (see Annex 8 ).
17. Key lessons learned and issues to be addressed were: a) Scalability of the safety net. APL II preparation developed greater clarity on the
distinction between the chronic and transient caseloads and contingency versus emergency appeals, including the identification of the drought risk financing mechanism to address larger shocks. A condition of disbursement was placed on presentation of an operational manual of the DRF.

5
b) Use of Government systems. While using existing Government channels and structures for implementation was consistent with longer-term public sector management objectives, reliance solely on existing civil service staff was insufficient to address capacity constraints. APL II foresaw greater recourse to contracted staff.
c) Flexibility in the choice between cash and food transfers. Experience revealed that cash and food transfers met different needs at different times of the year. Design of APL II sought greater flexibility in resource programming between cash and food.
d) Local accountability. A review of targeting performance in APL I found that criteria were generally respected, with no systemic political or ethnic biases in selection of beneficiaries. However, the appeals mechanism could be improved. A condition of effectiveness was placed on reinforcing the appeals system at the local levels.
e) Graduation. Safety net transfers were not intended to be sufficient to ‘graduate’ households out of food insecurity. PSNP APL II emphasized the need for better overlap of OFSP interventions to reinforce the path out of food insecurity.
f) Donor coordination. Means to strengthen the multi-donor framework developed in APL I were identified. Coordinated semi-annual project reviews were placed as dated covenants of the project and the Donor Coordination Unit was reinforced.
18. Two program risks were rated as ‘substantial’ at appraisal. First, there was concern over the ability of donors to commit funding for a program level over 7 million beneficiaries. During preparation, additional efforts were made to increase donor commitments. Funding for the first two years of APL II was confirmed prior to appraisal. Second, the limited capacity of the regional and woreda levels was acknowledged as a constraint to PSNP effectiveness. In response, the Project Implementation Manual was revised to clarify roles and better align the PSNP with woreda planning and budget cycles. The rapid response mechanism to address implementation problems was reinforced. And, to upgrade the quality of public works, a condition of effectiveness was placed on the establishment of Public Works Focal Units at regional and federal levels.
19. A Financial Management Assessment was done during appraisal. The main strength identified was the avoidance of setting up parallel systems. Some weaknesses identified include delays in reporting, shortage of qualified accountants and auditors, limited focus on internal audit, and delayed staffing of the external audit function.
20. All preparation and appraisal activities were carried out through the broader consortium of donors supporting PSNP. The PSNP APL II PAD became the de facto reference document for the overall program 2007-2009. The project was approved by the Board on December 11, 2006 and became effective April 11, 2007.
2.2 Implementation
21. Despite challenges of scale, capacity and external shocks, implementation progress during the three year APL II period was consistently rated as satisfactory.
22. Several factors contributed to successful implementation: a) Donor engagement and coordination was critical to effective implementation. The
PSNP Donor Working Group (DWG) continued to rotate the chair to ensure broad donor buy-in. Joint donor-Government thematic groups were formed to review

6
technical issues in greater depth, focusing on M & E, food and financial management, public works, pastoral development, communications, social development, capacity building and contingency financing. A Joint Coordination Committee between the Government and donors met on a bi-weekly basis to discuss implementation issues. The Donor Coordination Team (DCT) was established at the outset of APL II to serve as a technical secretariat for the agencies involved in PSNP. The DCT facilitates all aspects of donor/donor and donor/Government relations, including project supervision, studies and evaluations. The DCT helped donor agencies find consensus and provided continuity as donor representatives changed. This innovative coordination model reduced the transaction costs of dealing with many agencies.
b) Investments in staffing and technical assistance. The capacity constraints noted in APL I were addressed more aggressively in APL II. Over forty staff, both permanent and contract staff, were involved during APLII to support PSNP implementation at the federal level, including specialists in communications, social issues, and procurement. Some of the technical assistance at federal level was supported by CIDA and the EC. Specialists were also contracted at the woreda level, including finalization of the recruitment of some 760 accountants and cashiers. Training efforts at the woreda level centered on participatory watershed management, financial management, general project guidelines and procedures, M & E, environmental safeguards, and guidance on graduation from PSNP (see Annex 2 for details). Despite these investments, the overall instability of staff in the Ethiopian public sector continued to hamper implementation during the APL II period.
c) Several new systems or program areas were designed or implemented during APL II: (i) an automated Payroll and Attendance Sheet System (PASS) was designed and introduced during APLII and caseload management was improved through the unification of the public works and the direct support beneficiary lists. Client cards were designed and introduced towards the end of APL II which will further improve caseload management under APL III; (ii) the Drought Risk Financing (DRF) mechanism was activated in 2008 and 2009, extending payments to 4.4 million and 6.4 million PSNP beneficiaries, respectively; and (iii) a pastoral pilot was developed, albeit with delays, to tailor PSNP to the specificities of pastoral areas. The pilot was initiated in the final year of APL II in 18 woredas, of which 9 were NGO-supported, reaching 399,000 pastoralists.
23. Implementation of APL II was affected by factors exogenous to the program, most notably, the dramatic increases in world food and fuel prices in 2008. The situation was exacerbated by drought that same year from failure of seasonal rains. Food price inflation peaked at 91.7% for the 12 months ending July 2008, giving Ethiopia one of the highest food price inflation rates in the world. This tested the robustness of the PSNP in operating in a crisis context, with increased caseloads triggering the use of the DRF mechanism in 2008 and 2009. The severity of the shock required additional financing through the DRF, which was approved by the Bank as well as from other donors. Due to increases in basic food prices, the purchasing power of cash transfers declined. As a result, the daily wage rate was adjusted from 6 birr to 8 birr in 2008 and 10 birr in 2009. In addition, PSNP adjusted by decreasing the cash-food split from 74% cash in 2005 to 48% cash in 2008.

7
24. Further reforms to the targeting system were adopted during APLII. Steps were taken to improve the transparency and accountability of the targeting system by, most importantly, creating an appeals system that was independent from the targeting system. A 2008 study found that examples of dilution among households had significantly reduced, as had reports of exclusion of family members. However, the introduction of full family targeting principle everywhere remained a challenge throughout the APLII period.
25. A Mid-Term Review was carried out in October 2008. Based on the findings of the review, overall progress in meeting program objectives was satisfactory. Financial management and procurement continued to raise implementation challenges largely due to the complexity of a multi-donor program implemented using national systems. The MTR noted delays in the Natural Resource Management Directorate (NRMD) assuming more complete responsibility of the PW component and challenges in aligning PSNP with the Government’s overall Business Process Re-engineering (BPR) exercise. The MTR required that the PSNP MOU and PIM be revised to clarify the roles and responsibilities of all stakeholders in the new governmental structure. Despite improvement in timeliness of transfers, remaining bottlenecks were identified and remedies proposed. Concern over effective oversight of public works implementation was raised, with observations about quality issues in certain sub-sectors as well as delays in implementing an effective database on PW sub-projects. The MTR called for a Public Works Focal Unit to be re-established to manage PW activities in each region to reinforce technical quality and oversight. The MTR also recommended a more empirical measure be developed to guide graduation out of PSNP, which was subsequently undertaken.
2.3 Monitoring and Evaluation (M&E) Design, Implementation and Utilization 26. The PSNP monitoring and evaluation framework built on the strong performance under APL I and was comprised of the following activities (Annex 5):
a) Routine monitoring data collected regularly through Government systems based on a series of standard reporting formats on transfers, public works and financial flows.
b) Information Center (IC) reports: The IC was established within the Food Security Coordination Bureau (FSCB) during PSNP I to monitor humanitarian risk by collecting real-time data every other week from a sample of woredas on the status of transfers and food prices.
c) The Rapid Response Mechanism (RRM), consisting of teams from Federal and Regional levels, was reinforced in APL II.
d) Annual assessments and audits including roving audits of financial management, procurement and the appeals mechanism, reviews of a sample of completed public works sub-projects, and purchasing power studies to set the wage rate for transfers.
e) Impact and other evaluation studies. Given the flagship nature of the PSNP, much attention has been devoted to generating robust data on outcomes. A set of impact and other outcome evaluations include, among others, a regionally representative household survey carried out every two years. The baseline for the impact evaluation was completed in 2006 under APL I and the follow-up done in 2008. The scheduling of the impact evaluation allows for findings to be available as input to the design of

8
the next phase. The ongoing 2010 impact evaluation is scheduled to be completed by April 2011.
27. The PSNP M&E framework was effectively carried out during implementation, providing a robust empirical basis which served to make ongoing adjustments to the program as well as evaluate achievement of development objectives. Annex 2 provides a list of technical studies and evaluations carried out during APL II. The magnitude of the evaluation effort reflects the high profile and flagship nature of the PSNP. The impact evaluation results from 2008 were critical to adjustments made in the design of APL III. 28. Routine monitoring was more of a challenge with PSNP due to both the scale and complexity of the program and reliance on regular government reporting channels between levels of government. In addition, reporting on public works outputs was hampered by lack of consistent definitions for outputs. This has, for instance, resulted in not adequately capturing the outcomes of the significant watershed management activities of the program.
2.4 Safeguard and Fiduciary Compliance 29. Safeguard Compliance: Deficiencies in application of the Environmental and Social Management Framework (ESMF) identified during APL I were partially addressed during APL II. Six thousand local level development agents were trained in ESMF implementation. Screening checklists in local languages were made available. Donor-financed technical advisors were added to improve capacity of the regional PW Focal Units to manage the M&E and ESMF screening of the PW activities. Field visits confirmed that in most cases the ESMF screening checklists were available. However, despite the provision of materials and training, supervision in 2008 and 2009 continued to find deficiencies in the application of screening criteria. In 2009, only one-third of the sub-project ESMF screening forms examined had been completed to the required standards by the development agents2. This was exacerbated by continued staff turnover at the woreda level. Despite these procedural shortcomings, environmental reviews found that on the whole PSNP sub-projects had significant positive environmental impacts.
30. Fiduciary Compliance: Substantial improvements to the financial management system of the PSNP have been made since the first phase. Most notably, PSNP financial management migrated to full integration with Government budgeting, disbursement and reporting systems under the direct control of the Ministry of Finance. Financial reviews found significant improvements in the timely delivery of financial audit reports and a general lowering of financial risk during APL II.
31. There were consistent efforts to improve financial management, including:
2 To improve the rate and quality of ESMF implementation, specific attention was paid to the ESMF training material and screening procedures during the 2010 community based watershed management training for staff involved in the implementation of PW activities at woreda level.

9
a) Establishment of a new ‘Channel 1 Coordination Unit’ to help facilitate financial management for all donor projects fully integrated into the Government system;
b) Around 760 accountants and cashiers were contracted at the woreda level and beneficiary registries were automated;
c) Necessary equipment was provided to mitigate fiduciary risk. For example, safes were purchased for all PSNP woredas;
d) Government and donors established the joint Financial Management Task Force (FMTF) to better follow-up on Financial Management (FM) issues;
e) MOFED prepared detailed action plans covering the recommendations and comments of all audits (both Roving and Financial Audits) from 2007 – 2009. From 2010 onwards the Roving and Financial Audits will be combined and the auditor will carry out interim audits on a quarterly basis following the audit plan that is designed at planning stage of the audit. These interim audits are an integral part of the annual auditing process.
f) In 2009, the audit function was expanded to consider food resources in order to apply the same accountability criteria to both cash and food transfers.
32. Nonetheless, there were ongoing challenges in financial management largely stemming from the implementation of such a large-scale, complex program using national fiduciary systems. A lack of annual budget detail from the project at regional, zonal and woreda level weakened budget monitoring at all levels. A manual accounting system was used to record transactions and in most woredas for reporting which contributed to chronic delay in reporting between levels, leading to delays in providing acceptable IFR reports to the Bank. Regular government internal control procedures were used with strengths noted in the areas of payment authorization and segregation of duties. However, internal audit oversight was weak. This is not unique to this particular project but is rather a systemic weakness of the internal audit function affecting most Bank projects in Ethiopia. Also outside of PSNP control, issues with liquidity of regional banks meant that shortages of cash delayed payments and further complicated FM. 33. Audit reports were submitted to the Bank with delays for the years 2006 and 2007 (PSNP I) but improved for the years of 2008 and 2009 (PSNP II). The audit reports were mostly qualified due to internal control weaknesses. Audits found issues (e.g., purchase of some ineligible items) which pointed to repetitive systemic problems, but no indication of systematic corruption. During the last quarter of APL II, ineligible expenditures were found in one region (for example funds used for more capital-intensive public works in some woredas) and refunded back to the project. The Implementation Status Report (ISR) rating for Financial Management (FM) of the project was rated as moderately satisfactory throughout implementation but downgraded to moderately unsatisfactory at closing due to slower overall improvement then desired and the persistence of problems.
34. Procurement also had some shortcomings. The 2008 Post Procurement Review identified several problems with procurement processes and delays in putting in place Regional Procurement Coordinators. Regular procurement audits were added to more closely monitor decentralized actors compliance with procurement guidelines.

10
2.5 Post-completion Operation/Next Phase Sustainability of the investments financed by APL II:
35. Sustainability of public infrastructure has been a challenge for programs throughout Ethiopia. Ex-post evaluations of sub-project sustainability have generally been favorable and indicators have shown improvement over the APL II period. By sub-project type, soil and water conservation sub-projects, the largest area of the PSNP portfolio, were rated as 95 percent sustainable (using environmental, social technical, managerial and O & M resource availability criteria). Social facilities and agricultural activities also received high ratings. Ratings were lower for roads (64 percent) and water projects (50-56 percent) which may limit the medium-term impact of these sub-projects.
Sustainability of reforms and institutional capacity:
36. Government commitment to the PSNP has been high. Institutional sustainability is likely given that the PSNP is well-embedded in national fiduciary and local planning systems, rather than project-based implementation structures. The policy reforms in food security established at the outset of PSNP remain widely accepted by both the Government and donors. PSNP continues to play an important role in implementing the country’s broader policy agenda in agricultural growth, disaster risk management and social protection. In 2009, the Government revised its Food Security Policy for 2010-2014 confirming the main components of resettlement, the PSNP, and the household asset building program (HABP) of credit and technical inputs, as well as introducing a complementary community investment program (CCI) to support a broader array of basic infrastructure. In addition, Ethiopia endorsed the Social Policy Framework for Africa in 2009, which reinforces the country’s commitment to develop and operationalize national plans for social protection, including safety nets
Medium-term sustainability of funding for the PSNP/Follow-up Operation:
37. All of the original donors of the PSNP have continued to support the program and several new ones have joined. Donors have confirmed their commitment to supporting the next phase, with an overall PSNP program cost for 2010-2014 of US$2.256 billion, including US$160 million for drought risk financing if needed. Objectives of the next phase focus on: (i) strengthening the monitoring system to ensure a regular flow of data to program managers; (ii) adopting a more strategic approach to capacity building; (iii) reinforcing accountability and transparency measures at all levels and expanding these to the food management system; and, (iv) increasing the responsiveness of the program to transitory shocks. Greater attention to public works is anticipated to result in more sustainable public works projects and enhanced program impact at community-level. The donors are broadening their support for the Food Security Policy to include financing for the Household Asset Building Program (HABP).
38. Financial commitments have been made thus far totaling 76 percent of the program’s five year needs. On September 25, 2009, the World Bank’s US$480 million Ethiopia Productive Safety Net APL III Project was approved (US$350 million IDA grant and US$130 million IDA credit). The Government will allocate significant

11
resources to finance the credit component of the HABP and other complementary elements of the Food Security Program, at a level of US$160 million for the next three years.
Long-term perspectives on the sustainability of the safety net:
39. In terms of projected need for a safety net, at the outset of the FSP, the Government objective was to graduate 5 million households out of food insecurity within 5 years. This was more of a political aspiration than a realistic appraisal of the ability to eliminate food insecurity within such a short timeframe. In 2007, the Government developed a set of objective, asset-based “benchmarks” that define two levels of graduation: first, from the PSNP when households become food sufficient and second, from the FSP when households become food secure. Over APL II, about 431,380 individuals had met these benchmarks to graduate from the PSNP, though most stay in the program for an additional year because households on the cusp risk quickly eroding their asset base and falling back into the emergency system when shocks occur. Although there is now evidence to suggest that modest graduation levels are achievable in the medium-term, a significant caseload of chronically food insecure will remain.
40. In terms of willingness and ability to finance a longer-term safety net in Ethiopia, spending on safety nets in developing countries averages between 1-2 percent of GDP. The PSNP, as the main safety net in Ethiopia, currently represents about 1.3 percent of GDP. While the level of effort is within the average range, the PSNP is highly dependent on donor financing, reflecting the overall high level of donor dependence (between 30-40 percent of total public spending) at this stage of Ethiopia’s development. Therefore, the PSNP will likely continue to require donor financing even though Government funding of the FSP components overall has increased.
3. Assessment of Outcomes
3.1 Relevance of Objectives, Design and Implementation 41. There is a high degree of Government commitment to and ownership of this program. The PSNP forms a core component of the Government’s poverty reduction strategy, as outlined in the five-year Program for Accelerated and Sustained Development to End Poverty (PASDEP - (2005/06-2009/10). In addition to its role in food security, PSNP is seen as a core part of reaching the MDGs in terms of reduction of extreme hunger and poverty, environmental rehabilitation and agricultural productivity, and harmonization of partnerships. The approach operationalizes the Paris Declaration on Aid Effectiveness.
42. The PSNP is a key component of the World Bank’s April 2, 2008 Country Assistance Strategy (CAS) for Ethiopia (Report No. 43051-ET). The CAS places PSNP as a core part of an integrated national strategy to assist the poorest households graduate from food insecurity in a sustainable manner, protect the vulnerable from exposure to shocks as well as address environmental degradation. Program financing requirements and indicative commitments show that IDA resources are required for the medium-term to help fill the financing gap as well as leverage other development partner contributions.

12
3.2 Achievement of Project Development Objectives 43. The PSNP achieved its basic set of intended outputs. The program reached 7.2 million beneficiaries in 2007, 7.4 million in 2008 and 7.6 million in 20093, with the number of eligible households growing in the face of price and weather shocks. Eighty-three percent of beneficiaries participated in public works and 17 benefitted from direct support. PSNP financed 34,000 public works projects annually. This is the largest safety net in Sub-Saharan Africa. 44. The project’s extensive M & E efforts provided a rich body of evidence in determining achievement of development objectives. Impact evaluation methodology and main findings are summarized and other key evaluation reports are listed in Annex 5.4 Analysis of the basic results chain and achievement of development objectives derived from the outputs detailed in Annex 2 is provided schematically as follows: 45. The overarching development objective of the PSNP series is to transition away from reliance on relief-oriented assistance to a more development-oriented safety net, with improvements evidenced by: a) Increased food security: Key performance indicators: Improvements in the average
number of months that PSNP households report being food insecure was achieved relative to non-beneficiaries even if the drought impacted absolute levels. During APL I (2005-2006), the impact evaluation showed a net increase of 0.23 months of household food security for PSNP participants compared to control groups. This was during a period of relatively robust harvests. During APL II, the target was a continued increase in food security. In absolute terms this did not materialize because of the drought and rise in food prices. However, PSNP was able to fully protect beneficiaries from any worsening of food insecurity, while non-beneficiaries experienced a net increase in the food gap of 0.4 months. Therefore, the impact of PSNP on food security was positive in APL II; Other supporting evidence: Growth in caloric acquisition was 17 percent higher for PSNP households, but only when they received recent and regular transfers. The impact of the PSNP on food security was greatest among households affected by drought, with a 30 percent higher caloric acquisition than non-beneficiaries;
b) Protection and promotion of household assets including human capital: Key performance indicator: even in the face of drought, the occurrence of distressed sale of assets decreased for both DS (which fully reached its target) and PW clients (which
3 The increase of beneficiary numbers is mainly due to the inclusion of the pastoral areas (i.e. Afar and Somali region) into the program. In addition, in 2009 it was agreed to increase the number of beneficiaries in SNNPR and Oromiya to correct for observed exclusion errors.
4 The impact evaluation was carried out in 2008 to provide input into the design of PSNP’s third phase which was done in 2009. This data is the most robust on household and community level impacts and tied to several of the key performance indicators. Several other data sources and evaluations which were carried out closer to the end of APL II are also used to supplement the end of project information.

13
achieved about 20% of its target).5 Among households affected by drought, distress sale of livestock was significantly lower among PSNP households receiving predictable support as compared with non-PSNP households. This suggests that, when implemented as designed, the PSNP protects household assets. Other supporting evidence: Asset holdings increased, with public works participants experiencing a net growth in livestock holdings of 0.28 Tropical Livestock Units (TLU) over comparator households. Again, results were sensitive to program performance. When households that received low levels of transfers were measured, they saw no net increase in holdings; whereas households receiving recent and regular transfers had an increase of 2.6 TLUs. In addition, the Public Works Review found that small-scale irrigation from water sources developed by the PSNP had helped to expand livestock for 4-12 percent of households and increase incomes by 4-25 percent, depending on the region. In addition, the use of social services increased. In 2008, 27 percent of households reported increased use of health facilities over 2007 and almost half attributed this increase to the PSNP. Overall, households’ perceived well-being improved. Households participating in the PSNP perceived themselves to be better off in 2008 as compared with 2006 despite the period of drought in 2008.
46. The achievement of these outcomes is explained by performance of APL II in meeting its more specific development objectives in the areas of efficiency, effectiveness and fairness as follows, per the PDO: a) Ensuring timely, well-targeted transfers was achieved. Intermediate outcome
indicator: the level of program woredas completing 80% of cash distributions by end of July surpassed the target (123% achieved). This achievement was a result of improved capacity at the Ministry of Finance and Economic Development, MOFED, putting in place resources upfront, greater systematization of the payment arrangements and increased administrative personnel at the woreda level. Other supporting evidence: Analysis of targeting confirmed that PSNP is well-targeted to the poorest households, with PSNP beneficiaries having significantly lower incomes, fewer assets, and less farmland than non-beneficiaries.
b) The quality and environmental impact targets for public works were achieved. Key performance indicators: the share of public works assessed as satisfactory rose from a 2006 baseline of 56% to 86% in 2008, reaching the APL II goal. By project type, soil and water conservation (SWC) activities had the highest quality ratings and they comprise the largest share of PSNP projects. And, the share of households reporting direct benefit from community assets were fully met, showing a substantial increase over APL I. Intermediate outcome indicators: (i) the share of public works for which an ongoing management and maintenance mechanism has been established (based on
5 The impact evaluation notes the curious finding that the non-PSNP households showed even larger ‘improvements’ in avoiding the sale of distressed assets even in the face of much worsened food insecurity in non-PSNP households. One observation is on the indicator itself and how ‘distressed’ sale of assets like livestock is interpreted by respondents versus ‘non-distressed’ sales. Due to interpretation difficulties, this indicator was dropped in APL III.

14
PW Review sample and performance criteria) reached 93 percent compared with an end of project target of 50 percent; (ii) to ensure sufficient non-labor inputs and therefore PW quality, the percentage of program woredas using 80 percent of capital and management/administrative budgets by end July achieved 94 percent of the target, with results affected slightly by the pastoral pilot woredas which were operating for the first time in 2009 and in low capacity environments; and (iii) 95 percent of program kebeles prepared and drew on integrated community watershed management plans for public works activities, surpassing the target of 65 percent. Other supporting evidence: Despite shortcomings in systematic environmental screening, PW projects produced significant environmental benefits, including the rehabilitation of over 167,000 hectares of land through area closures, construction of 275,000 kilometers of stone and soil bund embankments, and the planting of almost 900 million seedlings. Ex-post visits to SWC projects found significant increases in wood and herbaceous vegetation cover and a broader diversity of plant species. The increase in vegetation has already had a positive and visible impact on the increased supply of livestock feed, bee forage, and medicinal plants. In addition, overall quality of public works was positively affected by improvements in local participation in the planning process. The impact evaluation confirmed increased involvement by households and local communities in the selection of PW projects, with community participation rates tripling from the baseline. Investments in training in community based watershed management and in capacity building in PW monitoring contributed to these results.
c) Increased complementarity between the PSNP and other food security interventions was partially achieved. One of the goals was to strengthen the linkages between PSNP and OFSP because the combined package increased households’ chances of graduating out of food insecurity. The Government scaled up OFSP during APL II, rising from 26% of surveyed households in 2006 to 36% in 2008. As a result, a greater share of PSNP beneficiaries gained access to OFSP during APL II – almost doubling from 29 percent in 2006 to 56 percent in 2008 - and the synergies between the two programs heightened household level impacts for both programs. Access solely to PW transfers had no effect on output, acreage, productivity or fertilizer use. Neither did access to only OFSP’s packages of inputs and technical assistance. However, there were large impacts on productivity – increases of more than 200 kg/ha – when households had access to both PW transfers and OFSP services. Key performance indicator: The indicator chosen was the relative percentage of OFSP beneficiaries with access to PSNP, which was not achieved because the increase in OFSP beneficiaries was stronger among non-PSNP households despite the improved overlap with PSNP beneficiaries.
d) Local accountability mechanisms were reinforced through the creation of an appeals system that was independent from the targeting system. Key performance indicator: Kebele Appeals Committees (KACs) were established in all areas. A 2009 roving appeals audit confirmed that KACs were operational in 90 percent of PSNP kebeles (versus an end of APL II target of 60 percent) and most KACs had satisfactory representation from different segments in the community. Almost all of the appeals presented were solved in a timely manner at the KAC level. Other supporting evidence found that over 87% of respondents reported that the PSNP selection process is fair. In addition, there are indications that PSNP provides more opportunities for citizen

15
engagement and “voice” than other programs. Of the respondents who reported that they had attended PSNP meetings, 66 percent said that they had never attended meetings for another organization in their neighborhood.
e) Ethiopia’s ability to respond to drought was substantially improved with the introduction and operationalization of the Drought Risk Financing mechanism under APL II. The DRF mechanism was first activated in 2008 following weather shocks and the global rise in food prices. Additional cash payments supported 4.3 million PSNP beneficiaries with extended payments. The DRF was again used in 2009 to provide additional transfers to 6.4 million PSNP participants in response to the failure of seasonal rains. This contributed to stabilization of food security during a significant shock period.
3.3 Efficiency 47. Economic analysis of PSNP is detailed in Annex 3 and summarized as: a) Cost effectiveness of the safety net transfers is high in terms of the overall share of
program resources that actually reach the poor through transfers. This is due to a combination of accurate targeting (little leakage to the non-food insecure), a high labor intensity (on average 80 percent), and relatively low overhead costs. The PSNP compares very favorably with international experience in public works programs.
b) Cost savings are achieved in the shift from food to cash: Given the 2008 cash/food mix, the estimated annual savings to the program of introducing cash payments is over US$21 million, mainly in food transportation and storage cost savings.
c) Public works have positive benefit-cost ratios: The 2008 PW Impact Assessment of completed public works projects in ten sample watersheds found that the average benefit-cost ratios were well over 1 for all types of sub-projects where this analysis can be done, ranging from an average of 1.8 for soil and water conservation sub-projects, 1.8 – 2.2 for health and 3.7 for water sub-projects.
d) Inflationary effects were not observed: Despite concerns that introducing cash payments could spark inflation, a World Bank study found that the 2008 food price inflation in Ethiopia can be largely explained by overall nominal increases in prices, which have in turn been very closely associated with increases in the money supply, rather than any effect of the PSNP. A 2008 woreda-level analysis of the potential inflationary effects of the PSNP similarly concluded that food prices in PSNP woredas did not increase faster than that of non-PSNP woredas.
3.4 Justification of Overall Outcome Rating Rating: Satisfactory
48. The relevance of the program remains high, with strong donor and Government commitment and a central role for the safety net in the Government’s poverty reduction strategy and donor assistance strategies. Donor engagement and harmonization as well as the use of government systems are an outstanding example of fulfilling the 2005 Paris Declaration for Aid Effectiveness goals. The specific design of the PSNP is highly

16
relevant to the Ethiopian context, creating a more targeted and productive safety net out of the existing emergency response system. 49. The storyline of achievement of development objectives follows and confirms the basic results chain of the PSNP. Investments in inputs, and in particular training and technical assistance, staffing, capacity building and monitoring, resulted in improvements in program delivery. Transfers were timelier. Public works were of higher quality and more deeply embedded in participatory local planning. The local transparency of the program was improved and potential targeting errors of exclusion were better addressed through a revised appeals mechanism. A greater share of PSNP participants also had access to OFSP, heightening longer-term prospects for graduation. The introduction of the Drought Risk Financing Mechanism created an instrument of scalability that was highly effective in quickly responding to the increased demands during the shocks of 2008-2009. These operational improvements translated into significant impacts on households and communities. Millions of rural Ethiopian households did not fall deeper into food insecurity in the face of severe shocks, unlike non-participants. PSNP households built up important assets like livestock. And, communities saw environmental rehabilitation, improved productive capacity and expanded social and economic infrastructure which increased utilization of services, and in some cases, agricultural productivity. However, program impacts were sensitive to program performance – where transfers were late or not complete, there were less effects. 50. The economic efficiency of the program was high because of the high labor-intensity and low administrative costs as well as the efficiency gains of transitioning to cash payments. The cost-benefit analysis of completed sub-projects found that investments are economically sound.
3.5 Overarching Themes, Other Outcomes and Impacts (a) Poverty Impacts, Gender Aspects, and Social Development
51. Vulnerable groups were targeted to receive direct support payments. During APL II, a social development specialist was contracted to the federal level PSNP to reinforce aspects related to vulnerable groups. Impact evaluations confirm that direct support recipients were more likely to be female-headed or comprised of elderly, have lower labor endowments and poorer when measured by livestock and land holdings.
52. The PSNP adjusted its program to ensure specific vulnerable groups were reached: a) Gender mainstreaming. A gender assessment of the PSNP concluded that the PIM
provided a strong institutional framework for promoting gender equity. Fieldwork observed progress in implementing the gender provisions of the PIM, including significant female participation as well as selection of PW projects like water supply that reduce women’s burdens, although this was uneven across woredas and elements of the PIM. The impact assessment found that 40 percent of PW participants were

17
women, which is a good result given international experience with female participationi in public works.6 Many women interviewed for the assessment felt that participating in public works had improved their standing and respect in their communities. Women are nearly always represented in PSNP committees, but not always at the number indicated in the PIM. Despite these measures, women are less likely to participate in meetings than men, though this is less of an issue in the preparation of PSNP Safety Net Plans. Women are more likely than men to use alternative mechanisms to the Kebele Appeals Committees (KACs), like local Women’s Affairs Offices, to air grievances.
b) Pastoral populations: The pastoral pilot design focuses on testing an appropriate program for the livelihoods, cultures and traditions found in pastoral areas. The pilot included partnerships with NGOs because of the severe shortage of capacity in pastoralist woredas. Local food security task forces make use of traditional institutions, clan leaders and religious leaders in the implementation of PSNP, particularly in targeting, mobilizing for public works and ensuring the safety of PSNP resources and personnel. Moreover, public works are developed that do not impinge on livestock mobility nor result in competition between different groups.
c) Integration of HIV & AIDS in PSNP: HIV mainstreaming is a focus within the PSNP to support the overall national response. Common characteristics of households affected by HIV/AIDS are included in targeting criteria, such as elderly-households with young children, or households with chronically ill working-age members. HIV/AIDS related activities were found to have been planned as part of local PSNP planning in only a handful of communities, with the exception of the Tigray region, where PSNP has sponsored mass training (over 76,000 participants) in HIV/AIDS.
(b) Institutional Change/Strengthening 53. The PSNP had a substantial institutional impact, largely because it is implemented using Government systems and structures. During APL II, significant investments in staffing, systems and processes were made in order to address these constraints: a) At the federal level, CIDA and EC financed technical assistants supported
operations in the FSCB, MoFED and the NRM department in the areas of public works, procurement, monitoring and evaluation, communications, social development and financial management.
b) Systems and processes were reinforced through the development and revision of internal guidelines during APL II, including a Graduation Guidance Note, Risk Financing Guidelines, and Pastoral Pilot Guidelines.
6 Female participation in public works programs vary greatly by labor market conditions and program objectives. The PSNP PIM call for creating employment that women can participate in but sets no quotas. The 40 percent result is similar to Maharashtra Employment Guarantee Scheme (ODI ‘The Maharashtra Employment Guarantee Scheme, India’, 2006) which is designed to encourage female participation. In South Africa’s Expanded Public Works Program although women were main target groups, they account for only 23 percent of employment generated (Grosh et. al 2008 “For Protection and Promotion”).

18
c) Some 760 cashiers and accountants were hired at the woreda level to improve timeliness of payments and overall administrative operational capacity, with 96 percent of the appropriate staffing ratios achieved.
d) Regional procurement officers were contracted in four regions. e) The PASS payroll system and the unification of the PW and DS beneficiary lists
contributed improved institutional capacity to manage the PSNP caseload more efficiently and transparently. In addition, client cards were designed and introduced during the last year of APL II.
f) Extensive training activities were undertaken to shore up capacity. Details on the annual training program executed are provided in Annex 2. Some of the impact of this training was undermined due to continued high levels of staff turnover throughout the Ethiopian civil service.
54. Capacity was also reinforced through changes in institutional structures: a) The Government’s 2008 Business Process Re-Engineering (BPR) program brought
together the former Food Security Coordination Bureau and the Disaster Prevention and Preparedness Agency as two directorates under the State Minister for Disaster Management and Food Security.
b) A Public Works Coordination Unit in the NRMD was fully staffed, albeit with delays, with a dedicated budget and similar units created at the regional level.
c) The Channel-1 Coordination Unit established in MoFED facilitated donor funding flowing through Government budgeting and financial management systems leading to better integration of donor funding overall.
d) Regional Information Centers are being established in five regions to provide more real-time monitoring of program performance at the decentralized levels.
e) At the local level, 193 farmer training centers were constructed in 2007-2009 as public works projects, including housing for development agents.
55. Because the PSNP is integrated into government systems and personnel, the capacity building activities have strengthened institutions in Ethiopia beyond a narrow project focus. Investments in capacity-enhancing equipment and goods further reinforced institutions, particularly at the local level where there is a systemic lack of operational resources like motorcycles, office equipment, computers, printers, and office furniture. The operational experience obtained through the PSNP, for example in integrated watershed management and participatory community planning, in targeting and selection of households, in administering a decentralized program and in monitoring and evaluation have benefited more broadly institutional capacity, particularly at the local level. Institutional impacts have been significant at all levels of government. (c) Other Unintended Outcomes and Impacts (positive or negative)
4. Assessment of Risk to Development Outcome Rating: Negligible to low
56. The risk to development outcomes is rated as Negligible to low:

19
a) Stakeholder commitment to PSNP remains high. A detailed approach to food security policies and the securing of substantial funding for the 2010 – 2014 period is in place. The PSNP remains a core part of the Government poverty reduction and rural growth strategies and has received a high degree of institutional engagement at all levels of the Ethiopian government.
b) The achievements of APL II are fully supported through the approval of PSNP APL III. The new project broadens the scope of the World Bank support to the Food Security Policy and seeks greater impact through inclusion of investments in the HABP. The follow-on operation will also reinforce the institutional capacity developed during APL II.
c) The assessment of sustainability of the PW investments under APL II is largely positive, with some project types (e.g. water and road infrastructure) identifying issues. The continued presence of PSNP in these woredas and kebeles will reinforce operations and maintenance issues, including training of local staff and communities.
d) The risks of exogenous factors, like economic and natural shocks, which may affect the functioning of the safety net are now better managed with the DRF.
e) There is some country-wide risk as Ethiopia has had political stresses that in the past have put at risk donor funding. But, even during the tensest moments with donors, the humanitarian response system has continued to operate. Moreover, the donors and government now have a forum for dialogue on political issues at the DAG level.
5. Assessment of Bank and Borrower Performance
5.1 Bank Performance (a) Bank Performance in Ensuring Quality at Entry
Rating: Satisfactory
57. The operation was relevant to the country context and was highly responsive to Government priorities and strategies. The World Bank’s role in bringing international expertise on safety nets was recognized by the Government and donors as adding value to the design of APL II. A thorough review of the evaluative evidence and lessons learned was carried out in preparation of APL II. Sufficient technical expertise, both through the World Bank and other donors, carried out the technical, financial, social and economic appraisal APL II. Risks were adequately assessed and mitigation measures identified. The World Bank placed several conditions on the project to ensure critical issues were addressed or critical actions taken. For instance, establishment and staffing of the Public Works Focal Unit and issuing directives for a strengthened appeals mechanism were conditions of effectiveness and dated covenants were placed on the regular schedule of reviews.
58. There were minor shortcomings to quality at entry, namely: Developing an approach for pastoral areas was intended but not achieved during
PSNP I. The design process of the APL II would have been stronger had the pastoral program been more fully implemented during APL II.
Appraisal of FM capacity noted that most of the implementing agencies lacked sufficient staff and there were frequent delays in financial reporting. The
20
mitigation measures for this could have been more strongly linked to meeting required staffing levels to address the underlying capacity issues.
The DRF component was not fully designed at appraisal so a condition of disbursement was placed on that component.
(b) Quality of Supervision Rating: Highly Satisfactory 59. World Bank supervision, rated highly satisfactory, is a best practice example of effective implementation support. The team ensured basic supervision activities, such as regular joint implementation missions, filing of ISRs and consistent monitoring of fiduciary and safeguard policies. Both the PDO and IP ratings remained satisfactory throughout APL II. ISRs were candid in their assessments of progress and the key implementation issues facing the program. Ratings for areas facing operational challenges, like financial management and procurement at times, were downgraded in a proactive fashion.
60. The Task Team went beyond this general level of supervision effort. Task Team members provided on-going technical support, for example by participating directly in the Rapid Response Teams, Public Works Reviews and donor-government technical groups. The World Bank was instrumental in ensuring the robust impact evaluation was thoroughly analyzed and its lessons integrated into PSNP policy discussions.
61. There were several additional outstanding features to the supervision of PSNP: a) Through the World Bank’s efforts (and those of the other donors), the PSNP is a
model for donor harmonization and reflects a robust example of implementation of the Paris Agenda on Aid Effectiveness. The World Bank’s role was critical to building effective coordination mechanisms. The formation of the Donor Coordination Team (DCT) was critical to effective donor coordination. The Bank supported the formation and function of the DCT, including contracting of personnel and provision of office space in the World Bank’s Ethiopia country office.
b) The Bank Task Team attracted and managed a significant amount of trust fund resources that supported various implementation and supervision activities. For instance, the Bank-managed PSNP Multi-Donor Trust Fund, financed by bilateral funds from Canada, Sweden, Great Britain and Ireland, channeled US$4.3 million to studies, technical assistance, consultants and supervision efforts. The Task Team also leveraged $0.3 million in funding from the global facility for disaster risk reduction and recovery to develop a weather indexation mechanism to support the DRF. Without this additional funding, it would have been difficult if not impossible to carry out such intensive implementation support with only Bank internal resources
c) The World Bank Task Team has also been proactive in early detection of funding gaps and ensuring adequate transition arrangements. The Team processed US$25 million in additional financing through the global food and fuel crisis facility in response to the rising food prices which affected the financial plan of PSNP. And, the Task Team worked closely with donors and the Government to develop the approach,

21
documentation and financial commitments to underpin the next phase of the Food Security Program APL III, ensuring that there was no gap in implementation.
d) To inform international best practice on safety nets, the Task Team went beyond the more narrow project supervision focus and invested time and resources in learning from the PSNP experience, resulting in the publication of the book Designing and Implementing a Rural Safety Net in a Low Income Setting: Lessons Learned from Ethiopia’s Productive Safety Net Program 2005-2009 in 2010. The PSNP experience has been presented in numerous internal and external safety net fora, informing international practice on safety nets in low-income settings.
(c) Justification of Rating for Overall Bank Performance Rating: Satisfactory
62. The overall rating for World Bank performance is satisfactory, with a stronger supervision effort and some minor shortcomings during the appraisal phase.
5.2 Borrower Performance (a) Government Performance
Rating: Satisfactory
63. The Government displayed a high degree of commitment to the PSNP. For example, it was agreed in late 2008 that the Joint Coordination Committee meetings, including representation of all key ministry departments, would be chaired by the State Minister for Disaster Risk Management and Food Security Sector (DRMFSS) to elevate the meetings to a more strategic level and ensure more concerted follow-up from Government. Also affecting the program, in 2008 the GoE implemented the Business Process Re-engineering (BPR) to reform service delivery by the public sector. The post-BPR structure brings together the former FSCB and DPPA as two Directorates under the State Minister for DRMFSS which was beneficial. This reorganization brought some disruption and changes in staff, but also had the positive effect of facilitating the coordination of emergency response and the safety net. 64. Nonetheless, implementation was adversely affected by systemic weaknesses in the Ethiopian civil service. The Government agreed to several hybrid arrangements to shore up capacity, mainly through accepting greater levels of technical assistance and contract staff. But, the underlying problems, including high levels of staff turnover, remain widespread.
65. The Government provided significant funding to FSP in general, with the OFSP and resettlement component largely financed out of the national budget. The utilization of Government staff to implement PSNP is valued at over $50 million. (b) Implementing Agency or Agencies Performance Rating: Moderately Satisfactory

22
66. The main implementing agency for the PSNP is the Food Security Coordination Directorate (FSCD) in conjunction with the Natural Resources Management Directorate (for PW oversight) and MOFED as the financial channel:
a) The FSCD was the focal point for the program and had overall responsibility for the design and operation of the PSNP. The FSCD devoted considerable attention to achievement of development objectives, generating a significant level of studies and analytical work. FSCD developed new and revised manuals and guidelines to systematize procedures. Despite some delays in developing the pastoral pilot, main program activities were implemented as planned and with a high degree of documentation and evaluation. Nonetheless, procurement and environmental management were rated as moderately satisfactory through most of the life of APL II.
b) In terms of financial management, there were some delays and deficiencies in financial reporting. MOFED did address these issues, but was slow in informing donors which posed a threat to the timely provision of resources to the program. MOFED ensured that there were sufficient accountants and cashiers deployed at the local levels and set up the Channel I Coordination Unit that began to address some of these more systemic challenges as donors began to move an increasing level of resources through Government systems. Nonetheless, there were persistent shortcomings with the financial management of the program.
c) The Natural Resources Management Department was slow to take on the technical responsibility for oversight of the public works and had difficulties maintaining an adequate information base on the outputs of the public works. Nonetheless, the natural resources staff at the local levels played a key role in PSNP implementation including incorporation of integrated watershed management into the PSNP.
67. The program implementing agencies initiated a detailed review of their food security policy and programs in 2009 to prepare the next phase of the Food Security Program (2010-2014). During the ICR mission, all of the donors remarked on the high degree of government ownership of this design process as a sign of the experience of 5 years of PSNP in developing capacity not only in the operational but also the policy area. (c) Justification of Rating for Overall Borrower Performance Rating: Satisfactory 68. Overall, implementation progress was satisfactory. Despite modest shortcomings in processes and procedures, the Government was generally responsive to program needs and the key development objectives were met. The shortcomings in financial management, environmental screening and procurement were largely a function of the PSNP being implemented through existing government channels and by line agency staff rather than donor driven, ad-hoc project implementation rules and structures. The positive benefits of increased capacity among line agency and woreda staff is notable.

23
6. Lessons Learned 69. A range of strategic and operational lessons has been learned from the PSNP APL series to date (both APL I and II). Some of the most pertinent lessons are captured below. They are included in this ICR because not all these lessons were evident at the end of APL I and thus, restricting the discussion to APL II only would miss some of the most important lessons learned from the PSNP: a) A shared understanding of the principles of safety net reform is crucial to
sustaining Government and donor buy-in to these reforms. The PSNP was built on a broad-based agreement that the emergency response system was failing to protect livelihoods and that a system-wide reform was required. This agreement, together with a clearly defined set of principles, helped hold together a coalition of partners with a wide array of interests and operating procedures.
b) Effective donor coordination is essential in such a large-scale Government-led program with multiple funding agencies and requires significant attention. The PSNP is a model of donor collaboration and harmonization reflecting a robust example of implementing the Paris Declaration and Accra Agenda on Aid Effectiveness. This was built on mechanisms like the coordinated bi-annual joint reviews, the creation of the Donor Coordination Team, joint donor-Government technical working groups, and agreement on harmonized program indicators, financial procedures and reporting requirements. These effective harmonization and coordination structures required dedicated resources and continuous engagement particularly given the diversity of views in this Government-led program.
c) A safety net can be implemented through government systems in low-income settings. The experience of the PSNP has shown that as long as the basic aims of the program are being met and humanitarian risks averted, capacity to deliver more sophisticated systems can be built over time. Indeed, integrating the PSNP into government systems and structures has resulted in a level of institutional development beyond what would have been achieved through a narrow project focus in capacity building.
d) Safety net transfers can be well-targeted to the poorest households, even in rural communities with widespread poverty and low levels of inequality. Evidence from a range of indicators shows that PSNP is well targeted. This suggests that a community-based targeting system can be effective in the absence of proxy means test systems when capacity is weak and information is limited. However, an independent appeals mechanism is an important component of the household targeting system.
e) Achieving timely transfers requires investments in capacity building and streamlining procedures. For instance, computerization of the payroll and attendance sheets made processing payments easier and faster while strengthening fiduciary controls. Putting in place resources upfront also promoted timely transfers.
f) The impacts from the public works created can have important environmental rehabilitation and infrastructure development benefits. This in turn enhances agricultural productivity and livelihoods and has a positive impact on the food security status of the beneficiaries. The quality and ultimate impact of PW investments have been furthered by using integrated watershed management

24
principles, providing sufficient funding for non-labor inputs, developing technical norms and guidelines, assigning clear responsibilities for technical supervision to local sectoral staff, and carrying out repeated field visits and quality reviews.
70. The following strategic and operational lessons were learned during the implementation of PSNP APL II: a) The implementation of safety net programs through Government systems requires
continual attention to capacity development and integration with the regular work program of operational staff. During APL II, the PSNP deepened efforts to shore up institutional capacity, particularly where weaknesses were identified during the first phase. Because of systemic weaknesses in the civil service in Ethiopia, such as high turnover, training in basic program procedures and systems needs to be repeated and continuous training approaches adopted. Measures like recruiting contracted staff can reinforce capacity when overall civil service reforms are not yet effective.
b) Up-front financing is necessary for safety nets to truly be ‘scalable’ in responding when crises hit. With the international food price hikes and drought in 2008, the DRF mechanism had already put resources in place up front which resulted in a quick response which protected the incomes and assets of households. Putting in place ex-ante contingent financing was an innovation of APL II and indeed for the safety net experience internationally and created the ability to respond swiftly to crisis. That there were no reductions in the food gap for PSNP households during a combined drought and international food and fuel crisis is a testament to the responsiveness.
c) The pace of graduation from a safety net needs to be set against a realistic assessment of overall economic trends and conditions. Graduation cannot be expected to result only from the safety net and needs to be viewed with an understanding of the multiple paths out of poverty.
d) Cash and food transfers can be combined successfully in a safety net as long as there is flexibility. Despite PSNP’s ‘cash first’ principle, the food price spikes during APL II caused erosion in the basic purchasing power of the cash transfer. PSNP switched to a mixture of cash and food which helped respond to beneficiary preferences and stabilize the protective benefits of the basic transfers.
e) Successive impact evaluations provide valuable information not only to measure program effect but to identify areas that heighten impact. The PSNP impact evaluation measured many critical program variables in a robust manner. In addition, because of the way the impact evaluation was structured, several valuable pieces of information emerged which are not usually covered in program impact evaluations, including: (a) household level impacts were highly sensitive to whether safety net transfers were delivered in a full, timely and predicable manner; and (b) impacts were stronger when combined with other food security interventions. The well-designed impact evaluation has enabled the Program to generate lessons to inform international best practices on safety nets.

25
7. Comments on Issues Raised by Borrower/Implementing Agencies/Partners (a) Borrower/implementing agencies In addition to the discussions with key government stakeholders during the ICR mission, written comments were received from the DRMFSS. As overall coordinator of the program DRMFSS made some editorial comments on the draft text of the ICR. These comments were incorporated in the final version of the ICR. Furthermore, DRMFSS expressed disagreement with the moderately satisfactory rating for the performance of the implementing agencies. Over the course of APLII the program has seen a year on year improvement in the implementation of the program, DRMFSS is therefore of the opinion that the implementing Agencies have performed satisfactory (see for details annex 7). (b) Cofinanciers and stakeholders All main donors were consulted during the ICR mission and written comments on the draft ICR were received from Irish Aid, CIDA, Netherlands Embassy, DFID, USAID and WFP. Overall the development partners found that the ICR was a well presented and informative document that is effective in capturing APL II results, the implementation experience and lessons learned. Various editing comments were made by the partners, which have been taken into consideration in the final version of the document (see for details annex 7).

26
Annex 1. Project Costs and Financing
(a) Project Cost by Component (in USD Million equivalent)
Components Appraisal
Estimate (USD millions)
Actual (USD millions)
Percentage of Appraisal
1. Safety Net Grants 836.5 868.1 104%
2. Drought Risk Financing 25.0 114.4 458%
3. Institutional Support 47.3 47.3 100%
Total Baseline Cost 909.3
Physical Contingencies 3.0
Price Contingencies 3.0
Total Project Costs 915.3 1,029.7 113%
(b) Financing (in USD Million equivalent)
Source of Funds Type of
Cofinancing
Appraisal Estimate
(USD millions)
Actual (USD millions)
Percentage of Appraisal
Opening Balance (carry‐over funds from APL I) 56.5 0.0 0%
Sources of Funds
Government of Ethiopia 2.0 5.6 280%
International Development Association (IDA) 175.0 207.9 119%
Department for International Development (DFID) 194.6 139.3 72%
European Commission 195.6 160.8 82%
Irish Aid (DCI) 18.0 47.4 263%
United States Agency for International Development(USAID) 38.0 314.2 827%
Canada International Development Agency (CIDA) 14.4 87.4 607%
World Food Program (WFP) 26.6 25.1 94%
Swedish International Development Agency (SIDA) ‐ 29.4 n.a
Netherlands ‐ 31.3 n.a
Global Facility for Disaster Risk Reduction and Recovery ‐ 0.3 n.a
Closing Balance (Financing Gap or Surplus) ‐194.6 19.0 n.a
Total 915.3 1,029.7 113%
Notes: (i) CIDA contribution includes financing allocated to APL 1 that was disbursed during the APL 2 period. This was recorded in the PSNP APL I as financing to APL I. However, because MOFED records include it as a source of funds to APL 2, it is included here as a source of financing and attributed as expenditure; (ii) the Government allocation is the in‐kind contribution to the PSNP until July 2010; (iii) For APL II Actuals, in‐kind contributions to the PSNP have been valued at the prevailing market rate per year; (iv) The USAID contribution to the PSNP is allocated through NGOs and WFP; (v) No carry‐over balance from APL 1 to APL 2 is shown here because MOFED attributed expenditure to all APL 1 financing.

27
Annex 2. Outputs by Component Component 1: Safety Net Grants Number of Woredas and Beneficiaries assisted by PSNP 2007-2009 2007 2008 2009 Woredas Beneficiaries Woredas Beneficiaries Woredas Beneficiaries Amhara 62 2,519,829 64 2,519,829 31 1,453,707 Oromia 62 1,378,876 71 1,378,876 64 2,519,829 SNNP 58 1,298,981 79 1,298,981 76 1,438,134 Tigray 31 1,453,707 31 1,453,707 79 1,459, 160 Dire Dawa 1 52,614 1 52,614 1 52,614 Harari 1 16,136 1 16,136 1 16,136 Afar 29 472,229 29 472,229 32 472,229 Somali 0 0 6 162,671 6 162,671 TOTAL 244 7,192,372 282 7,355,043 290 7,574,480 Distribution of Public Works and Direct Support Beneficairies Public Works % Direct Support % Total 2007 6175122 86% 1,017,250 14% 7,192,372 2008 6309753 86% 1,045,290 14% 7,355,043 2009 5,958,564 79% 1,615,916 21% 7,574,480 APL II Average 83% 17%
Major Public Works Outputs for the Years 2007, 2008 and 2009
Sub-projects Unit 2007 2008 2009 Total
Soil and Water Conservation
Land rehab-/area closures hectares 47,154 25,323 94,673 167,150
Soil embankment constr. km 33,285 21,279 36,890 91,454
Stone embankment constr. km 38,190 54,669 91,871 184,730
Seedling production Number 301,778,600 887,990,000 132,169,420 1,321,938,020
Seedling planting Number 12,883,657 852,480,000 17,958,043 883,321,700 Tree nurseries Number 285 419 410 1,114
Water Supply
Pond constr./rehabilitation Number 88,936 31,594 13,397 133,927
Spring development Number 598 1,537 1,549 3,684
Well construction Number 491 - 771 1,262 Small-scale irrigation canal constr/rehab km
2,679
712
2,355
5,746
Social Services
School constr/rehab Number 340 1,291 446 2,077
Health post construction Number 71 56 105 232
Community Roads
Roads construction km 8,323 8,683 6,730 23,736
Roads maintenance km 20,458 12,120 9,839 42,417

28
Component 2: Drought Risk Financing Mechanism 2008 2009 Number of beneficiaries with extended payments (millions) 4.43 6.42 Component 3: Institutional Support Main outputs of the institutional support component consist of (a) additional staff contracted at federal, regional and woreda levels and technical assistance, (b) training activities, (c) goods and equipment purchased to reinforce institutional capacity, and (d) studies and surveys, as detailed in the tables below: Staff and technical assistance: Federal level: Over 40 permanent and contract staff, including public works coordination unit specialists, communication specialist, and a social development specialist were involved in the coordination and supervision of the program during APLII. Contracted staff at Regional and zonal level: Public works focal points (21) Pastoral specialist (2) Procurement coordinators (4) Social mobilization (4) Accountant (25) IT specialists (3) PSNP implementation specialists (6) Contracted staff at Woreda level: Recruitment of 355 accountants and 405 cashiers Public works/natural resources focal points (82) Social development, HIV/AIDs specialists (79) PSNP coordinators (64) Public works technicians (5) Training: 2007
Participatory watershed management – Amhara, Tigray, and Harari regions – 200 staff
Administration Council training – Oromia, SNNP, and Dire Dawa – 310 staff 2008
Financial management training – Oromia, Amhara, Tigray and SNPP Participatory watershed management – pastoral pilots in Afar and Somali – 31
staff

29
Training on the new graduation guidance note for woreda staff Training on automated Payroll and Attendance Sheet System (PASS) – regional
and woreda staff Training on guidelines for piloting PSNP in pastoral areas Translation of Environmental and Social Management Framework Operational
Summary and IPM documents and environmental screening formats into regional working languages (Amharic, Tigrigna and Oromifa) and distribution of copied to all regions and woredas.
2009
Successive training sessions in PASS – 478 woreda and zonal participants Under watershed activities, 76,626 people in Tigray received mass education and
in Harari 109 watershed development committee members and 12 development agents participated in a two-day workshop about HIV/AIDS transmission and protection measures
Multi-subject 3-day training workshop (PIM, graduation, M & E, ESMF) in Tigray for 242 woreda experts
Community-based public works and watershed planning, off-farm package and credit, business plan preparation, resource management and graduation technical training in Amhara region for 397 woreda experts and 1,767 kebele development agents
Goods and Equipment: Items Quantity Distributed to: Motorcycles 118 51 to Oromia, 52 to SNNPR and 9 Afar Regions Generator sets 114 40 to Amhara, 32 Oromia, 17 Tigrayand 25 SNNPR Photocopiers 404 65 to Oromia, 122 Amhara, 130 SNNPR, 63 Tigray, 21 Pilot
Woredas, and 11FSCB Fax Machines 258 64 to Oromia, 57 Amhara, 60 SNNPR, 55 Tigray, 21 Pilot
woredas and 1 FSCB Cash Safe Boxes 230 61 to Oromia, 64 Amhara, 79 SNNPR and 26 Tigray Vehicles (procured but not distributed under APL II)
207 59 to Amhara, 44 Oromia, 72 SNNPR, 16 Tigray, 1 Dire Dawa, 1 Harari, 7 Somali and 7 Afar
Desktop Computers 468 61 to Oromia, 138 Amhara, 76 Tigray, 151 SNNPR, 42 FSCD
Uniform Power Supply
470 63 to Oromia, 138 Amhara, 76 Tigray, 151 SNNPR, 42 FSCD
Stabilizers 470 63 to Oromia, 138 Amhara, 76 Tigray, 151 SNNPR, 42 FSCD
Printers 470 63 to Oromia, 138 Amhara, 76 Tigray, 151 SNNPR, 42 FSCD
Filing cabinets 136 SNNPR Laptop computers 13 4 Oromia, 2 Amhara, 4 Tigray, 3 SNNPR

30
Studies and Surveys:
Consultancy 2007 2008 2009
PSNP JRIS Facilitation
Automation of Payroll and Attendance Sheet IDS/ODI Panel Survey 3,6,9 Pilot Survey IFPRI FSP Impact Assessment PSNP Review OFSP Review FSP Programme Document (2010-2014) PSNP Programme Document (2010-2014) HABP Programme Document (2010-2014) Institutional Mapping Risk Financing Risk Financing Mechanism Development Financial Management Purchasing Power Study Banking Sector Assessment
PSNP Module for Financial Transparency & Accountability Perception Survey, 2008 Public Works Public Work Impact Assessment Public Work Review (1st - planning process) Public Work Review (2nd sub-projects) Pastoral Pastoral Pilot Study Pastoral Pilot Guidelines Institutional Capacity Needs Assessment for Pastoral Areas
PSNP Pastoral Areas Pilot M & E System Consultancy Pastoral Pilot Lessons Learned Study Cross-cutting issues Gender Study HIV/AIDS Mainstreaming into PSNP Nutrition Pilot Communications Strategy

31
Annex 3. Economic and Financial Analysis (including assumptions in the analysis) Cost effectiveness of safety net programs are analyzed in several ways: First, cost efficiency of the safety net transfers themselves are a function of the accuracy of targeting, the labor intensity of the public works and the general overhead costs of the program, which together help determine the overall share of program resources that actually reach the poor through transfers. In the case of the PSNP, the cost efficiency of the transfers is high due to:
Accurate targeting with little leakage to the non-food insecure. a combination of accurate targeting of beneficiaries (little leakage to the non-food insecure),
High labor intensity, on average 80 percent. This compares very favorably with international experience in cost effective public works programs.7
Overhead costs are within benchmark ranges for safety nets. These costs were 14 percent over APL II including a valuation for all Government staff working on the program as well as all institutional support expenditures.8 Costs are typically higher in the early phases of safety nets as institutional investments in equipment, technical assistance and capacity building are more intensive, as is the case for ht PSNP in this phase.
A further program efficiency is specific to PSNP and involves the shift from food to cash transfers. Given the 2008 mix of cash and food beneficiaries, the estimated annual savings to the program of introducing cash payments is over US$21 million, mainly in savings of transportation and storage costs. This savings is equivalent to almost 300,000 incremental cash beneficiaries. In terms of economic impact of the infrastructure created, this analysis applies traditional cost benefit analysis to the public works outputs for those sectors where such analysis can be carried out. The 2008 Public Works Impact Assessment conducted
7 Labor intensity of PSNP is estimated at 80% (non-labor costs calculated from capital and administrative budget expenditures). This is quite high by international standards. The large-scale public works program averaged 60-70% in India (Maharashtra Employment Guarantee Scheme), 70% in Korea’s public works program, 40-50% in Argentina’s Trabajar program and 60-70% in Bangladesh’s Food for Work Program (source: “Systemic Shocks and Social Protection: Role and Effectiveness of Public Works Programs” Kalanidhi Subbarao, Social Protection Discussion Paper No. 302, World Bank. January 2003.) 8 Comparison of administrative costs across types of safety nets is notoriously difficult due to definitional and data issues; i.e., whether capacity building is included or just operational costs. In Grosh et. al 2008 “For Protection and Promotion: Design and Implementation of Effective Safety Nets”, a review of administrative costs of programs found that (pg 391-392) administrative costs of well executed cash or near cash programs cluster in the range of 8-15 percent of total costs. The average share of administrative costs in food-related programs was 22 percent due to higher logistical costs. And, (cash based) public works programs averaged 5 percent. PSNP combines elements of all three, with cash transfers via direct support, cash for public works and food transfers.

32
economic analysis on completed public works projects in ten sample watersheds nationwide, which are summarized below: Soil and Water Conservation: Of the households interviewed, 34% reported
significant benefits from the area enclosures in terms of forage for livestock. Benefit-cost ratios for the SWC measures were calculated that covered the benefits of soil loss reduction, woody biomass and forage production and carbon sequestration. The results range from 1.5 to 2.6, with an average of 1.8.
Water Supply Projects: In addition to health gains from greater access to clean water and resulting increased labor productivity, water projects were found to reduce the distance women and children travel to fetch water. This timesaving allows household members to engage in other value-added household activities like crop production. Using the willingness-to-pay method, the discounted benefit-to-cost ratio of a typical single developed spring was calculated to be 3.7.
Small-scale irrigation: It is estimated that even very small-irrigated plots (190 m2) are capable of generating gross margins of between ETB 4,200 to 6,000/yr (double cropped). Thus, even micro-scale irrigation can have a significant impact on household livelihoods and food security.
Health Projects: Potential impacts of investments in health facilities will be through improved household labor productivity and a reduction in health care costs from not being ill. Two approaches to benefit-to-cost analysis for this type of project were used: (i) willingness to pay for medical services, and (ii) the opportunity costs of labor lost due to illness. The former method provided an estimated benefit-to-cost ratio of 1.8 and the latter one of 2.2.
Rural roads: PSNP rehabilitated roads are providing better access, particularly for vehicles, carts, and mules. As the roads constructed by the PSNP generally consist of small additional sections to existing roads it was not possible to determine benefit-to-cost ratios. However, data on time-savings due to the PSNP road segments were as follows: reaching health post - 17.8 minutes; kebele office - 7.1 minutes; market - 18 minutes, school - 16.3 minutes.
These findings are consistent with other evidence on other investments in Ethiopia. A recent World Bank project found general SWC ERRs of 10-17% (World Bank/GEF).9 Other research in Ethiopia on stone bunds found yield increases 20-50% with an ERR of
9 Economic analysis of the Ethiopia Sustainable Land Management Project (World Bank Project Appraisal Document Report No. 42927-ET) found an ERR of 10% for physical investments in SWC (stone bund, soil bund, fanyajuu, and grass strips), and 17% for SWC physical structures combined with fodder on bunds and intercropping.

33
46 percent.10 Soil bund returns were more variable by location with marginal or negative returns in high rainfall areas.11 Another issue of economic impact of concern to the PSNP has been the possible local inflationary effects of shifting from food aid to cash. Recent analysis found that the recent food price inflation in Ethiopia can be largely explained by overall nominal increases in prices, which have in turn been very closely associated with increases in the money supply.12 In addition, a 2008 woreda-level analysis of the potential food inflation effects of the PSNP similarly concluded that “prices in PSNP woredas did not increase faster than that of non-PSNP woredas”.13
10 Pender, J. and B. Gebremedhin. 2006. “Land Management, Crop Production, and Household Income in the highlands of Tigray, Northern Ethiopia: An Econometric Analysis.” In Pender, J., F. Place, and S. Ehui (eds) Strategies for sustainable Land Management in the East African Highlands. Washington D.C.: IFPRI. Kassiea et. al. “Estimating Returns to Soil Conservation Adoption in the Northern Ethiopian Highlands” Environmental Economics Policy Forum for Ethiopia, Addis Ababa, Ethiopia. 2007. Nyssen, et. al., “Interdisciplinary on-site evaluation of stone bunds to control soil erosion on cropland in Northern Ethiopia” Soil and Tillage Research, Volume 94, Issue 1, May 2007, Pages 151-163. Stochastic Dominance Analysis of Soil and Water Conservation in Subsistence Crop Production in the Eastern Ethiopian Highlands: The Case of the Hunde-Lafto Area” Journal of Environmental and Resource Economics Volume 32, Number 4 / December, 2005. 11 Menale Kassie, Stein Holden, Gunnar Köhlin, and Randy Bluffstone. “Economics of Soil Conservation Adoption in High-Rainfall Areas of the Ethiopian Highlands” Environment for Development Discussion Paper Series March 2008 . EfD DP 08-09. 12 “Explaining Sources of Food Price Inflation in Ethiopia” World Bank, June 30, 2007 13 “Cereal markets and productive social safety net program (PSNP) in Ethiopia”, Shahidur Rashid, Alemayehu Seyoum, Belay Fekadu, Befekadu Behute, Policy Brief 4, December, 2008 UNECA Addis Ababa, Ethiopia.

34
Annex 4. Bank Lending and Implementation Support/Supervision Processes
(a) Task Team members
Names Title Unit Responsibility/
Specialty Lending Arianna Legovini Senior Economist AFTQK Marylou Bradley Senior Operations Officer AFTH3 Marito Garcia Lead Human Develop. Economist AFTH3 Trina Haque Lead Economist AFTH3 Ernst Lutz Consultant MNSSD Southsavy V. Nakhavanit Program Assistant AFTH3 John Nyaga Sr. Financial Mgt. Specialist AFTQK Edwige Reichelt Office Manager AFTH3 Carolyn Winter Sr. Social Development Specialist AFTCS William Wiseman Economist AFTH3 Eshetu Yimer Sr. Financial Mgt. Specialist AFTFM
Supervision/ICR Tafesse Freminatos Abrham Consultant AFTFM Eleni Albejo Program Assistant AFCE3 Harold H. Alderman Adviser PA9SS Tesfaye Ayele Procurement Specialist AFTPC Shimelis W. Badisso Procurement Specialist AFTPC Abiy Demissie Belay Financial Management Analyst AFTFM Marylou R. Bradley Senior Operations Officer WBIHS Ian Leslie Campbell Consultant AFTSP Sarah Elizabeth Coll-Black E T Consultant AFTSP Endashaw Tadesse Gossa Senior Operations Officer AFTSP Samuel Haile Selassie Senior Procurement Specialist EAPPR Laketch Mikael Imru Sr. Rural Development Specialist AFTAR Renate Kloeppinger-Todd Rural Finance Adviser ARD Sorssa Natea Merga E T Consultant AFTH3 - HIS Southsavy V. Nakhavanit Temporary AFTSP Richard Olowo Senior Procurement Specialist AFTPC Larissa Pelham Consultant AFTSP Mulat Negash Tegegn E T Consultant AFTFM William David Wiseman Senior Economist AFTSP Eshetu Yimer Sr. Financial Mgt. Specialist AFTFM Trina Haque Country Operations Adviser LCC2C Carolyn Winter Sr. Social Development Specialist AFTCS Colin Andrews Sr. Social Development Specialist HDNSP Tesfaalem Gebreiyesus Lead Procurement Specialist SARPS Margaret Grosh Lead Economist LCSHD Qaiser Khan Sector Lead Economist AFTSP

35
Bassam Ramadan Sector Manager HDNSP Francesco Sarno Consultant AFTEN Emil Tesliuc Sr. Economist AFTHD Julia Van Domelen Consultant AFTSP Maniza Naqvi Sr. Social Protection Specialist AFTSP Josiane Luchmun Program Assistant AFTSP Luis Schwarz Sr. Finance Officer CTRFC
(b) Staff Time and Cost (not including trust fund resources)
Stage of Project Cycle Staff Time and Cost (Bank Budget Only)
No. of staff weeks USD Thousands (including travel and consultant costs)
Lending FY06 4.59 FY07 134.56 FY08 0.00
Total: 139.15 Supervision/ICR
FY06 0.00 FY07 40.94 FY08 157.96
Total: 198.90

36
Annex 5. PSNP Monitoring and Evaluation Instruments and Impact Evaluation Findings
Types of reports
Information provided Frequency Examples of indicators
Monitoring Reports
- Regular collection of information at output and activity level, including regular financial reports (IFRs).
- Monthly from woreda to region; - Quarterly to Federal level
- Number of public works completed - Volume of transfers delivered
Information Center Reports
- Information collection from a sample of woredas largely focused on timeliness of transfers, but also includes price data.
- Every two weeks
- Date and amount of transfers to woredas and beneficiaries - Maize prices
Rapid Response Mechanism Report
- Regular assessments of implementation at kebele, woreda and regional levels to address critical implementation problems as they occur. This includes transfers to beneficiaries, public works, capacity issues and others.
- Every two months from Federal level (regularly from regional and below)
- Number of households targeted - Beneficiary satisfaction with PSNP
Annual Assessments
- Purchasing power study to inform the setting of an appropriate wage rate for the PSNP - PW Review (planning) to assess the adequacy of PSNP public works plans - PW Review (technical) to review the quality and sustainability of PSNP PW - Risk Financing (RF) Review to determine the effectiveness of the RF response, if triggered - Roving Appeal Audit to assess the functioning of the appeal system - Roving Procurement Assessment to review procurement processes at woreda level
- Annual - Annual - Annual - As needed - Annual - Annual
- Average prices in PSNP markets over time - Number of public works meeting technical standards - Number of Appeal Committees established - Volume of goods procured
Audits
- The Financial Audit includes an audit of accounts; systems audit; and review of transactions to beneficiaries to ensure that funds were used for purposes intended. - The Commodity Audit review to ensure in-kind resources are used for the purpose intended
- Quarterly rolling, annual - Annual
- Percent of households receiving full payment - Quality of food stock records
Evaluations
- Public Works Impact Assessment to determine if the objective of the PSNP PW were met - Biannual Impact Evaluation, a regionally representative household survey, to assess outcomes and impacts of all component of FSP - IDS/ODI Panel Survey 2006 – 2008 ‐ The Financial Transparency and Accountability Perception Survey (FTAPS) fielded in 2008 - Risk Financing impact assessment to determine if the objectives of RF were met
- Every two years - Every two years - As needed
- Benefit-cost assessment of public works - Change in household food gap, assets -Targeting fairness, information, changes in quality of life -Coverage etc.
Source: World Bank. Project Appraisal Document for Phase Three of the Productive Safety Net Program. Washington, D.C.: World Bank, 2009.

37
Household-level Impact Evaluation: 14
Impact evaluation methodology: The impact evaluation is based on longitudinal quantitative survey data collected at the household and locality levels. These data were collected in the four major regions covered by the Food Security Program; from north to south these are Tigray, Amhara, Oromiya and SNNPR. The first survey was implemented in June-August 2006 with the bulk of the interviewing conducted in July. The follow-up survey was implemented in June and early July 2008 so differences between rounds due to seasonality considerations should not be large. The design of the 2006 Food Security Survey sample was based on power calculations conducted to determine the minimum number of sample enumeration areas and households needed to be able to identify impacts of the Food Security Program. The sample is clustered at the woreda level. 49 woredas were randomly sampled proportional to size from a list of 153 chronically food insecure woredas stratified by region. Within each woreda, sample kebele serving as Enumeration Areas were randomly selected from a list of kebele with active Productive Safety Net Programmes (PSNP). Within each EA, 15 beneficiary and 10 non-beneficiary households were sampled from separate lists for each group, yielding a sample of 25 households per EA. This yielded a sample of 146 EAs and a sample of 3,688 households. Households were drawn from PW beneficiaries alone as DS beneficiaries are few in number and the transfers are low in value, making it difficult to carry out matching or measure impact. The survey instrument consisted of two parts: (1) A community questionnaire that includes a set of questions administered to local community leaders within the sample EAs and a survey of local market prices; and (2) A household questionnaire. These instruments were designed to: (i) capture the impact, outcome, output and process indicators identified in a Log Frame (dated February 2006) associated with the Food Security Program (FSP); (ii) capture information that would permit the assessment of impact using matching techniques, while accounting for behavioral responses by households and design features that might affect the impact of the FSP on these indicators; and (iii) draw from survey instruments that were extensively pilot tested and implemented to collect useful data. The household questionnaire had seven modules covering basic household characteristics; land use, crop production and related agricultural activities; assets; income apart from own-agricultural activities and credit; access to the Productive Safety Nets and Other Food Security Programs; consumption; and health, illness, shocks and poverty perceptions. The follow-up survey in 2008 re-interviewed the households surveyed in 2006. The survey instruments were nearly identical to those used in 2006 so as to maximize comparability across the two rounds. Questions on time invariant characteristics were dropped, a few additional questions on program operations were added and an anthropometry module was also included. Attrition was relatively small. A total of 137 households (or 3.7 percent of the baseline sample) attrited, a third of which were concentrated in two EAs that could not be re-surveyed. Therefore, the 2008 survey encompassed 3,551 households in 146 EAs. Analysis of the data is based on the construction of a comparison group from among non-beneficiary households that was similar to PSNP beneficiaries before the program began, derived
14 Derived from Gilligan, D., Hoddinott, J., Kumar, N. and A. Taffesse. “An Impact Evaluation of Ethiopia’s Productive Safety Nets Program”, International Food Policy Research Institute, March 16, 2009.

38
by matching beneficiaries to non-beneficiaries based on observable household and community characteristics. The impact evaluation estimates impacts using nearest neighbor matching (NNM), a form of covariate matching in which the comparison group sample of non-beneficiaries is selected based on similarity to the beneficiary sample in observable characteristics. Analysis is based on “difference-in-difference” or “double difference” estimate of impact (the difference in outcomes between 2006 and 2008 for beneficiaries compared to the difference in outcomes between 2006 and 2008 for non-beneficiaries).
Summary Findings15:
Against the background of rising food prices and widespread drought, participation in the public works component of the PSNP (defined as receipt of at least 100 Birr in payments over the first five months of 2006, 2007 and 2008) has modest effects. It improves food security by 0.40 months and increases growth in livestock holdings by 0.28 Tropical Livestock Units (TLU). It leads to an increase of 4.4 percentage points in the likelihood that a household is forced to make a distress asset sale.
These aggregate results, however, mask important differences within the sample of beneficiary households:
Households that received low levels of transfers (defined as less than 900 Birr over the first five months of 2006, 2007 and 2008) were much more likely to make distress sales, especially if they reported being affected by drought as were households whose transfers were characterized by a high degree of variability. By contrast, there is no impact on distress sales when transfers are higher, when they are less variable and when households also receive OFSP services. Further, when transfers were low, but predictable, households could access consumption credit as a means of avoiding distress sales.
Program impacts on asset accumulation are greater when higher levels of transfers are received and when participants have access to both the PSNP and the OFSP. On average, households receiving high levels of transfers (defined as more than 900 Birr over the first five months of 2006, 2007 and 2008) had a 14.3 per cent higher growth rate in the value of their livestock holdings. High levels of transfers and access to the OFSP improved food security between 2006 and 2008 by 0.45 months. Results from the baseline evaluation fielded in 2006 showed that access to the PSNP and OFSP improved food security by 0.36 months, thus giving a combined impact of an improvement in food security of 0.81 months since the introduction of the program. Access only to public works transfers, or only to specific OFSP packages of services such as irrigation or seeds, had no effect on agricultural productivity as measured by maize yields. By contrast, households where both public works transfers and these OFSP services were received saw large increases – 243 to 266 kg/ha - in maize yields.
15 It is not possible to assess the impact of new assets constructed by the PSNP program. Because they are community assets, they potentially provide a flow of benefits to PSNP and non-PSNP households alike within the same community

39
Access to high levels of public works transfers protected households from the malign effects of drought. Restricting the sample to respondents who indicated that they had been adversely affected by drought in 2007, households receiving a high level of transfers and OFSP services accumulated 0.88 more TLU than non-beneficiary households that experienced this shock.
Payment for at least 10 days work per month in the three months prior to the 2008 survey (specifically, the receipt of at least 80 Birr in March, April and May 2008) improved food security even though food prices were rising dramatically at the time. Restricting the sample to households affected by drought in 2008, receipt of this level of transfers raised the growth rate of caloric acquisition (relative to non-beneficiaries) by 30 percent while increasing livestock holdings by 0.89 TLU. However, households who were receiving public works transfers, but low or no transfers in this three month period prior to the survey saw their food security deteriorate relative to non-beneficiaries.
Taken altogether, these results provide a modestly positive view of the impact of public works, transfers and access to the OFSP. When households receive reasonably high levels of transfers, when these transfers are predictable, and when they also receive access to OFSP services designed to improve farm productivity, food security improves, asset growth is faster and yields rise. Further, the program does act as a safety net provided transfers are reliable. By contrast, low and unpredictable levels of transfer have less positive impacts and the uncertainty of their receipt forces households to be more likely to make asset distress sales. Increasing transfers to beneficiaries, making them more predictable and continuing to strengthen the links to productive components of the OFSP will further improve the impact of the FSP.

40
Annex 6. Summary of Borrower's ICR and/or Comments on Draft ICR
Abridged Implementation Completion Report for the
Productive Safety Net Programme
APL II
Start date: 31 January, 2007
End date: 31 December, 2009
Closing date: 30 June, 2010

41
ACRONYMS BoARD Bureau of Agriculture and Rural Development
BoFED Bureau of Finance and Economic Development
BPR Business Process Reengineering
DFID Department for International Development (British overseas aid)
CIDA Canadian International Development Agency (Canadian overseas aid)
DCT Donor Coordination Team
DHS Demographic Health Survey
DWG Donor Working Group
EC European Commission (Rural Development and Food Security section of the Delegation to Ethiopia)
EFSRA Emergency Food Security Reserve Administration
EGS Employment Generation Scheme
EGTE Ethiopian Grain Trade Enterprise
EDRP Emergency Drought Recovery Project
ESMF Environmental and Social Management Framework
ETB Ethiopian Birr
EWRD Early Warning and Response Department (previously Disaster Preparedness and Response Agency)
FPWCU Federal Public Works Coordination Unit
FSCB Food Security Coordination Bureau (now FSCD)
FSP Food Security Programme
FSPt Food Security Project (Donor funded programme)
FSCD Food Security Coordination Directorate (previously FSCB)
FTAP Financial Transparency and Accountability Survey
FTC Farmer Training Centre
IFPRI International Food Policy Research Institute
IFR Interim Financial Report
IRR Internal Rate of Return
JCC Joint Coordination Committee
JRIS Joint Review, Implementation and Supervision [Mission]
KAC Kebele Appeals Committee
KFSTF Kebele Food Security Task Force
MDG Millennium Development Goal
MEHRET Managing Environmental Resources to enable Transition to Sustainable Livelihoods (Joint Programme between MoARD and WFP)

42
METT Monitoring and Evaluation Technical Taskforce
MoARD Ministry of Agriculture and Rural Development
MoFED Ministry of Finance and Economic Development
MoLSA Ministry of Labour and Social Affairs
NRMD Natural Resource Management Directorate
OFSP Other Food Security Programmes
OVI Objectively Verifiable Indicator
PASDEP Plan for Accelerated and Sustainable Development to End Poverty
PIM Programme Implementation Manual
PSNP Productive Safety Net Programme
PWFP Public Works Focal Person
RFSCO Regional Food Security Coordination Office
RPWFU Regional Public Works Focal Unit
RTCC Regional Technical Coordination Committees
SIDA Swedish International Development Agency (Swedish overseas aid)
SNNP Southern Nations, Nationalities and Peoples (Region)
SWC Soil and Water Conservation
USAID United States Agency International Development (US overseas aid)
WFP World Food Programme
GLOSSARY OF ETHIOPIA WORDS USED Belg Short rains, falling between February and May
Kebele Low level Government administrative unit. Kebeles tend to be made up of between 1,000 to 5,000 households.
Meher Long rains, falling between June and September
Woreda Mid-level Government administrative unit. Woredas tend to be made up of between 15 and 30 Kebeles

43
Table of Contents 1. Introduction .................................................................................... 43
2. Programme Objectives .................................................................. 44
3. Programme Scale and Coverage ................................................... 44
4. Programme Performance by Component .................................... 44
4.1 Safety Net Grants44 4.2 Institutional Support .......................................................... 47 4.3 Integrated Risk Financing ................................................. 48
5. Outcomes and Impact .................................................................... 48
6. Financial Management Performance ........................................... 50
7. Project Costs and Financing .......................................................... 50
8. Major Factors Affecting Programme Performance .................... 51
8.1 Efficiency ......................................................................... 52 8.1 Effectiveness .................................................................... 53
9. Lessons Learned ............................................................................ 54

44
1. Introduction The Productive Safety Net Programme (PSNP) was designed to make a transition from relief to development and from the traditional model of temporary response to chronic food insecurity through food aid and relief by creating a programme which not only met food deficits but also reduced household vulnerability and improved resilience against shocks. The PSNP approach is to support the creation of food security through protecting and building household assets and community assets. The objective of the Programme is to ‘provide transfers to the food insecure population in chronically food insecure woredas in a way that prevents asset depletion at the household level and creates assets at the community level16’. Using this approach the Programme expects to ‘address immediate human needs while i) simultaneously supporting the rural transformation process, ii) preventing long-term consequences of short-term consumption shortages, (iii) encouraging households to engage in production and investment, and (iv) promoting market development by increasing household purchasing power17’. The Programme expects to achieve the following outcomes: Food consumption assured and asset depletion prevented for [chronically] food insecure
households. Markets stimulated and access to services and natural resources enhanced for PSNP
[participants] and other households. Natural environment rehabilitated and enhanced18.
The PSNP Program (APL II) is made up of three components: i) Safety Net Grants ii) Institutional Support iii) Drought Risk Financing
The PSNP differs from the emergency system by improving the productivity of transfers; both through the focus on quality public works and by providing a significant proportion of transfers in cash, thereby stimulating markets through an increase in demand (and indirectly encouraging increased production and investment). The PSNP was officially launched in 2005, with an agreed plan to support 4.5 million chronically food insecure people in SNNP, Amhara, Tigray, Oromiya, Dire Dawa and Harari regions. In 2006, the programme plan was increased to provide support to 6.7 million in these six regions, as well as a further 472,229 in Afar region19. In 2008 a pilot pastoral safety net programme was launched in selected woredas of Afar, Somali, Oromiya and SNNP regions20.
16 Government of Ethiopia. Productive Safety Net Programme Programme Implementation Manuel. Addis Ababa, July 2006, p 1 17 Ibid p 1 18 Food Security Programme Department. Productive Safety Net Programme Logical Framework Report. Addis Ababa, Ministry of Agriculture and Rural Development, December 2007, pp1-2 19 The programme in Afar region only provides direct support, acknowledging the need to identify appropriate mechanisms for intervention in pastoral areas 20 Actual beneficiary numbers in each year were often higher with regions using the contingency budget to support additional households.

45
2. Programme Objectives As clearly stipulated in the APL II PAD and PSNP Programme Implementation Manual (2006), the development objective of the PSNP is to contribute to reducing household vulnerability and improving resilience to shocks. This will be achieved through reform of the humanitarian emergency system to a development-oriented program which provides timely, predictable and adequate transfers to beneficiary households. This allows for an effective consumption-smoothing and avoidance of asset-depletion; creates productive and sustainable community assets; contributes to large-scale rehabilitation of severely degraded areas; stimulates local markets through demand linkages; and establishes more effective responses to drought shocks to avoid increasing destitution among affected households.
3. Programme Scale and Coverage PSNP coverage has risen from 4.5 million beneficiaries in 2005 to its current 2009 coverage of 7.6 million. Initially launched in 192 woredas, the program currently reaches 292 chronically food insecure woredas in 8 of the country’s 10 regions. This is equivalent to roughly 10% of the total population in just over 40% of woredas. Table 1: Number of Woredas and Beneficiaries assisted by PSNP21 2007 2008 2009 Woredas Benefic-
iaries Woredas Benefic-
iaries Woredas Benefic-
iaries Amhara 62 2,519,829 64 2,519,829 64 2,519,829
Oromiya 62 1,378,876 71 1,378,876 78 1,438,134
SNNP 58 1,298,981 79 1,298,981 79 1,459,160
Tigray 31 1,453,707 31 1,453,707 31 1,453,707
Dire Dawa 1 52,614 1 52,614 1 52,614 Harari 1 16,136 1 16,136 1 16,136 Afar 29 472,229 29 472,229 32 472,229 Somali 0 0 6 162,671 6 162,671 TOTAL 244 7,192,372 282 7,355,043 292 7,574,480
4. Project Performance by Component 4.1 Safety Net Grants
Labour-intensive public works (PW) provide grants to households whose adults participate in public works sub-projects. Sub-projects to be undertaken are determined locally by the beneficiary communities through an annual, participatory planning process that focuses on integrated watershed management. Since the most appropriate time for undertaking public works is during agricultural slack season, which occurs in general between January and June in Ethiopia,
21 Source: Federal Food Security Coordination Bureau (now Food Security Coordination Directorate) Annual Plans 2007-2009. As these numbers are based on plans, they do not include information on the number of beneficiaries covered through contingency resources.

46
most public works and payments were scheduled during this period, although some works, such as afforestation, will continue through August. This timing is also beneficial to households by ensuring that the bulk of transfers are provided to them before the “hungry” season starts (around June). The timing of PW aims for households to have the resources available when they are needed, as well as works to be undertaken at the most appropriate time in terms of weather conditions and when labor demand from alternative agricultural activities is at its lowest. Table 2: Data on Cash Food Split
It should be noted that pastoral woredas in Afar and Borena are all food woredas that receive 9 months of support, which adds quite a bit to the overall food resource requirement of the program. In addition, there were slightly more pastoral woredas added under the pastoral pilot in 2009 compared to 2008. Additionally, it is important to note that the pastoral pilot began in 2008. The difference between the planned and actual in 2009 is also related to the switch of 22 woredas in SNNPR from a cash-food split to all cash. The erosion of the purchasing power in 2007, 2008 and 2009 led more woredas to request a switch to food. However, because of a short-fall in food resources in the Programme, the Government provided cash transfers when prices were low instead of engaging in a larger local or international food purchase. In 2009, the Government, for the first time, used the cash-food split as a risk management tool, which meant that , it provided ALL woredas with three months cash and then three months food transfers to secure the protective function of the transfers. This was designed in response to the rapid food prices rises that had occurred the year before in the months leading up to the harvest, i.e. from May onwards. Roughly 6.65 million people received food transfers, often combined with cash transfers. A major focus of APL II was on improving the quality and environmental impact of the public works activities. In order to achieve this, the Government established Public Works Focal Teams in the Natural Resources Department of the Bureaus of Agriculture and Rural Development (BOARD) in each implementing Region as well as at federal level in the Natural Resources Management Directorate of Ministry of Agriculture and Rural Development (MoARD). These teams were resourced and charged with the responsibility for technical planning, oversight and back-stopping woredas in the implementation of appropriate, high-quality Public Works sub-
0%10%20%30%40%50%60%70%80%90%
100%
Plan Actual Plan Actual Plan Actual
2007 2008 2009
Cash Food Overall trend:food to cash

47
projects. This will also serve to strengthen implementation of the Environmental and Social Management Framework, which fell largely within their remit.
Table 3: Major public works outputs, 2007-2009 Sub-projects Unit 2007 2008 2009 Total 1 Soil and Water Conservation
Land rehabilitated through Area Closure hectares 47,154 25,323 94,673 167,150 Soil Embankment Construction km 33,285 21,279 36,890 91,454 Stone Embankment Construction km 38,190 54,669 91,871 184,730 Seedling production Number 301,778,600 887,990,000 132,169,420 1,321,938,020Seedling planting Number 12,883,657 852,480,000 17,958,043 883,321,700 Nursery site establishment and management Number 285 419 410 1,114
2 Water Supply Pond Construction or rehabilitation Number 88,936 31,594 13,397 133,927 Spring development Number 598 1,537 1,549 3,684 Hand-dug Well Construction Number 491 771 1,262 Small-scale irrigation canal contr. Or rehab. km 2,679 712 2,355 5,746
3 Social Services School construction , expansion or repair Number 340 1,291 446 2,077 Health post construction Number 71 56 105 232
4 Community Roads Roads construction km 8,323 8,683 6,730 23,736 Roads maintenance km 20,458 12,120 9,839 42,417
Two budget lines for capital inputs and administrative/management costs were allocated to woredas alongside the financing for the unskilled labor costs (i.e. the transfers to households for public works). Furthermore, under APL II financing for Public Works was transferred from Federal levels to Regions and woredas before the start of the PSNP implementation season, to ensure that woredas had the funds to procure tools and materials and start activities in a timely way. “Info-techical notes” or technical guidelines and work-norms were developed by MOARD for different types of labor-intensive Public Worksand made available to PSNP implementers. During APL II the PSNP planning cycle was aligned with the annual Government financial and planning calendar at each level. Moreover, APL I conducted the annual Public Works Review, this was scaled up to become a key part of monitoring the implementation of public works on a semi-annual basis. The reviews provided an opportunity for inter-regional learning and sharing of best practice. Direct support (DS) provided grants to households who are labor-poor and cannot undertake public works. Beneficiaries included, but were not limited to, orphans, pregnant and lactating mothers, elderly households, other labor-poor, high risk households with sick individuals (such as people living with HIV/AIDS), and the majority of female-headed households with young

48
children and no other available adult labor. During the interim period while work was ongoing in design of safety nets appropriate to pastoral communities, payments to the chronically food insecure woredas in pastoral areas in Afar were also made via Direct Support. Table 4: Annual Direct Support Participants as a Percent of PSNP Population by Region
2007 2008 2009 2009 DS as a % of Total
Amhara 272,701 271,880 282,435 11% Oromiya 214,451 214,629 226,201 15% SNNP 244,327 244,010 299,853 20% Tigray 276,204 305,278 162,559 11% Dire Dawa 7,892 7,895 7,895 15% Harari 1,675 1,598 2,073 12% TOTAL 1,017,250 1,045,290 1,615,916 21%
Operational modalities for the implementation of the DS Component were strengthened during APL II, incorporating lessons learned from the first phase. Implementation guidelines were further clarified and/or strengthened in regard to the types and levels of support for female-headed households, definition of work norms taking gender considerations into account, the use of capital and administrative/management budgets to support DS beneficiary participation in and/or contribution to community activities, including training to increase their future productivity, and monitoring of DS activities. Under APL II, a unified beneficiary list integrating public works beneficiaries and direct support beneficiaries was adopted. Capacity at woreda level was strengthened through the provision of training, back-stopping and technical support. Opportunities for strengthening linkages with other ongoing programs, particularly in the delivery of training to DS beneficiaries (i.e. literacy classes; child nutrition/growth classes, awareness campaigns for HIV/ AIDS) were also focus areas.
4.2 Institutional Support This component supported institutional strengthening activities, including related management costs, during the APL II implementation period. These costs were covered from different funding sources. Apart from the program budget, there were additional financing contributions from different donors, e.g. DFID managed a technical assistance call-down facility, CIDA paid directly for TAs, while CIDA, DFID, and Irish Aid provided funds through a multi donor trust fund managed by the World Bank. Activities supported through this component included: Program management costs and capacity building at community level to strengthen beneficiary identification and local level planning; at woreda and regional level to improve financial management and procurement capacity, and at all levels to improve technical supervision of public works to ensure that sub-projects are designed and implemented appropriately. Monitoring and evaluation focused on the implementation of the monitoring framework designed under APL I and included additional instruments such as the Rapid Response Mechanism and Information Centre which are critical to ensuring smooth program implementation. Among others it focused on improving monitoring of public works through the scaling up of the annual Public Works Review. It also financed the impact evaluation survey based on the baseline survey implemented under APL I, social assessment to ensure proper treatment of social factors that affect the implementation, quality, effectiveness and impact of safety net activities, and beneficiary assessments to assess beneficiary satisfaction with safety net interventions. Strategic

49
training activities to further strengthen capacity for monitoring, evaluation, and reporting were implemented at all levels. Transparency and accountability measures were put in place that ensure widespread understanding of program objectives, procedures, and implementation progress among key stakeholders, both domestic and international. This included development of material on program objectives and procedures suitable for communication at community level; beneficiary assessments, and the publication of critical program information at federal level through various media, etc. The Institutional Support component also financed several studies and pilots that were included as triggers for APL III. These defined the supporting interventions necessary to promote graduation and determine how they should be appropriately integrated with the PSNP.
4.3 Integrated Risk Financing While Component 1 (Safety Net Grants) focused on the chronically food insecure, Component 3 (Integrated Risk Financing) sought to provide timely resources for transient food insecure households in response to shocks within existing program areas. This component was seen as central to the sustainability of the overall PSNP by providing an early response which could more effectively prevent household asset depletion and prevent increased levels of destitution. Given that the required volume and proposed use of resources is contingent on the size and nature of a specific drought event, this component aimed to develop the Livelihood Protection Cost Index – a rainfall based index utilizing 30 years of rainfall data in Ethiopia, in order to eventually trigger and scale disbursements. While it was envisaged that the index will, in due course, be the principal instrument to be used for triggering financing for this component, it was agreed that alternative methodologies may also be used if they can ensure a timely, objective, and transparent response. Integrated risk financing was channelled to woredas using existing distribution systems established under the PSNP according to pre-established contingency plans. Table 6: Utilization of Drought Risk Financing Mechanism by Year 2008 2009 Total # of beneficiaries incorporated under DRF
4.43 6.42 10.85
# of additional beneficiary months of PSNP support (millions)
9.2 12.84 22.04
5. Outcomes and Impact Recent independent impact evaluations, together with a series of qualitative studies, show that the PSNP is having a positive impact on the livelihoods of households, and is significantly enhancing community level infrastructure and contributing to environmental transformation. The positive impact has been demonstrated in crisis and non crisis periods. These same studies highlight, that the impact of the PSNP is much more significant and effective and appears across a wider range of indicators when households receive more support from the Program. The impact of the PSNP is measured against the outcome indicators for APL II, namely reported food security and asset protection, and a range of other indicators at household and community-levels. The impact at household level was measured using the following indicators:

50
(a) Improved Food security: The impact evaluation found that participation in the PSNP
significantly improved household food security, as measured by changes in the self-reported household food gap. The impact of the PSNP on food security was found to be larger when transfers were predictable and of a higher value22. Households that received these transfers and inputs from the household asset building program experienced an improvement in food security by 0.81 months (or 25 days).
(b) Improved Nutrition : Moreover, participation in the PSNP increased caloric acquisition by 19.2 percent among households that received regular, higher value transfers as compared with non-beneficiary households23.
(c) Increased Asset creation and protection: The PSNP is having a significant impact on asset accumulation24. The growth rate in livestock holdings among PSNP beneficiaries was 28.1 percent faster than among non-beneficiaries. This is supported by evidence from other surveys that shows that PSNP beneficiaries are using part of their cash transfers to invest in farming inputs and livestock. These findings also hold true during times of crises, when the PSNP has proven to be effective at helping households avoid distress sales of assets.
(d) Increased Utilization of education and health services: PSNP beneficiaries have increased their use of social services. In 2006, 46.1 percent of PSNP beneficiary households reported that they used health facilities that year to a greater extent as compared with the year before and 76 percent attributed this to the PSNP. In 2008, 26.7 percent of households reported increased use of health facilities over 2007 and 47 percent attributed this increase to the PSNP. This information, together with reports that PSNP beneficiaries use some of their cash transfers to invest in health and education, suggests that the Program is having a positive impact on human capital accumulation.
(e) Improved Agricultural productivity: The PSNP is enabling households to take risks that improve household productivity. A major finding of the impact evaluation was a synergy between the OFSP and PSNP. While OFSP has only a marginal impact on agricultural productivity when implemented alone, when combined with the PSNP the results showed a 38 percent increase in maize yields. This suggests that by allowing households to focus on long-term investments and providing more regular cash flow, the PSNP is a critical element of a strategy to effectively improve agricultural productivity.
A growing body of evidence shows that the PSNP is having a significant positive impact at community level:
(i) Increased wood and vegetation cover: The Public Works Impact Assessment carried out in 2009 found that soil and water conservation activities have significantly increased wood and herbaceous vegetation cover.
(ii) Increased domestic water supply through increases in spring water, groundwater
levels and increased infiltration. The construction of soil and water conservation structures within the closed areas has reduced surface runoff, increased infiltration and raised groundwater levels, thereby enhancing spring yields and increasing
22 Higher value is defined as receipt of transfers worth at least 900 ETB between 2006 and 2008. 23 “Non-beneficiary households” refers to a control group established using matching methods. 24 The term ‘implemented as designed’ refers to when PSNP beneficiaries receive a significant proportion of their entitlement, that is, at least 900 ETB between 2006 and 2008, and the transfers arrive on time at regular intervals. This is the basic design of the PSNP. The impact evaluation shows that PSNP is not implemented in this way in all areas.

51
stream base-flows. In several communities, springs last longer into the dry season. Additionally, the number of domestic water supplies has doubled.
(iii) Improved Livelihoods: There is evidence that these community-level benefits are
resulting in improved livelihoods. An estimated 34 percent of households surveyed reported significant benefits from the closed areas that had increased the availability of forage for livestock. Up to 87 percent of households reported that family health had improved as a result of access to PSNP water supplies. It is important to note that these benefits accrue to the community at large beyond the immediate target group of the Program.
In conclusion, the overarching finding on program designed outcomes and impacts is that PSNP there are significant positive benefits at household and community levels. The results of these surveys, together with administrative data, show that the Program is being implemented effectively in many areas. While the usual variation between Regions and woredas performance exist in areas such as timeliness of transfers to beneficiaries and the technical quality of public works these are being addressed through project implementation. .
6. Financial Management Performance
The financial management of the PSNP has improved over time. In 2006, responsibility for financial management was shifted from FSCB to MOFED. While capacity constraints within the MOFED system initially resulted in delayed reporting and other weaknesses but have improved over times.. In particular, the quality and timeliness of financial reports has improved. In terms of external audits, the first year external audit by the national audit agency was delayed because of agency backlogs. All audits of the PSNP to date have been qualified, citing miscoding of expenditure and poor record keeping. However, this has been attributed to systemic capacity constraints rather and the audits have found no evidence of systematic corruption. To address the delays in the external audit, the PSNP adopted a system of external “roving audits” to provide feedback on financial management performance in advance of the annual external audit. The roving audit found some instances of weak performance (e.g., purchase of ineligible items, lack of approval of payrolls) but no indication of systematic corruption. In 2009, the audit function was expanded to consider food resources as well, thereby applying the same accountability criteria to both cash and food resources.
7. Project Costs and Financing
(A) Project Cost by Component (in USD Million equivalent)
Components Appraisal Estimate
(USD millions)
Actual/Latest Estimate (USD
millions)
Percentage of Appraisal
1. Component 1: Safety Net Grants A. Sub-Component Public
Works B. Sub-Component – Direct
Support
353.27
210.82

52
Contingencies for Food and Cash Transfers Capital and Administrative Budgets Sub-Total
139.75
132.67
838.50
983.9
117% 2. Drought Risk Financing 25.00 50.5 202% 3. Institutional Support 47.29 41.7 88%
Total Baseline Cost 909.30 Physical Contingencies 3.00 Price Contingencies 3.00
Total Project Costs 915.30 1,076.0 118%
(b) Financing
Source of Funds Type of
Cofinancing
Appraisal Estimate
(USD millions)
Actual/Latest Estimate
(USD millions)
Percentage of Appraisal
Opening Balance (carry-over of resources from PSNP I)
56.5 81.0 143%
Government of Ethiopia 2.0 1.1 55% International Development Association (IDA) – Grant
175.0 207.9 119%
Department for International Development (DFID)
194.6 139.4 72%
European Commission 195.6 160.3 82%Irish Aid (DCI) 18.0 47.7 265%United States Agency for International Development (USAID)
38.0 314.2 827%
CIDA 14.4 84.7 607%World Food Program 26.6 25.1 94%Swedish International Development Agency (SIDA)
29.5 n.a.
Embassy of the Kingdom of the Netherlands (EKN)
31.3 n.a
Global Facility for Disaster Reduction and Recovery
0.3 n.a
Closing Balance/Financing Gap or Surplus
194.6 -49.2 n.a.
Total 915.3 1,076.2 118%
8. Major Factors affecting project performance The PSNP Programme represents a massive and remarkable undertaking in terms of the scope of its coverage, the number of implementing and donor partners and the level of coordination required at every level and between every stakeholder. The coordination of the PSNP program by the Government and its partners is in itself is an achievement worth noting. The speed at which administrative structures were set-up and the Programme rolled-out in ways which ensured a reasonable standard of programme operation even in the first year is reflective of this fact. The

53
Programme implementation teams and decision makers have demonstrated a high willingness and openness to assessing and addressing challenges and adjusting the design and implementation course. This has enabled programme adjustments and has ensured improvements in programme implementation throughout the life of the program to date. The Government and partner teams are in agreement that the implementation issues that arise do so because of capacity constraints. These challenges are summarized and presented below:
8.1 Efficiency General Management On a number of topics (for example ESMF, targeting and use of the contingency), there has
been a significant gap between understanding at the federal level and actual implementation in the woreda.
Staffing: The Mid-Term Review highlighted the mostly positive impact of Business Process Re-
engineering on the staffing profile of MoARD and other agencies engaged in PSNP implementation.
There are significant numbers of contract staff engaged in programme implementation due to human resource capacity constraints within the government. Furthermore management support is provided through a range of task teams and the donor group (in particular the Donor Coordination Team). While the original programme design sought to make use of existing government structures rather than making use of a Programme Implementation Unit; capacity constraints and limited number of staff within the Government structures required increases in short term capacity increases in staff. The employment of contract staff is one of the few tools available to the programme to ensure adequate staffing. Furthermore, it is hoped that the need to operate the PSNP at its current scale will be viewed as consistent with the program objectives in the longer term. The level of dependence currently on contract staff and how their services are utilized and managed should be reviewed to ensure that the principle of core government structure management and oversight is maintained. Contract staff use should be to bolster, rather than substitute core government capacity.
Public Works: The majority of Public Works are meeting technical standards. In July 2008, the NRMD
formally re-asssumed responsibility for PSNP public works management and coordination. However, capacity constraints prevented the establishment of a fully functioning federal PWCU, and the regional PWFUs remain considerably below capacity.
Challenges remain in closing the gap between public works plans and achievements. In 2008, according to the Public Works Review 100% of soil and water conservation projects met the standards to at least a minimum acceptable level, and 87% of other projects. The areas of concern in terms of technical quality are rural roads, water and potable water projects. Also of concern are the availability of resources for operation and maintenance for potable water and small scale irrigation projects. Quality of PWs such as roads, water and irrigation systems also requires significant oversight to ensure that these works are sustainable. .
Training: Better linkages and follow-up are needed in the training provided under the PSNP program.
There is a need for closer linkages between training design and monitoring of results of training and its application by trainees.

54
Markets: The PSNP is expected to have positive impacts on markets (and there should be management
strategies in place to avoid any negative impacts), while APL II had limited mechanisms in place to enable market monitoring or to assess impacts on markets, the ongoing Program would take this into account.
Monitoring and Evaluation: Reporting formats were largely adhered to, however the quality of monitoring reports and the
timeliness of report submission remained challenges. Furthermore, accurate and regular consolidation and analysis of monitoring information is also weak. Conversely there was limited feedback on reports submitted by Government. These issues highlight capacity constraints at different levels in the system.
At present much of the focus of the monitoring and evaluation system is about reporting upwards through levels of government. There needs to a larger effort on fostering meaningful discussion concerning the utilisation of monitoring or evaluation information at woreda level.
Of particular concern has been the capacity of data collection and evaluation that impacts the quality of data for public works. The implementation and performance of monitoring and evaluation is weak between the woreda to the regional to the federal level. Monitoring and evaluation of public works is the mandate of the regional PWFUs, however the works are at the Woreda level and at the regional level the capacity to assume this role is weak this is, to a large extent, a reflection of some of the institutional constraints at federal and regional level highlighted above. It may also suggest a lack of capacity at woreda level.
The PSNP does aim to contribute to the reduction in malnutrition of children under five (with an indicator at super-goal level). These outcomes have not been captured in APLII and would need to be incorporated in regular evaluation exercises or specific studies related to ongoing APLIII phase of the PSNP programme.
Monitoring of food within the PSNP programme, and consolidated of data within the FSPD concerning food programming in woredas which also receive NGO support would need to be strengthened in the APLIII.
8.2 Effectiveness Transfers: Several implementation issues require fine tuning during the next phase of the PSNP
program, these include the timely transfers of food and cash; the composition of transfers in cash rather than food; and receipt of less than full transfers.
Although timeliness of transfers has improved significantly and is approaching performance targets, nearly 60% of beneficiaries state that they receive transfers but do not receive their transfers on time and are unable to plan ahead. As a result only 27% feel that PSNP transfers enable them to plan ahead. Furthermore, there are who are beneficiaries are not receiving the transfer they would choose; in part because a greater proportion of the Programme is being provided in cash despite the severe erosion in purchasing power of cash transfers.
Both the Panel Survey and the FTAP Survey indicate that there are beneficiaries who report that they do not receive their transfers in full. A number of factors could cause this (misunderstanding of entitlement, payments forfeited due to failure to complete public works, misappropriation of funds by woreda staff or kebele officials).25
25 Annual and roving audits have not uncovered any misappropriation of fund

55
Public Works The majority of public works are meeting technical standards. In 2008, according to the
Public Works Review 100% of soil and water conservation projects met the standards to at least a minimum acceptable level, and 87% of other projects. The major areas of concern in terms of technical quality are rural roads, water and potable water projects. Also of concern are the availability of resources for operation and maintenance for potable water and small scale irrigation projects.
Linkages During APL II links between the PSNP and the emergency system were in transition. As a
result there have been areas where there has been a lack of coordination and smooth transition which increased the likelihood that vulnerable people have not been assisted in a timely manner (and may in some cases have fallen through the gaps). The program implementation team recognizes that such gaps must be addressed because the program must adequately address the needs of vulnerable people whether they are current PSNP beneficiaries or not. Timely addressing of needs would assist in reducing the programme cost for the future.
There have been significant improvements in the concentration of both PSNP and OFSP resources on target households. Full coverage of all PSNP beneficiaries remains to be completed for household assets The Government considers building of household assets as the most likely path to graduation.
9. Lessons Learned
The PSNP has evidence based results that show that it has stabilized livelihoods, created productive assets, improved natural resource management and improved food security in households. The Program has demonstrated the value of a shift away from a humanitarian response system to a more development oriented approach to addressing food gaps. There is evidence that livelihoods are stabilizing and food insecurity is being reduced among beneficiary households. There is also evidence that public works are creating productive assets and improving the natural resource base in treated areas.
The improvements to the OFSP and FSP identified elsewhere, demonstrate a viable safety net, however graduation to date out of the program has been below Government expectations. This raises the question of whether all chronically food insecure households can be graduated quickly out of the program or whether the process takes a longer time to achieve with a recognition that there will be a subset of households in the future that will continue to need support or will come in and out of needing support. It is necessary to explore the strategies that would need to be put in place that address the need for a permanent Safety Net and strategies that provide a range of pathways to graduation for those households which achieve sustainable food security. The role of the PSNP should grow into a institutionalized Safety Net that reduces risks to food security and disasters and which, because of its focus on securing the most vulnerable, enables a wider set of integrated interventions and strategies on job creation, the wider economy and education to achieve sustainable paths to sustainable incomes and development.
Efforts need to be made to better understand through the program evaluations and assessments, the choices made by the most vulnerable and their reluctance to graduate out of the program. It may be possible that this lack of confidences reflects the fact that household asset building and security takes time and the economic fragility of the most vulnerable exposes them to a high level of risk and at the slightest of climatic or economic shocks such as high levels of inflations which can overturn and wipe out the gains they have made in a previous season.

56
To mitigate some of the risks associated with graduation from PSNP a phased approach to graduation should be explored, by which households which are making progress towards graduation still receive some support but for a reduced number of months. This has already been agreed during the October 2008 Mid-Term Review and could be linked with the ongoing ‘Variable levels of support’ pilot.
It is possible to roll-out complex programmes in environment’s where capacity is limited, but it requires:
o A significant investment in training (not only once of, but repeated trainings on the same topics).
o An ability and willingness to monitor programme implementation and be flexible to make adjustments when needed.
Though unavoidable overall the PSNP would have benefited from a more systematic capacity building approach. Due to the rapid roll-out of the Programme, at the time of a food crisis capacity building efforts tended to be reactive (computers provided in the second or third year of the programme rather than at the programme start).
There is a need to balance out tasks for policy making between the different levels of Government. For example the concept of food insecurity is one example where those at the local level who are responsible for targeting find it easier to assess depth of need or lack of assets.
The strongest implementation comes when key stakeholders have a shared understanding of programme goals and principles and this in part accounts for differences in the quality of implementation from woreda to woreda. Ensuring ownership and shared understanding political and administrative stakeholders as well as technicians is important. Further work in defining key principles may better enable the development of this shared understanding.
The design of the Risk Management component going forward in the next phase would need to ensure strong links with the activities and responsibilities of the Early Warning and Response Directorate and coherence with the revised National Disaster Policy.
Experience from APL II demonstrates that mechanisms to ensure ongoing operation and maintenance of public works are a critical aspect to the sustainability of public works. All public works should have defined “owners” after completion. These ‘owners’ are those who have rights of use, and therefore the obligation to maintain and manage assets. In many cases, user rights arrangements will involve the creation of group by-laws governing access, and management and responsibility obligations. They may also require the establishment of a system to collect user fees. These user rights and maintenance responsibilities need to be defined during the planning process to establish a sense of ownership by the benefiting community or group. Ensuring a common understanding between community asset ‘owners’ and Woreda government service providers on what further support ‘owners’ can expect to receive, once the asset has been handed over, is critical. A Regional Technical Coordinating Committee is responsible for ensuring budget provisions for the operation and maintenance of new infrastructure in all sectors including health and education; and (iii) ensuring the active participation and technical inputs of the relevant line bureaus and offices in the implementation and monitoring of the PW program.
Going forward, programme size and cost are likely to be pushed higher by the following factors: i) formal inclusion of the chronic caseload currently covered using the PSNP contingency, ii) potential increases in the number of chronically food insecure households as a result of drought or food price inflation, iii) population growth, iv) the risk financing initiative and v) expansion of the programme fully into pastoral areas. Furthermore, the focus on improving the overall FSP is likely to create more demands on donor and Government financing. A realistic review of what is affordable needs to be undertaken, with a clear

57
determination of what cannot be covered so that expectations are not raised or to enable other sources of financing to be secured.
The decision by MOLSA to develop a national action plan for Social Protection (mentioned in the October 2008 Mid Term Review) provides an opportunity to develop a long-term vision for safety net programming in Ethiopia. MoARD will engage in the debate to ensure that the PSNP is fully represented in the policy especially for direct support, and that there is a coherent overall strategic vision which supports the needs of different groups, avoiding overlaps but minimizing gaps.

58
Annex 7. Comments of Borrower, Cofinanciers and Other Partners/Stakeholders (a) Borrower/implementing agencies In addition to the discussions with key government stakeholders during the ICR mission, written comments were received from the DRMFSS. As overall coordinator of the program DRMFSS made some editorial comments on the draft text of the ICR. These comments were incorporated in the final version of the ICR. In addition DRMFSS expressed disagreement with the moderately satisfactory rating for the performance of the implementing agencies. In view of DRMFSS the program represents a massive undertaking in terms of scope and coverage as well as input at all administrative levels of the Government staff. Government program implementation teams and decision makers have demonstrated high willingness and openness to assessing and addressing challenges during implementation. Over the course of APLII the program has seen a year on year improvement in the implementation of the program, DRMFSS is therefore of the opinion that the implementing Agencies have performed satisfactory. (b) Cofinanciers and stakeholders All main donors were consulted during the ICR mission and written comments on the draft ICR were received from Irish Aid, CIDA, Netherlands Embassy, DFID, USAID and WFP. Overall the development partners found that the ICR was a well presented and informative document that is effective in capturing APL II results, the implementation experience and lessons learned. Irish Aid indicated that while the Lessons Learned section of the document could be expanded, in combination with the excellent 2010 "Designing and Implementing a Rural Safety Net in a Low Income Setting; Lessons Learned from Ethiopia's PSNP 2005-09", the two documents combined are a really useful reference set regarding the achievements and challenges of the programme to date. CIDA pointed out that donor engagement in their view was a key success factor and also highlighted that no reference was made to the involvement of NGOs in the implementation of the program. It also wanted the ICR to mention the financial support of CIDA and EC for technical assistance to the federal level implementing partners as well as the challenges with the implementation of full family targeting. CIDA also provided a detailed set of editing comments. The Embassy of the Kingdom of the Netherlands (EKN) indicated that they are in agreement with the content of the report and specifically supported the low rating for the risk associated with the program. EKN further found the lessons learned section useful and indicated that the report makes a strong case for continuation of the program. DFID noted that most key information related to APLII was captured in the report but suggested that in the lessons learned section the ICR could reflect more on (i) the positive impact on program implementation of the establishment technical committees and task forces at the local level; (ii) the improvements in timeliness of transfers due to the introduction of the automated payroll and hiring of additional accountants and cashiers; (iii) the establishment of the appeal system improved local accountability and (iv) the proactive engagement of the Donor Working Group to involve high level decisions makers when

59
required. USAID described the report as a solid piece of reporting that will be a useful reference in future. Especially the narrative on the additional benefits of the PSNP was found useful. It pointed out that the explanatory text for indicator one could be confusing for the less informed reader and suggested reformulation. WFP noted that as PSNP PW projects are significantly contributing to climate change adaptation and mitigation through degraded land rehabilitation, biodiversity improvements and natural resources and environmental management etc. WFP therefore recommended strengthening the report by reflecting more on the PW outcomes in relation to climate change. All above comments were taken into consideration in the final version of the document.

60
Annex 8. List of Supporting Documents Amha W. Assessment of the credit component of Government financed household food security package program.Draft report. Addis Ababa, Government of Ethiopia, 2008. Anderson K, and W. Masters. Distortions to Agricultural Incentives in Africa, Washington, D.C.: World Bank, 2009. Behnke R et al. Piloting the PSNP in pastoral areas of Ethiopia. Revised program proposal. Addis Ababa: Food Security Coordination Bureau, 2007. Campbell I. Presentation on the PSNP Public Works for World Bank HD learning week, PowerPoint Presentation. Washington, D.C: World Bank, 2008. Campbell, I. Presentation to donors on new PW arrangements. Mimeo, 2008. Campbell White A et al. Study for Mainstreaming HIV and AIDS into PSNP operation in Ethiopia. Addis Ababa: Food Security Coordination Directorate and PSNP Donor Working Group, 2009. Devereux S et al. Ethiopia’s Productive Safety Net Program: 2008 Assessment Report. Brighton and London: Institute of Development Studies and Overseas Development Institute, 2008. Dorosh P, and L. Subran. Food Markets and Food Price Inflation in Ethiopia. Washington, D.C. and Rome: World Bank and World Food Program, 2007. DFID. Fiduciary risk assessment in the PSNP, 2008. Evers B, et al. Contextual Gender Analytical Study of the Ethiopia Productive Safety Nets Program. Addis Ababa: Ministry of Agriculture and Rural Development, 2008. Federal Democratic Republic of Ethiopia. Government report on implementation of the PSNP Draft. Jan 2009. Federal Democratic Republic of Ethiopia (2007) Food Security Program: Progress made in building assets of food insecure households, FSCB, MoARD, Addis Ababa, July, 2007. Federal Democratic Republic of Ethiopia. The new coalition for food security in Ethiopia: Food Security Program: Policy Document & Monitoring and Evaluation Plan, May 200, Food Security Coordination Bureau: Addis Ababa) Federal Democratic Republic of Ethiopia. Ethiopia: Building on Progress: A Plan for Accelerated and Sustained Development to End Poverty (PASDEP). Addis Ababa: Federal Democratic Republic of Ethiopia,2006a .

61
Federal Democratic Republic of Ethiopia. The New Coalition for Food Security in Ethiopia. Addis Ababa: Federal Democratic Republic of Ethiopia, 2006b. Food Security Coordination Bureau. PSNP Graduation Guidance Note. Addis Ababa, Ministry of Agriculture and Rural Development, 2007. Food Security Coordination Directorate. EFY 2002 PSNP Annual Plan. Addis Ababa: Food Security Coordination Bureau, 2009a. Food Security Coordination Directorate. Report to the October 2008 PSNP Mid-Term Review Mission. Addis Ababa: Food Security Coordination Directorate, 2008. Gill G. The Productive Safety Net Programme: Institutional Lessons Learned. A Report to DFID-Ethiopia. Addis Ababa: DFID-Ethiopia, 2006. Hess U, and W. Wiseman. Drought risk financing paper. Washington, D.C. and Rome: World Bank and World Food Program, 2006. IFPRI/CSA. Ethiopia Food Security Program: Report on the 2008 Survey. Washington, D.C. and Addis Ababa: IFPRI and Government of Ethiopia, 2009a. IFPRI/CSA. Ethiopia Productive Safety Net Program Impact Assessment. Washington, D.C. and Addis Ababa: IFPRI and Government of Ethiopia, 2009b. IFPRI/CSA: A Further Analysis of the 2006 Productive Safety Nets Program Baseline Survey. Washington, D.C. and Addis Ababa: IFPRI and Government of Ethiopia, 2007. IFPRI/CSA. Ethiopia Food Security Program: Report on the 2006 Survey. Washington, D.C. and Addis Ababa: IFPRI and Government of Ethiopia, 2006. IDL group. Building consensus for social protection: Insights from Ethiopia’s PSNP. London: UK Department for International Development, 2008. Kassie M et al. Economics of Soil Conservation Adoption in High-Rainfall Areas of the Ethiopian Highlands. Environment for Development Discussion Paper Series, 2008. Kassie M. et al. Estimating Returns to Soil Conservation Adoption in the Northern Ethiopian Highlands. Addis Ababa: Environmental Economics Policy Forum for Ethiopia, 2007. M.A Consulting Group. Impact Assessment Study Report for PW Component of the PSNP in Ethiopia. Addis Ababa: Government of Ethiopia, 2009. Ministry of Agriculture and Rural Development. Productive Safety Net Programme, Revised Programme Implementation Manual. Draft. Addis Ababa: Government of Ethiopia, 2010.

62
Ministry of Agriculture and Rural Development. Review of the PSNP. Addis Ababa: Government of Ethiopia, 2009a. Ministry of Agriculture and Rural Development. Review of the Other Food Security Program. Addis Ababa: Government of Ethiopia, 2009b. Ministry of Agriculture and Rural Development. Food Security Program 2010–2014. Addis Ababa: Government of Ethiopia, 2009c. Ministry of Agriculture and Rural Development. Productive Safety Net Program 2010–2014. Addis Ababa: Government of Ethiopia, 2009d. Ministry of Agriculture and Rural Development. Household Asset Building Program 2010–2014. Addis Ababa: Government of Ethiopia, 2009e. Ministry of Agriculture and Rural Development. 2008 1st PSNP Public Works Review. Addis Ababa: Government of Ethiopia, 2008a. Ministry of Agriculture and Rural Development. 2008 2nd PSNP Public Works Review. Addis Ababa: Government of Ethiopia, 2008b. Ministry of Agriculture and Rural Development. Drought Risk Financing Manual. Addis Ababa: Government of Ethiopia, 2008c. Ministry of Agriculture and Rural Development. 2007 1st PSNP Public Works Review. Addis Ababa: Government of Ethiopia, 2007a. Ministry of Agriculture and Rural Development. 2007 2nd PSNP Public Works Review. Addis Ababa: Government of Ethiopia, 2007b. Ministry of Agriculture and Rural Development. Joint Review and Support Mission Aide-Memoire of PSNP APL II, May 2007. Addis Ababa: Ministry of Agriculture and Rural Development, 2007c . Ministry of Agriculture and Rural Development. Productive Safety Net Program, Program Implementation Manual (PIM), July 2006. Addis Ababa: Ministry of Agriculture and Rural Development, 2006a. Ministry of Agriculture and Rural Development. Environmental and Social Management Framework (ESMF); Federal Democratic Republic of Ethiopia Productive Safety Net Programme Phase II. Addis Ababa: Ministry of Agriculture and Rural Development, 2006b. Ministry of Agriculture and Rural Development. 2006 PSNP Public Works Review. Addis Ababa: Government of Ethiopia, 2006c.
63
Nyssen J et al., “Interdisciplinary on-site evaluation of stone bunds to control soil erosion on cropland in Northern Ethiopia” Soil and Tillage Research, 2007, 94(1):151–163. PSNP Donor Working Group. Study for mainstreaming HIV and AIDS into PSNP operation in Ethiopia. Final Report. June 2009. PSNP Donor Working Group. Background issues paper for the PSNP October 2008 Mid-Term Review. Addis Ababa: PSNP Donor Working Group, 2008a. PSNP Donor Working Group. Donor issues paper on contingency and response to shocks for MTR. Addis Ababa: PSNP Donor Working Group, 2008b. PSNP Donor Working Group. Donor issues paper on graduation for MTR Addis Ababa: PSNP Donor Working Group, 2008c. PSNP Donor Working Group. Donor issues paper on linkages for MTR Addis Ababa: PSNP Donor Working Group, 2008d. PSNP Donor Working Group. Donor issues paper on transfers for MTR Addis Ababa: PSNP Donor Working Group, 2008e. PSNP Donor Working Group. Issues paper from emergency group – MTR donor issues paper Addis Ababa: PSNP Donor Working Group, 2008f. Rashid S et al. Cereal markets and productive social safety net program (PSNP) in Ethiopia, Policy Brief 4, Addis Ababa: UNECA, 2008. Risner C. Final Report: PSNP, Harmonisation and Programme Implementation. Addis Ababa: PSNP Donor Working Group, 2006. Sandford J. Cash, Food, Payment and Risk: A Review of the Productive Safety Net Programme. Addis Ababa: Save the Children UK, 2008. Save the Children UK. “Impacts of HIV/AIDS on Livelihoods and Food Security in Rural Ethiopia Summary Report”, World Food Programme Vulnerability, Analysis and Mapping (VAM) Unit, August, 2008. Sharp K. et al. Targeting in the PSNP. London: Overseas Development Institute and theIDLgroup, 2006. Urban Institute and Birhan Research and Development Consultancy. The Ethiopia Productive Safety Net Program, In the Financial Transparency and Accountability Perception Survey. Washington and Addis Ababa, 2008. WABEKBON Development Consultants PLC. Second Roving Appeals Audit of PSNP in Ethiopia. Addis Ababa: Government of Ethiopia, 2009.

64
WABEKBON Development Consultants PLC. Roving Appeals Audit of PSNP in Ethiopia. Addis Ababa: Government of Ethiopia, 2008. WABEKBON Development Consultants PLC. Evaluation of the Direct Support Component of the Productive Safety Net Programme. Addis Ababa: Government of Ethiopia, 2007. Wiseman W. Case study on Ethiopia’s PSNP: Instruments to strengthen control and accountability in social protection. PowerPoint Presentation. Washington, D.C.: World Bank, 2008. World Bank. Project Appraisal Document for Phase Three of the Productive Safety Net Program. Washington, D.C.: World Bank, 2009. World Bank. Implementation Status Reports #1-7, 2007-2010. Washington, D.C.: World Bank, 2010. World Bank/GEF. Economic analysis of the Ethiopia Sustainable Land Management Project (World Bank Project Appraisal Document Report No. 42927-ET). Washington, D.C.: World Bank, 2008a. World Bank. Country Assistance Strategy for the Federal Democratic Republic of Ethiopia. Report No. 43051-ET, Washington, D.C.: World Bank, 2008b. World Bank. Post-procurement Review (& World Bank response report) (Washington, D.C.: World Bank, 2008c. World Bank. Explaining Sources of Food Price Inflation in Ethiopia. Just in Time Policy Note. Washington, D.C.: World Bank, 2007 World Bank. APL I Implementation Completion Report. Washington, D.C.: World Bank, 2006a. World Bank. PSNP APLII Concept Note Washington, D.C.: World Bank, 2006b. World Bank. Project Appraisal Document for Phase Two of the Productive Safety Net Program. Washington, D.C., World Bank, 2005a. World Bank. Ethiopia: Risk and Vulnerability Assessment. Washington, D.C.: World Bank, 2005b.
65
Other internal program documents: PSNP Aide Memoires, MTR, October 2008 and JRIS reports PSNP Performance targets – May 2008 PSNP Annual Plans 2007-2010 PSNP Integrated Financial Reports (IFRs) PSNP (2007-2009) Rapid Response Team reports. Mimeo. PSNP (2007) Medium Term Expenditure Financing Framework. PSNP (2007) PSNP logical framework report, December. Log frame Workshop Group. PSNP (2008) Food Security Programme Review. Detailed Report for the Productive Safety Net Programme Zero Draft. November 2008 Productive Safety Net Project-APL II: FM Implementation Completion Report input, October 2010. Overview of improvements in financial management system in first phase of PSNP, March, 2010

T I G R AYT I G R AY
A FA RA FA R
A M H A R AA M H A R A
S O M A L IS O M A L I
O R O M I YAO R O M I YA
G A M B E L AG A M B E L A
DIRE DAWADIRE DAWA
S N N P RS N N P R
ADDIS ABABAADDIS ABABA
B E N S H A N G U LB E N S H A N G U L
HARARIHARARI
T I G R AYT I G R AY
A FA RA FA R
A M H A R AA M H A R A
S O M A L IS O M A L I
O R O M I YAO R O M I YA
G A M B E L AG A M B E L A
DIRE DAWADIRE DAWA
S N N P RS N N P R
ADDIS ABABAADDIS ABABA
B E N S H A N G U LB E N S H A N G U L
HARARIHARARI
Jijiga
Dire Dawa
WeldiyaDebraTabor
AxumAdigrat
Bahir Dar
Gambela
Sodo
Negele
Mega
Imi
DoloOdo
Degeh Bur Aware
Warder
Domo
Ferfer
Moyale
Yavello
Wendo
Shashemene
Nazret
Welkite
Hosaina
Bonga
GimbiAwash
Dodola
Humera
Kebri Dehar
Gonder
Asela
Awasa Goba
Mekele
Dese
ArbaMinch
Gore
NekemteHarer
Jima
DebreMarkos
ADDISABABA
SUDAN
ERITREA
SOMALIA
UGANDA KENYA
DJIBOUTI
REP.OF
YEMEN
INDIANOCEAN
LakeTana
LakeTurkana
R e d S e a
14°N
36°E 40°E 44°E32°E
36°E 40°E 44°E 48°E
48°E
32°E
14°N
10°N
6°N
10°N
6°N
ETHIOPIA
This map was produced by the Map Design Unit of The World Bank. The boundaries, colors, denominations and any other informationshown on this map do not imply, on the part of The World BankGroup, any judgment on the legal status of any territory, or anyendorsement or acceptance of such boundaries.
0 50 100 150
0 50 100 150 Miles
200 Kilometers
IBRD 37166R
DECEMBER 2010
ETHIOPIA
PRODUCTIVE SAFETY NETPROGRAM II
TOTAL PSNP BENEFICIARIES:
Above 40,000
30,001 – 40,000
20,001 – 30,000
10,000 – 20,000
Below 10,000
No beneficiaries
SELECTED CITIES AND TOWNS
NATIONAL CAPITAL
WEREDA BOUNDARIES
REGION BOUNDARIES
INTERNATIONAL BOUNDARIES
SOURCE: Government of Ethiopia data courtesy ofthe World Food Program.