DOCUMENT INDEX - the dtic
55
Transcript of DOCUMENT INDEX - the dtic

DOCUMENT INDEX
This is the third document in the following series of guidelines for the determination of
Baseline Water Use and Target Setting for various economic sectors:
SAWC G1 Irrigation Sector
SAWC G2 Commercial Sector
SAWC G3 Manufacturing Sector
SAWC G4 Mining Sector
ACKNOWLEDGEMENTS
The authors acknowledge and appreciate the input and guidance from the Counter Part
Group in the development of this guide.
APPROVAL
This document has been approved by the Counter Part Group for use in support of the
Stakeholder Accord on Water Conservation.
This document should be cited as:
This document should be cited as:
The Stakeholder Accord on Water Conservation, 2009. Guideline for Baseline Water Use Determination and Target Setting in the Manufacturing Sector.

FUND FOR RESEARCH INTO INDUSTRIAL DEVELOPMENT GROWTH AND EQUITY
GUIDELINE: BASELINE WATER USE DETERMINATION AND TARGET SETTING IN THE MANUFACTURING SECTOR
ii
TABLE OF CONTENTS
GLOSSARY VII�
1� INTRODUCTION 1�
1.1� Overview 1�
1.2� Guideline objectives 1�
1.3� When to use this guideline 1�
1.4� Principles adhered to in this guideline 1�
1.5� Structure of this guideline 2�
2� WATER USE IN THE SECTOR 3�
2.1� Overview 3�
2.2� Typical Water Uses in the Manufacturing Sector 3�
2.2.1� Process water 3�
2.2.2� Water used for steam production 4�
2.2.3� Water used for cooling 4�
2.2.4� Water used for gas scrubbing 4�
2.2.5� Water used for dust suppression 5�
2.2.6� Water used for cleaning 5�
2.2.7� Water used as a carrier for waste materials 5�
2.2.8� Water used to operate equipment 5�
2.2.9� Water used for staff and customer amenities 6�
2.2.10� Water used for garden maintenance 6�
3� DEFINITION OF THE SITE 7�
4� KEY PERFORMANCE INDICATORS (KPI’S) 10�
4.1� Why Key Performance Indicators are Necessary 10�
4.2� Site-level Key Performance Indicators 10�
4.2.1� Absolute Water Use 10�
4.2.2� Water Intensity 11�

FUND FOR RESEARCH INTO INDUSTRIAL DEVELOPMENT GROWTH AND EQUITY
GUIDELINE: BASELINE WATER USE DETERMINATION AND TARGET SETTING IN THE MANUFACTURING SECTOR
iii
5� DETERMINATION OF BASELINE WATER USE 14�
5.1� The Need for Baseline Water Use Determination 14�
5.2� Pre-requisites for Baseline Water Use Determination 14�
5.2.1� Measurement of site Water Use 14�
5.2.2� Measurement of Production Levels 14�
5.3� Determination of Baseline Water Use in a Constant Throughput Scenario 15�
5.4� Determination of Baseline Water Use in a Varying Throughput Scenario 18�
6� IDENTIFICATION AND QUANTIFICATION OF WATER CONSERVATION OPPORTUNITIES 22�
6.1� Overview 22�
6.2� Quantification of Water Use in Priority Areas 22�
6.2.1� Determination of a detailed water use breakdown 22�
6.2.2� Quantification of water use in core manufacturing areas 22�
6.2.3� Quantification of water use in site utility areas 23�
6.2.4� Quantification of water use in staff amenity areas 23�
6.2.5� Quantification of water use by gardens and lawns 24�
6.2.6� Quantification of water use for cleaning/carwash 25�
6.2.7� Quantification of water use for the staff canteen/kitchen 25�
6.2.8� Accommodating water recycling 25�
6.2.9� Compiling a site water use overview 25�
6.3� Assessment of Individual Water Conservation Opportunities 26�
6.3.1� Assessment of water conservation opportunities in core manufacturing areas 27�
6.3.2� Assessment of water conservation opportunities in site utility areas 28�
6.3.3� Assessment of water conservation opportunities in staff amenity areas 28�
6.3.4� Assessment of water conservation opportunities in garden and lawn irrigation 28�
6.3.5� Assessment of water conservation opportunities in cleaning/carwash 29�
6.3.6� Assessment of water conservation opportunities at canteens / staff kitchens 29�
6.3.7� Assessment of water conservation opportunities due to rainwater harvesting 29�

FUND FOR RESEARCH INTO INDUSTRIAL DEVELOPMENT GROWTH AND EQUITY
GUIDELINE: BASELINE WATER USE DETERMINATION AND TARGET SETTING IN THE MANUFACTURING SECTOR
iv
6.3.8� The need for an integrated approach to the identification of conservation opportunities 30�
7� SETTING WATER USE TARGETS 31�
7.1� Timeframes for water use targets 31�
7.2� The role of water use benchmarks 31�
7.3� Development of a site water conservation plan and associated targets 32�
7.4� Dealing with significant throughput changes 37�
8� CONCLUSIONS 41�
9� REFERENCES 42�

FUND FOR RESEARCH INTO INDUSTRIAL DEVELOPMENT GROWTH AND EQUITY
GUIDELINE: BASELINE WATER USE DETERMINATION AND TARGET SETTING IN THE MANUFACTURING SECTOR
v
LIST OF TABLES
Table 1: Water Use Efficiency Example .................................................................................................. 13�
Table 2: Methods of Measuring Production ........................................................................................... 15�
Table 3 : Projected Water Use Baselines for Different Throughput Levels ........................................ 21�
Table 4: Quantification of Water Used for Amenities ............................................................................ 24�
Table 5: Selected Water Intensity Benchmarks in Manufacturing ....................................................... 31�
Table 6: Water Use by Area at a Soft Drinks Plant ................................................................................ 33�
Table 7: Projected Annual Savings from Water Conservation Projects .............................................. 35�
Table 8: Annual Water Use Targets Example ......................................................................................... 36�
Table 9 : Baseline Water Use and Target-Setting with Changes in Throughput ................................ 39�

FUND FOR RESEARCH INTO INDUSTRIAL DEVELOPMENT GROWTH AND EQUITY
GUIDELINE: BASELINE WATER USE DETERMINATION AND TARGET SETTING IN THE MANUFACTURING SECTOR
vi
TABLE OF FIGURES
Figure 1: Water Management System on a Manufacturing Site ............................................................. 7�
Figure 2: Example of a Water Intensity Trend at a Manufacturing Site ............................................... 12�
Figure 3: The Relationship of Fixed and Variable Water Use to Total water Use ............................... 16�
Figure 4: Typical Relationship between Throughput and Water Intensity .......................................... 17�
Figure 5: Throughput versus Absolute Water Use Graph at a Manufacturing Site............................ 19�
Figure 6: Typical Breakdown of Water Use in Meat Processing .......................................................... 26�
Figure 7: Fixed and Variable Water Savings from Implemented Conservation Initiatives ................ 37�

FUND FOR RESEARCH INTO INDUSTRIAL DEVELOPMENT GROWTH AND EQUITY
GUIDELINE: BASELINE WATER USE DETERMINATION AND TARGET SETTING IN THE MANUFACTURING SECTOR
vii
GLOSSARY
Absolute water use The amount of water used, in volume terms, over a defined period.
Aqueous phase In margarine manufacture an emulsion is produced through high-shear mixing of an oil phase and an aqueous phase, the latter being a mixture of specific ingredients in water, or in some cases milk.
Baseline water use Water consumption status at the beginning of a water conservation programme. Baseline measurements are used as a reference point for determination of a site’s water savings as it completes its water conservation plan.
Benchmark A quantitative measure of performance or qualitative practice against which other levels of performance or other practices may be compared.
Blow down The discharge of concentrated cooling water from a cooling water loop. Concentration of salts occurs due to evaporation of water during the cooling process. Blow down is also carried out to remove other pollutants, such as organic matter for example.
Centrifuge Device used to separate materials of differing density through the application of centrifugal force.
Centrifugal pump A device used to increase the pressure of a fluid, thereby causing it to flow, through the use of a rotating impeller.
Cooling towers Structures used to cool water through an evaporative process in which the water is exposed to air in counter-current flow.
Condensate Steam that has been condensed into the liquid phase.
Condensate make-up Water added to a steam production system to compensate for losses of condensate.
Condensate trap A device installed to remove condensate from pipelines carrying steam.
Consumptive water use Water use that removes water from the immediate environment and does not make it available to other users in the form of a liquid discharge. Consumptive use is generally a term applied to uses resulting in evaporation, evapotranspiration or incorporation into products.

FUND FOR RESEARCH INTO INDUSTRIAL DEVELOPMENT GROWTH AND EQUITY
GUIDELINE: BASELINE WATER USE DETERMINATION AND TARGET SETTING IN THE MANUFACTURING SECTOR
viii
GLOSSARY
Culinary steam Steam that can be brought into contact with food products without impacting on their safety for human consumption.
Drift Loss of water droplets through the top of a cooling tower as a result of the air draft. Can be reduced by installing drift eliminators.
Differential pressure cell Also called a “d.p. cell”, this device is used to measure the liquid level in vessels or impoundments based on the difference in pressure between the pressure at the bottom of the liquid column and the pressure in the gases above the liquid surface, taking consideration of the density characteristics of the liquid.
Dust suppression The process whereby the movement of dust is controlled/prevented, typically through the application of water sprays.
Energy balance Calculations used to account for the flow of energy between materials, the fundamental basis of which is that energy is conserved.
Flash steam Steam formed when high temperature, high pressure condensate experiences a drop in pressure e.g. when it is discharged into a vessel at atmospheric pressure.
Gas scrubbing The process whereby gases are bought into contact with a fluid with the intent of removing solid, liquid or gaseous components from the gas stream through incorporating them into the fluid. In the context of this guide, the gas scrubbing referred to involves the use of water, though other fluids may be used.
Grey water Water recycled from showers, sinks and wash basins.
Harvested rainwater Rainwater that is not returned to the stormwater system but is collected for use on site.
Heat capacity The amount of energy required to raise the temperature of a unit mass of a substance by one temperature unit without changing the phase of the substance.
Heat exchanger A device used to exchange heat between two fluids, generally without the fluids being brought into direct contact.

FUND FOR RESEARCH INTO INDUSTRIAL DEVELOPMENT GROWTH AND EQUITY
GUIDELINE: BASELINE WATER USE DETERMINATION AND TARGET SETTING IN THE MANUFACTURING SECTOR
ix
GLOSSARY
Internal recycling Water that is recycled on site after it has already been used. Internally recycled water should not be added to site water use, as it was already recorded as a water use when it was used for the first time.
Key performance indicators
The most important measures of water use performance, as chosen by users or other stakeholders.
Latent heat of vaporisation
The amount of energy required to convert a unit mass of a substance from the liquid phase to the vapour phase at constant temperature.
Lautering In brewing, the filtration process whereby the liquid extract and malt husk components of a mash are separated, aided by the application of water sprays.
Load cells Devices used to measure mass through measuring the amount of strain caused by the load. The strain is converted into a resistance value, which is ultimately converted to a mass reading.
Magnetic flow meter Also called a “magflow”, this is a type of flow meter which measures the strength of the voltage generated by charged particles moving within a magnetic field generated by the meter. This voltage is proportional to the velocity of the particles, which is then related to the flow rate of the fluid being handled.
Malt mash In brewing, a mixture of milled malt and water that is subjected to defined temperature and pH conditions in order to determine the sugar and (to a lesser extent) protein/amino acid spectrum of the resulting extract.
Mass flow meter A device used to measure the mass flow rate of a fluid.
Mulching The practice of covering soil (using natural or synthetic materials) in order to reduce moisture loss, prevent weed growth and prevent soil erosion.
Pasteurisation The process of rendering a food product free of bacteria through the application of heat.
Potable water Water of high enough quality to be used for human consumption without any short or long-term health effects. In the context of this guideline, this is treated water supplied by water service providers.

FUND FOR RESEARCH INTO INDUSTRIAL DEVELOPMENT GROWTH AND EQUITY
GUIDELINE: BASELINE WATER USE DETERMINATION AND TARGET SETTING IN THE MANUFACTURING SECTOR
x
GLOSSARY
Pinch Technology An approach used to minimise water or energy consumption through integrating the various process on a site, and matching water or energy sources to water or energy sinks, reducing the need for “fresh” water or energy sources by reusing available sources that would otherwise be wasted.
Preventive maintenance Maintenance that is carried out to prevent failures from occurring (as opposed to maintenance carried out to correct failures that have occurred).
Point-of-use conservation
With reference to water conservation, this refers to techniques employed to reduce the amount of water used by individual processes at the point where the water is used.
Pulp In papermaking, a suspension of fibres in water.
Raw water Water from boreholes or surface water resources that is in an untreated form.
Saturated steam Steam in which the liquid and vapour phases are in equilibrium, and for which pressure is a function of temperature. Removing energy from saturated steam causes it to start to condense.
Stormwater Rain water diverted into drainage systems for transport to surface water resources.
Superheated steam Steam for which pressure is independent of temperature. Removing energy from superheated steam will not cause it to condense unless sufficient energy is removed to cause the steam to become saturated, after which it will start to condense should additional energy be removed.
Thermal pollution The increase in temperature, with consequent environmental degradation, of a water body, resulting from the discharge of water/effluents of higher temperature than that of the water body into the water body.
Unit operation An individual process step within a bigger manufacturing process.
Viability A viable conservation initiative is one which meets criteria that justify its implementation. These criteria are at the discretion of the implementing organisation.
Water audit A process whereby all water on a site is accounted for, with the object of identifying losses and sources of inefficiency.

FUND FOR RESEARCH INTO INDUSTRIAL DEVELOPMENT GROWTH AND EQUITY
GUIDELINE: BASELINE WATER USE DETERMINATION AND TARGET SETTING IN THE MANUFACTURING SECTOR
xi
GLOSSARY
Water balance A calculation/assessment technique in which all water into and out of a site is accounted for, using the principle that the amount of water entering the site (in solid, liquid or gaseous form) should be equal to the amount of water leaving the site. It is also possible to account for water retained on the site, a useful approach should inventories be large or where the balance is conducted over short time intervals.
Water conservation The process whereby the amount of water used for an activity is reduced without impacting on the outcomes of the activity.
Water efficiency The accomplishment of a function, task, process, or result with the minimal amount of water feasible. Water efficiency aims to reduce the waste of water and not restrict the use thereof.
Water intensity Water use per unit of economic activity. In the case of the manufacturing sector, this is expressed as the amount of water used per unit of production. The lower the water intensity of a manufacturing operation, the more efficient it is.
Weigh bridge A platform onto which vehicles may be driven in order to determine their mass. Vehicles are typically weighed before and after product is delivered or loaded, with the difference being the mass of product supplied to or by the site.
Work practices The practices and procedures followed on a manufacturing site.

FUND FOR RESEARCH INTO INDUSTRIAL DEVELOPMENT GROWTH AND EQUITY
GUIDELINE: BASELINE WATER USE DETERMINATION AND TARGET SETTING IN THE MANUFACTURING SECTOR
xii
ABBREVIATIONS
CIP Clean in place
hl Hectolitre = 100 litres
IISI International Iron and Steel Institute
KL Kilolitre
KPI Key performance indicator
L Litres
m Metre
mm Millimetre
UNEP United Nations Environment Programme
YOY Year on year
WSP Water Services Provider
FUND FOR RESEARCH INTO INDUSTRIAL DEVELOPMENT GROWTH AND EQUITY
GUIDELINE: BASELINE WATER USE DETERMINATION AND TARGET SETTING IN THE MANUFACTURING SECTOR
1
1 INTRODUCTION
1.1 Overview
This is one of a series of guidelines outlining the steps to follow at site-level for the:
i. Determination of baseline water use levels and;
ii. Setting of water use targets, within the context of a water conservation programme.
In particular, this guideline supports the objectives of the Stakeholder Accord on Water Conservation, and
the chosen water use performance indicators are aligned to those required for reporting as agreed by
Accord stakeholders.
This guideline applies to the MANUFACTURING sector, which comprises those sites that convert raw
materials into items of value, generally through the use of equipment and controlled processes. Included
in this sector would be sites that conduct assembly operations.
1.2 Guideline objectives
The objectives of this guideline are to ensure that participants in the Stakeholder Accord on Water
Conservation within the manufacturing sector receive guidance on:
• How to categorise the key water-using processes for their individual sites;
• What the water use and water intensity measures appropriate to the manufacturing sector are in
terms of the requirements of the Stakeholder Accord on Water Conservation;
• How to determine baseline water use;
• How to identify opportunities for water conservation and;
• How to translate identified conservation opportunities into short and long-term water use and
water intensity targets.
1.3 When to use this guideline
This guideline has been developed specifically to support the Stakeholder Accord on Water Conservation.
It is however also of use in the following general circumstances:
• When developing a water conservation plan;
• As input to planning and budgeting processes.
1.4 Principles adhered to in this guideline
This guideline is based on the principles governing the Stakeholder Accord on Water Conservation and
assumes that baseline determination and target setting would be undertaken at site level on a voluntary
basis. The use of this guideline is not mandatory, but it is rather a tool aimed at supporting water users in
the sector in their water conservation efforts. It is assumed that this guideline is implemented within the
regulatory framework governing water use, taking cognisance of all environmental impacts related to the
implementation of water conservation projects.

FUND FOR RESEARCH INTO INDUSTRIAL DEVELOPMENT GROWTH AND EQUITY
GUIDELINE: BASELINE WATER USE DETERMINATION AND TARGET SETTING IN THE MANUFACTURING SECTOR
2
1.5 Structure of this guideline
This guideline is based on the concepts of water auditing. The approach followed in this guideline is
comprised of the following steps:
• Determination of the absolute water use and water intensity baselines for the site;
• Identification of potential water conservation initiatives;
• Quantification of water savings expected from implementation of these water conservation
initiatives;
• Determination of expected absolute water use targets for future years by subtracting water
savings from viable conservation initiatives from the baseline. Both savings and the baseline
may also be related to the level of production projected for the manufacturing entity;
• Repetition of this process annually for a rolling five-year period.
The guideline briefly discusses the nature of water use in the manufacturing sector and then defines a
generic water balance for the manufacturing site. Thereafter the guideline describes key performance
indicators (KPI’s) relevant to the sector, to be used as a basis for determining absolute water use and
water intensity baselines. Once the process to be used for determination of these baselines has been
described, a methodology for the incorporation of water savings into the target setting process is
described.

FUND FOR RESEARCH INTO INDUSTRIAL DEVELOPMENT GROWTH AND EQUITY
GUIDELINE: BASELINE WATER USE DETERMINATION AND TARGET SETTING IN THE MANUFACTURING SECTOR
3
2 WATER USE IN THE SECTOR
2.1 Overview
For the purposes of this document, the manufacturing water-use sector is defined as comprising
enterprises in which the primary assets employed in the conducting of business are plant and equipment
and their surrounds (i.e. raw material storage areas, parking areas, gardens and outdoor amenities),
typically delineated by a physical boundary. These assets are used to convert raw materials into products
of higher value. The manufacturing sector would also include industries that assemble components into
finished goods. While this guideline applies to any sub-sector in manufacturing, the type of water used,
the quantity of water used and the patterns of water use (volume and seasonality) in the manufacturing
sector can vary markedly between users based on the nature of their operations. Examples of water use
sub-sectors that could use this guideline successfully to determine water use baselines and set water use
targets are:
• Food and beverage processors;
• The iron and steel industry;
• The pulp and paper industry;
• The chemical manufacturing industry;
• Agro-processors.
It is also possible to use this guideline for the mineral processing operations of the mining industry,
though it is preferable that the guideline: “Guideline for Baseline Water Use Determination and Target
Setting in the Mining Sector” is consulted first in this regard.
Manufacturers, both between and within sub-sectors, typically have different water use characteristics,
depending on a range of factors such as technology footprint, product mix, processing technique, scale of
operations and raw materials used. The idea of this guide is to enable users in the manufacturing sector,
regardless of their unique circumstances, to be able to baseline their water use and set meaningful water
use targets.
2.2 Typical Water Uses in the Manufacturing Sector
2.2.1 Process water
Process water is defined as water that comes into direct contact with the product being manufactured,
and in many cases is incorporated into the product. Some process water may be evaporated or
discharged with waste materials during processing. Water incorporated into products is considered to be
consumptively used. Examples of the types of operations in which process water is used in South African
industry are:
• Slurrying of phosphate rock in phosphoric acid manufacture;
• Lautering of malt mash in the brewing industry;
• Pulp washing in pulp and paper manufacturing;
• Production of the aqueous phase in margarine manufacturing;

FUND FOR RESEARCH INTO INDUSTRIAL DEVELOPMENT GROWTH AND EQUITY
GUIDELINE: BASELINE WATER USE DETERMINATION AND TARGET SETTING IN THE MANUFACTURING SECTOR
4
• In-package pasteurisation in the dairy industry;
• Washing of reusable containers in the soft drink industry.
2.2.2 Water used for steam production
Most manufacturing sites employ saturated or superheated steam (or both) in their operations, generally
for heating purposes. In the food industry, culinary steam is sometimes used for sterilising of vessels or
for direct incorporation into products. The steam is produced in boilers, using coal, gas, fuel oil or
electricity as an energy source. Where steam is not brought into direct contact with product, or is not used
in a consumptive manner on site, it is typically condensed and returned to the boilers as condensate,
which is reused to produce steam in a closed cycle.
Despite the condensing of steam, with subsequent reuse of the condensate, it is usual to experience
losses from the steam circulation system. As a pressurised system, it is prone to leaks, and there are
typically some processes that use live steam, meaning that this steam is lost from the closed loop.
Condensate traps upstream of process equipment such as heat exchangers also discharge condensate
which, if not recovered, represents a loss of water. In addition losses due to flash steam may also occur
where atmospheric pressure condensate recovery tanks are employed. In order to make up for these
losses, additional water (commonly called “condensate make-up”) has to be introduced into the steam
production system.
2.2.3 Water used for cooling
Water has certain characteristics such as its high heat capacity and high latent heat of vaporisation that
make it excellent as a cooling medium. Where water is used for cooling through direct contact, such as in
metal casting and iron and steel processing, some water is typically lost through evaporation. Water is
also extensively used for cooling through indirect contact, for example through the use of heat
exchangers to cool liquids, or jackets in the case of equipment cooling. In these instances the
temperature of the water increases, and has to be reduced again before the water can be reused as
cooling water. This is typically accomplished through the use of cooling towers, leading to some loss of
water through evaporation, drift and windage losses. Dry cooling systems in which the water is cooled
with air in a heat exchanger (much like a car radiator system) are also used, preventing evaporative
losses, but making the cooling process more dependent on atmospheric conditions. Once-through
cooling, in which the warm water returned from the cooling process is directly discharged to surface water
resources, is also practised in some industries. This practice can lead to thermal pollution, particularly
where the cooling water flows are large relative to the flow of the receiving water body.
2.2.4 Water used for gas scrubbing
Water is commonly used for gas scrubbing in industries such as mineral processing, the chemical
manufacturing industry, the sugar industry and power generation, either on its own or as a carrier for
chemicals involved in gas scrubbing processes. The water is typically disposed of as an effluent after use

FUND FOR RESEARCH INTO INDUSTRIAL DEVELOPMENT GROWTH AND EQUITY
GUIDELINE: BASELINE WATER USE DETERMINATION AND TARGET SETTING IN THE MANUFACTURING SECTOR
5
in scrubbing processes, but there are generally opportunities available to recycle some of this water to the
scrubber.
2.2.5 Water used for dust suppression
On sites in which the generation of dust is potentially excessive, water is often sprayed onto fine materials
to limit dust formation. Chemicals are available to aid in dust suppression, thereby reducing water use for
this application, but these should be carefully investigated before use in order to understand any
potentially harmful impacts arising from their use.
2.2.6 Water used for cleaning
In food and beverage processing, water is used extensively for cleaning of the surfaces that come into
contact with product, such as pipelines and the insides of vessels and equipment. This type of cleaning is
called “cleaning in place” or “CIP”. This is typically carried out through the use of specially designed
cleaning equipment and the use of cleaning chemicals. Water is used, both to constitute the chemical
solutions used for removal of contaminants and for rinsing.
Recycling is a common means of reducing water use for cleaning applications. A typical CIP cycle would
entail a preliminary rinse to remove gross solids and remaining liquids, followed by a chemical clean and
then a final rinse to remove traces of cleaning chemicals. Through, for example, use of the final rinse
water from a cleaning cycle as the preliminary rinse water for subsequent cycles, recycling can be
achieved. The reused water is then disposed of along with other site effluents, or treated to allow further
reuse, possibly in other process areas.
Besides CIP, water is also used to clean the manufacturing environment i.e. for on-site housekeeping.
The amounts used here are typically small relative to other water uses, and would vary depending on the
housekeeping and hygiene standards demanded by the sub-sector concerned.
2.2.7 Water used as a carrier for waste materials
Water is used as a carrier for waste materials in some industries, such as in mineral processing and
power generation, chemical manufacturing and some sub-sectors of the food industry. Some water may
be recovered for reuse where these waste materials are stored on site and systems such as leachate
and/or seepage recovery systems are in place.
2.2.8 Water used to operate equipment
Certain specialised pieces of equipment require water for their operation e.g. centrifuges in the food
industry, which use water to operate hydraulic pistons, or centrifugal pumps, which use water for sealing
purposes. This is different to process water as defined above, since this water is not in direct contact with
the product being manufactured. It is however not unusual for the water used here to be aggregated with
overall process water use from a water accounting perspective, since it is typically a very small volume

FUND FOR RESEARCH INTO INDUSTRIAL DEVELOPMENT GROWTH AND EQUITY
GUIDELINE: BASELINE WATER USE DETERMINATION AND TARGET SETTING IN THE MANUFACTURING SECTOR
6
and need not necessarily be accounted for separately. It is also uncommon for this water to be metered,
again due to the small volumes involved.
2.2.9 Water used for staff and customer amenities
This refers to water used for drinking and ablutions i.e. by sanitary fixtures such as toilets, urinals and
sinks. This is generally a small portion of total water use on a manufacturing site, but may present
opportunities for water conservation. Please consult the guide: “Guideline for Baseline Water Use
Determination and Target Setting in the Commercial Sector” should you require more information.
2.2.10 Water used for garden maintenance
This refers to the water used to irrigate gardens within the site boundary and for related uses such as
water features. Potable water is often used, but it is possible to use raw water, recycled water or
harvested rainwater for this purpose. Please consult the guide: “Guideline for Baseline Water Use
Determination and Target Setting in the Commercial Sector” should you require more information.
FUND FOR RESEARCH INTO INDUSTRIAL DEVELOPMENT GROWTH AND EQUITY
GUIDELINE: BASELINE WATER USE DETERMINATION AND TARGET SETTING IN THE MANUFACTURING SECTOR
7
3 DEFINITION OF THE SITE
In order to define the key performance indicators (KPI’s) to be used for baseline water use performance
determination and the setting of water use and water use efficiency targets, it is necessary to define the
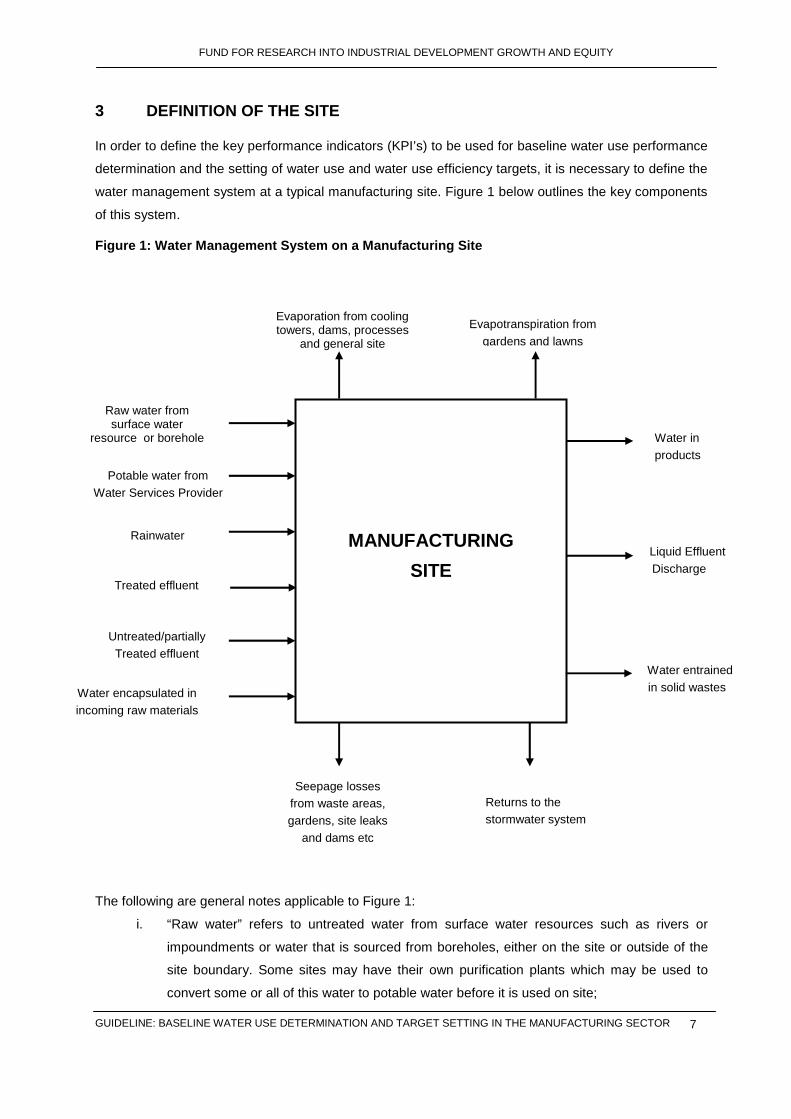
water management system at a typical manufacturing site. Figure 1 below outlines the key components
of this system.
Figure 1: Water Management System on a Manufacturing Site
The following are general notes applicable to Figure 1:
i. “Raw water” refers to untreated water from surface water resources such as rivers or
impoundments or water that is sourced from boreholes, either on the site or outside of the
site boundary. Some sites may have their own purification plants which may be used to
convert some or all of this water to potable water before it is used on site;
MANUFACTURING
SITE
Water in products
Liquid Effluent Discharge
Water entrained in solid wastes
Returns to the stormwater system
Seepage losses from waste areas, gardens, site leaks
and dams etc
Evapotranspiration from gardens and lawns
Evaporation from cooling towers, dams, processes
and general site
Treated effluent
Water encapsulated in incoming raw materials
Rainwater
Potable water from Water Services Provider
Raw water from surface water
resource or borehole
Untreated/partially Treated effluent
FUND FOR RESEARCH INTO INDUSTRIAL DEVELOPMENT GROWTH AND EQUITY
GUIDELINE: BASELINE WATER USE DETERMINATION AND TARGET SETTING IN THE MANUFACTURING SECTOR
8
ii. “Potable water” refers to the treated drinking-quality water supplied by WSPs;
iii. “Water encapsulated in incoming raw materials” refers to water contained in materials that
are to be used on site e.g. the moisture content of maize used in industrial starch
manufacturing or in the sugar cane used for sugar production;
iv. “Rainwater” may be directed to on-site stormwater drains, from which it will be diverted to
surface water resources, and/or be harvested for use on site, provided this is permitted by
the relevant authorities;
v. “Treated effluent” refers to effluent supplied by others that has been treated and may be
used on site without further treatment.
vi. “Untreated/partially treated effluent” refers to discharges from users outside the site
boundary that may either be used without further treatment or treated further before use. A
number of untreated/partially treated effluent streams of varying quality may be used on a
single site;
vii. The extent of seepage losses depends on individual geo-hydrological considerations for
each site and considerations such as whether dams are lined or not, and if not, the nature of
the underlying geology. Many sites employ seepage recovery systems, allowing the water to
be captured and reused;
viii. “Liquid effluent discharge” could comprise treated or untreated process effluents discharged
to surface waters and/or to sewer, which would include process as well as domestic effluents
generated on the site;
ix. “Returns to the stormwater system” comprise that portion of rainwater that is not harvested
for reuse;
x. “Evaporation from cooling towers, dams, processes and general site” encompasses all
evaporation on site that is not directly recovered, excluding water evaporated from solid
waste materials;
xi. “Evapotranspiration from gardens and lawns” refers to evaporation of applied water as well
as rainwater from land and plant surfaces, as well as the loss of this water through the
stomata of plants. This would include evapotranspiration from planted crops where irrigation
water is part of the manufacturing site’s water balance;
xii. “Water entrained in solid wastes” refers to the portion of water discharged with waste
materials that is not recovered for reuse on site, and includes the water that may ultimately
be evaporated from solid waste materials. Examples of waste materials are the brine
discharged from a reverse osmosis plant or the water contained in the ash from coal-fired
boilers and;
xiii. “Water in products” refers to the water contained in the products produced on the site, which
would be in the form of moisture in the case of solid products or liquid in the case of products
such as beverages.
Figure 1 represents the overall water balance for a manufacturing site. It should be clear that by reducing
the amount of water leaving the site boundary through evaporation, evapotranspiration, discharges and

FUND FOR RESEARCH INTO INDUSTRIAL DEVELOPMENT GROWTH AND EQUITY
GUIDELINE: BASELINE WATER USE DETERMINATION AND TARGET SETTING IN THE MANUFACTURING SECTOR
9
entrainment in waste materials, the amount of water that has to be transported across the site boundary
for use on site is reduced. The two key ways to achieve this on a manufacturing site are to reduce the
amount of water used by individual processes (i.e. “point-of-use” water use reduction) and/or to recycle
as much water as possible.
FUND FOR RESEARCH INTO INDUSTRIAL DEVELOPMENT GROWTH AND EQUITY
GUIDELINE: BASELINE WATER USE DETERMINATION AND TARGET SETTING IN THE MANUFACTURING SECTOR
10
4 KEY PERFORMANCE INDICATORS (KPI’s)
4.1 Why Key Performance Indicators are Necessary
KPI’s can be established at a number of levels, for example to measure the performance of the entire
manufacturing site or to measure the performance of an individual process within a site. Hence KPI’s may
be established to measure water use for an entire dairy as well for an individual water-using process such
as pasteurisation.
Process-level KPI’s are considered to be outside of the scope of this document, which considers only
site-level performance. More detailed KPI’s would have to be developed by users at each site based on
the structure of water-demanding processes on that site. These lower-level KPI’s would permit improved
management of water use efficiency at the site level, as they would typically address the drivers of overall
site performance.
The use of standardised quantitative measures of water use performance allows individual sites to track
performance over time as well as to benchmark performance against that of other sites.
4.2 Site-level Key Performance Indicators
The two key measures regarding water use at site-level in the manufacturing sector that have been
agreed within the context of the Stakeholder Accord on Water Conservation are the following:
i. The absolute volume of water used, which is an indicator of the demand that a site places on
freshwater resources and;
ii. Water intensity, which is an indicator of the sustainability of the site’s water use.
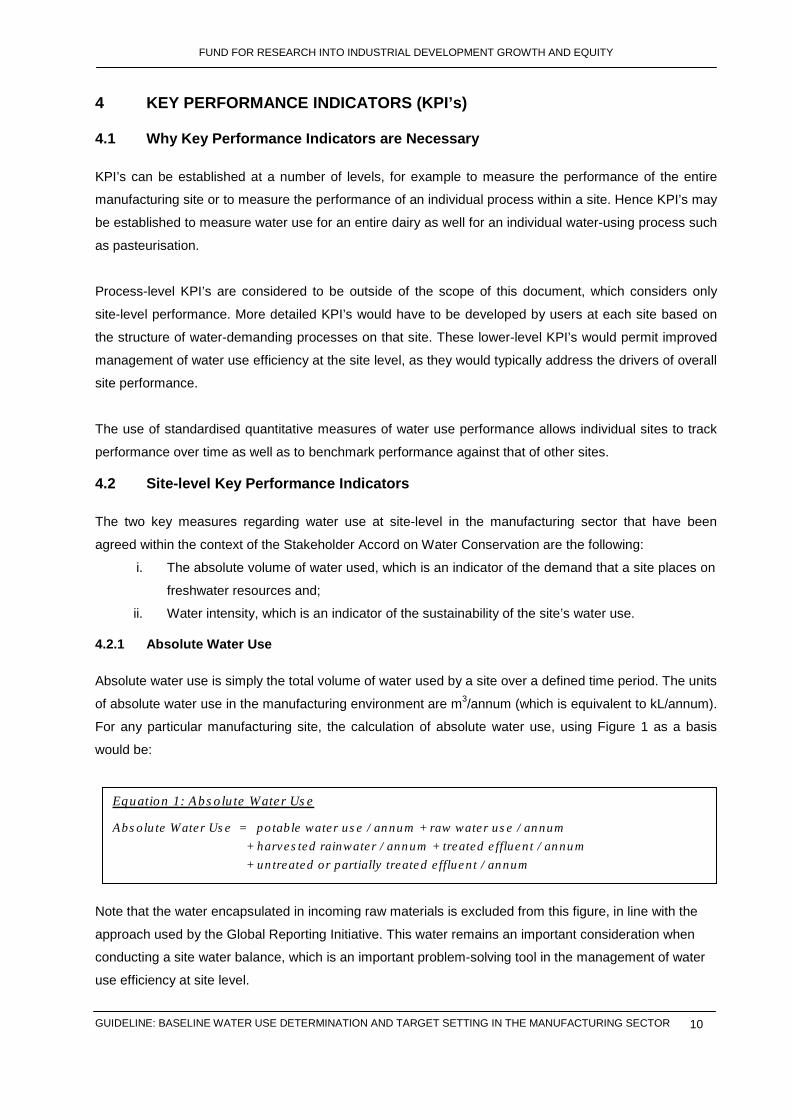
4.2.1 Absolute Water Use
Absolute water use is simply the total volume of water used by a site over a defined time period. The units
of absolute water use in the manufacturing environment are m3/annum (which is equivalent to kL/annum).
For any particular manufacturing site, the calculation of absolute water use, using Figure 1 as a basis
would be:
Note that the water encapsulated in incoming raw materials is excluded from this figure, in line with the
approach used by the Global Reporting Initiative. This water remains an important consideration when
conducting a site water balance, which is an important problem-solving tool in the management of water
use efficiency at site level.
Equation 1: Absolute Water Use
Absolute Water Use = potable water use / annum + raw water use / annum + harvested rainwater / annum + treated effluent / annum + untreated or partially treated effluent / annum

FUND FOR RESEARCH INTO INDUSTRIAL DEVELOPMENT GROWTH AND EQUITY
GUIDELINE: BASELINE WATER USE DETERMINATION AND TARGET SETTING IN THE MANUFACTURING SECTOR
11
Example 1:
A chemical manufacturing plant uses 900,000 m3/annum of potable water, 300,000 m3/annum of raw
water, 30,000 m3/annum of harvested rainwater and 450,000 m3/annum of untreated effluent from a
neighbouring steel mill. What is the absolute water use of the site?
Absolute water use = 900,000 m3/annum + 300,000 m3/annum + 30,000 m3/annum +
450,000 m3/annum
= 1,680 000 m3/annum
4.2.2 Water Intensity
An efficient water user uses the minimal amount of water feasible to achieve a given outcome or result.
The measurement of water use efficiency therefore requires an indication of absolute water use as well
as a measure of the level of economic activity associated with that level of water use.
For manufacturing sites, the measure of water use efficiency generally used is that of “water intensity”,
which relates water use over a defined time period to the mass or volume of production over that same
period.
Example 2:
The chemical plant in example 1 produces 3,360 tons of product per annum. What is the water intensity
of the site?
Water intensity = 1,680000 m3/annum ÷ 3,360 tons/annum
= 500 m3/ton
Water intensity values alone do not provide complete information on how efficient the site is. For a more
complete view on how efficient a site is, comparison to appropriate benchmark values would be required.
Water intensity values do however provide a measurement that can be used to monitor trends in water
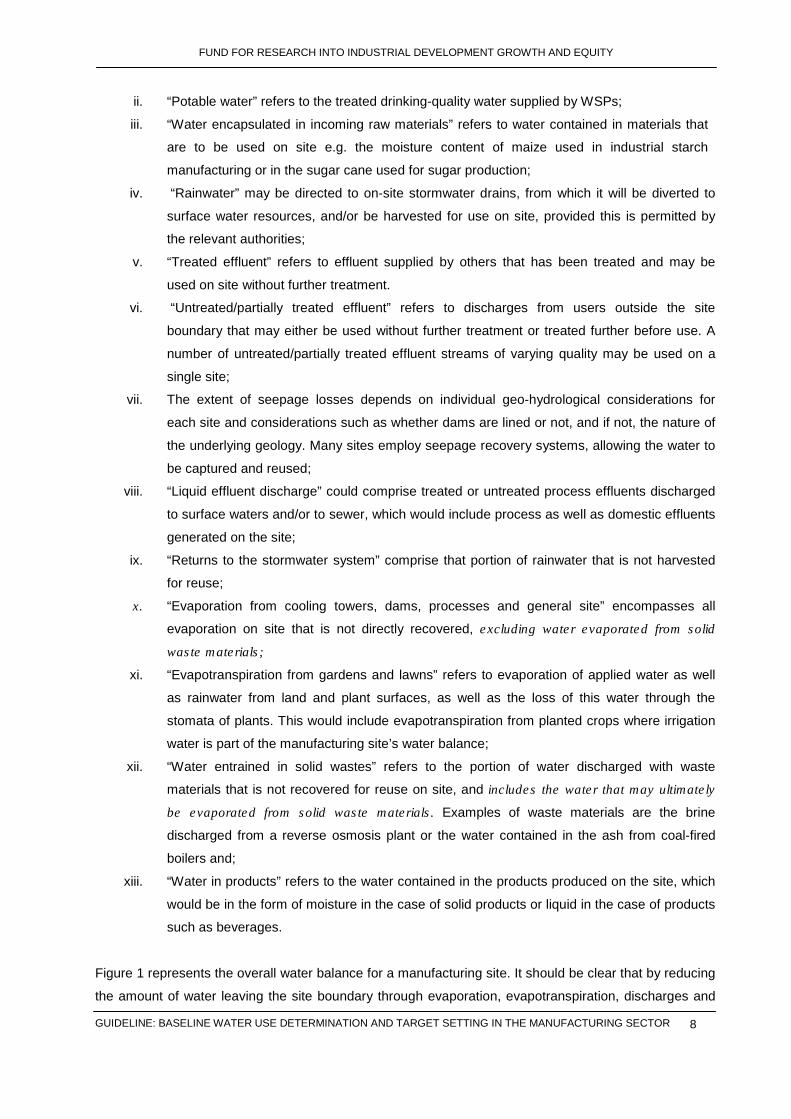
use efficiency at a site. Figure 2 below outlines how trends of water intensity may be interpreted as
regards water use efficiency at an individual manufacturing site.
Figure 2 examines the water intensity trend at a manufacturing site over a period of 4 years. The dashed
line represents the minimum feasible water intensity at the site, which is the water intensity level the site
could achieve if all feasible water conservation initiatives were implemented. The site is seen to
experience an increase in water intensity (and hence a decline in water use efficiency) between Year 1
and Year 2, after which water intensity decreases. By year 4, a steady decrease in water intensity is
apparent, indicating increasing levels of water use efficiency.
Equation 2: Water Use Intensity
Water Use Intensity = Absolute Water Use / Production Activity (Quantity Produced)

FUND FOR RESEARCH INTO INDUSTRIAL DEVELOPMENT GROWTH AND EQUITY
GUIDELINE: BASELINE WATER USE DETERMINATION AND TARGET SETTING IN THE MANUFACTURING SECTOR
12
Figure 2: Example of a Water Intensity Trend at a Manufacturing Site
Table 1 below contains the raw data for this site, measured for each of the four years in question. The
table also contains the year on year percentage change in water intensity.
For any year, Yearn followed by a year, Yearn+1, the percentage change year on year is:
To calculate performance in any year, Yearn relative to the base year, Yearb:
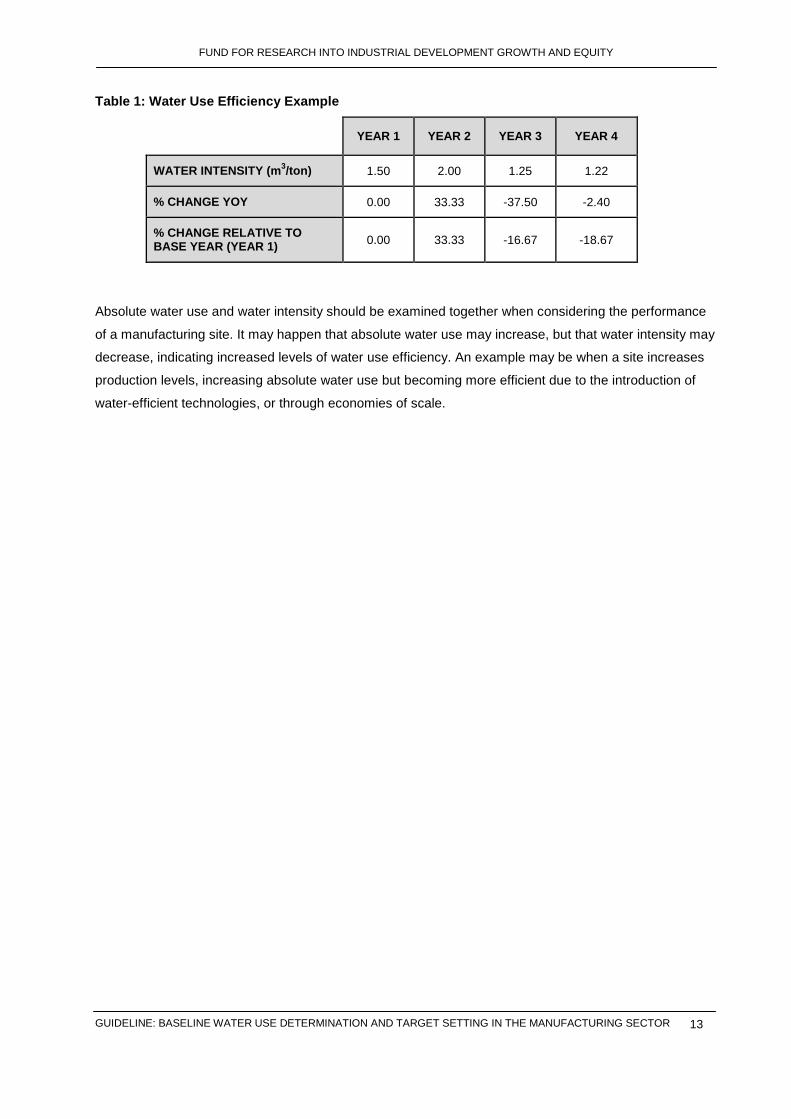
Table 1 shows the ongoing annual decrease in water intensity (and hence improvement in water use
efficiency) at the site, leading to a cumulative decrease in water intensity of 18.67% by year 4.
Year 1 Year 2 Year 3 Year 4
TIME
WA
TER
IN
TEN
SIT
Y
(m3 /to
n)
0.5
1
.0
1
.5
2.
0
2.5
Site trend
Lowest water intensity feasible
Equation 3: % Change Year on Year
% Change YOY = (Water intensity in Yearn+1 -Water intensity in Yearn) x 100 / Water intensity in Yearn
Equation 4: % Change Relative to Base Year
% Change = (Water intensity in Yearn – Water intensity in Yearb) x 100 / Water intensity in Yearb
FUND FOR RESEARCH INTO INDUSTRIAL DEVELOPMENT GROWTH AND EQUITY
GUIDELINE: BASELINE WATER USE DETERMINATION AND TARGET SETTING IN THE MANUFACTURING SECTOR
13
Table 1: Water Use Efficiency Example
YEAR 1 YEAR 2 YEAR 3 YEAR 4
WATER INTENSITY (m3/ton) 1.50 2.00 1.25 1.22
% CHANGE YOY 0.00 33.33 -37.50 -2.40
% CHANGE RELATIVE TO BASE YEAR (YEAR 1) 0.00 33.33 -16.67 -18.67
Absolute water use and water intensity should be examined together when considering the performance
of a manufacturing site. It may happen that absolute water use may increase, but that water intensity may
decrease, indicating increased levels of water use efficiency. An example may be when a site increases
production levels, increasing absolute water use but becoming more efficient due to the introduction of
water-efficient technologies, or through economies of scale.
FUND FOR RESEARCH INTO INDUSTRIAL DEVELOPMENT GROWTH AND EQUITY
GUIDELINE: BASELINE WATER USE DETERMINATION AND TARGET SETTING IN THE MANUFACTURING SECTOR
14
5 DETERMINATION OF BASELINE WATER USE
5.1 The Need for Baseline Water Use Determination
Determination of the baseline is the process of establishing the status of absolute water use and water
intensity for a manufacturing site at a defined point in time. When this baseline has been established, it
serves as a benchmark against which water use performance improvements may be judged.
5.2 Pre-requisites for Baseline Water Use Determination
In order to determine the baseline water use for a manufacturing site, the following are the minimum pre-
requisites necessary.
5.2.1 Measurement of site Water Use
Determination of baseline water use requires that the volume of all water that enters the site from outside
the site boundary (or from water sources located inside the site boundary such as boreholes or on-site
impoundments that receive un-metered flow from across the site boundary, and are not considered part
of the site’s water inventory) be measured. This implies that metering systems be in place to measure the
volumes of potable water, treated and untreated/partially treated effluent (from external sources),
harvested rainwater and raw water on a routine basis. Alternatively, the site needs to have a means of
estimating these water volumes to an acceptable degree of accuracy.
The metering systems must be capable of measuring the cumulative volume of water used for the period
of interest. Meters that have counters that cannot be reset are preferred, since the volume used between
measuring periods can then simply be found by subtracting the most current reading from the reading
before it. Meters that can be reset can result in lost information, since they could be reset in the middle of
the month for example. Water use would in this case be under-stated, since the full month’s data would
not be contained in the cumulative value used. Water supplied by Water Services Providers is metered
for billing purposes and hence should be available by default.
Highly automated manufacturing sites typically have the infrastructure to enable storage of water
measurement data in a database, and the facility to examine water use trends. Local reading of meters
(i.e. physical recording through readings taken at the site of the meter) in such environments is not
necessary, since each incoming water stream is typically metered by a flow meter that is wired to an
automatic recording device, or to a programmable logic controller (PLC). Using local area networks and
technologies such as the internet, the data can be accessed from remote locations.
5.2.2 Measurement of Production Levels
Production levels are indicated either as the mass of production or the volume of production, depending on the industry concerned. In the beverage industry, volume is typically used, while in most other industries mass is used, often even in industries producing liquid products. There are various methods of
FUND FOR RESEARCH INTO INDUSTRIAL DEVELOPMENT GROWTH AND EQUITY
GUIDELINE: BASELINE WATER USE DETERMINATION AND TARGET SETTING IN THE MANUFACTURING SECTOR
15
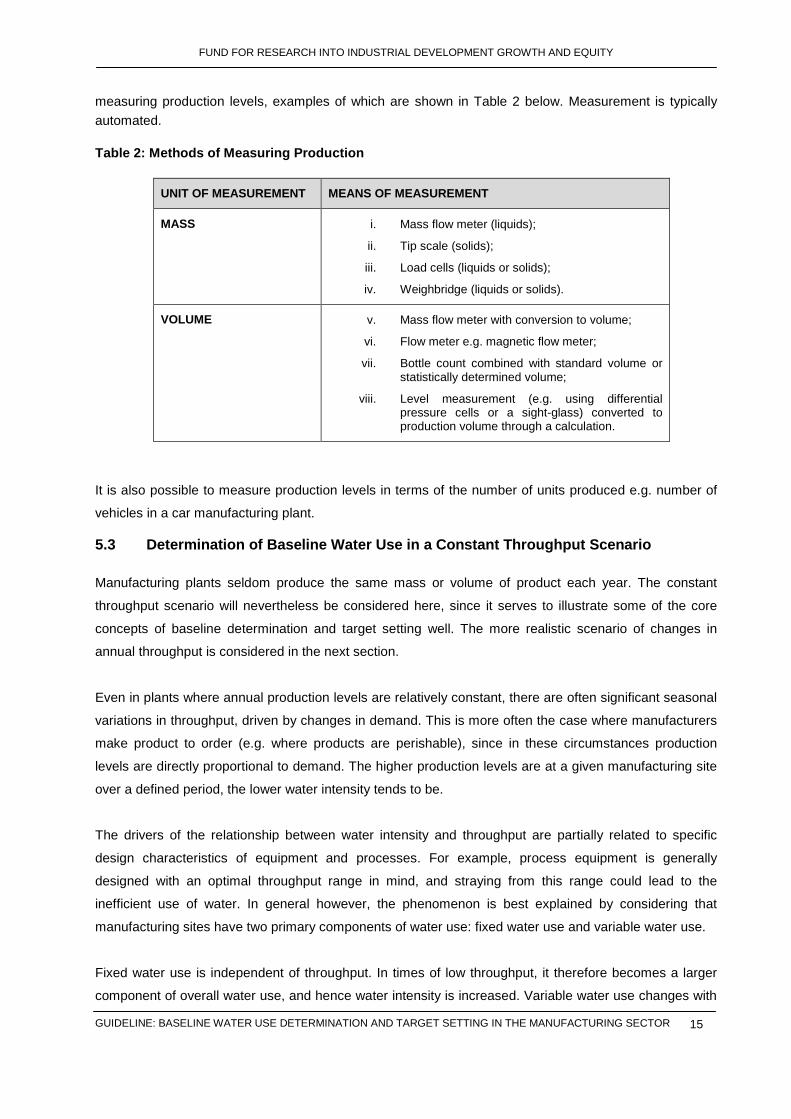
measuring production levels, examples of which are shown in Table 2 below. Measurement is typically automated.
Table 2: Methods of Measuring Production
UNIT OF MEASUREMENT MEANS OF MEASUREMENT
MASS i. Mass flow meter (liquids);
ii. Tip scale (solids);
iii. Load cells (liquids or solids);
iv. Weighbridge (liquids or solids).
VOLUME v. Mass flow meter with conversion to volume;
vi. Flow meter e.g. magnetic flow meter;
vii. Bottle count combined with standard volume or statistically determined volume;
viii. Level measurement (e.g. using differential pressure cells or a sight-glass) converted to production volume through a calculation.
It is also possible to measure production levels in terms of the number of units produced e.g. number of
vehicles in a car manufacturing plant.
5.3 Determination of Baseline Water Use in a Constant Throughput Scenario
Manufacturing plants seldom produce the same mass or volume of product each year. The constant
throughput scenario will nevertheless be considered here, since it serves to illustrate some of the core
concepts of baseline determination and target setting well. The more realistic scenario of changes in
annual throughput is considered in the next section.
Even in plants where annual production levels are relatively constant, there are often significant seasonal
variations in throughput, driven by changes in demand. This is more often the case where manufacturers
make product to order (e.g. where products are perishable), since in these circumstances production
levels are directly proportional to demand. The higher production levels are at a given manufacturing site
over a defined period, the lower water intensity tends to be.
The drivers of the relationship between water intensity and throughput are partially related to specific
design characteristics of equipment and processes. For example, process equipment is generally
designed with an optimal throughput range in mind, and straying from this range could lead to the
inefficient use of water. In general however, the phenomenon is best explained by considering that
manufacturing sites have two primary components of water use: fixed water use and variable water use.
Fixed water use is independent of throughput. In times of low throughput, it therefore becomes a larger
component of overall water use, and hence water intensity is increased. Variable water use changes with

FUND FOR RESEARCH INTO INDUSTRIAL DEVELOPMENT GROWTH AND EQUITY
GUIDELINE: BASELINE WATER USE DETERMINATION AND TARGET SETTING IN THE MANUFACTURING SECTOR
16
the level of production. The cumulative variable water use hence increases as production levels increase
and decreases as production levels decrease. If this relationship is considered to be linear, then overall
water use also follows a linear relationship to production levels as illustrated in Figure 3 below.
Figure 3: The Relationship of Fixed and Variable Water Use to Total water Use
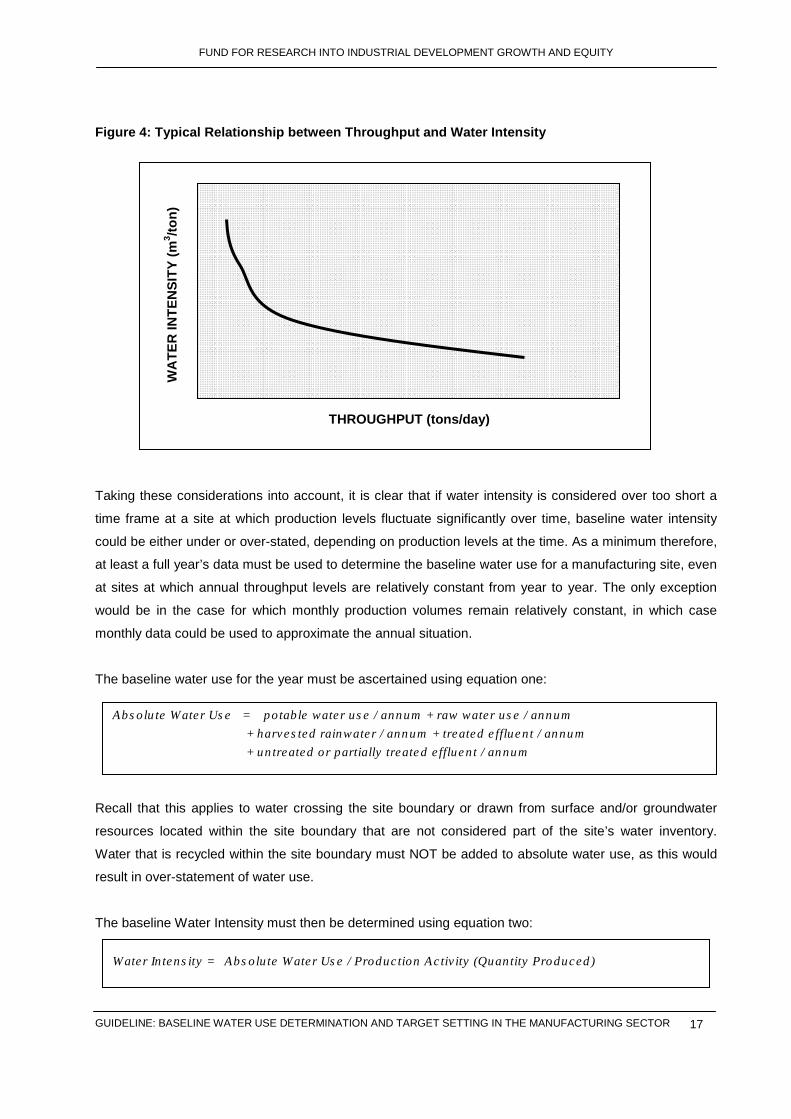
If we consider that water intensity is the ratio of absolute water use to throughput, it is clear that as total
production levels increase, water intensity can be expected to decrease. As fixed water use becomes a
smaller and smaller portion of total water use i.e. at high throughput levels, the reduction in water intensity
with increasing throughput becomes less and less pronounced. This general relationship is described
graphically in Figure 4 below.
THROUGHPUT (tons/day)
WA
TER
US
E (m
3 /day
)
Total water use
} Fixed water use
Variable water use
FUND FOR RESEARCH INTO INDUSTRIAL DEVELOPMENT GROWTH AND EQUITY
GUIDELINE: BASELINE WATER USE DETERMINATION AND TARGET SETTING IN THE MANUFACTURING SECTOR
17
Figure 4: Typical Relationship between Throughput and Water Intensity
Taking these considerations into account, it is clear that if water intensity is considered over too short a
time frame at a site at which production levels fluctuate significantly over time, baseline water intensity
could be either under or over-stated, depending on production levels at the time. As a minimum therefore,
at least a full year’s data must be used to determine the baseline water use for a manufacturing site, even
at sites at which annual throughput levels are relatively constant from year to year. The only exception
would be in the case for which monthly production volumes remain relatively constant, in which case
monthly data could be used to approximate the annual situation.
The baseline water use for the year must be ascertained using equation one:
Recall that this applies to water crossing the site boundary or drawn from surface and/or groundwater
resources located within the site boundary that are not considered part of the site’s water inventory.
Water that is recycled within the site boundary must NOT be added to absolute water use, as this would
result in over-statement of water use.
The baseline Water Intensity must then be determined using equation two:
Absolute Water Use = potable water use / annum + raw water use / annum + harvested rainwater / annum + treated effluent / annum + untreated or partially treated effluent / annum
Water Intensity = Absolute Water Use / Production Activity (Quantity Produced)
THROUGHPUT (tons/day)
WA
TER
INTE
NS
ITY
(m3 /to
n)

FUND FOR RESEARCH INTO INDUSTRIAL DEVELOPMENT GROWTH AND EQUITY
GUIDELINE: BASELINE WATER USE DETERMINATION AND TARGET SETTING IN THE MANUFACTURING SECTOR
18
“Quantity produced” would be the mass or volume of production for the same 12 month period selected
for determination of absolute water use.
Some discretion is required in selecting the year to be used for baseline determination. It is preferable to
select a baseline year in which no extraordinary business activity occurred on the site. If data for such as
year is not available, then as far as possible the collected data should be corrected to accommodate
anomalies. Hence if production was curtailed due to implementation of capital projects or problems
associated with raw material supply, or if an unusually high level of production occurred due to a once-off
order from a large client, the absolute water use and water intensity figures used for baseline
determination may be corrected.
It is not necessary to use a calendar year for baseline water use determination since the use of data from
any 12- month period during which operations proceeded as normal would address seasonal fluctuations
in water demand.
Should water use targets be agreed at some time in the future for the purposes of the Stakeholder Accord
on Water Conservation, a baseline year common to all Accord participants may be specified. In this
instance, should the chosen year be one in which unusual water use activity may have occurred, it is
recommended that either the production level or the water volume used be corrected to reflect a more
average situation. These corrections must be rigorously related to the specific issues driving unusual
water use performance.
This guideline deals with the determination of baseline absolute water use and baseline water intensity at
the site level. It is however possible to carry out baseline determination using the principles above for
specific areas of a manufacturing site, provided that the data as regards water measurement and the
characteristics of the areas concerned are available. Hence if a site contains numerous manufacturing
plants, each of which has its own metered water supplies and means of measuring production, absolute
water use and water intensity can be calculated at the plant level, and hence a baseline can be
determined for each area. The principles of carrying out such a determination are the same as those used
at the site level. Individual users may wish to determine these more focused baseline determinations in
the interest of area-specific water management. This area-based approach is outside the scope of this
document.
5.4 Determination of Baseline Water Use in a Varying Throughput Scenario
The motivation for the determination of baseline water use is the need to establish the level of water use
at a site prior to implementation of water conservation. When conservation initiatives are implemented, it
then becomes possible to ascertain the impact of these initiatives through comparison of observed water
use to the baseline.

FUND FOR RESEARCH INTO INDUSTRIAL DEVELOPMENT GROWTH AND EQUITY
GUIDELINE: BASELINE WATER USE DETERMINATION AND TARGET SETTING IN THE MANUFACTURING SECTOR
19
As discussed above, water intensity at manufacturing sites is generally a function of throughput levels.
Hence, if throughput levels change significantly from year to year, use of a baseline water use value that
does not take this impact into account would be of little value. It is therefore necessary to be able to
correct the baseline that is determined at the start of a conservation programme for changes in
throughput.
In order to be able to correct baseline water use for throughput, the relationship between annual water
use and annual throughput for the manufacturing site has to be established. Figure 5 below outlines this
process.
Figure 5: Throughput versus Absolute Water Use Graph at a Manufacturing Site
The time intervals of interest are annual intervals, and for sites that have the requisite historical data, the
process would entail plotting a graph of annual water use versus annual production levels and then
determining the mathematical relationship that defines that graph.
The graph in Figure 5 is based on the data from 6 separate years of production. Five of the points are
shown to lie roughly on a straight line, while one of the points is an outlier. In that particular year, there
may have been unique circumstances that increased water use disproportionately e.g. problems with the
commissioning of a new production line. Provided there is evidence of unusual circumstances, such
outliers should be ignored and excluded from the data used to determine the relationship between
throughput and water use. Note that this process is aimed at understanding how a site behaves before
the implementation of water conservation initiatives, or rather, at the time that has been chosen for
baseline determination.
ANNUAL THROUGHPUT (tons)
AN
NU
AL
WA
TER
US
E (m
3 )
Outlier

FUND FOR RESEARCH INTO INDUSTRIAL DEVELOPMENT GROWTH AND EQUITY
GUIDELINE: BASELINE WATER USE DETERMINATION AND TARGET SETTING IN THE MANUFACTURING SECTOR
20
The determination of the relationship between annual throughput and annual water use can be carried
out using spreadsheet applications such as EXCEL. Such applications can even be used to define non-
linear relationships through fitting a trend line to the data and then using the application to define the
relationship mathematically. It is in fact often better to use a polynomial to express the relationship, since
polynomials tend to yield relationships with higher R2 values where the observed relationship is not
perfectly linear (a mathematical expression that perfectly described the relationship would have an R2
value of 1).
Once the relationship is known mathematically, it becomes possible to determine a baseline value of
performance for different throughput levels (this is shown in more detail in the example below). For sites
that do not have historical annual water use and throughput data, it is possible to use monthly data as an
approximation, multiplying both throughput and water use by 12 to gain a sense of what the relationship
could look like annually.
It must be said that this process is by no means an exact science. Consider that an individual site could in
practice have different water use levels for the same annual throughput level based on how that annual
throughput was achieved i.e. the cumulative daily throughput levels that led to that annual throughput
level. Note also that we can only truly talk of a baseline water use when a facility operates at a baseline
performance level, and in reality, manufacturing sites deal with variables such as changing raw material
quality, the impacts of human intervention, wear and tear of equipment and the like. There is hence
always some level of flux inherent in manufacturing operations. These variations are however considered
small in relation to the impact of changes in throughput, and throughput is hence a factor that must be
included in baseline determination where annual throughput levels change significantly at a site.
Example 3:
The relationship between throughput and absolute water use was determined, by fitting a polynomial
trend line to raw data, to be as follows at a beverage manufacturing site:
Annual Absolute Water Use (m3) = -0.00000004 x (Throughput (hl))2 + 0.41 x Throughput (hl) + 9.156
Site management wished to institute a water conservation programme, and wanted to establish what the
baseline water use would be for each of the next 5 years, considering that throughput levels were
expected to vary significantly over this period.
Throughput in the current year was expected to be 2,000,000 hl, and hence absolute water use was
expected to be:
Absolute water use = 0.00000004 x 2,000,0002 + 0.41 x 2,000,000 + 9.156
= 660,009 m3/annum

FUND FOR RESEARCH INTO INDUSTRIAL DEVELOPMENT GROWTH AND EQUITY
GUIDELINE: BASELINE WATER USE DETERMINATION AND TARGET SETTING IN THE MANUFACTURING SECTOR
21
Table 3 outlines projected water use baseline values for each of the next five years, based on expected
throughput levels.
Table 3 : Projected Water Use Baselines for Different Throughput Levels
YEAR
EXPECTED
THROUGHPUT (hl)
PROJECTED WATER USE BASELINE (m3/annum)
0 2,000,000 660,009
1 1,850,000 621,609
2 2,100,000 684,609
3 2,300,000 731,409
4 2,160,000 698,985
5 2,400,000 753,609
The relevance of this approach is that for each of these years, it is possible to compare water use
achieved (including the impacts of implemented conservation initiatives) to baseline water use, but
corrected for the influence of changes in throughput. It is clear that neglecting to account for throughput
could lead to use of a baseline that may be meaningless in terms of evaluating the impacts of
conservation, since the savings expected or realised may be insignificant relative to the error inherent in
the use of a baseline that does not account for throughput changes.

FUND FOR RESEARCH INTO INDUSTRIAL DEVELOPMENT GROWTH AND EQUITY
GUIDELINE: BASELINE WATER USE DETERMINATION AND TARGET SETTING IN THE MANUFACTURING SECTOR
22
6 IDENTIFICATION AND QUANTIFICATION OF WATER CONSERVATION OPPORTUNITIES
6.1 Overview
This guideline describes the technical approach to be used in determining water use baselines and
setting water use targets. This technical approach is complemented by certain strategic considerations
e.g. business priorities or problems with water scarcity in specific locations. The detail of these
considerations is considered outside the scope of this guideline, since they are unique to each
organisation. They are however an important input to decisions regarding the viability of each water
conservation initiative that is identified, which will ultimately determine whether individual initiatives are
implemented or not. The assessment of viability is a matter that is left to the discretion of individual
organisations as far as this guideline is concerned.
6.2 Quantification of Water Use in Priority Areas
6.2.1 Determination of a detailed water use breakdown
In order to determine water use targets, it is necessary to first identify each of the water-saving
opportunities on the site, and to quantify the amount of water that could be saved through implementation
of these. The first step in doing this is to determine how much water is used in various areas of the site.
The example of a generic manufacturing facility will be used to illustrate this concept. It is important to
appreciate however that each site is unique, and that even sites within the same manufacturing sub-
sector may exhibit vastly different water use breakdowns.
The site should first be divided into major water-use areas. For a typical manufacturing site these would
be:
i. Core manufacturing areas – these are those areas on the site in which raw materials and
products at various stages of manufacture are handled, processed and stored;
ii. Site utility areas – these are areas that house site services, such as steam production,
refrigeration, compressed air generation and cooling water circuits;
iii. Staff amenities, such as toilets and washrooms;
iv. Gardens and lawns, including water features;
v. Cleaning / carwash and;
vi. Staff canteen/kitchen.
6.2.2 Quantification of water use in core manufacturing areas
The detail with which the water use in core manufacturing areas may be assessed depends in part on the
metering capabilities of the manufacturing site in question, with more extensive metering networks
enabling more extensive assessment. Total core manufacturing water use is the amount of water used in
all core manufacturing areas on a site, excluding water that is internally recycled.

FUND FOR RESEARCH INTO INDUSTRIAL DEVELOPMENT GROWTH AND EQUITY
GUIDELINE: BASELINE WATER USE DETERMINATION AND TARGET SETTING IN THE MANUFACTURING SECTOR
23
Where flow meters are in place, quantification is simply a matter of reading the volumes used in individual
areas over a given time period and adding these to ascertain total core manufacturing water use for the
site over that period. Where flow meters are not available, it is possible in some cases to calculate the
volumes of water used, based on engineering data such as pipeline pressures, pump running hours,
pump characteristics, piping characteristics and the like. It is also possible to use energy balances to
estimate the amount of water used, and to use information such as the moisture levels in waste materials
and the mass of waste produced over the period of interest to assess the amount of water used in
process areas that generate waste streams.
6.2.3 Quantification of water use in site utility areas
The approach used for the assessment of absolute water use in utility areas is similar to that used for
core manufacturing areas. The water used for individual utilities/services (excluding water that is internally
recycled) is added up to yield the total site utility water use.
6.2.4 Quantification of water use in staff amenity areas
Staff amenity areas in manufacturing facilities use plumbing fixtures and fittings such as taps,
showerheads, toilets, mixers and the like.
There are three components to water use in these areas:
i. The frequency with which each fitting is used;
ii. The duration for which each fitting is used and;
iii. The flow rate of water over the duration of each use.
These last two issues may be grouped into a single item, which would be the average volume of water
used with each use.
Amenity areas are often not individually metered, and are typically widely dispersed across manufacturing
sites. They may comprise kitchenettes, changing rooms, toilet facilities and the like. At labour intensive
sites, staff changing rooms can consume large amounts of water. In order to assess water use due to
amenities, it is therefore necessary to estimate frequency of use, duration of use and flow rate during use
(or volume with each use) for all plumbing fittings. The data on flow rate or volume used could be
obtained from manufacturer’s specifications. These may not be readily available, and in this instance
physical measurements may have to be made. For example, the volume of a washbasin may be
determined from physical measurements, and the time taken to fill it could be divided into this volume to
ascertain the flow rates of taps. It is the typical flow rate used rather than the maximum flow rate possible
that is of interest when assessing taps.

FUND FOR RESEARCH INTO INDUSTRIAL DEVELOPMENT GROWTH AND EQUITY
GUIDELINE: BASELINE WATER USE DETERMINATION AND TARGET SETTING IN THE MANUFACTURING SECTOR
24
Example 4:
The showers at a staff changing room at a steel plant operating on a 3-shift system with 300 workers on
site for each shift and 90% of staff using the facilities, are operated for 2 minutes at a time and at a flow
rate of 15 litres per minute. Calculate the average daily water use due to the showers.
Water use = frequency of use x duration per use x flow rate
= 0.9 x 300 x 3 uses/day x 2 min/use x 15 L/min = 24,300 L/day.
Table 4 below outlines what the breakdown of staff amenity water use at a manufacturing site could look
like after such an assessment has been conducted
Table 4: Quantification of Water Used for Amenities
This site is shown to use approximately 12,000 KL per annum for staff amenities. More detail on
assessing water use in this area may be found in the guide: “Guideline for Baseline Water Use
Determination and Target Setting in the Commercial Sector”.
6.2.5 Quantification of water use by gardens and lawns
Where metering is not in place, water use can be estimated from the frequency of irrigation, its duration
and the flow rate of water delivered to the irrigation system or via a garden hose. The flow rate can be
determined by discharging water into a receptacle of known volume and then determining the time
required to fill it, with the volume divided by the time being the calculated flow rate. The total time used for
irrigation over the year can then be used together with this flow rate to estimate the volume of water used
for irrigation. This element of water use is typically very small at a typical manufacturing site. Impacts of
Area Fitting Flow Rate (L/min)
Duration Per Use
(min)
Volume Per Use (L)
No. of Uses
Per Day
Volume Per Day
(L)
Volume Per Annum
(L)
Kitchenette 1
Tap 1 12 0.5 6 30 180 65,700
Tap 2 10 0.5 5 56 280 102,200
Tap 3 9 0.5 4.5 45 202.5 739,12.5
Kitchenette 2
Tap 1 15 1 15 67 1005 366,825
Tap 2 15 0.8 12 43 516 188,340
Kitchenette 3
Tap 1 15 0.4 6 54 324 118,260
Tap 2 15 0.5 7.5 32 240 87,600
Change rooms
Tap 1 14 1 14 30 420 153,300
Tap 2 14 1 14 30 420 153,300
Tap 3 14 1 14 30 420 153,300
Toilet 1 8 200 1600 584,000
Toilet 2 8 230 1840 671,600
Showers 16 2 32 810 25920 9,460,800
TOTALS 33367.5 12,179,138

FUND FOR RESEARCH INTO INDUSTRIAL DEVELOPMENT GROWTH AND EQUITY
GUIDELINE: BASELINE WATER USE DETERMINATION AND TARGET SETTING IN THE MANUFACTURING SECTOR
25
seasonality must be accounted for by assessing water use at various times in the year. Changes in the
types of plants being irrigated should also be accounted for.
At some manufacturing sites, irrigation with effluent is practised, in some instances over large areas such
as pastures or crop fields. The water used must only be considered part of site water use where the
effluent was supplied by another party. Effluent generated on the site that is subsequently used for
irrigation must not be considered part of site water use, as this is an example of internal recycling.
6.2.6 Quantification of water use for cleaning/carwash
This refers to cleaning outside of the buildings on the manufacturing site (cleaning of the building interior
should be factored into the water use ascertained when assessing staff amenities except in instances
where non-potable water is used). Determination of water use can be carried out in much the same way
as for the assessment of water use by gardens and lawns in the case where sub-metering is not in place.
6.2.7 Quantification of water use for the staff canteen/kitchen
Note that this is different to the water use due to kitchenettes, which are smaller facilities generally used
to prepare hot beverages and to microwave food. Staff canteens/kitchens tend to be larger and designed
to serve large groups of people. They may have numerous specialised appliances, some of which may
consume significant quantities of water e.g. dishwashers. The approach used is similar to that used to
assess water use by staff amenities, with engagements with equipment suppliers being an important
means of obtaining water use information for specific appliances.
6.2.8 Accommodating water recycling
Issues regarding water recycling have been mentioned previously, but bear repeating for the sake of
clarity. The recycling of water is a common water conservation strategy in the manufacturing sector.
When determining baseline water use, it is however the amount of water that crosses the site boundary
and water that is sourced from surface and groundwater resources on site that is of interest. Water that is
internally recycled on a manufacturing site should therefore not be included in baseline water use. Water
that is recycled from another facility should however be included, as this water crosses the site boundary.
6.2.9 Compiling a site water use overview
The aim of gathering the information on individual water use areas is to be able to construct a breakdown
of water use on the site, which would assist in pointing out where the biggest opportunities for
conservation are. Figure 4 below outlines an example of such a breakdown, based on audits carried out
on meat processing plants in California, USA.

FUND FOR RESEARCH INTO INDUSTRIAL DEVELOPMENT GROWTH AND EQUITY
GUIDELINE: BASELINE WATER USE DETERMINATION AND TARGET SETTING IN THE MANUFACTURING SECTOR
26
Figure 6: Typical Breakdown of Water Use in Meat Processing
Source: The Pacific Institute
It is clear from Figure 6 that Process Water (i.e. “water use in core manufacturing areas”) and Cooling
Water (which would fall into the “site utilities” category) are the biggest users, followed by Restroom
Water, which would fall into the “site amenities” category. Water used for landscaping (irrigation and
possibly water features) is a small portion of the total. While the relative size of individual use categories
may not necessarily imply the biggest opportunities for conservation, it makes sense to investigate
opportunities in these areas first, particularly if the site exhibits high water intensity relative to other sites
in the same sector.
6.3 Assessment of Individual Water Conservation Opportunities
In order to set meaningful water use targets, the size of individual water conservation opportunities has to
be determined. Each opportunity can then be evaluated in terms of its viability, and those found to be
viable can then be planned for implementation. Implementation timelines will determine when the savings
expected from planned conservation interventions will be realised and can hence be built into targets.
A water conservation opportunity may be defined as a viable intervention which, when implemented,
results in a reduced consumption of water relative to baseline water use.
The viability of individual water conservation interventions should be ascertained using the standard
methodologies used by individual organisations when justifying any project. While the details are outside
the scope of this guideline, and will depend in part on the approach of individual organisations, the
following are important considerations:
• The capability of the organisation and/or external service providers to sustain the
intervention. For example, should new equipment be required, are the spares and skills
required for routine maintenance available locally and at short notice?
• The financial viability of the intervention i.e. will savings in water, energy, chemicals etc.
justify the capital and operating costs arising from the intervention?
FUND FOR RESEARCH INTO INDUSTRIAL DEVELOPMENT GROWTH AND EQUITY
GUIDELINE: BASELINE WATER USE DETERMINATION AND TARGET SETTING IN THE MANUFACTURING SECTOR
27
• Risks arising from the intervention – a full risk assessment should be carried out on all
proposed plant and work practice modifications to ensure that unintended consequences of
implementation are avoided. For example, reducing the frequency with which cleaning
solutions are refreshed could lead to microbiological contamination in food processing plants.
Ill-considered conservation projects can lead to unanticipated problems.
• The risks of not implementing an intervention also bear consideration. In water-scarce
regions, sites may be subjected to water restrictions, significantly increasing the costs of
failing to conserve water.
There are two broad categories into which water conservation initiatives in the commercial sector may be
divided:
i. Operational initiatives and;
ii. Capital projects
Operational initiatives are those which yield water savings through the modification of work practices and
behaviour, or through the use of different materials/consumables. For example, implementation of a
preventive maintenance programme could reduce leaks and hence conserve water.
Capital projects are those in which changes to equipment or plant are made. An example here would be
the introduction of a water treatment plant to allow increased recycling of treated effluents, thereby
reducing fresh water requirements.
What follows are brief examples of how opportunities may be assessed in the various water-use areas of
a manufacturing site.
6.3.1 Assessment of water conservation opportunities in core manufacturing areas
Core manufacturing areas differ significantly in different manufacturing sub-sectors, and it is not
uncommon to find organisations within the same sub-sector using very different equipment and
processing techniques. Core manufacturing areas are an important source of competitive advantage for
manufacturers, and have an impact on important considerations such as production capacity, product
quality, process yields and operational flexibility. The identification of water conservation opportunities in
core manufacturing areas therefore demands a deep understanding of local site conditions.
Water conservation opportunities in the core manufacturing area generally comprise opportunities to
reduce “point-of-use” consumption and opportunities to recycle water. A holistic review of potential
conservation opportunities would typically result in the identification of opportunities in both of these
areas. “Point-of-use” reductions in water use involve reducing the amount of water required by individual
unit operations. An example would be replacement of the spray balls used for vessel cleaning in the food
industry with more efficient alternatives that use less water yet achieve the same level of hygiene.

FUND FOR RESEARCH INTO INDUSTRIAL DEVELOPMENT GROWTH AND EQUITY
GUIDELINE: BASELINE WATER USE DETERMINATION AND TARGET SETTING IN THE MANUFACTURING SECTOR
28
Recycling opportunities involve replacing all or part of the water requirements for a process with recycled
water. The recycled water could be obtained as an effluent from other processes on site and used in
unaltered form if possible, or treated before reuse. It is generally best to assess these opportunities in an
integrated manner rather than in a piece-meal fashion. There are techniques such as Pinch Technology
available that may assist in the selection of streams to be recycled and the matching of water-demanding
and water-consuming processes on a manufacturing site.
6.3.2 Assessment of water conservation opportunities in site utility areas
The approach to be followed here is similar in some ways to that followed for core manufacturing areas.
Site utilities generally employ generic technologies supplied by a larger number of vendors than what is
typically found in the case of core manufacturing equipment. Special care should be taken to consider
how site utilities interface with core manufacturing areas i.e. there are typically a number of links between
the performance of site utilities and the performance of core manufacturing unit operations. Hence it is
possible to compromise product quality or employee safety by implementing ill-considered water
conservation initiatives in the site utilities area, and such risks should be carefully evaluated.
6.3.3 Assessment of water conservation opportunities in staff amenity areas
Efficient plumbing devices and fittings are available in South Africa, as are efficient appliances. In order to
ascertain potential water saving opportunities, the expected water consumption due to the installation of
alternative devices must be compared to the water use due the devices currently installed. The difference
is then the magnitude of the saving. Opportunities may also exist to recycle grey water from washbasins
and the like. More detail on this topic is available in the guide: “Guideline for Baseline Water Use
Determination and Target Setting in the Commercial Sector”.
6.3.4 Assessment of water conservation opportunities in garden and lawn irrigation
It is useful to benchmark site water use for irrigation in mm, as this allows horticultural specialists to
compare the water use of a site to a projected water use for a given mix of plants, taking the local
environment (in terms of rainfall and evaporation) into account. To convert the volume required for
irrigation from KL to mm, use the following relationship:
It is best to use an annual figure for this assessment in order to account for seasonality.
From an operational point of view, the types of measures that could be taken to reduce irrigation water
use include:
i. Watering only during cool periods;
ii. Watering no more than once a week;
iii. Ensuring that water is directed only at plants and not paved areas;
Equation 5: Irrigation Water Use
Irrigation Water use (mm) = Irrigation Water Use (KL) x 1000 / Garden area (m2)

FUND FOR RESEARCH INTO INDUSTRIAL DEVELOPMENT GROWTH AND EQUITY
GUIDELINE: BASELINE WATER USE DETERMINATION AND TARGET SETTING IN THE MANUFACTURING SECTOR
29
iv. Changing watering patterns based on seasonal variations;
v. Mulching of flower beds;
vi. Removal of weeds/invading vegetation and;
vii. Control of mowing height for lawn areas.
The types of capital investment opportunities that could be pursued in order to reduce irrigation water use
include:
i. Installation of efficient irrigation systems;
ii. Rain sensors to shut off irrigation systems;
iii. Wind sensors to shut off irrigation systems;
iv. Soil moisture sensors and;
v. Use of indigenous plants and plants that use minimal amounts of water e.g. groundcover
tends to use less water than lawn does.
The savings associated with each of these initiatives should be documented for possible inclusion in a
water conservation plan, dependent on viability.
6.3.5 Assessment of water conservation opportunities in cleaning/carwash
Work practice changes typically present a significant opportunity for savings in this regard e.g. the use of
brooms instead of hoses for cleaning of walkways and paved areas. Since manufacturing sites typically
also experience significant traffic due to the delivery of raw materials and the dispatch of product,
housekeeping issues regarding vehicles are important e.g. leaks from tankers should be actively
managed.
6.3.6 Assessment of water conservation opportunities at canteens / staff kitchens
This assessment is very similar to that for amenity areas. Extensive consultation with specialist suppliers
is necessary to ascertain specific savings associated with particular appliances. From an operational
point of view, the work practices of kitchen staff could potentially be changed to save water.
6.3.7 Assessment of water conservation opportunities due to rainwater harvesting
Rainwater harvesting is typically carried out by collecting rainwater from rooftops as well as from ground-
level stormwater collection areas in manufacturing installations. The water is typically diverted to a tank
(or on large sites, a dam), from which it is either pumped or fed by gravity to point-of-use, depending on
the elevation of the tank or impoundment relative to the elevation at the point-of-use. Some treatment
may be required depending on user requirements, but for uses such as garden irrigation, the water may
typically be used without treatment. It is of course important to ensure that the stormwater is not
contaminated during collection, as this could limit options for its use in untreated form.
The amount of water that can potentially be harvested may be estimated from the average annual rainfall
and measured area of the rooftops and/or paved/concreted areas to be used from the relationship.

FUND FOR RESEARCH INTO INDUSTRIAL DEVELOPMENT GROWTH AND EQUITY
GUIDELINE: BASELINE WATER USE DETERMINATION AND TARGET SETTING IN THE MANUFACTURING SECTOR
30
Example 5
What is the annual potential volume of rainwater that could be harvested at a manufacturing installation
with a roof area of 1300 m2 and paved stormwater collection areas of 115,000 m2 in a town with an
average annual rainfall of 500 mm?
Potential rainfall harvest = 500 x (1,300 + 115,500) / 1000 = 58,400 m3/annum
The actual tank or impoundment size required would depend on shorter-term fluctuations in rainfall
patterns and the matching of rainwater supply to the demands of the processes in which harvested
rainwater is to be used.
6.3.8 The need for an integrated approach to the identification of conservation opportunities
The preceding sections of this guideline have examined individual water conservation opportunities.
However, it is important that once these individual areas have each been examined, the entire site is
evaluated as a single integrated system. This ensures that any changes made in one area which could
have impacts for other areas are considered with these impacts in mind. This integrated approach can
also assist in the prioritisation of the implementation of individual water conservation initiatives. Several
iterations would typically be required before the overall plan can be finalised.
For example, consider the case of the implementation of an effluent treatment system that would allow
increased recycling. The system’s design capacity may be based on a given volume of effluent, which
may change significantly should “point-of-use” conservation initiatives be implemented. It is therefore
prudent to consider the entire basket of options and the implications of each option for the basket as a
whole before implementing any single option.
Equation 6: Potential Rainwater Harvest
Potential Rainwater Harvest = Annual rainfall (mm) x Collection area (m2) / 1000

FUND FOR RESEARCH INTO INDUSTRIAL DEVELOPMENT GROWTH AND EQUITY
GUIDELINE: BASELINE WATER USE DETERMINATION AND TARGET SETTING IN THE MANUFACTURING SECTOR
31
7 SETTING WATER USE TARGETS
7.1 Timeframes for water use targets
Water use targets should be reviewed at least annually, with a target determined for each year over a five
year time horizon. Hence at any one time an organisation should have five targets, one for each of the
next five years. The target for the next year may be viewed as a short term target, and the target in five
years time as a long-term target. Repeating the process each year allows for current approaches in water
conservation as well as current business strategy and/or stakeholder priorities, to be incorporated into the
process.
Continuous improvement is one of the drivers of target setting and performance monitoring, and hence
the target for each year should demonstrate a progressive planned reduction in water intensity i.e. a
progressive improvement in water use efficiency. These planned improvements should be based on
opportunities that have been evaluated as described above. Over time however, it does become more
and more difficult to continue to improve without significant capital investment. This is the law of
diminishing returns as applied to water conservation. Organisations that achieve their lowest feasible
water use level should shift their focus to the maintenance of performance, while continuing to scan the
environment for new technologies that may enable yet further improvement.
7.2 The role of water use benchmarks
The use of water intensity trends as a means of reviewing water use efficiency performance has been
discussed earlier, and is a means for an individual organisation to determine whether water use efficiency
performance is improving or declining over time. An organisation’s absolute water use efficiency
performance may in addition be compared to other users in a sector through the use of benchmarks. In
addition to benchmarks that merely document the performance of users in a sector, a number of “best-
practice” water use benchmarks are available for various industries, some examples of which are outlined
together with other more general benchmarks in Table 5 below.
Table 5: Selected Water Intensity Benchmarks in Manufacturing
INDUSTRY BENCHMARK DETAIL BENCHMARK VALUE SOURCE
Iron and Steel Typical integrated mill with
extensive recirculation
2.4 – 4.8 m3/ton crude steel International Iron and
Steel Institute
Brewing Average global brewery water use 6.5 hl/hl packaged beer UNEP
Best practice 4 hl/hl packaged beer UNEP
Dairy Average of 27 UK dairies 1.3 litres/litre packaged
milk
Envirowise
Power generation Best practice for wet-cooled, coal-
fired power stations, derived from
statistical analysis of US data
1.5 litres/kWh power to grid Illinois University

FUND FOR RESEARCH INTO INDUSTRIAL DEVELOPMENT GROWTH AND EQUITY
GUIDELINE: BASELINE WATER USE DETERMINATION AND TARGET SETTING IN THE MANUFACTURING SECTOR
32
It is not suggested that such benchmarks be directly used to set targets, since individual water users each
have their own context within which water use has to be managed. Benchmarks do however provide an
important reference point against which targets may be reviewed. If a water use target deviates
significantly from a benchmark value, this may indicate that the target should be modified, specifically in
cases where the water use target is at a far lower level of efficiency than the benchmark value. It is
however critically important that the detail as to how individual benchmarks were derived is appreciated,
since some benchmarks could be misleading. As a case in point, of the examples above, the incoming
water quality at the power stations used to derive the best practice benchmark could be significantly
better than what is experienced locally, and similar levels of performance may not be achievable in South
Africa. Benchmarks may not be available in some instances, and may need to be developed, particularly
for specialised manufacturing operations.
7.3 Development of a site water conservation plan and associated targets
Once potential opportunities have been identified and the volumes of potential water savings associated
with each have been quantified, each of these opportunities now has to be analysed to a level of detail
that will permit management within the organisation to be able to make well-considered business
decisions regarding implementation.
Ideally, the assessment of opportunities on the site should yield a wide suite of potential water saving
options. Each of these options would have to be evaluated with respect to specific criteria that determine
viability, within each organisation’s unique context. Of all the possible options, a number of viable options
could then be identified. The viable options could be earmarked for implementation at specific times over
the five-year period following each, annual iteration of target setting. By subtracting the water savings
expected from the baseline water use level and taking the timing of implementation of individual initiatives
into account, annual targets can then be set. It is recommended that since targets are set annually,
initiatives planned for implementation in any one year be used to set the target for the following year. This
is illustrated by the following example.

FUND FOR RESEARCH INTO INDUSTRIAL DEVELOPMENT GROWTH AND EQUITY
GUIDELINE: BASELINE WATER USE DETERMINATION AND TARGET SETTING IN THE MANUFACTURING SECTOR
33
Example 6:
A carbonated soft drink plant with annual production of 2 million hectolitres uses 660,009 m3 of potable
water annually. This water is split between the various uses on the site as per Table 6 below:
Table 6: Water Use by Area at a Soft Drinks Plant
Area Water Use (m3) % of Total
Process 560,009 84.85%
Cooling towers 34,000 5.15%
Steam production 46,500 7.05%
Amenities 10,000 1.52%
Irrigation 4,800 0.73%
Canteen 2,600 0.39%
Cleaning/carwash 2,100 0.32%
1 hl = 100 litres and the water intensity of the plant was therefore:
Water intensity = volume of water / volume of product
= 660,009 m3 / (2,000,000 x 100/1000) m3
= 3.30 m3/m3 OR 3.30 hl/hl
The Plant Manager noted that the company’s 3 other plants had an average water intensity of 2.6 hl/hl,
and that the best practice for the industry, according to independent research was 2.1 hl/hl. It was
therefore clear that improvements in water use efficiency were possible, and hence a water conservation
project was launched.
It was clear from the site water use breakdown that Core Manufacturing areas and Site Utilities should be
the focus of any conservation projects, since these areas used 97% of the total amount of water used on
site. This did not mean that there were no opportunities in other areas, but simply that that biggest
opportunities were most likely in these areas and that they therefore should be prioritised for action.
Water conservation opportunities were identified and rough water savings were quantified for each
opportunity. Detailed investigations by engineering staff located on the site supported by specialist
contractors yielded a number of viable conservation projects based on savings in water (among other
benefits) relative to implementation costs and the risks associated with implementation. The initial focus
was placed on operational improvements. These comprised water conservation education and awareness
programmes for plant operators and an improved preventive maintenance programme to restore
equipment functioning to OEM specifications. In addition, opportunities to optimise the existing plant were

FUND FOR RESEARCH INTO INDUSTRIAL DEVELOPMENT GROWTH AND EQUITY
GUIDELINE: BASELINE WATER USE DETERMINATION AND TARGET SETTING IN THE MANUFACTURING SECTOR
34
investigated. This involved an examination of work practices at the shop floor, and a review of all process
conditions.
Next the focus moved to capital projects that could reduce water use. The bottle washer was found to be
consuming far more water than at other sites in the organisation, and was prioritised for action. The
supplier of the equipment was requested to propose water conservation options aimed at reducing water
consumption while achieving the same level of bottle washing effectiveness. A number of phased options
for modification of the bottle washer were proposed. Solutions were also found for reducing cooling water
make-up through improved automation of blow down, and an audit of the entire steam reticulation system
yielded opportunities to improve condensate recovery.
The suite of options identified was assessed, and those options found to be viable were planned for
implementation. Table 7 outlines how these individual options were located within the five-year target-
setting period.

FUND FOR RESEARCH INTO INDUSTRIAL DEVELOPMENT GROWTH AND EQUITY
GUIDELINE: BASELINE WATER USE DETERMINATION AND TARGET SETTING IN THE MANUFACTURING SECTOR
35
Table 7: Projected Annual Savings from Water Conservation Projects
Area of Site Baseline
% of Total Consumption
Expected annual savings of projects implemented in Year 1
Expected annual savings of projects implemented in Year 2
Expected annual savings of projects implemented in Year 3
Expected annual savings of projects implemented in Year 4
Expected annual savings of projects implemented in Year 5
Process 560009 84.85 80000 40000 15000 5000 0 Cooling Towers 34000 5.15 0 6000 0 2500 2900
Steam production 46500 7.05 3500 15000 0 0 0 Amenities 10000 1.52 0 0 0 0 0 Irrigation 4800 0.73 0 0 0 0 0 Canteen 2600 0.39 0 0 0 0 0 Carwash 2100 0.30 0 0 0 0 0 Future annual savings expected from implemented projects 83500 61000 15000 7500 2900 Expected Absolute Water Use in following year if no further action is taken (m3/annum)* 576,509 515,509 500,509 493,009 490,109
Expected water intensity in following year if no further action is taken (hl/hl)* 2.88 2.58 2.50 2.47 2.45
*Assumes the initiatives are successfully implemented and achieve the expected savings

FUND FOR RESEARCH INTO INDUSTRIAL DEVELOPMENT GROWTH AND EQUITY
GUIDELINE: BASELINE WATER USE DETERMINATION AND TARGET SETTING IN THE MANUFACTURING SECTOR
36
Table 7 outlines the essence of the target-setting process. The philosophy followed is to build any water
savings planned for implementation in a particular year into the target for the following year. Initiatives
planned for implementation within any given year are not built into that year’s target. This approach is
slightly conservative, since it would be possible to include initiatives implemented in any given year into
that year’s target by performing pro-rata calculations of savings and including these into the target. This
latter approach is not recommended for the following reasons:
• There is no guarantee that a conservation project would be implemented in the month it is
planned. Pro-rata approaches could therefore lead to penal targets;
• The approach proposed provides more certainty to the target-setting process.
Table 8 below outlines in more detail how this process, which follows from table 7, is used to set targets.
Note that the target for each year is the level of water use that the site would like to achieve over the
course of that full year. The target is set at the beginning of the year and water use would then be
monitored over the course of that year. The water use at the end of the year is then compared to the
target to assess performance.
Table 8: Annual Water Use Targets Example
Year Target (m3) Target (m3/m3) Comment
Baseline 660,009 3.30 Determined at “Year 0”
Year 1 660,009 3.30 Target = baseline
Year 2 576,509 2.88 Target = baseline – expected annual savings in year 1.
Year 3 515,509 2.58 Target = baseline – (expected annual savings in year 1 + expected annual savings in year 2)
Year 4 500,509 2.50 Target = baseline – (expected annual savings in year 1 + expected annual savings in year 2 + expected annual savings in year 3)
Year 5 493,009 2.47 Target = baseline – (expected annual savings in year 1 + expected annual savings in year 2 + expected annual savings in year 3 + expected annual savings in year 4)
Year 1, which is the year after which the baseline is determined, is considered to be the year in which the
first iteration of opportunity identification and assessment is carried out. It is therefore expected that
minimal implementation would happen in this year as this would be a year of intensive planning. For this
reason, the target for year 1 is taken as the benchmark water use level. Thereafter targets are made
increasingly challenging as conservation projects are implemented.

FUND FOR RESEARCH INTO INDUSTRIAL DEVELOPMENT GROWTH AND EQUITY
GUIDELINE: BASELINE WATER USE DETERMINATION AND TARGET SETTING IN THE MANUFACTURING SECTOR
37
7.4 Dealing with significant throughput changes
The preceding calculations and examples made an important assumption that requires further
consideration – the throughput at the manufacturing site was assumed to be constant from one year to
the next at 2,000,000 hl/annum. In practice this is often not the case, and hence it is worthwhile to
examine the implications of significant changes in annual throughput. The issue of accounting for the
impact of changes in throughput on baseline water use was handled earlier in this guideline (see section
5.4).
An additional and important consideration when including the impact of changes in throughput into the
baseline and target-setting process, is that the magnitude of expected savings from individual
interventions are in many cases themselves a function of throughput. This applies specifically to initiatives
that deal with the variable element of water usage, as would be the case with conservation initiatives
involving core manufacturing water use, for example. Figure 7 below illustrates the two fundamental
types of water savings initiatives on the basis of their relationship to throughput.
Figure 7: Fixed and Variable Water Savings from Implemented Conservation Initiatives
Fixed savings arise from initiatives that are independent of production processes, or from processes
within production that use water in quantities that are independent of throughput. Variable savings
typically arise from initiatives within core manufacturing processes, and the quantity of water saved by
these initiatives tends to increase as the level of production increases. Total savings at a site as a result
of implementation of a number fixed and variable water use initiatives will therefore, as a group, typically
be a function of throughput, as outlined in the graph. The magnitude of the savings and their relationship
THROUGHPUT (tons/day)
WA
TER
SA
VIN
GS
(m3 /d
ay)
Total savings
} Fixed savings
Variable savings

FUND FOR RESEARCH INTO INDUSTRIAL DEVELOPMENT GROWTH AND EQUITY
GUIDELINE: BASELINE WATER USE DETERMINATION AND TARGET SETTING IN THE MANUFACTURING SECTOR
38
to throughput depends on the specific nature of each initiative, and are typically quantified when each
initiative is investigated for feasibility. This information is therefore generally available for use in target
setting. For the variable savings in particular, it is necessary to calculate what these savings would be for
each throughput level expected in each of the years over which targets are to be set.
This brings us to the fundamental difference between setting targets in an environment in which
throughput is constant and in an environment in which throughput changes significantly from year to year.
In the former situation, the target for any year is simply the baseline less the expected volumes of water
saved in preceding years. These savings do not change since the throughput does not change. When
annual throughput changes, the annual savings from each initiative (except for those involving fixed
savings) change as well. For any given year, the target then becomes the baseline (corrected for
throughput) less the savings due to initiatives implemented in preceding years, all corrected to reflect
the throughput level of the year for which the target is being set. Table 9 below outlines how targets
are calculated using this approach.

FUND FOR RESEARCH INTO INDUSTRIAL DEVELOPMENT GROWTH AND EQUITY
GUIDELINE: BASELINE WATER USE DETERMINATION AND TARGET SETTING IN THE MANUFACTURING SECTOR
39
Table 9 : Baseline Water Use and Target-Setting with Changes in Throughput
YEAR BASELINE YEAR YEAR 1 YEAR 2 YEAR 3 YEAR 4 YEAR 5
THROUGHPUT (hl) 2,000,000 1,850,000 2,100,000 2,300,000 2,160,000 2,400,000
CORRECTED BASELINE (m3/annum) 660,009 621,609 684,609 731,409 698,985 753,609
SA
VIN
GS
CO
RR
EC
TED
FO
R T
HR
OU
GH
PU
T (m
3 )
Process 1 0 80,000 91,000 97,000 91,500 98,500
Process 2 0 0 40,000 43,000 40,500 44,000
Process 3 0 0 0 15,000 14,000 16,000
Process 4 0 0 0 0 5,000 6,500
Cooling Towers 1 0 0 6,000 6,500 6,050 7,000
Cooling Towers 2 0 0 0 0 2,500 2,750
Cooling Towers 3 0 0 0 0 0 2,900
Steam Production 1 0 3,500 4,000 4,300 4,050 4,500
Steam Production 2 0 0 15,000 16,500 15,250 16,860
TOTAL ANNUAL SAVINGS EXPECTED BY END OF
YEAR 0 83,500 156,000 182,300 178,850 199,010
TOTAL SAVINGS FROM PREVIOUS YEARS’
INITIATIVES AT CURRENT THROUGHPUT
0 0 95,000 167,300 171,350 196,110
ABSOLUTE WATER USE TARGETS (m3/annum) 660,009 621,609 589,609 564,109 527,635 557,499
WATER INTENSITY TARGET (hl/hl) 3.30 3.36 2.81 2.45 2.44 2.32
In order to be able to perform the necessary calculations, it is first necessary to document the expected
savings from each initiative at the various throughput levels expected over the target-setting period. This
is illustrated in Table 9 above, again using the example of the soft drink plant from SECTION 5.4. Refer to
Table 7 for a view of these initiatives in the “constant throughput” scenario. The savings in the year of
implementation are assumed to be the same as those in the “constant throughput” scenario, with savings
expected in subsequent years corrected to reflect the expected throughput level in those years.

FUND FOR RESEARCH INTO INDUSTRIAL DEVELOPMENT GROWTH AND EQUITY
GUIDELINE: BASELINE WATER USE DETERMINATION AND TARGET SETTING IN THE MANUFACTURING SECTOR
40
Targets are then determined using the same philosophy outlined for the constant throughput scenario,
which is to incorporate savings made in previous years into any individual year’s target, but not to include
savings expected in any one year into that same year’s target. The key differences between this
approach and that used in the case of constant throughput are:
• The baseline is adjusted for expected throughput in each year;
• The water savings are adjusted for expected throughput in each year;
• It is not a case of adding expected savings from prior years, but of evaluating cumulative savings
from initiatives implemented in prior years at the throughput level of the year for which the
target is being set.
In terms of the first iteration of target-setting, the above process is adequate. However, by the end of the
first year in which conservation initiatives have been implemented, changes may be required based on
the savings that have actually been achieved. Where these savings differ from what was expected, the
actual savings realised must be built into target-setting for future years, even for the case in which
savings exceed expectations. Where savings are less than expected, it is of course necessary to
understand why this is so and attempt to correct the problem before changing expected savings for future
years.

FUND FOR RESEARCH INTO INDUSTRIAL DEVELOPMENT GROWTH AND EQUITY
GUIDELINE: BASELINE WATER USE DETERMINATION AND TARGET SETTING IN THE MANUFACTURING SECTOR
41
8 CONCLUSIONS
Water use baseline determination and target-setting in the manufacturing environment can be complex,
particularly when the impacts of changing throughput are incorporated into the process. The principles to
be employed are however basically the same, regardless of whether throughput is fixed or whether it
changes.
The potential impacts that changes in product mix can have on baseline determination and target setting
have been purposefully omitted in the interests of simplicity, but could be incorporated into future
revisions of this guideline.
This guideline represents a point of departure for baseline determination and water use target-setting in
the manufacturing sector. Over time, it is expected that this guideline be improved, possibly incorporating
details on specific sub-sectors within the manufacturing sector. In its current format, it can however be
applied to any sub-sector within the manufacturing sector, provided that the principles illustrated here are
adapted to account for any unique sub-sector characteristics.
As a final point, this guideline is for the benefit of users, and its ongoing improvement and development is
welcome. Comments and suggestions for improvement of this guideline should be communicated to your
sector representative.

FUND FOR RESEARCH INTO INDUSTRIAL DEVELOPMENT GROWTH AND EQUITY
GUIDELINE: BASELINE WATER USE DETERMINATION AND TARGET SETTING IN THE MANUFACTURING SECTOR
42
9 REFERENCES
1 International Iron and Steel Institute (2002), Industry as a Partner for Sustainable Development,
IISI and UNEP.
2 United Nations Environment Programme (UNEP) (2008), Sustainable Water Utilisation in
African Breweries: Current Practices and Prospects, African Brewery Sector Water Saving
Initiative.
3 Envirowise (2007), Benchmarking Water Use in Dairies, Harwell Science and Innovation
Campus.
4 Dziegielewski, B, et al (2006), Water Use Benchmarks for Thermoelectric Power Generation in
the United States, Research Report of the Department of Geography and Environmental
Resources, Southern Illinois University.