
DOCUMENT EESUME ED 211 427 Procedural Handbook: 1978-79 ... · The seven chapters cover objectives...
86
ED 211 427 TITLE INSTITUTION SPANS AGENCY REPORT NO PUB DATE GRANT NOTE AVAILABLE FROM DOCUMENT EESUME SO 013 E06 Procedural Handbook: 1978-79 Art Assessment. Education Commission of the States, rsnver, Colo. National Assessment of Educational Progress, National Inst. of EduCation (ED)., Washington, D.C. ISBN--0-89398-014-5; NAEP-10-A-40 81 NIE-G-80-0003 86p-; For a related document, see Er 186 331.. National Assessment of Educational Progreea, 1860 Lincoln St., Suite 700, Denver, CO 8029! ($E.60). EDES PRICE ME01/PC04 Plus Postage, DESCRIPTORS *Administration; Art Appreciation; Art Education; ATt History; Cognitive Ability; Uata:Analysis; Data Collection; *Educational Assessmeg; Educational Objectives; Elementary Secondary Toducatiol; *Evaluation Methods; Multiple Choice tests; Sampling; Scoring; Student Attitudes IDENTIFIERS *National Assessment 'of Educational Progress: Second Art Assessment (1979) ABSTRACT, This handbook describes the procedures used to deVelop, administer; and analyze the results of the 197E-79 art assessment of 9-year-olds, and 17-year-olds.bycthe National Assessment of Educational Progress (NAEP).. The primary purpose,of the handbook is to provide detailed prozedural information for people interested in replicating the assessment or in need of more , information than is provided in the reports containing assessment data. The seven chapters cover objectives rech,velopment, exercise creation, preparation of assessment booklets, sampling data collection, scoring, alid data anallsis. Each chapter explains the basic procedures used for the 1978-79 art assessment and cortrazts 'the procedures `to those used in earlier years (if there were changes). Appendices include definitions of reporting groups used by ,NAEP, forms used to gather background information about students and schools, response rates, computation of achievement measures, and procedures for smoothing respondent weights. A glossary of National Assessment terms is provided at the end of the book. Primary type of information provided by report: Procedures (Overview). (Author/RM) AA 4*** ****************************************************************** Reproductions supplied by EDRS are the best that can be made from the original document. ****************************************************1****************** tt-
Transcript of DOCUMENT EESUME ED 211 427 Procedural Handbook: 1978-79 ... · The seven chapters cover objectives...

ED 211 427
TITLEINSTITUTION
SPANS AGENCYREPORT NOPUB DATEGRANTNOTEAVAILABLE FROM
DOCUMENT EESUME
SO 013 E06
Procedural Handbook: 1978-79 Art Assessment.Education Commission of the States, rsnver, Colo.National Assessment of Educational Progress,National Inst. of EduCation (ED)., Washington, D.C.ISBN--0-89398-014-5; NAEP-10-A-4081
NIE-G-80-000386p-; For a related document, see Er 186 331..National Assessment of Educational Progreea, 1860Lincoln St., Suite 700, Denver, CO 8029! ($E.60).
EDES PRICE ME01/PC04 Plus Postage,DESCRIPTORS *Administration; Art Appreciation; Art Education;
ATt History; Cognitive Ability; Uata:Analysis; DataCollection; *Educational Assessmeg; EducationalObjectives; Elementary Secondary Toducatiol;*Evaluation Methods; Multiple Choice tests; Sampling;Scoring; Student Attitudes
IDENTIFIERS *National Assessment 'of Educational Progress: SecondArt Assessment (1979)
ABSTRACT,This handbook describes the procedures used to
deVelop, administer; and analyze the results of the 197E-79 artassessment of 9-year-olds, and 17-year-olds.bycthe NationalAssessment of Educational Progress (NAEP).. The primary purpose,of the
handbook is to provide detailed prozedural information for peopleinterested in replicating the assessment or in need of more
, information than is provided in the reports containing assessmentdata. The seven chapters cover objectives rech,velopment, exercisecreation, preparation of assessment booklets, sampling datacollection, scoring, alid data anallsis. Each chapter explains thebasic procedures used for the 1978-79 art assessment and cortrazts
'the procedures `to those used in earlier years (if there werechanges). Appendices include definitions of reporting groups used by,NAEP, forms used to gather background information about students andschools, response rates, computation of achievement measures, andprocedures for smoothing respondent weights. A glossary of NationalAssessment terms is provided at the end of the book. Primary type of
information provided by report: Procedures (Overview). (Author/RM)
AA
4*** ******************************************************************Reproductions supplied by EDRS are the best that can be made
from the original document.****************************************************1******************
tt-

4
U.S. DEPARTMENT OF EDUCATIONNATIONAL INSTITUTE OF EDUCATION
EDUCAT.ONAL RESOURCES INFORMATIONCENTER (ERIC!
This document has been reproduced asreceived from the person or organization
.,doriginating
Minor changes have been made to improvereproduction quality
Points of view oropinions stated in this data.
ment do not necessarilyrepresent official ME
Position or policy
PROCEDURAL HANDBOOK:
1978-79 ART ASSESSMENT
Report No. 10-A-40
by theNational Assessment of Educational Progress
Education Commission of the StatesSuite 700, 1860 Lincoln Street
Denver, Colorado 80295
__________Dememboe 1981
The National Assessment of Educational
Progress is funded by the National Insti-
.tute of Education Under a grant to the
Education Commission of the States. It is
the policy of the Education Commission of
the States to take affirmative action to
p.event drscrimination in, its policies,piogranis and employment practices.
Library of CongressCatalog Card Number: 72-183665
Although a few early National Assessmentreports have individual catalog card num-
bers, all recent reports have been as-signed the above series number.
ISBN 0-89398-014-5
The National Assessment of Educational Progress is an education-
research project mandated by Congress to collect anu.report data,
over time, on the performance of young Americans in various learn-
ing areas. National Assessment makes available information on as-
sessment procedures and materials to state and local education
agencies and others.
The work upon which this publication is based was performed pursu-.
ant to Contract No. OEC-0.-14-0506 of the-National Center for Edu-
cation Statistics and the National Institute of Education; also,
Grant-No -.411-E,G-__taGma03 of the National Institute of Education. It
does not, however, necessarily reflect the -views -of those__agen-
cies.

TABLE OF CONTENTS
LIST OF TABLES
FOREWORD vii
ACKNOWLEDGMENTS ik
INTRODUCTION * xi
CHAPTER 1 Objectives Redevelopment 1
Outline of Art Objectives 3
CHAPTER 2 Development of Exercises 5
Exercise Development 5
Field ""Tryout Procedures 6
CHAPTER 3 Preparation of Assessment Materials 7
Preparation of Booklets and Audio Tapes 7
Wfferences in Item Booklets in the 1974-75 and :1978-79 Assessments 8
CHAPTER 4 Sampling 11
Overview of the National Assessment Sample Design 12
Survey Weights 12
CHAPTER 5 Data Collection 15
CHAPTER 6 Scoring 19
CHAPTER 7 Data Analysis 23
Measures of Achievement 23
Est4mating Variability in Achievement Measures 25
Controlling Nonrandom Errors 26
APPENDIX A Definitions of National AssessmentReporting Groups 27
Group Definitions 27
APPENDIX B Forms Uded to"Obtain Background Information 31
55APPENDIX C Response Rates for AssesSment Samples
-APPENDIX D Computation of Measures of Achievement._Changes-in_Ach4evement_and Standard Errors 59
Measures of Achievelielit _ _- f. -41 OOOOOOOOOOOOOOOOOOOOO 59
Computation of Standard Er6rs 61
APPENDIX E Adjustment of Respondent Weights by Smoothingto Reduce Random Variability of Estimated PopulationProportions 65
Background ' 65Smoothing Procedures Used by National Assessment 66
The Current Smoothing Procedure 67Adjustment of Weights by Users 68
Changes in Smoothed Proportions as New AssessmentsAre Completed 70
GLOSSARY OF NATIONAL ASSESSMENT TERMS 71
BIBLIOGRAPHY 77
4

LIST OF TABLES
TABLE 1% Desired Percent of Assessment Exercise Timeby Objective and Subobjectve, for Ages 9, 13 and 17,1978-79 Assessment 2
TABLE 2. Desired Percent of Assessment Exercisa Timeby Age and Major Objective, 1974-75 Assessment 2
TABLE 3. Number of PSUs and Schools Within PSUsSelected in 1974-75 and 1978-79 13
TABLE '4.' School Cooperation Rates, 1978-79 Assessment 15 ,
TABLE 5. Number of Students Responding to Each ItemBooklet in 1978-79 ASsessment, by Age 16
TABLE 6. Between-Score Quality-Control Summariesfor Art Open-Ended Scoring Summarized AcrossSeven Weeks 21
TABLE 7. Within-Scorer Quality-Control Summaries forArt Open-Ended Scoring 4 4 21
TABLE-C-1:- Number of Students Assessed and Percent ofSample Covered, by Age and Assessmpnt Year 55
TABLE D-1. Average Number of Respondents in RaportingGroups Taking an Item Booklet, by Age andAssessment Year 63
TABLE D-2. Estimated Current Population Proportions ofNational Assessment Reporting Groups for In-SchoolStudents 64
TABLE E-1. Smoothing Cells Used for the 1978-79Smoothing Procedure 67
TABLE E-2. Smoothed Frequencies From 10-Year Smooth bySmoothing Cell and Year for 9-Year-Olds 68
-TABLE E-3. Smoothed Frequencies From 10-Year Smooth bySmoothing Cell and Year for 13-Year-Olds 69
TABLE E-4. Smoothed Frequencies From 10-Yeai Smooth bySmoothing Cell and Year for In-School 17-Year-Olds 69
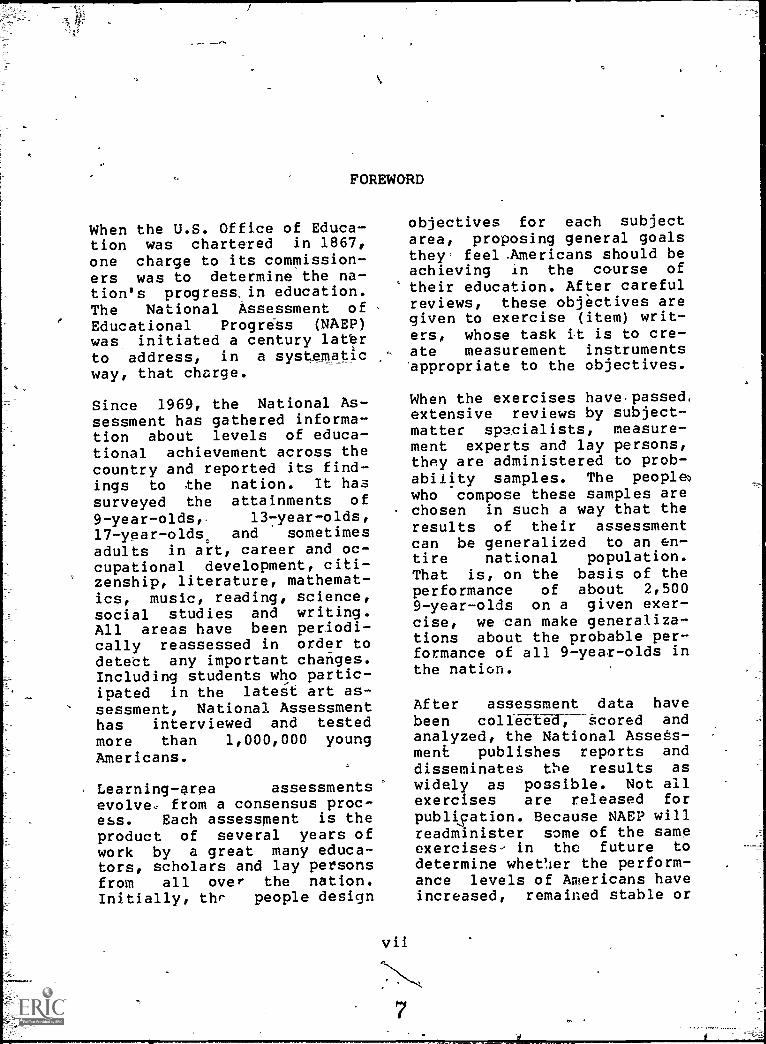
FOREWORD
When the U.S. Office of Educa-tion was chartered in 1867,one charge to its commission-ers was to determine the na-tion's progress in education.The National Assessment ofEducational Progress (NAEP)was initiated a century laterto address, in a systematicway, that charge.
Since 1969, the National As-sessment has gathered informa-tion about levels of educa-tional achievement across thecountry and reported its find-ings to the nation. It hassurveyed the attainments of
9- year - olds,. 13-year-olds,17-year-olds,, and sometimesadults in art, career and oc-cupational development, citi-zenship, literature, mathemat-ics, music, reading, science,social studies and writing.All areas have been periodi-cally reassessed in order todetect any important changes.Including students who partic-ipated in the latest art as-
, sessment, National Assessmenthas interviewed and testedmore than 1,000,000 youngAmericans.
Learning-area assessmentsevolve from a consensus proc-ess. Each assessment is theproduct of several years ofwork by a great many educa-tors, scholars and lay personsfrom all over the nation.Initially, thr people design
vii
7
objectives for each subjectarea, proposing general goalsthey feel.Americans should beachieving in the course oftheir education. After carefulreviews, these objectives aregiven to exercise (item) writ-ers, whose task it is to cre-ate measurement instruments'appropriate to the objectives.
When the exercises have passed,extensive reviews by subject-matter spacialists, measure-ment experts and lay persons,they are administered to prob-ability samples. The people)who compose these samples arechosen in such a way that theresults of their assessmentcan be generalized to an en-tire national population.That is, on the basis of theperformance of about 2,5009-year-olds on a given exer-cise, we can make generaliza-tions about the probable per-formance of all 9-year-olds inthe nation.
After assessment data havebeen coll-d-EEIT,--Scored andanalyzed, the National Assets-ment publishes reports anddisseminates the results aswidely as possible. Not allexercises are released forpublication. Because NAEP willreadminister some of the sameexercises- in the future todetermine whet!ler the perform-ance levels of Americans haveincreased, remained stable or
n
decreased, it is essential - order to preserve the- integ-
that they not be released in rity of the study. ..
1
viii
8
V
-..
6
ACKNOWLEDGMENTS
Many organizations and indi-viduals have made substantialcontributions to the art as-sessments. Not the least ofthose to be gratefully ac-knowledged are the administra-tors, teachers and stude,hts
who' cooperated so generouslyeuring the collection of thedata.
Special acknowledgment must goto the many art educators andspecialists who provided theirexpertise in the development,review and selection of theassessment objectives and ex-ercises. Development of theart assessment was coordinatedby Sarah Knight.
Administration of the art as-sessment was conducted by theResearch Triangle, Institute,Raleigh, North Carolina. Scor-ing and processing were car-
ix
ried out by the MeasurementResearch Center (now Westing-house DataScore Systems), IowaCity, Iowa, and by the Na-tional Assessment staff.
The actual preparation of thisreport was a collaborativeeffort of the National Assess-ment staff. Special thanksmust go to Donald T. Searlsfor information on samplingand data analysis and to MarciReser and Deborah Houy forproduction; Scoring and sta-tistical analyses for the artassessment were supervised EbySarah Knight and Donald Phil-lips.
Roy H. Forbes,Director
INTRODUCTION
The National Assessmgnt ofEducational 'Progress (NAEP)
has completed two assessments .
of art, the first conducted in1974-75 and the second in
1978-79. Each assessment sur-:veyed the achievement and at-titudes of American 9-, 13-and' 17- year - olds, using a
deeply stratified, multistage 4/probability sample design.This report documents proce-dures used-in the 1978-79 artassessment and also describeschanges in procedures betweenthe assessments:,
To measure changes in perform-ance between 1974-75 and1978-79, approxima;ely half ofthe exercises assessed in,thefirst assessment were reas-sessed in the second under,almost identical 'administra-tive conditions. To measurethe status of art. achievement
,_in 1978-79, National Assess-ment consultants reviewed theobjectives used in the firstassessment and developed addi-tional exercises to providewider coverage of those objec-tives.
1Although National Assessment'traditionally, revises Objec-tives prior,to an assessment,a shortage of funds and timeprohibited complete redevelop-ment of the art objectives.Previous art objectives were
Approximately 7,500 9-year-Olds, 11,000 13-year-olds and13,500 17-yer-olds 'partici-pated in the 1978-79 art as-sessment. Because' there waremore art exercises for 13-year -olds than available as-;sessment space, six exerciseswere iheld and administered inthe next year's assessment(1979-80). During the 1979-80assessment, 2,749 13-year-oldsresponded to these six artexercises.
Since National Assessment re-ports results for groups ofstudents, not individuals, itis not necessary for each stu-dent to re§pond to every item(exercise). 4 Each respondentcompleted only one item book:let,of about 45 minutes inlefigth. Between 2,400 and2,800 students 'responded to
each booklet. In 1978-79,three exercise booklets for9-year-olds, four booklets for'13-year-olds and five booklets
reviewed by consultants andfound "to be usable with someshifts ins emphasis..
National Assessment uses theterm "exercise/1r' to mean anassessment item. The terms"exercise" and "item" are usedinterchangeably in this re-,
port.
2
xi
10

for 17-year-olds contained artexercises., In the 1979-80 as-sessment, only one item book-let for 13-year-olds includedart items.
In both the 1974-75 and the1978-79 assessments, 13-year-olds were assessed in Octoberthrough December, 9-year-oldsin January r,nd February and17-year-olds in March andApril. Thus, the amount ofschool experience for each agegroup was approximately thesame in each assessment.
The exercises for each'assess-ment were administered by aprofessional data collectionstaff to minimize the burdenon participating schools andto maximize the uniformity ofassessment, conditions. In-structions and items were re-
. corded on a paced audio tapeand played back to students toreduce the potential effect ofreading difficulties and toensure .that all students movedthrough the packages at thesame speed.
The majority of the a4 itemswere multiple- choice; .a fewexercises from the first as-sessment that were reassessedin 1978-79 were open-ended.Many items included more thanone part.
Multiple-choice items werescored by an optical scanningmachine; open-ended items werehand-scoted by trained scorersusing scoring guides developedto define categories ofacceptable and unacce?tableresponses.
National Assessment reports
estimated percentages of,cor-rect responses for singleitems. When a report indicatesthat "85% of the 13 -year -oldsgave a correct response," itmeans that an estimated £5% ofthe 13-year-olds would- nyegiven a correct response ifall the 13-year-olds inschools across the country hadbeen assessed. National As-sessment also aggregates per-centages of success on varioussets of items to provide dataon changes in performance be-tween assessments and on thedifferential performance ofpopulation subgroups. In addi-tion to reporting nationalresults, National Assessmentprovides data on the perform-ance of various populationsubgroups within the nationalpopulation, defined by sex,race/ethnicity, region of thecountry, size and type of com-munity lived in and level ofparental educatiOn. In addi-tivn, for the art assessments,some data are available on theextent of art training and/orexperience with art -- eitherformal or informal -- that 9-,13- and 17-year-olds have had.
This handbook describes theprocedures used to develop,administer and analyze theresults of the 1978-79 artassessment. The primary pur-pose of this handbook is toprovide detailed proceduralinformation for peopleinterested in replicating theassessment or in need of moreinformation than is providedin the reports containing as-sessment data. The seven chap-ters cover:objectives redevel-opment, exercise creation,
xii
1.

preparation of assessmentbooklets, sampling, data col-lection, scoring and dataanalysis. Each chapter ex-plains the basic proceduresused for the 1978-7'3 art as-sessment and contrasts theprocedures , to those used inearlier years (if ,there werechanges).
Appendixes include definitionsof reporting groups used byNational Assessment, formsused to gather background in-formation about students andschools. response rates, com-putation of achievement meas-ures and procedures forsmoothing respondent weights.A glossary of National Assess-ment terms is provided. at theerid of the bdok.
The objectives for the artassessments, Art Objectives(1971) and a one page objec-
tives supplement and releasedexercises, Second Assess-ment of Art, 1978-79: ReleasedExercise ,Set (1980)/':.arp.available from NAEP.
5
A supplement to the releasedexercise set that will includereleased open-ended exercises,their scoring guides and someselected data is planned forpublicatio- in late 1981. Bythe end of 1981, National As-eessment also will completereports on the results of the1978-79 art assessment and thechanges in art performancebetween the 1974-75 and 1978-79 assessments. For the exacttitles of these publicationsand 'information about' theiravailability, more completedata or other assistance con-cerning the art assessments,please contact National As-sessment.
of

CHAPTER 1
OBJECTIVES REDEVELOPMENT
The primary goals of the Na-tional Assessment of Educa-tional Progress (NAEP) are toreport on the current educa-tion status c'E yoging Americansand to monitor any changes inachievement over time. Foreach learning, area to be as-sessed, NAEP asks consultantsto develop objectives thatdefine the subject area. Sincethe objectives provide gdide-lines for exercise developers,consultants are aP'-ed to in-clude examples of the knowl-edge, skills and attitudes tobe assessed at each age level.
Education in America is a col-laborative enterprise involv-ing a great many people withwidelYdiffering philosophies.Providing information abouteducation nationwide would beconsiderably easier if therewere a consensus about theMeans and ends of Americaneduca',Aon, but the fact is
that Americans-have conflict-ing and sometimes contradic-tory- values regarding thegoals of education and-, themeans for achieving_ them. Todevelop an assessment that -istruly national in scope and
. _takes into account the diver-sity of curricula, values andgoals across the country, Na-tional Assessment employs_ aconsensus process for develop-ing objectives, with represen-
tation of many differentgroups of people.
Several types of consultantshelped develop the 'bjectivesfor the first ass sment ofart. College and universityspedialists in art, classroomteachers, curriculum supervi-sors and persons involved inteacher education made-'6ift-e-that the objectives includedimportant concepts, skills andattitudes that the, schoolscurrently were teaching aLdthat they should be teaching.Concerned citizens, parentsand other interested lay per-sons also hid to agree thatthe objectives were importantfor young people Ito achieve,were free of education jargonand were,nOt biased against oroffensive to any groups. Con-sultants were selected to rep-resent different regions ofthe country and minoritygroups. They also represented-a range. of experience wwithstudents of different ages, andCommunity types.
1.3
In preparation for the 1978-79art assessment, the 1974-75art objectives were reviewed'by art educators. A shortageof funds and a very tightschedule for completing the
assessment made a completeredevelopMent of the objec-tives impractical. To reflect
shifts of emphasis in art edu-cation, the objectives werereviewed and the amount- ofassessment time to be devotedto each objective was modifiedas necessary. Suggestions fomore extensive revisions wereprovided to National Assess-ment for future implements=tion.
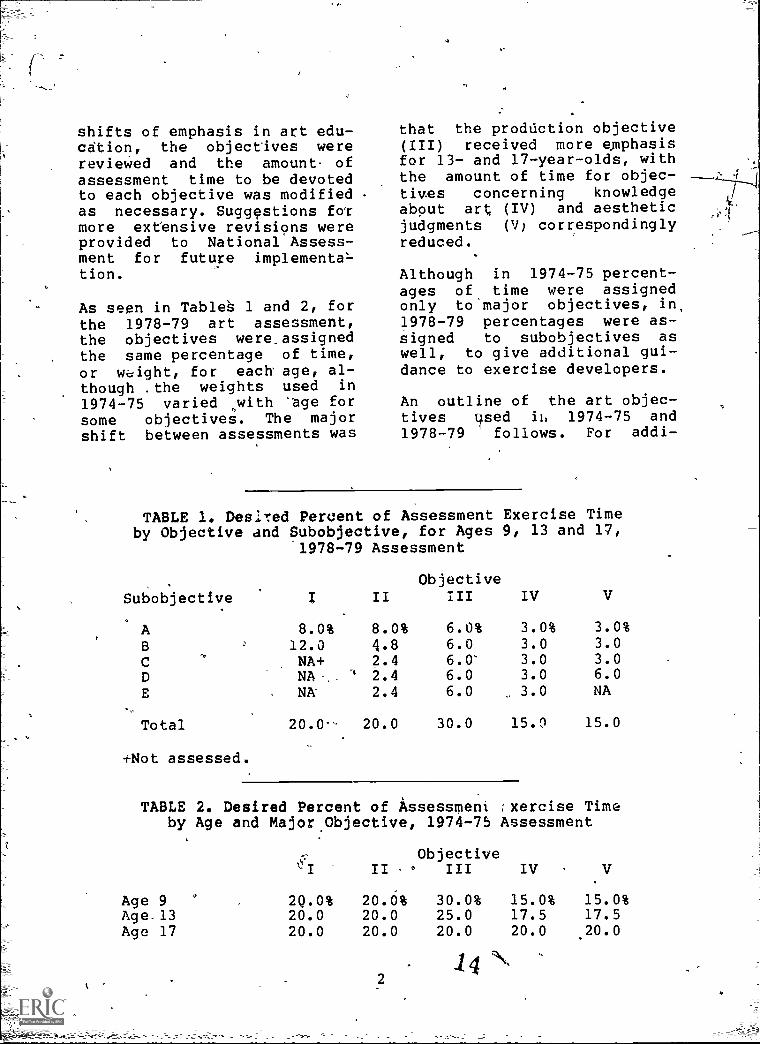
As seen in TableS 1 and 2, forthe 1978-79 art assessment,the objectives were assignedthe same percentage of time,or weight, for each' age, al-though the weights used in
1974-75 varied with 'age forsome objectives. The majorshift between assessments was
that the production objective(III) received more emphasisfor 13- and I7-year-olds, withthe amount of time for objec-tives concerning knowledgeabout art (IV) and aestheticjudgments (V) correspondinglyreduced.
Although in 1974-75 percent-ages of, time were assignedonly to major objectives, in,1978-79 percentages were as-signed to subobjectives aswell, to give additional gui-dance to exercise developers.
An outline of the art objec-tives used ih 1974-75 and1978-79 follows. For addi-
TABLE 1. Desired Percent of Assessment Exercise Timeby Objective and Subobjective, for Ages 9, 13 and 17,
1978-79 Assessment
.
Subobjective II
ObjectiveIII IV V
A 8.0% 8.0% 6.0% 3.0% 3.0%
B 12.0 4.8 6.0 3.0 3.0
C NA+ 2.4 6.0' 3.0 3.0D NA 2.4 6.0 3.0 6.0E NA 2.4 6.0 3.0 NA
Total 20.0-- 20.0 30.0 15.0 15.0
+Not assessed.
TABLE 2, Desired Percent of Assessmeni :xercise Timeby Age and Major. Objective, 1974-75 Assessment
ObjectiveII III IV . V
Age 9 (' 2Q.0% 20.0% 30.0% 15.0% 15.0%Age. 13 20.0 20.0 25.0 17.5 17.5Age 17 20.0 20.0 20.0 20.0 20.0
14

tional detail concerning artobjectives, see Art Objectives(19/1) .
t,
Outline of ArtObjectives .
I. PERCEIVE AND RESPOND TOASPECTS OF ART
Aspects of art are defined as:sensory qualities of dolor,
line, shape and texture; com-positional elements such asstructure, space, design, bal-ance, movement, placement,closure, contrast and pattern;expressive qualities 'such asmood, feeling and emotion;subject matter, including (1)objects, themes (the generalsubject of a work, i.e., land-scape or battle scene), eventsand ideas (general presymbolicmeanings) and (2) symbols andallegories; and expressivecontent, which is a uniquefusion of the foregoing as-pects
A. Recognize.,and describethe subject-matterelements of works ofart
B. Go beliond the recogni-tion of subject matterto the perception anddescript.on of formal.qualities and expres-sive content (the com-bined effect of thesubject matter and thespecific visual formthat characterizes a
particular work ofart)
ro
II. VALUE ART AS AN IMPORTANTREALM OF HUMAN EXPERIENCE
A. Be effectively ori-ented toward art
B. Participate in activi-ties related to art
C. Express -easonablysophisticated concep-tions about and posi-tive attitudes towardart and artists
D. Demonstrate an open-mindedness toward dif-ferent forms andstyles of art
E. Demonstrate an open-mindedness toward ar-tistic experimentatio
III. PRODUCE WORKS OF ART
3
15
A. Produce original andimaginative works ofart"
B. Express visual ideasfluently
C. Produce works of -art,
with a particular com-position, subject mat-ter, expressive char-acter pr expressivecontent
'D. Produce works of artthat contain variousvisual conceptions
E. Demonstrate knowledgeand application ofmedia, tools, techni-ques and forming pro-cesses°
C.

IV. KNOW ABOUT ART
A. Recognize major fig-ures, and,works in thehistory of art and
understand their sig-nificance. (Signif-icance as it is usedhere refers to suchthings as works of artthat began new styles,markedly influencedsubsequent works,changed the directionof art, contained vis-ual and technical dis-coveries, expresbedparticularly well thespirit of their ageand those consideredto be the major worksof major artists)
B. Recognize the stylesof art, understand theconcept of style andanalyze works of art
_on_the basis of style
C. Know the histdry ofart activity andunderstand the, rela-tion of one style orperiod to other stylesand periods
D. Distinguish "k between-factors of a l'work ofart tharelate prin-cipally to the per-sonal style 'of theartist and factorsthat relate to thestylistic'' period orthe entire age
E. Know and recognize therelationships that
4
existed between artand the other disci-plines of the humani-ties (literature,music and particularlythe history of ideasand philosophy) duringa given period
V. MAKE AND JUSTIFYJUDGMENTS ABOUT THE AES-THETIC MERIT AND QUALITYOF WORKS OF ART
Statements of aesthetic qual-ity are those that character-ize the various aspects of awork of art, while statementsof aesthetic merit 'are, asser-
,tions about the degree ofgoodness or badness of the
work. Justifications of aes-thetic merit are based on cri-teria such as the degree towhich the work is integratedand whether contact with thework results in a vivid andfused experience
A. Make and justify judg-ments about aestheticmerit
B. Make and justify judg-ments about aestheticquality
C. Apply specific crite-ria in judging worksof,art
D. Know and understandcriteria 'for makingaesthett6 judgMents
76
CHAPTER 2
DEVELOPMENT OF EXERCISES
Exercise Development
Exercise development, for the1978-79 art assessment beganwith a planning conferenceearly in 1977. At this con-ference, consultants evaluatedexercises developed for thefirst assessment but not as-sessed and determined whichobjectives were not adequatelymeasured by existing ateri-als. In addition, prototypeitems that could be used asmodels by exercise writers,were identified.
Contultants who are experts in. L-arx. child development and arteducation wrote new exercisesduring March 1977. The new
exercises and those chosenfrom the items developed forthe first assessment but notused were field tested inspring 1977. The exercises andthe results of the fieldtrials -were reviewed byconsultants during summer1977. This review providedguidance for further exercisedevelopment, which wasconducted in late summer andearly fall 1977. Exercisesfrom this development were
field tested during Octoberand November. F011owing ,thesefield tests,. a1,1 newlydeveloped exercises and fieldtest results were reviewed by
5
subject-matter-experts and laypersons.
Subject-matter .specialistsreviewed exercises to ensurethat they were appropriate forthe age level being assessedand that the content includedwas correct. Lay citizens,,representing a variety of oc-cupations and interests, alsoreviewed the exercises, check-ing for sex or racial/ethnicbias and considering the gen-eral importance of each exer-cise.
By the end of February 1978,exercises had been revised andedited and were in-_final formfor inclusion in the assess-
ment. Since more, items werecdeveloped than could be as-
sessed, in March the items tobe used for the first time inthe 1978-79 _assessment wereselected. Exercises to be usedwere selected at a conferenceof subject-matter experts andeducators. Items from thefirst assessment to be,used tomeasure changes in performancewere automatically included inthe second assessment. Using
the weighted objectives' as aguide to the amount of assess-ment time to be used for eachsuboblective, exercises (In-cludin,g those from the firstassessment) were selected toapproximate these amounts.
tS =7.7.
Field Tryout PiOcedures
The field trials for the1978-79 art assessment wereperformed in schools acrossthe country to discover poten-tial problems ,,with items inwording, directions or admin-istrative procedures and tocollect item statistics, tim-ing information and scoringinformation. "Tryout" schoolswere selected to representhigh- and low-income communi-ties as well as more typicalcommunities. The items beingfield tested were administeredto students in at least fourclassrooms (approximately 100
tnt
6
students) at each age forwhich an item was intended.In order to simulate actualassessment field procedures,students recorded their an-swers in the test booklets;directions and questions wereread to students from an audiotape; and National Assessmentstaff members, rather thanclassroLh' teachers, adminis-tered the test. The completed"tryout" packages were thenscored anu results were ana-lyzed. The tryout data, aswell as the administrators'reports_of"any field problems,helped both NAEP staff andconsultants to ,evaluate and
.,revise the exercises.
18

CHAPTER 3
PREPARATION OP ASSESSMENT MATERIALS
Preparation of Bookletsand Audio Tapes
National Assessment uses a
matrix sa:dpling approach, withdifferent nationally represen-tative samples of students
responding to different itembooklets (see Chapter 4 for
details). .Since the Assess-
ment's aim is to describe re-sults for groups'' of students(males, blacks, students in
the West, and.so on), not ia-dividualsrit is not necessaryfor each student to respodd to
all the items. Each studentresponded to one booklet ofitems designed to be completedin a single class period.
' The 1978-79'assessment was a
combined assessment of art,music ,and writing. Because of
the length of many of the'artand writing exercises, onlytwo subject Areas were in-
cluded in an item booklet.Booklets of exercises includedeither music and writing exer-cises, art-add writing exer-cises`, or art exercises only.
Following the selection of-artexercises, National Assessmentstaff grouped and sequenced
them into exercise booklets.Since students at differentages received somewhat differ-ent sets of exercises, book-lets were constructed sepa-
7
rately for each age level.
Thus, exercises for 9-year-olds were not sequenced /in thesame order as those for 13-year -olds, and so forth.
In 1978-79, there were threeexercise booklets that con-tained art exercises for 9-year -olds, four such bookletsfor 13- year -olds and five suchbooklets fort 17-year-olds. Onebooklet for 13-year-olds in
the 197"9-80 assessment in-
cluded art items.
The following constraints wereobserved in preparing exercisebooklets:
1. Each booklet containedexercises of varying dif-ficulty so that studentswould not become bored bymany easy exercises ordiscouraged by many diffi-cult exercises.
2. Exercises- could not cue
other exercises. *In otherwords, the answer to oneexercise could not be con-tained in another exercisein the same booklet.
3. Each booklet was timed sothat it would take no morethan '45 minutes of a stu-dent's time -- the lengthof a typical class period.Booklets contained approx-
imately 30-35 minutes ofexercise time and an addi-tional 10-15 minutes ofintroductory material,instructions and back-ground questions.
4. Booklets were designed tobe, ,insofar as possible,'parallel with respect tothe numbei of: differentobjectives measured anddifficulty levels. Itemsmeasuring a particularobjective were scatteredthroughout the booklets sothat many different stu-dents would respond toquestions related to a
particular objective.
5. At ages 13. and 17, book-lets containing reassesseditems used to measurechange between 1974-75 and1978-79 were identical in'content and_item sequencein both assessments. The
"six exercises for 13-year -olds assessed in
1979-80 (the year follow-ing the main art assess-ment) were in the samebooklet. None of theseitems was used to measurechange in achievement from1974-75.
National Assessment makesevery effort to minimize dif-ficulties connected with thetesting situation so that re-sults will be, as nearly aspassible, an accurate refllec-*Lion of what students know andcan do. For example, studentsmarked their answers directlyin the assessment booklets,not on separate answer sheets.It was felt that this proce-dure would reduce possibili-
8
ties for errors in markinganswer sheets, especially foryounger' students. To minimizeguessing, studentS were en-
couraged s.to select the "I
don't know" response' optionincluded with some multiple-choice items or to write "Idon't know",on the answer linefor open-ended questions if
they felt they did not knowthe answer to a question. Manymultiple-choice art exercisesasked for a student's opinionabout a work of art. Suchitems did not include the "Idon't know" option.
Paced audio tapes were pre-pared for each exercise book-let. Instructions, most ofthe written portions of anexercise stimulus and responseoptions were read aloud to
minimize the effect of anyreading difficulties and to
ensure that all students movedthrough the booklets at thesame 'speed. During the fieldtesting of the exercises, ad-ministrators had determinedthe time needcJ for most stu-=dents to respond to an item,and this amount of time wasallowed on the audio tape. In
addition, the use of tapeshelped to ensure uniform as-sessment conditions across thecountry.
Differences in Item Bookletsin the 1974-75 and 1978 -79
Assessments
National Assessment 'makesevery effort to make assess-,ment conditions for itemsmeasuring change identicalfrom assessment to assessmentso that any changes observed
4
20

will be attributable to
changes in achievement ratherthan a response to an alteredtesting condition.
As noted previously, bookletsof items used to measurechanges in achievement for 13-
-and 17-year-olds includedidentical itemt. in the same
sequence in both assessments.Items used for the first time
in 1978-79 were included inother booklets. Tapescriptsfor the audio tapes accompany-ing the booklets used to meas-ure change between assessmentswere also identical in each
assessment. At age 9, book-
lets including items used .to
measure- change also containednewly developed items; there-fore, booklets were not the
same for the 'two assessments.However, individual items used
to measure _change and tape--scripts for those items wereidentical in both assessments.It was felt that the differ-
ence in item context probablywould not have any appreciableeffect on results. Items for
13year-olds included in the
1979-80 assessment were newlydeveloped for the second as-
sessment and thus were not
used to measure changes in
performance.

CHAPTER 4
SAMPLING
This chapter giveq an, overviewof the-procedures used in de-signing and selecting the sam-ples for the 1974-75 and
1978-79 art assessments. Sam-ple design and selection forboth assessments were con-
ducted by the staff of theResearch Triangle Institute,Raleigh, North Carolina, andmonitored by National Assess-ment staff.
The target populations for the
1978-79 assessment consistedof 9-, 13- and 17-year-olds'enrolled in either public orprivate schools at the time of
the assessment who were not
functionally handicapped to
the extent that they could not
participate in an assessment,Other specific groups excludedwere: non-English-speakingpersons, those identified asnonreaders, persons physicallyand mentally unable to re-
spond, and persons in institu-
tions or attending schools
1Definitions of 1978-79 as-
sessment age groups are: 9-
year-olds -- born during the
calendar year 1969; 13-year-olds -- born during the calen-
dar year 1965; and 17-year-
olds -- born October 1,-1961,through September 30, 1962.
1
established for the physically,or mentally handicapped.
National Assessment did notfollow up specific individualsfrom one assessment to thenext: In other words, the stu-
dents who participated in the1974-75 assessment were notthe same ones who participatedin 1978-79. However, in each
assessment year, participants
were carefully selected to
.represent each age level. For --
example, although differentsets of probability samples of
9-year-olds were used for thetwo assessments, each set con-tained nationally representa-tive samples.of students who
were 9 years old during thatassessment year. Thus, if we
say that 9-year-olds' achieve-ment declined between 1975 and..
1979, we mean that students
who were 9 years old in 1975correctly answered the same
questions more often thanthose - who were 9 v_ ears old in
1979.
The definitions of the in-
school target populations wereidentical in each assessment.The National Assessment saM--
ples were designed to provideapproximately 2,500 respon-dents per exercise. These num-bers allow reporting of datafor the nation and for the

subgroups defined in Appendix
There were minor differencesin the sample designs for the1974-75 and 1978-79 art as-sessments. A major differencein the samples obtained wasthat 17-year-olds who weredropouts or early graduateswere assessed in 1974-75 butnot in 1978-79, because, ofbudget limitations. To ensure
'comparability, all comparisonsof 17-year-olds'. 1974-75 and1978-79 results were madeusing data only for studentsattending school. All otherdifferences are technical im-provements or changes thatincreased sampling efficiencyand lowered administratiVecosts, but did not affect com-parability ofthe samples.
Overview of the NationalAssessment Sample Design
For all of its assessments,National Assessment uses a
deeply stratified, three-stagenational probability sampledesign with oversampling oflow-income and rural areas. Inthe- first stage, the UnitedStates 'is divided 'into geo-graphical units of counties orgroups of contiguous countiesmeeting a minimum populationsize requirement. Theseunits, called primary samplingunits (PSUs), are stratifiedby region ana size of commu-nity. From the list of PSUs, asample of PSUs is drawn With-out replacement with probabil-ity proportional to populationsize measures, representingall' regions and sizes-of com-munities. Oversampling of
low-income and extreme-ruralareas is first performed atthis stage by adjusting the.estimated population sSzemeasures of those areas to,increase sampling rates.'Within PSUs, Census EmploymentSurvey Data are used to delin-eate and oversample low-incomeareas. Counties with high pro-portions of rural families arealso oversampled.
In the second stage, all pub-lic and private schools withineach PSU selected in the firststage are listed. SchoolSwithin each PSU are selectedwithout replacement with prob-abilities proportional to thenumber of age-eligibles in theschool.
The third stage of samplingoccurs during the data collec-tion period. A list of allage-eligible students withineach selected school. is made.A simple random selection ofeligible students without re-placement is 'obtained, anditem booklets are administeredto the selected students. Spe-cially trained personnel se-lect the sample and administerthe booklets.
Survey ,Weights
-The number of PSUs, schoolswithin PSUs and studentswithin schools is determinedby optimum samplingprinciples. That is, a sampledesign is utilized thatattempts to .achieve themaximum precision for a givenlevel of resources. Table 3
displays the number of PSUsused and the number of schools
12'
23'

Age 9Age 13Age 17
TABLE 3. Number of PSUs and Schools Within PSUs
Selected in 1974-75 and 1978-79
1974-75Assessment
No. of No. ofPSUs Schools
115115115
1,103972830
1978-79Assessment
No. of No. ofPSUs Schdols
757575
in which assessment sessionswere conducted, by age, for
the 1974-75 and 1978 -79assessments. Appendix C givesinformation about the numberof students assessed.
Each respondent in the sample
did not have the same proba-
bility of selection because
some subpopulations were over-
sampled and because adjust-
ments were made to compensate
13
648650534
for some schools' refusals toparticipate and for student
nonresponse. The selection
.probability for each individu-al was computed, an0 its re-
ciprocal was used to weighteach response in any statisti-cal calculation to compensatefor unequal rates of samplingand to ensure proper represen-tation in the population'structure. Procedures used toassign weights are discussedin Chapter 7 and Appendix E.
24

CHAPTER'5
DATA 0412-EtTION
National Assessment subcon-tracted data collection to the-Research Triangle Institute,Raleigh, North Carolina. A
professional data collectionstaff was used rather than
school personnel to minimizethe .burden on participatingschools and to ensure, insofaras possible, uniform adminis-trative conditions across thecountry (Final Report...In-School Field Operations...,1979).
Participation- in the NationalAssessment is voluntary. NAEPmakes every effort to encour-age the schools selected inthe sample to participate inthe assessment, and NationalAssessment and Research Trian-gle Institute staffs have ob-tained high rates of schoolcooperation, as shown in Table4 (Final Report Field Opera-
TABLE 4. School CooperationRates, 1978-79 Assessment
Percent of EligibleSchbols Participating
Age in,1978-79 Assessment
9 90.413 90.9
17 92.9Overall 91.3
tions..., 1'979, p. 39, Table
27). Student cooperationrates were also high. The ef-fect of student nonresponse is
discussed in Appendix C. Table5 shows the actual number ofstudents that responded to aparticular exercise booklet ateach age level in the 1978-79assessment.
Each age group was assessed atapproximately the same time ofthe school year in each as-sessment. As noted previously,I3-year-olds were assessed inOctober-December, 9-year-oldsin January-February and 17-year -olds in March-May.
In 1978-79, booklets were ad-ministered to groups of 10-25students, with each group re-sponding to only one of thebooklets for their age level.The groups varied in size de-pending on the number of eli-gible students and on an esti-mate of the rate of nonre-sponse for a particularschool. In 1974-75, the plan-ned session sizes were fixedat 12 students, with up to 4alternates used if less than12 students appeared for thesession._
In each assessment, NationalAssessment takes steps to
guarantee the anonymity of
15
25

TABLE 5. Number of Students Responding to Each .
Item Booklet in 1978-79 Assessment, by Age
Age 9Number
Booklet Responding
1+2+3+4+5+6+7+8+9
1011
Total
Age 13* Age 17Number Number
Booklet Responding Booklet Responding
2,532 1+ 2,755 1+ 2,7302,553 2+ 2,801 2,7462,475 3+ 2,775 3+ 2,7612,494 4+ 2,791 4+ 2,7722,479 5+ 2,785 5+ 2,6842,522 6+ 2,748 "- 6+ 2,7392,531 7+ 2,736 7+ 2,6422,5124 8+ 2,779 8+ 2,6562,486 9+ 2,754 9++ 2,7872,483 10 2,758 10+ 2,6972,526 11 2,751 11 2,628,
12 2,720 12 . 2,62813 2,757 13 2,698
14 2,654
27,605 35,910 37,822
*During the 1979 assessment, several age 13 art itemswere included in oklet 12, which was taken by 2,748respondents.+Thete were no art exercises- included in booklets 1 through8 at age 9, booklets 1 through 9 at agd 13 and booklets 1through 8 and'1.0 at age 17.++Only exercise 6 of booklet 9 at age 17 was an artexercise; it is a combined art/writing, exercise.
each .respondent. Students'names 'were listed with theirbooklet identificatiOn numberso that scoring and processingpersonnel could go back to theschool lists for data verifi-Cation -- for instance, onbackground information -- ifnecesSary. These lists did notleave the schools and weredestroyed six months followingthe assessment in a school.
To provide information on re-spondents( badkgrounds, school
16
officials were asked to re-spond to a "principal.'s ques-tionnaire," which includedquestions about the size andtype of community served bythe schools. In addition, in1978-79 officials in schoolswere asked to respond to a"supplementary principal'squestionnaire," which askedabout art, music andwriting/language arts programsin the school. Students alsoprovided information on theirbackgrounds through questions
included in the item booklets.Samples of forms used _to col-lect background informationfrom students and school offi-
cials in the 1978 -79 assess-ment appear in Appendix B.
The assessment administratorcod4;1 each- student's. birthdate, ,sex, trade and
racial/ethnic classificationon his or her booklet. Iden-
tification numbers were pre-
coded by machine on. the frontof each booklet. Administra-tors made a visual racial/eth-nic identification at the timeeach student turned in his orher booklet. During the 1978-79 assessmet... six differentracial classifications were
used: white, black, Spanishheritage, American Indian orAlaskan native, Pacific Is-
.lander or Asian, and unclassi-fied. If an administrator wasunsure of a student'sracial/ethnic,group, he or shereferred to the, student's nameor questioned school personnelto make the identification,In a few cases, listening tothe student's speech was an
aid. The assessment adminis-trator did not ask students to
give a racial identificationfor themselves; however, in
1978-79 17- year -old stp'antswere .askedv to provide this
.information in one of the
background questions includedin the exercisa booklet.
Sample sizes of the two clas-
sifications American Indian'or'Alaskan native, and PacificIslander or Asian, are too
small to permit reporting forthese groups. Results for thegroup classified as Spanish'heritage cannot be reportedfor separate exercises but canbe reported fo'r aggregate re-sults across a number of exer-cises.
Following data collection,assessment administrators sentcompleted booklets to thescoring contractor, Westing-house DataScore Systems, IowaCity, Iowa. Booklets werequality-checked to verify thatcorrect administrative proce-dures were followed by thefield staff. Coded identifi-cation information was alsochecked for .accuracy; incon-sistencies that could not bereconciled were sent back tothe assessment administratorto be checked against the listof student names and identifi-cation numbers retained by theschool for six months follow-ing the assessment.
In 1974-75, 17-year-olds whowere not. currently attendingschool were included in theassessment. These out-of-school 17 -year -olds could eachanswer up to four booklets ofassessment .materials; theywere paid $5.00 for each book-let they completed. Unpacedaudio tapes were used for thisTroup.
CHAPTER, 6
SCORING
Scoring and computer recordingof data were contracted to
Westinghouse DataScore Sys-
tems; Iowa City, Iowa. Whilethe majority of exercises inthe 1978-79 art assessmentwere multiple-choice, severalexercises were open-ended.Responses to.multiple-choiceexercises were read directlyfrom the booklets by opticalscanning machiges.,The scoringcontractor employed a special
staff to hand score the open-ended exercises. 'Scorers wereresponsible for categorizingresponses, using the scoringguides for open-ended exer-cises that defined categoriesof acceptable and unacceptableresponses. They then coded
this information into ovalsthat could be read by opticalscanning machines.
Because of the complexity andexpense of art scoring, thesix opeh-ended art exercisesscheduled to be scored follow-ing the second (1978-79) artassessment were .not scoreduntil fall 1980. All of theseexercises had been used in the1974-75 assessment as well asduring the 1978-79 assessment.Responses from the first as-sessment had been held un-
Scored so that responses fromboth assessments could bescored at the sam4 time,by thesame scorersi Similarly, some
19
open-ended unreleased items
from the 1978-79 assessmentremained unscored so that re-sponses can be scored withresponses from a subsequentassessment.
The art exercises were scoredusing scoring guides that hadbeen created by art consult:-ants, using as a- referencefield trial responses from thefield trials completed priorto the 1974-75 assessment.These guides were edited andrevised by National AsseSsmentstaff. Ih September 1980,staff from NAEP and Westing-house DataScore Systems workedto refine these scoring guidesthrough trial use with a sam-ple of responses to each exer-cise from the 1978-79 assess-ment. The Westinghouse staffincluded an artist retained asa consultant for this scoringproject and several experi-enced scorers. Following re-finement of the six scoringguides, this team of scorersassigned scores to a set oftraining papers. On more thanone oocasion, art consultantswho had worked with the ear-lier versions of the videswere contacted for clarifica-tion.
Of the six open-ended exer-,cises scored, two exercisesrequired short, written an-
28
swers and were administered toall three ages. Four itemsasked for production of somekind of drawing. Two of 'these"drawing" items were adminis-tered to all three ages; twowere administered only to 13-and 17-year-olds.
Items were scored by eightscorers organized into two
teams of four. In addition,the artist consultant workedwith 'both teams ,as the artauthority on scoring questionsand dtd some scoring. Each
scoring team was responsiblefor the scoring of oneshort-answer and ,two artproduction exercises. Thus,each scorer had to master onlythree scoring guides. Sincethe scoring guides varied fromabout 15 pages for theshort-answer exercises to over100 pages- for the artproduction exercises, it wasfelt that more an three,guides would be excessivelydifficult to learn.
During training of the scor-ers, conducted in October1980, scoring guides were dis-cus-ed, and scorers then beganworking with small sets of
training papers. Their scoresand''the master scores assignedduring 'scoring guide refine-ment were compared ..and dis-crepancies were discussed. Ina number of, cases, inconsis-tencies in the master scoreswere detected and corrected.These discussions led to somefurther scoring guide revi-sions and refinements.
When scorers apd trainers weresatisfied that the scoringguides could be consistently
20
applied, the ,scoring of theactual responses from the1974-75 and 1978-79 assess-ments began. To help ensurethat the guides were uniforml=y.,used -across years and acrossages, scoring of 'responsesfrom all three ages and from-both assessments proceededsimultaneously.
To be sure that the art handscoring was reliable acrossthe scoring period and acrossscorers, National .Assessmentasked Westinghouse DataScoreSystems to perform twoquality-control studies. In
one study, a sample of about3% 'of the responses to one ofthe six open-ended questionswas drawn during each week ofscoring. Each of these re-sponses was scored by twoscorers who were normally as-signed to score the item. Thetwo scorers independentlyrated- each response and theirscores were then compared. Asseen in Table 6, the Overallpairwise percentage of agree-ment was 94.6% -- Team 1 aver-aged 94.9% and Team 2 averaged94.4%.
In the second quality-controlstudy, which began near thebeginning of the scoring pe-riod, scorers scored a sampleset of responses; they thenrescored the same set of exer-cises at the conclusioh of thescoring period. ' The twoscores were compared and pair-wise percentages of agreementwere calculated, this timewithin scorer and across time.Team 1 averaged 92.5% and Team2 avrat3ed 95.2% agreement(see Table 7).
29

o
TABLE 6. Between-Scorer Quality-Control Summariesfor Art Open-Ended Scoring Summarized Across Seven Weeks
Exercise #
Team 1
# of Scores It of Agreements % of Agreement
101005 2,520 2,399 95.2
301008 3,240 3,046 94.0
303042 4, 800 4,574 95.2
Total , 10;560 10,019 94.9
Team 2302006. 14,280 13,566 9,5.0
304014 6,900 6,521 94.5
501012 1,680 1,495, R9.0
Total 22,860 21,582 94.4
Grand total 33,420 31,601 94.6
TABLE 7. .Within- ,Scorer Quality-ControlSummaries for Art Open-Ended Scoring
(Readings at Beginning and Conclusion of Scoringi
Ixereiso #
Team 1
I of Scores I of Agreements of Agreement
101005 720 654 90.8,
301008 1,080 987 91.4'
303042_ 1,680 1,577 93.9
Total 3,480 3,218 92.5
TeAm 2302006 3,060 2,939 96.0
304014 2,070 1,961 94.7
501012 360 327 90.8
Total 5,490 5,227 95.2-
Grand total 8,970 8,445 94.1
The results of the ongoingquality-control study wereclosely monitored by Westing-house. When necessary, correc-
tive actions were taken, in-.cluding retraining and somerescoring of work units al-ready completed.
21
30Vb.

.
CHAPTER 7
DATA ANALYSIS
Measures of Achievement
-The basic measure of achieve-
ment reported by National As-
sessment is the percentage of
students responding acceptably
to a given item. This. percent-
age is an estimate of the per-
centage of 9-, 13- Or 17-
ligar-olds 'who would respond
acceptably to a given item -if
every 9-, 13- or 17-year-oldin the country were, assessed.
Percentages of acceptable re-
sponses are used because each-item is designed as a separate
measure of some aspect of an
objective or subobjective. The.
-purpose of-National Assessment
is to discover if more or
fewer people are able to an-
swer these items acceptably --and thus meet the objectives
-- over time.
In addition to providing re-
sults on individual items,
National Assessment- reportsthe average performance across
groups of similar 'items, for
example, the learning area as
a whole, for particular objec-
tives or subobjectives, and so
forth. The results ,are theamean, or arithmetic average,
of the estimates.,of perform-
ance on the g oup of items,
which is cal d t ie mean,per-
23
centage acceptable.' The exer-cises included in the calcula-
tion of a mean--percentage areusually located in several
-exercise booklets, and the
same booklets are not adminis-tered to all students.
To present a general pictureof changes in achievement,
4.Twenty-two empirical distri-butions of change measures
from the 1969-70 and 1972-73science assessments were used
to' generate Monte Carlo simu-
lations of sampling distribu-tions for several measures of
central location. In additionto the mean'and median, o'ther
measures of central location
that were considered in th4
simulation studies includedthe average o2 the extremes,
two forms of biweighted-esti-mates and three forms of
weight-matching estimation
described by John W. Tukey inthe' research paper "Some Con-
siderations on Locators °Apt
for Some Sgueezed7Tail (and
'Stretched-Tail) Parents(1975). In almost every case;the sampling-_, stability of .the
mean change was as good as or'better than that of the othermeasures studied.
National Assessment describesthe gains- and losses on a
group of exercises in terms ofthe differences in the averagepercentages of acceptable re-sponses.
Unless the exercises summar-ized in the mean percentagesof acceptable responses areidentical, the means-, of oneage group should not be com-pared with the means of an-otherp since their values re-flect both the choice of exer-cises and the performance ofthe students. When only a fewexercises are summarized by a,mean, one shOuld be especiallycautious in interpreting re-
,
sults, since asmall set ofexercises might not adequatelycover the wide range of poten-tial behaviors °included undera given objective or subobjec-tive. The mean should be in-terpreted literally as thearithmetic average of the per-centage of acceptable respons-es obtained from National As-sessment samples on a specificset of exercises.
In addition to providing na-tional results, NAEP reportsthe achievement of varioussubpopulations of interest.Groups are defined by regionof the country, sex, race/eth-nicity, 'size of community,type of community, grade andlevel of parents' education.Results from some additionalvariables are also analyzed.The definitions of reportinggroups are found in AppendixA. Forms used to obtain back-ground inforffiation are pre-
, sented in Appendix B. --
1n considering National As-
24
sessment's achievement meas.%:ures, it is the differences inperformance between assess-ments-, among groups and amongages that are the most useful.By maintaining the same itemor set of items in makingthese compdrisons, we have areasonable indicator ofwhether more or fewer peopleknow or can do somethingjudged important.
Procedures for estimating per-centages of acceptable re-sponses to exercises are de-pendent on the sample design.Each response by an individualis weighted and multiplied byan adjustment factor for non -response. An estimate of thepercentage of the group thatwould have responded to anexercise acceptably if theentire age group were assessedis defined as the weightednumber of acceptable responsesdivided by the weighted numberof all the responses. A simi-lar ratio of weights is usedto estimate percentages. ofacceptable responses for re-porting groups of subpopula-tions Of interest."
2Appendix C discusses nonre-sponse in assessment samples.
ti 3A weighting-class adj.Astment-procedure was used to smoothestimated population' propor-tions across the assessmentsconducted between 1970-71 and1979-80. Appendix E discusses-this procedure.
32

Estimating Variability inAchievement Measures
National Assessment- uses a
national probability sample ateach age level to estimate theproportion of people who wouldcordplete an exercise in'a cer-tain way."The partibular sam-ple_selected is one of a largenumber of all possible samples
of the same size that couldhave been selected with thesame sample design. Since an,
achievement measurescomputedfrom each of the possible sam-ples would differ-from, onesample to another, the sten-
t..ard error of this statistic isused as a measure of the sam-
pling variability among
achievement measures from allpossible samples. -A standarderror, based on one particularsample, serves to estimatethat sampling variability.
In the interest of samplingand cost efficiencies, Na-
tional Assessment uses a com-plex, stratified, multistageprobability sample design.
Typically, complex designs donot provide for unbiased orsimple computation of sampling
errors. A reasonably good ap-proximation of standard errorestimates of acceptable re-
sponse percentages is obtained
by applying jackknife pro'cedure (Miller, 1964, pp.
1594-1705; Miller, 1968, pp.
567-582; Mosteller and Tukey,1968) to first-stage samplingunits within strata. Standard
errors for achievement meas-ures such as group differ-
ences, mean percentages or
mean group differences for aparticular assessment year areestimated directly, taking
advantage of features of the
jackknife procedures that aregeneric to all of these sta-
,tistics.4 Since samples for-differerit r assegements are in-dependent, ,the Standard errorsof the differences in achieve-
bent measures between assess-ments can-be estimated simplyby -the square root of the sumcf' squared standard errors
from each of the assessments.
The'standard error provides anestimate of sampling reliabil-
ity for the achievement meas-ures used by National Assess-ment. It is comprised of sam-pling error and othet randomerror associated with the as-sessfttent of a specific, item or
set of items. Random error
includes all possible nonsys-tematic error associated with
administering specific exer-
cises to specific students in
specific situations. For
open-ended items, random dif-ferences among scorers are
also included in the standarderrors.
25
National Assessment has ad-
hered to a standard conventionwhereby differences between
statistics are designated asStatistically significant at
the .05 level of significance.That is, differences in per-
formance between assessedyears or between a reportingcroup and the nation are high-
4See Appendix D for a moredetailed description of Na-
tional Assessmenev computa-tion of standard errors.
7 33
lighted with asterisks only ifthey are at least twice aslarge as their standard error.Differences this large wouldoccur by chance in fewer than5% of all possible replica-tions of the sampling and datacollection .procedures for anypartic4ar reporting group ornational estimates.
Controlling NonrandomErrors'
Systematic errors can beintroduced at any-stage of anassessment -- exercise devel-opment, preparation of exer-cise booklets, design or ad-ministrative procedures, fieldadministration, scoring oranalysis. These nonsampling,nonrandom errors rarely can bequantified, nor can the magni-tude of the bias they intro -educe into the ,estimates beevaluated directly.
,Systematic errors can be con-trolled in large part by em-ploying uniform administrativeand scoring procedures and byrequiring rigorous' qualitycontrol in all phases of anassessment. If the systematic
errors are the same from ageto age or group to group, thenthe difference in percentagesor mean percentages are meas-ures with reduced' bias becausesubtraction tends to cancelthe effect of the systematicerrors.
Similarly, the effect ofsystematic errors in differentassessment years can becontrolled by carefullyreplicating in the secondassessment the Procedurescarried out in the. first.Differences in achievementacross assessment years willalso be measures with reducedbias since subtraction willago in tend to cancelsys ematic errors.
Although it is not possiblefor every condition or proce-dure to remain exactly thesame between assessments'con-ducted several years apart,National Assessment makesevery effort to keep condi-tions as nearly the same aspossible. Changes in proce-dures described in this reportwere judged to have a rela-tively minor impact.
26 34
I
'APPENDIX A
DEFINITIONS OF NATIONAL ASSESSMENT REPORTING GROUPS
In addition. to reportingresults for all 9-, 13- and17-year-old' students in the
;United States, wNational
v Assessment reports results fora number of populationsubgroups. These subgroups are
defined for both the 1974-75and the 1978-79 assessments.
Group Definitions
Definitions of the subgroups.follow:
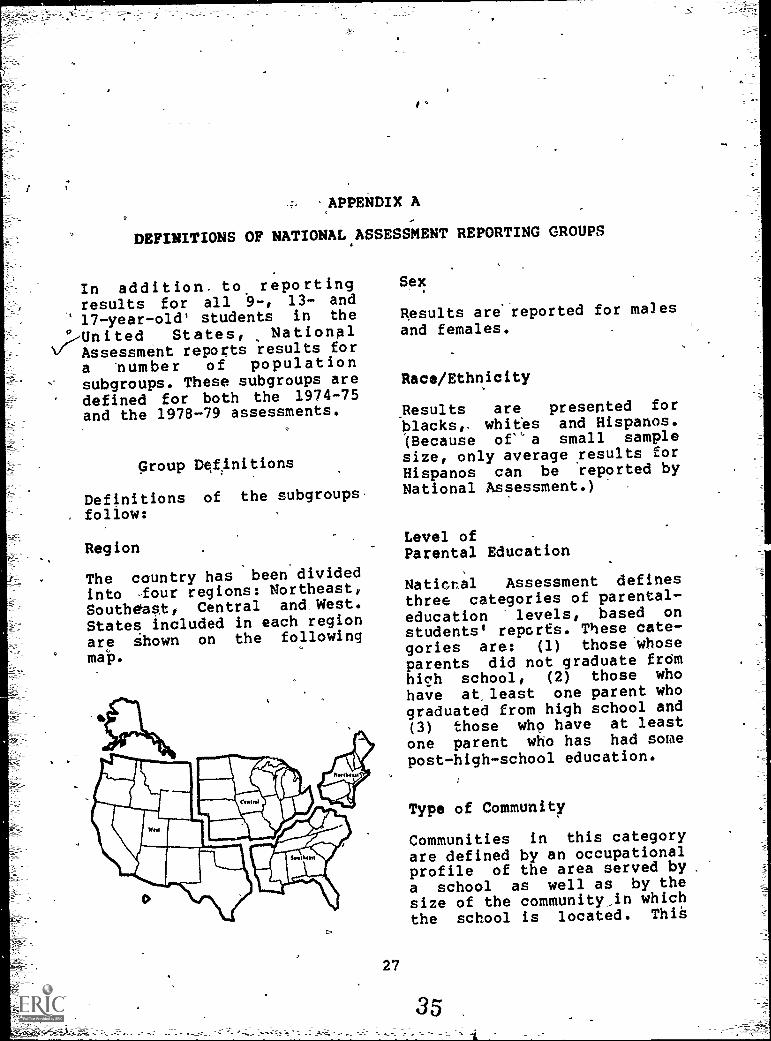
Region
The country has been dividedinto tour regions: Northeast,
Southeast, Central and West.
States included in each region
are shown on the following
map.
27
Sex
Results are reported for males
and females.
Race/Ethnicity
Results are presented for
blacks,. whites and Hispanos.(Because of"a small samplesize, only average yesults for
Hispanos can be reported byNational Assessment.)
Level ofParental Education
Naticr.al Assessment defines
three categories of parental-education levels, based onstudents' report's. These cate-
gories are: (1) those'whoseparents did not graduate fromhigh school, (2) those who
have at. least one parent whograduated from high school and
(3) those who have at least
one parent who has had some
post-high-school education.
Type of Community
Communities in this categoryare defined by an occupationalprofile of the area served by.
a school as well as by thesize of the community_in which
the school is located. Thig
35

1
is the only reporting groupthat excludes a large numberof respondents. About two-thirds do, not fall "into theclassifications listed below.Results for the remainingtwo-thirds. are not reportedsince their performance issimilar to that of the nation. -
Advantaged -urban (high-metro)communities. Students in thisgroup, attend schools in oraround cities having a popula-tion greater than 200,000where a high proportion of theresidents are in,professionalor managerial positions.
Disadvantaged-urban (low-,metro) communities. Studentsin this group attend schoolsin or around cities having apopulation greater than200,000 where a 'relativelyhigh proportion of the resi-dents are on welfare or-arenot regularly employed.
Rural communities.Students inthis group attend schools inareas with a population under10,000 where many of the resi-dents are farmers or farmworkers.
Size of Community
Big cities. Students in-thisgroup attend schools withinthe city limits of cities hair-ing a 1970 census populationover 200,000.
Fringes around big cities.Students in this group attendschools withih metropolitanareas (1970 U.S. Bureau of theCensus urbanized areas) servedby cities having a population
greater than 200,000 but out-side the city limits.
Medium cities., 'Students inthis group attend schools incities having a populationbetween 25,000 and 200,000,not clagsified in thefringes- around - big - cities cat-egory.
Small places. Students in thisgroup attend schools in commu-nities having a populationlegs than 25,000, not classi-fied irs the fringes-around-big-cities category.
Grade in School,
Results are categorized for9-year-olds in grades 3 and 4;13-year-olds in grades 7 and ----
'8; and 17- year -olds in grades10, 11 and 12.
Modal Grade by Region
Results are categorized for9-, 13- and 17-year-old re- ,
spondents in grades 4, 8 and11, respectively, who live '
the Northeastern, Southeasern, Central or Western regionof the country.
Modal Grade byCommunity Size
3
Results are categorized for9-, 13- and 17-year-old re-spondents in grades 4, 8 and11, respectively, who live inbig cities, fringes around bigcities, medium cities andsmall places.
Modal Grade by Sex
Results are categorized for9-, 13- and 17-year-old malesand females in grades 4, 8 and1.6 respectively.
Visit Art Museums
Results are categorized for
9-, :13- and 17-year-old re-spondents who rep -ted neverhaving visited an : museum,
'having visited an art museumonce and having visited an artmuseum five or more times.
Art Taught
Results are categorized for
9-, 13- and 17-year-olds whoseprincipals reported that theirschools offered at least one
art class and for those whoseprincipals reported that theirschools offered no art
classes.
Do You Collect Art
Age 13 results are categorized
by those who reported collect -cing none, one type and twbtypes of art. Age 17 resultsare categorized by thOse whopreported collecting none, onetype, two types and threetypes of art.
What Kinds of ArtworkDo You Do
Age 9 results are categorizedby those who reported doingnone, 1 or 2, and 3 or 4 typesof art outside of school. Age13 and 17 results are catego-rized by those who reporteddoing none, 1 or 2, 3 or 4',
and from 5 to 10 types of artoutside of school.
Art Classes Taken
Age 13 results are categorizedby those who reported takingnone, one or two art classes.Age 17 results are categorizesby those who reported takincnone, one, two or three, oJour to six art classes.
29
37

APPENDIX B
FORMS USED TO OBTAIN BACKGROUND INFORMATION
This appendix .contains theforms used by National Assess-ment to collect- backgroundinformation from'school offi-cials -and-respondents in .the
1978-79 attt assessment. Fol-lowing is a listing and a
brief description of the formsincluded.
p. 33. School Principal's Questionnaire -- filltd out byschool principals or other school officials forschools, at each of the age levels discussed.
p. 35 Supplementary Principal's Questionnaire (Ase
-- given ,to principals of schools in which theage 9 assessment took place. The questionnaireprovides information about the art and musicprograms of the schools.
p. 38 Supplementary Principal's Questionnaire (Age 13)1
-- given to principals of schools fn which theage-13 assessments took place. The questionnaireprovides information about the art, music andwriting or language arts programs of, the schools.
40 Supplementary Principal's Questionnaire (Age 17)-- given to principals of schools in which theage 17 assessments took place. The questionnaireprovides information about the art, music ,and-writing or language arts programs of the schools.
P
p. 42 Standard Back round Information Form for 9 -Year-Olds -- provides, information about reading mate-Far in the home and level of parents' education.
1This principal's questionnairewas not used with the age13 art, exercises given in
1979-80.
31
38
p. 43 Standard Background_Information Form for 13--
Year-Olds provides information about reac'igmaterial in the home, leVel of parents' educa'ronand plate lived in at age 9.
p. 44 Standard Background Information Form r 17-Year -Olds -- provides information on homework, TVwatching, racial identification, possessions inthe home and classroom activities, in addition toquestions also asked of 9- and 13-year-olds.
p. 47 Back round Information: Arty MuseuM or CallerVisits -= 9-, 13- and 17-Year-Olds. This exer-cise asked for responses about the number of artmuseums or galleries visited. It was included inAll 9-, 13- and 17-year-olds' art booklets givenin 1978-79 except booklet 9 at age 17.2 It wasnot included in the age 13 art materials assessedin 1979-80.
p. 48 Background Information: 'Kinds of Artwork DoneOutside of School -- 9-, 13- and 17-Year-Olds.These two excercises, one for age 9. and one forages 13 and 17, asked respondents' if they haddone, a number of different types of artwork out-'side of school. The appropriate versions appearin ,all 1978-79 and 1979-80 booklets except book-let 9 at age 17.2
p. 50 Background 'nforma'tion: Art Classes Taken - -.13-and 177Year-Olds.. These two. exercisetione foreach age, asked about art classes taken or, pres-ently enrolled in. The appropriate version wasincluded in all 1978-19 and 1979-80 booklets for13- andi17-year olds except booklet 9 at" age 17.2
p. 52 Background Information: Types of Art Collected --: 13- and 17-Year-Olds. There were two versions ofthis exercise, one 113-year-oldd and anotherfor 17-year-olds. ViVkippropriate version of theexercise appeared in,all 1978-79 art booklets' for13- and 17-year-olds except booklet 9 at age 17.2This exercise was not included with the 1979 -80,.age 13 art materials.
2Booklet 9 for 17-year-oldsincluded only one exercise inart. This item was an essayitem designed to measure bothart and writing.
3239

School Principal's Questionnaire
Primary Sampling Unit
This report n authorized by low (20 U.S.C. 1221 c11. Whileyou are not required to respond. your cooperation is neededto make the results of this how/ comprshenskrit accurate.and limey.
Name of School
Address of School..4e
School Number I I 1 -I I I 1- 1 I 1
Age Group(s) 9 13 `;'-: 17
(Street)
PLEASE(City) (State) (Zip Code)
PRINTNpme of School Principal
Name and title of person completing the form if other than school principal
Name. Title
1. What is your best estimate of the current enrollment and the average dailyattendance by grade of your school (1978-79 school year)? (Enter zeros for
grades not served by your schoOl.)
Grade
Enrollment
AverageDailyAttendance
K 1 2 3 4 5 6 8 9 10 11 12
2. Approximately what percentage of the students attending your school live in each
of the followin, areas?
% A In a rural area (less than 2,500)
% B In a town of 2,500 to 10,000.
100%
% C In a town of 10,000 or more
(Items A-C should add to 100%)
33
40
BEST COPY AVAILABLE
3. Approximately what percentage of the students attending your school are children
of
% A Profet,sipnal or managerial persOnnel
% B Sales, clerical, technical or skilled workers
C Factory or other blue collar workers
% D Farm workers
E Persons not regularly employed
F Persons on welfare
100%
(Items A-F should add to 100%)
4. Approximately what percentage of the students attending your .school are
100%
% A American Indian or ',lacked Native.
% B Asian or Pacific Islander
% C Hispanic, regardless of race (HexicantPuerto Rican, Cuban, Central
or South American or other Spanish culture or origin)
D Black and not Hispanic
% E White and not Hispanic
(Items A-E should add to 100%;
A
5. Does your school qualify for ESEA Title I assistance?
Ye - If Yes, approximately what number of students qualify for
ar.d what number of students are receiving ESEA Title I assistance?
No
Approximate number of students qualifying for ESEA
Title"I assistance
Approximate number of students geceivini ESEA Title I
assistance
THANK YOU FOR YOUR COOPERATION
34 .
r

Supplementary Principal's Questionnaire (Age 9)
Instructions: The purpose of this questionnaire is to provide additional information whichwill be used .n the analyses of NAEP data. Darken the appropriate ovalswith a soft lead pencil. If ::ou have questions about any of the for swing items,please contact the National Assessment district supervisor. Thank you foryour cooperation.
1. Is art taught in your school?
o Yes o No (Go to Question 10 on page 3)
2. Are there specified and systematically ordered objectives for art instruction in
your school?
o Yes czi No
3. Which of the following items are available as art teaching aids in your school?
A. Slides of works of art Yeso NooB. Films on art Yeso NooC. Film strip's of works of art 'z es,, o Noo
-- .-:---D. Color reproductions of works of art Yes NooE. Art books Yeso No '
c:R,
F. Original works of art Yeso No'oG. Other Yeso- Noo
4. Does your school have a special art room?
cz, Yes (=> No
35
42
rs"
5. Which of the following art equipment is found in your school?
A. Pottery kiln . Yes0 NoCD
B. Potters wheel a. YescD
No:=C. Weaving loom Yes:= No:=D. Easels Yes.
cNo:=
E. Cameras Yes:= No:=F Other Yes:= No:=
6. Do the nine-year-old students in your school receive art instruction?
:= Yes := No (Go to Question 10 on page 3)
If the nine-year-old students receive art instruction, who does the teaching?
(Mark each appropriate oval.)
A. The classroom teacher Yes:= No:=B. A member of a teaching team, having
a background in art but not certified .in art
Yes:= No:=
G. A certified art teacher Yes:= No
D. Other Yes:= No:=
8. On the average, how much time each week is given to art instruction of nine-
year-old students?
4:= Less than 30 minutes
4:= 30 to 59,Tinutes
c=) 60 to 89 minutes
c 90 to 119 minutes
:= 120 a mutes and over
36
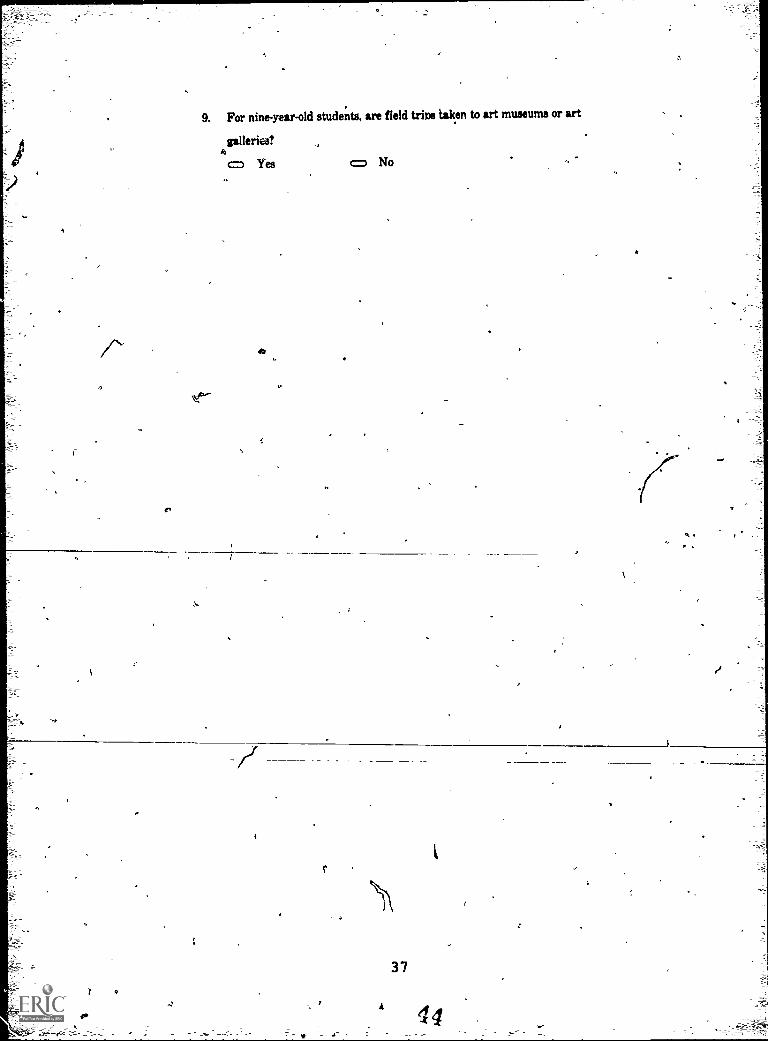
9. For nine-year-old students, are field trios taken to art museums or art
galleries?
cm Yes o No
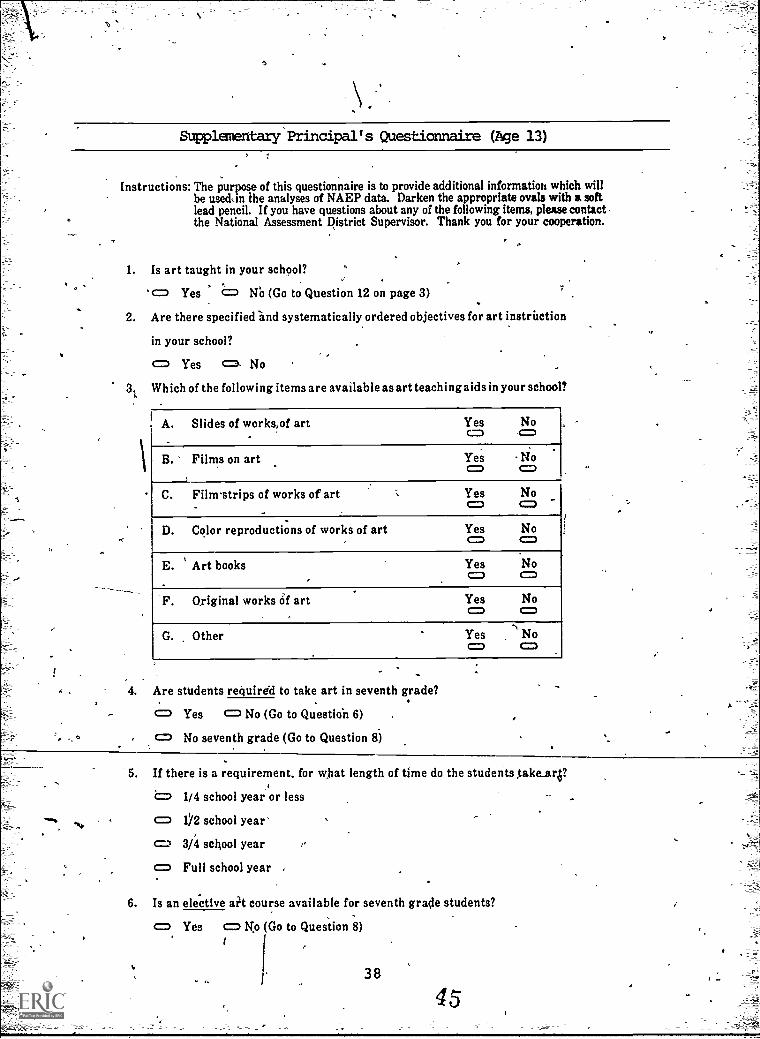
Supplementary Principal's Questionnaire (I ge 13)
Instructions: The purpose of this questionnaire is to provide additional information which willbe useckin the analyses of NAEP data. Darken the appropriate ovals with a softlead pencil. If you have questions about any of the following items, please contactthe National Assessment District Supervisor. Thank you for your cooperation.
1. Is art taught in your school?
'c= Yes,
c=1 NO (Go to Question 12 on page 3)
2. Are there specified and systematically ordered objectives for art instruction
in your school?
4:= Yes c:=). No
3., Which of the following items are available as art teaching aids in your school?
A. Slides of works,of art Yesc.=
No=1
B. Films on art Yescm
Nocm
C. Film-strips of works of art YesazNocn
D. Color reproductions of works of art Yescm
NoazE. Art books Yes
CDNoCD
F. Original works Of art Yescm
Noco
G. Other Yescm
Noaz
4. Are students required to take art in seventh grade?
4:= Yes 4:= No (Go to Question 6)
1==) No seventh grade (Go to Question 8)
3 If there is a requirement. for what length of time do the students Xake_arS?
= 1/4 school year or less
cm 1%2 school year
3/4 school year
cm Full school year
6. Is an elective art course available for seventh grade students?
CD Yes co No (Go to Question 8)
.1
38
45
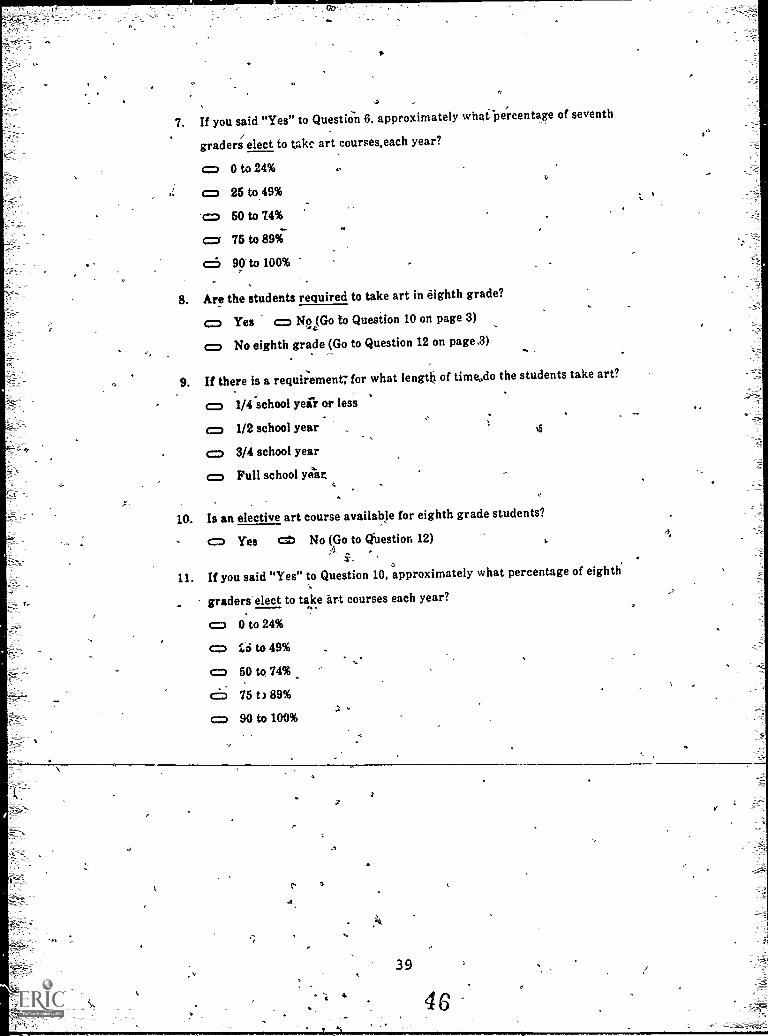
7. If you said "Yes" to QuestiOn 6. approximately whatpe'rcentage of seventh
graders elect to takt, art coursemach year?
0 0 to 24%
c:: 25 to 49%
50 to 74%
c=r 75 to 89%
c5 90 to 100%
8. Are the students required to take art in eighth grade?
CD Yes o Ns1Go to Question 10 on page 3)
cp No eighth grade (Go to Question 12 on page,3)
9. If there is a requi;ement7 for what length of timedo the students take art?
1/4 school yesir or less
cm 1/2 school year
3/4 school year
o Full school yeIt
10. Is an elective art course available for eighth grade students?
cp Yes cl) No (Go to question 12)T-
11. If you said "Yes" to Question 10, approximately what percentage of eighth
graders elect to take "art courses each year?
o 0 to 24%f4 to 49%
50 to 74%
O 75 t) 89%
c=s 90 to 100%
39
46

Supplementary Principal's Questionnaire (Pile 17)
Instructiozi: The Purpose-ct this questionnaire is to provide additional information which willbe used in the analyses of NAEP data. Darken the appropriate ovals with a softlead pencil. If you have questions about any ofthe following itmni, please contactthe National Assessment district supervisor. Thank you for your cooperation.
.7
1. Is art taught in ybur school?
c=. Yes c=> No (Go to Question 7 on page 3)
2. Are there specified and systematically ordered objectives for art instruction
in yOur school?
c= Yee c=> No,
3. Which of the following items are available as art teaching aids in your school?
A. Slides of works of art Yes:= goa:,
B. Films on art Yesc=s cnNo
C. Film strips of works of art.
Yes:= Nocm
D. Coldr reproductions of works of sit Yes:= ofE. Art books
.. .
Yes:= Noc=,
F., Original works of art Yes ,:= cnNo
G. `Other . Yes(.=)
.=, No, an
4. Is art instruction available in your school for the following grades?
No suchNoGrade Yes
A: Grade 9 Q c=:) cm
B. 'Grade 10 c..., = , c=)
C. Grade 11 c=)
D. Grade 12 , o c=:$
E. Ungraded cp c..=
40
4
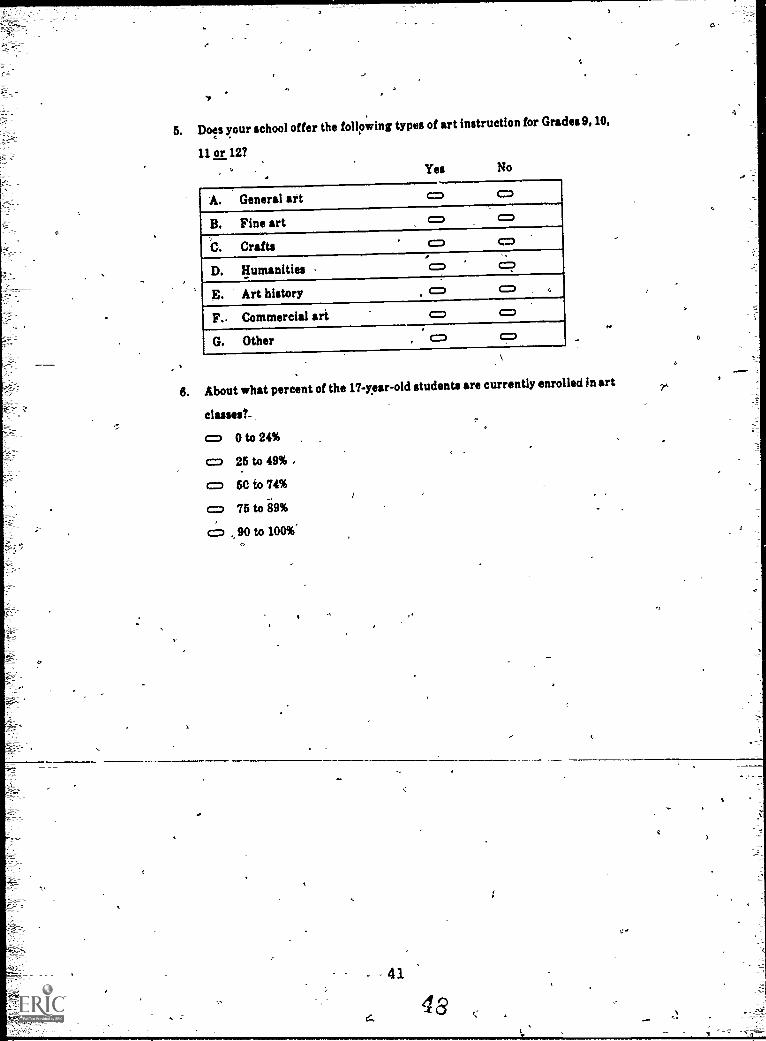
5. Does your school offer the follpWing types of art instruction for Grades 9, 10,
11 or 12?Yes No
A. General art (= ca
B. Fine art
. Crafts
D. Humanities -
E. Art history c::: oF., Commercial art oG. Other
,
6. About what percent of the 17-year-old students are currently enrolled in art
classes?.
t=1 0 to 24%
25 to 49% ,
c=) 60 to 74%
ca 76 to 69%
c=D 90 to 100%;
41
48
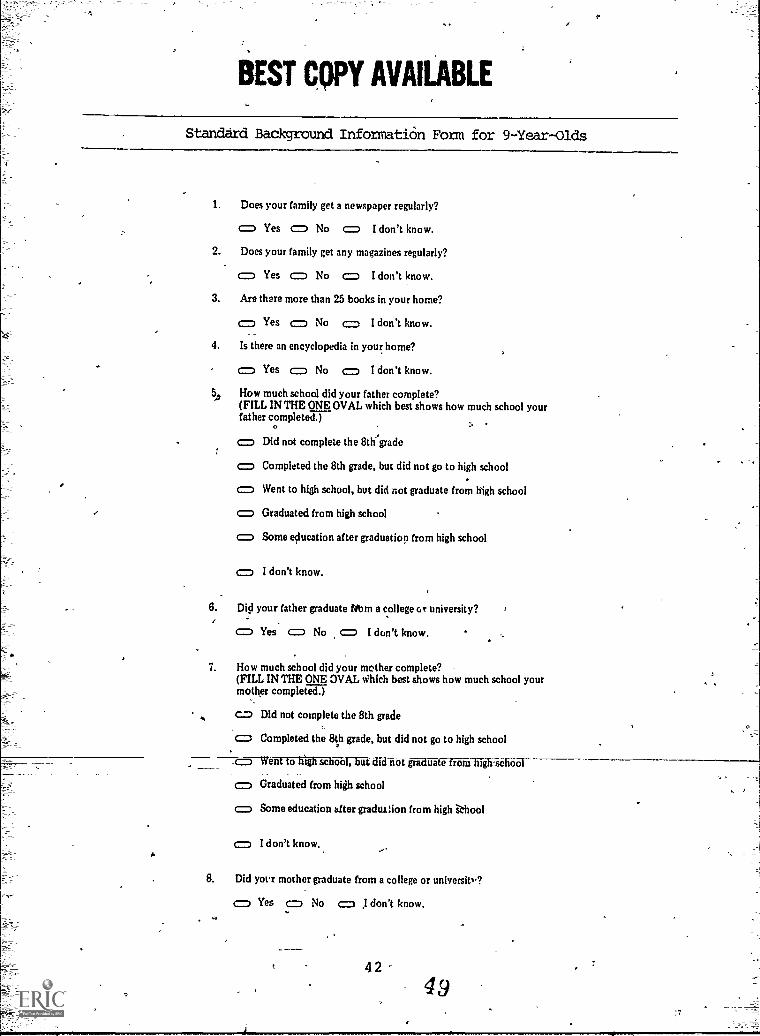
I
BEST COPY AVAILABLE
Standard Background Information Form for 9-Year-Olds
1. Does your family get a newspaper regularly?
<=) Yes <=1 No <=) I don't know.
2. Does your family get any magazines regularly?
<=1 Yes c7D No c= I don't know.
3. Are there more than 25 books in your home?
Yes <=) No c=) I don't know.
4. Is there an encyclopedia in your home?
<=) Yes <=) No .;=) 1 don't know.
50 How much school did your father complete?(FILL IN THE ONE OVAL which best shows how much school yourfather completed.)
°<=1 Did not complete the 8thgrade
<=I Completed the 8th grade, but did not go to high school
(=) Went to high school, but did not graduate from high school
<=I Graduated from high school
<=I Some education after graduation from high school
<=) I don't know.
6. Did your father graduate !Alm a college GT university?
<=1 Yes <=I No <=I I don't know.
7. How much school did your mother complete?(FILL IN THE ONE OVAL which best shows how much school yourmother completed.)
CD Did not complete the 8th grade
'CD Completed the 8th grade, but did not go to high school
-Went to high school, but dicrimt gradual-MT-In igh-sch1
(=) Graduated from high school
<=1 Some education after graduation from high khool
<=1 I don't know.
8. Did yovr mother graduate from a college or university?
<=1 Yes c..= No I don't know.
42
49
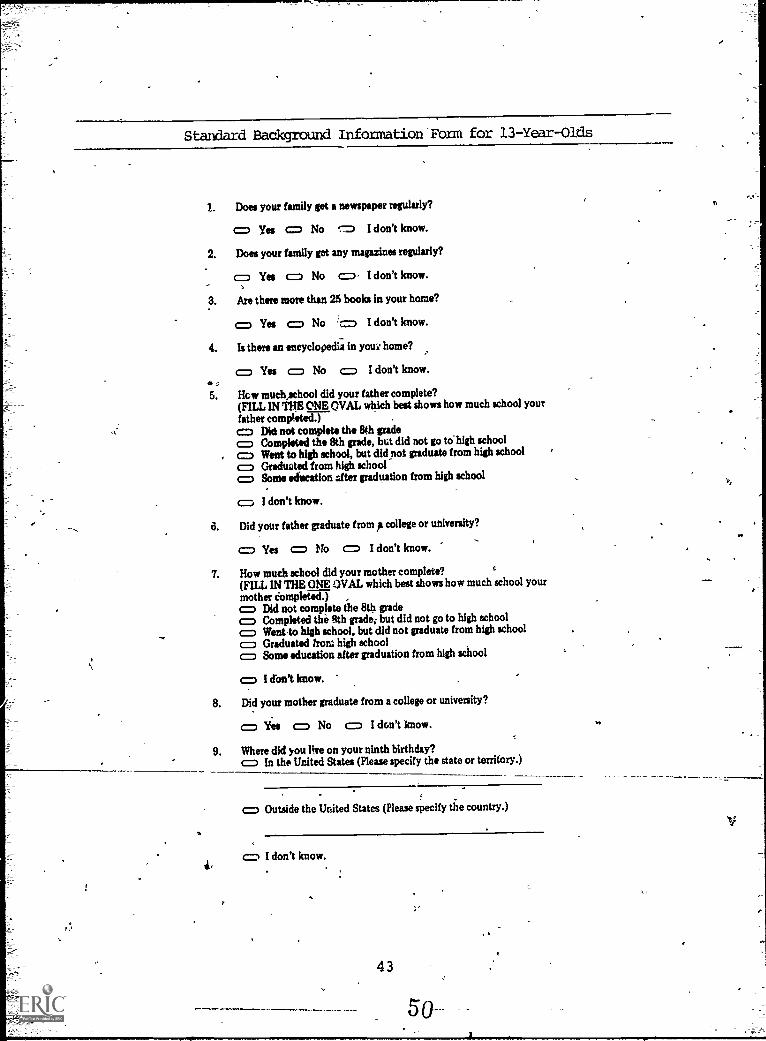
Standard Background Information Foam for 13 -Year -Olds
1. Does your family get a newspaper regularly?
o Yes CD No f.= I don't know.
2. Does your family gat any magazines regularly?
o Yes o No o I don't know.3. Are there more than 25 books in your home?
o Yee CD No O I don't know.
4. Is there an encyclopedia in youe home?
f= Yes f= No O I don't know.
5. How much,school did your father complete?(FILL IN THE ONE OVAL which best shows how much school yourfather completed.)C=3 Did not complete the 8th gradeo Completed the 8th grade, but did not go to-high schoolc=1 Went to high school, but did not graduate from high schoolo Graduotedlrom high schoolo Some education after graduation from high school
o I don't know.
6. Did your father graduate from p college or university?
CD Yes o No o I don't know.
7. How much school did your mother complete?(FILL IN THE ONE OVAL which best shows how much school yourmother Completed.) ,o Did not complete the 8th gradeo Completed the 8th grade: but did not go to high schoolo Went.to high school, but did not graduate from high schoolo Graduated kora high schoolo Some education after graduation from high school
o I don't know.
8. Did your mother graduate from a college or university?
o Yes o No o I don't know.
9. Where did you live on your ninth birthday?o In the United States (Please specify the state or territory.)
o Outside the United States (Please specify the country.)
o I don't know.
43
50
V

StarxIcrd Background Information Form for 17-Year-Olds
@
1. Which of the following does your family have at home? (Fill in one oval oneach line.)
Have Do not have
A. Newspaper received regularly o oB. Magazines received regularly oC. More than 25 books o o
., Encyclopedia oE. Dictionary o oF. Record player o oG. Tape recorder or cassette player foH. Typewriter o oI. Vacimin cleaner c= - oJ. Electric dishwasher o OK. Two or more cars or trucks that run o
2. How much time did you spend on homework yesterday?
o No homework was assignedo I had homeWork but didn't do itO Less than one hourr= Between 1 and 2 hourso More than 2 hours
3. How many different schools have you attended since you started the firstf' grade?'
o 1 to 3 schools 'k ,
c=:. 4 to 6 schoolso 7 to 9 schools,o 10 or more schools. t
4. How long have you lived in lhe community in which you now live?
c= An my lifeo 10 or more years but not all my lifeo 5 to 9 yearss= 1 yearo Less than 1 year
5. How much television'did you watch yesterday?
c=, None c 2 houtso 1,hour or less o 3 hourso 1 hour CM 4 hours
o hourso 6 hours or more
6. is English the language spoken 111(iSt often-in-your home?-
(= Yes o No
44
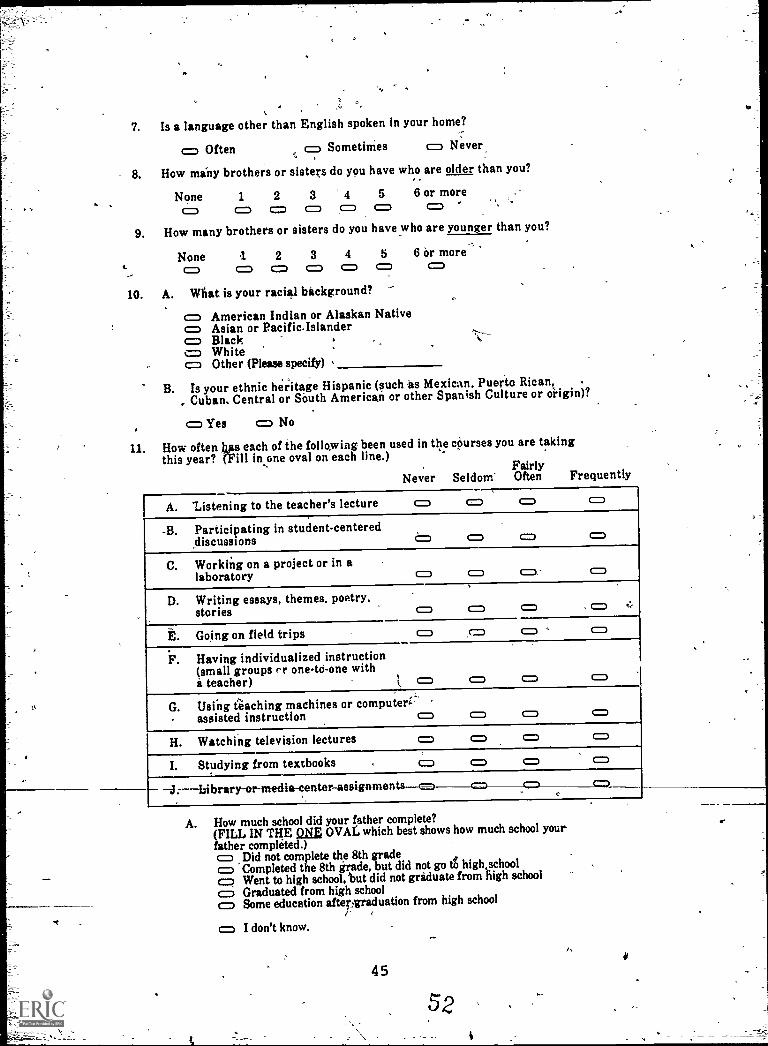
7. Is a language other than English spoken in your home?
c= Often (=i Sometimes c= Never,
8. How many brothers or sisters do you have who are older than you?
None 1 2 3 4 5 6 or more
(==. 0 cp 0 0 0 0'9. How many brothers or sisters do you have who are younger than you?
None 1 2 3 4 5 6 or more
10. A. What is your racial background?
c= American Indian or Alaskan Nativec= Asian or Pacific.Islanderc= Black= White(:=D Other (Please specify)
B. Is your ethnic heritage Hispanic (such as Mexican. Puerto Rican,Cuban. Central or South American or other Spanish Culture or origin)?
c= Yes c= No
11. How often has each of the following been used in the courses you are takingthis year? (Fill in one oval on each line.)
FairlyNever Seldom' Often Frequently
A. listening to the teacher's lecture c= c= c= c=
-B. Participating in student-centereddiscussions o c= c=, c=
C. Working on a project or in alaboratory t= c= c=i- c=i
D. Writing essays, themes. poetry,stories c= c= 0 1= ,:-
E. Going on field trips c=
F. Having individualized instruction(small groups er one-US-one withI teacher) c= cn c=i
G. Using teaching machines or computerrassisted instruction c= c= c= c=
H. Watching television lectures = 0 0 c=
I. Studying from textbooks
Library-orinedia-center -assignmentsc= MI CD-__ 0J. ,
.
A. How much school did your father complete?(FILL IN THE ONE OVAL which best shows how much school your
father completed.)o Did not complete the 8th gradecp Completed the 8th grade, but did not go to high schoolo Went to high school, but did not graduate from high schoolc= Graduated_ from high schoolo Some education after4raduation from high school
rt1-
o I don't know.
45
s \52
4

B. Did your father graduate from a college or university?
= Yes = No c= I don't' know.
C. How much school did your mother complete?(FILL IN THE ONE OVAL which best shows how much school yourmother completed.)c=, Did not complete the 8th grade ..
c= Completed the 8th grade, but did not go to high schoolc= Went to high school, but did not graduate from high schoolo Graduated from high school
4o Some education after graduation fromhigh school
) I don't know.
D. Di your mother graduate from .a college or university?
'c= Yes cm No o I don't know.
E. Where did yoti live on your ninth birthday?
ei; In the United States (Please specify the state or territory.)
o Outside of,the United States (Please specify the country.)
c:D I don't know.
F. Where did you live on your thirteenth birthday?
c= It the United States (Please specify the state or territory.)
c= Outside of the United States (Please specify the country.)
c= I don't know.
46
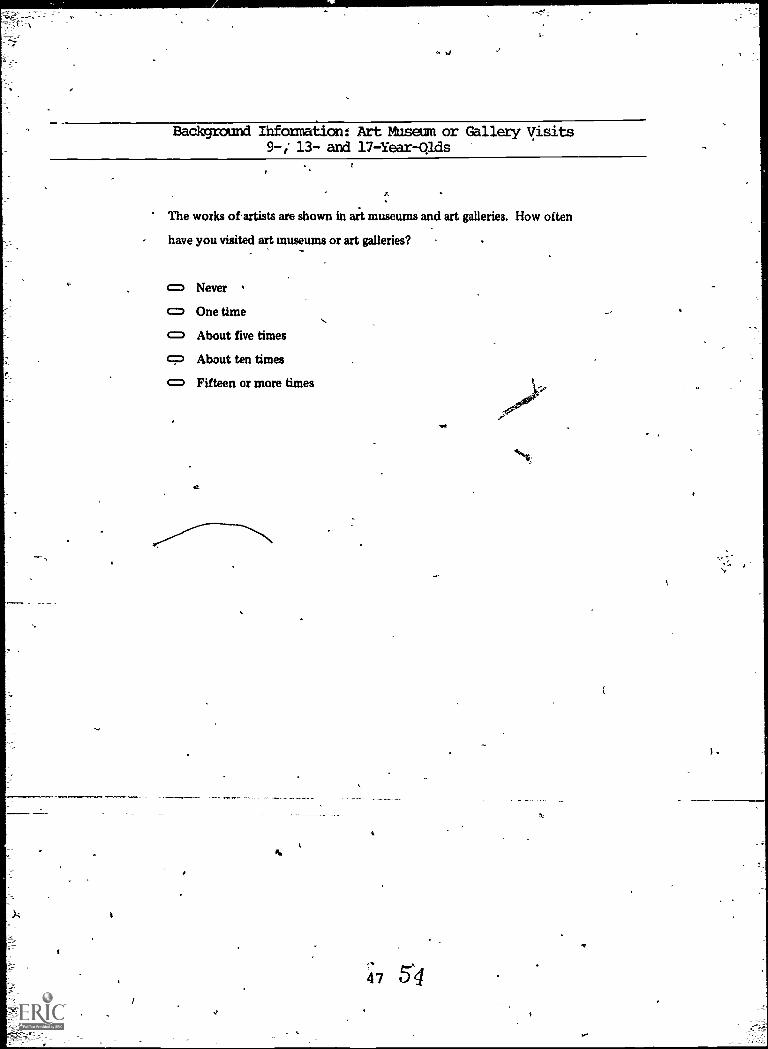
Background Ihformationt Art Museum or Gallery Visits9 -; 13- and 17-Year-1111ds
The works oartists are shown in art museums and art galleries. How often
have you visited art museums or art galleries?
c=-.) Never
c="3 One time
c="3 About five times
t:::;) About ten times
c=") Fifteen or more times
a7 54
Nie

.
Backgraund =nation: Kinds of Artwork Done Outride of School9-Year--Olds
Outside of school, what kinds of art work do you do? Tell whether you
do each of the following things.
A. Outside of school, do you draw?
c= Yes
c= No
c= I don't know.
B. Outside of school, do you paint?
c= Yes
'= No
azi I don't know.
C. Outside of school, do you make collages by cutting and pasting paper,
cloth and scrap materials?
c= Yes
c= No
c= I don't know.I
D. Outside of school, do y' carve or' ake models with wood, stone,
clay, metal or plastic?
c= Yes
c= No
c= I don't know.
48

Background Information: Kinds of Artwork Done Outside of SChoo113-and 17-Y:-ar-Olds
Outside of school, what kinds of art work uo you do? Tell whether you do
each of the following things outside of school.
Yes No I don't know.
A. Drawing c= c= c=
E. Painting c= cm c=
C. Making pictures by cutting andpasting paper, cloth and scrapmaterials
c:::, cm c=
D. Carving or modeling in wood,stone, clay, metal or plastic
c= cm c=
E. -Print-making such as blockprinting, silk screening,
' etching
c= c=1,
k
c=
F. Making pottery, ceramics ormosaics
c= cm c=
G. Weaving, macrame or knot-tying, or needlework such asembroidery, needlepoint,knitting, crocheting
c= cm c=
Hi Making photographs or films c= cm c=
,I. Making jewelry o cm CD
J. Creating designs or plans for, things like clothes, toys, cars,
houses, furniture
o cz) c=
49
56 ,

BackgroUnd Information: Art Classes Taken 13-Year-Olds
c
I.
.--.
A. Did you take an art class in school last year?
o Yes, c=i No . o I don't knows
B. Are you talc.1.4 an art class during this school, year?
o Yes a No o Idon't know.
L
50
0
57
I
V
NI,
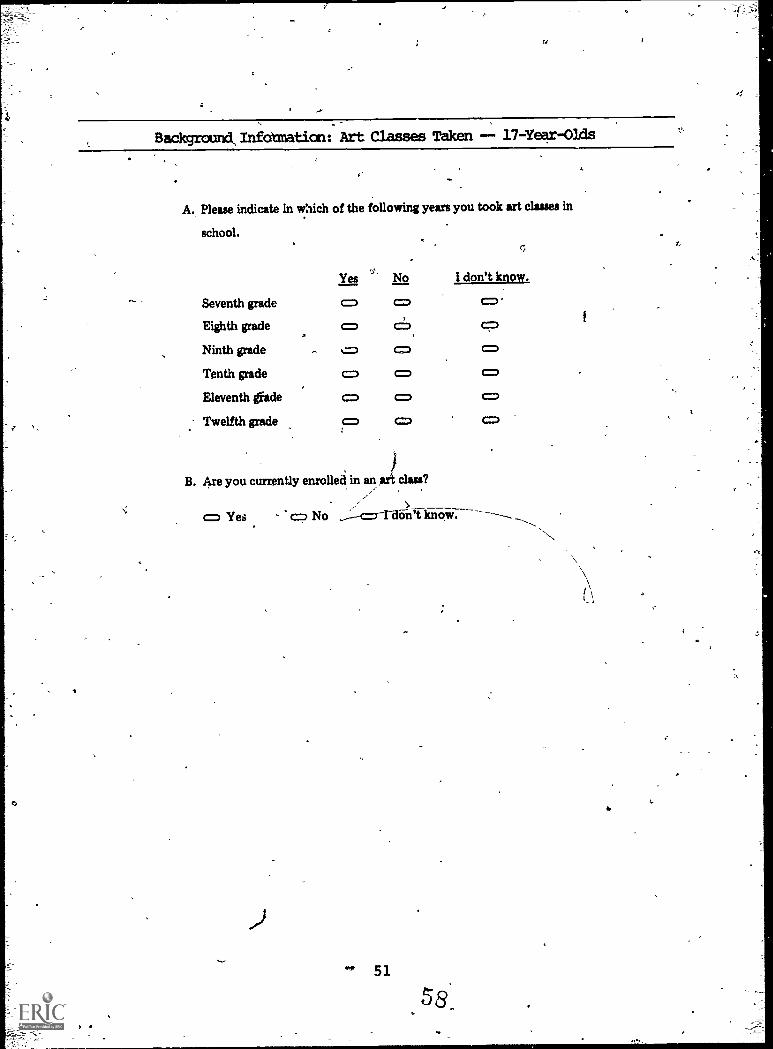
Backgrcond, infdanatian: Art Classes Taken 17-Year-Olds
A. Please indicate in which of the following years you took art classes in
I don't knqr.
Seventh grade
Eighth grade
Ninth grade ...= c=o c=
Tenth grade c= c=) C:D
Eleventh lade
.- Twelfth grader
B. Are you currently enrolled in an art class?
c= Yeti c? No _rdon't know.
58WS

'Background Informatia it Types of Aft Collected 1.3Year-Olds1
1,
A. Original works of art are such things as paintings, drawings, sculpture,.
ceramic pieces, jewelry, hand-signed prints, weaving or any other work
actually made by an artist. t
Do you ..vllect original works of art?
cm Yes
cp No
c:=, I don't know.
Fs
. Reproductions of works of art are copies of original art works.
t Do you collect reproductions of works of art?
. cm Yes
No
an I don't know.
5250
a
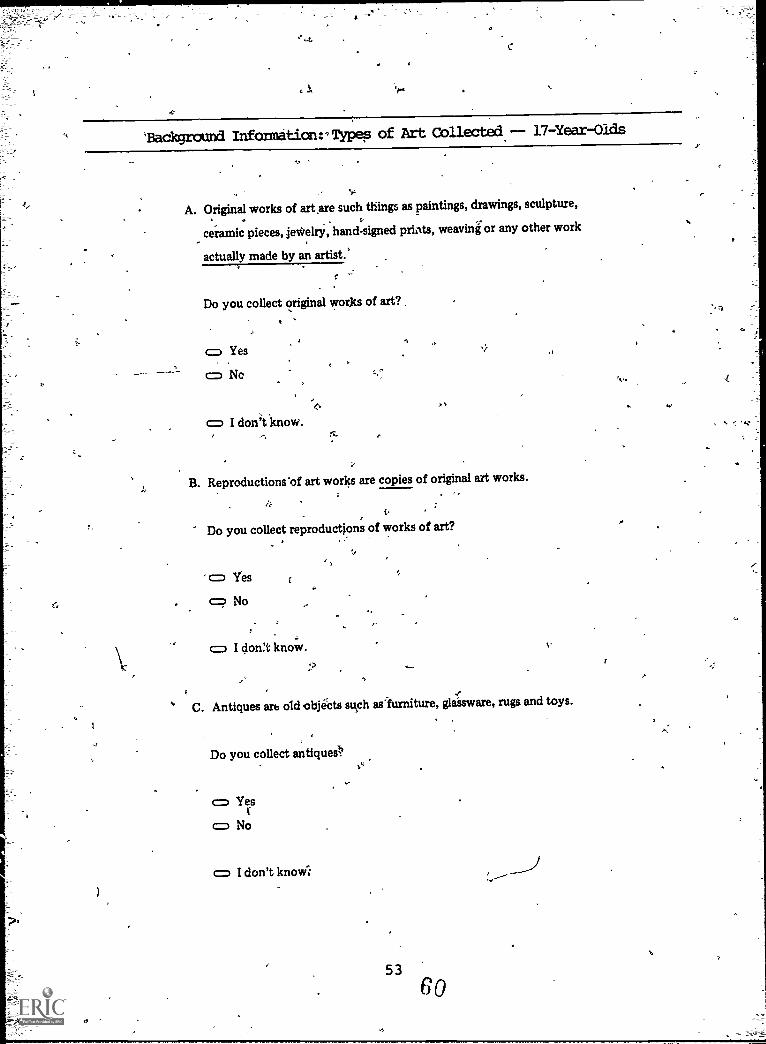
'Background Information: Types of Art C.ollected 17-Year-Olds
Mr
A. Original works of art are such things as paintings, drawings, sculpture,
ceramic pieces, jewelry, hand-signed prilts, weaving or any other work
actually made by an artist.'
Do you collect original works of art?
c=..) Yes
c=44 No
c:=4 I don't know.
B. Reproductions bf art works are copies of original art works.
r.
Do you collect reproductions of works of art?
c=4 Yes
c? No
c=4 I don!t know.
C. Antiques art old objects such as:furniture, glgsware, rugs and toys.
Do you collect antiqueit)
c=4 Yes
cp No
cp I don't know--
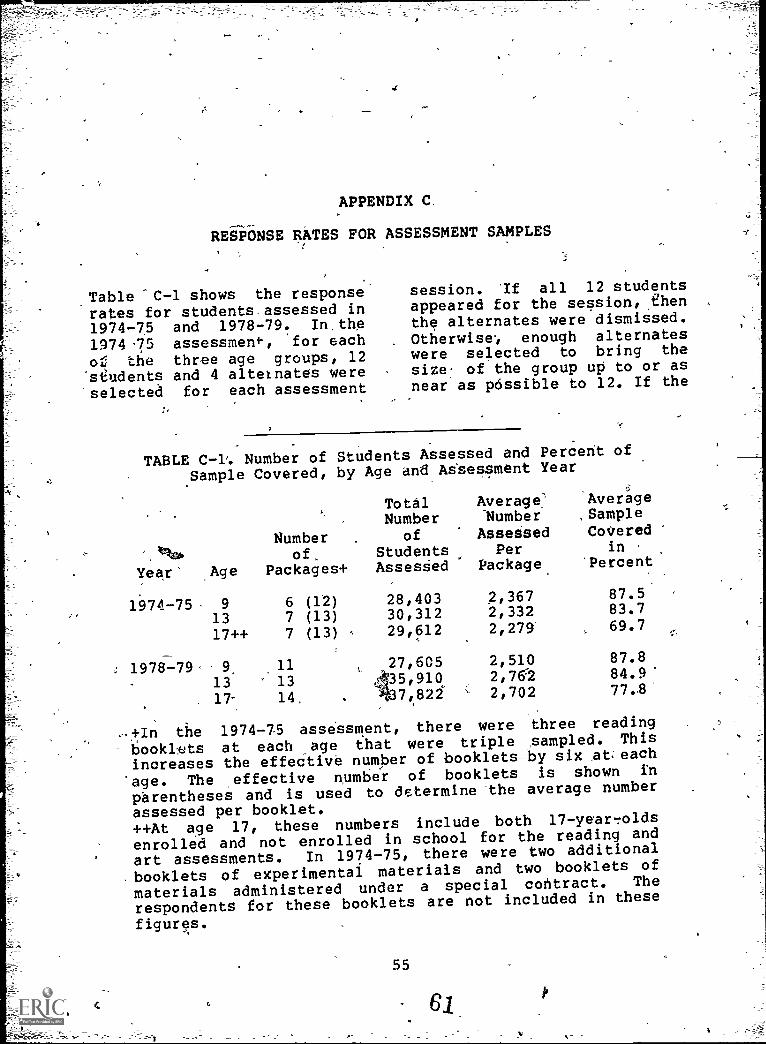
f
APPENDIX C.
RESPONSE RATES FOR ASSESSMENT SAMPLES
Table 'C-1 shows the responserates for students. assessed in
1974-75 and 1978-79. In;the
1974-75 assessment, for each
of the three age groups, 12siudents and 4 alternates wereselected for each assessment
session. 'If all 12 studentsappeared for the session,,Ehenthe alternates were dismissed.
Otherwise, enough alternateswere selected to bring thesize of the group up to or asnear as pdssible to 12. If the
TABLE C -i'. Number of Students Assessed and Percent of
Sample Covered, by Age and Assessment Year
Year' Age
1974-75. 91317++
1978179., 9,
1317-
Numberof
Packages+
6 (12)7 (13)7 (13)
111314.
TotalNumber
ofStudentsAssesSed
28,40330,31229,612
27,60535,910437,822
Average'Number
AsseisedPer
Package
2,3672,3322,279'
2,5102,7622,702
Average,SampleCoVered
in`Percent
87.583.769.7
87.884.9"77,8'
-+In the 1974-75 assessment, there were three reading
booklets at each ,age that were triple sampled. This
increases the effective number of booklets by six at.each
`age. The effective number of booklets is shown in
parentheses and is used to determine the average number
assessed per booklet.++At age 17, these numbers include both 17 -year -olds
enrolled and not enrolled in school for the reading and
art assessments. In 1974-75, there were two additional
.booklets of experimental materials and two booklets of
materials administered under a special contract. The
respondents for these booklets are not included in these
figures.
55
Si

C".
grdup assessed ,numbered be-, tween' 8 and 12 students, then,the - administration was consid-ered complete: If the finaltotal was not at least-a quo-rum of; 8, a second and some-times a third -make -up sessionwas' held. The percenta9eF inTable C-1 are based oil thenumbers of students assessedfrom the original groups of 12selected and do not reflectthe use of alternates,.
For the 1978-79 assessment,slightly different procedureswere used. 'The number of stu-dents'selected for each admin-istrative session varied from16-25 students, depending onprevious response rates ob-tained from schools ih similarcommunities. No alternateswere selected. The quorum sizeneeded to consider an adminis-trative session complete var-ied according to the number ofstudents selected. Since non-response. rates have alwaysbeen relatively small for, ages9 , and 13, the make-up orfolidw7up procedures used in1978-79 for those ages weresimilar to the ones used forthe first art, assessment. If aqubrum was not obtained at thefirst administrative session,asecond and sometimes a thirdmake-up session was held. Atage 17, in the 1978-79 assess-ment, follow-up procedureswere conducted on a school,rather than a session, basis.If a school had an overallresponse rate of less than75%, then all nonrespondentsin the school were contactedfor one or two follow-up ses-sions. These follow-up proce-dures for 17-year-olds pro-
56
vided sample coverage simil'arto that obtained at ages 9 and13.
Since response rates at age 17have always been somewhat_lower than at the other twoages, the Research TriangleInstitute (RTI), Raleigh,North Carolina, was asked toconduct ,a special study ofnonrespondents- during ' the1972-73 assessment of scienceand mathematics. The results(Kalsbeek et al., 1975; Rogerset al., 1977) indicated thatabout 80%, of the total nonre-spondent group did not appearat the ,assessment sessionsbecause of conflicting schoolactivities or illness. ,Theremaining 20% did not seem tobe available. They attendedschool'infrequently4 if at all(for practical purposes,. theyhad dropped out), or they hadmoved out of the school atten-dance area. In either case,these students probably shouldnot have been listed in thein-school population ofeligibles.
Tables ,published in previotisNational Assessment reportsshowing response rates for age17 genei.aliy contain percent-ages adjusted to account forthose 17-year-olds listed, butnot attending' school.' But,since National Assessment hasnot had the resources in re-cent assessment years to rep-.licate the RTI study, the 20%figure used as a basis foradjusting these percentagesmay be outdated, and thus thepercentages giver in Table C-1have not been adjusted. Itseems likely that despite ef-forts to update the lists of
62

eligibles, these lists still
contain some percentage of
students who have in effect
left the schools. Thus, the
r
57
percentages listed for age 17are probably underestimates ofthe, actual response rates for17- year -olds attending sc!..:01.
634

A APPENDIX D
COMPUTATION OF MEASURES OF ACHIEVEMENT,-CHANGES LN ACHIEVEMENT AND STANDARD ERRORS
Several measures of achievement thatNational Assessment uses in its re-ports are described in Chapter 7 ofthis document. The sample design, as*scribed in Chapter 4, is a complex,deeply stratified, multistage proba-,bility sample design. Measures of
achievement are obtained by weighting
individual responses .apptvpriately.
Reasonably good approximation of
standard error estimates of these
achievement measures can be obtainedby applying the jackknife procedureto, first-stage sampling units withinstrata, using the method of sbcces-
skve differences and accumulatingacross strata.
In this section, the measures ofachievement are first defined in al-gebraic form, followed by a descrip-tion of the jackknife method thatNational Assessment uses to estimate
the standard errors of achievementmeasures.
Measures of Achievement
Based on the sample design, a weightis assigned to every individual whoresponds to an exercise administeredin an assessment. The weight is thereciprocal of the probability of se-lecting a particular individual to
take a particular exercise with ad-justment for nonresponse. Since theprobabilities of selection are basedon an estimated number of people in
the takget age population, the weight' for an individual estimates the num-ber of similar people that individualrepresents in the age population. As
explained in Appendix E, the weightsare adjusted to reflect informationfrom previous assessments on popula-tion distributions.
59
A sum of the weights for all individ-uals at an age level'reSponding to anexercise is an estimate of the' totalnumber of people in that age popula-tion. A sum of.weights for all indi-viduals at an aae responding cor-rectly to an exercise is an estimateof the number of people in the agepopulation who would be able to re-spond correctly ff the entire popula-tion were assessed. These conceptsals6 apply to any reporting group(e.g., defined by region, sex, and soon) and category of response (e.g.,correct, incorrect and "I don't
knowm).
Let Wek= sum of WeightS for respon-
dents to exercise e whoare in reporting subgroupi and who are in the kthreplicate of the hth sam-pling stratum, and
COih k
= sum of weights-for respon-dents to exercise 6 whoare in reporting subgroupi, who are in the kth rep-
licate of the hth sampling
64

stratum and who selected.response category I (e.g.,
correct foil) for the ex-ercise.
Note that wP = E Cjihk ihk°
Then summing k over the r_13, sample
replicates in the stratum h, and sum-ming over the H sampling strata,
H nW? E
rhWihk
h=1 k=1estimates the number of eligibles inthe population who are in subgroup i.
ejH nh ei
Similarly, Ci.1.4. = E E esti-h=1 k=1 1 '
mates the number of eligibles in thepopulation who are in subgroup i andwho wouldt select response wtegoryfor exercise e. ?
An estimate of the proportion of theeligibles in the age population ingroup i who would select responsecategory j on exercise e is:
( I) Pei Cei /we .i++ i++
In the special _case where the pro-portion ,of all age-eligibles whowould select response category j onexercise e is estimated, the index A(for ALL) will be used in place of ias follows:
(2)4-1-
Pei '1 Cei /WeA A A++
In National Assessment reports, theproportion in (1) multiplied by 100is called the group percentage, andthe proportion in (2) multiplied by100 is called the national percent-age. The difference between the pro-
60
portion in subgroup i who would se-lect category j on exercise e and the
proportion in the nation is denotedby:
(3) aeij Peij PAei
National Assessment also reports thearithmetic mean of the percentage ofcorrect responses over sets of /exer-cises corresponding to the measuresin (1), (2) and (3).,These me s aretaken over the set of all e ercisesor a subset of exercises c assifiedby'a repOrting topic or con ent ob-jective. The mean percenta es ofcorrect responses taken over m xer:
cises in some set of exercises co re-sponding to measures (1), (2) and
are, respectively:
(4) Pim
1JIB Z
ece /we
(5)A m
- kiE c'-% + /We and. e
(6) API. -
( )
Note that'the response category sub-script j has been suppressed sincethe means are,understood to be takenoven the correct response categoryfor each exercise.
Each of these six achievement meas-ures is computed and routinely usedin reports describing achievementdata for any assessment. The simpledifference in these measures betweentwo assessments of the same exercise(or sets of exercises) pnvides sixmeasures of change in achievementthat are routinely used in NationalAssessment's change reports. The nextsection describes how standard errors
are estimated for the 12 statilstics

used in NAEP reports.
Computation ofStandard Errors
In order to obtain an approximatemeasure of the sampling variabilityin the statistics (1) through (6), a
jackknife replication proceduie forestimating the sampling variance of
nonlinear statistics from complex,
multistage samples was tailored toNational Assessment's sample design.Miller (1968, 1974) and Mosteller and
TUkey (1977) provide information
about the jackknife technique, whileFolsom (1977) describes how the pro-cedure is used in estimating standard.'
errors for National eissessment's sam-
ple design.
To demonstrate the computationalhas-
pecta of this technique, consider
estimating the variance of the sta-
tistic in .(1) -- the proportion ofage-eligibles in subgroup i who would
select response category on exer-
cise e.
This statistic is based on the data
from all 'the nh replicates ,in the H
Let OiJhk
be dzfined as a
replicationestimateofejand
constructed from all the replicatesexcluding the data from replicate kin stratum h: These replication esti-mates are computed as if the excluded'replicate had not responded, and areasonable nonresponse adjustment isused to replace the.data in replicatehk in estimating P93. Several choices
for replacing the data in replicatehk are available. In order to cbtaina convenient and computationally ef-ficient algorithm for approximat-
strata.
ing standard errors,. National Assess-
ment replaces Ceuilk and Ilhk from the
hkth replicate with corresponding
sums from another paired replicate in
the same stratum. The replicate esti-mate is then computed. The replicateestimates to. be used in the calcula-tions are determined by arranging allthe replicates in each stratum intosuccessive pairs. That is, replicate1 is paired with replicate 2,.repli-cate 2 with replicate 3, 3 with
4,...(nh-1) with Eh and replicate Eh
with replicate 1.
The contribution to the variance of
jP.ety each pair of replicates is the
change in the value of the statisticincurred by replacing the data fromeach replicate in the pair with the
data from the other replicate in thepair. and recomputing P!3 in the
usual way. This produces two repli-
cate estimates. Squaring the differ-
ence between these replicate esti-
mates and then dividing by eight
measures the contribution of this
pair of replicates to the total vari-ance. The sum of these contributionsover all 11, successive pairs in the
stratum is the contribution by stra-, :tum h to the total variance. The
square root of the sum of the H stra-tum contributions is ths4estimate of
thestandarderrorofP.J.
61
66
w

Algebraically, the twoireplicate es-timates for the pair k, k+1 (where
k =1, ...,nom and n41+1=1) are:
pe
ij hk ej ej ej
Wi++ - Wihk Wih(k+1)
ej ej ejC1.44. - C + Cih(k+1)
'and
ej - ej + CeiC1.44 -Cej ihkej
(8) P i-h(k+1) wej wej wej
i++ ih(k+1) ihk
The contribution to the total vari-ance from stratum h is:
(9) var (Peih i) = I (P2
pej
i-h(k+1)
And finally, an estimate of the Stan
dard error of Pej is:
(10) SE (Pli) (E varh
ejPih
) .
Multiplying Pej by 190 yields the
percentage of response to category j.
Multiplying S,(Peij) by 100 :yields
the corresponding estimated standarderror of the percentage.
In general, the jackknifed standarderrors of the, proportion estimateswill be larger than the simple rsampling formula (PQ/N)
where P=Pej, Q=1-P and N is the num-
ber of sampled respondents in sub-
group i who took the exercise. The
larger size of SE(PV) reflects
mainly the loss of precision due to
cluster-sampling of schools and stu-
dents. The standard errors for theachievement measures (2) through (6)
are computed through a series'ofsteps analogous to, those follOwed in
compuLing SE(P7j).
The standard'errors for the differ-ences between two assessments for any
of the achievement measures (1)
through (6) are computed as the
square root of the sum of the squaredstandard errors from each of the sep-
arate assessments.
The size of the standard errors de-pends largely not 'only on the numberof replicates and schools included in
the sample, but also on the number ofrespondents in each of the reportinggroups. Table D71 shows the average
number of students responding to anexercise booklet for each of the re-porting groups for each age for eachassessment year. Table D-2 shows
National Assessment's current esti-mates of the proportions of studentsin each reporting group at each age.
62 67

TAME D-l. Average Number ondents in Reportifig GroupsTaking an Item Booklet, by Age and Assestent Year+
Age 13 Age 17#
1974-75 1978-79 1974-75 1978-79 1974-75 1978-79
Nation 2,382 2,510 .2,388 2,762 2,168 2;702
RegionNorthemsz 581 580 601 675 536 642
Southeast 564 625 559 657 501 683
Central 695 665 686 752 634 725
West .542 639' 542 -681 ,496 649
Sex .-
Male 1,197 1,255 1,172 1,370 1,050 1,312
Female 1,184 1,255 1,216 1,395 1,118 1,386
Race /ethnicityWhite 1,844 1,849 1,884 2,053 1,794 2,134
Black 396 484 374 507 279 392
Other++ 142 177 - 130 202 96 176
Parental education _
Not graduated high school 215 191 355 326 357 386
Graduated high sohool 514 589 746 895 696 895
Postjaigh sdhool 758 880 973 1,200 993 1,334
. Unknown++ 895 850 314 341 122 87
Type of communityRural 249 252 262 271 218 246
. Disadvantaged urban 236 250 227 281 228 306
Advantaged urban 238 253 236 277 202 265
1,659 1,755 1,663 1,933 1,521 1,885Other++
Size of communiyBig cities 460 723 460 775 390 718
Fringes around big cities 450 448 472 588 423 571
Medium cities 346 237 326 287 326 287
Small places 1,126 1,097 1,131 1,115 1,030 1,123
Grade3, 7, 10 522 623 615 683 282 360
4, 8, 11 1,793 1,834 1,713 2,031 1,593 2,014
12-41
253 285
Otter++ 67 53 5 36 43
+Data may not total -Wee to -znding error.iSeventeen-year-olds /enrolled in school.++Data are not reported for these groups.
68

TABLE D-2. Estimated Current Populati:n Proportionsof National Assessment Reporting Groups
for In-School Students
Reporting GroupLi Age 9 Age 13 Age
SexMale .50 .50 .48
Female .50 .50 .52
Race/ethnicity.White
,..(1
, , .80 .83
Black .14 .13 .12
Other .07 .07 .05
RegionNortheast .25 .25 .25
Southeast .22 .23 .20
Central .27 .27 .29
West .26 .25 .26
Parental educationNot graduated high school .09 .13 .15
Graduated high school .24 .32 .32
Post high school .33 .42 .48
Unknown .34 .13 . .05
Type of communityRural .08 .10 .08
Disadvantaged urban .07 .07 .09
ilvantaged urban .11 11 .11
Ocher .74 .72 .72
Size of communityBig cities .20 .21 .19
_Fringes around big cities .22 .22 .26
Medium cities .12 .11, .11
Small places .46 .46 .44
Grade .in school<3, <7, <10 <.01 .02 .02
3, 7, 10 .23 .25 .13
4, 8, 11 .75 .72 .75
>4, >8, 12 <.01 <.01 7---L .10
Other <.01 <.01 <.01-
64 69
17

APPENDIX E
ADJUSTMENT OF RESPONDENT WEIGHTS BY SMQOTHING TO REDUCERANDOM VARIABILITY OF ESTIMATED POPULATION PROPORTIONS
Background
A weight is assigned to everyindividual who responds to anexercise administered in anassessment. The weight is thereciprocal of the probabilityof selection of the individualwith adjustment for nonre-sponse. The weight for an
individual estimates the num-ber of people that the indi-vidual represents in the agepopulation. The sum of theweights of all individuals atan age level who responded toan exercise is an estimate ofthe total number of people inthat age population in the
year that the exercise wasassessed. Similarly, the sumof weights for all Individualswho took the exercise and whoalso are members of some demo-
,
grAohic category .(such as
bl,..ks) gives an estimate ofthe number of people in the
age population, fc: the year,dho are also members of thecategory: The ratio of the twototals estimates the propor-tional representation' of thedemographic category in the
age population for the givenyear.
Separate estimates of the pro-portional representation ofthe various demograph:u sub-groups are provided by each
booklet administered to a
particular age group in a
given year. Because of sam-pling variability, the esti-mates of population .propor-tions for a given year basedon single booklets- vary.There is also sampling varia-tion in estimates of popula-tion proportions from year toyear in addition to any exist-ing trends in population pro-
, portions over time.
It is desirable to reduce therandom variability of popula-tion proportions as much aspossible, since this variabil-ity has an effect on perform-ance estimates. For example,the percentage of acceptableresponses for-an age group isa function of the relativeproportions of high-performingand low-performing groups. Ifthe relative proportions ofthese groups are very differ-ent in different assessmentsdue to sampling variability,then a portion of the changein percentage of acceptableresponses for an age groupcould be attributable to
yearly sampling differences inthe relative proportions- ofhigh- and low-achievinggroups.
In addition to reporting per-formance estimates for an age,
65
1

P
.,-
..group as a whole, NationalAssessment also reports per-formance for various subpopu-lations, such as whites, or
`ft- blacks. Because variability ofsubgroups within these sub-
,",' populations (such as males andfemales within the white popu-lation)- influences the per-formance estimates foi thesubpopulations, it is desira-ble that fluctuations of pro-poreions of all subgroups ofeach subpopulation-be reducedas much as possible.
For each age and year, each ofthe various booklets adminis-tered 'provides estimates of agiven population proportion.Since these estimates are sub-ject to booklet-to-bookletvariability, a better estimateof the population proportion,which will have reduced varia-bility, is obtained by combin-ing the information from allbooklets. However, the e pro-portions vary from y ar toyear due to random sa ingvariability or systematic di "z--,,\ferences in sampling proce-dures. An even better estimateofpopulation proportions for anysingle year can be obtained bysmoothing the proportions overseveral assessment years. Theword "smoothing" is uqed herein the sense of fitting a
smooth curve to a sequence ofnumbers by robust/resistantprocedures (Tukey, 1977).Smdothing estimates of popula-tion proportions reduces, alarge portion of the samplingvariability while preserving,as far as possible, actualtrends occurring in the agepopulrtion.
After the population prppor-
tions have been smoothed, ad-ji.Isted weights, are derived forthe assessed individuals sothat the, population propor-
.
tionS computed using the ad-justed weightS are equal tothe smoothed proportions. Theadjusted- weights are then usedfor all analyses.
66
Smoothing ProceduresUsed by National
Assessment
The most direct way to smoothproportions 1.4 first to clas-sify people into mutually ex-clusive multiway cells on thebasis of their membership incategories of various impor-tant variables and then tosmooth .the propartions withineach of the resulting multiwaycells across years. Unfortu-nately, this procedure tends-to produce a large number ofcells with few people and,consequently, quite unstableestimates of smoothed propor-tions.
To circumvent this difficulty,National Assessment has uti-lized various smoothing proce-dures. These procedures, ceIchate all basically weighting-class adjustments appliedindependently to each age, aredesigned to control, to var-ying degrees, fluctuations incertain key subgroups whileavoiding, as much as possible,instabilities due to smallcel
/
ls.
The procedure used in 1978-79has the following characteris-tics:
1. It produces a single ad(--/---s
1.
71

c-
justed weight for each-individual.
2. It' affords good control onthe distribution of pro-portions of certain keyvariables.
3. It tends to produce sta-bility of performance es-timates.
L-4. It is relatively easy toimplement.
Even tho gh adjusted weightsusing s procedure differsligh from the corresponding adjusted weights from theother procedures that havepreviously been employed, Na-tional Assessment intends touse weights obtained using the1978-79 procedure for all fu-ture analyses of data assessedin earlier years. This is simrply because we believe weightsobtained through this proce-dure have the most desirablefeatures.
The Current SmoothingProcedure
The first step in the 1978-79smoothing procedure involved
the partitioning of the popu-lation of age-class eligiblesinto the six smoothing cellsgiven in :Table E-1. The samecells were used for all ages.
Then., for each age and every-year, the proportion of thepopulation in each of thecells was estimated. For a
given age and year, the pro-portion of the population in aparticular cell was computedas the sum of weights of allrespondents assessed in the
Oven year who were of thespecified age and who belonged r
in the cell,'divided -..by the
total of the weight of allresporidents of the given ageassessed in that year. .1'
Each of the six cells was com-prised of a sequence of esti-mated population proportionscorresponding to the variousyears of assessment. A Eachsuch 'sequence of proportionswas then smoothed by fittingrobust/resistant lines. Usingdata from the U.S. Census Bu-reau and Current PopulationSurvey, trends in enrollmentby age and race and by age andregion were obtained. The datafrod these surveys were ad-
TABLE E-1. Smoothing Cells US'ed for the1978-79 Smoothing Procedure
Cell Race Region Community Size
1 White All Big cities 4- fringe2 White All Medium cities3 White All Small places4 Black Southeast All5 Black Not Southeast All6 Other All All
67

justed to correspond with Na-- tional Assessment definitions
as much as , possible. The re-sistant lines within thesmoothing cells were con-strained to satisfy the trendfrom the U.S. Census and Cur-rent Population Survey data.
The final step in the smooth-ing procedure was :to adjustthe respondents' weights to beconsistent with the smoothedproportions. Since each re-
spondent takes only one book-let, the weight adjustmentswere done independently foreach booklet. For a given age,year and booklet, populationpropolitions using the original'weights were obtained for each
of the smoothing cells: Thenthe, weights' of all respondents .of a given cell were multi-plied by the ratio of thesmoothed cell proportion tothe proportion using the,orig-inal weights. This producedthe adjusted weights that wereused in all analyses.
Adjustment of Weightsby Users
The smoothed population pro-portions for 9-, 13- and 17-year -olds (in-school only) aregiven in Tables E-2, E-3 andE-4, respectively. The columnsof each table represent thesmoothing cells while the rows
TABLE E-2. Smoothed Frequencies From 10-Year Smoothby Smoothing Cell and Year for 9-Year-Olds
Cell1 2 3 4 6
Race White White White Black , Black Other
Region All All All SE+ Not SE All
Size ofCommunity BC+FR# MC ++ SPIt All All All
Year1970-71 0.3299 0.1203 0.3574 0.0557 0.0736 0.0631
1971-72 0.3232 0.1177 0.31147 0.0562 0.0743 0.0638
1972-73 0.3165 0.1152 0.3720 0.0568 0.0749 0 0646
1973-74 0.3098 0.1126 0.3793 0.0573 0.0756 0.0654
1974-75 0.3030 0.1101 0.3866 0.0579 0.0763 0.0661
1975-76 0.2963 0.1076 0.3938 0.0594 0.0770 0.0668
1976-77 0.2896 0.1050 0.4011 0.0590 0.0776 0.0676
1977-78 0.2829 0.1025 0.4084 0.0596 0.0783 0.0684
1978-79 0.2762 0.1000 0.4157 0.0601 0.0790 0.0691
1979-80 0.2694 0.0974 0.4230 0.0607 0.0797 0.0698
+SE = Southeast.#BC+FR = big cities + fringes.++MC = medium cities.##SP = small places.
68
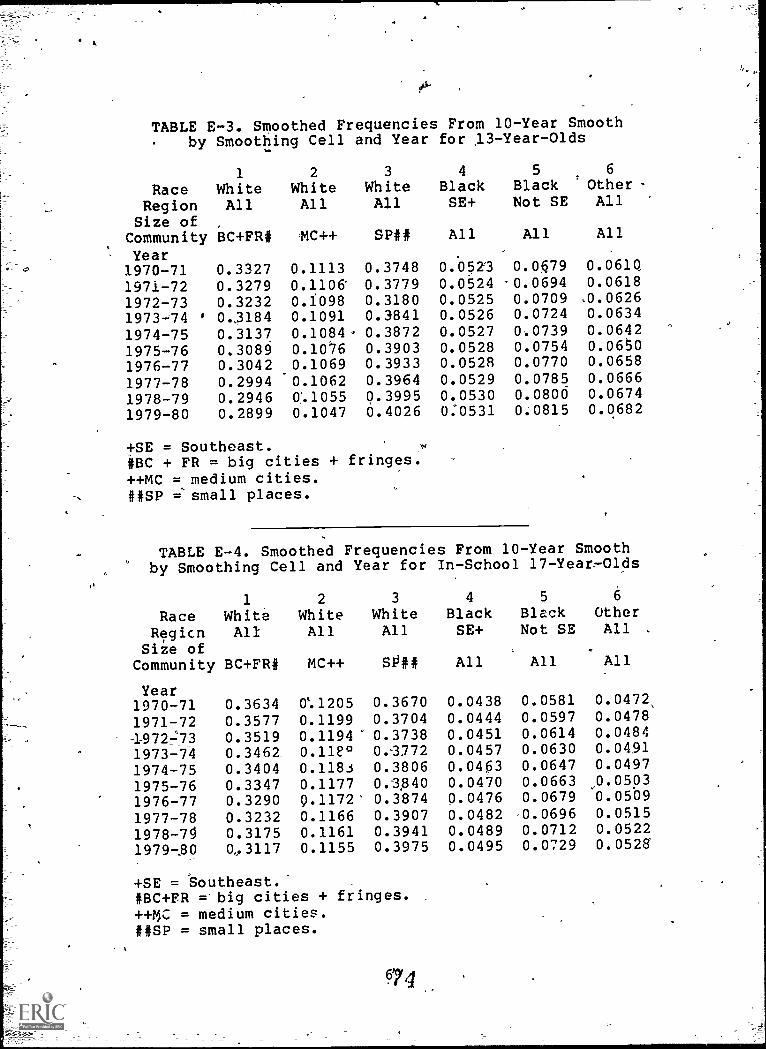
TABLE E-3. Smoothed Frequencies From 10-Year Smoothby Smoothing Cell and Year for 13-Year-Olds
RaceRegion
Size of
1
WhiteAll
2
WhiteAll
3
WhiteAll
4
BlackSE+
5BlackNot SE
6
OtherAll
Community BC+FR# 44C++ SP## All All All
Year1970-71 0.3327 0.1113 0.3748 0:0523 0.079 0.0610,
1971-72 0.3279 0.1106 0.3779 0.0524 '0.0694 0.0618
1972-73 0.3232 0.1098 0.3180 0.0525 0.0709 .0.0626
1973-74 ' 0.,3184 0.1091 0.3841 0.0526 0.0724 0.0634
1974-75 0.3137 0.1084. 0.3872 0.0527 0.0739 0.0642
1975-76 0.3089 0.1076 0.3903 0.0528 0.0754 0.0650
1976-77 0.3042 0.1069 0.3933 0.0528 0.0770 0.0658
1977-78 0.2994 0.1062 0.3964 0.0529 0.0785 0.0666
1978-79 0.2946 0'.1055 0.3995 0.0530 0.0800 0.0674
1979-80 0.2899 0.1047 0.4026 0:0531 0.0815 0.0682
+SE = Southeast.#BC + FR = big cities + fringes.++MC = medium cities.##SP ='small places.
TABLE E-4. Smoothed Frequencies From 10-Year Smoothby Smoothing Cell and Year for In-School 17- Year--Olds
1 2 3 4 5 6
Race White White White Black Black Other
Regicn All All All SE+ Not SE All
Size ofCommunity BC+FR# MC++ SO## All All All
Year
-
1970-71 0.3634 0%1205 0.3670 0.0438 0.0581 0.0472
1971-72 0.3577 0.1199 0.3704 0.0444 0.0597 0.0478
1972=73 0.3519 0.1194' 0.3738 0.0451 0.0614 0.0484
1973-74 0.3462 0.11E° 0.3772 0.0457 0.0630 0.0491
1974-75 0.3404 0.118s 0.3806 0.0403 0.0647 0.0497
1975-76 0.3347 0.1177 0.3840 0.0470 0.0663
1976-77 0.3290 9.1172' 0.3874 0.0476 0.0679.0.05030.0509
1977-78 0.3232 0.1166 0.3907 0.0482 0.0696 0.0515
1978-79 0.3175 0.1161 0.3941 0.0489 0.0712 0.0522
1979-80 03117 0.1155 0.3975 0.0495 0.0729 0.0526
+SE = Southeast.#BC +FR =-big cities + fringes.++MC = medium cities.##SP = small places.

,
represent the assessment year.For example, the smoothed .pop-ulation proportion of 9-year-olds in smoothing cell 2
(whites in medium cities) for1912-73 is .1152.
ual's original weight andthe appropriate adjustmentfactor.
To adjust respondent weightsChanges in SmoothedProportions as New
to be consistent with thesmoothed proportions, the fol-
Assessments Are Completed
lowinglowed:
procedures were fol- Every time an assessment iscompleted, a new time point is
1. For each booklet, respon-dents ,were classified ac-cording to smoothing cell,and the raw populationproportions for each cellwere obtained. For exam-ple, the raw proportions,for a booklet given to
9-year-olds in smoothingcell 4 was the total ofthe weights of all 9-
year -olds receiving thebooklet who were black andin the Southeastern re-gion, divided by the totalof the weights of all re-spondenti _receiving 'thebooklet.
2. For each booklet and
smoothing cell, a weightadjustment factor as theratio of the smoothed pop-ulation proportion (for
the appropriate age, yearand smoothing cell) overthe raw population pro-portion was obtained.
3. The adjusted weights foran individual were the
product of that individ-
added to each of the sequencesof population proportionswithin the smoothing cells..
This means that, even thoughrobust/resistant proceduresare used, the addition of a
new point may somewhat changethe values of smoothed propor-tions for prior years. Addi-tionally, any changes in meth-odology will'impact the esti-mates.
This means that the smoothedproportions, with the additionof the next assessment data,are apt to differ somewhatfrom the correspondingsmoothed proportions withoutthe new Aata. National As-sessment has -adopted the
philosophy that the smoothedproportions, baSed on all cur-rently available data using
the best available algorithm,are the best available. There-fore, all subsequent analyses,for any year, will- be doneusing this best available in-formation-, even though this
may produce estimates thatdiffer slightly from'priorvalues.

GLOSSARY OF NATIONAL ASSESSMENT TERMS
Acceptable response. Any re-sponse to an exercise thatdemonstrates achievement ofthe objective measured bythat exercise.
Administration time. The totaltime allowed on the pacedaudio tape for an euercise.(Includes the time allowedfor the stimurus and theresponse.)
Administration timetable. Timeperiods during the schoolyear when the various agegroups are assessed. The
time periods are:
October-December 13- year-olds
January-February 9-year-olds
March-May 17-year-olds
Age group or age level. Threeage groups have-.5een sam-pled in both art assess-ments: 9-year,-olds, 13-
Year-olds and 17- year -oldsattending school.' Birthdate ranges for each age
group in each of the twoassessments are as follows:
AssessmentpAge 9 -Age 13 Age 17
1974-75 1965 1961 10/57-9/58
1978-79 '1969 1965 10/61-9/62
Assessment. The documentationof the progress in knowl-edge, skills and attitudesof American youth. Measuresare taken at periodic in-
tervals for each learningarea, with the goal of de-termining trends and re-porting the findings to thepublic and to the educationcommunity.
Assessment administrator. In-dividual employed to
administer the assessmentin participating schools.
Background questions. Ques-tions about respondents'instructional experienceswith art both in school andout of school were includedin art item booklets. Stan-dard background questionsasked in every learningarea are found on the backpages of the item bookletsand include such things aslevel of parental educationand reading materials in
the home. Background ques=tions used in the 1978-79art assessment appear in
Appendix B.
Booklet. Items (eXercises) arepresented to respondents inbooklets. Booklets are de-signed to be scored by op-tical scanning machines.Each' booklet contains: (1)instructions for answeringitems and sample items, (2)assessment items and (3)
background questions. Eachbooklet contains approxi-mately 30-35 minutes ofassessment items and 10-15
71
76

minutes of introductorymaterial and backgroundquestions%
Category (scoring). A classi-fication of a response toan open-ended exercise. Seeacoring guide.
Category within a variable. Asubclassification within avariable. For exanple, maleand female are categoriesof the variable sex. Seereporting groups.
Difficult y level. The percent-age of acceptable responsesto an exercise.
Exercise. A task designed tomeasure an objective. Be-cause NAEP does not admin-ister"tests," but insteaddescribes educationalachievement over time, theterm "exercise" is oftenused instead of the term"item" or "test item." Theterms "item" and "exercise"are used synonymously inthis report.
Exercise booklet. See booklet.
Exercise part. See item part.
Exercise pool. The entire setofexercises prepared for alearning area. This setincludes recycled exer-cises, exercises developedfor previous assessmentsbut not used due to exer-cise booklet or.budgetaryconstraints and newly de-veloped exercises.
Field test. A pretest of exer-cises to obtain informationregarding clarity, diffi-
s72
culty levels, timing, fea-sibility and special admin-istrative problems. Neededfgk, revision and selectionof exercises to be used inthe assessment.
Grade in school. Results arereported for 9-year-olds ingrades 3 and 4; 13-year-olds in grades 7 and 8; and17-year7olds in grades 10,11 and 12.
Group administration. Bookletswere administered to groupsof 10 to 25 students in1978-79. In 1974-75, normalgroup size was 12 respon-dents. A paced audio tapewas used to provide uniforminstructions and oral pre-sentation of exercises.
Hand scoring (scoring). Thecoding of responses in aformat compatible with theoptical scanning equipmentbeing used. Multiple-choice exercises can bedirectly machine scored;however, responses tpopen-ended exercises mustbe coded in scoring ovalsso that they can then bemachine scored. See scoringguide.
ID number. An identificationnumber referring to theunique number assigned toeach respondent. This num-ber is assigned to preservethe anonymity of each re-spondent. NAEP does notkeep records of the namesof any individuals.
Item. See exercise.
Item booklet. See booklet.
77
Item part. Each part of anitem that asks a separatequestion. Parts may allpertain to one stimulus,such P- a graph or a table,or concern the same
topic.
Jackknife. The name of the
algorithm used by NAEP toestimate standard errors ofpercentages and other sta-tistics.
Learning area. One of the
areas assessed by NationalAssessment: reading/litera-ture, writing, mathematics,science, citizenship/socialstudies, art, music, careerdevelopment. Also called"subject area."
Leyel of parental education.These levels are describedin Appendix A.
Modal grade. The grade in
which the majority of eachin-school age group is en-rolled. For 9 year-olds,the modal grade is grade 4;for 13-year-old , grade 8;
and for 17-year-olds, grade11.
Objective. A desirable educa-tion goal agreed upon byscholars in the field, edu-cators and concerned laypersons, and, establishedthrough the consensus ap-proach.
Objectives redevelopment.After the initial assess-ment of a learning area,one of the first steps inpreparing for reassessmentis a review of thelearning-area objectives.
73
78
This is carried out byscholars in the field, edu-cators and concerned laypersons. These reviews mayresult in revision, modifi-cation or total rewritingof the learning-area objec-tiVes to reflect currentcurricular goals and empha-ses;
the
may also resultin the endorsement of theobjectives from the previ-ous assessment as adequatefor the next assessment.
Open-ended exercise. A nonmul-tiple-choice exercise thatrequires some type of Wit-ten or oral response.
Paced audio tape. A tape re-cording that accompanieseach booklet to assure uni-formity in administration.Instructions and exercisesare played back from the_tape recording so thatreading difficulties willnot interfere with an indi-vidual's ability to re-spond. Response time is
included on the tape.
Primary sampling unit (PSU).First-stage sampling units,typically a county or a
group of contiguous coun-ties.
Principal's questionnaire. Adata collection form givento school officials. Theofficials respond to ques-tions concerning enroll-ments, size of the commu-nity, occupational composi-tion of the community, andso forth. Samples of thesequestionnaires are found inAppendix B. See also sup-plementary principaTF

questionnaire.
PSU. See primary sampling
Public-use data tapes. Com-puter tapes containing re-spondent-level exercise andbackground/demographic dataand machine-readable docu-mentation. These-tapes areavailable for use by exter-nal researchers wishing todo secondary (analyses ofNational Assessment data.
Racial/ethnic category. Forthe art assessments, re-
sults are reported for
whites, blacks and His-panos. (Because of a smallsample size, only averageresults for Hispanos can bereported by National As-sessment.)
Receipt control. Proceduresimplemented by scoringstaff to check in andscreen materials from thefield. InformatiOn gainedfrom receipt control ugce-dures is relayed /CZ) theadministrative staff sothat any errors may be cor-rected.
Recycled exercises. The set ofexercises that is kept se-cure from one assessment tothe next that will be usedto measure changes (growth,stability or decline) in
performance for the learn-ing area.
Region. One of four geographi-cal regions u3ed in gather-ing and reporting data:
Northeast, Southeastr Cen-tral and West. States in-
74
cluded in each region areshown in Appendix A.
Released exercise. An exercisefor which results and exer-cise text have been re-ported to the public.
Released exercise set. A setof released exercises, in-cluding documentation andscoring guides, that can bepurchased from _NationalAssessment.
Reporting groups. Categoriesof variables for which Na-tional Assessment data arereported. Variable cate-gories are defined in Ap-pendix A.
Rescore. If an open-ended ex-ercise was scored underdifferent conditions thanpresently held or if pas-sage of time might affectscoring, responses from aprevious assessment may berescored at the same timethat responses from a laterassessment are scored.Responses from an earlierassessment also may be heldand not scored so that theycan be scored, with respons-es from a later assessment.
despondent. A person who re-sponds to the exercises inan assessment booklet.
Response options. Differentalternatives to a mul-tiple-choice question thatcan be selected by the re-spondent.
Review conference. A con-ference held to review theobjectives of a learning
area to ensure theiracceptance as measures ofthe objectives by scholars,educators and 'lay personsor to revietli exercises for
racial, ethnic, socV1 orregional bias.
Sample. National Assessmentdoes not assess an entireage population but ratherselects a representativesample from the 'age groupto answer assessment items.(See Chapter 4 for -a
description of NationalAssessment samplingprocedures.)
Scoring guide. A guide for
hand scoring an open-endedexercise that specifiesdescriptive or diagnosticcategories by giving
definitions and sample re-sponses.
Scoring ovals. Scannable ovalsprinted beside multiple-choice options and printedat the bottom of the pagefoe open-ended exercises(to be used in hand scor-ing). When ,ovals- aremarked, they can be scoredby machine and responsesthen can be recorded bycomputer.
Sex. Results are reported formales and females.
Size of community. Results are"reported for four size-of-community categories: bigcities, fringes around bigcities, medium cities andsmall places. These cate-gories are defined in Ap-pendix A.
75
I
SMSA. Standard MetropolitanStatistical Area. SMSAs areeconomic and sac al .unitsdefined by the U.S. Bureauof the Census.
Standard error. A measure ofsampling variability for astatistic. Because ofNAEP's complex sample de4.:-
sign, standard errors areestimated by jackknifingfirst-stage sample esti-mates.
Stem. The portion of an exer-cise that states the prob-lem or asks the question.
Stimulus. For art exercises,this will be an auraland/or a visual stimulusused as part of the stem.
Subject area. See learningarea.
Subpopulation or subgroup.Groups within the nationalpopulation,. such as matesand females, for which dadaare reported.
Supplementary principal'squestionnaire. A data col-lection form given to
school officials. On thisform, officials are askedto respond to questionsconcerning course offer-ings, materials and staf-fing specific to the learn-ing area being assessed. Asample of this question-naire is found in Appendix B.See- also principal's ques-tionnaire.
Tapescript. A script preparedfor the announcer to use in
80
producing the paced tape..It indicates exactly whatis to be read or not readaloud to the students andindicates the amount ofresponse time allowed foreach exercise. See paced_audio tape.
Timing. Most NAEF exercisesare administered with apaced audio tape to stan-dardize data collectionconditions. The tape in-cludes the amount of timestudents are allowed torespond to each exercise.
Type of community. Results arereported for three type-of-community categories:disadvantaged urban, advan-taged urban and rural.Definitions of these cate-gories are found in Appen-dix A.
76
User tape. See public-use datatape.
Variable. A classification ofrespondents. Standard re-porting variables are: re-gion, sexl race/ethnicity,level of parental educa-tion, size of community,type of community and gradein school.
Weight. A multiplicative fac-tor equal to the reciprocalof the probability of arespondent being selectedfor assessment with adjust-ment for nonresponse -- anestimate of the number Ofpersons in the populationrepresented by a respondentin the sample. Theoreti-cally, the -sum of theweights for all res1.,ndentsat an age level is equal tothe number, of persons inthe country at that agelevel.
81
BIBLIOGRAPHY
Art Objectives, no. 06-A-10, 1974-75 Assessment. Denver,Cow`.. National Assessment of Educational Progress,Education Commission of the States, 1971. ERIC no.ED 051 255. ISBN 0-89398-001-3.
Art Technical Report: Exercise Volume, Report no. 06-A-20, 1974-75 Assessment. Denver, Colo.: National As-sessment of Educational Progress, Education Commis-sion of the States, 1978. ISBN 04-89398-006-4.
Art Technical Report: Summary Volume, Report no. 06-A-21, 1974-75 Assessment. Denver, Colo.: National As-sessment of. Educational Progress, Education Commis-sion of the States, 1978. ERIC no. ED 155 125. ISBN0-89398-007-2.
Attitudes Toward Art, Report no4,-,4 06-A-03, 1974-75 AS-sessment. Denver, Colo.:. National Assessment ofEducational Progress, Education ,Commission of theStates, 197g. ERIC no. ED 166 1'1.22. ISBN 0- 89398-005-6.
Chromy, J. -and D: Horvft;z. "Structure of Sampling andWeighting,* 1969-70 Science: National Results andIllustrations of Group Comparisons, Report no. 1,1969-70 Assessment. Denver, Colo.: National Assess-ment of Educational Progress, Education Commissionof the States, 1970. ERIC no. ED 055 786. ISBN 0-89398- 276 -8.
Design ani Drawin Skilisi Report no. 06-A-01, 1974-75Assessment. env.er, Colo.: National Assessment ofEducational Progress, Education Commission of the
States, 1977.' ERIC no. ED 141 249. ISBN 0- 89398-002 -1.
Final Report: In-School Field Operations and Data Col-lection Activities National Assessment of Eluea-t onal Progress, For the Period of Oct. 1, 1974Through Sept. 30, '1975. Research Triangle Park,N.C.: Research iangle Institute,. 1975.
77
Final Report on National Assessment of Educational Pro-otJss Sampling and Weighting Activities for Assess-
Year 10. Research Triangle Park, N.C.: Re-search Triangle Institute, 1980.
Final Report on National Assessment of Educational Pro-gress Sampling and Weighting Activities for Year 06.Research Triangle Park, N.C.: ResearchTriangle In-stitute,1976.
Final Report on v-gar 10 In-School Field Operations andData CollectAon Activities, National Assessment ofEducational Progress. Research Triangle Park, N.C.:Research Triangle Institute, 1979.
Folsom, Ralph E. National Assessment Approach to Sam-Tin Error Estimation, Sampling Error MonographU- 6-5. Research Triangle Park, N.C.: Research
Triangle Institute, 1977.
Kalsbeek, W.D. et al. No Show Analysis, final reps t.Raleigh, N.C.: Research Triangle Institute, 1975.
Knowledge About Art, Repo'rt no. 06-AL02, 1974-75 Assess-ment. Denver, Colo.: National Assessment of Educa-tional Progress, Education Commission of the States,1978. ERIC no. 7D 151 270. ISBN 0-89398-004-8.
Miller, R.G. Jr. "A Trustworthy Jackknife," Annals ofMathematical StatiStics,,no. 35, 1964.
Miller, R.G. Jr. "Jackknifing Variances," Annals ofMathematical Statistics, no. 39, 1968.
Miller, R.G. -Jr. *"The Jackknife A Review," Bio-metrika, no. 51, 1974.
Mosteller, F. and J.W.- Tukey. Data Analysis and Regres-sion.l` Reading, Mass.? Addison-Wesley, 1977.
Mosteller, F. and J.W. Tukey. "Data Analysis IncludingStatistics," in Handbcok of Social Psychology, 2nded., edited by E. Aronson and67lindzey. Reading,Mass.: Addison - Wesley, 1968.
Rogers, W.T. et al.-"Assessment of Nonresponse Bias inSOlple Surveys: An Example From National Assess=
,Jiment," Journal of Educational Measurement, val: 14,no 4, 1977.
7883

I
Supplement to 1971 Art Objectives, no. 10-A-11, 1978-79Assessment. Denver, Colo.: National Assessment o'fEducational Prc,:ress, Education Commission Tof theStates, 1971. ISBN 0-89398-010-2.
The Second Assessment of Art, P:*78-79: Released ExerciseSet, no. 10-A-25. Denver, Colo.: Uational Assessment.of Educational Progress, Education Commission of theStates, 1980. ERIC no. ED 186 331. ISBN 0-89398-D11-0.
Tukey, John' W. Exploratory Data Analysis. Reading,Mass.: Addison-Wesley, 1977.
Tukey, John W. "Some Considerations on Locators Apt forSome Squeezed-Tail (or Stretched-Tail) Parents"(paper prouuced in connection with research atPrinceton-University, supported by the Army ResearchOffice), summer 1975.
I
' d
84 79* O. S. GOVERNMENT PRINTING OFFICE 1981 - 576403/78 Reg.
4%.
NATIONAL ASSESSMENT OF EDUCATIONAL PROGRESSEducation Commission of the States
Robert D. Ray, Governor of Iowa, Chairperson,Education Commission of the States
Robert C. Andringa, Executive Director,Education Commission of the States
H. Forbes, Director, Nationals Assessment
All National Assessment reports and publications are availablethrough NAEP offices at the address shown at the bottom. Reportsordered from NAEP are processed within three days.
Some of the more recent reports are also available from theSuperintendent of Documents, and most all are available "from ERIC.Write to the National Assessment office fot a current publicationsligt.
National Assessment reports related to this report:
MUSIC1st Assessment (1971-72)
03-MU-01 The First 14ational Assessment of MusicalPerformance February 1974 $ 1.00
03-MU-02 A Perspective on the First MusicAssessment, April 1974 1.00
03-MU-'03 An Assessment Of Attitudes Toward Music,September 1974i; 1.10
03-MU-00 Thp First Music Assessment: An Overview,August 1974 1.00
03-MU-20 Music Technical Report: rcise Volume,December 1975 25.00
03-MU-11 Music Technical Report y VolumeNovember 1975 4.40'
ilOTE: A cassette supplementing th- usic report'g' including musicalstimuli and actual performan-e by 9-, 13-,and 17-year olds isavailable for $1.00. ,
2nd Aisessment (1978-79)10-MU-01 Music 1971-79: Results From the Second
National Music Assessment, November 1981 7.0010-MU-25 The Second Assessment of Music, 1978-79,
Released Exercise Set, April 1980 15.2010- -MU -40 Proc...e&ural Handbook: 1978-79 Music
Assossment, December 106.1 7.70
0 NOTE: A cassette tape with music stimel for released exercisestk supplementing Report no. 10-MU25 is now available for $2.00,
(Continued on Inside Back Cot:er)
0,b5
Pri.V.M.IA=411...01WallmAMMAIMMUNIMMMOMMAIMA.
(Continued From Inside Front Cover)
ART1st Assessment (1974-75)
06-A-01 Design and Drawing Skills, June 197706-A-02 Knowledge Aboqt Art, January-197806-A-03 Attitudes Towbed Art, May 197806-A-20 Art Technical Report: Exercise Volume,
January 197806-A-21 Art Technical Report: Summary Volume,
`,June 1978_
2nd Assessment (1978-79)*10-A-01 Art and Young Americans, 1974-79: Results
From the Second National Art Assessment ,
December.198110-A-25 lbe Second Assessment of Art, 1978-79,
Released Exercise Set, April 198010-A-40 Procedural Handbook: 1978-79 Art
Assessment, December 1981
BACKGROUND REPORT03/04-GIY General Information Yearbook. A condensed
4 description of the Assessment's methodology,December 1974
3.702.152.65
27.50
6.80#
-8.90
12,.65
8.60
2.75
In addition to -the above reports, National Assessment has producedreports in the areas of social studies, citizenship, writing,literature, reading, mathematics, science and career andoccupational development. A complete publications list andordering information are available from the address Delow.
NATIONAL ASSESSMENT OF EDUCATIONAL PROGRESSSdite 700, 1850 Lincoln Street-. Denver, CoIorado.80295
86


