DOCTOR OF BUSINESS ADMINISTRATION ... - Information...
164
1 DOCTOR OF BUSINESS ADMINISTRATION NOTTINGHAM TRENT UNIVERSITY Sustaining Data Quality- Lessons from the Field Creating and Sustaining Data Quality within diverse Enterprise Resource Planning and Information Systems Tony O’Brien This dissertation is submitted in part fulfilment of the requirement of Nottingham Trent University for the degree of Doctor of Business Administration February 2011 This dissertation is the final thesis of a Doctor of Business Administration programme which comprises in total six documents. The thesis is a stand alone text and is the culmination of this entire research. Reference is made to the prior documents to highlight how the early research has developed and progressed.
Transcript of DOCTOR OF BUSINESS ADMINISTRATION ... - Information...

1
DOCTOR OF BUSINESS ADMINISTRATION
NOTTINGHAM TRENT UNIVERSITY
Sustaining Data Quality- Lessons from the Field
Creating and Sustaining Data Quality within diverse
Enterprise Resource Planning and Information Systems
Tony O’Brien
This dissertation is submitted in part fulfilment of the requirement of Nottingham Trent University for the degree of Doctor of Business
Administration
February 2011 This dissertation is the final thesis of a Doctor of Business Administration programme which
comprises in total six documents. The thesis is a stand alone text and is the culmination of
this entire research. Reference is made to the prior documents to highlight how the early
research has developed and progressed.

2
Table of Contents Acknowledgements 6
Abstract 7
1. Introduction and Objectives 8
• Introduction 8
• The Focus of this Research 9
• Data Quality Defined 10
• Enterprise Resource Planning 11
• Remploy 13
• Review and Development of the Research Questions 14
• People Processes and Data 16
• Theory and Practice 16
2. Conceptual Themes and Frameworks 18
• Conceptual Framework 18
• Major Concepts 19
• Working Definitions 21
• Research Focus 25
• Important Aspects of The Initial Literature Review Revisited 25
• Sustainability 26
3. Data, the Management of Data and Data Governance 28
• The Management of Data and Data Governance 28
• Data Dimensions 32
4. Processes 34
5. People Issues 37
• People as ‘Users’ 37
• People and ERP 37
• Information Politics and Culture 38
• Implementing Improvements and the Management of Change 39
6. Sustaining Improvements and the Management of Change 41
• Theoretical Models for change 42
• Management of Change 44

3
7. Sustainability and the Principles of Quality Management 46
• Sustainability and Enterprise Resource Planning 48
• Key Recurring Themes 50
• Data Quality Software Tools 53
8. Data and Data Quality within Remploy 54
• The Requirement for Quality Data 54
• Data Quality Improvement 55
• Remploy Data Accuracy Key Performance Indicators 56
• Measurement Process 57
• KPI Roll Out and Development 58
• Review of the Reporting Process 60
9. The Objective of this Research 62
• Internal Qualitative Study 62
• Internal Quantitative Survey 67
10. Ethical Aspects of This Study 68
• Remploy’s Ethical Standards 68
• Security 69
• Electronic Security 69
• Ethical Aspects of Qualitative Research Relating to this Study 69
• Ethical Aspects of Quantitative Research Relating to this Study 70
11. Internal Qualitative Research 71
• Focus/Discussion Groups 72
• The Data Capture Process 72
12. Internal Qualitative Research- Analysis and Findings 74
• The Research Process 74
• Analysis 75
• Recommendations for Action 77
• The Wider Context of this Research 79
13. The Data Accuracy KPI Index Performance Review 81
• Period of Review- September 2006 to November 2009 81
• Subsequent Events 84
• Summary of the Findings 85

4
14. Internal Quantitative Research 86
• The Data Capture Process 88
15. Internal Quantitative Research- Analysis and Findings 90
• Survey Response 90
• Identification of Variables 91
• Analysis and Findings 92
• Summary of the Findings 100
16. Analysis of Findings 102
• Comparison of Key Findings and Key Themes 102
• Additional Key Findings and Outcomes 105
• Summary of the Key Findings 106
• Principle Findings 107
17. Conclusion s and Recommendations 112
• Data as a Key Strategic Resource 112
• Enterprise Resource Planning and Competitive Advantage 113
• Enterprise Resource Planning Maturity Conclusions 115
• Quality Data as a Competitive Advantage 117
• Data Governance and Corporate Governance 117
• Summary 119
• Conclusions Drawn from the Key Findings and Principle Findings 119
• Final Conclusions and Recommendations 121
References 127
Appendices
1a. Qualitative Analysis Framework 1
1b. Qualitative Analysis Framework 2
2 Analysis of Key Findings
3. Analysis of Key Findings and Key Recurring Themes Related to the Conceptual
Framework

5
List of Abbreviations
BPR Business Process Reengineering
DAMA The Data Management Association
DBA Doctor of Business Administration
DMAIC Define, Measure, Analyse, Improve and Control
DMBOK Data Management Book of Knowledge
DWP Department for Work and Pensions
ERP Enterprise Resource Planning
GDP Gross Domestic Product
GRC Governance, Risk and Compliance
IS Information Systems
KPI Key Performance Indicator
NTU Nottingham Trent University
PC Personal Computer
PDCA Plan, Do, Check, Act
POP Purchase Order Processing
R&D Research and Development
SOP Sales Order Processing
TBA To Be Agreed
TQM Total Quality Management
UK United Kingdom

6
Acknowledgements
I would like to thank my supervisors Professor Carole Tansley and Professor Alistair Mutch
for their advice, support, encouragement, patience and expert guidance without which I would
not have completed this programme. Thanks also go to the staff of Nottingham Business
School for their support and in addition my fellow members of Cohort 7, in particular those
who have stayed the course, in the hope we will remain firm friends for life.
I would also like to acknowledge the contribution of my colleagues within Remploy, in
particular Nigel Hopkins who has provided fantastic support throughout this entire
programme.
I am also grateful for the assistance provided by fellow members of the International
Association for Information and Data Quality (IAIDQ), together with other members of the
data/information quality fraternity.
And finally I wish to acknowledge the tremendous contribution from my family, my wife Stella
and my grown up children, who will now be very grateful the word ‘document’ will no longer be
part of my every day vocabulary.

7
ABSTRACT This research has identified a gap in the literature surrounding the process of improving and
sustaining the quality of data within enterprise resource planning and information (ERP)
systems. The study not only established firmly that quality data is an absolute necessity for all
organisations, none more so than those operating ERP systems, but identified that for any
improvement process to be worthwhile it must gain some degree of sustainability. For this
reason this study has attempted to discover the means by which the quality of data can be
improved but more fundamentally become embedded within an organisation. A detailed
review of the literature was undertaken which unearthed rich material in particular around the
concept of data quality and its application within business systems, from which a correlation
was established between the concepts of a planning and information system and that of a
product manufacturing system. A conceptual framework was then developed based upon
three conceptual elements seen to be key to any data quality programme namely: people,
processes and data.
A qualitative study was undertaken within the researcher’s own organisation Remploy,
employing an action research/focus group approach aligned to a data quality improvement
initiative that was already in place within the organisation. A series of site meetings and
conference calls took place embracing forty eight of the fifty four factories together with seven
business groups. A quantitative survey was then undertaken using a web-based self-
administered questionnaire distributed to a number of the researcher’s colleagues within
Remploy. The findings from both the qualitative study and the quantitative survey provided
unique material in terms of key findings and themes. A number of principle findings then
emerged relating to: the significance of the role of a ‘champion’ at various levels within a
project; the importance of measurement, reporting and feedback relating to any improvement
process; the necessity for systems and the people that use them to be allowed to mature; and
the manner in which peoples’ perceptions and attitudes toward data and data quality can
have considerable degrees of inconsistency.
In conclusion it is felt that the outcomes of this study have the potential to both improve and
sustain quality data within enterprise systems when applied to practical business and
professional settings, whilst also providing the academic community with the promise of a
contribution to the body of knowledge

8
1. INTRODUCTION AND OBJECTIVES Introduction There has been extensive interest in the nature of knowledge within the literature, largely
related to the growth of the knowledge economy (Davenport and Prusak 1997; Davenport, De
Long and Beers 1998; Hislop 2005; Orna 2005; Mutch 2008). The focus of a great deal of this
investigation into knowledge management and the learning organisation has been related
mainly to tacit forms of knowing Lave and Wenger (1991); Nonaka and Takeuchi (1995);
Wenger (1997) and within this arena of the research, the question of data has tended to be
rather overlooked. Other forms of enquiry however have attempted to address this issue
particularly within the context of management planning and information systems (Davenport
1998; Davenport, Harris, De Long and Jacobson 2001a; Galliers and Newall 2001; Davenport
and Harris 2002; Newall, Huang, Galliers and Pan 2002; Davenport, Harris and Cantrell
2004). From this research a realisation has grown that organisations that are able to collect,
analyse and act on data in a strategic manner, are in a position to gain a competitive
advantage within their industries, leading in some cases to domination in these areas
(Davenport 2006a). This form of information management known as ‘analytics’ stresses that
successful organisations are those that take action from their information to inform their
strategic decision making Davenport (1998); Davenport, Harris, De Long and Jacobson
(2001); Davenport (2006a); Davenport and Harris (2007) Davenport (2009), establishing
along the way a ‘fact-based culture’ (Harris 2005a; Harris 2005b; Harris 2007). If this ever
expanding focus on ‘intelligent’ business intelligence and management information is so
crucial to organisational strategy, then the requirement to have quality data becomes even
more paramount in manufacturing planning Gustavsson and Wanstrom (2009: 326) as well as
information systems (Davenport, Harris and Cantrell 2004: 23; Stenmark 2004: 1; Economist
Intelligence Unit 2006: 2, 16; Foley and Helfert 2010: 477; Davenport, Harris and Morison
2010: 1).
Extensive literature has identified the high costs of low quality data and the cost of poor data
quality (COPDQ) (Redman 1995; English 1998; Redman 1998; Loshin 2001; Redman 2002;
Redman 2004; English 2009). Redman (2001: Table 8.1) identified that firms may lose
upwards of 10% of revenues due to poor operational data, together with other serious
consequential effects relating to tactical decision making and strategy generation. A report
from The Data Warehouse Institute estimated that data quality problems costs US business
$600 billion a year (5% of the American GDP) in postage, printing and staff overhead costs
alone, whilst the majority of the senior managers in those companies affected remained
unaware (Eckerson 2002: 3). Findings from the PricewaterhouseCoopers Global
Management Survey, published at the end of 2004, identified that 75% of those surveyed
reported major problems resulting from faulty data, half reported incurring additional costs
resulting from the need to carry out extra internal control work, whilst a third had been forced
to delay new system implementations (Informatica 2005: 2). There were also predictions that

9
during 2006/2007 more than half the data warehouse projects would have only limited
success at best (Informatica 2005). A report published jointly by Dun and Bradstreet and the
Richard Ivey School of Business (2006: 1) forecasted that critical data within at least 25% of
the Fortune 1000 companies would continue to be inaccurate and that “every business
function will have direct costs associated with poor data quality” (Dun and Bradstreet and the
Richard Ivey School of Business 2006: 2). A survey conducted by the Economist Intelligence
Unit on behalf of SAP and Intel reported that 72% of the survey respondents said their data
was sometimes inconsistent across departments Economist Intelligence Unit (2006: 9) and
that workers frequently made poor decisions because of inadequate data (Economist
Intelligence Unit 2006: 21). More recently English (2009: 4-15) outlined a catalogue of
corporate disasters emanating from poor quality business information amounting to ‘One and
a Quarter Trillion Dollars’ (English 2009: 15). During 2009 a survey of 193 organisations
sponsored by Pitney Bowes, 39% of which had revenues in excess of US $1 billion, reported
that a third of the respondents rated their data quality as poor at best, whilst only 4% reported
it as excellent (Information Difference 2009: 4). A further survey found that less than one third
of organisations regularly monitor data quality (Hayter 2010: 22). A Gartner report stated that
“Through 2011, 75% of organisations will experience significantly reduced revenue growth
potential and increased costs due to the failure to introduce data quality assurance” (Fisher
2009: 6). Conversely an Accenture study suggested that companies who are able to gain a
better understanding of their customers, may be in a position to enhance their operating
margins by up to six percent (Davenport and Harris 2002: 30).
The Focus of this Research All the research carried out within this study, together with one’s personal and professional
experiences, substantiates the premise that data quality is of paramount importance to the
efficiency and effectiveness of any organisation, none more so than those operating
enterprise resource planning and information systems. For this reason this study will attempt
to discover the means by which the quality of data can be improved, but more fundamentally,
become embedded within an organisation. Without the latter, any gains emanating from the
former will be merely marginal or short term at best.
Data encompasses all organisations and enterprises, together with all aspects of everyday life
and therefore its quality has serious implications for everyone. Document One identified and
developed the concept of data quality per se and then proceeded to place this within the
context of an enterprise resource planning and information system encompassing a multi-
business/multi-site operation, employing disabled people. Within Document Two a conceptual
framework was developed from a comprehensive review of the literature, combined with one’s
own experiences. A correlation was also identified between the concepts of a planning and
information system and that of a real life product or service manufacturing system both

10
comprising inputs, processes and outputs. Document Three expanded upon these concepts
by examining further the quality management principles of initial error prevention, the
identification and elimination of the root causes of data defects, combined with data cleansing
and housekeeping processes. Research was carried out at a number of sites within the
researcher’s own organisation Remploy employing the use of focus groups in conjunction with
an action research approach utilising process mapping, to study the manner in which data
interacted with business processes to provide information to assist in detecting data and
process problems and in identifying the ultimate ownership and responsibility. Document Four
attempted to test the validity of these concepts by way of a self-administered questionnaire
distributed to over four hundred data quality professionals across the world. Whilst the
number of responses (29: 7%), was below initial expectations, there was reason to believe
that the overall response rate was no worse than similar surveys carried out within this field. A
summary of the findings indicated a high level of positive replies (76%-96%) in support of
these concepts and whilst one has to balance this against the low response level, it was felt
that the findings ‘indicated’ that there was substance to their overall validity.
Data Quality Defined
The definition of Data Quality employed within this research, was developed during Document
Two from an extensive review of the literature as; “Having the right and correct data in the
right format, in the right place, at the right time, by having one single version of the truth
across the enterprise”- being an amalgam of (Redman 2004: 2; Redman 2005: 1; Griffin
2005: 2; Deloitte: 2006: 1; Williams and Beyer 2006: 2). A fundamental element of the survey
conducted during Document Four, was the attempt to validate this definition. Of the
seventeen specific responses, twelve (71%) were supportive whilst the remaining five
provided alternative or additional definitions. This definition was also tested again within the
survey conducted for this document- Section 15 Page 100. Of the twenty responses, fifteen
(75%) were in agreement whilst the remaining five sought to add remarks and observations
on accuracy and quality. There were no negative comments received. As in Document Four
the replies were essentially positive and supportive. The placing of this definition within the
overall context of data and the management of data is also discussed later within this
document. It must be stressed that within this research the term ‘data quality’ as defined
above, applies generically to both the quality of data and the quality of information. The
concepts of data and information together with knowledge will also be discussed in detail in
later sections.

11
Enterprise Resource Planning Having established the objective of this research, as the attempt to determine the means by
which quality data can be created and sustained within a diverse enterprise resource planning
and information system, it is essential that an overview of enterprise resource planning as an
entity be framed.
“An enterprise resource planning (ERP) system is a packaged business software system that
allows an organisation to automate and integrate the majority of its business processes, share
common data and practices across the entire enterprise and produce and access information
in a real-time environment” (Deloitte 1999: 2). Figure 1 below highlights the integrated nature
of an ERP structure or an ‘enterprise system’ Davenport (1998: 124), a model which is
basically a series of generic business solutions which attempt to reflect how businesses
potentially operate Davenport (1998: 125), seen by some as a political programme for
organising change (Pollock and Williams 2008: 95).
Managers andstakeholders
Employees
Customers Suppliers Sales force Back-office and customer administrators service reps and workers
Centraldatabase
Humanresource
managementappications
Reportingapplications
Serviceapplications
Sales anddelivery
applications
Financialappliactions
Manufacturingapplications
Inventoryand supplyapplications
ANATOMY OF AN ENTERPRISE SYSTEM
At the heart of an enterprise system is a central database that draws data from andfeeds data into a series of applications supporting diverse company functions. Using asingle database dramatically streamlines the flow of information throughout a business
Figure 1. The anatomy of an enterprise system
Davenport (1998: 124)

12
Davenport (1998: 123) claimed that a good enterprise system can act as a technological tour
de force with a single database at its core, coordinating and supporting virtually all of a
company’s business activities, but warned that if a company’s systems are fragmented, its
business will be fragmented also. Diverse or ‘multi-site’ ERP systems can be complex
applications operating across multiple locations, incorporating strategic business structures,
intricate software configurations, working on multiple technical platforms all of which provide
organisations with serious management challenges Markus, Tanis and Fenema (2000: 43-
46), requiring strong executive management and decision making (Mann 2003: 32-33).
Enterprise resource planning as a subject figures prominently within the literature; in generic
terms, Klaus, Rosemann and Gable (2000); Al-Mashari (2003); Shehab, Sharp, Supramaniam
and Spedding (2004); Botta-Genoulaz, Millet and Grabot (2005); Jacobs and Weston (2006);
within implementation strategy and issues, Ross (1999); Markus, Tanis and Fenema (2000);
Al-Mashari, Al-Mudimigh and Zairi (2002); Ho, Wu and Tai (2002); and post implementation
improvements, (LaMonica 1999; Wallace and Kremzar 2001; Willis and Willis-Brown 2002;
Nicolaou 2004; Outten 2005). However within this context, any in-depth focus upon the quality
of the data appears to be rare (Vosberg and Kumar 2001; Wallace and Kremzar 2001; Willis
and Willis-Brown 2002; Nelson 2002; Xu, Nord, Brown and Nord 2002; Davenport, Harris and
Cantrell 2004: 23; Gustavsson and Wanstrom 2009: 325).This extreme bias within the
literature towards initial-phase related ERP research is perhaps best illustrated by Pollock and
Williams (2008:84) and Williams and Pollock (2009:3) who highlighted the fact that over
ninety five per cent of the six hundred plus articles contained in the ERP Research Group
online bibliography may broadly be described as ERP implementation studies. Such has been
the fixation with ‘early stage’ ERP, that most of the research has focussed mainly on single
site operations Williams and Pollock (2009: 2), of a short term impact, snap shot type studies
of fleeting durations which lack real maturity and as a consequence may have severe
limitations (Pollock and Williams 2008:84 and Williams and Pollock 2009:3). Even the
literature which embraces enterprise resource planning within the themes of total quality
management (TQM) and business process reengineering (BPR), which will be discussed in
detail later within this study, neglected to emphasis the importance of data quality (Akkermans
and van Helden 2002; Schniederjans and Kim 2003; Laframboise and Reyes 2005). One has
to question whether this is a serious omission on behalf of the authors of the articles who
continually fail to identify the significance of data quality within an ERP/TQM concept, or the
failure of the data quality fraternity to get its message across to ERP and TQM researchers.
Galliers and Newell (2001: 613) did suggest a refocusing on the management of data within
ERP systems rather than concentrating on knowledge per se, especially within diverse and
dispersed organisations, but omitted to make any direct reference to data quality.
The complex nature of the ‘Davenport model’ illustrated above with its integrated modular
processes and activities, attempts to serve all the departments within an enterprise from a

13
single database, providing a single version of the truth throughout the entire organisation by
means of a unified system; a form of processual behemoth. The model illustrates how the
functions of the organisation are interrelated whereby the effect of a single transaction has a
knock-on effect within or between departments of the enterprise. An ERP system operates
horizontally across an organisation working within and between functions, departments and
businesses, whilst in contrast most organisations manage and control vertically. This potential
management misalignment may cause control problems if not recognised and eliminated, as
data and information move from one department or function to another. Consequently there
has to be ownership of this data or information that is passed or forwarded onwards.
Organisations must recognise this potential incongruity and manage the data and information
to match the required processes and data flows. This should be viewed as a
supplier/customer relationship with the same responsibilities towards customer relations and
satisfaction as exists or should exist in external commercial relationships. The model can
become even more complex where the ERP system encompasses more than one
organisation, crossing numerous countries with differing currencies, languages and time
zones. Managing such complex data flows and processes is paramount. It is essential that
these issues are addressed at the optimum level highlighting the absolute necessity for
having some form of Data Governance policy.
Whilst the ‘ERP model’ is expanding further and further into multifarious organisational types,
the heart of most enterprise systems are commercial transactions involving the supply of
goods or services, encompassing sales, purchasing, manufacturing and distribution, all of
which have financial implications. A customer order for a manufactured product will progress
from an initial enquiry to final completion and payment, as the physical processes of order
satisfaction, inter-act with the data flows and processes within the ERP environment. In many
ways the ‘system’ drives the physical processes, indicating what, when and how, to purchase,
manufacture, supply and distribute products to enable customers’ requirements to be
satisfied, in addition to recording all of the financial transactions and results. An aspect of the
research carried out for this project has been the attempt to identify the impact that these
elements have upon the quality of the overall data. It is intended that this model will apply
equally to the provision of goods and services in both commercial and not-for-profit
organisations.
Remploy A considerable portion of the detailed research undertaken as part of this entire study has
been carried out within the researcher’s own organisation, Remploy. Whilst the fundamental
aim of this entire research is to add to and develop the pool of knowledge within professional
and management practice, it will be useful to place the company within this overall context.

14
Remploy is the largest provider of employment opportunities for disabled persons in the UK,
currently employing over three thousand disabled people in over sixty individual factories and
offices across the entire country, whilst placing over 10,000 others into external open
employment, a figure which may expand by up to a factor of seven over the next five years. A
Baan/Infor ERP system was implemented over ten years ago and whilst there have been
many benefits overall there is still considerable scope for further improvements especially
within the areas of data quality and system complexity. Maintaining sustainable quality data
within any ERP system can be problematical at best, but when one factors in an organisation
with twelve individual business streams operating within such diverse areas as automotive,
electronics, packaging, PC recycling, healthcare, furniture, in addition to manufacturing
protective clothing against nuclear, chemical and biological threats for the UK military and
police, the overall picture can become very complex with a high potential for errors and
problems. This position is complicated even further when it is then superimposed upon the
current network of over fifty separate factories with over 800 active users, over 500 of which
are disabled in one form or another. This level of complexity within an organisational
structure, together with such a unique ERP community, provides a valuable environment
within which to undertake this research, generating knowledge to benefit both the
management and professional communities in general, as well as similar disabled
employment organisations.
Review and Development of the Research Questions The ways in which the research questions have evolved during this study reflects the
maturing nature of the research. Questions one to three emerged from the proposal and
planning process within Document One, whilst questions four to six were developed from the
literary review and conceptual framework in Document Two. The total quality management
philosophy of ‘right first time’ is a guiding principle that has influenced one’s approach to this
subject and from this two further questions, seven and eight, emerged during Document
Three: They are all reproduced below to provide a vision of this evolutionary process
1. What are the attributes of data quality with particular reference to ERP?
• What is data quality?
• How does it impact upon enterprise resource planning?
2. What is the range of factors that impinge on data quality?
• What are the elements that effect data quality?
• How can data quality be measured?
• What levels of data quality are necessary?
• What do organisations need to do to improve and sustain data quality?

15
3. Are there specific factors that apply to these in the context of Remploy and related
organisations?
• How can the study be best related to Remploy?
• Does Remploy’s position make it unique or can common practices be applied
with or without modifications?
4. What is the impact of poor quality data?
• What is the true cost?
• What are the benefits of improved data quality?
6. How can a data quality improvement programme best be implemented with regard to?:
• The management of organisational change
• The management of organisational politics and culture
• The education, training and development of people
• Remploy-specific issues (tie in with 3 above)
7. How can an organisation improve data quality by preventing problematical or
erroneous data from entering the data flow at source?
8. How can an organisation maintain and sustain any improvement identified and
implemented from the answers to the above question?
A further question- No 5 ‘How can the concept of ‘World Class’ be related to ERP and
Information?’ was rejected within Document Four as being too vague and imprecise.
Given that the stated aim of this study has been the investigation as to how data quality
process improvements can be sustained per se, then a review and refining of these research
questions is of vital importance. The research questions have so far been depicted in
somewhat of a linear nature, but now it is felt that a degree of structure and prioritisation
needs to be applied together with a pruning of those questions which are not seen as totally
fundamental to the final focus of this document. Document Three inspired the development of
research questions seven and eight and Document Four confirmed these as the main
priorities at that time. However it is worthwhile debating the validity of both these questions in
the light of ongoing research and experiences. Question seven states “How can an
organisation improve data quality by preventing problematical or erroneous data from entering
the data flow at source?” This encapsulates the total quality concepts “getting it right first
time”, “up-front error prevention”, “up-stream solutions”, data defect prevention” and “root
cause analysis and prevention”. However poor source data is not the only cause of data
quality problems. It is appreciated that this question may be geared more towards the
‘intrinsic’ data dimensions relating to accuracy/validity, believability and objectivity, rather

16
towards timeliness, relevancy, accessibility or security and those data quality problems can
pervade the entire dataflow chain, not just at the beginning. Whilst one is fully aware of the
dangers of attempting to take a too wide a view within a single research project, one can
argue that question eight “How can an organisation maintain and sustain any improvement
identified and implemented from the answers to the above question?” is too restrictive and the
final critical research question may be better stated as:
“How can an organisation create an environment where data quality improvements can be
sustained?”
People, Processes and Data Fundamental to the progress made so far has been the identification, within Document One,
of three conceptual elements seen to be key to any data quality programme namely: People,
Processes and Data. This was then developed further within Document Two to form the basis
of the conceptual framework- Figure 2 page 18. This research has so far indicated that there
are a myriad of methods and solutions to improve data quality in both the areas of
transactional and master data at various levels embracing both process and people, with
varying consequences and degrees of success. Nicholaou (2004:44) identified that lack of
people training and failure to recognise the effects of an ERP system on current business
processes are the most important culprits in problematical implementations. Whilst all such
initiatives have enormous merit in themselves, they will not generate long term success or
influence unless they can be embedded. This study takes note of these theories and practises
that can improve and create quality data, but the main focus will be on attempting to identify
how an organisation may be able to create an environment where such data quality
improvement initiatives may be sustained. In this it accepts that there must be a climate
where such improvements should be sought-after, generated, supported and implemented
with adequate resources.
Theory and Practice The objective of any DBA is to improve business, management and professional practice, by
developing the students’ personal, intellectual and academic abilities, together with their
personal managerial practice, by studying work based issues or problems (NTU DBA Course
Members’ Handbook 2005: 6). By acquiring new knowledge, the student is in a position to
bring about professional change, which in turn has the potential to create new organisational
knowledge. This is unique to the ‘professional’ doctorate, but there is in fact further potential
to reciprocate the process by making such findings available to be incorporated into the body
of academic knowledge. Over forty years ago Simon (1967) argued that business schools
have a dual mission, to develop new knowledge that advances science and improves practice

17
Simon (1967:1) and to address the problem of bridging the gap between the social system
that develops scientific knowledge and that which consumes it, i.e. professional practice
(Simon 1967:16). Attempts to bridge this gap between the fields of theory and practice have
generated considerable discussion within the literature. Rynes, Bartunek and Daft (2001: 340)
described the wide gap existing between research and management practice, arising from the
reluctance of organisational executives to take account of academic research findings and the
unwillingness of academics to undertake practice-related research. Van de Ven and Johnson
(2006a) focussed on the relationship between theory and practice and proposed a method of
‘engaged scholarship’ Van de Ven and Johnson (2006a: 803) to enable practitioners and
researchers to co-produce knowledge that can advance both theory and practice. This was
debated further by McKelvey (2007) and Van de Ven and Johnson (2006b) culminating in Van
de Ven (2007). One believes that this research has identified a gap in the literature and
therefore has the capacity to add to the current body of managerial and professional
knowledge within the realm of planning and information systems. This will be discussed later
in this document. There is also an intention that such new knowledge should also be made
available to benefit academic and science theory.
The first four documents have unearthed and developed certain essential key concepts and
frameworks and it is now essential that these be defined, as they will form the basis for the
further research and the development of the final findings, conclusions and recommendations.

18
2. CONCEPTUAL THEMES AND FRAMEWORKS The conceptual framework and the major conceptual themes were developed in the main
within the first two documents and even after continuous re-appraisal during the subsequent
research they have remained largely robust, subject to minor refinements and modifications.
Conceptual Framework The conceptual framework depicted in Figure 2 below sets Data Quality firmly within the
overall context of Data Governance as part of an enterprise-wide data strategy and acts as a
route map through the on-going research minefield.
Data Quality Project
Operational/Transactional
Data
MasterData
Management
ProcessImprovements
Education &Training
PersonalDevelopment Accessibility
ImprovementProcess
RawData
Data Governance/Data Strategy
DataCleansing
ProcessImprovement/re-
engineering(defect prevention)
Data in Context(within an ERP
database)
Information
Data Inspection& Correction
(scrap & rework)
DataQualityProcess
Data Processes People
Housekeeping
Cultural/Organisational
Change
Figure 2. Conceptual framework
The initial triple inter-linked framework was developed from an intensive review of the
literature and comprises the ’Data’ elements of master data management, together with
operational and transactional data; ‘Process’ review and improvement initiatives running in
tandem with the necessary system housekeeping procedures; together with the ‘People’
elements of education and training, personal development aligned with accessibility in the
form of Assistive Technology (hardware and software techniques developed in order to assist
visually or physically disabled persons gain access to information technology within the
working environment). During the research for this study it became apparent that any
enduring improvement is predicated on making lasting changes to both processes and

19
individuals’ behaviour and to bring about this, there has to be cultural and organisational
change mainly through the interaction of leadership and management at all levels. The
conceptual framework has therefore been updated to place ‘Cultural and Organisational
Change’ in a position to influence the concepts of ‘People’ and ‘Processes’ as well as the
overall ‘Improvement Process’ element. The framework also identifies how the process of
producing quality information derived from quality raw data has parallels with a generic
product manufacturing process. This useful analogy between a production process and an
information system also has strong roots in the literature (Strong, Lee and Wang 1997:104;
Wang 1998: 59)
Major Concepts People, Processes and Data
The fundamental inter-relationship between People, Processes and the Data, which has been
a guiding principle from the very start, requires that any attempt to improve the overall quality
of data within any organisation must be centred on people whether data suppliers, processors
or information customers; the processes that receive, handle, action and pass on data and
information; as well as the data itself where ever it sits within the data cycle of input, process
and output. Data quality improvement is not just about fixing data or improving quality within a
single business application or process, but also about taking a more expansive and forward-
looking enterprise-wide approach. This must involve addressing cultural issues, initiating both
short and long term process and procedural improvements by a step-by-step, incremental
approach, whilst ensuring that the data conforms to appropriate specifications or
requirements. In this way any improvement initiative has an opportunity to be sustained. It has
to be appreciated that there cannot be a ‘one size fits all’ remedy to embedding organisational
improvements at all levels, but rather to identify appropriate solutions to fit individual
situations and circumstances. One accepts that data quality problems are not created
intentionally by people, but more by the failure of the surrounding processes whether these
are system related or individual related involving lack of education, training, personal
developments or purely the person being placed in a position for which they are not suited.
There is strong evidence to indicate that solutions exist to improve the quality of data,
emanating from both the academic fraternity and the commercial world and this project
attempts to embrace both these arenas in the true spirit of a DBA. This research therefore
has not only a strong academic base but also has major practical implications which leads to
a further key theme, that of aligning robust theoretical and academic concepts, within the
operating environment of a real life organisation, in order to implement sustainable data
quality improvements. Both Van de Ven and Johnson (2006a) and Van de Ven (2007)
focussed on this relationship between theory and practice and how each discipline may
inform and thereby benefit the other, within a single project. It is also recognised that research

20
in this specific area may have implications for other functional sectors where process
improvements programmes can be applied.
Generic Process Model
As indicated earlier, strong parallels have been drawn in the previous documents between the
concept of a planning and information system and that of a manufacturing system (Strong,
Lee and Wang 1997:104; Wang 1998: 59 and latterly Pham Thi and Helfert 2007: 6). The
principle elements are highlighted below within what may be termed a Generic Process Model
to compare and contrast the various elements:
Generic Manufacturing Generic ERP
Process System Information System Environment
Input Raw materials Raw data People- Processes- Data
Process/
Operations Production line Information system ERP Database
Output Physical products Information products Information-People
The ‘Manufacturing’ or ‘Factory’ analogy is a useful model in that it takes a conceptual over-
view of both generic manufacturing and information systems to identify ways in which
established quality principles may be applied to the input and process elements ensuring that
information products in the form of outputs conform to the requirements of their relevant
customers. Strong, Lee and Wang (1997:104) identified three key roles within a data
manufacturing system:
Data Producers: Generate data
Data Custodians: Manage, store and process data
Data Consumers Use data and information
Within this context, however, one needs to be aware that the end products from
manufacturing and information systems have differing implications, with the information
production process viewed as potentially a more complex process than its physical equivalent
(Pham Thi and Helfert 2007: 6). The outputs from a factory are unique one-off products which
can be consumed only once, whether they are finished goods or components requiring further
work. The overall effects of poor manufacturing are somewhat limited, normally requiring a
scrap and re-work operation. Some longer-term detrimental implications may occur including
customer dissatisfaction or product contamination, but even these will normally be relatively
localised and time-constrained. Output in the form of data or information products can be
consumed in an infinite number of ways and be re-cycled continually. Poor data can act like a
virus infiltrating all aspects of an enterprise’s operations, re-occurring again and again, or lay
hidden undetected within sub-systems in perpetuity. Data may also be used in ways for which

21
it was not created or intended, causing potential misalignment, errors or misinterpretations,
resulting in potentially dangerous or catastrophic decision making (Senge 1992: 7; Orna
2005: 44, 144-150; Mutch 2008: 53).
Working definitions Within the literature there are numerous studies that fail to discriminate between data and
information Helfert (2001: 1), indeed a number of articles Strong, Lee and Wang (1997: 103);
Wang (1998: 59); Wang, Allen, Harris and Madnick (2002: 1) stated specifically that the terms
data and information may be used interchangeably. In a recent article, Madnick, Wang, Lee
and Zhu (2009), this debate was once again discussed, affirming that there was still no real
consensus between the two terminologies, although a tendency exists to use data to refer to
technical issues and information to be applied to non-technical issues (Madnick, Wang, Lee
and Zhu 2009: 2:2). However, whilst it has been established within the context of this
research that the term ‘data quality’ refers to both the quality of data and information, it is
important to establish working definitions for these individual integral elements to avoid
confusion and to place them in their true context. The Generic Process Model above also
identifies where data and information reside within the ERP and Information System models.
Data
Fox, Levitin and Redman (1994: 11-12) identified a number of definitions on the notion of
data, citing: Blumenthal (1969); Fry and Sibley (1976) who both defined data as a set of facts.
Davis and Rush (1979); Yovits (1981) referred to the way it can be obtained, as the results of
measurement and observation; Dorn (1981) defined data as “the raw material from which
information is developed”, whilst Langefors and Samuelson (1976) and Burch (1983) referred
to data as ‘symbols’. The article, Fox, Levitin and Redman (1994: 11-12), then focused on the
approach developed by the database research community citing the works of Mealey (1967);
Kent (1978); Tsichritzis and Lochovsky (1982) and Loebl (1990) from which a framework of
‘data items’ were devised, comprising entities, attributes and values. Davenport and Prusak
(1997: 9) defined data as “simple observations of the world, easily structured, captured,
transferred and quantified” and Davenport and Marchand (2000: 165) as “signals about
human events and activities”. Whilst according to Brackett (1999: 2) data may be viewed as
individual raw facts out of context, without any meaning. Within the context of this research,
data is viewed as the raw material for an information manufacturing system and is best
represented by the English (1999: 468) definition: “The representation of facts, the raw material from which information is produced, when it is
put in a context that gives it meaning”

22
Data in an ERP Database (Data in Context)
Data in context is data within the database and is no longer raw data, but it is not yet
information. By residing within an ERP system it is easily identified as such whether it is
master or transactional data. Brackett (1999: 2) described data in context as facts comprising
raw data that can readily be understood, but unlike information has no relevance or time
frame. It is data that is arranged and labelled.
Information
An article published in 1948 by Claude Shannon, ‘A Mathematical Theory of Communication’,
helped establish the discipline of information theory, centring on the engineering problems of
transmitting information over noisy communication channels or telephone lines (Wand and
Wang 1996: 87; Sveiby 1998: 2). Shannon viewed information as merely the quantitative
measure of communicative exchanges, concentrating solely on the transmission of messages
within a telecommunication system environment, attempting to ensure that the message
received by the recipient was exactly or as close as possible to that transmitted by the sender
from the source (Losee 1998: 274). The focus of Shannon’s study was centred upon the
accuracy of the transmission and reception rather than the accuracy of any perceived
meaning and subsequent understanding. Working within the fields of electronics and
information science Losee (1998: 258) defined information as the transmission of knowledge
produced by the interaction of processes, representing the sum of the value of the
characteristics of these processes (Losee 1998: 259). This process theme is depicted in
Figure 3 where the value of the output is informed by the input and its process Losee (1998:
265) mirroring the Generic Process Model discussed earlier.
Input Output Value of Output
is Information
Input Process Output ------------- about Input
& Process Input Output
Figure 3. Information as an output of a process
Losee (1998: 265)
Peter Drucker has been credited with defining information as “data endowed with relevance
and purpose” Davenport and Prusak (1997: 9), whilst Marchand (2000: 4) described
information as the way people in business express, represent, communicate and share their
knowledge with others to accomplish their activities and objectives. Davenport and Marchand
(2000: 165) suggested that information is the outcome of the data as humans interpret and
contextualise it, whilst Brackett (1999: 2) viewed information as a set of data in context that is

23
relevant to one or more people at a point in time or for a period of time. Boland, Tenkasi and
Te'eni (1994: 459) identified the correlation between information and meaning as …..”the task
of information systems is to support human inquiry as a process of subjective, interpretive,
meaning making” and extends this further by stating that “Inquiry is the act of producing
knowledge” (Boland, Tenkasi and Te'eni 1994: 462). Mutch (1996: 58) and Mutch (1997: 381)
identified earlier definitions from Boland published in 1987 that information “is not a resource
to be stockpiled as one more factor of production. It is meaning, and can only be achieved
through dialogue in a human community”. Also “Information is not a commodity. It is a skilled
human accomplishment” and “information is a thing to be searched for, stored and identified”
(Mutch 1999: 327). Marchand (2000: 25-27) identified four ways that companies may use
information to create value for business by: minimising risks particularly in the areas of
marketing, finance, operational and legal; reducing costs by improving processes and
transactions; adding value to customers and markets; and finally creating new realities by way
of innovation and R&D.
Data can be stored in a system database but information cannot. The data becomes
information when it reaches the public domain, that is, in the possession of the recipient from
which one is then able derive relevance, meaning, purpose and knowledge.
Knowledge
Knowledge is internal within a person and only people can derive understanding and only
people can be aware of meaning. Knowledge exists only in people’s minds and reflects the
outcome of the connectivity between a person’s experiences and skills, with incoming
information messages.
Checkland and Howell (1997: 86-92) proposed a single model encapsulating the process of
turning data into knowledge detailed in figure 4 below.
Selected Meaningful Larger longer living
Facts or created structures of meaningful
Facts Facts Facts
Data Capta Information Knowledge
Figure 4. Data, capta, information and knowledge- three step process
Checkland and Howell (1997: 86-92)
The three-step process commences with data, comprising a mass of raw facts, from which
part of the data is selected for attention as being useful and relevant and thereupon becomes
known as ‘capta’ (meaning ‘to take’); this is then converted into information by having some
form of meaning in context attributed to it albeit of a short term nature; the process is
completed when information gains a degree of longevity within the mind of the recipient in the
form of knowledge. The example can be used to model any data-to-knowledge environment.

24
The act of creating information and knowledge is seen as a human act, outside the scope of
any machine. When applied to the context of an enterprise resource planning, or any other
database system, it is only the processed capta (selected data) or (data in context as
described above) that resides within the database. The model is useful in that the ‘capta’
stage provides a clear division between raw data and information particularly within a non-
database environment, where the distinction may otherwise become blurred. It should be
noticed that the higher arrows move the reader from the left (data) to the right (knowledge),
then the lower arrows continue this clockwise motion returning the reader leftwards from
knowledge back to data Checkland and Howell (1997: 86-92). In a similar way Mutch (2008:
63) suggested that it is knowledge that guides the researcher towards the data that is
required and the information that will be extracted from it.
“Today’s economy runs on knowledge” (Wenger 2002: 139). “Knowledge is information
combined with experience, context, interpretation and reflection and is a high-value form of
information that is ready to be applied to decisions and actions” (Davenport, De Long and
Beers 1998: 43). Knowledge is information in peoples’ minds Davenport and Marchand (2000:
165) or “valuable information from the human mind, including reflection, synthesis and
context” Davenport and Prusak. (1997: 9), whilst Marchand (2000: 3) defined knowledge as
“our experiences, skills, expertise, judgement and emotions”.
Knowledge can be ‘tacit’ reflecting the knowledge within an individual or a collective such as
an organisation and is often contained within the subconscious. It cannot easily be shared but
has been found to be a strong foundation within the process of creativity and innovation.
Explicit knowledge on the other hand is knowledge that can be articulated and shared and
also it is claimed can be codified, stored and written down in manuals and procedures.
Nonaka and Takeuchi (1995: 62) recognised that knowledge is created through the
interaction between tacit and explicit knowledge comprising four modes of knowledge creation
namely; Socialisation (Sympathised Knowledge), Externalisation (Conceptual Knowledge),
Combination (Systematic Knowledge) and Internalisation (operational Knowledge) (Nonaka
and Takeuchi 1995: 72). The interactions between the four modes can invoke a ‘knowledge
spiral’ to create ‘organisational knowledge’, fundamental to which is the process of learning
(Nonaka and Takeuchi 1995: 72).
Lave and Wenger (1991) described a learning process whereby individuals work and learn
together in an informal way to achieve their common goals. This interactivity they term as
‘Communities of Practice’. Every individual is a member of some form of community of
practice whether they appreciate it or not Wenger (1997: 38), which will be essentially
unstructured without necessarily a beginning or an end. The common bond between the
participants is an informal shared passion and commitment towards a common joint

25
enterprise Wenger and Snyder (2000: 139) evolving into ‘Communities of Action’ Wenger and
Snyder (2000: 140), being an effective vehicle for knowledge-sharing and knowledge creation
(Hislop 2005: 70). According to Wenger (1997:38) ”Learning is the engine of practice and
practice is the history of learning”. One may suggest that if this concept of learning and
practice develops new knowledge to inform and improve individuals’ and organisations’
practice, then there may be opportunities in turn to inform theory in the manner suggested by
‘engaged scholarship’ (Van de Ven and Johnson 2006 and Van de Ven 2007).
Practical examples of the way the data to knowledge relationship can impact upon corporate
performance may be seen where organisations use ERP transaction-driven data, coordinated
with human-based information, to directly improve their marketing and enhance their
knowledge about their customers, to generate improved business results (Davenport and
Harris 2002:31). Davenport, Harris, De Long and Jacobson (2001b: 5) suggested a model for
turning transaction data into knowledge and results, by way of three elements comprising:
context, being the core organisational ingredients of strategy, skills, culture, and data; which
are then passed through the transformational element where the data is analysed to assist in
decision making; leading to the final outcome where action is taken to bring about change and
effect results.
Research Focus This discussion is extremely beneficial in establishing the interrelations between data,
information and knowledge and in that context, enriches this research. However it should be
noted that the literature tends to concentrate predominately on the outcomes, of information
and knowledge whether tacit or implicit. This is also the case with references to business
intelligence and management information applications which tend to be preoccupied with the
ability to be able to slice and dice information in a myriad of different ways. In contrast there
appears to be less interest in ensuring that the initial source material, data, and the processes
that generate the ‘outcomes’, are of sufficient quality and robustness to provide recipients with
meaningful enlightenment. This study attempts to take note of these discussions whilst
placing them within the context of the overall research focus, that of creating and sustaining
quality data within management, planning and information systems. Whilst highlighting this
apparent imbalance in the focus of the related research, one has to acknowledge that a rich
vein of material does exist around data quality, much of it unearthed during the literature
review. In the context of this study it will be useful to return to this area.
Important aspects of the initial Literature Review revisited As stated, Document Two carried out a thorough review of the literature surrounding data
quality. The process proved very enlightening in that it identified valuable and meaningful

26
material which has provided the strong foundation upon which one has been able to build, to
support this ongoing project; consequently a number of these articles are worthy of re-
iteration. Wang and Strong (1996) examined data quality through the concept of data
dimensions with particular regard to the requirements of data and information users,
customers and consumers. Wand and Wang (1996) analysed data quality in terms of
measuring deficiencies between two views of what is seen as the real world, comprising a
view of the world as seen through a direct observation of events and a view inferred from the
information system. Strong, Lee, and Wang (1997) identified the concept of a ‘data
manufacturing system’ and the notion of data producers, custodians and consumers. Wang
(1998) built upon this research in terms of an information system with inputs, processes and
outputs, whilst Lee Strong, Kahn and Wang (2002) proposed a methodology termed AIM
quality (AIMQ), using a 2x2 framework model to identify what quality means to information
consumers and managers. The methodology is useful in identifying problems, prioritising
areas for improvement and monitoring progress. Data quality was viewed by Pipino, Lee and
Wang (2002) as a multi-dimensional concept requiring a quality assessment process which
reflects such diversity using appropriate measurement, metrics and analysis. Assessing an
organisation’s data quality requires both a subjective and objective assessment. Both Orna
(1996) and Wang (1998: 59) described the final output of a data manufacturing system as an
‘information product’, being the visible vehicle by which information is presented for use either
on paper, in electronic form or in any other media, the ‘telling’ end of the scale (Orna 2001). A
number of these articles were referred to by Madnick Wang, Lee and Zhu (2009) who
presented an overview of certain examples of academic data and information quality research
carried out over the preceding twenty years.
Sustainability It will be beneficial at this stage to determine what is meant by ‘sustainability’ and define the
context within which the term will be used. In general it may be seen as the ability to maintain
the balance of a certain process or state in any system, viewed as either a ‘journey’ or a
‘destination’ within that system (Milne, Kearins and Walton 2006). The dimensions of
sustainability are normally taken to be environmental, social and economic and within these
three ‘pillars’ Adams (2006), they can be evaluated by means of quantitative reporting
measures amongst them indicators, metrics, benchmarks, indices and audits (Hak 2007).
The above definition refers to ‘maintaining the balance’ which therefore leads the discussion
as to what is intended by ‘maintain’ and ‘balance’ when applied to data quality improvements.
By using any form of measurement one is implying that any result must be evaluated whether
against a goal, target or even a general expectation, otherwise the metric is meaningless.
Within the context of this study ‘maintaining the balance’ or sustaining improvements within
this context has two possible meanings:

27
• Maintain the actual improvements made so far, from which there should be no
decline, based upon the current measured result. A stake in the ground as such. This
may be viewed as the ‘destination’ referred to above.
• Maintain the momentum of the improvements made so far, by continuing the trend
and thereby looking to improve the current measured result further in the future. An
incremental process and part of a ‘journey’, as against a final ‘destination’.
The latter definition which is seen as a continual process, best fits the basic initial premise of
this research.
Considerable discussion has already taken place within this study around the relationships
between Data, Processes and People. It will be beneficial at this stage to examine the
elements of each of these key fundamental concepts to analyse their drivers and enablers.
Whilst data as an entity, has been debated above, the following section will place Data and
the ‘Management of Data’ and Data Governance within the context of this overall research.

28
3. DATA, THE MANAGEMENT OF DATA AND DATA GOVERNANCE Considerable discussion took place within the previous section around data, information and
knowledge as entities and the efforts to develop explanations, sense and meaning to further
clarify each of these elements. This section takes a narrower perspective looking specifically
at the way data should be handled within organisations to ensure that it is both recognised as
a enterprise-wide asset and managed accordingly to release its full potential and thereby
maximise benefits to each organisation .
One view of data management is that it comprises all the disciplines related to managing data
as a valuable resource. The Data Management Association (DAMA Data Management Body
of Knowledge- DMBOK) DAMA (2009: 7) defined data management as “the development,
execution and supervision of plans, policies, programmes and practices that control, deliver
and enhance the value of data and information assets”. The DAMA Framework includes: Data
Governance; Data Architecture; Data Development; Database Management; Data Security
Management; Data Quality Management; Reference and Master Data Management; Data
Warehousing and Business Intelligence Management; Document Record and Content
Management and Meta Data Management (DAMA 2008:11). Within the context of this
research, one accepts that the Framework encompasses a great deal of the aspects
surrounding ‘Data’ but believes that ‘the term ‘Data Management’ is subordinate to the ‘higher
level’ concepts of the ‘Management of Data’ and specifically Data Governance itself.
One has played a major role in the restructuring of Remploy’s Data and IS strategy; in
particular drafting the initial Data Governance and Master Data Management policies and it
will be useful to place within the setting of this document, the paper setting out the basic
concepts (Table 1 below). This initial policy document passed through a number of iterations
prior to being approved by the Company’s Executive, having been reviewed by Gartner Inc
(Ted Friedman) with the comments: “Overall we believe your document is generally in line
with industry trends and best practices for defining a data governance program” (Gartner
2009: 2). It is now intended that these principles will be developed and applied across all of
the Company’s applications. The concepts behind these policies can also be applied to any
organisation.
The Management of Data and Data Governance The Management of Data Data is both an organisational resource and an enterprise-wide asset, as valuable as any
physical, financial or personal asset and therefore must be managed appropriately. Its sole
purpose is to serve the organisation to enable Remploy to attain its corporate objectives and
goals.

29
Data takes two main forms:
Master Data
Data about the core business entities:
People: Customers, Suppliers, Employees, Partners, Clients
Things: Products, Items, Assets (including Buildings and Plant), Financials
Places: Factories, Offices, Branches, Employers
Concepts: Contracts, Licences, Polices and Procedures
Transactional Data
Data relating to our operations as we conduct business around sales, deliveries, purchases
using the master data created above
Financial: Orders, Invoices, Payments and Revenues.
Work: Plans, activities
Logistics: Deliveries, Receipts
Employment Services: Job Progressions
For the purposes of this paper we are referring only to that data that interacts with any of our
IS systems
Guiding Principles
We need to establish first and foremost guiding principles around the management of data.
To be really effective we also need to identify and focus on those data sub-sets that hold real
value and/or potential risk, rather than attempt to manage ALL of the data fields, much of
which will be of low priority. This should be undertaken by establishing:
Ownership: Who has actual ‘ownership’ or ‘custody’ of the data on behalf of the
organisation as a whole and thereby has responsible for the ‘quality’
Responsibility: Those persons who are directly involved in any way with the entry, extraction,
manipulation of any part of the data (as data suppliers, processors or
consumers)
Management: Ensuring operational availability, security and business continuity- IS
Department
Accountability: Everyone within the organisation
Data Policies: To be set by the organisation together with the ‘owners’ or ‘custodians’
To ensure we follow these established guiding principles and work towards achieving our
objectives we need to create a culture of Data Governance

30
Data Governance The policy of treating data as an enterprise-wide asset assists in establishing a data
governance strategy. The concept behind adopting a data governance approach is to enable
an organisation to create an environment within which data is controlled and co-ordinated. As
with most successful enterprise-wide initiatives, data governance requires a mandate, ideally
in the form of sponsorship from a leading executive (Russem 2006: 19). Without a strong
mandate for change, a data governance policy and indeed a data quality initiative, cannot
hope to be successful. Data governance refers to the overall management of the data within
an organisation involving, not only the security and risks associated with the data, but also
determining who are the true owners and custodians of the enterprise’s data assets,
procedures, policies and processes; establishing the approach towards data quality and
instilling a culture of data stewardship and quality through out O’Brien (2006:40); Russem
(2006: 19), providing data quality and other data management practices with consistency,
efficiency and a mandate within the enterprise (Russem 2006: 22). Data stewardship is the
process of taking the data governance policies and initiatives and implementing them within
the organisation at a task and operational level. In addition a comprehensive data governance
programme should include other dimensions, specifically life-cycle management (Russem
2006: 19), incorporating archival, retention and disposal of data assets; privacy closely allied
to security and data standards relating to the agreed policies. This is not just a data cleaning
exercise but a culture change; the policies and initiatives need to be institutionalised so that
they become part of the organisational fabric. However with this come the dangers of
‘corporate politics’ and inherent resistance to change, which can de-rail the entire process, if
the mandate for change is not strong (O’Brien 2006: 40; Russem 2006: 19).
Data Governance Functions
People Data Council Data Owners Data Stewards Analysts Developers Architects Data Suppliers Data Processors Data Consumers
Policies & procedures Data Quality Management Data Security & Risk Management Data Privacy Exception Handling Data Stewardship Define Stewardship Guidelines Life-cycle Management Specific Data Policies & Procedures Specific Data Standards
Standard definitions Data Definitions Technology Standards Enterprise Data Model Master /Reference Data Management Transaction Data
Technology Data Integration Data Profiling Data Cleansing Metadata Management Data Modelling Archiving Security Privacy
Table 1a Data governance functions
(Developed from a presentation witnessed at (Informatica 2009).

31
Initial Data Standards
Initial gateway requirements for each project/application:
• Identify where the Ownership, Responsibility and Management of the data lies and ensure that this is communicate and accepted by all relevant people
• Establish effective procedures for cleansing and migrating data to any new application
• Identify the points where the project/application integrates with other applications. Communicate with the other projects to establish a clear strategy, procedures and governing rules as to how the data is to be integrated
• Establish KPIs and a monitoring process to measure the ongoing quality of the data
Master Data Management
The practice of acquiring, improving and sharing master data:
• There must be designated Business/Department/Personnel covering the Ownership
and Responsibility for those elements of master data that are seen as being of value
and/or potential risk.
• Those important fields must be identified and their implications understood. There
should be a scoping exercise to identify these and those of low priority should so
designated.
• Some tables cover more than one function- ie Customer & Suppliers have financial,
logistical and analytical related fields. These must be identified separately
• It is appreciated that every field may not be mandatory but any ‘blank’ field must be
designated and agreed as such.
• All of the above must be fully documented, approved by a designated authority (TBA)
with a copy deposited within a central repository with revision control
• There must be an agreed common and consistent approach to address field content
and avoid duplications
• This will form the basis of related operational processes and procedures
Examples
Master Data Tables Table Ownership Responsibility
Existing Finance/ERP
Customers SSC/Business Shared Service Centre
Suppliers Purchasing/Business Shared Service Centre
General Ledger Central Finance Finance Systems Team
Finance Tables Central Finance Finance Systems Team
Items Relevant Business Central Team (to be agreed)
Logistics Tables Relevant Business Central Team (to be agreed)
32
Manufacturing Relevant Business Central Team (to be agreed)
Distribution Relevant Business Central Team (to be agreed)
Employees Relevant Business Central Team (to be agreed)
CRM To be agreed To be agreed
New Applications
Finance As above As above
ES Case Management To be agreed To be agreed
HR People systems To be agreed To be agreed
Transactional Data
The same process of identifying ownership and responsibility must also be applied to
transactional data around:
• Need to ensure everyone is fully aware of the implications of their actions
• A complete understanding of the underlying system principles and requirements
• Being able to address root causes of issues and problems to ensure upfront error
prevention
• Identify the personnel dealing with each type of ‘order’ and agree who does what with
responsibilities for each process
Table 1 The management of data
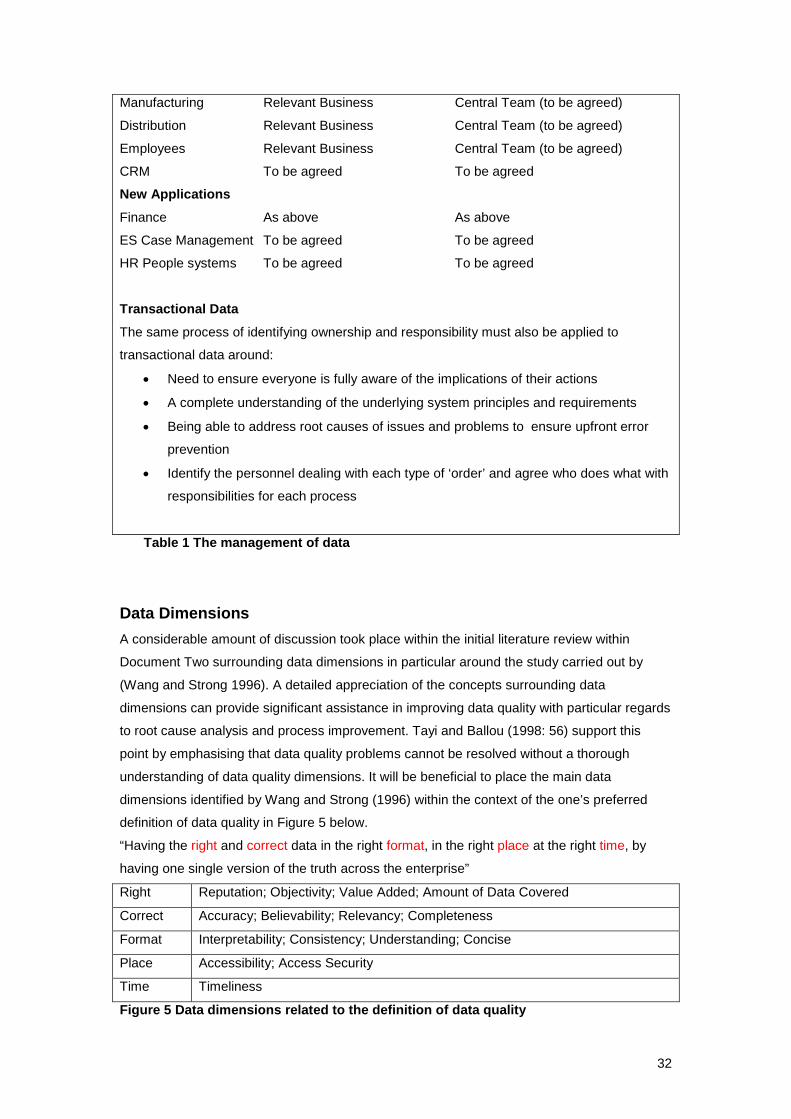
Data Dimensions A considerable amount of discussion took place within the initial literature review within
Document Two surrounding data dimensions in particular around the study carried out by
(Wang and Strong 1996). A detailed appreciation of the concepts surrounding data
dimensions can provide significant assistance in improving data quality with particular regards
to root cause analysis and process improvement. Tayi and Ballou (1998: 56) support this
point by emphasising that data quality problems cannot be resolved without a thorough
understanding of data quality dimensions. It will be beneficial to place the main data
dimensions identified by Wang and Strong (1996) within the context of the one’s preferred
definition of data quality in Figure 5 below.
“Having the right and correct data in the right format, in the right place at the right time, by
having one single version of the truth across the enterprise”
Right Reputation; Objectivity; Value Added; Amount of Data Covered
Correct Accuracy; Believability; Relevancy; Completeness
Format Interpretability; Consistency; Understanding; Concise
Place Accessibility; Access Security
Time Timeliness
Figure 5 Data dimensions related to the definition of data quality

33
Kimball (2007:4) paraphrasing Michael Hammer in his 1994 book ‘Re-engineering the
Corporation’ stated. “Seemingly small data quality issues are, in reality, important indications
of broken business processes”. This highlights the nature of data quality issues in that they
easily mask wider significant process problems which can seriously affect a company’s ERP
system. The following section discusses the Process concept from both an ‘operational’ and a
‘quality’ perspective.

34
4. PROCESSES This research has established the overriding importance of having quality processes in place
within any organisation and this section places this concept within the context of enterprise
resource planning, as well as generic business systems and discusses means by which they
may be improved and enhanced.
Davenport (2005: 102) referred to processes as related tasks an organisation performs in
order to carry out its work. Processes may be comprehensive and cross-functional, taking the
form of a total end-to-end business process, for example a total ‘order to pay’ sales order
processing operation (SOP), or they may have a much narrower perspective as a sub-
process of the overall order processing operation. In a standardised format, processes may
be viewed as individual building blocks brought together within a workflow to perform an
overall task, with the exact number varying, depending upon the simplicity or complexity of
the required outcome. Effective integrated processes are essential if an organisation is to
derive full benefits from any application especially complex enterprise systems (Hammer and
Stanton 1999: 111). This intricacy has potential to be further exacerbated in multi-location
environments with high levels of inter-site activity as is the case in Remploy. Nicolaou (2004:
44) recognised the strategic advantages that can be achieved from enhancing business
processes within enterprise systems, in the form of improvements in the availability and
quality of information.
A standardised sub-process should ideally be the most efficient and effective method of
performing the appropriate task and have synergy with its other related sub-processes to
come together to bring about the overall result. In this way effective sub-processes can be
chained together to create a situation where the whole is greater than the sum of the
individual parts. One has to be mindful however that a total end-to-end process can cross
functions and management fiefdoms with potential to generate conflict between the direct
interests of a particular function and the overall interests of the entire process, leading to
possible sub-optimisation. It is recognised that there is potential for such incidences to exist
within Remploy and one’s experiences have identified situations where this has occurred. It is
hoped that one corollary of this research will be to waken peoples’ awareness as to the
consequences of such events and provide greater visibility as to where such incidents may
occur.
Processes support an organisation’s mission, strategy, goals and objectives and comprise a
series of enablers all of which impact on performance (Sharp 2006). These enablers or levers
can also be manipulated to bring about improvements. They comprise: workflows- those
steps and sequences as to what is to be done, when and by whom; information systems
using data processing applications; motivation incentives allied to measurement, with
reporting indicators tied to reward systems; human resources, to engage the people

35
perspective via recruitment, training and development; business policies and rules, to govern
the organisation and avoid sub-optimisation; and the facilities, relating to the actual physical
environment where the work takes place (Sharp 2006: 8).
This research has identified two types of processes within the context of this study.
‘Operational’ processes, relating to the way in which master and transactional data within
enterprise systems interact to both drive and react to the physical business operations as
discussed above; and ‘Quality’ processes, essential activities that need to be in place to both
improve and sustain the quality of the data overall. This study seeks to identify ways to
cultivate and enhance the former whilst identifying, implementing and inculcating the latter.
Whilst a great deal of the discussion within this section relates to generic processes, the
principles can be applied equally to data and information, especially with regard to the
objectives of this research.
Organisations have methodically monitored and evaluated process performance via a myriad
of measurements either financial or non-financial to establish a guide as to the overall quality
or as an indicator of the levels of change following any process improvement initiative. This
information should then be disseminated across the relevant process owners to enable them
to focus on their relevant areas. The process of measure, publicise and incentivise, can be
very powerful especially if this is then tied to monetary or non-monetary rewards.
Process enhancement and change initiatives normally come under two, sometimes inter-
related, categories. Quality management, often referred to as total quality management
(TQM), is an incremental on-going/open-ended approach focussing on continuous
improvements, sometimes involving minuscule ameliorations, which collectively can bring
about large-scale improvements. In contrast re-engineering or business process re-
engineering (BPR) normally takes the form of radical changes carried out within a fixed time
frame and usually geared to resolve specific issues or problems (Davenport and Beers 1995:
58). The procedure may well involve a full root and branch review with a consequential
mandate for change within all areas of an organisation (Hammer 1990: 112). The implications
for TQM and BRP to influence this research are discussed in later sections.
Process improvement initiatives using ‘double loop learning’ utilising the format of action
research have been in existence for a considerable period Argyris (1977) and was the focus
of the research for Document Three. Loop One is the ‘Performance Loop’ which attempts to
monitor day to day process performance, analyse and resolve problems and monitor trends;
whilst the second ‘Relevance Loop’ looks to ascertain the significance and importance of the
process and determine what changes if any are required (Davenport and Beers 1995: 63).
The former takes a single dimensional view of the situation, whilst the latter attempts to
observe from a wider and more strategic perspective.

36
The fact that small data quality issues are indicative of problems within business processes,
as discussed in the previous section Kimball (2007: 4) enables us to focus our attention on
the source of the data quality problems and identify paths to possible solutions. Whilst data
quality problems tend to relate more to process issues, it is important to examine the People
perspective and how this inter-relates with both Data and Processes.

37
5. PEOPLE ISSUES The research carried out within Document Two, and evidenced by the conceptual framework
(Figure 2 page 18) established the People related elements of Education and Training,
Personal Development and Accessibility as fundamental to the success of any data quality
project and this key concept will be discussed further within this section.
In common with a number of other observers Jantz (2001); Chen and Popovich (2003);
Andress (2004); Morgan and Liker (2006); Whitehead (2006: 2) referred to the alignment
between people, processes and technology. The author prefers to use the term data, as data
quality does not require the medium of technology to make it relevant. Whitehead (2006: 7)
observed that people are essentially unpredictable unlike the more controllable process flows.
People need to change behaviour to bring about improvements and in this they can only be
influenced and encouraged to generate the required motivation, especially within the
environment of this study where human behaviour cannot be controlled. The dynamics of
human behaviour all come into play, relating to an individual’s personality, learning styles,
conflict styles and means of communication to inter-relate with the over-arching organisational
culture to attempt to bring about cultural alignment.
People as ‘Users’ It will also be useful at this juncture to consider the term ‘user’ in reference those persons who
interact directly with enterprise systems and IT applications in general. There has been some
debate within the literature which contends that the expression ‘user’ may undervalue the
skills and roles associated with such people whether they be data producers, custodians or
consumers, with the implication that data is a mere commodity rather than the lifeblood of an
organisation. English (2009: 42), quoting Peter Drucker and Stephen Covey, referred to the
term ‘Knowledge Workers’ as well as ‘Information Customers’. Bannon (1991:25-44) also
sought to elevate the ‘human factor’, to rethink the concept of ‘users’, employing the term
‘human actors’ to imply less of a passive and more of an active controlling role. Lamb and
Kling (2003:199) also challenged the ‘user’ concept, proposing a ‘social actor’ model to better
facilitate future IS research (Lamb and Kling 2003: 224). Possibly a more relevant title may be
‘system actor’. However the term ‘user’ appears to be inculcated into both the culture of
Remploy as well as within parts of the literature, therefore within the strict confines of this
study, eschewing the term is not considered to be a high priority.
People and ERP All ERP implementation and optimisation programmes are ostensibly people projects and
their biggest challenge is not related to technology, but to the people issues (Deloitte 1999:
10). The Deloitte (1999: 17) survey conducted amongst 99 large corporations, 90% of which

38
had annual revenues exceeding US$1 billion, found that 57% of the issues and obstacles
were people related, most noticeably change management and the quality of staff and
training. The necessity for effective change management figures predominantly in this study,
identifying that success in this area is partly dependant upon adequate education and
training. Training covers the basic skills that are necessary to use the system correctly, but
education progresses this further by identifying, how the system will help the organisation
(and thereby themselves) become more effective. This assists buy-in by enabling all
individuals to see where they fit within the entire context of the system and how each can
contribute to the overall success. If people understand their roles they are more likely to
embrace rather than resist change. From that aspect of the literature which focuses on the
more practical aspects of enterprise system implementation, optimisation and development,
Goodfellow (1994: 46) identified education as the single most essential factor in determining
successful or unsuccessful projects; similarly Wallace and Kremzar (2001: 16) recognised
people as the key, the most important element within an ERP system and that it is those
people, who are trained to use the right tools and to work together as a team, that can make
the difference between success and failure (Wallace and Kremzar 2001: 142). Mohamed and
McLaren (2009: 13-14) emphasised the importance of the ‘soft skills’ associated with ERP
implementations, in particular strong change management, performance measures and
rewards, employee morale and resistance, much of which tends to be overlooked within ERP
education programmes. Discussion into these areas figures prominently in later sections.
Information Politics and Culture Davenport, Eccles and Prusak (1992: 64) recognised that managing the politics of information
is difficult, complex and time consuming, requiring detailed management attention together
with changes in organisational culture. Five models of information politics were identified as
being representative of the practices employed within information environments and are
detailed below in order of increasing effectiveness (Davenport Eccles and Prusak 1992: 56;
Davenport and Prusak 1997: 69):
Technocratic Utopianism: A heavily technical approach to information management
stressing categorisation and modelling of an organisation’s full information assets, with heavy
reliance on emerging technologies.
Anarchy: The absence of any overall information management policy, leaving individuals to
obtain and manage their own information.
Feudalism: The management of information by individual business units or functions, which
define their own information needs and report only limited information to the overall
corporation.
Monarchy: The definition of information categories and reporting structures by the firm’s
leaders, who may or may not share the information willingly after collecting it.

39
Federalism: An approach to information management based on consensus and negotiation
on the organisation’s key information elements and reporting structures.
The key is to match the organisation to the political structure that provides the best fit
Davenport and Prusak (1997: 68), by ascertaining which model is currently in ascendancy
within the organisation and to which model the organisation should be moving (Davenport,
Eccles and Prusak 1992: 62). At the commencement of this study one’s thoughts were that
Remploy was hovering around the monarchy model with elements veering towards feudalism.
Over the last five years there appears to have been a growing acceptance that quality data is
important together with a need to conform to standards and one can now detects aspects of
the federalism model emerging in all levels of the organisation. One feels that this study has
assisted in this process.
Davenport and Prusak (1997:84) defined information culture in terms of the attitudes and
patterns of behaviour that identifies an organisation’s approach towards information. Culture
has an important influence on how an organisation views and uses information (Davenport
and Prusak 1997: 68). One has always viewed culture as ‘the way we do things around here’
involving beliefs and values. Corporate values themselves play an integral part in the
development of an information culture. Remploy’s ‘five values’- keeping promises, respect,
openness, professionalism and passion, by their very nature should support any change
management initiatives directed towards data and information improvements.
Remploy has a proven track record within learning, education and training and each year all
employees undergo a personal appraisal and development review, an essential part of which
comprises a detailed learning and development plan, which is reviewed throughout the year.
One area that has not been covered comprehensively, relates to Baan system training and
the necessity for a Baan related education and training review has been identified. Such a
programme was carried out within the implementation phase during the latter 1990s but has
not been followed up fully on a regular basis. Over the intervening period key personnel have
left and their replacements have been often ‘trained’ by others passing on bad habits and
faulty work practices in some cases.
Implementing Improvements and the Management of Change Data and information are very emotive subjects even within a static environment, but when
one factors in elements of change, the climate becomes even more volatile. The finest data
improvement initiative will flounder unless the process is managed correctly. Human and
organisational factors are commonly identified as causes and contributors to failures and
difficulties in implementing planned change. A study carried out by Lewis (2000: 151)
identified that personal communication or the lack of it, plays a fundamental role in the

40
success or failure of programmes of change and that around this central core of
communication, four key themes emerged relating to: creating and communicating a vision to
highlight the purpose and intent of the change and to promote a shared understanding
amongst those effected; sense making around the mission and the provision of adequate
feedback facilities; establishing legitimacy for the change programme to important
stakeholders; and communicating goal achievements, both as a means of publicising
successes, and providing evidence of continued progress towards targets and milestones.
How do others implement change? A more detailed assessment of the aspects of
organisational culture, politics and change management relevant to this study is discussed in
the following section.

41
6. SUSTAINING IMPROVEMENTS AND THE MANAGEMENT OF CHANGE The concept of sustainability has already been defined in Section 2 to mean an on-going
journey of improvement where a continual upward momentum is maintained. One could use
the phrase ‘Continuous Improvements’ although this may be interpreted by many to refer to
the ‘continuous improvement’ policy known as Kaizen, the strategy of constantly introducing
small changes in a business in order to improve quality and/or efficiency. Whilst this may be
relevant to improving data quality it is viewed as a means to the end rather than the overall
concept itself. This section proposes that any element of sustainability is predicated on being
able to manage change successfully. In this context Helfert (2009: 949) identified that
managing change effectively is fundamental to the success of business process management
improvement programmes.
Zairi (2005: 4) defined sustainability as “the ability of an organisation to adapt to change in the
business environment, to capture contemporary best practice methods and to achieve and
maintain superior competitive performance” referring to the Quinn (2000) definition that
sustainability is a “development which meets the present without compromising the future”
Zairi (2005: 3). One appreciates the basic principles of the former definition particularly
regarding the strong strategic ideals around best practice and improved competitiveness, but
believes that it is not specific enough to meet the detailed requirements of this document,
whilst the latter definition better supports the strong conviction that any short term initiative
must never sub-optimise the future.
Any improvement process requires some form of change and all change needs to be
managed. It is here where the triple concept of people, processes and data and the inter-
relationships, has great significance. One can change a process (process change), but for
this to become effective people are required to follow the new process (behaviour change).
Where legal implications are present then enforced behavioural change may be required, but
for the great majority of business change situations, further forms of acceptance and
compliance are necessary. The greatest long term challenge facing any improvement change
initiative is to ensure it becomes sustained, especially when this requires people to behave in
new or different ways. The requirements for process change, behaviour change and the
consequential culture change all have direct relevance to the conceptual framework
Depending upon the size and scope of the change, different strategies may be employed to
engender acceptance and compliance. Boult and Eaton (2008) suggested: generating a
belief that the proposed change is worthwhile and that the situation will improve; employing
forms of temporary enforcement; measuring, analysing and providing feedback to ensure
continued compliance; obtaining ‘buy in’ to generate individual ownership and belief; creating
an environment which encourages and supports the new practices and celebrate successes;
and building the changes into individuals’ objectives, especially where this is allied to a

42
reward system. Additional management practices may be employed including the
identification of the objectives, risks and benefits, with adequate communications to reinforce
the messages to provide two-way feed back; involving all interested parties, canvassing their
opinions; ensuring adequate training and development is delivered where applicable and
making the necessary environmental improvements to equipment and facilities, to ensure
returning to the old ways of working are deterred or prevented. Whatever strategy is put in
place it has to be recognised that it is not a one-off event but a continuous on-going process.
There is a requirement to align the organisation behind any significant change and to become
aware of this need to change, to accept the consequent responsibility and then to generate
the necessary actions to adopt the new practices. Behavioural change requires adapting to
these new habits and practices. This may be best initiated by focusing upon a few achievable
goals with a sympathetic and willing audience, to test the viability and then to push forward
with relevant interested groups, establishing and publicising relevant measures in order to
build improvement with positive reinforcement.
Theoretical Models for Change The literature has provided a number of theoretical models which have been developed to
assist in making change programmes successful.
Formula for Change
The Formula for Change model attributed to Richard Beckhard and David Gleicher attempted
to identify the chances of successfully implementing change in a given situation. The original
formula was ‘simplified’ to make it more accessible for organisations to use Jacobs (1994:
122) and rewritten as:
D x V x F > R
If the combined elements of:
D = Dissatisfaction with the current situation
V = Vision of what can be achieved
F = First steps that can be taken to commence the change process
is greater than the initial:
R = Resistance to change
then within this climate there is a possibility that change can be implemented, but conversely
if one or more of these elements are missing or deficient, then success is unlikely, as the
resistance will overcome the attempt.
An organisation can develop the D, V and F elements by identifying and highlighting the
critical negative effects and implications of the current position (D), creating an image of the

43
new future as a desirable and achievable goal (V) and identifying quick wins to get the
process up and running immediately (F). Likewise the factors that comprise the resistance (R)
can be identified and worked upon and in that way their effects may be lessened. Resistance
can take a number of guises. There can be organisational resistance where the inherent
culture works against any change or where there is seen to be other alternative options with
greater priorities. Resistance may also be viewed as an organisational cost either in financial,
time related or psychological terms where individuals fear change. Whichever implementation
strategy is chosen it must continue to be employed until the change is fully inculcated.
Stages of Change Model
The Stages of Change model also known as the ‘Transtheoretical’ model was developed in
an attempt to promote successful health related life style changes (Prochaska and
DiClemente 1982). It focused upon the route to successful behavioural change and attempted
to predict whether an individual can successfully change their habits and identified the
potential inhibitors that may exist along the way. The model identified six to seven stages,
from total inactivity, to a successful stable conclusion (Prochaska and Velicer 1997). In the
first stage, ‘pre-contemplation’, there is a total lack of awareness and no intention to change.
In the second stage, ‘contemplation’, there is awareness but no firm commitment exists. At
the third stage, ‘preparation’, action is intended or planned, which leads to the fourth stage,
‘action’, where some change has been initiated. The fifth stage ‘maintenance’ represented
that important phase where the initial up-front enthusiasm gives way to business as usual and
with it the temptation to revert to type may exist, which can lead to a sub-stage of ‘relapse’,
which if occurs, will necessitate a return to the ‘action’ stage to recommence the process once
more. The final stage, ‘termination’, exists when the individual has finally inculcated in full, the
essences of the new practice without any desire to return the ‘old’ ways.
Although the original model concerned itself initially with health related changes, since its
publication it has been used within far wider ranging research environments and is now an
established part of organisation theory and research to assist in bringing about sustainable
change by training and support (Harris and Cole 2007: 778).
Kotter’s Eight-Step Change Process
A change management model was developed by Kotter (1996), which encompassed an eight-
step process, designed to cement change initiatives into an organisation’s structure. The eight
steps comprise: establishing a sense of urgency, to identify potential threats and
opportunities, whilst obtaining management ‘buy in’; creating the guiding coalition, to convince
everyone that change is necessary; developing a vision and strategy, that everyone can
understand and empathise with; communicating the change vision, in order to attract peoples’

44
attention and acceptance; empowering employees for broad-based action, to remove
obstacles and identify areas of resistance; generating short term wins, to gain immediate
momentum whilst also; consolidating gains and producing more change, by also taking a
wider long term perspective of the overall project objective; and finally anchoring new
approaches in the culture, to embed the change so that it becomes part of the organisational
fabric (Kotter 1996 (33-158).
Management of Change All change programmes will encounter disappointments and setbacks especially after the
initial enthusiasm and euphoria has lapsed. It is vitally important that this is not allowed to de-
rail the overall initiative. Fluctuations in results exist in all forms of life and improvement
initiatives and change management programmes are no exception. It must be accepted that
set backs and periods of stagnation will occur naturally as outside influences come to bear on
any programme and this has to be accepted. The important thing is to put these into
perspective and avoid overdue pessimism at all levels. Most change processes attempt to
affect human behaviour, therefore psychological influences exist and feelings of pessimism,
disappointment and negativity can produce damaging consequences. A positive solution-
focussed approach may be employed to overcome such dangers and the programme
champion or leader has to exemplify all of these positive characteristics. Any project has to
accept that temporary set backs are the norm and that one should not become discouraged.
None more so than within this study where this aspect will be discussed in later sections.
As part of a study into ‘extreme value theory’ Baum and McKelvey (2006: 166) investigated
the daily closing prices of the Dow Jones and NASDAQ stock market indices from 1990 to
2005. They found that whilst there were daily fluctuations some with huge negative results,
across the entire period there had been a continual positive upward trend. Applying this
principle to the concept of managing change, one should not anticipate stagnation, but if it
occurs one should focus upon the achievements made so far and continue to apply those
principles that have worked in the past. This may require a re-focussing of the whole team
with action plans and targets to generate further positive momentum. One also has to
acknowledge however that not all improvement programmes will achieve any modicum of
success. Some fail for various reasons and it is important to identify when this happens and
then rethink the entire strategy.
A major study of organisations that experienced huge improvements in performance pointed
to a common theme that of a build-up and break-though experience (Collins 2001: 165). The
image of a flywheel was employed to illustrate the way that transformation is a continuous,
cumulative process with no one defining moment, no single action, killer innovation or

45
revolutionary instance; but instead a step upon step, action upon action, decision upon
decision, turn upon turn of the flywheel to bring about spectacular sustainable results.
Generic change management and sustainable improvement programmes can provide
valuable lessons and examples for such initiatives within the field of data quality. Strong
programmes are adaptable to numerous applications in many fields. Success is not easy.
Research carried out by the Henley Management College indicated that around £25bn is
wasted annually on UK improvement programmes and further research identified that
upwards of 80% of such programmes fail to meet expectations (Eaton and Phillips 2006). One
solution advocated having a defined methodology which outlines the proposed journey,
communicates this clearly to all parties to specify the actions to be taken to create the
necessary organisational environment, to enable the improvements to take hold. The
organisation should then align itself behind these changes providing the necessary support to
encourage and motivate both the individuals and the teams within which they operate (Eaton
and Phillips 2006).
The change leader becomes the key, needing to have the respect of all related parties and be
able to lead with passion. Change management programmes have to be seen to be alive and
proactive, embracing emotions and exuding this passion, to stimulate acceptance and
involvement so essential to win the necessary hearts and minds. Regular measurement,
monitoring and reporting is also essential, as is the regular communication of the actions
taken and progress made, towards the goal, whilst constantly reminding everyone of the
criticality of the initiative so as to position the programme within the overall context of the
organisation’s objectives.
Having established the significant principles underpinning managing change to create a
climate where improvements can be sustained, it is now important to place this discussion
within the field of quality management together with data and data quality in particular..

46
7. SUSTAINABILITY AND THE PRINCIPLES OF QUALITY MANAGEMENT This study has identified that there appears to be a gap in the literature surrounding the
research into sustaining data quality improvement initiatives within an enterprise resource
planning environment. There is a myriad of rich material embracing data quality per se and
enterprise resource planning in general and its procurement and implementation programmes
in particular. Likewise quality management and specifically total quality management, figures
significantly in both academic and practical publications. The previous section identified that
sustainable quality improvement initiatives involve managing change and these related
principles are relevant to all forms of quality improvement whether product, service or data
related.
This section examines quality management literature relating to sustainability with particular
relevance as to how this may best be applied to planning and information systems. A number
of the most relevant articles published over the last ten to fifteen years have been identified
and their significance is reviewed below.
Dale (1996: 49-51) identified three key features relating to sustainability in the context of total
quality management. In principle these related to: the relevant elements of TQM, amongst
them leadership, infrastructure, quality systems and tools and techniques, measurements and
communications; the continual process of improvement; and an organisation’s ability to hold
onto improvement gains. In a further article Dale, Boaden, Wilcox and McQuater (1997: 372),
‘sustaining’ was defined as ‘the maintaining of a process of quality improvement’. The study
identified certain important pitfalls around the lack of adequate leadership, management and
problem-solving skills; failure to follow through on projects; the inability to keep teams
together; and the lack of essential physical and technical resources, information and analysis.
Buch and Rivers (2001: 371) emphasised the importance of leadership and culture to the
success of any TQM initiative, in partnership with training, reward and support systems to
combat the natural tendency to revert to type in the face of both internal and external
influences. This was echoed within an article published by the journal Strategic Decision
(2002) which acknowledged that sustaining any new culture is extremely difficult and that
leadership is crucial to the success of any new initiative, to ensure continued support and
focus across the organisation and thereby influence the outcomes of the planned changes.
Wood (2004: 20) identified that achieving any degree of sustainability within a supply chain
environment, required the direct involvement of those people who could make the changes
with each accountable for their results. Allied to this was the requirement to provide a clear
vision of the future, with targets and action milestones, supported by regular measuring and
monitoring to provide feedback. In addition a number of enablers were recognised as having
significance at an operational level namely: the formal documentation of all ideas and

47
suggestions for improvement; enabling teams to make local operational decisions; allowing
time for daily housekeeping and improvement activities; with management staying focussed
upon the overall improvement activities. The concept of enablers was developed further by
Bateman (2005: 274), initially a process improvement approach was developed, which then
evolved into continuous improvement programme to provide sustainability. Tactical and
operational improvements at shop floor level were then implemented and integrated within the
wider business scene, allied to a more organisational perspective.
A study by Balding (2005: 286) using an action research approach within a healthcare
environment, found that when senior management were able to create a suitable culture to
enable the middle management structure to become far more empowered and as a
consequence more directly involved, this enabled the middle management team to take
ownership and accountability for their part of the project, building upon their values to allow
them to establish positive message within their teams. This helped counter major negative
attitudes and thereby increased the opportunity for sustaining the organisation’s quality
improvement implementation.
Goyal and Patil (2009) described the building of an organisational quality mindset to bring
about sustainable improvements. They identified that Lean Manufacturing, Six Sigma and
TQM implementations may all suffer deterioration after the completion and handover of the
breakthrough improvement unless the correct processes were put in place. The quality mind
set proposed a programme of continuous improvement supported by: root cause analysis and
prevention; regular management reviews by both local and senior management;
institutionalisation of processes; daily measurement, monitoring and reporting; developing
greater team work; all reinforced by the continual support of the top management. A strategic
view provided by Svensson (2006: 25-29) used the term ‘Sustainable Quality Management’
to propose a ‘circulation approach’ which was seen basically as a chain or series of business
improvement operations across three of total quality management’s major components
namely: core values, techniques and tools. The study also questioned whether the short term
nature of these three components could conflict with the longer term aims of the organisation.
Zairi’s (2005) study concluded that sustainable improvements can only be achieved by
cultural and transformational change, with commitment and participation by everyone towards
continuous improvement, developing skills, learning from experiences, celebrating success,
all within an environment supported and reinforced fully by management at all levels. The
entire process should be evolutionary, emphasising an organisation’s critical success factors,
supported by regular measurement and feedback, to develop a total quality management
philosophy throughout the organisation.

48
Within the information system arena, Helfert (2001: 2) identified the importance of applying
the principles of total quality management to inform the concept of a ‘method-based data
quality management’ approach to improve the quality of data within data warehousing
projects. This relationship between total quality management and data/information quality was
developed further by Levis, Helfert and Brady (2007) identifying that whilst the majority of
TQM researchers tended not to mention information quality explicitly, high quality data and
information was critical to the success of quality management programmes. In a reciprocal
manner it was also concluded that the principles of data/quality management are strongly
underpinned by the concept of TQM (Levis, Helfert and Brady 2007: 9).
Sustainability and Enterprise Resource Planning Whilst it has been identified that there is a gap in the literature relating to process
improvement sustainability within ERP systems, certain articles have been published which
contribute to the overall ERP/Quality Management debate. Laframboise and Reyes (2005)
described research into the integration of ERP implementations and total quality management
(TQM) systems. They identified that historically ERP and TQM had never been viewed as an
essential pair and that there had been very little academic research carried out on ERP other
than on procurement and implementation, which coincides with one’s own findings. One
relationship that was identified as being essential to both ERP and TQM was the critical
support of top management and the devoted involvement of every employee. Whilst TQM and
business process re-engineering (BPR) are both mentioned widely, there was never any
reference made to ‘data quality’ as such. One questions whether this is a serious omission on
behalf of the authors of the article who fail to identify the significance of data quality within a
TQM concept, or the failure of the data quality fraternity to get its message across to ERP and
TQM researchers.
Akkermans and van Helden (2002) debated the merits of two alternative methods to bring
about ERP system improvements, comparing a ‘strategic leap’ approach akin to business
process reengineering, with that of continuous improvement which (quoting Upton and
McAfee (1997: 3) they defined as “a series of small steps whose individual impact might be
small, but which cumulatively delivers substantial performance gains over time” (Akkermans
and van Helden 2002: 4). The study compared the two alternative methods which were both
employed within a specific ERP implementation, revealing that the use of the ‘strategic leap’
caused a major crisis within the organisation, which was only resolved when a ‘continuous
improvement’ approach was employed. The article concluded that a continuous improvement
process approach can have significant positive influences for both ERP implementations and
post-implementation success (Akkermans and van Helden 2002: 19). Once again no direct
reference was made to data quality which makes one question not only the ERP researchers
and the data quality fraternity per se, but also the failure of the academic community’s to take
49
any real interest in such an important topic, leaving an apparent void within this part of the
literature
In a further study, Schniederjans and Kim (2003) examined the sequencing of business
process reengineering and total quality management initiatives within a number of ERP
implementations. Their research indicated that where BPR preceded the ERP implementation
and was followed by a TQM initiative there was a fair element of success. This success was
also mirrored in instances where the sequence TQM/BPR/ERP was employed. Reference
was also made to ‘Lewin’s Three Phased Organisational Change Model’ which may be
characterised as ‘unfreezing, changing, re-freezing’ and how this model could be applied to
their research. One appreciates that the very existence of any form of effective process
development can act as a catalyst for a successful improvement programme. Worley, Chatha,
Weston, Aguirre and Grabot (2005) studied the implementation and subsequent optimisation
of an ERP system within a university, concluding that effective optimisation requires adapting
business processes so that they align with the attributes of the human resources. Tasks and
responsibilities have to be defined clearly, within consistent and optimised processes, taking
account of the roles, competences, knowledge, requirements and potential of the workforce.
Davenport (2004) identified that organisations can derive significant benefits from enterprise
systems implementations, provided they continue to optimise business and management
processes. This may be achieved by establishing a continuous business change
infrastructure with management involvement, working on a prioritised action plan, focussed
towards ongoing process improvement; by standardising the operations, using best practices
to ensure that they fit and flow effectively across the business, with appropriate measures and
related accountability, to generate organisational value.
A study commissioned by Deloitte (1999: 21-23) found that successful companies
demonstrated a number of best practices for maximising and sustaining the benefits of
enterprise resource planning. Amongst these were: aligning the whole business behind the
original vision and use the business case as an ongoing management tool; focusing upon the
capabilities and benefits that have been identified from an ongoing perspective; ensuring that
the most effective working processes are balanced with the new technology, to support the
people who have been motivated, trained and developed; establishing clear lines of
responsibility and ownership at all levels; together with the provision of measurements and
metrics to evaluate progress against system performance targets and budgets. The study,
termed ‘ERP’s Second Wave’, also identified a series of generic steps to support ERP
optimisation, to promote the benefits along with long term sustainability. These comprised a
programme to: confirm the destination, where the organisation wishes to go; determine the
progress made to date, where are we now?; develop a plan to continue the ‘journey’, with
actions to be taken to achieve the goal(s); organise progress throughout the journey and

50
implement the action plans; create a means for tracking progress, measure, report and
feedback the results, to determine whether the overall objective were being met. This may be
seen as a derivation of the change management process of Plan, Do, Check, Act.
These last two sections have identified strong collective recurring themes arising from
research within the generic Change Management, TQM, Lean Manufacturing and Six Sigma
arenas some of which related to ERP environments. It should be noted that this literature
review has focussed principally upon quality management and TQM mainly to the exclusion of
business process re-engineering (BPR). One feels that this approach is valid because data
quality is an ongoing life-time philosophy, more akin to the principles of quality management,
rather than a collection of focussed, one-off or short term events to resolve business
problems as is the case with the majority of BPR initiatives.
Key Recurring Themes
The key recurring themes have been summarised, referenced and grouped into a number of
broad headings aligned to the main structure of the conceptual framework, in Table 2 below.
Whilst the categorisation is not prescriptive and there may be some grey areas and elements
of duplication, the analysis provides a summary of the main arguments and premises
surrounding the notions of both change management and quality improvement, derived from
the review of the relevant literature. This analysis will be revisited in Section 16 as part of the
discussions emanating from this entire research.
Cultural/Organisational Leadership:
Executive and Management support and sponsorship Dale (1996); Kotter (1996); Buch and Rivers (2001); Davenport (2004); Zairi (2007); Goyal and Patil (2009) Establish a clear vision with targets and milestones Beckhard (1989); Kotter (1996); Deloitte (1999); Lewis (2000); Wood (2004) Importance of Leadership and Culture Dale (1996); Kotter (1996); Buch and Rivers (2001); Balding (2005) Align the Organisation Kotter (1996); Deloitte (1999); Eaton and Phillips (2006); Strategic Decision Focus upon achievements Kotter (1996); Lewis (2000); Zairi (2005) Celebrate successes Lewis (2000); Zairi (2005); Boult and Eaton (2008)

51
Management:
Improvement requires change which has to be managed Kotter (1996); Lewis (2000); Bateman (2005) A belief that change is worthwhile and necessary Kotter (1996); Boult and Eaton (2008) Manage the change Kotter (1996); Deloitte (1999); Bateman (2005); Zairi (2005) Identify risks, benefits and overall objectives Boult and Easton (2008) Plan and identify required actions Deloitte (1999); Davenport (2004); Wood (2004); Eaton and Phillips (2006) Measure, monitor with reporting and feedback to support accountability Dale (1996); Davenport and Beers (1995); Deloitte (1999); Wood (2004); Zairi (2005); Boult and Eaton (2008); Goyal and Patil (2009) A continual on-going process Dale (1996); Akkermans and van Helden (2002); Davenport (2004); Balding (2005); Zairi (2005); Boult and Eaton (2008); Goyal and Patil (2009) Accept that there will be set backs Baum and McKelvey (2006) Avoid undue pessimism, stay focussed and be positive Balding (2005) Identify potential pitfalls Dale, Boaden, Wilcox and McQuarter (1997) Manage any potential short term and long term conflicts Kotter (1996); Sharp (2006) Svensson (2006) Align the processes behind the people Worley, Chatha, Aguirre and Gabot (2005); Eaton and Phillips (2006) Establish clear channels of communication Kotter (1996); Lewis (2006); Boult and Eaton (2008) Manage the relationship between the way data interacts between the processes and the people Deloitte (1999); Worley, Chatha, Aguirre and Gabot (2005); Whitehead (2006) Processes: Best practices within the right environment Hammer (1990); Zairi (2005) Continual process reinforcement Dale (1996); Davenport (2004) Elements of quality management principles in all forms Schniederjans and Kim (2003)

52
Continual process improvements Akkermans and van Helden (2002); Davenport (2004); Bateman (2006); Goyal and Patil (2009) Root cause analysis and error prevention Goyal and Patil (2009) Concept of People, Processes and Data Deloitte (1999); O’Brien (2006); Whitehead (2006) Align the processes behind the people Deloitte (1999); Worley, Chatha, Aguirre and Gabot (2005); Whitehead (2006) Identify and document the process enablers Wood (2004); Bateman (2005); Sharp (2006)
People: Obtain buy-in, ownership and belief Boult and Eaton (2008) Involve everyone Kotter (1996); Worley, Chatha, Aguirre and Gabot (2005); Boult and Eaton (2008) Build targets into peoples’ objectives with a reward mechanism Sharp (2006) and Boult and Eaton (2008) Importance of education, training and development Deloitte (1999); Buch and Rivers (2001); Wallace and Kremzar (2001); Sharp (2006); Harris and Cole (2007); Boult and Eaton (2008) Importance of ownership and responsibility Balding (2005) Teamwork Wallace and Kremzar (2001); Goyal and Patil (2009) Tendency for people to revert to type Prochaska and Velicer (1997); Buch and Rivers (2001); Boult and Eaton (2008) Concept of People, Processes and Data Deloitte (1999); O’Brien (2006); Whitehead (2006) Align the processes behind the people Deloitte (1999); Worley, Chatha, Aguirre and Gabot (2005); Whitehead (2006) Table 2 Key recurring themes
It has already been established in Section 2 that there is a correlation between the concepts
of a manufacturing system and that of planning and information system and as such, one
believes that the basic quality management principles and practices that have emanated from
the manufacturing environment, much of which has been described above, have strong
potential to assist in whole or in part, to manage effectively the quality of data within an ERP
system. That being said, implementing and sustaining data quality initiatives requires
processes, techniques and tools which will vary according to individual circumstances. One

53
size will not fit all, but these established generic quality principles and practices have the
potential to be capable of being applied successfully across varied and diverse environments.
This study will compare these strong themes emanating from the research detailed above,
with the results derived from the qualitative and quantitative research, carried out within this
project.
Data Quality Software Tools This study focuses upon the manner in which processes and people interrelate around the
data flows to impact upon the quality of an organisation’s data. One is fully aware of the
numerous software tools available which purport to improve data quality and there is
considerable evidence that these tools do provide solutions in certain circumstances.
However it is considered that such software tools are best applied once the basic principles of
data quality management have been addressed and sustainable improvement processes are
in the process of being applied. Therefore they are not considered to be part of this research.
The main research question for this entire study asks: “How can an organisation create an
environment where data quality improvements can be sustained?” The ongoing review of the
literature conducted for this research, has yielded rich material as to the notion of data quality
as evidenced in detail in Document Two and in Section 2 of this document. Also
the means by which quality improvement programmes in general may become embedded
within organisations has been discussed in detail within Sections 6 and 7 above. This wealth
of material combined with one’s own professional and personal experiences has been used to
frame the further research carried out for this study, in the form of both a qualitative study and
a quantitative survey conducted within one’s own organisation Remploy. The next section
places into context the concept of data and data quality within the organisation and how this
has developed over the last decade.
54
8. DATA AND DATA QUALITY WITHIN REMPLOY As a prelude to the practical research undertaken for this study, this section presents a
background to the way in which the organisation has approached the question of data quality
and then provides an account of the improvement initiatives which have taken place over the
last five years.
The Requirement for Quality Data There has long been awareness within Remploy of the necessity of having accurate data
within all aspects of the organisation, although for a period of time this was more of an
aspiration than a reality. Following the implementation of the Baan/Infor ERP system between
1997 and 1999, data quality improvement efforts tended to concentrate on short term problem
resolution in the form of on-the-spot, one-off training sessions and corrective actions as
problems were discovered, together with data clean up exercises relating mainly to item,
customer and supplier master data, all of which tended to be focussed on reactive problem
fixing.
As the Company reorganised to move away from a historical structure of factory based
businesses, to focus on a more product based structure with factories operating across two or
more product businesses with far greater inter-factory trading it became more apparent that
there were real data quality inadequacies. Superimposed upon this was the introduction of a
far tighter month-end closure and reporting timetable. Originally ten working days, this was
reduced to two and a half days over a period of four years restricting any time for the
‘traditional monthly data clean up’ exercise. This then led to a growing realisation of the need
to ‘get the data right first time’. Greater improvements in company reporting with the
introduction of a new business intelligence reporting and budgeting tool led to a greater
demand for structured reporting from a single source and a move away from individual ad hoc
spreadsheet reports. This recognition of the need for far more accurate data emanated
initially from within the Finance function where all the data ills tended to manifest themselves
and with management frustration around the mistrust of the information contained within
important operational and finance reports. New financial and non-financial reports and key
performance indicators (KPIs) were introduced alongside quarterly business reviews to
enable the Executive and each business management team to meet to review both past and
more importantly future performance. With a far greater emphasis being placed on budgeting
and forecasting, the need for accurate robust data was seen as paramount.
During the period 2002 to 2005 a number of initiatives were commenced around process
improvements, one of which incorporated a partnership with Ashridge Business School under
the title of ‘3X Project’ embracing the ‘Theory of Constraints’ principles Goldratt and Cox
(1984), which provided a basis for achieving dramatic improvements in factory performance.

55
The project was rolled out across thirty or so factories with varying degrees of short term and
long term success. In certain sites it was met with indifference and resistance, whilst in others
the changes were welcomed and acted upon. From the views of some of those involved, the
deciding factors appeared to relate to; the ability of the project team to ‘sell’ the concept, the
attitude and willingness of the local sites to accept fully something new, the degree of senior
management sponsorship and open support (which did not appear to be prominent) and the
lack of any ongoing measurement of progress and publication of results. The project itself had
a finite existence but there is still evidence to suggest that in certain areas, improvements
have been maintained over the last five to six years. It is felt that this was down mainly to
cultural aspects of the individual sites where there was an immediate buy-in and in certain
circumstances where actual physical changes to the factory layout prevented a return to the
‘old’ ways of working. This provided some interesting lessons around the subjects of process
improvement and the management of change.
During the summer of 2005 the concept of data quality achieved a far higher prominence
within the Company as an integral part of a new initiative, the Business Optimisation Project,
supported by the Executive, the raison d’être of which was to coordinate the functions of
manufacturing, HR, finance and IT to further optimise the operations of the whole
organisation. Within this context quality data was seen as prerequisite to ensure that the
existing Baan ERP system and allied applications should move from a support and control
tool into one that could be used for the positive advantage of the businesses in providing
accurate, timely and easily accessible data to allow the Company to better manage its assets
and achieve its objectives. In hindsight this may be seen as the first real strategic awakening
as to the importance of data quality to the organisation.
Data Quality Improvement An initiative to raise the awareness of the essential requirement for quality data and instigate
improvements across all businesses was launched at a finance department conference during
the autumn of 2005 under the auspices of the author and the overall sponsorship of the
Director of Finance. The various business finance managers agreed to act as conduits to
drive forward the concept of data quality improvement within the areas of their responsibility.
To assist in this, a small project team was assembled to initiate the improvement programme
as part of the Business Optimisation Project described above. It should be noted that the term
‘accuracy’ was to be used instead of ‘quality’ and whilst it is recognised that accuracy is only a
single element of the data quality concept as indicated in the section on data dimensions
above, the entire finance team felt that the term ‘accuracy’ would have greater resonance
within the business community and therefore have a better potential take-up and
understanding. All of this in no way precluded the other elements of the data dimensions and
the data quality definition from being integral parts of the programme. Over the intervening

56
period the level of awareness, focus and all-round general acceptance of the concept justifies
this decision.
An initial approach was made across a number of fronts to attempt to promote education and
training; documentation of procedures; the acceptance of responsibility, ownership and
accountability at all levels for processes and data; together with better management of master
data. In addition the identification and implementation of ‘quick wins’, together with selling the
importance of the project up and down the corporate structure was also seen as being
fundamental to raising and integrating the profile of data quality. Recognising that accurate
source data was essential, it was agreed that the initial focus should be directed at the
operational and factory level, concentrating on the essential operational and commercial
activities from customer order receipt to final completion and payment and it was seen as
imperative that these should be measured, monitored and controlled.
Remploy Data Accuracy Key Performance Indicators To this end seven key performance indicators (KPIs) were established around the order
fulfilment process, historically the sources of many of the data quality issues. The KPIs were
chosen specifically to reflect the salient elements of these essential commercial operations.
Two external facing measures were chosen relating to customers and suppliers, four others
relating directly to processes within each factory and a final one involving both the sites and
the central finance Shared Service Centre which oversees the Accounts Receivable and
Accounts Payable functions. The KPIs were designed to reflect the view of the world as seen
through the lens of the ERP system, compared with an actual view which could be obtained
by direct observation of the actual physical order process. In other words how closely the
‘system’ (data within the ERP system) reflects reality in the manner described by Wand and
Wang (1997: 94), whilst also providing a measure of the quality of the actual data and the
related processes. Over and above this the information provided the company with the ability
to track order fulfilment targets and identify late orders in the form of purchase receipts,
production completions, sales despatches and invoice generation all of which have related
data quality connotations with potentially serious financial implications. The KPIs have been
used to monitor the levels of data quality over the past four years in particular to measure the
success of the various data quality initiatives which are tied closely to this study, therefore it is
important that their detail and implications are understood.
External Facing KPIs
The following KPIs attempt to identify potential problems emanating from customer/supplier
trading which can affect not only the quality of the company data but also the inter-
relationship between the company and its external trading partners.

57
Customer Credit Notes- The number of credit notes as a proportion of customer invoices.
This measure can reflect inaccuracies in invoiced quantities, pricing, VAT charges, customer
master data, delivery problems as well as product quality issues.
Purchase Invoices Under Query- This measure identifies those supplier invoices that
cannot be matched and approved against a receipted purchase order. This process can be
affected by inaccuracies in receipting goods and services, invoice pricing, supplier master
data, failure to raise purchase orders, order line data and supplier invoicing errors.
Internal Facing KPIs
Site specific KPIs
The following KPIs relate to order fulfilment, identifying transactions that have not been
completed on time and may have a serious impact not only on data quality but also potentially
customer/supplier relationships.
Outstanding Orders: Production, Purchase and Sales- Identifies orders that are still not
complete requiring further transactions to be carried out. These can be affected by
inaccuracies in quantities booked, poor housekeeping (failure to complete/close orders),
completion of back orders, failure to maintain receipts, record production and post
despatches, as well as the effects of actual late order fulfilment.
Despatches Not Yet Invoiced- Indicates where goods have been despatched to a customer
without an invoice being raised or where the invoicing process is still incomplete.
Site/Shared Service Centre KPI
This KPI relates to the inter-functional relationship between the various sites and the central
Shared Service Centre. This measure identifies potential issues that can affect the quality of
the overall data and relationship between the company and its suppliers.
Receipts Not Invoiced- Identifies the level of receipts that have been booked into stock or
charged against costs that have not yet been matched against a supplier invoice. This can be
affected by inaccuracies in booking in quantities or recording product returns, invoice
matching, purchase order prices, supplier master data, or an incorrect supplier chosen. Whilst
the overall responsibility lies with the originating site and business, the very fact that a portion
of the transaction interfaces with the central Shared Service Centre means that there is an
element of shared responsibility. The circumstances are further complicated by the fact that
when a receipt is made, a financial liability is created which under current accounting
standards means that any legitimate receipt must be retained as a liability for a minimum of
six years unless otherwise agreed.
Measurement Process When using any form of key performance indicator one has to ensure that it is viewed purely
as a measure to monitor a given situation and not as the situation or problem itself. The KPIs

58
indicate a given position in this case the quality of the inherent data. The KPIs are intended
to measure the improvement or otherwise in the quality of the data, the processes and the
employees’ activities. There is strong evidence to suggest that actions have be been taken in
some sites solely to ‘improve the score’ which have subsequently proved detrimental to the
sites’ overall performance. Such actions which sub-optimise business performance must be
outlawed.
The source data is extracted straight from the Baan ERP system each evening into a data
mart from which the management reporting tool updates the KPI reports overnight in order
that they always reflect the previous day’s position. The reports take the form of numeric and
graphical data. Although graphs and charts are useful in depicting trends, the main attention
has focussed upon the numeric data which takes the form of detailed aged listings of each of
the individual transactions which comprise each category and are reported by site, business
and total company. It was accepted that the majority of recipients were not acquainted with
the detailed workings of Baan so it was decided at the beginning, to set the data within the
business intelligence reporting tool alongside the other factory and business reports for easy
access, with the ability to view and print at any time. The detailed KPI reports were developed
and constructed during late 2005 and early 2006 and were first made available in April 2006.
The importance of being able to measure progress was appreciated fully, especially as the
seven components are somewhat disparate and so therefore it was decided to create a table
to summarise all seven reports within a weighted index incorporating the concepts of the
Balanced Scorecard (Kaplan and Norton 1992). The weighting was based upon the age of
each transaction aggregated into thirteen monthly periods relating to the Company’s annual
accounting timetable, commencing with the current period, with the thirteenth containing
transactions twelve months old and over. Each successive period was allocated a higher
weighting in recognition of fact that transactions are more significant the older they become.
The exception to this was the report covering credit notes as it was agreed that the position
should be one of improvement and as a consequence the weighting was reversed with the
newer periods receiving the higher weighting than older ones. After the end of each
accounting period any outstanding transactions are then subsequently aged by a month. A
separate index was produced for each site with an aggregated one for each business.
KPI Roll Out and Development Initial Development
The KPIs reporting process was first made available initially from April 2006. In tandem, the
weighted index was also being developed and finally completed in July of the same year. A
very rigorous testing programme was carried out within all facets of the reporting mechanism.
As part of this process individual pilot operations were run with a number of the businesses to

59
test the validity of the data, ease of use and understanding of both the results and the
weighting mechanism. This process took a considerable period of time, recognising that it
was imperative that any instrument designed to measure the accuracy of any data, MUST be
totally error free, or all credibility in the measurement process would be lost forever. It was
also appreciated that to ensure continuing on-going use and acceptance, the reporting should
also be easy to use and understand from both the data source and the implications of the
outputs.
Initial Reporting Process
The formal reporting process commenced in September 2006 with the publication of the
weighted index initially on a fortnightly basis circulated to the senior members of the Finance
Department and the Director of Finance by way of an email attachment. In addition, detailed
guidelines were also published outlining the background and justification, together with
instructions for use. It was agreed that each finance manager would be the focal point to
cascade the initiative throughout their individual businesses and obtain the necessary buy-in
at all levels. The reporting consisted of two high level summary reports comprising an overall
index for each business and another providing the information by site within each business. A
more detailed summary report was also added at certain times. During this initial period the
researcher visited a small number of the business offices and sites to support the initiative.
Extension of Reporting Process
In September 2007 the circulation list was extended to incorporate the Business Managers
and an additional member of the Executive Team, which raised the profile further. Every effort
was made to try and ensure that this was viewed by all as a company-wide initiative and not a
financial, IT or corporate project. Emphasis was placed on the fact that the data was owned
by the businesses and that they were therefore responsible for its quality. Whether or not this
was accepted at the time is a moot point. The reporting was further expanded in September
2008 to take in both the individual businesses’ operations managers and the recently formed
Operations Forum, a format to discuss operational issues and share ideas and best practice.
One attended a number of these meetings where data accuracy was discussed. Further
business penetration took place in January 2009 when all the individual factory and site
managers were added together with certain relevant supervisors. Within this period the KPI
Index was elevated in terms of management and exec reporting. In January 2008 it was
included in the Quarterly Business Review meetings between the Exec and each business
and in December 2008 individual quarterly targets were set and agreed for each business and
measured on a monthly basis. A summary of the roll out is set out in Figure 6 below
Roll out of the Data Accuracy KPI Reporting
September 06 Finance Community and Finance Director

60
September 07 Added Business Managers and Exec member
September 08 Added Operations Managers and Operations Forum
January 09 Added Factory and Site Managers and certain support staff
January 08 Included within the Quarterly Business Review meetings (Business Management Teams and Exec)
December 08 Quarterly Index targets set for each Business
Figure 6 Data Accuracy KPI Index roll out
Review of the Reporting Process The programme of expanding the circulation and overall corporate exposure depicted above
may be considered to be somewhat ad hoc in that it did not conform to any initial detailed pre-
determined agenda; rather, it developed and evolved over the period, in line with the
researcher’s own learning process, both as part of this study and as further development of
one’s practical business experiences. With hindsight the process may have been accelerated
a little but the overall aim has been to inculcate rather than inflict the concept. It was also felt
that it was important that it be seen as a cross-functional business-wide project rather than a
centrally imposed reporting and control structure.
The Data Accuracy KPI Index is essentially a barometer of the effectiveness of the related
processes they measure and not an end in itself. Any lasting improvement is predicated on
the effectiveness and quality of the processes and the way in which any persons interacting
with the processes adhere with the agreed requirements. If the processes are right the
improvements in the KPIs should fall out as a direct result.
It was appreciated that this roll out was essentially a top-down process attempting to engage
all the relevant elements of each business via the normal management channels of
communication. The initial phase saw a high degree of success, which continued in a number
of areas due mainly to the enthusiasm of certain managers who were really passionate about
the subject seeing real practical merit in what was being attempted. It became evident in 2008
that not everyone was on board and that the real message had not being delivered deep into
all the factories and business offices. A Modernisation Programme had taken place during the
early part of 2008 with the closure of a third of the sites and the restructuring of a number of
businesses, coupled with certain key staff choosing to accept or volunteer for redundancy, all
of which took place within a six to eight month period from March 2008.
Whilst the Modernisation Programme achieved its strategic, financial and operational targets,
a natural outcome was the understandable re-focussing of everyone’s objectives onto the
new structure and the related business development projects. As a result the data quality

61
initiative found itself competing for peoples’ focus with other equally if not more personally
pressing priorities. A consequence was a rapid decline in the overall quality of the data as
measured by the data accuracy KPIs and a general concern that the overall momentum had
somewhat dissipated. It became evident that a re-launch was required and this would be best
achieved by attempting to communicate at a factory and business office level with the
relevant business and site managers and their relevant teams. This was seen not just as a
means of promoting the data accuracy reporting, but as an opportunity to engage with those
individuals who acted as the ‘data producer/custodians’ in addition to ‘data consumers’, to
promote the ideal of data quality and obtain their views, input and feedback into the overall
concept of data quality and its sustainability. This process formed the internal qualitative study
using an action research approach detailed below in Section 11. Site visits had taken place
previously on a number of occasions on an ad hoc basis, but not as part of any
comprehensive, planned project. The progress made through the initial two years of the
programme indicated that whilst there was enthusiasm in many areas towards the concept of
data quality, such interest was mainly tacit. This meant that real progress towards creating
any degree of sustainability faced many challenges. This research has attempted to identify
and explore these challenges to determine ways to create an environment for enduring quality
data.
Having established the context within which the research is to be conducted, the following
section explores the approaches to both the qualitative and quantitative research.

62
9. THE OBJECTIVE OF THIS RESEARCH The objective of this research is to discover the means by which the quality of data can be
improved, but more fundamentally, become embedded within an organisation. This study
used a dual research approach employing both qualitative and quantitative research
strategies focussed within the researcher’s own organisation. Such multiple methods of
enquiry are capable of knitting together different types of evidence Williams and Pollock
(2009:14) to produce more robust and richer understandings (Williams and Pollock 2009:15).
Internal Qualitative Study Action Research
It was decided to employ a qualitative site-based action research approach to involve and
engage with those colleagues who interact with and influence the quality of the data at
source, being the method most likely to produce the essential insights into peoples’
perceptions (Eden and Huxham 1996:82). Action research, as the title implies, focuses upon
action to promote and manage change, based on the philosophy of learning, planning and
then taking action in order to change a part of reality (Jarvinen 2005: 13). Lewin (1946: 42)
saw action, research and training as a triangle, emphasising that to improve the actions one
must first train the personnel. Lewin (1946: 38) identified research as ‘fact-finding’ or
‘reconnaissance’, a means of ascertaining whether one is moving in the right direction and at
what speed, involving four stages to: evaluate the action; gather new insights; plan the next
step; as a basis for modifying the overall plan. This was seen as part of a ‘spiral of steps’,
each “composed of a circle of planning, action and fact-finding about the result of the action”
(Lewin 1946: 38). Kemmis (1993:3) suggested that action research provides a way for people
to enhance their lives through a research process that widens their social structures and
related processes, being a pragmatic approach which looks to come to terms with the world
(Baskerville and Wood-Harper 1996: 239); Fisher (2004: 45-46) emphasised the aspects of
learning from experiences, by taking action and monitoring the consequences and then
developing and promoting improvement and change within an organisation. Bryman and Bell
(2003: 304) identified action research as a real life experimental process enabling an
organisation to solve problems through a process of identification, planning, action and
evaluation. This may then lead to the re-education and the changing of peoples’ patterns of
thinking via action through participation, thereby contributing to both academic theory and
practical action Bryman and Bell (2003: 304), This link between theory and practice then
becomes relevant to both the practitioner as well an academic audience Eden and Huxman
(1996: 83), simultaneously assisting in practical problem solving and expanding scientific
knowledge (Baskerville and Wood-Harper 1996: 239). This again echoes the sentiments of
‘engaged scholarship’ developed by (Van de Ven and Johnson 2006; and Van de Ven 2007).
Indeed Van de Ven (2007: 281-2) identified action research directly as a form of engaged
scholarship.

63
Action Research within Planning and Information Systems
Action research is not a unique approach within ERP systems, however the majority of the
literature has followed the established trend and focussed upon ERP procurement and
implementation Akkermans and van Helden (2002); Stefanou and Revanoglou (2008);
Walsham (2006); Beyon-Davies, Baker and Williams (2008); Deep, Guttridge, Dani and Burns
(2008); Bohorquez and Esteves (2009) and system enhancement Klueber and Alt (2000);
Adams, Baker, McFadzen, Miller and Smith (2004), without any real focus upon the quality of
the data.
Whilst action research figures within the information systems literature Baskerville and Wood-
Harper (1996); Baskerville and Wood-Harper (1998); Baskerville (1999); Lau (1999): Kock,
Davison, Dias Figueiredo and da Cunha (2002); Stirling, Petty and Travis (2002); Kock
(2003); Baskerville and Myers (2004); de Vries (2007); DeLuca, Gallivan and Kock (2008),
there is a distinct lack of any direct reference to data quality. The use of action research
approach within information systems research is considered to be “very appropriate”
Baskerville and Wood-Harper (1996: 235); “the most scientifically legitimate approach
available” Baskerville and Wood-Harper (1996: 240); “a rewarding experience” Lau
(1999:170); “a potential avenue to improve the practical relevance of IS research” Baskerville
and Myers (2004: 239); whilst DeLuca, Gallivan and Kock (2008: 66) anticipated an increase
in the use of action research over the following ten years. The potential for action research to
contribute to theory and practise is also emphasised (Baskerville and Wood-Harper 1996:
239; Lau 1999:170; Kock, Davison, Dias Figueiredo and da Cunha 2002: 1; Baskerville and
Myers 2004: 330; Jarvinen 2005: 4; de Vries 2007:5; DeLuca, Gallivan and Kock 2008: 66).
The Application of Action Research within this Study
One must not underestimate the potential tensions that exist when employing an action
research approach, in particular where research projects are being carried out by part-time
students working within their own organisation in a work-based environment. This is further
exacerbated within this study by the fact that this research is not being undertaken purely for
academic purposes but alongside an actual ongoing operational improvement programme,
making this study very much a form of ‘participatory’ action research. Coghlan (2007:335)
discussed such ‘practitioner doctorates’ where middle or senor managers carry out doctoral
research within their organisations, employing an action research approach, combining work
and study. Within this context Bryman and Bell (2003:305) described three interrelated issues
associated with, the pre-understanding of the setting, role duality and organisational politics.
Coghlan (2007) and Roth, Shani and Leary (2007) discussed these issues in detail within the
framework of research into insider action research. Being an ‘insider’ with a pre-
understanding of the organisation, the researcher may be too close to the data Roth, Shani

64
and Leary (2007: 47), finding it difficult to stand back (Coghlan 2007: 339). The dual roles of
organisational member and researcher also have the potential to cause conflict (Coghlan
2007:339; Roth, Shani and Leary 2007: 51). Roth, Shani and Leary (2007: 51) also identified
a third role, that of an ‘internal consultant’. Organisational politics also play a part with the
potential to undermine or block planned change (Coghlan 2007: 340). The ‘internal
researcher’ or ‘political entrepreneur’ Coghlan (2007: 340); Roth, Shani and Leary (2007: 44),
has to appreciate and understand the workings and culture of their organisation Roth, Shani
and Leary (2007: 58) and have credibility to be able to achieve ‘buy-in’ from colleagues (Roth,
Shani and Leary 2007: 58).
Whilst one appreciates the reservations and caveats discussed above, one feels that a
researcher working within their own known professional environment has the opportunity to
generate rich and valuable findings to benefit both the research outcomes and the
organisation as a whole. Within this study, role duality was not considered to have negative
consequences; it was felt that a ‘sympathetic’ pre-understanding of the setting, knowledge of
the organisational politics and a reputation for providing help and advice in the past has the
capacity to make the process credible, to generate considerable buy-in from participants,
avoiding conflict, and thereby make change and learning possible. Whilst it is accepted that
being ‘close’ to the data with the inherent difficulties in being able to ‘stand back’ may cause
possible problems, it is felt that this should be overcome if the researcher is aware of such
potential issues and allows the participants freedom to become involved and contribute fully.
Every effort was made to ensure that this happened.
Given that this study employed an insider action research approach where the researcher had
intimate knowledge of both the business processes and the Baan application, there was a
distinct danger that one could become the ‘major source’ of the solution. To guard against
this, one made every attempt to ensure that as many participants as possible had the
opportunity to make a contribution. There were occasions where one’s advice and opinion
was sought as part of the general discussions and in such circumstances a response was
provided. Every effort was made to ensure one remained objective and that one’s views were
never imposed upon the proceedings. The positive responses from each meeting appear to
be evidence that everyone felt that they had made a positive contribution.
Whilst undertaking work-based research one must also place this within the areas of
theoretical inquiry. Both Bryman and Bell (2003:304) and Eden and Huxman 1996: 80)
suggested that there appears to be little difference between the roles of an academic
researcher and a management consultant and action research and consultancy. (Eden and
Huxman (1996: 79) also identified and discussed two groups, the ‘consultant as researcher’
and the ‘researcher as consultant’, both reflecting a practical orientation although satisfying
different audiences. The former, which seeks to bring about improvement by forms of

65
‘tweaking’ to improve practice Eden and Huxman (1996: 79) is viewed as closest to this
research, although in the light of a previous discussion, the term ‘practitioner as a researcher’
may to be more apt. Whilst action research does not lend itself to repeatable experimentation
and has not traditionally been seen as an ideal means for the rigorous testing of theory Eden
and Huxman (1996: 80), it does have the powerful potential to generate rich data around
people and their actions Eden and Huxman (1996: 80) especially within this context, where it
may be seen to have enhanced this research, as will be discussed further in Section 17.
Within this study the process of action research is seen as the means of developing a deeper
understanding of the organisational conditions within which the quality of data can be
improved, by colleagues working together towards a common accepted goal in terms of a
‘collective involvement’ to manage organisational change (McNiff 2002: 27). In this context
the action research process leads to individual learning not only by the researcher but by all
participants in the form of ‘organisational learning’ (McNiff 2002: 28). Without this element of
collaborative action learning any improvements would have little chance of any degree of
permanency. Action research may be seen as the external collective ‘We’ element whilst
action learning relates to the internal ‘I’ allowing the external experiences to become
inculcated.
In Figure 7 below McNiff (2002: 7, 11-12) provided a generic action research model, depicted
diagrammatically in black, which underscores the salient points surrounding action research
and also provides a very practical action plan for applying the concepts. This has then been
adapted to relate more closely to this study as detailed in blue, to which has been added a
‘return loop’ in red to represent each subsequent site/business meeting following similar
processes, hopefully learning from the prior experiences. One may also see a direct
correlation with the quality management cycles of Plan, Do, Check, Act (PDCA- TQM) and
Define, Measure, Analyse, Improve, Control (DMAIC-Six Sigma).

66
Identify the issue(s)
Devise potential solution
Try potential solution
Evaluate does it work?
Implement change practice
Yes
No
The quality of the data
Meetings with the sites/businesses to discuss issues and best practice
etc
Apply the agreed solutions
Obtain feedback and review measures
Re-define the issues in light of the results
Publicise findings: short term guidelines/issues/ongoing
suggestions
Generic Process Application to this Research
Separate process for each meeting whilst
learning from previousexperiences
Figure 7 Applied model of action research for Remploy
Based upon McNiff (2002: 7, 11-12)
The practical application of this model is detailed within Sections 11 and 12
As highlighted within Section 8 this qualitative study had a distinct practical origin relating to
the re-launch of Remploy’s data quality initiative following the completion of the initial phase
of the Modernisation Programme which saw a rapid decline in the overall quality of the data
as measured by the Data Accuracy KPIs.
One of the main aims of this project has been the attempt to highlight the importance of
getting the data right first time by the application of root cause analysis and correction of data
errors at source. The qualitative study was viewed very much as a two-way education and
learning process by which the site and business teams would be able to become more
acquainted with the data quality initiative and all that entailed, but even more importantly be
able to provide rich feed back, utilising the concepts of collaborative action research (Miles
and Huberman 1994:9). It was intended that this would enable best practices to be developed
and communicated, important issues and problems to be identified and solutions worked
upon, along with the development of longer term principles and guidelines.

67
Internal Quantitative Survey The quantitative survey, in the form of a self-administered web-based questionnaire was
distributed to the one hundred and eleven recipients of the Data Accuracy KPI reports during
the summer of 2009 using NTU’s own survey tool Autoform. This was viewed as an essential
development of the overall data quality initiative not just as a follow-up to the site visits, but to
complement this process, as a further means of measuring peoples’ views and perceptions of
the quality of their data and to gain additional valuable insight from all levels of the
organisation. The cultural climate was also seen as appropriate. Just as one chose to carry
out an external quantitative survey for Document Four during the run up to the Modernisation
Programme, the post Modernisation period was seen as ideally suited to a re-appraisal of
those important ideals and concepts of which data quality was viewed an essential element.
Each of the two research processes is described in detail within forthcoming sections,
however prior to undertaking any form of research, one has to be mindful at all times of the
ethical implications of the researcher’s actions. The next section discusses this topic in detail
with particular reference to the research carried out as part of this study.

68
10. ETHICAL ASPECTS OF THIS STUDY Remploy’s Ethical Standards The main research undertaken for this document has been carried out with the author’s own
organisation. Remploy has developed a code of moral practice allied to its five key values,
which guides the organisation’s very existence and dictates its moral climate, without which it
would find it impossible to operate. These values of Professionalism, Passion, Respect,
Openness and Keeping Promises, again echo the moral principles of total openness, honesty,
respect for others and integrity. Within the context of Remploy, the author has executive
approval to undertake this project and has been a member of the organisation for over sixteen
years working closely within all aspects of the business, not only within Finance and IT. This
enabled the researcher to build up a network of colleagues over a number of years, gaining
their respect and support which has assisted considerably in gaining access and facilitating
the qualitative and quantitative research detailed here. The Company’s values and associated
culture, together with the enduring relationship one has developed with both the Company
and one’s colleagues helped formulate the ethical principles employed throughout this entire
research. One has then been able to build upon these professional relationships, a number of
which were able to set up further contacts within their own individual areas. It was recognised
however that this places even greater pressure on maintaining those moral principle of total
openness, honesty, respect for others and integrity not only to maintain one’s own moral and
ethical integrity and reputation, but to ensure that none of the supportive colleagues were let
down.
There are a number of generic ethical guidelines that relate to all forms of research, in
particular, adherence to legal requirements including the Data Protection Act, organisational
procedures, confidentiality and anonymity, the keeping of promises together with the
obtaining of permission to publish. From previous research, certain key moral values and
principles emerged which can be applied equally to both business and life ethics. The detailed
code of practice published by the Economic and Social Research Council within its Research
Ethics Framework Economic and Social Research Council (2006), encapsulates a great deal
of the literature on the subject. It constitutes a set of minimum generic standards which
encourage good ethical practice in social science research encapsulated within certain key
principles in that the research should be designed, reviewed and undertaken to ensure
integrity and quality.
This section will focus and evaluate those ethical elements which appertain directly to the
research undertaken as part of this project. This area of investigation embraces both the
practical challenges of undertaking this specific research together with a review of the related
literature. The intention is to identify the principles that should be followed and also in more
detail the implications and challenges that have emerged.

69
Security The questions of confidentiality and anonymity have been highlighted, which then leads onto
a discussion as to how these elements may be controlled. The issue is not just about the
researcher ensuring that research details are not disclosed directly to other parties for
example by word of mouth, but heavily involves the matter of data security and its storage in
either hard copy or electronic format. The author ensured that only summary data was being
kept as a hard copy without any direct reference to any research contributor. The exception to
this is where an individual is referred to within any of the six documents (other than as a
published literature reference), but this is only made with the explicit authority of the person
quoted and is used in support of a particular relevant position or stance. Some of the detailed
information containing direct references to individuals, was gathered from face to face
meetings and written down, but this data will not be retained as a hard copy, but committed to
electronic applications such as Word or Excel. The original material will be disposed of
securely (using Remploy’s document disposal service) after the completion of this research.
Electronic Security The questions of security around the various electronic formats pose far more complex
problems. The entire data is held on the author’s own company laptop, essentially in Word,
Visio, SPSS and Excel files secured by special encryption software. This data is also stored
upon a back-up media within the Remploy IS network as part of the company’s back-up and
disaster recover policy and procedure. Detailed person-sensitive data is also held externally
on NTU’s web based survey tool Autoform which has been used to carry out two electronic
questionnaires. Satisfactory evidence has been obtained to indicate that the data held within
the Remploy network and NTU’s Autoform environment, meets acceptable storage and
access requirements to provide adequate security.
Ethical Aspects of Qualitative Research Relating to this Study Action research relies upon total openness amongst the participants with the respondents in
particular feeling able to make a contribution without fear of any repercussions. Likewise the
researcher must ensure that no one is ever placed in a position where this is likely to occur.
Each site visit was designed to both provide information and gather data by enabling open
discussion to take place within a positive blame free environment with each party able to
share thoughts and ideas around a common goal. The researcher also tried to ensure that the
respondents were revealing their own opinions and not those which they thought that should
be given. In line with this policy of openness, all the notes taken by the author at each
meeting were circulated to all participants in bullet point form with a request for confirmation
and feedback.

70
Gill and Johnson (2002: 93-94) referred to certain ethical issues relating to action research
including the acceptability of the client/project to the researcher, the values relating to the
parties and the confidentiality and the protection of respondents. They further identified that
there may be circumstances where respondents wish to remain anonymous which in practice
may prove very difficult, in addition some business may be happy to be identified in any
subsequent publications whilst others may require anonymity. Miles and Huberman (1994:
290-297) identified certain specific ethical issues surrounding qualitative research: the
worthiness or value of the project; the competency and expertise of the researchers; obtaining
informed consent; the benefits/costs trade-off; potential harm and risk; trust and honesty;
privacy, confidentiality and anonymity; research quality and integrity; and the use and miss-
use of the results and potential conflicts, dilemmas and trade-offs. The author is aware of
these issues and concerns but feels that these potential problems were not present within the
study. In many cases an invitation came directly from the businesses and throughout the
proceedings there appeared to be no evidence of any negative attitudes or consequences.
Ethical Aspects of Quantitative Research Relating to this Study Gill and Johnson (2002: 121) discussed the circumstances of survey research conducted
within a single organisation commissioned by an interested party. The salient points
recognised that, consultation should take place as to the purpose of the survey, with the
opportunity for fellow colleagues to have input into the survey design, together with an
acknowledgement that the results could have implications for all concerned. All these points
were accepted and taken into consideration within this study.
The use of internet-based research compared with the more traditional modes of
communication brings with it certain concerns. Nosek, Banaji and Greenwald 2002) identified
ethical issues relating to the absence of the researcher, potential exposure of confidential
data and/or identity to a third party and lack of detailed de-briefing facilities. They also
highlighted related security questions surrounding confidentiality and anonymity, security of
data transmission and data storage, the tracking of participants over a period of time and the
possibility of miss-behaviour by participants, intentional or otherwise. These issues are all well
founded but have been dealt with earlier within this section.
Having established the ethical principles governing the research for this thesis, the following
section describes the qualitative research process that was employed.

71
11. INTERNAL QUALITATIVE STUDY
The qualitative research for this document has been built upon the experiences and lessons
learnt from the research carried out within Document Three. This involved the use of focus
groups in conjunction with an action research approach utilising process mapping, to collect
data around processes and procedures within Remploy’s operational and manufacturing
environment. This was aimed at obtaining a better understanding of the data flows and assist
in deriving a greater appreciation of the data as it interacts with people within the relevant
processes. The qualitative element of the research for this document took the format of a
series of discussion-type focus group meetings sharing experiences, ideas, issues, problems,
successes, around a basic flexible agenda, whilst still employing an action research
approach. This approach was less formal excluding the use of process mapping as the main
intention was to generate discussion and interaction to discover peoples’ real feelings and
attitudes towards their data. Such “local qualitative research may provide better tools for
drawing out intricacies…opening up new understandings of novel and emerging phenomena”
(Pollock and Williams 2008:110).This section places this interactive process of data
collection, within the overall context of focus group and action research, whilst relating the
direction of the meeting agenda to previous discussions within this study.
As stated previously, the researcher decided that a re-launch of the data quality improvement
initiative was necessary and this would be best achieved by working together with those
colleagues who were actively undertaking the vital ‘customer order receipt……to final
payment’ processes, at factory and business office levels. At the outset there was not a
specific plan in place to visit the majority of factories, but to concentrate initially on around a
dozen. These were intended to be a mixture of those that were viewed to have performed well
during the initial two years and those that had performed less well, in an attempt to ascertain
the factors behind the variations in performance as well as to reinvigorate the entire initiative
and instil a degree of sustainability. Also after attempting to engage the businesses from a
‘top-down’ perspective, it became apparent that more balanced method involving a ‘bottom-
up’ approach would prove more beneficial. This was also seen as a key factor in part to
overcome instances in a number of the businesses where it was claimed that the ‘message’
had never been cascaded down to all levels. There was also a realisation that this was the
‘right thing to do’, in that it provided an opportunity to engage with those individuals who acted
as the ‘data producers’, ‘data custodians’ and ‘data consumers’, to promote the whole ideal of
data quality and obtain their views, input and feedback into the overall concept of data quality
and its sustainability. These practical aspects dictated the nature of the qualitative research
for this document, but to complement this, the recognition of theoretical and academic
research principles helped to enrich the overall outcomes. This is a further example of the
congruity between theory and practice

72
Focus/Discussion Groups It was decided to eschew the more formal focus group/process mapping approach, used in
Document Three, in favour of a more informal process engaging those individuals who where
actually responsible for the factory and business processes. Remploy is essentially a mini
conglomerate and whilst not every location is identical, in size or complexity, the basic
functions of production, purchasing, sales and administration exist in varying degrees in all
sites and the representatives covering each of these functions together with the relevant
management and/or supervisory personnel were the obvious colleagues to involve. It was felt
that a more informal atmosphere would generate a more relaxed environment to enable more
free and frank discussions to take place, although it was acknowledged that this would
depend greatly upon the mood and tone set by both the researcher and the local
management team (Pearce 1998: 72).
Whilst an informal discussion approach was considered the most appropriate, one must not
lose sight of the fact that these ‘inter-active engagements’ were conducted within a focus
group type environment, in the form of free flowing open discussion on a focussed topic
Bryman and Bell (2003: 368, 570); Fisher (2004: 45), attempting to ‘tease’ out facts and
information from the participants to construct meaning (Bryman and Bell 2003: 371). Within a
well constituted focus group, participants are able to discuss issues and topics that are
important and significant to them, whilst engaging in an open dialogue where each can
share, argue and challenge each other’s views (Bryman and Bell 2003: 369). Such an
environment can assist individuals to define their issues and problems and work together to
identify and apply potential solutions (Bryman and Bell 2003: 369).In this way focus groups
can help group norms and cultural values, encourage open conversation, facilitate the
expression of ideas end experiences, encouraging participants to generate and explore their
own questions and experiences, by tapping into a wider form of understanding (Kitzinger
1995: 302). Focus groups are sometimes criticised because of the unsystematic nature of the
sampling process and the potential difficulties of replicability and reliability (Bryman and Bell
2003: 371). However in this study, this approach is seen as both a strength and an
advantage, because the resultant participation and unpredictability of the outcomes,
particularly where strong personal interaction takes place, was the most appropriate method
for this particular topic (Eden and Huxham 1996:82).
The Data Capture Process The data capture process took the form of a series of face to face meetings carried out at a
number of the Company’s factories and business offices, supplemented by conference calls
used where either sheer distance or time precluded a physical meeting. The meetings were
arranged in a number of ways; by the author contacting individual sites, upon the receipt of an

73
invitation from a site, or a number of visits organised via a member of a business
management team. As the process developed the majority of the further meetings were
requested either by individual sites or by a site-owner business. A generic agenda was
developed to focus each event and identify the main points of discussion, whilst still being
flexible enough to tease out any other relevant issues. These agenda points embraced:
• Discussion on the overall Corporate Data Quality Improvement Initiative with
particular regards to the Data Accuracy KPIs and the way in which these
support the overall process
• Implications for the site and business
• The Site/Business KPIs
• Priority areas
• Short term actions
• Medium term approach
• Ensuring that everyone is aware of the implications of their actions and
responsibilities
• Any further relevant points
This generic agenda encapsulates also the recurring themes around Processes and People,
together with the Cultural/Organisational themes relating to measurement and reporting,
communication, change management and short and long term priorities, identified from the
review of the literature as detailed in Table 2 on pages 50-52.
As stated the initial plan when commencing this study was to cover around a dozen sites, but
it became apparent immediately from the outset, that there was a distinct appetite, across all
levels within the manufacturing businesses, for better quality data as sites and businesses
rapidly requested a visit. This gathered a momentum, which led one to decide to expand the
initiative to encompass as many sites as possible. This valuable additional access has not
only widened the improvement process within the organisation, but has expanded the
researcher’s insight, to further identify understanding around this subject.
Every effort was made to ensure that this was not viewed as ‘a visit from Head Office’ or as
just another training session, but as a two-way information exchange. Notes were taken by
the researcher and were then written up in bullet point form, usually within twenty four hours,
to a predetermined format and circulated to all attendees for their comments and feedback.
These outcomes were then analysed and the findings generated as lessons learnt and to be
learnt, reproduced in the form of key findings, short term guidelines, issues and ongoing
suggestions for improvement as described in the following section.

74
12. QUALITATIVE STUDY- ANALYSIS AND FINDINGS This section summarises the actual research process, analyses the results from this research,
identifies related key findings and then proceeds to provide guidelines as to best practice,
recognising certain issues and problems and finally offers suggestions for future progress.
The Research Process The main thrust of the process took place between December 2008 and April 2009. In all,
forty eight of the fifty four factories and seven business operations and sales teams were
covered. Thirty four separate locations were actually visited, a number of these events
comprised representatives from two or more factories in the form of regional cluster meetings,
to speed up the process, reduce travelling and share experiences. In addition three
conference call meetings were also held where it was not possible to arrange for all the
participants to be together at the same time. Four of the factories also received a second visit
after a specific request. Over this time the author travelled almost eight thousand miles. The
process is summarised below in Tables 3 and 4:
Analysis of the meetings
Meetings covered by: Site Visit Joint Meeting Conference
Call Total
Factories 30 12 6 48
Operations Teams 4 2 6
Sales Teams 1 1
Additional meetings 3 1 4
Total 37 13 9 59
Table 3 Analysis of the meetings
Timescale of the meetings
Oct 08 Dec 08 Jan 09 Feb 09 Mar 09 Apr 09 Sep 09 Total
1 13 18 3 15 8 1 59
Table 4 Timescale of the meetings

75
The number of attendees at each meeting (excluding the researcher) varied between one and
six in respect of the pure site factory visits and up to nine in the case of business
operations/sales meetings. There was also quite a breadth of job roles represented, from
sales, procurement, finance, administration and well as operations and in total in excess of
130 people took part.
Every attempt was made to include all participants in the discussions whenever possible,
although there were occasions where some attendees’ natural reticence may have prevented
them from participating fully. In these circumstances one had to reply upon the local manager
and other colleagues to compensate. The ability of the researcher to gain full access to such
a wide and diverse contact base added considerably to the overall richness of this research.
This is reflected not only in the volume of the sites covered and people interviewed, but also
the extent to which virtually everyone appeared eager to participate fully and attempt to make
a contribution. The overall feedback proved to be very positive and one did not detect any real
degree of negativity. Some very interesting comments emerged particularly relating to the roll
out of the Data Accuracy KPIs themselves. A number of managers and their staff stated that
they had never previously been aware of their existence. This immediately brought into
question the method by which this and other initiatives had been implemented, raising
uncertainty as to the quality and effectiveness of employing purely internal top-down
communication processes.
Analysis The initial meetings followed the basic format of the generic agenda described above, but
additional related priorities quickly began to emerge alongside the original aim of re-launching
the data quality initiative, on the back of re-focussing attention onto the Data Accuracy KPIs.
The wider perspective emerging from the research, with regard to sustainability, became a
real objective, mirroring the progression of this entire study. Whilst the term ‘sustainability’
was only mentioned briefly, discussions revolved around; ‘what data quality means’, ‘why it is
so important?’, ‘how the KPIs fit in with and contribute towards this concept’, ‘what has gone
well and what has gone poorly in relation to this?’, ‘what are your problems and issues?’,
‘what are your suggestions for improving things?’, ‘how can each factory and business make
a considerable contribution towards improving data quality?’. It was also recognised that four
of the seven KPIs were within the direct control of each factory but the remaining three
required input from other sources both internal and external to the Company. The format of
the discussion evolved to encompass:
• Re-focussing the Data Accuracy KPIs within the perspective of the overall
data quality landscape
• Identifying and highlighting good and bad practice

76
• Identifying issues and problems
• Developing best practices within both the short and medium terms
• Determining how best this may be implemented
• Leaning from the above to improve on-going practice- (Action
Research/Learning)
The discussions were captured and recorded by the researcher in bullet point form and
circulated around all attendees as soon as possible after each event. Feedback was
requested and any resultant comments were noted and added where applicable. In all thirty
seven separate events were recorded in this way. This process generated two hundred and
fourteen points of discussion, a number of which were repeated on several occasions as one
would imagine.
These principle themes noted from each meeting, were then analysed further within
Framework 1- Appendix 1a.
The data was arranged in columnar form analysed by:
• Site/Department ) Although for the purposes of this document
• Business ) individual personal, site and business information
• Date of the meeting ) has been excluded to preserve anonymity
• The detailed agreed discussion points relating to each site/business meeting
The discussion points were then analysed into five major categories colour coded to aid
identification:
• Current actions and policies- The way we are doing things currently
• Issues and problems- Issues and problems identified
• Actions to be taken going forward- What we are going to do in the short and
medium term
• Current culture- Current inherent thinking, attitudes and behaviours
• Future culture- Intended inherent thinking, attitudes and behaviours
These categories were chosen to reflect the nature of the action research approach
employed, in that a review of the current actions and policies would help to recognise both the
good and poor practices, from which the issues and problems could be identified, leading to
actions going forward to promote and further embed better practices across the entire
business in a form of action learning. Current cultural and behavioural issues were examined
to determine whether they were enablers or restrictors, to be developed or eliminated and
thereby assist in developing future positive cultural practices to facilitate ongoing progress.
Framework 2- Appendix 1b then proceeded to consolidate the discussion points within each
separate category and in the case of the current culture and current actions and policies,

77
classified further as being identified as a positive (+) or a negative (-) influence. Table 5 below
summarises the results.
Current
Culture
Current
Actions
and
Policies
Issues
and
Problems
Actions
Going
Forward
Future
Culture Total
Total 27 25 52 82 11 214
Positive 19 23
Negative 8 2
Table 5 Framework 2
Both Framework 1 and 2 were developed to consolidate all the various conversational strands
in an attempt to identify related topics and ideas. From the outset certain important notions
and impressions emerged from the discussions and this analysis and these were
subsequently developed as key findings. It was felt that these fell in three broad categories
relating to: lessons learnt that should be put in practice at all sites, involving basic quality
management principles, ownership, responsibility and support, together with measurement
and reporting; positive personal motivational factors which help to engender commitment from
individuals, relating to internal competition and targets, an acceptance of best practices and
how these relate to one’s ideas and principles; together with organisational; and cultural
environmental elements essentially involving leadership and management issues. A detailed
analysis of these key research findings appear in Appendix 2A. These generic findings will be
discussed further within Section 16, as part of the consolidated review of the research
outcomes.
Recommendations for Action At the end of March 2009, with 85% of the meetings completed, a detailed appraisal of the
whole procedure was carried out, taking into consideration the meeting process, the
discussions that ensued and their subsequent analysis in Frameworks 1 and 2, the key
findings, together with a review of the performance of the Data Accuracy KPI Index during the
period of this qualitative study. A number of guidelines, issues and suggestions for future best
practice were distilled from the evidence of these deliberations. The researcher decided that it
was important to communicate the salient action points emanating from the meetings, to re-
enforce ongoing practices, provide guidance towards optimising processes and procedures
and to identify problems to be resolved. In addition it also provided all participants with
evidence that the information sharing process was real and that everyone’s contribution was
considered important and had received due attention.
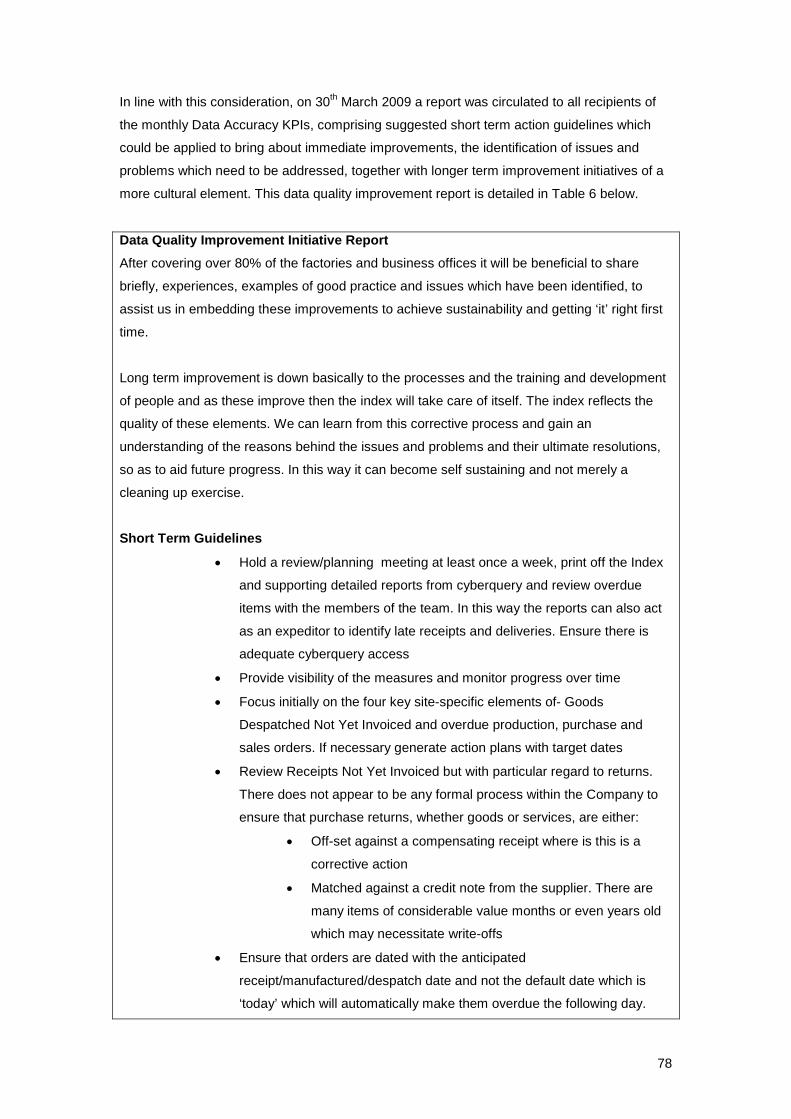
78
In line with this consideration, on 30th
March 2009 a report was circulated to all recipients of
the monthly Data Accuracy KPIs, comprising suggested short term action guidelines which
could be applied to bring about immediate improvements, the identification of issues and
problems which need to be addressed, together with longer term improvement initiatives of a
more cultural element. This data quality improvement report is detailed in Table 6 below.
Data Quality Improvement Initiative Report
After covering over 80% of the factories and business offices it will be beneficial to share
briefly, experiences, examples of good practice and issues which have been identified, to
assist us in embedding these improvements to achieve sustainability and getting ‘it’ right first
time.
Long term improvement is down basically to the processes and the training and development
of people and as these improve then the index will take care of itself. The index reflects the
quality of these elements. We can learn from this corrective process and gain an
understanding of the reasons behind the issues and problems and their ultimate resolutions,
so as to aid future progress. In this way it can become self sustaining and not merely a
cleaning up exercise.
Short Term Guidelines
• Hold a review/planning meeting at least once a week, print off the Index
and supporting detailed reports from cyberquery and review overdue
items with the members of the team. In this way the reports can also act
as an expeditor to identify late receipts and deliveries. Ensure there is
adequate cyberquery access
• Provide visibility of the measures and monitor progress over time
• Focus initially on the four key site-specific elements of- Goods
Despatched Not Yet Invoiced and overdue production, purchase and
sales orders. If necessary generate action plans with target dates
• Review Receipts Not Yet Invoiced but with particular regard to returns.
There does not appear to be any formal process within the Company to
ensure that purchase returns, whether goods or services, are either:
• Off-set against a compensating receipt where is this is a
corrective action
• Matched against a credit note from the supplier. There are
many items of considerable value months or even years old
which may necessitate write-offs
• Ensure that orders are dated with the anticipated
receipt/manufactured/despatch date and not the default date which is
‘today’ which will automatically make them overdue the following day.

79
• Rather than raise single production orders for large volumes covering a
long time period, set up orders for smaller quantities with shorter lead
times
• Hold monthly conference calls with each business’s Op Team to monitor
progress and issues
Issues
• There are training requirements and gaps in people’s knowledge
especially following Modernisation
• The ‘Super User’ concept not yet followed up fully
• Some sites have no identified business-specific ISBM and have problems
obtaining assistance
• Liaison with SSC
• Problems identified in accounting for carriage charges on suppliers’
invoices
Ongoing Suggestions
• Need to ensure everyone is fully aware of the implications of their actions
• Better understanding of the underlying principles and requirements
• Ascertain root causes of issues and problems
• Appreciation as to how the KPIs fit within the corporate data and information
quality initiative
• Identify the personnel dealing with each type of order and agree who does
what with responsibilities for each process
• Build data quality targets into people’s objectives
Table 6 The data quality improvement report
The guidelines, issues and suggestions where intended not just to provide feedback, but to
focus peoples’ attention upon the salient outcomes of the series of meetings, together with
the findings from the literature reviews, to identify the actions that were happening and/or
should happen to drive the data quality initiate forward in the future. The discussion on the
performance of the Data Accuracy KPI Index within the next section substantiates this.
The Wider Context of this Research It is appreciated that this study has been carried out entirely within a work-based setting
therefore it is important that this is then positioned within the overall context of this research
project and the broader issues and concerns that emanate from this, for both practice and
theory. In line with this, the organisational-specific short term guidelines, issues and ongoing

80
suggestions described above have been translated into a format that will enable them to be
better applied within a wider environment and these are analysed in detail within Appendix
2.B. These generic findings will be discussed further within Section16, as part of the
consolidated review of the research outcomes.
The paramount importance of measurement, reporting and feedback has been stressed
throughout this thesis. The following section traces the performance of the Data Accuracy KPI
Index over its lifetime from September 2006 to November 2009 and in particular to the period
between November 2008 to November 2009, to identify whether there is any correlation
between the data quality activities undertaken within this study and the performance of the
Index.

81
13. THE DATA ACCURACY KPI INDEX PERFORMANCE REVIEW The importance of measurement, analysis, reporting and feedback has been emphasised
continually throughout this entire research. Whilst the KPI Index represents a composite view
of a what is basically transactional data, there is a strong argument to suggest that it is also
indicative of the quality of the data overall and the progress being made towards its continual
improvement. The following discussion traces the performance of the Index overall and in
particular the period following the commencement of the site visit programme described in the
preceding section, to determine whether there is any correlated sustained improvement.
Period of Review- September 2006 to November 2009 This section reviews the Index’s performance over this period, analysing the fluctuations,
variations and trends and examines the impact of the various external influences both positive
and negative. It then attempts to attribute relevant meaning. It was felt that allowing a period
of just over six months to elapse from the end of the site visit programme, would permit a
degree of maturity to take place and thereby enable a more objective appraisal to be
undertaken. Full details of the Index mechanism and the methodology used to roll out the
process across the Company, have already been outlined in Section 8.
Table 7 below tracks the movement of the total overall Company Index figure by quarter over
the designated period. Columns one and two identify each quarter; column three represents
each financial year’s (April to March) cumulative percentage movement by quarter; column
four represents the quarterly improvements (+/-) in terms of an index with a September 2006
base date; column five presents each quarter in terms of its cumulative percentage
improvement derived from column four; whilst column six displays the overall trend.
Data Accuracy KPI Index Improvement Tracker Annual Moving Index Trend Qtr/Yr Cum Impr Index Impr %
06/07 Sep-06 100 0% 0% Dec-06 3% 97 3% 4% Mar-07 29% 71 29% 8%
07/08 Jun-07 3% 69 31% 12% Sep-07 6% 67 33% 16% Dec-07 -9% 77 23% 20% Mar-08 16% 60 40% 24%
08/09 Jun-08 -15% 69 31% 28% Sep-08 -27% 76 24% 32% Dec-08 -15% 69 31% 36% Mar-09 6% 56 44% 40%
09/10 Jun-09 6% 53 47% 44% Sep-09 6% 53 47% 48% Nov--09 14% 48 52% 52%
Table 7 Data Accuracy KPI improvement tracker

82
The data within Table 7 is also depicted below in graphical form in Figure 8 below
Data Accuracy KPI Improvement Tracker September 2006 to November 2009
0%
10%
20%
30%
40%
50%
60%
Sep-
06
Dec
-06
Mar
-07
Jun-
07
Sep-
07
Dec
-07
Mar
-08
Jun-
08
Sep-
08
Dec
-08
Mar
-09
Jun-
09
Sep-
09
Quarter/Year
Inde
x Im
prov
emen
t
Index Trend
Figure 8 Data accuracy improvement
The improvement tracker was developed as a means of highlighting the periodical
movements in the Index on a companywide basis to identify improvements or otherwise and
indicate any trends. In this way it was intended to measure the momentum of any
improvements to determine whether there was any degree of sustainability in the manner
discussed in Section 2 on page 26. The figures were based upon the aggregated monthly
company index at each quarter end. A quarterly measurement was considered to be
preferable in that it provided a better perspective of the overall trend(s) than a more complex
monthly measurement. The tracker being the aggregation of all the site and business indices
provided a corporate summary of what was actually happening across the businesses
A summary of the progress:
• 29% improvement in the first six months to March 2007
• 33% improvement in the first year to September 2007
• 16% improvement in the year to March 2008
• 40% improvement in the first eighteen months to March 2008
• 27% decline in the eight months to November 2008- which coincided with
the Company’s Modernisation Programme
• 37% improvement in the year to November 2009
• 52% improvement between September 2006 and November 2009

83
The initial eighteen month period to March 2008 saw significant improvements (40%), as one
would imagine with any new major initiative, especially as there was plenty of opportunity for
early ‘quick wins’ coupled with executive support and constant monitoring and reporting. The
above graph also highlights a ‘glitch’ within this period, in December 2007, which appears to
be a seasonal issue, related to Christmas and New Year, as there was a similar occurrence in
the preceding year. It is recognised that there will always be fluctuations within any index and
that the real measurement of any significance is the overall ‘trend’. The steep decline from
April 2008 may be attributable solely to the effects of the Company’s Modernisation
Programme which saw a third of the factories closed, businesses re-positioned, certain
employees transferred to new locations, with others leaving the business. The period from
March 2008 to September 2008 was certainly a huge hiatus to ‘business as usual’, as a
considerable part of the business re-focussed itself onto more short term pressing issues.
Whilst the Modernisation Programme achieved all of its objectives within timescales and
budget, there were short term negative impacts which affected certain activities, the Data
Quality Initiative amongst them. One accepts this as a matter of course, having been directly
involved in the financial aspects of the planning, budgeting and control of the Modernisation
Programme. However after the completion of this final phase during the autumn of 2008 it
was necessary to undertake the re-launch of the Data Quality Initiative which led ultimately to
the qualitative research described in the previous section.
The direct outcomes of the factory and business meetings have already been described and
recommendations made for future short and medium term practice. However within this
context one has to validate such findings to ensure that they are not mere rhetoric, but have
real substance. Table 8 below charts the activity carried out as part of the factory and
business programme, superimposed upon the Data Accuracy KPI Index between November
2008 and November 2009 in both month upon month and cumulative format. During this
period, quarterly business targets were set in December 2008 and the reporting was also
extended to factory and site managers in January 2009, each with the potential to generate
additional positive influences.
Nov
08
Dec
08
Jan
09
Feb
09
Mar
09
Apr
09
May
09
Jun
09
Jul
09
Aug
09
Sep
09
Oct
09
Nov
09
No of
Meetings 0 13 18 3 15 8 0 0 0 0 1 0 0
Index
Impr
% Month
0 9% 7% -4% 16% 1% 1% 5% 0 2% -3% 7% 2%
Index
Impr
% Cum
0 9% 15% 12% 26% 27% 27% 31% 31% 32% 30% 35% 37%
Table 8 Data Accuracy KPI monthly performance

84
From analysing the above table, it is evident that there was a significant improvement in the
Index (27%), following the commencement of the factory and business meeting programme
from December to April, in line with the number of meetings carried out. However within this
context it also has to be appreciated that in the two preceding years, there had also been
considerable improvements during the period from December to March (26% in 2007 and
22% in 2008). That fact is accepted, but it also has to be recognised that as year upon year
improvements take place, the scope for further significant improvements become more and
more difficult unless a sea change approach is introduced.
In an attempt to ascertain whether any degree of sustainability had taken place within the
businesses themselves, it was decided that from April 2009 onwards, the only ‘Central’
activity would be the publication of the Index reports on a monthly basis. During the summer
of 2009 there was a levelling of the rate of improvement, but overall it still remained positive.
However during September there was a 3% decline on the August figure and when the Index
was measured again part way though October (13th
), a further 7% decline had taken place
during the preceding two weeks, leading to a year to date 1% reduction overall based upon
March 2009. This situation was raised immediately as a high priority matter across the
businesses and the support of the Executive Team was enlisted. Two weeks later at the end
of October the position had changed dramatically so much so that the 7% decline had
transformed to a 7% improvement, which has further enhanced in November by 2% to
register an over all 37% improvement in the twelve month period to November, with an overall
52% improvement since the commencement of the entire initiative just over three years
previously. There was strong evidence to suggest that whilst a degree of sustainability
appeared to be in place as indicated by the overall trend in the KPI tracker, it did not appear
to be self-sustaining in that it required the regular involvement of external agencies such as
senior management and the constant attention of the project leader to maintain the
momentum.
Subsequent Events Further evidence of the weight and richness of this argument is demonstrated when one
examines the performance of the Index over the succeeding four months (December 2009 to
March 2010). The first three months indicated seasonal fluctuations in line with the
experiences of previous years, followed by a recovery in March to record a 22% year on year
improvement, promoting the overall improvement since September 2006 to rise to 56%. This
performance is entirely consistent with previous trends contributing further to these findings.

85
Summary of the Findings There is considerable evidence to suggest that the progress and improvement described
above have real significance leading one to believe that there is potential for real cultural
change to take place if improvement initiatives are managed correctly.
This has implications for the wider context of this research as seen by the evolution of the
measurement and reporting process which may best be summarised as:
• “What gets measured gets done”
o A good start, but by whom?
To:
• What gets measured by the Exec gets done quicker”
o “A further improvement, but too top-down
Leading finally to:
• “What is measured, communicated, discussed and agreed at all levels has a
very good chance of becoming embedded”
o Bottom-up supported by top-down
o A potential key to sustaining any kind of change?
There is considerable evidence to claim that any improvement initiative cannot be undertaken
in isolation and that everyone needs to become involved. There is also however a caveat, in
that at this stage it appears that the level of progress achieved appears to be commensurate
with the levels of activity of the internal champions or change leaders, suggesting a climate of
‘controlled sustainability’ rather than ‘self sustainability’. This may be a reflection of the
relevant infancy of the overall initiative. This question of time, age and ‘maturity’ is seen as
being important in a number of the areas relating to this research and will be discussed within
the concluding section together with the involvement of champions at every level.
The above findings are reproduced in Appendix 2.C and will also be discussed further within
Section16, as part of the consolidated review of the research outcomes.
To supplement the qualitative study and to attempt to determine the attitudes and perceptions
of one’s colleagues towards data quality, a web-based survey was carried out during the
summer of 2009 as described in the following section.

86
14. INTERNAL QUANTITATIVE SURVEY To build upon the progress made within the Data Quality Improvement Programme, a web-
based survey was carried out during the summer of 2009 amongst fellow Remploy colleagues
as a means of determining their views, attitudes, thoughts, feelings and opinions with regard
to data quality in general, their perceptions as to the quality of their data in particular and their
potential commitment towards continuous data quality improvement. Coming immediately
after the site and business meetings described above, it was felt that this would also
complement this initiative and emphasise that the site meeting programme was not a one-off
exercise, but part of a much wider and far-reaching agenda. The process employed is
described within this section.
Although the quantitative research undertaken during Document Four experienced a low
response rate, the process appeared to function effectively, therefore it was decided to follow
this same research mode that of a survey based self-administered questionnaire distributed
on this occasion to certain fellow Remploy colleagues, using NTU’s web-based on-line survey
tool Autoform. This mechanism allows researchers to generate a survey questionnaire and
collect and collate the resultant data which is then made available via email. The subsequent
analysis was undertaken using the SPSS statistical analysis package provided by NTU.
The nature of quantitative research may be characterised as a linear progression
commencing with a theory and then working through to the ultimate findings and conclusions.
Bryman and Bell (2003: 89) provided a very useful generic process blueprint (in black), which
has been adapted to fit the context of this internally based survey (in blue), depicted in Figure
9 below. Each element of the initial generic process has been linked to the relevant step
within the research cycle for this document to indicate visually how the entire process has
been undertaken. The initial elements of Theory and Hypothesis have been derived from
previous discussion and research conducted with in this and previous documents. The next
five elements relating to the construction, publication and distribution of the survey are
described in detail within this section, whilst the latter four elements covering the processing
and analysis of the data and the subsequent findings are detailed within Section 15.

87
Theory
Hypothesis
Select research sites
Process data
Select subjects/
respondents
Write up findings/
conclusions
Analyse data
Collect data
Findings/conclusions
Research design
Devise measures of
concepts
The core concepts regarding data quality derived from the research carried out and identified in this and previous documents
Cross-sectional design using a questionnaire
Generic Process
Types of questions with/without options for additional data
Fellow colleagues within Remploy
Recipients of the Data Accuracy KPI Index Reports. Invitation sent via email
Questionnaire accessed via web link to NTU- Auto form
Collect the responses from NTU web link and transfer into SPSS and carry out analysis
Review and interpret the analysis. Identify real findings and draw conclusions
Write up details of this study
Application to this Research
Figure 9. The quantitative research process
Adapted from Bryman and Bell (2003: 69)
Bryman and Bell (2003: 573) defined a questionnaire as a collection of questions
administered to respondents; but when employed without the direct interface of the
researcher, it is termed a self-completion questionnaire The main objectives in designing a
questionnaire are to maximise the proportion of subjects answering the questionnaire i.e. the
response rate and to obtain accurate relevant information for the survey (Wai-Ching 2006).
Oppenheim (1992: 7-8) emphasised the importance of adequate preparation and planning

88
prior to undertaking any survey identifying the essential steps in overall design from the initial
generation of aims and objectives through to the writing up and publication of the final report.
Schonlau, Frickerer and Elliott (2002: 41-53) also offered strong guidelines in dealing with the
design and implementation of Internet surveys involving the actual questionnaire design,
automation techniques together with the implementation and fielding of the survey. Bryman
and Bell (2003: 509-510) discussed sampling issues around the use of web surveys and their
advantages and disadvantages compared with postal questionnaires Bryman and Bell (2006
512) and concluded that “The electronic-only survey is advisable when resources are limited
and the target population suits an electronic survey (Bryman and Bell 2003: 511). Fan and
Yan (2010: 137-138) provided suggestions for increasing the response rate of web surveys,
whilst indicating that the average response rate is approximately 11% below other survey
modes (Fan and Yan 2010: 132). This deficiency rate was also supported by (Manfreda,
Bisnjak, Berzelak, Haas and Vehovar 2008: 79).
The Data Capture Process The layout and content of the survey was a mixture of: multiple-choice ‘ordinal’ type questions
involving a Likert scale format each having a five-point option ranging from ‘strongly agree’
through to ‘strongly disagree’; other ‘nominal’ type questions requiring specific answers from a
drop-down menu; a ‘semi-dichotomous’ type question, which requested a ‘yes’ or ‘no’
response but also had a default of ‘no answer’; and four questions requesting comments to
specific questions or statements. A decision was made to insert the demographic questions at
the beginning to lead the recipients into the full process. The questions were a mixture of both
‘open’ and ‘closed’, many having an ‘other(s)’ option with an accompanying box to provide
elaboration. Whilst it is appreciated that the questionnaire was basically a piece of survey
based statistical research using a quantitative research strategy, space was provided for
textual input as it was considered that the potential level of subject expertise available within
the sample, had considerable potential to enrich the overall project and therefore warranted
this facility to ‘trap’ this additional body of knowledge.
The personal data was followed by a section relating to generic questions surrounding data
quality in general, relating to the sources and causes of problems and issues and their
possible solutions. The remaining part of the main section was focussed within a Remploy
context, examining attitudes to the Data Accuracy KPIs, areas of problems and possible
methods of improvement, training requirements, overall responsibility for data quality,
peoples’ perceptions with regard to the quality of data and their attitudes towards Assistive
Technology. There were two final questions requesting respondents’ opinions, firstly towards
the author’s own definition of data quality- “Having the right and correct data in the right
format, in the right place at the right time, by having one single version of the truth across the
enterprise” and secondly a request for any additional comments. A number of the questions

89
relating to generic data quality were identical to those in Document Four, in order to compare
and contrast responses.
Every attempt was made to plan and pilot the questionnaire thoroughly applying the lessons
learnt from Document Four. An initial draft was created in Microsoft Excel and circulated to a
number of colleagues. The quality of the feedback was positive and the document was refined
a number of times, for errors missed during the initial proof reading and to make structural
changes to enhance the overall presentation and improve data collection. The refined version
was then positioned into Autoform and a couple of pilot respondents then tested the final
questionnaire in situ. This final feedback indicated that the survey was accessible and easy to
understand and complete.
Autoform was considered to be the most appropriate survey tool for this research in that one
had had experience of the application within Document Four where is had worked well
especially in the collection of the data and the subsequent integration and analysis within
SPSS. One had also received assurances regarding its security as discussed in Section 10. It
was appreciated that the tool had certain limitations in that it was somewhat rigid in its format,
however it was considered that the other benefits outweighed this and therefore consideration
as to the use of an alternative tool was not necessary.
The target audience selected for the survey were the one hundred and eleven recipients of
the Data Accuracy KPI Index reports by way of an email. The survey publication timetable
comprised:
• Survey set up on Autoform on 20th
• Initial email sent to all prospective responders on 28
May 2009 th
• Reminder circulated to Operations Managers on 8
May 2009 with the link
to the Autoform survey attached. th
• Reminder circulated to Finance Managers on 11
June 2009 th
June 2009
The analyses and findings from this survey are described in the following section.

90
15. INTERNAL QUANTITATIVE RESEARCH- ANALYSIS AND FINDINGS This section examines the level of responses, analyses the resultant data and then places the
findings within the context of the overall research project.
Survey Response The internal web-based survey was distributed to one hundred and eleven colleagues within
Remploy via an email link on 28th May 2009 and by the cut off date of 7th
July (the last day
any returns were received), forty five respondents had taken part, a response rate of 41%.
This was a considerable improvement upon the disappointing return experienced with the
Document Four survey. A reasonable response had been anticipated given that it taken place
immediately following the series of factory and business meetings described above. A
detailed analysis is shown below in Table 9:
Analysis of Responses Remploy Internal Data Quality Survey May/June 2009
Actions Date Cumulative Responses No % Publication date 28 May 2009 0 0 29 May 2009 24 53 01 June 2009 33 73 03 June 2009 34 76 04 June 2009 36 80 Reminder to Operations Managers 08 June 2009 38 84 Reminder to Finance Management 11 June 2009 43 96 15 June 2009 44 98 07 July 2009 45 100
Table 9 Analysis of responses
Response Rates
Manfreda, Bisnjak, Berzelak, Haas and Vehovar (2008: 79) and Fan and Yan (2010: 132)
both indicated that responses to online surveys tend to be lower than those for more
traditional distribution methods. A review of the related literature revealed a very diverse
range of average response rates, Cook, Heath and Thompson (2000: 829) reported a 40%
success rate; Cobanoglu, Warde and Moreo (2001: 447) 44%; Roster, Rogers and Albaum
(2004: 367) 28%; Berger (2007: 12) ‘up to 2%’; Poade (2007: 10) ‘10% or lower’; and
Manfreda, Bisnjak, Berzelak, Haas and Vehovar (2008: 90-91) 32%. A white paper published

91
by (Ipathia (2009: 2) reported that an average response rate of 41% was achieved within199
separate surveys they conducted for clients across industry and local and federal government
primarily in the US and Canada. Whilst contributors to a UK blog forum at econsultancy.com
had lower expectations stating that; “Best one I’ve ever seen is 10% but realistically I’d say
expect around 0.1%” and “Typically we get anywhere between 0.5% and 10%”.
It is appreciated that this survey was distributed to somewhat of a captive audience who had
been prepared for the subject matter and in most cases were aware of the importance and
implications. Not withstanding, the author felt that the overall response level of 41% was an
acceptable size on which to analyse and present findings, draw conclusions and make
recommendations, especially when compared with the experiences of the majority of other
researchers identified above. It was also obvious that a number of managers had also
encouraged members of their teams to participate in the survey, something that had been
promoted within the survey invitation email. The timing of responses also appeared to be
fairly much in line with that experienced by the majority of similar surveys, in that three
quarters of the responses were received within the first week and virtually all had completed
within two weeks.
Identification of the variables In order to ensure that the survey variables are analysed correctly, each question has been
identified and its variable type determined to ensure that the appropriate analytical techniques
are applied. The guidelines in Bryman and Bell (2003: 240-241) have been used and are
detailed below in Figure 10: Are there more than two categories? Yes No Variable is dichotomous Can the categories be rank ordered? Yes No Variable is nominal Are the distances between the categories equal? Yes No Variable is ordinal Variable is interval/ratio

92
Figure 10 Identifying the types of variables Bryman and Bell (2003: 240-241)
• Dichotomous: Variables containing data that have only two categories. It should be
noted that Autoform allocates to the ’yes’/’no’ response questions, a default of ‘no
answer’. One considers that such questions are semi-dichotomous.
• Nominal: Variables whose categories cannot be rank ordered
• Ordinal: Variables whose categories can be rank ordered but the distances between
the categories are not equal
• Interval/Ratio: Variables where the distances between the categories are identical
across the range. For the purpose of this survey the two types do not require
separation.
Analysis and Findings The raw data was provided by Autoform via an Excel csv file contained within a secure email
from NTU. This data was downloaded into the SPSS analytic tool, subject to the security
controls as outlined in Section 10. The data was then analysed within SPSS and extracted via
Excel xls files. All sections averaged between 90% and 100% complete, apart from those
relating to ‘Training’ (76% - 78%). This may be explained in part by the fact that some
respondents did not see this section as being directly related to them as they were not a
departmental head or did not have any responsibility for staff.
Demographic data was requested around job roles and summarised in the Table 10 below.
Demographic Characteristics
Invitations Responses Response Invites Response Analysis of Invitations/Responses Nos Nos % Split % Split % Executives/Business Managers 10 6 60 9 13 Operations 53 19 36 48 42 Commercial 15 7 47 14 16 Finance 26 9 35 23 20 IS 7 4 57 6 9 Total 111 45 41 100 100
Table 10 Demographic data
This represents a fair cross section of the organisation with all interested parties and functions
represented. The response rates vary across the areas with Management, IS and
Commercial (which includes supply chain, procurement and logistics) recording the highest
rates; however this may be partially explained by the lower number of invitations in these
functions and the fact that a greater proportion of the population were more interested or
passionate about the subject. Management may also have felt that it had to take the lead and

93
those members of IS who received an invitation had experienced frustration in the past with
data quality problems. It has to be stated that the response level from within Finance was
disappointing given that the entire initiative had its foundation within a Finance Conference
over three years previously. Part of this might be reflected by the fact that the entire function
had been reorganised and restructured towards the end of 2008 with the department
centralised within one main base in Leeds with a small sub-base in Coventry. Previously it
had been distributed geographically across each business. The result of the reorganisation
meant that many of those who had participated in the initial stages were no longer part of the
organisation. The largest volume of responses was received from Operations, both at factory
and business levels as one would expect given that it was the largest population polled. A
response rate of 36% was perhaps lower than anticipated, but there may have been some
possible cross-over with the Commercial functions, where a factory manager had delegated
the responsibility for responding to a colleague who was subsequently categorised within
procurement, rather than site purchasing. However this should not have affected the figures
by more than two to three percent.
Analysis of Responses Received
The results from each section were analysed below. The ‘ordinal’ type questions employed a
‘Likert’ scale format with five options ranging from ‘strongly agree’ to ‘strongly disagree’, with
three non-specified points in between. It would have been preferable to title the range ‘very
high’, ‘high’, ‘medium’, ‘low’ and ‘very low’ but the constraints of Autoform precluded this. For
the purpose of the analysis of this document, one chose to aggregate the responses scored
as ‘strongly agree’ and ‘2’ (representing ‘very high’ and ‘high’) as indicative of a positive
response to the appropriate question. This is also in line with the format used within the
Findings and Discussions section of Document Four.
As stated previously this survey endeavoured to gauge the attitudes, thoughts, feelings and
opinions of one’s colleagues within Remploy, regarding the concepts of data quality and their
potential commitment towards its continued improvement. A number of the questions were
identical to those used in Document Four, which was conducted within a data quality ‘expert’
community. This approach is totally consistent, in that this entire enquiry goes to the very
heart of ‘the quality of data’, whether it is in the minds of the academic, the practitioner or the
actual person in an operational delivery chain. This analysis evaluated the responses of the
two surveys to these identical questions where applicable, to compare and contrast the
attitudes and beliefs of both environments.
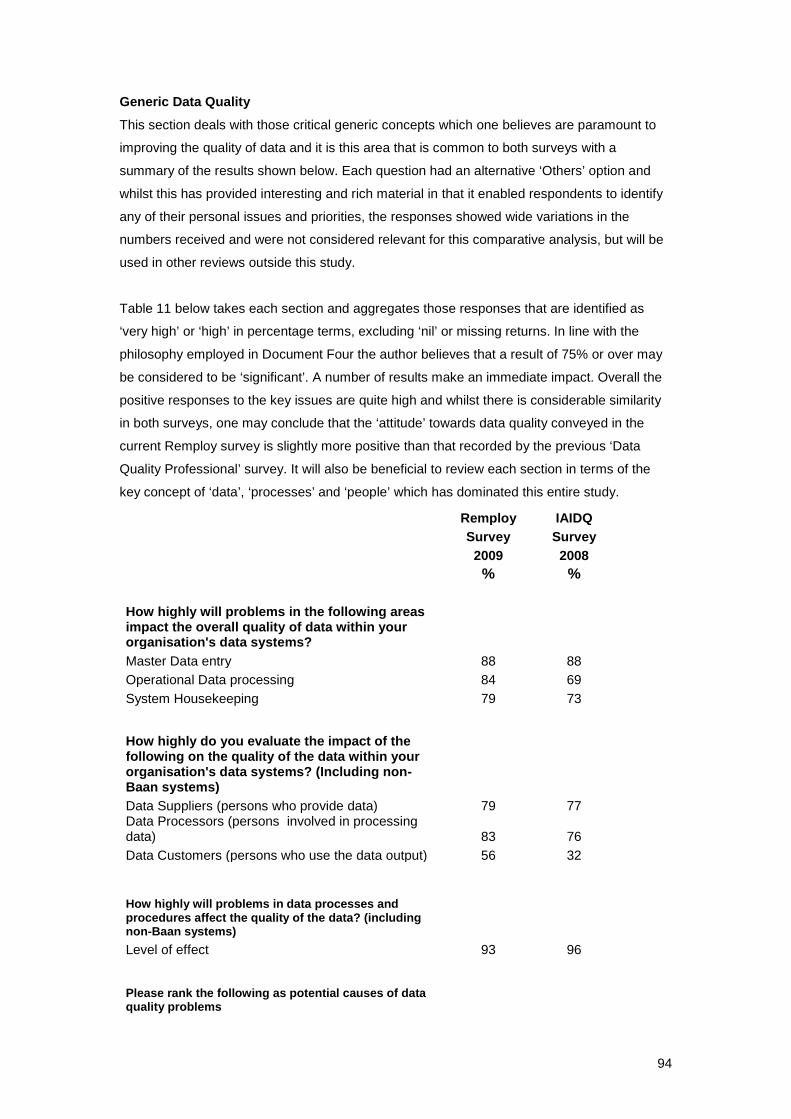
94
Generic Data Quality
This section deals with those critical generic concepts which one believes are paramount to
improving the quality of data and it is this area that is common to both surveys with a
summary of the results shown below. Each question had an alternative ‘Others’ option and
whilst this has provided interesting and rich material in that it enabled respondents to identify
any of their personal issues and priorities, the responses showed wide variations in the
numbers received and were not considered relevant for this comparative analysis, but will be
used in other reviews outside this study.
Table 11 below takes each section and aggregates those responses that are identified as
‘very high’ or ‘high’ in percentage terms, excluding ‘nil’ or missing returns. In line with the
philosophy employed in Document Four the author believes that a result of 75% or over may
be considered to be ‘significant’. A number of results make an immediate impact. Overall the
positive responses to the key issues are quite high and whilst there is considerable similarity
in both surveys, one may conclude that the ‘attitude’ towards data quality conveyed in the
current Remploy survey is slightly more positive than that recorded by the previous ‘Data
Quality Professional’ survey. It will also be beneficial to review each section in terms of the
key concept of ‘data’, ‘processes’ and ‘people’ which has dominated this entire study.
Remploy IAIDQ Survey Survey 2009 2008 % %
How highly will problems in the following areas impact the overall quality of data within your organisation's data systems? Master Data entry 88 88 Operational Data processing 84 69 System Housekeeping 79 73
How highly do you evaluate the impact of the following on the quality of the data within your organisation's data systems? (Including non-Baan systems) Data Suppliers (persons who provide data) 79 77 Data Processors (persons involved in processing data) 83 76 Data Customers (persons who use the data output) 56 32
How highly will problems in data processes and procedures affect the quality of the data? (including non-Baan systems) Level of effect 93 96
Please rank the following as potential causes of data quality problems

95
Employees 80 77 Customers 39 44 Suppliers 58 44 External data sources 46 46 Processing errors 80 54 External Systems 31 33 System errors 48 48 Please rank the following as potential causes of data quality problems Poor data entry 88 81 Lack of DQ knowledge, training, education 88 69 Poor processes 73 85 Poor management 70 65
Please rank the following in terms of their effectiveness in resolving data quality problems Build targets into peoples' objectives 64 Root-cause analysis of problems 100 Maintain up-front error prevention 91 88 Identify and clean errors at source 93 84 Identify and clean within the process (i.e. downstream) 59 44 Identify and correct errors in reports 60 24 Take no action 2 4
Table 11 Generic data quality
Summary of the Results:
• 84% Identified that problems with master data and transactional data
seriously impacts a company’s operations (Data)
• 81% Identified that people who provide and process data have a serious
impact upon data quality (People/Processes)
• 93% Identified that process problems seriously impact the quality of data
(Processes)
• 80% Identified that employees and processing errors are major potential
causes of data quality problems (People/Processes)
• 88% Identified that poor data entry and a lack of knowledge and training are
major causes of data quality problems (Data/People)
• 95% Identified that ‘root cause analysis’, ‘up front error prevention’ and
‘identify and clean errors at source’ are vitally important in resolving data
quality problems (Data/Processes/People)
From the analysis above it appears that within many areas of the Company, there exists an
appreciation of the generic principles of data quality management, providing a strong
foundation on which to consolidate the progress made so far.

96
Remploy Data Quality
The remaining part of the main section was focussed within a Remploy context
Remploy Survey 2009 % Attitudes towards the Data Accuracy KPI Index
How often do you print and review the Data Accuracy KPIs? Daily/Weekly 73 (The comparative figure for the 2008 survey was 41%) Please rank the following KPIs in terms of their impact in improving the quality of the data Credit Notes 59 Despatches Not Yet Invoiced 73 Outstanding Production Orders 70 Outstanding Purchase Orders 86 Outstanding Sales Orders 86 Purchase Orders Under Query 91 Receipts not yet Invoiced 86 Please rank the following KPIs as a source of data quality issues/problems Credit Notes 61 Despatches Not Yet Invoiced 56 Outstanding Production Orders 63 Outstanding Purchase Orders 75 Outstanding Sales Orders 68 Purchase Orders Under Query 83 Receipts not yet Invoiced 83
Table 12 Data Accuracy KPI response
Given the fact that not every respondent has a direct responsibility for reviewing the KPI Index
on a regular basis, the overall attitude is very positive and may be considered significant. Also
the focus upon the seven elements of the KPI Index helped to identify those which are seen
as the most important. Not all are relevant to every site, but those which are can be easily
identified. The area receiving less attention- Credit Notes, is the one with which the sites have
less overall control as other factors exist, which may well explain this variance.
Training requirements
Please rank the system training and developments requirements of your site/department Sales 32

97
Purchasing 57 Production 51 Finance 56
Table 13 Training requirements
Training appears to be less prominent than other sections, although a requirement was
identified in certain areas during the site and business meetings noted above in Section 12.
When one takes into account, ‘medium’ scores, alongside ‘very high’ and ‘high’, then between
71% and 83% register a distinct interest. Further references to training and development
appear later in this document.
Responsibility for data quality
At what level should the responsibility for data quality sit within Remploy Everyone 58 Management 42
Table 14 Responsibility for data quality
It is extremely encouraging to see that almost 60% identified that ‘everyone’ has a
responsibility for the quality of data, although it may be a natural response to allocate
authority for a major aspect of any business, to ‘management’ in general. A couple of
interesting comments were also made- “Data is a Company-wide asset & belongs to everyone” and
“Everyone who uses the system should have an understanding of the system and how things impact
each other”.
Perceptions and attitudes
How do you feel about the following statements?
“I am happy with the quality of the data I receive” 26
“I believe I have the ability to influence the quality of the
data under my control” 83
“I believe that the quality of the data I provide to others
meets their requirements” 81
Table 15 Perceptions and attitudes
This is possibly the most interesting, intriguing and enlightening part of the entire survey and
certainly one of the most important. The above responses reveal a great deal about the
mindset of the individual respondents. Whilst 82% believe they have the ability to influence
the quality of their data and provide quality data to others, only a quarter believe that the data
they receive is of equivalent quality, although when one includes those choosing a ‘medium’

98
response, then the figure rises to 69%. There is however a huge disparity within peoples’
perceptions and attitudes giving rise to a number of questions. Given that data runs
horizontally across departments, functions, sites and businesses from provider to recipient
and that the survey represents a reasonable cross-section of this model, one can only deduce
that there is either a lack of communication between both parties as to what the ‘customer’
requires or that the ‘supplier’ is ignoring such requirements. There is also of course the
personal perception that “I am always right and it’s the other person’s fault” or that no one is
prepared to admit that they are not providing a good service. One also has to consider that
the population, that did not respond or were outside the scope of the survey, may be
responsible in part for this apparent disparity. This entire area is worthy of further investigation
outside this study, especially around the area of communication.
Assistive Technology
What % of your team's employees currently use some form of assistive technology? 0-10% 87 11-25% 9 26-50% 2 51-100% 2 How do you find Assistive Technology? Beneficial to everyone 80 Improve the quality of life for disabled users 98 Improve Data Accuracy 72 Have you ever heard of Access to Work and the work they do funding Assistive Technology to disabled users? Yes 88 No 12
Table 16 Assistive technology
Accessibility in the form of Assistive Technology (hardware and software techniques
developed in order to assist visually or physically disabled persons gain access to information
technology within the working environment) appears to have significant visibility within the
organisation, but the degree to which it is being applied practically within the areas that matter
cannot be determined fully as this stage.
Other Questions
The four remaining questions sought to discover attitudes, opinions and perceptions by
means of textual responses rather than by choosing an option amongst a number of
predetermined answers

99
Data quality problems and issues
A number of issues were identified and are summarised below:
No %
Data Input and System Errors 8 20
Training and Development 3 8
Liaison with the Share Service Centre 2 5
KPIs Credit Notes 5 13
Purchase Orders 4 10
Purchase Invoices 4 10
Receipts Not Invoiced 14 34
Total 40 100
Table 17 Data quality problems and issues
There will be opportunities to follow up on all of these issues
Methods for improving data quality
A number of areas were identified and are summarised below:
No %
Review KPIs on a daily/weekly basis 15 48
Identify problems and resolve asap 10 31
Improve processes 3 9
Training and Development 2 6
Others 2 6
Total 32 100
Table 18 Methods for improving data quality
This result is very encouraging reinforcing the message emanating from the site meetings
whilst also supporting data quality best practice
Finally two further questions requesting respondents’ opinions were asked:
Author’s Definition of Data Quality To assist with ongoing research, we have attempted to define a working definition of 'Data Quality' which
we feel encapsulates our ultimate vision of the subject:
“Having the right and correct data in the right format, in the right place at the right time, by having one single version of the truth across the enterprise”
As already stated in Section 1, of the twenty valid responses, fifteen (75%) were in agreement
whilst the remaining five sought to add remarks and observations on accuracy and quality.

100
There were no negative comments received. As in Document Four the replies appear to be
positive and supportive given the rather subjective and emotional nature of the subject.
Additional Comments
A number of interesting comments were received; that there had been great improvements in
data accuracy in all areas; the requirement for regular measurement and quantification; the
risk of the KPIs driving wrong behaviour; the negative impact of inaccurate data and that there
were variations as to the severity of the risks that could effect data quality.
Overall Comment
The overall response to the survey was extremely constructive and encouraging and it
identified a significant positive attitude towards data quality in critical areas. Whilst it has to be
remembered that less than 50% of the invitees responded and therefore one has to view the
results in this context, this level is not inconsistent with similar online surveys as discussed
earlier in the section. It is possible that those who did not participate do not view the quality of
data in the same way. However, this caveat should not detract from the overall positive
results that there appears to be a firm commitment towards Data Quality within Remploy.
There is reason to believe that, within a period of three years, data quality now has a profile
as high if not higher than that of product quality and heath and safety, in terms of publicity,
employee involvement and attention and the impetus towards continual improvement. One’s
personal definition of ‘data quality’ also received a positive response, but possibly the most
significant result appears to be the disparity between peoples’ perception of the quality of the
data they receive and their own perceived ability to influence and pass on data of sufficient
quality to satisfy their customers’ needs.
Summary of the Findings. Whilst it is appreciated that this survey has been conducted entirely within a work-based
setting, it is important that this is then positioned within the overall context of this research
project and the broader issues and concerns that emanate from this, for both practice and
theory. This sub-section proceeds to summarise the organisational-specific findings into a
more ‘general’ format that will enable them to be applied within a wider environment.
Generic Data Quality
• There is a high appreciation of the influence that People, Processes and Data
have on the quality of data
• There is a realisation of the importance of having the data right first time

101
• The level of positive responses compares very favourably with the previous
survey held amongst the data quality community
Remploy Data Quality
• The overall attitude towards measurement, reporting and feedback was very
positive
• There was an appreciation of the importance of education and training
• Almost 60% felt that ‘everyone’ has a responsibility to improve the quality of
their own and the organisation’s data
• There was a huge disparity between the respondents’ perception of the
quality of the data they influence (82%) and that which they receive (26%)
• 90% of respondents identified measurement and reporting, problem
resolution and process improvement as key elements for improving data
quality
These findings are reproduced with Appendix 2.D and will be discussed further within Section
16, as part of the consolidated review of the research outcomes.
This next section brings together the key findings from the entire research, relates them to the
key recurring themes from the literature to identify common principles, but then more
importantly uncovers those key findings and principle findings which appear to have the
potential to inform both professional and managerial practice and the academic community.

102
16. ANALYSIS OF FINDINGS Appendix 2 presents in detail, the key findings from this entire research; extracted from the
research findings, short term guidelines, issues and ongoing suggestions from the qualitative
study; the findings from the Data Accuracy KPI Index performance review; and the summary
findings from the quantitative survey. To this has been added further perceived outcomes
derived from an appraisal of the entire project over its lifetime, coupled with one’s related
personal and professional experiences.
Comparison of Key Findings and Key Themes This section proceeds to take these key research findings and relate them to the concepts of
the conceptual framework as depicted in Figure 2 page 18 and the key recurring themes
derived from the quality and change management literature review detailed in Table 2 pages
50-52. The initial classification is shown in Appendix 3. The key findings are then compared
with the key themes within broad generic common headings in Table 19 below, to identify
similarities and variations. Certain key findings have been identified as unique to this research
in that there is no related key theme and these are identified in Table 20 below, together with
the additional perceived outcomes, to highlight potential additional knowledge on this topic.
The concluding part of this section expands further on these key findings and perceived
outcomes by examining their implications and potential for informing theory and knowledge as
principle findings. Positive practical consequences of this research have already been
evidenced by the lasting improvements in the levels of the quality of the data as described by
the KPI Index. Section 17 will then establish further that this study has unearthed new insights
into the subject whilst adopting a research approach which is certainly not new, but may be
considered to be unique within this arena. In this way it is intended to show how new
knowledge and unique methodology are able to inform theory and enhance practice and as a
consequence improve business performance, in the manner described by Van de Ven and
Johnson (2006a) and Van de Ven (2007).
Analysis of the Key Research Findings and Key Recurring Themes related to the Conceptual Framework within Broad Generic Common Headings Key Research Findings Key Recurring Themes A. Cultural/Organisational- Leadership/Management 1. Management and Executive Support
• Executive and senior and middle management sponsorship and involvement
• Executive and Management support and sponsorship

103
2. Leadership and Culture • Explain the underlying reasons behind the
improvement programme and how it will support the corporate objectives
• Sell the concept up and down the organisation • Cultivate an attitude and willingness to embrace
new ideas • Better understanding of the underlying
principles and requirements
• Establish a clear vision with targets and milestones
• Importance of Leadership and Culture • Align the Organisation • Focus upon achievements • Celebrate successes
3. Measurement and Reporting
• Provide regular visible measures and report progress
• Measurement of progress and the publication of results
• Continually measure, report and provide feedback
• Make the measurement and results visible • The overall attitude towards measurement,
reporting and feedback was very positive
• Measure, monitor with reporting and feedback to support accountability
4. Managing Change
• Identify how the ‘measures’ will influence the quality of the data
• Build in system and structural changes to prevent a return to type
• There is potential for real cultural change to take place if improvement initiatives are managed correctly.
• Focus on the ‘key’ elements setting objectives and targets
• Improvement requires change which has to be managed
• A belief that change is worthwhile and necessary
• Manage the change • Identify risks, benefits and overall objectives • Plan and identify required actions • A continual on-going process • Manage any potential short term and long
term conflicts • Tendency for people to revert to type • Elements of quality management principles in
all forms 5. Ownership and Responsibility
• Identify ownership and responsibilities • The Businesses ‘own’ the data NOT IT- a
paradigm shift
• Importance of ownership and responsibility • Obtain buy-in, ownership and belief
6. Communications
• Improve communications to share ideas • Communicate across the business on a regular
basis
• Establish clear channels of communication
7. Positive Approach
• Tackle negative cultural issues
• Accept that there will be set backs • Avoid undue pessimism, stay focussed and
be positive • Identify potential pitfalls

104
B. Processes 8. Root Cause Analysis and Improvement
• Ascertain root causes of issues and problems and resolve at source
• Ensure that potential problem areas are identified
• There is a realisation of the importance of having the data right first time
• Potential ‘problem’ areas identified • Ascertain root causes of issues and problems
• Root cause analysis and error prevention
9. Continual Process Improvement
• Ensure that the appropriate processes and procedures are in place- ‘one size does not fill all’
• Best practices within the right environment • Continual process reinforcement • Continual process improvements • Identify and document the process enablers
C. People 10. Education, Training and Development
• There was an appreciation of the importance of education and training
• Training, education and development requirements not being met fully
• Importance of education, training and development
11. Objectives, Targets and Reward
• Build data quality targets into peoples’ objectives and reward success
• Build data quality targets into people’s objectives
• Build targets into peoples’ objectives with a reward mechanism
12. Involvement
• Involve everyone, provide support • Involve everyone • Hold regular reviews with the ‘Team’ • Any improvement initiative cannot be
undertaken in isolation and that everyone needs to become involved.
• Involve everyone • Teamwork
13. People, Processes and Data
• Identify the personnel dealing with each type of order and agree who does what with responsibilities for each process
• Concept of People, Processes and Data .
• Align the processes behind the people • Manage the relationship between the way
data interacts between the processes and the people
• Concept of People, Processes and Data • Align the processes behind the people
Table 19 Comparison of key findings and key themes
As one would anticipate there is considerable agreement and alignment between the findings
and the themes in the majority of the headings, although this research appears to focus more
on Measurement and Reporting (3) and Root Cause Analysis and Improvement (8), whilst the
quality and change management literature places greater emphasis on Managing Change (4).
This again is not surprising given their slightly differing focus.

105
Additional Key Findings and Outcomes The analysis of this research also identifies a number of key findings which do not appear to
relate directly to any of the key quality management themes. These additional key findings
are detailed below in Table 20 alongside those positive outcomes that one has developed
during this entire research and over one’s personal and professional life
Key Findings Cultural/Organisational Leadership:
• Have an Internal Champion who has the respect of the audience • A ‘Bottom-Up approach with ‘Top-Down’ support • What is measured, communicated, discussed and agreed at all levels has a
very good chance of becoming embedded” o Bottom-up supported by top-down o A potential key to sustaining any kind of change?
• The level of progress achieved appears to be commensurate with the level of activity of the internal champions or change leaders, leading to a climate of controlled sustainability rather than self sustainability
Management • A need for ongoing support in all areas with an internal ‘expert’ user
community • Requirement for closer liaison between functions • Appreciation as to how the KPIs fit within the corporate data and information
quality initiative • 90% of respondents identified measurement and reporting, problem
resolution and process improvement as key elements for improving data quality
People
• There was a huge disparity between the respondents’ perception of the quality of the data they influence (82%) and that which they receive (26%)
• Ensure everyone is fully aware of the implications of their actions • Take things slowly to ensure everyone is onboard • Motivational Factors
o It is the ‘right’ thing to be doing, it supports one’s principles o Belief that it will improve efficiency, help control and manage the
factory and department o Competition between colleagues o Peer and Manager pressure o ‘League Table’ Syndrome o Requirement to achieve monthly/quarterly targets o A distinct movement away from ‘I’m going to be in trouble’ to ‘My life
is better for doing it this way’ • Almost 60% felt that ‘everyone’ has a responsibility to improve the quality of
their own and the organisation’s data

106
Additional Outcomes
• The Data Accuracy KPIs and the Index is merely a barometer of the effectiveness or otherwise of the related processes- not an end in itself. Any improvement is predicated on the quality of this process and the degrees of adherence of the related persons’ behaviour to follow theses processes
• There are two types of processes o Operational processes- SOP/POP etc o Quality processes- what we need to be done to improve data quality
ongoing • Get the processes right and adhere to them, then the improvement in the
KPIs will fall out • Identify the processes (operational and quality) that are required and then
change the behaviour (people) which needs to take place to ensure the agreed processes are followed continually
• Creating an environment where quality data can be sustained is dependant upon changing the way people behave to ensure they follow the most effective and appropriate processes and policies to a given situation- process change and people (behaviour) change
• Sustainability requires stability- NOT rigidity • Identify the changes required to embed a sustainable data quality culture • From both the qualitative and quantitative studies
o Emphasise the positive practices (Pros) o Review and take action on the issues and problems identified (Cons) o Focus on the important cultural environment and ensure that it is
place
Table 20 Additional key findings and outcomes
The additional key findings and outcomes described above in Table 20 above have potential
to add to the body on knowledge surrounding the sustainability of improvement initiatives per
se, however this research is focussed upon a narrower goal, that of ‘creating and sustaining
data quality within diverse enterprise resource planning and information systems ’. Within this
overall objective, all of the elements described within Table 19 also come into play, as they all
have a potential to impact and influence the ability of all organisations to improve and sustain
the quality of their data. This will be discussed in detail below.
Summary of the Key Findings The conclusions drawn from this study will contend that this research has unearthed new
knowledge as to the means by which data quality improvements may be sustained within the
environs of diverse enterprise planning and information systems.
Table 19 identifies considerable congruence between the key findings from this research and
the key recurring themes emanating from the review of the quality management literature in
Sections 6 and 7. A further review of these key recurring themes will testify that a
considerable majority of the supporting references identified in Table 2 on pages 50-52 have
no direct relationship to ERP or data quality studies. Of those that do focus on enterprise

107
systems, the majority concentrate on the quality principles of TQM and BPR without any
direct reference to data quality and none appear to focus upon its sustainability. From this one
feels justified in arguing that the key findings in Table 19 above are basically unique to this
study whilst also having generic support from within the quality management arena. This point
of uniqueness is extended even further when one considers the findings contained within
Table 20 above, none of which are to be found within the quality management literature
review. It has to be admitted that none of these key findings are unique in themselves when
examined in total isolation, however their real exclusivity comes when they are brought
together and applied within a specific setting to bring about elements of sustainability. In this
way this research brings a new insight into an area largely neglected by the academic
community.
Principle Findings All of these key findings in both Table 19 and 20 are important in themselves. They are the
series of individual ‘actions’ that have collectively brought about the changes as witnessed by
this research. However from these a number of principle findings have emerged which have
been identified as those essential elements or concepts that have bound together these
individual and potentially disparate actions in order to make these changes happen. The
extent to which change becomes embedded and lasting depends upon these principle
findings. They are seen as the primary messages from this study.
The ‘Cultural/Organisational’ heading is a rich vein in terms of achieving a potential
knowledge break-through. It focuses upon leadership and management at all levels and from
this a number of principle findings emerge. The significance of specific project leadership
identified as the local Champion(s), together with the extreme importance of continual
measurement, reporting, feedback with support and encouragement. Intertwined with these
threads is the element of time and maturity. Sustainability can only be judged in relation to
some form of continuum and whilst improvement programmes can go for initial quick wins,
real sustainability is only achieved when evidenced by its durability and capability to deliver
the longer term desired outcomes and values. The ‘People’ heading also recognises the
importance of maturity in terms of allowing ‘system actors’ time to come to terms not only with
their position within the structure of the organisation and their specific role within an enterprise
system, but also to appreciate the importance of data, the purpose of any quality initiatives
that may be taking place and the manner in which their own actions can influence the
outcomes both positively and negatively. The ‘People’ category also highlights the most
intriguing finding from the quantitative study, that of the differing and inconsistent perceptions
as to what appears to constitute quality data as witnessed by the huge disparity between the
respondents’ perception of the quality of the data they influence (82%) and that which they
receive (26%). Each of these principle findings is analysed in detail

108
Role of the Champion
The critical role of the champion in bringing about change and innovation is well established
in the literature (Schon 1963; Howell and Higgins 1990; Powell 1993; Shane 1994a; Shane
1994b: Markham 2000; Howell and Boies 2004). Such a Champion or ‘heroic local actor’
Williams and Pollock (2009:3), can come in many guises. Here one is not referring to the
‘Main Sponsor’, ‘Exec Champion’ or ‘Strategic Champion’ who can provide corporate focus
and support however important that can be, but to those ‘Tactical or Operational Champions’
who have the essential responsibilities and passionate feelings to make the improvements
happen. Without such champions any quality initiative is doomed to failure. Every project
requires an overall champion to drive the programme forward. Such a person may have been
the initial inspiration behind the programme or may have ‘emerged’ as the ideal candidate.
This ‘leader’ has the specific role to coordinate and provide the impetus with credibility, not
necessarily as an acknowledged expert although this would be advantageous, but with
interpersonal skills to inspire and bring others into play. Ideally such inspiration should
engender a similar impetus in others in more operational type roles to carry the messages
within their own communities. It is here where the real sustainability may grow. These latter
individual departmental or site ‘champions’ do not have the title as such and they are not
appointed, rather they ‘emerge’ and assume the role as data quality becomes part of their
everyday jobs, built into what they do. This may imply an element of structure possibly within
hierarchical environments, but whatever arrangement is in place it must remain flexible and
team-based to enable change to occur. Job titles are not important, whether they be Project
Manager, Departmental Head, Factory Manager, Supervisor, Purchasing Clerk, Store Keeper
etc. The critical element is the acceptance, attitude and commitment to the improvement
process. In this way they personify the role of the data steward, but not necessarily with that
specific title.
This project has followed this pattern, as unofficial departmental and site champions have
emerged many exhibiting the motivational factors identified in Table 20 setting data quality
objectives within their teams or for themselves. In other areas however local buy-in has not
been as encouraging and this is emphasised as one of the key findings in Table 20:
“The level of progress achieved appears to be commensurate with the level of activity of the
internal champions or change leaders, leading to a climate of controlled sustainability rather
than self sustainability”
From this discussion one may conclude that part of the process of evolving from controlled to
self sustainability requires a greater proliferation of ‘Local Champions’ into all environs of the
organisation, working in many instances independent of the ‘Overall Champion’ but sharing
the same ideals.

109
There should also be a note of caution, regarding the transitory nature of the champion. If a
champion leaves then this may create a possible vacuum which may lead to the derailing of
the entire initiative. Successful champions may be promoted, headhunted or leave for
whatever reason, even retirement. This poses a possible dilemma with potential ethical
connotations. How should the outgoing champion relinquish their position where a successor
has not been appointed or their replacement is not viewed as adequate to carry on the
crusade? This situation may also apply to a lesser extent in the case of the exit of a project’s
executive sponsor, although this may be protected somewhat by the existence of a financially
secure project business case.
Measurement, Reporting and Feedback
This study has already identified references within the quality literature as to the importance
of measuring, monitoring, reporting with feedback to support accountability Dale (1996);
Davenport and Beers (1995); Deloitte (1999); Wood (2004); Zairi (2005); Boult and Eaton
(2008); Goyal and Patil (2009) which has also been summarised within Table 2 pages 50-52.
Whilst this procedure therefore is not unique to this study, its application may be considered
to have some originality in that it has been used not only as a periodical monitoring and
reporting mechanism in the format of the KPI Index, but was also made available in a more
detailed format to assist in controlling day to day operations. Considerable efforts were made
to try and ensure that this was not viewed as purely a further arms-length ‘Head Office
Measurement Process’ but as a dual-purpose instrument with an emphasis on feedback and
assistance, as well as monitoring and reporting, to bring benefits to all parties.
Time and Maturity
The consideration of time and the need for maturity has been discussed in detail in various
part of this study; in particular to the requirement for time to allow systems to become
embedded (Davenport, Harris and Cantrell 2004). Cerpa and Verna (1998) also applied the
maturity principle to information systems and strategic planning, whilst Kochikar (2000)
identified certain maturity levels within the major prongs of People, Processes and
Technology within a framework for leveraging knowledge. Here the human aspect is vitally
important to allow individuals to come to terms not only with their position within the structure
of the organisation and their specific role within an enterprise system, but also to appreciate
the importance of data, the purpose of any quality initiatives that may be taking place and the
manner in which their own actions can influence the outcomes both positively and negatively.
Equally important is the requirement to allow time for the necessary skills to broaden and
develop beyond the strict confines of the technical aspects of any system Benbaset, Dexter
and Mantha (1980); Bartol and Martin (1982), aligning both people and processes, ‘learning

110
by doing’, the process of trial and error to discover and refine ways of using systems more
effectively (Pollock and Williams 2008:85 and Williams and Pollock 2009:4).
This study has also benefited by its longevity. This five year doctoral programme has provided
an extended timeframe to undertake a longitudinal study overcoming various pitfalls that can
befall ERP studies of much shorter duration, which tend to focus on short term impact, snap
shot type research which lack real maturity and as a consequence may have severe
limitations (Pollock and Williams 2008:84 and Williams and Pollock 2009:3).
Sustainability as a Process
The concept of sustainability within the context of this study has been discussed and defined
within a generic context in terms of maintaining the momentum of the improvements by
continuing the trend and thereby looking to improve the current measured result further in the
future, an on-going journey of improvement where a continual upward momentum is
maintained.
Within the context of this research, sustainability may be viewed as a ‘state’ which can be
measured within specific time intervals to determine trends as evidenced from a
measurement matrix derived from the Data Accuracy Index. In this guise the maintenance of
a continual upward trend (not withstanding intermediate fluctuations) may be taken to imply a
state of sustainability. However there may well be a time when the ‘improvement curve’ may
flatten out as incremental improvements become harder to achieve, something which may
occur in future to the KPI Index that has seen a 56% overall improvement in the first three and
a half years. One then has to weigh the ‘marginal cost’ of attempting to drive further index
improvements, against any ‘real organisational ‘benefits’ that may accrue. It is here where
sub-optimisation and the law of diminishing returns may well begin to materialise and one
may have to consider an element of trade-off, as has been recognised in other areas of the
literature (Helfert, Foley, Ge and Cappiello 2009: 12). Attaining the levels of improvement
witnessed so far is considered to be a major achievement and maintaining this level of
improvement may well be the optimum long term objective of this particular strand of the
sustainability process. Previous discussion established that the Data Accuracy Index is not an
end in itself, but an indication of the level of public recognition, acceptance and response to
the importance of quality data. The longer term focus on sustainability must be to change
attitudes, personal cultures and win ‘hearts and minds’, if the evolution from controlled to self
sustainability is to take place.

111
Perceptions of Data Quality
The existence of numerous notions as what constitutes ‘data quality’ and indeed ‘data’ and
‘information’ has permeated this entire study, although working definitions were presented
earlier within this document. It is therefore not surprising that differing perceptions of ‘data
quality’ exist within the various components of both the qualitative study and quantitative
survey. This may best be illustrated by the response to the quantitative research question on
perceptions and attitudes on pages 97-98, which was certainly the most interesting, intriguing
and enlightening part of the entire survey and arguably the most important, revealing a great
deal about the mindsets of the individual respondents. Whilst 82% believed they have the
ability to influence the quality of their data and provide quality data to others, only a quarter
believed that the data they receive is of equivalent quality, although when one includes those
choosing a ‘medium’ response, then the figure rises to 69%.
This is a huge disparity within peoples’ perceptions and attitudes giving rise to a number of
questions. Given that data runs horizontally across departments, functions, sites and
businesses from provider to recipient and that the survey represents a reasonable cross-
section of this model; one could deduce that there is either a lack of communication between
both parties as to what the ‘customer’ requires, or that the ‘supplier’ is ignoring such
requirements. There is also of course the personal perception that “I am always right and it’s
the other person’s fault” or that no one is prepared to admit that they are not providing an
adequate service. Although there was a considerable degree of support for one’s own
definition of data quality, the participants’ own view as to what data quality means to them
may in many cases take more of a selfish view focussing upon what they receive, rather than
the requirements as to what they need to provide to others. There is also considerable
evidence within the literature Laudon (1986); Wand and Strong (1996); Strong Lee and Wang
(1997); Giannoccao, Shanks and Drake (1999); Wang, Ziand and Lee (2001); Eckerson
(2002); Olson (2003), to suggest that this level of misperception as to data quality within
communities, is not unique to this study.
This entire research has been founded upon the robust conceptual framework as described in
Section 2 page 18 which brought together the concepts of people, processes and data into a
single related model, supplemented by the principles of cultural and organisational change.
This has shaped the focus of the entire ongoing research, enabling the outcomes of the
literature reviews, qualitative study and the quantitative survey to be brought together within a
single structure, allowing the subsequent analysis to draw out those essential key findings
and related principle findings which make this entire study unique. These key findings and the
subsequent principle findings discussed above are seen as the main outcomes for knowledge
and learning for both practice and theory that have emerged from this research. Within the
concluding section below these findings are discussed further within the context of the entire
study.

112
17. CONCLUSIONS AND RECOMMENDATIONS This study has identified a gap in the literature surrounding the process of improving and
sustaining the quality of data within enterprise planning and information systems. This final
section builds upon the evidence of this research and in particular the key findings and
principle findings in a format that has potential to be applied within practical business and
professional settings, whilst providing the academic community with the promise of a
contribution to the body of knowledge.
Data as a Key Strategic Resource This study indicates that the essential principles of sustainable data quality appear to be
largely neglected by the majority of organisations. The concept of treating data as an
important corporate asset was recognised many years ago Redman (1995: 102); following
this Davenport, Harris, De Long and Jacobson (2001b: 1) noted that “Data itself remains one
of our most abundant yet under-utilised resources” and in the intervening period there does
not appear to have been any considerable change. Latterly Redman (2008: 5) concluded that
data and information are essentially being unmanaged, as very few enterprises can claim
they meet the necessary criteria to manage their data effectively (Redman 2008: 4). To
ensure that organisations are in a position to reap the benefits of data and information as
strategic assets, they have to manage them aggressively and professionally as they do their
other assets (Redman 2008: 2). In order to achieve this Redman (2008: 2-5) proposed that
organisations must focus on the quality of their data, ensuring that it is correct first time, easy
to access and understand and protected from misuse. The data must then be put to value-
driven use, to assist in making better and more informed strategic decisions. This echoes the
earlier works of Davenport (2006a); Davenport and Harris (2007), and Harris (2005a); Harris
(2005b); Harris (2007) which centred on the use of ‘analytics’, moving towards a ‘fact-based
culture’ to generate competitive advantage by harnessing more effectively the power of
quality data. This message has been reiterated latterly by Davenport, Harris and Morison
(2010: 1) emphasising the total reliance of any analytic project on complete and high quality
data.
A PricewaterhouseCoopers survey found that 70% of executives contacted, considered data
to be an important asset, yet only 40% felt they used it effectively (Informatica 2008:6). Given
the evidence of Redman (2008) above, together with English (2009) and the other sources
described in Section 1, these figures may appear be somewhat optimistic, but they do
however highlight a gap between realisation and reality and the failure by organisations, for
whatever reason, to gain true value from their data assets. A survey conducted by
BusinessWeek and Hewlett Packard highlighted the fact that many organisations will readily
agree that their data is an important asset, but fail to take any action (Hewlett Packard 2007:
3). One may speculate as to the possible reasons for this apparent absence of activity. There

113
may be a general lack of attention to data per se at various organisational levels, or that
enterprises do not persevere with those initiatives they put in place. Peoples’ perceptions of
what is and what causes poor data quality appear to have a considerable effect. The
significant findings from the data quality survey described in Section 15 regarding peoples’
‘feelings’ as to the quality of the data they manage and that the quality they receive illustrates
this point profoundly and will be the subject of detailed discussion later in this section.
This research addresses these issues in that it attempts to ascertain how quality data can be
created and then embedded within an enterprise. If an effective data quality initiative is put in
place it will possess the propensity to raise the profile of data and its value will become more
appreciated. As the overall quality is improved, there will be greater confidence in its validity
and people will then find better ways of using the information to inform knowledge more
effectively, which will in turn enhance decision making. Such positive results will further
strengthen the initiative and increase the opportunities for it to become self-sustaining.
The Data Quality Initiative within Remploy has made considerable progress not only in
highlighting the importance of data as the valuable organisational resource and enterprise-
wide asset, but also in generating actions to improve the overall quality in order that it may be
used more effectively. Further progress is dependant upon the company maintaining a focus
on the quality of its data together with the extent to which the findings, conclusions and
recommendation of this study are developed and put into practice.
Enterprise Resource Planning and Competitive Advantage The literature contains numerous examples of research examining whether ERP systems can
provide organisations with sustainable competitive advantage. A number, Kalling (2003);
Beard and Sumner (2004); Lengnick-Hall, Legnick-Hall and Abdinnour-Helm (2004);
Laframboise and Reyes (2005), employed a resource-based view approach (RBV), an
economic tool designed to determine whether an organisation’s valuable resources can be a
source of competitive advantage focussing mainly on elements of their uniqueness to the
organisation (Kalling 2003: 49). Enterprise resource planning per se is not unique, being
used, in one form or another, in a great many organisations and for this reason there appears
to be a consensus that “an ERP system can yield at most a temporary competitive
advantage” Beard and Sumner (2004:148); that “ERP does not provide a competitive
advantage on its own” Lengnick-Hall, Legnick-Hall and Abdinnour-Helm (2004: 326) and
“ERP systems in themselves do not create a competitive advantage” Moe, Fosser, Leister
and Newman (2007:37), but are increasingly seen as a pre-requisite to stay competitive
(Beard and Sumner 2004:148).

114
The real value-generation elements emanating from ERP systems are seen to be; the
availability, quality and standardisation of data…and…improvements in business processes
Beard and Sumner (2004:144); improved cultural and learning capabilities aligned with a
superior knowledge base….also a platform for increasing social and intellectual capital
Lengnick-Hall, Legnick-Hall and Abdinnour-Helm (2004: 326); Lengnick-Hall and Legnick-Hall
(2006 190); an information base to outperform competitors Moe, Fosser, Leister and Newman
(2007:37); a source of operational excellence information Bendoly, Rosenzweig and Stratman
(2008: 320); enhanced processes Fosser, Leister, Moe and Newman (2008: 8-9); and a
source of Business Intelligence (Wing 2010: 29). Koh and Simpson (2007: 73) researching
within small and medium-sized organisations concluded that enterprise systems could create
competitive advantage by showing responsiveness and agility to change; whilst The American
Machinist August (2009: 49) concluded, “ERP comes down to improving business decisions
and increased profitability. With greater knowledge comes a greater chance to succeed”.
However Seddon (2005: 283) argued that ERP software is an unlikely source of competitive
advantage either strategically or operationally.
The debate within the literature described above appears to argue that competitive advantage
cannot be derived from solely by implementing an enterprise system. and that achieving any
‘real’ advantage is predicated on having the capability to add real value and excellence to an
organisation’s information products and knowledge base. It is worthwhile discussing this
further. The above literature is not stating that ERP systems cannot provide an organisation
with an advantage or that organisational improvement will not accrue, but that if all one’s
fellow competitors are operating an ERP system then the uniqueness does not exist. The
above research is not comprehensive and may not take into consideration the quality of
individual implementations. One may contend that whilst there exists a seeming ‘level playing
field’, in reality a firm may gain a competitive advantage over its rivals, if its ERP
implementation, optimisation and subsequent system maturity is superior to that of its
competitors. The one single element which can add real value to any organisation’s
information products and knowledge base, whilst enhancing any system implementation and
optimisation, is the quality of the data, the ‘real differentiator’.
Whilst one cannot state categorically that Remploy has so far derived a competitive
advantage from its ERP investment, it can certainly be argued that the company is in a far
better position to be able to manage and control all of its diverse operations as the result of its
improved ERP landscape. Whether further significant advantages can be obtained will
depend upon a number of factors, the most important being the ability to maintain high levels
of quality data to both further enhance the business and provide quality strategic analytical
information, as the ERP life-cycle moves further into the ‘maturity’ stage.

115
Enterprise Resource Planning Maturity Conclusions To reach the point where an organisation is able to manage its data effectively takes time
especially where the complexities surrounding ERP systems are concerned. Before an
enterprise can learn how to manage its data, it has to learn that data has to be managed and
this may come as the result of learning from previous failures Scott and Vessy (2002: 213);
the enterprise resource planning landscape being littered with implementation
disappointments and disasters, resulting from a plethora of causes (Chen 2001; Esteves and
Pastor 2001; Murray and Coffin 2001; Grossman and Walsh 2004; Xue, Liang, Boulton and
Snyder 2004). Holland and Light (2001: 43) described a three-stage ERP maturity model
involving; implementation, widening adoption, leading to strategic exploitation, enabling ERP
transaction data to provide high-end strategic value to related applications and information
and knowledge systems. Markus and Tanis (2000) developed a similar ‘ERP experience
cycle’, which Markus, Axline, Petrie and Tanis (2000: 264) described as a ‘set of processes’
which can be of varying and indeterminate length, with numerous dependences. A number of
the issues they raised has resonance with the findings from this research, in particular cultural
questions relating to resistance to change and management buy-in (Markus, Axline, Petrie
and Tanis 2000: 263). Whilst this project is not concerned directly with how enterprise
systems should be optimised, it recognises that post-implementation reviews are critical
Nicholaou (2004: 46) and in particular the importance of the way human resources interact
with consistent and optimised processes (Worley, Chatha, Weston, Augirre and Grabot 2005:
635). In order to reach the level of maturity required to enter the real added-value phase,
there has to be a move from the reactive ‘data inspection and correction’, to a far more
proactive ‘have the data right first time’ approach.
Davenport, Harris and Cantrell (2004: 22) highlighted the requirement for systems to become
embedded, emphasising the long term evolutionary process of enterprise system maturity, not
just in process improvement, but in the very nature of learning what data is available and how
to make best use in order to ‘informate’ or transform the data into information to provide
knowledge to support decision making. From...”transactional data, to good business
information” (Davenport, Harris and Cantrell 2004: 24). Davenport, Harris and Cantrell (2004:
23) also stressed the importance of overall data quality in bringing about organisational
benefits, incorporating data access, availability, quality, consistency, timeliness and accuracy
leading to greater familiarity and insight and thereby creating additional demand for more
meaningful information. de Souza Dias and de Souza (2004: 153-156) also identified the
association between the maturity of enterprise systems and the generation of competitive
advantage. A further example of the long term nature of enterprise system maturity, required
to gain real advantage, may be seen from the model for turning transaction data into
knowledge Davenport, Harris, De Long and Jacobson (2001b) discussed earlier on page 25.
The model is partially predicated on developing the skills and experiences of the staff,

116
together with detailed knowledge of the data. Both these essential ingredients require time to
develop and mature before they can be applied to generate any real success.
Whilst the examples above highlight the significance of system maturity and time, one has to
conclude that an appreciation of the importance of time and maturity appears to be lacking in
most of the related literature which has tended to focus mainly on single site operations
Williams and Pollock (2008: 2), of a short term impact, snap shot type studies of fleeting
durations, which lack real maturity and as a consequence may have severe limitations. In
contrast Pollock and Williams (2008: 83) and Williams and Pollock (2009: 14) suggested that
the consequences of enterprise system implementations and their subsequent evolution may
have to be considered in temporal framings of years or even decades.
This issue of time and the necessity to allow for the development of systems, people and
processes towards their maturity, in order to bring about the real lasting benefits, has direct
resonance to the practical elements of this research. Section 8 described the journey towards
improving data quality within Remploy over the last five years and makes particular reference
to time in relation to the role out of the Data Accuracy KPI reporting, on page 60. It will be
beneficial to reiterate again these main sentiments. “The programme of expanding the
circulation and overall corporate exposure may be considered to be somewhat ad hoc in that
it did not conform to any initial detailed pre-determined agenda; rather, it developed and
evolved over the period, in line with the researcher’s own learning process, both as part of
this study and as further development of one’s practical business experiences. With hindsight
the process may have been accelerated a little but the overall aim has been to inculcate
rather than inflict the concept. It was also felt that it was important that it be seen as a cross-
functional business-wide project rather than a centrally imposed reporting and control
structure”. This learning process can be extended within the overall context of the research to
encompass not only the researcher’s own learning, but also the organisation’s learning,
commencing with the initial phased Baan implementation during the latter 1990’s, onto the
individual business optimisations, leading to the commencement of the Data Quality Initiative
in 2005 and then finally to the KPI reporting introduced in 2006. This is also reiterated within
one of the additional key findings contained in Table 20 ‘People’ above, “Take things slowly to
ensure everyone is onboard”. It can be argued that part of the overall improvement in data
quality can be related directly to the fact that each element has been allowed to take hold,
embed and mature.
Davenport (2006a: 107) also emphasised the question of time and maturity in developing
companies’ analytical capabilities, normally taking several years to come to fruition in
resolving technological issues, transactional data refinements, building data warehouses and
implementing analytical software. Periods of six or seven years are quoted in order to collect
the data, and gain necessary experience to be able to validate the conclusions. In a letter to
117
the editor of the Harvard Business Review in response to criticism of the slow pace of
analytical implementations, Davenport (2006b) argued that analytics is all about slow steady
progress…and …over time making small quantitatively derived advantages which lead
ultimately to major gains.
Quality Data as a Competitive Advantage Whilst the majority of organisations have so far failed to maximise the benefits from their
planning and information systems, opportunities do exist to create competitive advantage by
managing data effectively. Those firms that are able to derive real competitive advantage are
doing so by leveraging their data to generate strategic knowledge. This strategic leap is not
made by merely implementing business intelligence applications to produce information, but
by providing employees with the means of being able to learn from the information so as
create valuable knowledge with which to make value-driven decisions, by way of a decision
making process termed the ‘insight-to-action loop’ Harris (2005a). To build such an analytical
capability requires a change to organisational culture in order that it becomes ‘fact-based’.
Such ‘insight’-driven companies focus on ’facts’ in every area of their enterprise Harris
(2005b) demanding complete and high quality data (Davenport, Harris and Morison 2010: 1).
As stated, there is also potential for an organisation to gain an advantage over its competitors
by making more effective use of its enterprise system to drive its transactional operations.
Enhanced processes and developed and engaged people, aligned to improved planning, are
better able to reduce lead times, satisfy customer requirements more speedily, maximise
revenues, manage working capital and control costs, to optimise operational performance. All
of which is also dependent upon being able to manage the data effectively. In this context
‘managing data’ involves creating and sustaining a data quality culture within which
individuals are able to recognise the value of data, improve the quality, embed such
improvements and identify opportunities to derive real long term benefits from its use. Without
quality data, any enterprise system cannot function effectively, either as the engine to drive
the business transactional processes or as source of the data that fuels the management
information and business intelligence applications to provide that winning analytical capability.
This study attempts to create the climate where such benefits are able to be realised both
within Remploy as well as the wider organisational horizons.
Data Governance and Corporate Governance This study has affirmed consistently the interrelationship between data quality and data
governance as enshrined within the conceptual framework in Figure 2 page 18 and in Section
2. In turn data governance has to be linked to corporate governance via corporate leadership.
This essential relationship between data and corporate governance also has roots within the

118
literature (Cheong and Chang 2007; Pfleeger, Trope and Palmer 2007; Tarantino 2008;
Weber, Otto and Osterle 2009). The quality of an organisation’s data not only has significant
commercial connotations, but it also has serious implications for all enterprises, as they
respond to the huge number of regulatory requirements, in the form of record keeping, data
gathering and recording and information providing. Failure to comply in full to any request can
result in serious financial damage to an organisation or even threaten its very existence, even
where fraud, deception or other misdemeanours are absent. This not only relates to
prominent laws such as Sarbanes-Oxley and Basel II, but to the myriad of government
demands for data, whether they be from HM Revenue and Customs, the Office for National
Statistics, or any other governmental agency whether UK or Internationally based. All have
potential penalties for late delivery or erroneous information. For any unified governance, risk
and compliance (GRC) strategy to be successful, there has to be confidence in the quality of
the inherent data (Tarentino 2008: 63-64). Whilst this section has focussed upon the
importance of data quality in ensuring compliance with regulatory requirements, one is also
aware of the necessity for the activities surrounding information systems should themselves
to conform to national and international legal obligations (Khadraoui, Leonard, Pham Thi and
Helfert 2009).
This dilemma has long been recognised within Remploy. Corporate policies and procedures
have been in place for a considerable period particularly within the areas of Finance and HR
to ensure both internal and external regulatory compliance. To further strengthen the
environment a new IS strategy was developed in 2009. A fundamental part of this was the
establishment of a governance body termed the Design Authority whose role is to ensure that
all elements of IS are consistent with this strategy, which in turn must conform to the overall
corporate strategy and governance. The author as a member of this body drafted the initial
guiding principles and standards around the management of data together with the data
governance policy, described in detail within Section 3.
As an example of the progress made and benefits derived within this field, the following
statement appeared as part of the Annual Corporate Business Report submitted to the
Executive of Remploy during April 2010:
“The introduction of a formal Data Governance strategy, allied to improved Data Quality, has
strengthened overall Corporate Governance within the Company especially around the
elements of Governance, Risk and Compliance (GRC). In addition there appears to be far
greater confidence in the quality and value of the information shared and also greater visibility
within the businesses, as to their day to day transaction processing”

119
Summary The direct operational benefits to Remploy of this study as highlighted by the improved Data
Accuracy Index have been referred to in depth, but there is also evidence to suggest that
there have also been considerable improvements of a cultural and strategic nature as
discussed within this section. Data is not only recognised as a significant resource and a
major corporate asset, but actual resources in terms of human capital and finance have been
expended to support ongoing improvement actions. Further operational and strategic
advantages have been derived from enhanced reporting, budgeting and forecasting which
may yet be leveraged further to give a real competitive advantage in the future. The myriad of
small meaningful ameliorations, both technical and procedural, which have been applied by
passionate people during the period since the original Baan implementation, are now gaining
greater maturity alongside higher quality data to generate both operational and informational
benefits. Finally the recognition of the importance of data in relation to overall governance,
risk and compliance has provided enhanced levels of authority and control to identify and
mitigate exposure to potential regulatory non-conformities.
Conclusions drawn from the Key Findings and Principle Findings The analysis of the key findings in Tables 19 and 20 pages 102-106 and the subsequent
detailed discussion around the principle findings which subsequently emerged, are seen as
the main outcomes for knowledge and learning for both practice and theory that have
emanated from this study. These principle findings have been identified as elements or
concepts which assist in binding together those strands of activity that have the capacity to
bring about change not only to improve the quality of data but also impart some degree of
permanency.
Principle Findings
The role of the champion is seen as key to promoting and embedding change and innovation.
Within this study local champions have emerged at various levels and from various functions
within the organisation embracing the essential cultural and motivational philosophies to make
improvements within their spheres of influence. Whilst there has yet to be universal
acceptance in all locations there is evidence to suggest that this ‘role’ is kernel in evolving the
programme from ‘controlled sustainability’ to ‘self sustainability’
The concept of measurement, reporting and feedback is a prerequisite for any successful
change programme. Within this study this element is not viewed as a mere ‘central’
monitoring and control mechanism, but has been developed into a reporting process to
provide sites and businesses with the information to manage their operations on a day to day
basis.

120
The necessity of time and maturity has been discussed in detail earlier within this section as
well as other parts of this study. This element of ‘organisational patience’ is important to allow
new ‘processes’, changes and improvements to become accepted and embedded as well as
to enable ‘people’ to accept change, develop themselves, gain experience and learn new
skills.
In discussing the concept of sustainability, emphasis has been placed upon maintaining the
momentum of improvement particularly within the process of measuring the quality of data.
One has to be aware however that there may be occasions where the ‘costs’ of making
further improvements within a particular field may outweigh the benefits that may accrue with
the risk of sub-optimisation. Within this study the Data Accuracy Index is not an end in itself
but an indicator. In a wider context one is looking to sustain the improvement in the levels of
awareness and acceptance of the importance of quality data.
The quantitative survey and subsequent related detailed discussions have highlighted the
huge disparity in peoples’ perceptions of data quality between the data they influence (82%)
and that which they receive (26%). Whilst evidence from the literature suggests that this is by
no means unique to this study it raises considerable concerns in general as to the quality of
communication and the way people view their roles and their own performance and the
performances of others. It was decided that further analysis as to the underlying reasons for
this disparity would best be examined as part of a further research project outside the scope
of this study, as it was felt that this additional research theme was somewhat extraneous to
the final research question. In addition it is appreciated that the misconceptions in general as
to the concepts of data and data quality appear to be prevalent and have parallels within the
data quality community as to their own definitions of data quality.
However it is appreciated that the above decision to restrict further detailed work may have
placed certain limitations on the analysis of the data carried out for this part of the survey
which if undertaken may have enriched the outcomes to determine this the reasons for this
seeming ‘disparity’. An alternative approach may well have used cross tabulation to provide
further analysis around the way participants responded to the question as to how they
perceived the quality of data they received. An analysis of this data possibly by function, job
role, location, business may have added richness to generate further theories. An attempt
was made to garner information of respondents by job role but only a third of the respondents
supplied this information. The base data did however contain the respondents’ contact details
which may also have been used (within ethical principles) to generate a secondary
questionnaire to tease out further information. Also it may be beneficial to target the recipients
at some later date to see if these perceptions had changed in any way, in terms of a

121
longitudinal survey. However the restrictions of this study precluded this, but it should not
prevent a follow up survey being undertaken as part of further research at some later date.
Final Conclusions and Recommendations It has been demonstrated that this study has identified a gap in the literature with regard to
determining means by which organisations may be able to sustain data quality improvements
within diverse enterprise systems. The research is even more unique in that it has been
undertaken within an organisation whose objective is to provide employment for disabled
people. This research is also distinctive in that it uses an action research approach within this
context, with the researcher taking an actual active participatory role in the process rather
than acting merely as an observer or recorder of the events. However it must be stated that
the researcher did not control the process, but acted as both guide and participant.
Review of the Research Question:
The development of the research questions and their evolution was discussed in detail in
Section 1. As part of this process the research questions went through a number of iterations
culminating in the final question:
“How can an organisation create an environment where data quality improvements can be
sustained?”
The findings, conclusions and recommendations of this study have identified, means by which
the quality of data within planning and information systems can be improved, together with the
opportunities for such improvements to be partially sustained. At the moment any real
sustainability exists mainly within a controlled environment requiring periodical interaction by
the overall champion, sub-champions and elements of the leadership. Means to achieve self-
sustainability need to be researched and identified and this will be discussed further.
Benefits and limitations
Rich access
The ability of the researcher to gain full access to such a wide and diverse contact base has
added considerably to the overall richness of this research. This is reflected not only in the
volume of the sites covered and people interviewed, but also the extent to which virtually
everyone appeared eager to participate fully and attempt to make a contribution. Walsham
(2006:322) emphasised the extreme importance of having appropriate access to an
organisation relevant to the scope and direction of the study.

122
The application of action research within this study
Discussion within Section 9 identified that action research is not a unique approach within the
overall arena of planning and information systems, however the majority of the literature
followed the established trend and focussed upon ERP procurement and implementation
Akkermans and van Helden (2002); Stefanou and Revanoglou (2006); Walsham (2006);
Beyon-Davies, Baker and Williams (2008); Deep, Guttridge, Dani and Burns (2008);
Bohorquez and Esteves (2009); system enhancement Klueber and Alt (2000); Adams, Baker,
McFadzen, Miller and Smith (2004); and information systems (Baskerville and Wood-Harper
1998; Baskerville 1999; Stirling, Petty and Travis 2002; de Vries 2007). Whilst a number Lee
(2004); Lee, Pipino, Strong and Wang (2004) did focus on data quality, they essentially
viewed the topic from a generic perspective. This study therefore may be considered to be
unique in the manner that it employs an action research approach to generate considerable
rich material within the area of sustainable data quality improvement within enterprise
systems.
Eden and Huxham (1996:84-85) argued that action research poses potential challenges,
around levels of uncertainty, imprecision and instability, a lack of control and understanding of
the concepts of consultancy and intervention, which may ultimately prove problematical when
used by doctoral students (Eden and Huxham 1996:85). One appreciates these
methodological reservations but believes that one’s personal and professional experiences
both academic and practical, gained over a considerable period of time in a number of
organisations, together with an intimate knowledge of the environment being investigated,
have acted as a form of ‘apprenticeship’ for this approach.
The research methods
The qualitative element of the research for this document took the format of a series of
discussion-type focus group meetings around a basic flexible agenda, employing an action
research approach. To further extend this research and build upon the progress made within
the Data Quality Improvement Programme, a web-based survey was then carried out
amongst fellow Remploy colleagues.
The research methods employed were dictated largely by their appropriateness to the real-life
environment within which the research was conducted, in particular the format of the
qualitative focus groups and the ability to make a real contribution to improving business
performance. This followed the realisation that a re-launch of the data quality initiative was
necessary and that this would be best achieved by working with those colleagues who
interfaced directly with the data. As discussed, this process escalated quickly as the benefits
were realised by all parties. It is appreciated that an alternative approach could have been
taken with a quantitative survey carried out prior to the qualitative study, possibly followed by

123
a further survey to determine whether perceptions and attitudes had changed. However in
hindsight one feels that the chosen process was most appropriate in that it enabled the
concept of data quality to be promoted throughout the company by personal contact and that
an initial survey may well have garnered little response given the focus at that time on other
priorities.
It is appreciated that other research methods were available of both a structured and
unstructured nature. In-depth, semi-structured or closed interviews could have been
employed but their individual focus would have been far too narrow, lacking totally the
essential interactivity between interested participants that proved so beneficial. Similarly,
observational research, whether open or closed would not have yielded the same rich
material. As a contrast to the use of focus groups, the Delphi technique offered a structured
alternative but its closed and rather anonymous nature would not have provided the essential
feedback, although its use should not be precluded should further research be undertaken.
Whilst the quantitative study was mainly a pre-coded self-administered questionnaire, there
was scope and opportunities for participants to express their opinions in number of instances
and one believes both elements worked well.
Validation of the research contribution
In validating the contribution that this research has made, one should examine this process
through alternative lenses. From a practical work-base perspective within Remploy the
importance of the need for quality data is now accepted in greater areas of the organisation
and positive feedback has indicated that peoples’ perceptions as to the quality of the
information they receive and the reliance and trust they place upon it has improved
dramatically. This has assisted greatly with the introduction of more sophisticated business
intelligence and budgeting tools, leading to the reduction in the regular monthly reporting
schedule from ten working days to less than three within four years. The improvements in the
levels of data quality as indicated by the Data Quality Accuracy KPI Index described in
Section 13, provides further evidence of the practical implications. Also the development of a
corporate data governance policy allied to the establishment of a data management presence
within the IS Design Authority as described on page 118 can also be attributed solely to this
project.
The initial research for this study recognised that a gap existed within the academic literature
surrounding the process of improving and sustaining the quality of data within enterprise
resource planning and information systems. Subsequent research identified those key
findings as described in Tables 19 and 20 (pages 102-106) which are not exclusive in
themselves but have the capacity, when aggregated together and allied to the principle
findings, to bring about the dramatic changes evidenced by the practical improvements

124
described above. It is contended that this collective process is unique within the environs of
planning and information systems and that this research has therefore unearthed new
knowledge with the capacity to make a contribution to the body of literature. It is also argued
that the employment of the specific action research approach within this context has also
been responsible for developing theory and generating positive practical business outcomes.
Therefore it may be seen that the version of action research methodology applied within this
research has not only created an environment where lasting improvement process theory can
emerge, but actually engenders a cultural atmosphere where such processes can propagate.
This relationship between theory and practice, research and action to attempt to enhance
theoretical knowledge whilst providing practical solutions as expounded by Van de Ven and
Johnson (2006a) and Van de Ven (2007) has been the overriding ambition of this study. It can
therefore be argued that this research has not only made a contribution to theory as
evidenced by the partial success in answering the final research question, but has also
enhanced the reputation of action research as a form of work-based research, when applied
to situations where the researcher has experience of and credibility within the research arena
and all parties have participated actively within the entire process.
Design science
The research for this entire study has been based around the behavioural-science paradigm
having its origins in natural science research. Within the arena of information systems
research however a complementary approach has gained wider and wider relevance, that of
design science. Design science has its roots in engineering and the sciences of the artificial,
being essentially a problem-solving paradigm attempting to create innovations or artefacts to
improve the analysis, design, implementation and use of information systems (Hevner, March,
Park and Ram 2004: 76). Hevner, March, Park and Ram (2004: 98) also argued that
behavioural-science and design science are inter-related, the former seeking to find ‘what is
true’ and the latter ‘what is effective’; truth and utility respectively, with truth informing design
and utility informing theory Hevner, March, Park and Ram (2004: 80); to both improve
performance in the development and use of information systems whilst making a contribution
to research knowledge (March and Storey 2008: 726). Hevner (2007: 91) contended that
design science is essential a pragmatic science with the emphasis on making a contribution
that is relevant and measurable, whilst at the same time having the rigor to learn from the
existing knowledge base with the potential to contribute to knowledge (Henver 2007: 90).
There has been discussion in the literature as to the relationship between design science and
action research in that both attempt to change the world Iivari (2007: 53) and to learn from
failures (Iivari and Venable (2009: 11). Jarvinen (2005: 12) argued that both could be

125
considered to be similar research approaches, both in their characteristics, action and
pragmatism and their validation processes (Jarvinen 2005: 13). Iivari (2007: 53) argued from
a paradigmatic perspective that they were clearly separate conceptually, and that their
paradigmatic assumptions differed dramatically (Iivari and Venable 2009: 12). Whilst Iivari
and Venable (2009: 10) accepted the view that action research and design science were in
principle compatible, their research orientations were different and that any similarities were
superficial and therefore both were decisively different (Iivari and Venable 2009: 12).
Approaching the debate from a scientific perspective Ogland (2009: 171) contended that the
paradigmatic differences could be overcome and the combination of action research and
design science could be a critical success factory particularly within the area of software
process improvement research.
Whilst it has been clearly evidenced how design science has influenced information systems
research particularly over the last decade, its application within enterprise systems and data
quality research appears to be non-existent. From a personal viewpoint design science
appears to require far greater direct involvement by the researcher in carrying out the process
than one would expect with a comparable action research project. This is certainly the case
with this study where the researcher has made every effort not to influence the proceedings.
Given the growing acceptance of design science within the information systems academic
literature there may be opportunity for future research to examine both data quality and
enterprise systems through the lens of a design science approach with or without an
alignment with action research.
Potential limitations of a single case
The qualitative and quantitative research for this document was undertaken within a single
organisation which may imply certain limitations; however the focus group/action research
study and the internal web-based survey did in fact embrace forty eight factories and twelve
business streams many of which are quite diverse. This approach takes the process out of a
single case environment into a far wider and varied research arena. In addition the survey
carried out within Document Four embraced data quality professional from across the world.
Therefore it can be argued that the findings, conclusions and recommendations do have a fair
degree of relevance to a far wider managerial and professional audience than just a single
organisation.
Opportunities for Further Research
Whilst this study has enhanced both practice and theory in integrating both established and
largely untested improvement processes and practices into a new environment, it has also
identified a number of topics which will benefit from further research outside of this particular

126
study. It is entirely appropriate that additional lines of investigation worthy of exploration
should emerge and this is seen as a further illustration of the benefits of this research. The
outcomes may also have relevance externally to this particular sphere. The wider change
management community and in particular the process improvement and quality management
fraternities may find resonance with a number of the principal findings.
As stated previously the single most important finding to emerge from the quantitative survey
was the huge disparity in perception of data quality in that 82% of respondents believe they
have the ability to influence the quality of their data and provide quality data to others, whilst
only a quarter believe that the data they receive is of equivalent quality. This entire subject is
worthy of further investigation outside this study, especially around the theme of
communication.
Whilst it is extremely encouraging to witness notions as to how improvement processes are
able to generate degrees of sustainability, this must be tempered by the knowledge that only
partial progress has been made. Further research is necessary to extend this knowledge to
discover those methods by which organisations are able to move from an environment of
controlled sustainability to one of self-sustainability. There is a strong evidence to suggest
that the role of ‘the champion’ in various forms may shed important light within this arena.
Considerable research has taken place within the scientific disciple of neuropsychology,
examining the human capacity to accept change, relating to the inner powers of the human
mind, in the way that it may support or sabotage efforts to bring about change and achieve
buy-in. This may well be a fruitful area for further investigation and the manner in which this
branch of science can be applied to data and information quality.
The extreme bias within the literature towards initial-phase related ERP research has already
been discussed in detail within the introduction to this study and possibly best illustrated by
Pollock and Williams (2008:84) and Williams and Pollock 2009:3) who highlighted the fact that
over ninety five per cent of the six hundred plus articles contained in the ERP Research
Group online bibliography may broadly be described as ERP implementation studies. One
believes that there is a strong requirement for far more detailed research allied to the longer
term use and development of enterprise systems rather than concentrating upon the
procurement, implementation and short-term optimisation arenas. It is hoped that this study
has made a much needed contribution towards addressing this academic imbalance and
hopefully will encourage and inspire other researchers to undertake similar projects within this
area.

127
REFERENCES Adams, G., Baker, M., McFadzen, S., Miller, J. and Smith, K. (2004) Not Every Change is Continuation Improvement: 1-9. Rockhampton, Queensland, Australia: Central Queensland University. http://www.ciu.cqu..edu.au Adams, W. M. (2006) The Future of Sustainability: Rethinking Environment in the Twenty First Century. In IUCN (Ed.). http://cmsdata.iucn.org/downloads/iucn_future_of_sustanability.pdf Akkermans, H. and van Helden, K. (2002) A Continuous Improvement Approach to ERP Implementation- A Case Study. European Journal of Information Systems
, 11: 35-46
Al-Mashari, M. (2003) Enterprise resource planning (ERP) systems: a research agenda. Industrial Management & Data Systems
, 103(1): 22-27
Al-Mashari, M., Al-Mudimigh, A. and Zairi, M. (2003) Enterprise Resource Planning: A taxonomy of critical factors. European Journal of Operational Research
, 146: 352-364.
American Machinist. (2009) Finding a Competitive Advantage Through ERP and Financial Management. American Machinist
, August: 46.
Andress, A. (2004) Surviving Security: How to Integrate People, Processes and Technology
. Florida: CRC Press: 503.
Argyris, C. (1977) Double Loop Learning in Organisations. Harvard Business Review
, 55(5): 115-125.
Balding, C. (2005) Embedding organisational quality improvement through middle management ownership. International Journal for Health Care Quality Assurance
, 18(4): 271-288.
Bannon, L. J. (1991) From Human Factors to Human Actors: The Role of Psychology and Human-Computer Interaction Studies in Systems Design in Design at Work: Cooperative Design of Business Systems
. Hillsdale, NJ: Lawrence Erbaum Associates: 25-44.
Bartol, K. M. and Martin, D. C. (1982) Managing Information Personnel: A Review of the Literature and Managerial Implications. MIS Quarterly
, 6(December): 49-70.
Baskerville, R. and Harper-Wood, A. T. (1996) A Critical Perspective on Action Research as a Method for Information Systems Research. Journal of Information Technology
, 11: 235-246
Baskerville, R. and Wood-Harper, A. T. (1998) Diversity in Information Systems Action research methods. European Journal of Information Systems
, 7(2): 90-107.
Baskerville, R. (1999) Investigating Information Systems with Action Research. Communications of the AIS
, 2(4): 1-32.
Baskerville, R. and Myers, M. D. (2004) Special Issue on Action Research in Information Systems: Making IS Research Relevant to Practice- Forward. MIS Quarterly
, 28(3): 329-335
Bateman, N. (2005) Sustainability: the elusive element of process improvement. International journal of Operations & Production Management
, 25(3): 261-276.
Baum, J. A. C. and McKelvey, B. (2006) Analysis of Extremes in Management Studies. Research Methodology in Strategy and Management
, 3: 123-196.
Beard, J. W. and Sumner, M. (2004) Seeking strategic advantage in the post-net era: viewing ERP systems from the resource-based perspective. Journal of Information Systems
, 13: 129-150.

128
Beckhard, R. (1969) Organization Development: Strategies and Models
. Reading MA: Addison-Wesley: 128.
Benbasat, T., Dexter, A. S. and Mantha, R. W. (1980) Impact of Organizational Maturity on Information System Skill Needs. MIS Quarterly
, 4(1): 21-34.
Bendoly, E., Rosenzweig, E. D. and Stratman, J. K. (2009) The Effective Use of Enterprise Information for Strategic Advantage: A Data Envelopment Analysis. Journal of Operations Management
, 27: 310-323.
Berger, J. T. (2007) The Power and Perils of Internet Surveys. Intellectual Property today
, August: 12.
Beynon-Davies, P., Baker, A. T. and Williams, M. D. (2008) Improving the Implementation of ERP Systems through Action Research. International Journal of Enterprise Network Management
, 2(2): 123-144.
Bohorquez Lopez, V. W. and Esteves, J. (2009) Overcoming Knowledge Integration Barriers in ERP Implementation Using Action Research Approach
. Paper presented at the AMCIS 2009.
Boland, R. J., Tenkasi, R. V. and Te'eni, D. (1994) Designing Information Technology to Support Distributed Cognition. Organization Science
, 5(3): 456-475.
Botta-Genoulaz, V., Millet, P.-A. and Grabot, B. (2005) A survey on the recent research literature on ERP systems. Computers in Industry
, 56(6): 510-522.
Boult, M. and Eaton, M. (2008) Are you sustaining change in your data quality initiatives? Lessons from leading change management specialists;http://www.dataqualitypro.com/data-quality-home/are-you-sustaining-change-in-your-data-quality-initiatives-l.html; 26/11/2008. Brackett, M. (1999) Business Intelligence Value Chain. DM Review Magazine
, March.
Bryman, A. and Bell, E. (2003) Business Research methods
. Oxford: Oxford University Press: 608.
Buch, K. and Rivers, D. (2001) TQM: the role of leadership and culture. Leadership & Organisation Development Journal
, 22(8): 365-371.
Cerpa, N. and Verner, J. M. (1998) Case Study: The Effect of IS Maturity on Information Systems Strategic Planning. Information & Management
, 34: 199-208.
Checkland, P. and Howell, S. (1997) Information, systems and information systems: making sense of the field
. Chichester: John Wiley & Sons.
Chen, I. (2001) Planning for ERP Systems: Analysis and Future Trend. Business Process Management Journal
, 7(5): 374-386.
Chen, I. J. and Popovich, K. (2003) Understanding Customer Relationship Management CRM): People Processes and Technology. Business Process Management Journal
, 9(5): 672-688.
Cheong, L. K. and Chang, V. (2007) The Need for Data Governance: A Case Study
. Paper presented at the AMCIS 2007, USA.
Cobanoglu, C., Warde, B. and Moreo, P. J. (2001) A Comparison of Mail, Fax and Web-Based Survey Methods. International Journal of Marketing Research
, 43(4): 441-452.
Coghlan, D. (2007) Insider Action Research: Opportunities and Challenges. Management Research News, 30(5): 335-343.

129
Collins, J. (2001) Good to Great
. London: Random House Business Books: 300.
Cook, C., Heath, F. and Thompson, R. L. (2000) A Meta-Analysis of Response Rates in Web-or Internet-Based Surveys. Educational and Psychological Measurement
, 60(6): 821-836.
Dale, B. G. (1996) Sustaining a process of continuous improvement: definition and key factors. The TQM Magazine
, 8(2): 49-51.
Dale, B. G., Boaden, R. J., Wilcox, M. and McQuarter, R. E. (1997) Sustaining total quality management: what are the key issues? The TQM Magazine
, 9(5): 372-380.
DAMA. (2008) DAMA- The Data Management Body of Knowledge- Functional Framework: DAMA International. DAMA. (2009) The DAMA Guide to the Data Management Body of Knowledge (DAMA-DMBOK Guide): DAMA International. Davenport, T. H., Eccles, R. G. and Prusak, L. (1992) Information Politics. Sloan Management Review
, 34(1): 53-65.
Davenport, T. H. and Beers, M. C. (1995) Managing Information about Processes. Journal of Management Information Systems
, 12(1): 57-80.
Davenport, T. H. and Prusak, L. (1997) Information Ecology: Mastering the Information and Knowledge Environment
. Oxford: Oxford University Press: 255.
Davenport, T. H. (1998) Putting the Enterprise into the Enterprise System. Harvard Business Review
, July-August 1998: 121-131.
Davenport, T. H., De Long, D. W. and Beers, M. C. (1998) Successful Knowledge Management Projects. Sloan Management Review
, Winter 43-57.
Davenport, T. H. and Marchand, M. A. (2000) Is KM Just Good Information Management?: Mastering Information Management
. London: Financial Times Management.
Davenport, T. H., Harris, J. G., De Long, D. W. and Jacobson, A. L. (2001a) Data to Knowledge to Results: Building an Analytic Capability. California Management Review
, 43(2): 117-138.
Davenport, T. H., Harris, J. G., De Long, D. W. and Jacobson, A. L. (2001b) Data to Knowledge to Results: Building an Analytic Capability: 1-26: Accenture. Davenport, T. H. and Harris, J. G. (2002) Elusive data is everywhere: understanding of position and strategy comes before knowledge creation. Ivey Business Journal
, 66(5): 30-31.
Davenport, T. H. (2004) Learning From Experiments. MIT Sloan Management Review
, Summer.
Davenport, T. H., Harris, J. G. and Cantrell, S. (2004) Enterprise systems and ongoing process change. Business Process Management Journal
, 10(1): 16-26.
Davenport, T. H. (2005) The Coming Commoditization of Processes. Harvard Business Review
, June: 101-108.
Davenport, T. H. (2006a) Competing on Analytics. Harvard Business Review
, January 2006: 99-107.
Davenport, T. H. (2006b) Competing on Analytics. Harvard Business Review
, May: 150-151.

130
Davenport, T. H. and Harris, J. G. (2007) Competing on Analytics: The New Science of Winning
. Cambridge MA: Harvard Business School Press: 225.
Davenport, T. H. (2009) Make Better Decisions. Harvard Business Review
, November 2009.
Davenport, T. H., Harris, J. G. and Morison, R. (2010) Overcoming Sticking Points to Embedding Analytics, Information Management Magazine
, Vol. May/June: 1-2.
de Souza Dias, D. and De Souza, R. S. (2004) ERP System Maturity and Competitive Advantage- Innovations Through Technology
: IGI Global. 156-158
de Vries, E. (2007) Rigorously Relevant Action Research in Information Systems. Sprouts: Working Papers on Information Systems
, 7(4): 1-24.
Deep, A., Guttridge, P., Dani, S. and Burns, N. (2008) Investigating Factors Affecting ERP Selection in Made-To-Order SME Sector. Journal of Manufacturing Technological Management
, 19(4): 430-446.
Deloitte Consulting LLP. (1999) ERP's Second Wave- Maximizing the Value of Enterprise Applications and Processes: 1-45. Deloitte Consulting LLP and Hyperion Solutions Corporation. (2006) Getting Started with Master Data Management: 1-8. DeLuca, D., Gallivan, M. J. and Kock, N. (2008) Furthering Information Systems Action Research: A Post-Positivist Synthesis of Four Dialects. Journal of the Association for Information Systems, 9(2): 48-72 Dun and Bradstreet and Richard Ivery School of Business. (2006) The Cost of Poor Data Quality: Dun and Bradstreet: 1-13. Eaton, M. and Phillips, S. (2006) Sustaining Improvement: Is It a Pipe Dream: ezinearticles. http://ezinearticles.com/?Sustaining-Improvement:-Is-It-a-Pipe-Dream?&id=361163 Eckerson, W. (2002) Data Quality and the Bottom Line: Achieving Business Success through a Commitment to High Quality Data: The Data Warehouse Institute: 1-33. Economic and Social Research Council. (2006) Research Ethics Framework (REF). Economist Intelligence Unit. (2006) Business Intelligence- Putting Information to Work: 25. London. econsultancy. (2009) Industry Stats UK On-line Survey Response Rates; http://econsultancy.com/uk/forums/best-practice/industry-stats-uk-on-line-survey-response-rates?page=1#forum_post_11310 24/12/09. Eden, C. and Huxham, C. (1996) Action Research for Management Research. British Academy of Management
, 7: 75-86.
English, L. P. (1998) The High Cost of Low-Quality Data. Information Management Magazine
, January: 1-5.
English, L. P. (1999) Improving Data Warehouse and Business Information Quality- Methods for Reducing Costs and Increasing Profits
. New York: Wiley Computer Publishing: 518.
English, L. P. (2009) Information Quality Applied
. Indianapolis: Wiley Publications Inc: 802.
Esteves, J. and Pastor, J. (2001) Enterprise Resource Planning Systems Research: An Annotated Bibliography. Communications of AIS
, 7(8): 1-99.
131
Fan, W. and Yan, Z. (2010) Factors Affecting Response Rates of a Web Survey: A Systematic review. Computers in Human Behaviour
, 26: 132-139.
Fisher, C. (2004) Researching and Writing a Dissertation for Business Students
. Harlow, England: Prentice Hall: 278.
Fisher, T. (2009) The Data Asset: How Smart Companies Govern Their Data for Business Success
. New Jersey: John Wiley & Sons: 220.
Foley, O. and Helfert, M. (2010) Information Quality and Accessibility- Innovations and Advances in Computer Sciences and Engineering
. Netherlands: Springer: 477-482.
Fosser, E., Leister, O. H., Moe, C. E. and Newman, M. (2008) Organisations and Vanilla Software: What Do We Know About ERP Systems and Competitive Advantage?
Paper presented at the 16th ECIS, Galway.
Fox, C., Levitin, A. and Redman, T. C. (1994) The Notion of Data and Its Quality Dimensions. Information Processing & Management
, 30(1): 9-19.
Galliers, R. D. and Newell, S. (2001) Back to the Future: From Knowledge Management to Data Management
. Paper presented at the Global Co-Operation in the New Millennium, Bled, Slovenia.
Gartner Research. (2009) Feedback on Data Governance Documents. In T. Friedman (Ed.): 3. Giannoccaro, A., Shanks, G. and Darke, P. (1999) Stakeholder Perceptions of Data Quality in a data Warehouse. Australian Computer Journal
, 31(6): 110-117.
Gill, J. and Johnson, P. (2002) Research Methods for Managers
. London: Sage Publications: 233.
Goldratt, E. M. and Cox, J. (1984) The Goal: A Process of Ongoing Improvement
. Barrington MA: North River Press: 337.
Goodfellow, R. (1994) Manufacturing Resource Planning MRPII
. High Wycombe, England: Manufacturing Business Excellence: 51.
Goyal, N. and Patil, K. (2009) Sustaining Improvement by Building a Quality Mindset; http://www.isixsigma.com/index.php?option=com_k2&view=item&id=681:sustaining-improvement-by-building-a-quality-mindset&Itemid=184 Griffin, J. (2005) Information Strategy: The Master Data Management Challenge. DM Review Magazine
, May.
Grossman, T. and Walsh, J. (2004) Avoiding the Pitfalls of ERP System Implementation. Information Systems Management
, 21(2): 38-42.
Gustavsson, M. and Wanstrom, C. (2009) Assessing Information Quality in Manufacturing Planning and Control Processes. International Journal of Quality & Reliability Management
, 26(4): 325-340.
Hak, T. (2007) Sustainability Indicators, SCOPE 67
. London: Island Press.
Hammer, M. (1990) Reengineering Work: Don't Automate, Obliterate. Harvard Business Review
, July-August: 104-112.
Hammer, M. and Stanton, S. (1999) How to Process Enterprises Really Work. Harvard Business Review
, November-December: 108-118.

132
Harris, J. G. (2005a) Insight-to-Action Loop: Theory to Practice: Accenture. Harris, J. G. (2005b). The Insight-to-Action Loop: Transforming Information into Business Performance: Accenture. Harris, J. G. (2007) Forget the toys- It's the guy with the best data who wins: Accenture. Harris, S. G. and Cole, M. S. (2007) A stages of change perspective on managers' motivation to learn in a leadership development context. Journal of Organisational Change
, 20(6): 774-793.
Hayter, A. (2010) The State of Data Governance
. Paper presented at the Data Governance Conference Europe 2010, London.
Helfert, M. (2001) Managing and Measuring Data Quality in Data Warehousing
. Paper presented at the World Multiconference in Systemics, Cybernetics and Informatics, Orlando, Florida, USA.
Helfert, M. (2009) Challenges of Business Processes Management in Healthcare. Business Process Management Journal
, 15(6): 937-952.
Helfert, M., Foley, O., Ge, M. and Cappiello, C. (2009) Analysing the Effects of Security on Information Quality Dimensions
. Paper presented at the 17th European Conference on Information Systems, Milan, Italy.
Hevner, A. R. and March, S. T. (2003) The Information Systems Research Cycle. IT Systems Perspectives
, November: 111-113
Henver, A. R., March, S. T., Park, J. and Ram, S. (2004) Design Science in Information Systems Research. MIS Quarterly
, 28(1): 75-105
Hevner, A. R. (2007) A Three Cycle View of Design Science Research. Scandinavian Journal of Information Systems, 19(2): 87-92 Hewlett-Packard. (2007) Managing Data as a Corporate Asset: Three Action Steps towards Successful Data Governance: 1-8. Hislop, D. (2005) Knowledge Management in Organizations
. New York: Oxford University Press: 269.
Ho, C.-F., Wu, W.-H. and Tai, Y.-M. (2004) Strategies for the adaptation of ERP systems. Industrial Management & Data Systems
, 104(3): 234-251.
Holland, C. P. and Light, B. (2001) A Stage Maturity Model for Enterprise Resource Planning Systems Use. The DATA BASE for Advances in Information Systems
, 32(2): 34-45.
Howell, J. M. and Higgins, C. A. (1990) Leadership Behavious, Influence Tactics, and career Experiences of Champions of Technological Innovation. Leadership Quarterly
, 1(4): 249-264.
Howell, J. M. and Boies, K. (2004) Champions of Technological Innovation: The Influence of Contextual Knowledge, Role Orientation, Idea Generation and Idea Promotion on Champion Emergence. The Leadership Quarterly
, 18: 123-143.
Informatica. (2005) Addressing data Quality at the Enterprise level: 13. Redwood City US: Informatica Corporation. Informatica. (2008) Timely, trusted Data Unlocks the Door to Governance, Risk and Compliance: 15: Informatica Corporation.

133
Informatica. (2009) Reducing Cost through Effective Data Management- Addressing Data Governance
. Paper presented at the Informatica Day, London.
Information Difference. (2009) The State of Data Quality Today: 33: The Information Difference Company. http://www.pbinsight.com/files/resource-library/resource-files/The-State-of-Data-Quality-Today.pdf Ipathia. (2009) Online Survey Response Rates and Times- Background and Guidance for Industry 6. IIvari, J. (2007) A Paradigmatic Analysis of Information Science as a Design Science. Scandinavian Journal of Information Systems
, 19(2): 39-64
Iivari, J. and Venable, J. (2009) Action Research and Design Science Research- Seemingly Similar but Decisively Dissimilar. Paper presented at the 17th
European Conference on Information Systems
Jacobs, R. W. (1994) Real-time strategic change: How to involve an entire organization in fast and far-reaching change. San Francisco: Berrett-Koehler: 335. Jacobs, F. R. and Weston, F. C. (2006) Enterprise resource planning (ERP)- A brief history. Journal of Operations Management
, 25: 357-363.
Jantz, R. (2001) Knowledge Management in Academic Libraries: Special Tools and Processes to Support Information. Reference Services Review
, 29(1): 33-39.
Jarvinen, P. (2005) Action Research as an Approach in Design Science. Paper presented at The European Academy of Management, Munich Kalling, T. (2003) ERP Systems and the Strategic Management Processes that Lead to Competitive Advantage. Information Resource Management Journal
, 16(4): 46-67.
Kaplan, R. S. and Norton, D. P. (1992) The Balanced Scorecard: Measures That Drive Performance. Harvard Business Review
(The best of HBR) Re-printed July-August 2005:: 172-180.
Kemmis, S. (1993) Action Research and Social Movement: A Challenge for Policy Research. Education Policy Analysis Archives
, 1(1): 1-8.
Khadraoui, A., Leonard, D., Pham Thi, T. T. and Helfert, M. (2009) A Framework for Compliance of Legacy Information Systems with Legal Aspect. AIS Transactions on Enterprise Systems 1
, 1: 15-26.
Kitzinger, J. (1995) Introducing Focus Groups. BMJ, 311: 299-302 Kimball, R. (2007) An Architecture for Data Quality, A Kimball Group White Paper
.
Klaus, H., Roseman, M. and Gable, G. G. (2000) What is ERP? Information Systems Frontiers
, 2(2): 141-162.
Klueber, R. and Alt, R. (2000) Enhancing ERP- Architectures for Business Networking- Case of Deutsche Telekom AG
. Paper presented at the Americas Conference on Information Systems, USA.
Kochikar, V. P. (2000) The Knowledge Management Maturity Model- A Staged Framework for Leveraging Knowledge
. Paper presented at the KM World 2000 Conference, New Jersey.
Kock, N,, Davison, R., Figueiredo, A. D. and da Cunha, P. R. (2002) Can Action Research be Successfully Used in Information Systems Doctoral Research? a Panel Discussion. Informing Science, June

134
Kock, N. (2004) The Three Threats of Action Research: A Discussion of Methodological Antidotes in the context of an Information System Study. Decision Support Systems, 27: 265-286 Koh, S. C. L. and Simpson, M. (2007) Could Enterprise Resource Planning Create a Competitive Advantage for Small Businesses? Benchmarking: An International Journal
, 14(1): 59-76.
Kotter, J. (1996) Leading Change
. Cambridge: Harvard Business School Press: 203.
Laframboise, K. and Reyes, K. (2005) Gaining Competitive Advantage From Integrating Enterprise Resource Planning and Total Quality Management. Journal of Supply Chain Management
, Summer: 49-64.
Lamb, R. and Kling, R. (2003) Reconceptualising Users as Social Actors in Information Systems Research. MIS Quarterly
, 27(2): 197-235.
LaMonica, M. (1999) Life after ERP. InfoWorld
, 21(33): 34-35.
Lau, F. (1999) Towards a Framework for Action Research in Information Systems Studies. Information Technology and People
, 12(2): 148-175
Laudon, K. C. (1986) Data Quality and Due Process in Large Interorganizational Record Systems. Commutations of the ACM
, 29(1): 4-11.
Lave, J. and Wenger, E. (1991) Situated Learning: Legitimate Peripheral Participation
. Cambridge: Cambridge University Press: 144.
Lee, Y. W., Strong, D. M., Kahn, B. K. and Wang, R. Y. (2002) AIQM: a methodology for information quality management. Information & Management
, 4: 133-146.
Lee, Y. W. (2004) Crafting Rules: Context-Reflective Data Quality Problem Solving. Journal of Management Information Systems
, 20(3): 93-119.
Lee, Y. W., Pipino, L. L., Strong, D. M. and Wang, R. Y. (2004) Process-Embedded Data Integrity. Journal of Database Management
, 15(1): 87-103.
Legnick-Hall, C. A., Legnick-Hall, M. L. and Abinnour-Helm, S. (2004) The Role of Social and Intellectual Capital in Achieving Advantage Through Enterprise Resource Planning (ERP) Systems. Journal of Engineering Technology Management
, 21: 307-330.
Legnick-Hall, C. A. and Legnick-Hall, M. L. (2006) HR, ERP, and Knowledge for Competitive Advantage. Human Resource Management
, 45(2): 179-194.
Levis, M., Helfert, M. and Brady, M. (2007) Information Quality Management: Review of an Evolving Research Area
. Paper presented at the International Conference on Information Quality, Cambridge, Massachusetts, USA.
Lewin, K. (1946) Action Research and Minority Problems. Journal of Social Issues
, 2(4): 34-46.
Lewis, L. K. (2000) Communicating Change: Four Cases of Quality Programs. Journal of Business Communication
, 37(2): 128-155.
Losee, R. M. (1998) A Discipline Independent Definition of Information. Journal of the American Society for Information Science
, 48(3): 254-269.
Loshin, D. (2001) The Cost of Poor Data Quality. DM Review Magazine, June.

135
Madnick, S. E., Wang, R. Y., Lee, Y. W. and Zhu, H. (2009) Overview and Framework for Data and Information Quality Research. ACM Journal of Data and Information Quality
, 1(1): 2.1-2.20.
Manfreda, K. L., Bosnjak, M., Berzelak, J., Haas, I. and Vehovar, V. (2008) Web Surveys Versus Other Survey Models: A Meta-Analysis Comparing response Rates. International Journal of Marketing Research
, 50(1): 79-104.
Mann, P. (2003) Multisite Mentality. Manufacturing Systems
, 21: 30-33.
March, A. T. and Storey, V. C. (2008) Design Science in the Information Systems Discipline: An Introduction to the Special Issue on Design Science Research. MIS Quarterly
, 32(4): 725-730
Marchand, M. A. (2000) Competing with Information: a manager's guide to creating value with information content
. Chichester: John Wiley & Sons: 342.
Markham, S. K. (2000) Corporate Championing and Antagonism as Forms of Political Behaviour: An R&D Perspective. Organisational Science
, 11(4): 429-447.
Markus, M. L. and Tanis, C. (2000) Learning from adopters' experiences with ERP: Problems encountered and success achieved. Journal of Information Technology
, 15: 245-265.
Markus, M. L., Tanis, C. and van Fenema, P. C. (2000) Multisite ERP Implementations. Communications of the ACM
, 43(4): 42-46.
McKelvey, B. (2006) Van de Ven and Johnson's "Engaged Scholarship": Nice Try, But... Academy of Management Review
, 31(4): 822-829.
McNiff, J. (2002) Action Research for Professional Development- Concise advice for new action researchers. Miles, M. B. and Huberman, A. M. (1994) Qualitative Data Analysis
. London: Sage Publications: 336.
Milne, M. J., Kearins, K. and Walton, S. (2006) Creating Adventures in Wonderland: The Journey Metaphor and Environmental Sustainability. Organisation
13(6): 801-839.
Moe, C. E., Fosser, E., Leister, O. H. and Newman, M. (2007) How Can Organizations Achieve Competitive Advantage Using ERP Systems Through Managerial Processes- Advances in Information Systems Development
: Springer US: 37-46.
Mohamed, S. and McLaren, T. S. (2009) Probing the Gaps between ERP Education and ERP Implementation Success Factors. AIS Transactions on Enterprise Systems 1
, 1: 8-14.
Morgan, J. M. and Liker, J. (2006) The Toyota Product Development System: Integrating People, Processes and Technology
. New York: Productivity Press: 383.
Murray, M. and Coffin, G. (2001) A Case Study Analysis of Factors for Success in ERP System Implementations
. Paper presented at the AMCIS 2001, USA.
Mutch, A. (1996) No such thing as.......information resource management. Management Decision
, 34(7): 58-62.
Mutch, A. (1997) Information Literacy: An Exploration. International Journal of Information Management
, 17(5): 377-376.
Mutch, A. (1999) Critical Realism, Managers and Information. British Journal of Management, 10: 323-333.

136
Mutch, A. (2008) Managing Information and Knowledge in Organizations
. London: Routledge: 272.
Nelson, K. (2002) Bad Data Plagues ERP. Bank Systems & Technology
, 39(3): 12.
Newell, S., Huang, J. C., Galliers, R. D. and Pan, S. L. (2002) Implementing enterprise resource planning and knowledge management systems in tandem: fostering efficiency and innovation complementarity. Information and Organisation
, 13: 25-52.
Nicolaou, A. I. (2004) Quality of Post implementation reviews for Enterprise Resource Planning systems. International Journal of Accounting Information systems
, 5: 25-49.
Nonaka, I. and Takeuchi, H. (1995) The Knowledge-Creating Company
. Oxford: Oxford University Press: 284.
Nosek, B. A., Banaji, M. A. and Greenwald, A. G. (2002) E-Research: Ethics, Security, Design and Control in Psychological Research on the Internet. Journal of Social Studies
, 58(1): 161-176 Abstract.
NTU DBA Course. (2005) NTU DBA Course Members' Handbook. 2005
: 53.
O'Brien, T. (2006) Data Quality; A fundamental element in Creating a World Class Enterprise Resource Planning and Information System within a Multi-site Disabled Employment Organisation- Document 2
. Nottingham Trent University, Nottingham.
Ogland, P. (2009) Action Research and Design Science Research- More Similar than Dissimilar. http://citeseerx.ist.psu.edu/viewdoc/summary?doi=10.1.1.160.4907 Olson, J. E. (2003) Data Accuracy: The Accuracy Dimension
. San Francisco: Morgan Kaufmann: 295.
Oppenheim, A. N. (1992) Questionnaire Design, Interviewing and Attitude Measurement
. London: Pinter Publishers: 307.
Orna, E. (1996) Information Products and Presentation in Organisations: Accident or Design? International Journal of Information Management
, 16(5): 341-351.
Orna, E. (2001) Information Products Revisited
: 301-316.
Orna, E. (2004) Information Strategy in Practice
. Aldershot: Gower Publishing: 164.
Orna, E. (2005) Making Knowledge Visible
. Burlington VA: Gower Publishing Company: 212.
Outten, R. (2005) Maximising ERP performance. Manufactures' Monthly
, April: 24.
Pearce, M. (1998) Getting Full Value from Focus-Group Research. Ivey Business Journal
, 63(2): 72-75.
Pfleeger, S. L., Trope, R. L. and Palmer, C. C. (2007) Managing Organisational Security. Security and Privacy
, 5(3): 13-15.
Pham Thi, T. T. and Helfert, M. (2007) Modelling Information Manufacturing Systems. International Journal of information Quality
, 1(1): 5-21.
Pipino, L. L., Lee, Y. W. and Wang, R. Y. (2002) Data Quality Assessment. Communications of the ACM
, 45(4): 211-218.
Poade, D. (2009) Sampling Response Rates: The experience of conducting an online student survey;

137
http://www.google.co.uk/search?hl=en&lr=&q=plymouth+university+response+rates+poade+%22plymouth.ac.uk%22&aq=f&aqi=&aql=&oq=&gs_rfai=24/12/09. Pollock, N. and Williams, R. (2008) Software and Organisations: The Biography of the Enterprise-Wide System or How SAP Conquered the World
. Abingdon: Routledge: 350.
Powell, P. (1993) Causality in the Alignment of Information Technology and Business Strategy. Journal of Strategic Information Systems
, 2(4).
Pries-Heje, J., Baskerville, R. and Venable, J. (2008) Strategies for Design Science Research Evaluation. http://is2.lse.ac.uk/asp/aspecis/20080023.pdf: 1-12 Prochaska, J. O. and DiClementie, C. C. (1982) Trans-theoretical therapy- towards a more integrated model of change. Psychotherapy: Theory, Research and Practice
, 19(3): 276-288.
Prochaska, J. O. and Velicer, W. F. (1997) The Transtheoretical model of health behaviour change. AM J Health Promote
, Sept-Oct(1): 38-48.
Redman, T. C. (1995) Improve Data Quality for Competitive Advantage. Sloan Management Review
, Winter: 99-107.
Redman, T. C. (1998) The Impact of Poor Data Quality on the Typical Enterprise. Communications of the ACM
, 41(2): 79-82.
Redman, T. C. (2001) Data Quality: The Field Guide. Woburn. MA: Butterworth-Heinemann: 243. Redman, T. C. (2002) A Long, Strange Trip Ahead: Process Management and Data Quality
. Paper presented at the Seventh International Conference on Information Quality.
Redman, T. C. (2004) Data: An Unfolding Quality Disaster. DM Review Magazine
, August: 1-7.
Redman, T. C. (2005) Data: A Sea Change Ahead. Wall Street Technology
, September.
Redman, T. C. (2008) Data Driven: Profiting From Your Most Important Business Asset
. Cambridge MA: Harvard Business Press: 261.
Ross, J. W. (1999) Surprising Facts About Implementing ERP. IT Professional1
, 4: 65-68.
Roster, C. A., Rodgers, R. D., Albaum, G. and Klein, D. (2004) A Comparison of Response Rates from We and Telephone Surveys. International Journal of Marketing Research
, 46(3): 359-373.
Roth, J., Shani, A. B. and Leary, M. M. (2007) Insider Action Research. Action Research
, 5(1): 41-60.
Russem, P. (2006) Taking Data Quality to the Enterprise through Data Governance: The Data Warehouse Institute: 1-23: Rynes, S. L., Bartunek, J. M. and Daft, R. L. (2001) Across the Great Divide: Knowledge Creation and Transfer Between Practitioners and Academics. Academy of Management Journal
, 44(2): 340-355.
Schneiderjans, M. J. and Kim, G. C. (2003) Implementing enterprise resource planning systems with total quality control and business process reengineering. International journal of Operations & Production Management
, 23(4): 418-429.
Schon, D. A. (1963) Champions for Radical New Innovations. Harvard Business Review, 41: 77-86.

138
Schonlau, M., Frickerer, R. D. and Elliott, M. N. (2002) Conducting Research Surveys via E-mail and the Web
. Santa Monica, CA: RAND: 118.
Scott, J. E. and Vessey, I. (2000) Implementing Enterprise Resource Planning Systems: The Role of Learning from Failure. Information Systems Frontiers
, 2(2): 213-232.
Seddon, P. B. (2005) Are ERP Systems a Source of Competitive Advantage? Strategic Change
, 14(5): 283-293.
Senge, P. M. (1992) The Fifth Discipline
. London: Century Business: 424.
Shane, S. A. (1994a) Are Champions Different from Non-Champions? Journal of Business Venturing
, 9(5): 397-421.
Shane, S. A. (1994b) Cultural Values and the Championing Process. Entrepreneurship
, 18.
Sharp, A. (2006) Process Orientation- What you need to know about business processes: 1-10: Acetta. Shehab, E. M., Sharp, M. W., Supramaniam, L. and Spedding, T. A. (2004) Enterprise Resource Planning: An integrative review. Business Process Management Journal
, 10(4): 359-386.
Simon, H. A. (1967) The Business School: A Problem in Organizational Design. Journal of Management Studies
, 4(1): 1-16.
Stefanou, C. J. and Revanoglou, A. (2006) ERP Integration in a Healthcare Environment: a Case Study. Journal of Enterprise Information Management
, 19(1): 115-130.
Stenmark, D. (2004) Leveraging Knowledge Management activities in everyday practice
. Paper presented at the CROINFO 2004, Zagreb Croatia.
Stirling, M., Petty, D. and Travis, L. (2002) A Methodology for Developing Integrated Information Systems Based on ERP Packaging. Business Process Management Journal
, 8(5): 430-446.
Strategic Direction. (2002) Sustaining a quality initiative. Strategic Direction
, 18(4): 15-17.
Strong, D. M., Lee, Y. W. and Wang, R. Y. (1997) Data Quality in Context. Communications of the ACM
, 40(5): 103-110.
Sveiby, K.-E. (2006) What is Information?; http://www.sveiby.com/articles/PerilsofInformatized.html 18/08/06. Svensson, G. (2006) Sustaining quality management: a strategic perspective. The TQM Magazine
, 18(1): 22-29.
Tarentino, A. (2008) Governance, Risk and Compliance Handbook: Technology, Finance, Environmental and International Guidance and Best Practices
. New Jersey: John Wiley & Sons Inc: 972.
Tayi, G. K. and Ballou, D. (1998) Examining Data Quality. Communications of the ACM
, 41(2): 54-57.
The Information Difference. (2009) The State of Data Quality Today: 33. Van de Ven, A. and Johnson, P. E. (2006a) Knowledge for Theory and Practice. Academy of Management Review
, 31(4): 802-821.

139
Van de Ven, A. and Johnson, P. E. (2006b) Nice Try, Bill, But...There You Go Again. Academy of Management Review
, 31(4): 830-832.
Van de Ven, A. H. (2007) Engaged Scholarship: A Guide for Organisational and Social Research
. Oxford: Oxford University Press: 330.
Vosberg, J. and Kumar, A. (2001) Managing dirty data in organizations using ERP: lessons from a case study. Industrial Management & Data Systems
, 101(1): 21-31.
Wai-Ching, L. (2007).How to design a questionnaire; http://archive.student.bmj.com/issues/01/06/education/187.php; 01/07/2007. Wallace, T. F. and Kremzar, H. H. (2001) ERP: Making It Happen: The Implementers' Guide to Success with Enterprise Resource Planning
. New York: John Wiley & Sons: 372.
Walsham, G. (2006) Doing Interpretive Research. European Journal of Information Systems
, 15: 320-330.
Wand, Y. and Wang, R. Y. (1996) Anchoring Data Quality Dimensions in Ontological Foundations. Communications of the ACM
, 39(11): 86-95.
Wang, R. Y. and Strong, D. M. (1996) Beyond Accuracy: What Data Quality Means to Data Consumers. Journal of Management Information Systems
, 12(4): 5-34.
Wang, R. Y. (1998) A Product Perspective on Total Data. Communications of the ACM
, 41(2): 58-65.
Wang, R. Y., Ziand, M. and Lee, Y. W. (2001) Data Quality
. Norwell, Massachusetts: Kluwer Academic Publishers.
Wang, R.Y. Allen, T. Harris, W. and Madnick, S. (2003) An information product approach for total information awareness. Paper presented at the IEEE Aerospace Conference. Big Sky, Montana, March 2003 Weber, K., Otto, B. and Osterle, H. (2009) One Size Does Not Fit All- A Contingency Approach to Data Governance. ACM Journal of Data and Information Quality
, 1(1): 71-97
Wenger, E. (1997) Practice, Learning, Meaning and Identity: (learning concepts 'Communities of Practice'). Training
, February(2): 38.
Wenger, E. and Snyder, W. (2000) Communities of Practise: The Organisational Frontier. Harvard Business Review
, January-February: `139-145.
Wenger, E. (2002) Cultivating Communities of Practice: A Guide to Managing Knowledge
: Harvard Business School Books.
Whitehead, J. C. (2006) Do we really Align People, Processes and Technology?- Improve Your Focus, Improve your ROI!: TriTuns, LLC: 1-7. Williams, J. and Beyer, M. (2006). Master Data Management: Creating and Enabling for Business Integration: Collaborative Consulting: 1-12. Williams, R. and Pollock, N. (2009) Beyond the ERP Implementation Study: A New Approach to the Study of Packaged Information Systems: The Biography of Artifacts Framework
. Paper presented at the Thirteenth International Conference on Information Systems, Pheonix US.
Willis, T. H. and Willis-Brown, A. H. (2002) Extending the value of ERP. Industrial Management & Data Systems
, 102(1): 35-38.
Wing, G. R. (2010) Unlocking the Value of ERP. Baseline, January/February: 28-29.

140
Wood, N. (2004) Making it stick: Sustaining your Improvements. Management Services
, 48(2): 20-23.
Worley, J. H., Chatha, K. A., Weston, R. H., Aguirre, O. and Grabot, B. (2005) Implementation and optimisation of ERP systems: A better integration of processes, roles, knowledge and user competences. Computers in Industry
, 56: 620-638.
Xu, H., Nord, J. H., Brown, N. and Nord, G. D. (2002) Data quality issues in implementing an ERP. Industrial Management & Data Systems
, 102(1): 47-58.
Xue, Y., Liang, H., Boulton, W. R. and Snyder, C. A. (2005) ERP Implementation Failures in China: Case Studies with Implications for ERP Vendors. International Journal of Production Economics
, 97(3): 279-295.
Zairi, M. (2005) TQM Sustainability: How to Maintain its Gains Through Transforming Change, Working Paper 05/14
: University of Bradford School of Management.

141
DATA QUALITY RESEARCH PROGRAMME Appendix 1a Research survey to ascertain factors that impact upon sustaining data quality improvements- positive/negative
Analysis of factors
Note the Site and Business names have been excluded Current Actions/Policies The way we are doing things currently
Issues/Problems Issues/problems identified
Action Going Forward What we are going to do in the short term
Culture-current Current inherent thinking, attitudes & behaviour Culture-future Intended inherent thinking, attitudes & behaviour No
Appreciation as to how KPIs fit within the Corporate D & IQ initiative
Focus initially on the four key site specific elements (DNYI & orders)
Ascertain root cause of issues/problems
Need to ensure that everyone is fully aware of the implications of their actions
KPIs never understood & never previously cascaded down
Detailed short term action plan- with target dates
Issues with transport & utility bills
Weekly KPI review meetings
Cyber access required 9
Appreciation as to how KPIs fit within the Corporate D & IQ initiative
Focus initially on the four key site specific elements (DNYI & orders)
Training issues identified
Need to ensure that everyone is fully aware of the implications of their actions
Detailed short term action plan- with target dates
Issues with DNYI?
Weekly KPI review meetings
Review credit notes 8
Specific policy re RNIs
Focus on outstanding orders SSC Issues 3

142
Contact TOB re any underlying SSC issues
Focus initially on the four key site specific elements (DNYI & orders)
SSC Issues contact keeps changing
Better understanding of the underlying principle & requirements
Confirmation of PO authority levels required
Review RNI principally 'returns'
Weekly KPI review meetings 7
Need to ensure that everyone is fully aware of the implications of their actions
KPIs never understood & never previously cascaded down
Detailed short term action plan- with target dates
Weekly KPI review meetings
Cyberq access required 5
Low level of business activity
Training issues identified
Need to ensure that everyone is fully aware of the implications of their actions 3
Appreciation as to how KPIs fit within the Corporate D & IQ initiative
No business specific ISBM contact
Dating of order- should be expected receipt/delivery date NOT default date 'today'
Need to ensure that everyone is fully aware of the implications of their actions
Key people left through VR without adequate replacement knowledge & training
Detailed short term action plan- with target dates
Requirement for visit by Tony Taylor
Weekly KPI review meetings
Super User' concept not followed up 9
No business specific ISBM contact
Baan outstanding PO report not complete- missing final
Training issues identified
Need to ensure that everyone is fully aware of the implications of their actions
DNYIs outstanding
Weekly KPI review meetings 6

143
steps
Greater publicity of the existence of KPIs
Prioritising of the impact on the business
Need to explain importance of KPIs at both business & site level to help sites take ownership
Need to ensure that everyone is fully aware of the implications of their actions
Toolbox of how to drill down through the reports to understand what has happened & what can go wrong 5
Problem with identifying site specific data from Co 510
Receiving outstanding order lists weekly via email
Printing & reviewing sales orders weekly
Overall performance is good
LRM has back office experience as a former production controller
Pricing of manual POs where actual price not known- 50 @ £1
Requirement for visit by Tony Taylor 7
Good processes in place using Baan
Agreed that KPI data will be used in conjunction with Baan reports
RNIs reviewed weekly by LRM
Baan outstanding PO report not complete- missing final steps
Cyberq access required 5
Process to improve credit notes
Implement automated process to advance dates on 'out to fit' production
Enter anticipated receipt date on POs NOT default date (today) BFP not known
KPIs reviewed weekly 5

144
orders
Problems with carriage charges
Issues with SSC
Issues with raw material price changes-- ownership & responsibility
Problems with incorrect conversion factors
Purchase returns- no process for chasing for supplier credit notes
Weekly KPI review meetings 6
New LRM not fully aware of the KPIs
Focus initially on the four key site specific elements (DNYI & orders)
Enter anticipated receipt date on POs NOT default date (today)
Need to identify the personnel dealing with each type of order & agree who does what with responsibility for each process
Production orders for large volumes are set up as one qty- better if broken into smaller qty orders
Weekly KPI review meetings 6
Agree process for dating production & purchase orders
Issues regarding invoicing for tooling- may take over a year
Process for improving credit notes- print documents
Focussing on KPIs must not sub-optimise day to day operations
Weekly KPI review meetings 5
Contact TOB re any underlying SSC issues
Focus initially on the four key site specific elements (DNYI &
Enter anticipated receipt date on orders NOT default date (today)
Need to ensure that everyone is fully aware of the implications of their actions
Weekly KPI review meetings 5

145
orders)
Site not aware previously of KPIs
Should order dates be changed if customers redates orders?
Baan outstanding PO report not complete- missing final steps
Need to ensure that everyone is fully aware of the implications of their actions
Focussing on KPIs must not sub-optimise day to day operations
Weekly KPI review meetings 6
SSC issues
Baan training requirements identified
LRM provides a weekly business KPI summary
LRM has produced business KPI guidelines
Pricing of manual POs where actual price not known- 50 @ £1
Weekly KPI review meetings 6
Some interesting comments (point 8)
Should order dates be changed if customers redates orders?
Purchase returns- no process for chasing for supplier credit notes
Weekly KPI review meetings 4
Everyone involved in the process
Culture of urgency where something needs to happen
Targets set & measured
KPI are beneficial & graphs useful
Assists in identifying & reducing poor practices
Indicative of the quality of the processes
Overall performance is good
Weekly KPI review meetings 8

146
Review all orders & pass details to relevant person at the start of each month
Call-off orders open for a long time
Set up production orders for smaller quantities covering shorter lead times
Need to ensure that everyone is fully aware of the implications of their actions- financial & transactional
Build DQ targets into people's objectives
Contact TOB re any underlying SSC issues
Requirement for visit by Tony Taylor
To review KPIs to measure progress 8
Ecycle orders not being picked up
Business to use KPIs on a weekly basis
Weekly planning meetings at each site, consolidated at the Centre
Problems with carriage charges on suppliers' invoices
Baan outstanding PO report not complete- missing final steps
Purchase Invoicing problems
SSC issues lack of continuity
Granfos receipts & returns not being contra'd 8
SSC issues lack of continuity
Contact TOB re any underlying SSC issues
Incorporate KPIs within staff's objectives
Importance of the KPIs identified
Focus initially on the four key site specific elements (DNYI & orders) 5
Problems with aggregated sales invoice for Glasgow liaise with SSC
Implement automated process to advance dates on 'out to fit' production orders
Training issues identified
Strictly monitor overdue purchase orders 4
Purchase returns- no process for chasing for supplier credit
Users need more knowledge to tell them which
Loss of skills following Modernisation. Training issues identified
Need to ensure that everyone is fully aware of the implications of their actions-
Automate essential reports & send via email 5

147
notes reports to run to obtain information
financial & transactional
KPIs have not been cascaded down to Operations. Staff do not understand the process
Previously not seen as important by LRMs & production controllers- merely lip services
Graphs are good provides visibility
Fundamental to running the business Cultural issues
Problem with identifying site specific data from Co 510 6
Problem with identifying site specific data from Co 510
Focus initially on the four key site specific elements (DNYI & orders)
Objective to achieve November index target of 21.22 by Christmas 3
Use super users to communicate and implement 'best practice'
Focus initially on the four key site specific elements (DNYI & orders)
Problems with accounting for consignment stock. Company policy required?
Common process for dealing with carriage charges on suppliers' invoices
Training requirements to be identified by each site 5

148
Highlight any SSC issues to TOB/Adam
Focus initially on the four key site specific elements (DNYI & orders)
Business/sites to provide feedback on DQ issues
Problems with carriage charges on suppliers' invoices
Maintain ongoing focus on weekly planning meetings
Weekly planning meetings at each site, consolidated at the Centre 6
Focus initially on the four key site specific elements (DNYI & orders)
Business/sites to provide feedback on DQ issues, problems & successes 2
Focus initially on the four key site specific elements (DNYI & orders)
Training issues identified
Need to ensure that everyone is fully aware of the implications of their actions
Policy re the re-dating of orders
Detailed short term action plan- with target dates
Issues re DNYI, invoicing & receivables
Review credit notes 7
All sites indicate good practices in place- aiming to be 'the best'
Super User set up but no feedback
Provide all LRMs with access to the GL Transaction Report?
Training requirements identified
No business-specific ISBM
Detailed short term action plan- with target dates
Problems with Aged Inventory Report- not clearing old receipts
Weekly KPI review meetings 8

149
A lot of bad habits have been carried forward & a lack of understanding in the sites
LRM process focussed: Right first time mentality: Coaching admin support
An error can take 30 seconds but a correction can take hours'
Produce a document covering each KPI highlighting examples of problems/issues with resolutions
Re-age orders as appropriate
New process for reduction of credit notes in Packaging
Review sales orders at daily production meeting
Weekly KPI review meetings
Running new Cyberq RNI report 9
Jobs & roles carried out by people who left under VR need to be identified & picked up
Re-age orders as appropriate
Print KPIs weekly & distribute to the Team
Review Cyberq access 4
Major improvements at all 3 sites
Data accuracy targets built into peoples' objectives
Issue monthly credit note report to all LRMs
RNI returns a big issue
Regular monitoring of KPI index (daily)
Detailed short term action plan- with target dates
Weekly KPI review meetings 7
No follow up on the 'Super User' concept
Multi-despatches on a single invoice with only one detach note number causes problems
Do we check supplier’s statements to see if there are old invoices not received?
Access to Accounts Payable enquiry sessions may be useful
Review training requirements
May be useful to cascade GL Transaction Report to all LRMs
Runs aged debtors report weekly
Weekly KPI review meetings
Credit note reasons investigated 9
Total 214

150
DATA QUALITY RESEARCH PROGRAMME Appendix 1b Research survey to ascertain factors that impact upon sustaining data quality improvements- positive/negative Current Actions/Policies Issues/Problems Action Going Forward Culture-current Culture-future
Culture-current No +/- Current Actions/Policies No +/- Issues/Problems No
Action Going Forward No
Action Going Forward No Culture-future No
KPIs never understood & never previously cascaded down 2 -
Specific policy re RNIs 1 +
Problems with carriage charges 4
Focus initially on the four key site specific elements (DNYI & orders) 11
Strictly monitor overdue purchase orders 1
Appreciation as to how KPIs fit within the Corporate D & IQ initiative 3
Overall performance is good 2 +
Focus on outstanding orders 1 +
Training requirements identified 6
Detailed short term action plan- with target dates 7
Purchase returns- no process for chasing for suplier credit notes 1
Acertain root cause of isues/problems 1

151
LRM has back office experience as a former production controller 1 +
Low level of business activity 1 ?
Issues with DNYI? 2
Weekly KPI review meetings 16
Users need more knowledge to tell them which reports to run to obtain information 1
Need to ensure that everyone is fully aware of the implications of their actions 12
New LRM not fully aware of the KPIs 1 -
Key people left through VR without adequate replacement knowledge & training 1 - SSC Issues 6
Cyberq access required 5
Automate essential reports & send via email 1
Better understanding of the underlying principle & requirements 1
Site not aware previously of KPIs 1 -
Receiving outstanding order lists weekly via email 1 +
SSC Issues contact keeps changing 4
Contact TOB re any underlying SSC issues 6
Objective to achieve November index target of 21.22 by Christmas 1
Need to explain importance of KPIs at both business & site level to help sites take ownership 1
Some interesting comments (point 8) 1 +
Printing & reviewing sales orders weekly 1 +
No business specific ISBM contact 3
Confirmation of PO authority levels required 1
Use super users to communicate and implement 'best practice' 1
Prioritising of the impact on the business 1

152
Everyone involved in the process 1 +
Good processes in place using Baan 1 +
Super User' concept not followed up 3
Review RNI principally 'returns' 1
Training requirements to be identified by each site 2
Need to identify the personnel dealing with each type of order & agree who does what with responsibility for each process 1
Culture of urgency where something needs to happen 1 +
RNIs reviewed weekly by LRM 1 +
Baan outstanding PO report not complete- missing final steps 4
Dating of order- should be expected reipt/defivery date NOT default date 'today' 4
Business/sites to provide feedback on DQ issues, problems & successes 2
Focussing on KPIs must not sub-optimise day to day operations 2
Targets set & measured 1 +
Weekly KPI review meetings 6 +
Problem with identifying site specific data from Co 510 3
Requirement for visit by Tony Taylor 3
Maintain ongoing focus on weekly planning meetings 1
Build DQ targets into people's objectives 2
KPI are beneficial & graphs useful 1 +
LRM provides a weekly business KPI summary 1 + BFP not known 1
DNYIs outstanding 1
Provide all LRMs with access to the GL Transaction Report? 1
Graphs are good provides visibility 1
Assists in identifying & reducing poor practices 1 +
LRM has produced business KPI guidelines 1 +
Issues with raw material price changes-- ownership & responsibility 1
Greater publicity of the existence of KPIs 1
Jobs & roles carried out by people who left under VR need to be identified & picked up 1

153
Indicative of the quality of the processes 1 +
Review all orders & pass details to relevant person at the start of each month 1 +
Problems with incorrect conversion factors 1
Toolbox of how to drill down through the reports to understand what has happened & what can go wrong 1
Access to Accounts Payable enquiry sessions may be useful 1
Importance of the KPIs identified 1 +
Weekly planning meetings at each site, consolidated at the Center 2 +
Purchase returns- no process for chasing for supplier credit notes 2
Pricing of manual POs where actual price not known- 50 @ £1 1
May be useful to cascade GL Transaction Report to all LRMs 1
Loss of skills following Modernisation 1 -
Re-age orders as appropriate 2 +
Issues regarding invoicing for tooling- may take over a year 1
Agreed that KPI data will be used in conjunction with Baan reports 1
KPIs have not been cascaded down to Operations. Staff do not understand the process 1 -
Using new Cyberq RNI report 1 +
Should order dates be changed if customers redates orders? 3
Process for improving credit notes- print documents 2

154
Previously not seen as important by LRMs & production controllers- merely lip services 1 -
Review sales orders at daily production meeting 1 +
Pricing of manual POs where actual price not known- 50 @ £1 1
Implement automated process to advance dates on 'out to fit' production orders 2
Fundamental to running the business 1 +
Runs aged debtors report weekly 1 +
Call-off orders open for a long time 1
Production orders for large volumes are set up as one qty- better if broken into smaller qty orders 2
Cultural issues 1 ?
Credit note reasons investigated 1 +
Ecycle orders not being picked up 1
Set up production orders for smaller quantities covering shorter lead times 2
All sites indicate good pratices in place- aiming tobe 'the best' 1 +
Granfos receipts & returns not being contra'd 1
Problems with aggregated sales invoice for Glasgow liaise with SSC 1
An error can take 30 seconds but a correction can take hours' 1 +
Problems with Aged Inventory Report- not clearing old receipts 1
Produce a document covering each KPI highlighting examples of 1

155
problems/issues with resolutions
A lot of bad habits have been carried forward & a lack of understanding in the sites 1 +
RNI returns a big issue 1
New process for reduction of credit notes in Packaging 1
LRM process focussed: Right forst time mentality: Coachung admin support 1 +
Multi-despatches on a single invoice with only one destach note number causes problems 1
Issue monthly credit note report to all LRMs 1
Major improvements at all 3 sites 1 +
Do we check suppliers statements to see if there are old invoices not received? 1
Data accuracy targets built into peoples' objectives 1 + Regular monitoring of KPI index (daily) 1 +

156
Total 27 25 52 71 11 28
+ 19 + 24 - 7 - 1 Total 214

157
Analysis of the Key Findings from the Research Appendix 2 This appendix presents in detail, the key findings from this entire research; extracted from the
research findings, short term guidelines, issues and ongoing suggestions from the qualitative
study, the findings from the Data Accuracy KPI Index performance review; and the summary
findings from the quantitative survey. To this has been added further perceived outcomes
derived from an appraisal of the entire project over its lifetime, coupled with one’s related
personal and professional experiences.
These key research findings are then classified further within Appendix 14 into the main
headings of the conceptual framework: Cultural/Organisational- Leadership (L) and
Management (M); Processes (Pr) and People (Pe) as indicated below, together with the key
recurring themes from the review of the quality literature shown in Table 2 on pages 50-52
A. Research Findings- Qualitative Study Lessons Learnt
• Take things slowly to ensure everyone is onboard (Pe)
• Identify ownership and responsibilities (M)
• The Businesses ‘own’ the data NOT IT- a paradigm shift (M)
• Provide regular visible measures and report progress (M)
• Identify how the ‘measures’ will influence the quality of the data (M)
• Involve everyone, provide support (Pe)
• Explain the underlying reasons behind the improvement programme and how
it will support the corporate objectives (L)
• Ensure everyone is fully aware of the implications of their actions (Pe)
• Build data quality targets into peoples’ objective and reward success (Pe)
• Ascertain root causes of issues and problems and resolve at source (Pr)
Motivational Factors
• It is the ‘right’ thing to be doing, it supports one’s principles (Pe)
• Belief that it will improve efficiency, help control and manage the factory and
department (Pe)
• Competition between colleagues (Pe)
• Peer and Manager pressure (Pe)
• ‘League Table’ Syndrome (Pe)
• Requirement to achieve monthly/quarterly targets (Pe)
• A distinct movement away from ‘I’m going to be in trouble’ to ‘My life is better
for doing it this way’ (Pe)

158
Environmental Factors
• Sell the concept up and down the organisation (L)
• Executive and senior and middle management sponsorship and involvement
(L)
• Measurement of progress and the publication of results (M)
• Have an Internal Champion who has the respect of the audience (L)
• Tackle negative cultural issues (M)
• Cultivate an attitude and willingness to embrace new ideas (L)
• Build in system and structural changes to prevent a return to type (M)
• Improve communications to share ideas (M)
• A ‘Bottom-Up approach with ‘Top-Down’ support (L)
General
• The concept of People, Processes and Data (Pr/Pe)
• A mixture of all of the above B. Guidelines, Issues and Suggestions- Qualitative Study Short Term Guidelines
• Involve everyone (Pe)
• Continually measure, report and provide feedback (M)
• Hold regular reviews with the ‘Team’ (Pe)
• Make the measurement and results visible (M)
• Focus on the ‘key’ elements setting objectives and targets (M)
• Ensure that potential problem areas are identified (M)
• Ensure that the appropriate processes and procedures are in place- ‘one size
does not fill all’ (Pr)
• Communicate across the business on a regular basis (M)
Issues
• Training, education and development requirements not being met fully (Pe)
• A need for ongoing support in all areas with an internal ‘expert’ user
community (M)
• Requirement for closer liaison between functions (M)
• Potential ‘problem’ areas identified (M)
Ongoing Suggestions (as above)
• Need to ensure everyone is fully aware of the implications of their actions
(Pe)
• Better understanding of the underlying principles and requirements (M)

159
• Ascertain root causes of issues and problems (Pr)
• Appreciation as to how the KPIs fit within the corporate data and information
quality initiative (M)
• Identify the personnel dealing with each type of order and agree who does
what with responsibilities for each process (Pr)
• Build data quality targets into people’s objectives (Pe)
C. Findings Data Accuracy KPI Index Performance • There is potential for real cultural change to take place if improvement
initiatives are managed correctly (M)
• “What is measured, communicated, discussed and agreed at all levels has a
very good chance of becoming embedded”
o Bottom-up supported by top-down
o A potential key to sustaining any kind of change? (L)
• Any improvement initiative cannot be undertaken in isolation and that
everyone needs to become involved. (Pe)
• The level of progress achieved appears to be commensurate with the level of
activity of the internal champions or change leaders, leading to a climate of
controlled sustainability rather than self sustainability (L)
D. Summary Findings from the Quantitative Survey Generic Data Quality
• There is a high appreciation of the influence that People, Processes and Data
have on the quality of data
• There is a realisation of the importance of having the data right first time (Pr)
• The level of positive responses compares very favourably with the previous
survey held amongst the data quality community
Remploy Data Quality
• The overall attitude towards measurement, reporting and feedback was very
positive (M)
• There was an appreciation of the importance of education and training (Pe)
• Almost 60% felt that ‘everyone’ has a responsibility to improve the quality of
their own and the organisation’s data (Pe)
• There was a huge disparity between the respondents’ perception of the
quality of the data they influence (82%) and that which they receive (26%)
(Pe)

160
• 90% of respondents identified measurement and reporting, problem
resolution and process improvement as key elements for improving data
quality (M/Pr)
E. Additional Outcomes Additional Outcomes
• The Data Accuracy KPIs and the Index is merely a barometer of the
effectiveness or otherwise of the related processes- not an end in itself. Any
improvement is predicated on the quality of this process and the degrees of
adherence of the related persons’ behaviour to follow theses processes
• There are two types of processes
o Operational processes- SOP/POP etc
o Quality processes- what we need to be done to improve data quality
ongoing
• Get the processes right and adhere to them, then the improvement in the
KPIs will fall out
• Identify the processes (operational and quality) that are required and then
change the behaviour (people) which needs to take place to ensure the
agreed processes are followed continually
• Creating an environment where quality data can be sustained is dependant
upon changing the way people behave to ensure they follow the most
effective and appropriate processes and policies to a given situation- process
change and people (behaviour) change
• Sustainability requires stability- NOT rigidity
• Identify changes required to embed a sustainable data quality culture
• From both the qualitative and quantitative studies
o Emphasise the positive practices (Pros)
o Review and take action on the issues and problems identified (Cons)
o Focus on the important cultural environment and ensure that it is
place

161
Analysis of Key Findings and Key Recurring Themes related to the Conceptual Framework Appendix 3
The key findings from the research detailed in Appendix 13 have been classified further into
the main headings of the conceptual framework below, alongside the key recurring themes
from the review of the quality literature shown in Table 2 on pages 50-52. This is an initial
general classification with no intent to compare the findings and themes. This comparison
takes place within Table 19 on pages 102-104, where similar related findings and themes
have been categorised into thirteen broad generic common headings ((1)-(13)) as indicated
below. There are a number of key findings without a comparable key theme and these are
indicated as (A) and detailed as Additional Key Findings in Table 20 on pages 105-106.
Cultural/Organisational Leadership: Key Findings Key Recurring Themes
• Explain the underlying reasons behind the
improvement programme and how it will
support the corporate objectives (2)
• Sell the concept up and down the
organisation (2)
• Executive and senior and middle
management sponsorship and involvement
(1)
• Have an Internal Champion who has the
respect of the audience (A)
• Cultivate an attitude and willingness to
embrace new ideas (2)
• A ‘Bottom-Up approach with ‘Top-Down’
support (A)
• What is measured, communicated, discussed
and agreed at all levels has a very good
chance of becoming embedded (A)
o Bottom-up supported by top-down
o A potential key to sustaining any kind
of change?
• The level of progress achieved appears to be
commensurate with the level of activity of the
internal champions or change leaders,
leading to a climate of controlled sustainability
rather than self sustainability (A)
• Executive and Management support and
sponsorship (1)
• Establish a clear vision with targets and
milestones (2)
• Importance of Leadership and Culture (2)
• Align the Organisation (2)
• Focus upon achievements (2)
• Celebrate successes (2)

162
Management
Key Findings Key Recurring Themes
• Identify ownership and responsibilities (5)
• The Businesses ‘own’ the data NOT IT- a
paradigm shift (5)
• Provide regular visible measures and report
progress (3)
• Identify how the ‘measures’ will influence the
quality of the data (4)
• Measurement of progress and the publication
of results (3)
• Tackle negative cultural issues (7)
• Build in system and structural changes to
prevent a return to type (4)
• Improve communications to share ideas (6)
• Continually measure, report and provide
feedback (3)
• Make the measurement and results visible (3)
• Focus on the ‘key’ elements setting objectives
and targets (4)
• Ensure that potential problem areas are
identified (8)
• Communicate across the business on a
regular basis (6)
• A need for ongoing support in all areas with
an internal ‘expert’ user community (A)
• Requirement for closer liaison between
functions (A)
• Potential ‘problem’ areas identified (8)
• Better understanding of the underlying
principles and requirements (2)
• Appreciation as to how the KPIs fit within the
corporate data and information quality initiative
(A)
• There is potential for real cultural change to
take place if improvement initiatives are
managed correctly. (4)
• The overall attitude towards measurement,
reporting and feedback was very positive (3)
• Improvement requires change which has to be
managed (4)
• A belief that change is worthwhile and
necessary (4)
• Manage the change (4)
• Identify risks, benefits and overall objectives (4)
• Plan and identify required actions (4)
• Measure, monitor with reporting and feedback to
support accountability (3)
• A continual on-going process (4)
• Accept that there will be set backs (7)
• Avoid undue pessimism, stay focussed and be
positive (7)
• Identify potential pitfalls (7)
• Manage any potential short term and long term
conflicts (4)
• Align the processes behind the people (13)
• Establish clear channels of communication (6)
• Manage the relationship between the way data
interacts between the processes and the people
(13)

163
• 90% of respondents identified measurement
and reporting, problem resolution and process
improvement as key elements for improving
data quality (A)
Processes Key Findings Key Recurring Themes
• Ascertain root causes of issues and problems
and resolve at source (8)
• Ensure that the appropriate processes and
procedures are in place- ‘one size does not
fill all’ (9)
• Ascertain root causes of issues and problems
(8)
• Identify the personnel dealing with each type
of order and agree who does what with
responsibilities for each process (13)
• There is a realisation of the importance of
having the data right first time (8)
• 90% of respondents identified measurement
and reporting, problem resolution and
process improvement as key elements for
improving data quality (A)
• Concept of People, Processes and Data (13)
• Best practices within the right environment (9)
• Continual process reinforcement (9)
• Elements of quality management principles in all
forms (4)
• Continual process improvements (9)
• Root cause analysis and error prevention (8)
• Concept of People, Processes and Data (13)
• Align the processes behind the people (13)
• Identify and document the process enablers (9)
People Key Findings Key Recurring Themes
• Take things slowly to ensure everyone is
onboard (A)
• Involve everyone, provide support (12)
• Ensure everyone is fully aware of the
implications of their actions (A)
• Build data quality targets into peoples’
objective and reward success (11)
• Obtain buy-in, ownership and belief (5)
• Involve everyone (12)
• Build targets into peoples’ objectives with a
reward mechanism (11)
• Importance of education, training and
development (10)
• Importance of ownership and responsibility (5)

164
• Motivational Factors (A)
o It is the ‘right’ thing to be doing, it
supports one’s principles
o Belief that it will improve efficiency, help
control and manage the factory and
department
o Competition between colleagues
o Peer and Manager pressure
o ‘League Table’ Syndrome
o Requirement to achieve
monthly/quarterly targets
o A distinct movement away from ‘I’m
going to be in trouble’ to ‘My life is
better for doing it this way’
• Involve everyone (12)
• Hold regular reviews with the ‘Team’ (12)
• Concept of People, Processes and Data (13)
• Training, education and development
requirements not being met fully (10)
• Need to ensure everyone is fully aware of the
implications of their actions (A)
• Build data quality targets into people’s
objectives (11)
• Any improvement initiative cannot be
undertaken in isolation and that everyone
needs to become involved (12)
• There was an appreciation of the importance
of education and training (10)
• Almost 60% felt that ‘everyone’ has a
responsibility to improve the quality of their
own and the organisation’s data (A)
• There was a huge disparity between the
respondents’ perception of the quality of the
data they influence (82%) and that which they
receive (26%) (A)
• Teamwork (12)
• Tendency for people to revert to type (4)
• Concept of People, Processes and Data (13)
• Align the processes behind the people (13)