docs.cpuc.ca.govdocs.cpuc.ca.gov/word_pdf/FINAL_DECISION/31449.doc · Web viewFurther, not all...
329
STATE OF CALIFORNIA GRAY DAVIS, Governor PUBLIC UTILITIES COMMISSION 505 VAN NESS AVENUE SAN FRANCISCO, CA 94102-3298 November 7, 2003 TO: ALL PARTIES OF RECORD IN ORDER INSTITUTING RULEMAKING 01- 09-001, AND INVESTIGATION 01-09-002 Decision 03-10-088 is being mailed without the written Concurrence of Commissioner Brown, and Commissioner Kennedy; written Dissent of Commissioner Lynch and Commissioner Wood. The Concurrence and Dissent letters will be mailed separately. Very truly yours, /s/ ANGELA K. MINKIN Angela K. Minkin, Chief Administrative Law Judge
Transcript of docs.cpuc.ca.govdocs.cpuc.ca.gov/word_pdf/FINAL_DECISION/31449.doc · Web viewFurther, not all...

STATE OF CALIFORNIA GRAY DAVIS, Governor
PUBLIC UTILITIES COMMISSION
505 VAN NESS AVENUE
SAN FRANCISCO, CA 94102-3298
November 7, 2003
TO: ALL PARTIES OF RECORD IN ORDER INSTITUTING RULEMAKING 01-09-001, AND INVESTIGATION 01-09-002
Decision 03-10-088 is being mailed without the written Concurrence of Commissioner Brown, and Commissioner Kennedy; written Dissent of Commissioner Lynch and Commissioner Wood. The Concurrence and Dissent letters will be mailed separately.
Very truly yours,
/s/ ANGELA K. MINKINAngela K. Minkin, ChiefAdministrative Law Judge
ANG:bb1
Attachment

R.01-09-001, I.01-09-002 COM/SK1/MP1/bb1
2
COM/SK1/MP1/bb1 MAILED 11/07/03
Decision 03-10-088 October 30, 2003
BEFORE THE PUBLIC UTILITIES COMMISSION OF THE STATE OF CALIFORNIA
Commission’s Own Motion to Assess and Revise the New Regulatory Framework for Pacific Bell and Verizon California Incorporated.
Rulemaking 01-09-001(Filed September 6, 2001)
Order Instituting Investigation on the Commission’s Own Motion to Assess and Revise the New Regulatory Framework for Pacific Bell and Verizon California Incorporated
Investigation 01-09-002(Filed September 6, 2001)
(See Appendix A For List of Appearances)
INTERIM OPINION REGARDING PHASE 2B ISSUESSERVICE QUALITY OF PACIFIC BELL AND
VERIZON CALIFORNIA, INC.
159381 - 1 -

R.01-09-001, I.01-09-002 COM/SK1/MP1/bb1
Table of Contents
Title.....................................................................................................................................................Page
INTERIM OPINION REGARDING PHASE 2B ISSUES............................................1SERVICE QUALITY OF PACIFIC BELL AND..............................................................1VERIZON CALIFORNIA, INC.........................................................................................1I. Summary........................................................................................................................2
A. Introduction: Major Finding and Scope of Study.........................................2B. Verizon Provides Very Good Service Quality.................................................3C. Pacific: Good Service Quality with Residential Service Weaknesses.....4D. Under NRF, Pacific’s Service Quality Has Improved Only for Business
Customers, while Residential Service Quality Shows No Major Trend; Verizon’s Business and Residential Service Quality Have Improved.....5
E. Other Information Consistent with Quantifiable Data................................8F. Areas for Improvement........................................................................................8
II. Scope of This Phase and Methodology..................................................................9III. California Measures of Service Quality and Standards.................................14
A. GO 133-B Measures, Standards, and Caveats.............................................141. Definition of “Primary Line” is Unclear...................................................162. Automated Response Units (ARU)............................................................163. Busy or Abandoned Calls Not Counted Under GO 133-B...................184. Commission Recognizes Need to Revise GO 133-B.............................18
B. Performance of Pacific and Verizon Against GO 133-B Measures........191. Held Primary Service Orders.....................................................................20
a) Position of the Parties...............................................................................................20b) Discussion: Measurement Problems, but Pacific and Verizon Show Improvements. 22
2. Installation-Line Energizing Commitments............................................26a) Position of the Parties...............................................................................................26Annual Data: Pacific and Verizon Met GO 133-B Standard for Honoring Installation
Commitments............................................................................................................27c) Monthly Data: Pacific and Verizon Met GO 133-B Standard for Honoring Installation
Commitments for ALL 144 Months Under NRF........................................................283. Customer Trouble Reports..........................................................................29
a) Position of the Parties...............................................................................................29b) Annual Data: Pacific and Verizon Met GO 133-B Standard for Incidence of Trouble
Reports......................................................................................................................31c) Monthly Data: Pacific and Verizon Met GO 133-B Standard for Incidence of Trouble
Reports for ALL 144 Months Under NRF..................................................................324. Toll Operator Answering Time...................................................................33
a) Position of the Parties...............................................................................................33b) Annual Data: Pacific and Verizon Met GO 133-B Standard for Operator Assistance
Answer Time..............................................................................................................34c) Monthly Data: Pacific Met Operator Assistance Answer Time Standard 107 of 108
Months; Verizon 140 of 144 Months.........................................................................365. Directory Assistance Operator Answering Time...................................37
a) Position of the Parties...............................................................................................37
- i -

R.01-09-001, I.01-09-002 COM/SK1/MP1/bb1
b) Annual Data: Pacific and Verizon Met GO 133-B Standards for Directory Assistance Answer Time..............................................................................................................38
c) Monthly Data: Pacific Met GO 133-B Standards for Directory Assistance Answer Time Every Month; Verizon in 106 of 108 Months....................................................396. Trouble Service Answering Time..............................................................41
a) Position of the Parties...............................................................................................41b) Annual Data: Pacific Has Met GO 133-B Standard for TRSAT Since 1999; Verizon
Since 1996.................................................................................................................42c) Monthly Data: Pacific Has Met GO 133-B Standard for TRSAT in 92 of 132 Months;
Verizon in 104 of 132 Months ..................................................................................457. Business Office Answering Time (BOAT)................................................46
a) Position of the Parties...............................................................................................46b) Annual Data: Pacific Has Met BOAT Standard Since 1997; Verizon Since 1998......48c) Monthly Data: Pacific Has Met BOAT Standard for 67of 109 months; Verizon 80 of
109............................................................................................................................52C. Summary of Empirical Assessment of Pacific’s and Verizon’s
Performance on GO 133-B Measures.............................................................52IV. Federal Measures of Service Quality – ARMIS and MCOT Data.................55
A. ARMIS Measures.................................................................................................55B. Accuracy of Data..................................................................................................56
1. General Issues with Pacific’s Data............................................................562. Pacific’s Data Concerning Installation Orders Require Clarification
593. Allegation that Pacific’s Reports Contain Erroneous Duplicate
Records Has No Factual Basis..................................................................604. Allegation that Pacific’s Reports Contain Erroneous “Anomalous
Records” Has No Factual Basis................................................................615. Verizon’s Data Are Accurate.......................................................................61
C. Summary Table of ARMIS 43-05 Measures.................................................621. The Number of Initial Trouble Reports per 100 Lines: Pacific -
Residential and Business Significantly Better than Reference Group, Business Significantly Improving Trend but No Trend for Residential; Verizon - Business and Residential Significantly Better than Reference Group and Trends Improving Significantly.............69
2. The Number of Repeat Trouble Reports per 100 Lines : Pacific - Residential and Business Significantly Better Than Reference Group, Business Significantly Improving Trend but No Significant Trend for Residential; Verizon - Residential and Business Significantly Better Than Reference Group, Trends for Both Improving Significantly...............................................................................72
3. The Number of Initial Out-of-Service Trouble Reports per 100 Lines: Pacific - Residential and Business Significantly Better Than Reference Group and No Significant Trend for Either; Verizon - Residential and Business Significantly Better Than Reference Group, Business Trend Improving Significantly, No Significant Trend for Residential...................................................................................75
ii

R.01-09-001, I.01-09-002 COM/SK1/MP1/bb1
4. The Number of Repeat Out-of-Service Trouble Reports per 100 Lines: Pacific - Residential and Business Significantly Better Than Reference Group, Business Trend Improving Significantly and No Significant Trend for Residential; Verizon - Residential and Business Significantly Better Than Reference Group and No Significant Trend for Either.......................................................................79
5. The Number of Subsequent Initial Trouble Reports and Subsequent Repeat Trouble Reports: Insufficient Observations............................81
6. The Number of Initial All Other Trouble Reports per 100 Lines: Pacific - Residential and Business Significantly Better Than Reference Group, Business Trend Improving Significantly, but Residential Trend Worsening Verizon - Residential Significantly Better Than Reference Group, Business Indistinguishable From Reference Group, Business Trend Improving Significantly but No Significant Trend for Residential.............................................................82
7. The Number of Repeat All Other Trouble Reports per 100 Lines: Pacific - Residential and Business Significantly Better Than Reference Group, Business Trend Improving Significantly, but Residential Worsening; Verizon - Residential Significantly Better Than Reference Group but Business Indistinguishable From Reference Group, Business Trend Improving Significantly but No Significant Trend for Residential.............................................................85
8. Initial Out of Service Repair Interval (in hours): Pacific - Residential Significantly Below Reference Group and Business Indistinguishable From Reference Group, No Significant Trends for Either; Verizon - Residential and Business Significantly Better Than Reference Group, No Significant Trends for Either................87
9. Repeat out-of-service repair interval (in hours): Pacific - Residential Significantly Worse Than Reference Group, Business Indistinguishable From Reference Group, No Significant Trend for Either; Verizon Residential and Business Significantly Better Than Reference Group, No Significant Trend for Either............................92
10. Initial all other repair interval (in hours): Pacific - Residential Significantly Worse Than Reference Group but No Significant Trend, Business Indistinguishable From Reference Group but Significant Improving Trend; Verizon Residential and Business Better Than Reference Group, but Significant Worsening Trend for Residential and No Significant Trend for Business....................95
11. Repeat All Other Repair Interval (in hours): Pacific - Residential Significantly Worse Than Reference Group, Business Indistinguishable From Reference Group, No Significant Trend for Either; Verizon - Residential and Business Better Than Reference Group, Significant Worsening Trend for Residential but No Significant Trend for Business..................................................................98
iii

R.01-09-001, I.01-09-002 COM/SK1/MP1/bb1
12. Average Installation Interval: Pacific and Verizon Indistinguishable From Reference Group and No Significant Trends..........................101
13. Switch Downtime: Pacific - Significantly Better Than Reference Group with No Significant Trend; Verizon - Statistically Indistinguishable From Reference Group with Significant Worsening Trend........................................................................................106
14. Switches Down per Switch......................................................................10715. Number of Switch “Occurrences”: Pacific - “Under Two Minutes”
Trend Improving, No Significant Trend for “Over Two Minutes” or “Percent Unscheduled”; Verizon - “Under Two Minutes” Trend Improving, But “Percent Unscheduled” Trend Worsening.............108
16. Installation Commitments Met: Pacific - Residential Performance Indistinguishable From Reference Group and No Distinguishable Trend, Business Significantly Better Than Reference Group But Trend Worsening; Verizon - Residential and Business Performance Indistinguishable From Reference Group with No Significant Trends 109
D. Summary of Empirical Assessment of Pacific’s and Verizon’s Performance on ARMIS 43-05 Measures....................................................111
E. MCOT Data..........................................................................................................1171. MCOT Data – Pacific Shows No Service Diminishment Following
the Ameritech Merger...............................................................................1172. MCOT Data – Verizon California (GTE) Shows No Diminishment of
Service Quality Following Merger.........................................................121V. Survey Data and Customer Satisfaction...........................................................125
A. Customer Satisfaction and Service Quality Surveys – Pacific..............1251. ORA Survey....................................................................................................1252. Pacific’s Surveys...........................................................................................130
a) J.D. Power Survey – Pacific......................................................................................130b) IDC Survey – Pacific................................................................................................131c) Other Customer Surveys – Pacific...........................................................................133
B. Customer Satisfaction and Service Quality Surveys – Verizon............1411. ORA Survey....................................................................................................1412. Verizon’s Surveys.........................................................................................141
VI. Other Direct Measures of Service Quality.......................................................142A. Informal Complaints: Pacific Low Incidence.............................................143B. Informal Complaints: Verizon Very Low Incidence.................................148C. Formal Complaints – Pacific...........................................................................152D. Formal Complaints – Verizon.........................................................................158
VII.Other Issues In This Proceeding.........................................................................159A. Allegation by TURN that Pacific Inappropriately Aggregated Data
Lacks Merit ………………………………………………………………………….160
B. Technological Change and Affects on Pacific’s Service Quality – None Documented........................................................................................................160
C. Growth – Pacific.................................................................................................163
iv

R.01-09-001, I.01-09-002 COM/SK1/MP1/bb1
D. Staffing – Pacific................................................................................................163E. Weather – Pacific...............................................................................................165F. Marketing – Pacific............................................................................................168G. Still Other Issues – Pacific...............................................................................168H. Movement of Functions to Unregulated Affiliates – Verizon................169I. Service Performance Guarantee - Verizon.................................................171J. Technological Change – Verizon...................................................................172K. Growth – Verizon...............................................................................................172L. Staffing – Verizon...............................................................................................172M. Weather – Verizon.............................................................................................173N. Marketing – Verizon..........................................................................................173O. Mergers and Structural Changes – Verizon...............................................174
VIII. NRF Incentives, Service Quality, and Competition.................................174A. NRF Incentives and Service Quality, Positions of Parties.....................174B. Discussion: Incentives to Improve Service Quality Under NRF and
Under Cost-of Service Regulation................................................................177C. Effect of Competition on Service Quality – Positions of Parties...........180D. Competition and Service Quality - Discussion..........................................181
IX. Comments on Proposed Decision.......................................................................183X. Setting Aside Submission for Acceptance of New Information into Record of Proceeding...................................................................................................................193XI. Assignment of Proceeding....................................................................................197Findings of Fact..............................................................................................................197CONCLUSION OF LAW................................................................................................238ORDER...............................................................................................................................240
APPENDIX A
v

R.01-09-001, I.01-09-002 COM/SK1/MP1/bb1
I. Summary
A. Introduction: Major Finding and Scope of StudyThis proceeding has conducted a comprehensive investigation
into the quality of telecommunications service offered to Californians by Verizon and Pacific under the New Regulatory Framework (NRF) mode of incentive regulation. We found that Verizon offers very good service quality. We found that Pacific offers generally good service quality in most areas, but there are several important areas of weakness in the quality of specific residential services.
This investigation assessed the performance of Verizon and Pacific in meeting the six California-adopted performance standards contained in General Order (GO) 133-B. In addition, we used standard statistical methods to analyze the trends in service quality for Verizon and Pacific under NRF regulation. The investigation also examined Federal service quality data. Since there are no standards adopted by the Federal Communications Commission (FCC) for these service quality measures, we compared the performance of each company against reference group of the ten largest national utilities (excluding Pacific but including Verizon-California). As with the California data, we also used statistical methods to determine the trends in service quality over the NRF period. In addition, the investigation reviewed survey data, regulatory proceedings, and informal complaint data to supplement the picture developed through our data analysis.
We note that there are limitations with each of the various measures of service quality that we examine in this decision. We therefore base the conclusions that we reach regarding service quality on the totality of information provided in the record.
2

R.01-09-001, I.01-09-002 COM/SK1/MP1/bb1
B. Verizon Provides Very Good Service QualityThe investigation found that Verizon offers very good service
quality. On the GO 133-B service quality measures, Verizon substantially complied with four of the six service quality standards adopted by this Commission for all years covered in our study.1 For the 576 monthly instances for which we have data on these four standards, Verizon met the standard 570 times. On the remaining two measures, Verizon compiled a record of substantial compliance. For the 241 monthly instances for which we have data on these measures, Verizon met the standard in 184 months, or 76% of the time. In addition, when evaluated on the Federal Communications Commission’s (FCC) Automated Reporting Management Information System (ARMIS) service quality measures, we find that Verizon exceeded the performance of a reference group on eight measures for both residential and business lines, and on two measures for residential lines only. Verizon has statistically indistinguishable performance on two measures for both residential and business lines and on two measures for business lines, and one measure for the residential/business lines. Based on our statistical analysis, Verizon does not fail to meet the performance of the reference group on any measure – this in itself is exceptional.2 Thus, on all significant Federal measures of service quality, Verizon meets or exceeds the performance of the reference group of large utilities.
1 We examine the years 1993 through 2001 for all GO 133-B measures. Where data exists, we examine 1990-20012 We note, however, that for Verizon’s performance on “business initial all other trouble reports” measure, Verizon’s raw numbers exceed those of the reference group, although they are statistically indistinguishable, as discussed below.
3

R.01-09-001, I.01-09-002 COM/SK1/MP1/bb1
C. Pacific: Good Service Quality with Residential Service Weaknesses
For Pacific, we find a general picture of good service quality with a few areas of weak service regarding residential services. On the GO 133-B service quality measures, Pacific substantially complied with four of the six service quality standards adopted by this Commission for all years covered in our study.3 When we examine monthly measures, we find that in 504 monthly instances for which we have measures, Pacific met the standard 503 times. For the remaining two measures, we find that in the 241 monthly instances for which we have measures, Pacific met the standard 159 times (66%). In addition, when evaluated on the FCC’s ARMIS service quality measures, we find that Pacific exceeds the performance of a reference group on six measures for both residential and business lines, and on one measure for business lines, one measure for the residential/business lines. Pacific has statistically indistinguishable performance on two measures for residential lines, and on five measures for business lines only. Pacific fails to meet the performance of the reference group on four measures for residential lines.
As these data suggest, Pacific has several areas of service weakness specific to residential services. Compared to the national reference group, Pacific has far fewer incidences of service trouble or outages, but once this occurs, Pacific is slower to resolve the trouble. Pacific is also slow to answer customer-billing queries, a service quality indicator not systematically measured and for which there is no current GO 133-B standard.
3 We examine the years 1993 through 2001 for all GO 133-B measures. Where data exists, we examine 1990-2001.
4

R.01-09-001, I.01-09-002 COM/SK1/MP1/bb1
D. Under NRF, Pacific’s Service Quality Has Improved Only for Business Customers, while Residential Service Quality Shows No Major Trend; Verizon’s Business and Residential Service Quality Have Improved
As noted above, both California utilities have performed well in meeting California-adopted service standards and have generally met or exceeded the performance of a reference group of large utilities. In addition to measuring the level of service for each company as noted above, we statistically examined how service changed during the years for which data is available during the period of NRF regulation. In particular, we sought to determine where service quality had improved and/or declined during NRF, and to determine whether NRF regulation was correlated with declines in service quality.
Concerning the effect of NRF regulation on service quality, we find that in general, service quality has improved during the NRF years. To reach this conclusion, we reviewed 7 GO 133-B measures and 17 ARMIS measures for Pacific and 16 for Verizon in this study to determine whether they showed a statistically significant increase or decline in service quality. Twelve of the ARMIS measures were examined separately for residential and business lines. This yields a total of 36 variables that we examined for Pacific and 35 for Verizon to determine if there were statistically significant trends in service quality over the NRF years. We examined these variables for each company.
Of the 36 variables for service quality reviewed in this study, Pacific showed statistically significant improvement on 6 of these business variables and one combined business/residential measure during the NRF period; it showed no statistically significant change on
5

R.01-09-001, I.01-09-002 COM/SK1/MP1/bb1
24 of them (including 5 of the 7 GO 133-B measures); it showed statistically significant declines on 2 of the residential measures and one business measure; and on two measures we could not make a finding. Thus, for Pacific, more variables showed improvement than showed decline during the NRF period, while most showed no significant change. Moreover, although 24 of the measures showed no statistically significant change, each of the four “residential repair interval” measures exhibited a curvilinear trend.4 Pacific exceeded the performance of the Federal reference group on 14 measures, had statistically indistinguishable performance on 7 measures, and failed to meet the reference group standard on 4 (residential) measures.
Verizon showed statistically significant improvement on 12 measures during the NRF period; it showed no statistically significant change on 19, and it showed statistically significant declines on 4 of the measures. Once again, despite performance that was either statistically indistinguishable or better than that of the Federal reference group on all measures , more variables showed improvement than showed decline. Switch downtime, however, skyrocketed, and is not explained. Finally, we note that Verizon’s business and residential installation intervals showed a pattern of curvilinear data.
Our examination of specific measures showed that sometimes one company showed a pattern of improvement, while the other company showed a pattern of decline.
Verizon’s measures in total outperformed Pacific. When statistical significance is assessed, Verizon outperformed Pacific in 13
4 Data worsened by a factor of nearly 2, followed by a nearly equivalent improvement.
6

R.01-09-001, I.01-09-002 COM/SK1/MP1/bb1
of 25 ARMIS measures, while Pacific outperformed Verizon in 3. Verizon performed better on ORA’s customer service survey than Pacific. Similarly, regarding complaint data filed with the Commission, Verizon’s numbers are proportionately lower than Pacific’s.
Moreover, we find that under NRF, financial incentives concerning service quality are somewhat different than those in place under cost-of-service regulation. In either case, the regulated utility is encouraged to reduce costs to become more efficient, albeit under rate case regulation, cost savings are realized only between rate case periods while under NRF they continue. On the other hand, NRF regulation, in combination with advances in the availability of data and statistical software, has led to more systematic investigations of service quality by this Commission and the FCC.
These outcomes – overall high service quality, more improvements than declines in service quality, greater improvement in business service quality than residential for Pacific, and disparate patterns of performance across companies – are not possible to reconcile with the proposition that NRF caused a systematic decline in service. The pattern of facts that we have established leads us to conclude that NRF did not cause a diminishment of service quality.
Although the facts demonstrate that under NRF, service quality was good and improving, we cannot include that NRF caused an improvement of service quality. In particular, the statistical methods and the available data do not permit us to determine if NRF caused an improvement in service quality.
We expect the parties to present recommendations in Phase 3B of this proceeding concerning how to build on the record of good
7

R.01-09-001, I.01-09-002 COM/SK1/MP1/bb1
service quality produced under NRF and to improve on those areas of weakness in service quality identified.
E. Other Information Consistent with Quantifiable DataAs part of our investigation, we also reviewed survey data,
informal complaint data, and formal Commission investigations of Pacific and Verizon. This information, which is more difficult to interpret quantitatively, presents a qualitative picture that supplements our statistical assessment. Customers are generally pleased with service quality, and the Commission has aggressively pursued lapses in service quality or marketing standards. Though such formal enforcement proceedings have been necessary to correct problems, such proceedings have not been resolved in a timely manner, usually several years after the time of the offense. We will pursue in Phase 3B whether specific changes to NRF’s incentive mechanism and monitoring program are necessary to promote service quality.
F. Areas for ImprovementAs with any investigation, we find areas for improvement. In
particular, we have identified areas of service where utilities can and should improve both their performance and their measurements of performance. In addition, we have identified several areas where regulation requires clarification and better measures of service quality. We note that Rulemaking (R.) 02-12-004 was opened to adopt revisions in GO 133-B and that is the appropriate forum for modifying these standards. Nevertheless, we are confident that the findings of our current investigation show where variables need clarification, where measurement is lacking, where standards may be necessary,
8

R.01-09-001, I.01-09-002 COM/SK1/MP1/bb1
and where no change is warranted. These findings should prove helpful to R.02-12-004.
II. Scope of This Phase and MethodologyThe Order Instituting Rulemaking (OIR) for this proceeding calls
for us to examine the service quality results for Pacific and Verizon in Phase 2B, and consider regulatory changes – including alteration of the NRF framework to account for any problems we find – in Phase 35:
In Phase 2 of this proceeding, the Commission will assess how service quality has fared under NRF. This assessment will focus on the quality of service provided to end-users by Pacific and Verizon. Issues that are beyond the scope of this proceeding include the following: (1) the quality of service provided by Pacific and Verizon to other carriers; (2) requests for relief that are better addressed in complaint proceedings or enforcement OIIs; and (3) issues regarding universal service.
. . .
In Phase 3, the Commission will consider whether and how NRF should be revised to achieve the Commission’s goal of high-quality service. Parties will have an opportunity in Phase 3 to recommend specific revisions to NRF that should be considered by the Commission in light of the record developed in Phase 2 regarding how service quality has fared under NRF. There will not be an opportunity in Phase 3 to litigate issues of fact
5 In a September 2002 ruling, the Assigned Commissioner divided this proceeding into two sub-phases. Assigned Commissioner’s Ruling Revising the Schedule and Clarifying the Scope of Phase 3, dated Sept. 23, 2002. Phase 3B will deal with any changes to NRF necessitated by the service quality findings we make here. Parties should interpret any reference to Phase 3 or 3B in this decision to include any new phase the Commission designates for consideration of remedies for the service quality results we find here.
9

R.01-09-001, I.01-09-002 COM/SK1/MP1/bb1
regarding service quality. All litigation of factual issues pertaining to service quality must occur in Phase 2.6
. . .
Parties may also offer recommendations in Phase 3 regarding how NRF should be revised to promote the availability of high quality services, such as a system of financial carrots and sticks tied to measurements of service quality.
Therefore, in this decision, we make factual findings regarding the service quality performance of Pacific and Verizon over the NRF period (January 1, 1990 to the present), but do not propose regulatory changes at this juncture. Because the NRF period is lengthy, we do not simply focus here on the carriers’ most recent performance. Rather, we examine their performance over the entire NRF period, and where we find evidence of problems with the service quality of either company at any time during that period, we identify the problem. In some cases, the most recent data may indicate that quality is improving, and if that is the case we point it out. By the same token, if the positive trend is of short duration, and past problems endured over a significant period of time, we point this out as well. We make every effort to distinguish statistically significant trends from changes in performance that are artifacts of the graphical scales used to illustrate our data or changes that are best understood as random variation.
Concerning the task of assessing the service quality of Pacific and Verizon, as well as the effects of NRF, we face some methodological obstacles. First, we have little service quality data
6 Rulemaking (R.) 01-09-001, 2001 Cal. PUC LEXIS 842, Appendix A.
10

R.01-09-001, I.01-09-002 COM/SK1/MP1/bb1
from the period preceding the adoption of NRF. Thus, it is not possible to compare the quality under NRF with the service quality preceding the adoption of NRF. Second, we find that the data included in service quality measures changed over time, sometimes because of a change in corporate organization, sometimes because of a change in technology, and sometimes because of a change in the mixture of services sold. Thus, even when a service measure remained stable over time, the activities measured may have changed dramatically. Third, different companies have interpreted a measure differently. Thus, it is difficult to compare the performance of one company with another. Fourth, during the period under study, virtually every regulatory jurisdiction adopted some version of price cap regulation. Moreover, the data introduced into this proceeding concerning a reference group of firms did not distinguish which companies were under price cap regulation and which were under rate of return regulation. Thus, it is not possible to compare the service quality of companies under price cap regulation with the service quality of those under rate of return regulation.
To answer our questions concerning the level of service quality and the effect of the change to price cap regulation, our investigation uses a variety of different measures and methods for assessing service quality. Each methodology has both advantages and disadvantages. Moreover, no single methodology provides a definitive answer.
In order to assess the service quality of Pacific and Verizon, we examine the direct measures of the provision of certain services. In particular, our GO 133-B defines specific measures associated with the quality of telecommunications services and sets standards for all but one. For Pacific and Verizon, we compare their performance
11
R.01-09-001, I.01-09-002 COM/SK1/MP1/bb1
against each standard and determine whether there are statistically significant trends in service quality over the measurement period. Similarly, using FCC’s ARMIS measures, we compare the performance of Pacific and Verizon against a reference set of utilities and against each other. In addition, we also assess the performance of Pacific and Verizon on Merger Compliance Oversight Team (MCOT) measures, also adopted by the FCC. Although we will discuss the strengths and weaknesses of each of these measures in the discussion sections below, it is important to remember that these are measures of utility performance, not measures of overall “service quality.” Moreover, and most importantly, we do not know to what extent consumers view these attributes as constitutive of service quality. Indeed, it is possible that consumers will view “missed appointments” by the telephone company as a more serious flaw in service quality than waiting on the phone for a customer service employee to answer. Further, not all aspects of service quality are captured in the GO 133-B and ARMIS measures. For example, how well customer problems are resolved or the accuracy of telephone billings is addressed in the ORA customer satisfaction survey and in the ARMIS customer satisfaction survey and informal complaint statistics.
To address the larger issue of how customers view the quality of service offered by Pacific and Verizon, we rely on survey data that directly ask customers their view of service quality. The record in this proceeding includes several surveys of customer satisfaction with each utility. In particular, the record includes a survey conducted by ORA addressing the quality of service for both Pacific and Verizon.
Pacific has presented the results of a survey it conducts as part of its ARMIS filings made to the FCC, known as ARMIS 43-06 and as
12

R.01-09-001, I.01-09-002 COM/SK1/MP1/bb1
part of the monitoring reports it files with this Commission (PA 02-04). In addition, Pacific presented the results of two surveys conducted by external firms, one by IDC and the other by JD Power.
Verizon also presents its ARMIS 43-06 survey. In addition, Verizon notes that it surveys its California customers by conducting over 1,000 interviews per month covering Directory Assistance, Consumer and Business Provisioning (which covers installation of new service), Consumer and Business Repair (which covers diagnosis, repair, and restoration of existing service), and Consumer and Business Request and Inquiry (which covers requests and inquires directed to the Business Office regarding customer bills, products and services, prices, and company policies).7
In general, each survey has particular strengths and weaknesses. Moreover, since customers only infrequently interact with a telephone utility, general surveys can provide a measure of service quality that lags behind current conditions. Other surveys, which sample customers that have recently interacted with the utility, provide other measures of service quality. In our analysis below, we will assess the value of the evidence provided by each survey and use it to inform our overall assessment of service quality.
Finally, although the average experience that a customer has with a phone company offers an important factor in our assessment of service quality, we also are concerned with the quality of service provided to customers when things go wrong. To aid in our assessment, we also examine the data accumulated by the Commission’s consumer service concerning complaints lodged by customers concerning the utility’s service. In addition, we also
7 Verizon Opening/Service Quality at 51-52.
13

R.01-09-001, I.01-09-002 COM/SK1/MP1/bb1
examine the recent record of formal legal complaints adjudicated by the Commission for each utility during the period covered by NRF.
III. California Measures of Service Quality and Standards
A. GO 133-B Measures, Standards, and CaveatsThe Commission adopted GO 133-B to establish uniform standards
of service for all telephone utilities providing service in California. Pursuant to GO 133-B all telephone utilities are required to compile monthly data. Pursuant to the NRF monitoring decision, utilities must submit quarterly reports on the following service quality measures8:
Table 1: GO 133-B Measures and Standards
Service Measure Description Standard
8 Two of the measures required by GO 133-B, dial service and dial tone speed were discontinued and will not be addressed here.
14

R.01-09-001, I.01-09-002 COM/SK1/MP1/bb1
1. Held Primary Service Orders
2. Installation-Line Energizing Commitments
3. Customer Trouble Reports
4. Toll Operator Answering Time (OA)
5.Directory Assistance Operator Answering Time (DA)
6. Trouble Report Service Answering Time (TRSAT)
7. Business Office Answering Time (BOAT)
Requests for primary telephone service delayed over 30 days due to lack of telephone utility plant
Requests for establishment or changes in non-key telephone individual and party-line service that normally involve plant activity
Initial reports from customers and users of telephone service relating to dissatisfaction with telephone company-provided equipment and/or service
The percentage of toll and assistance calls answered within 10 seconds
The percentage of directory assistance calls answered within 12 seconds
The percentage of trouble report calls answered within 20 seconds
The percentage of business office calls answered within 20 seconds
No standard established
95% commitments met
6 reports per 100 lines for units with 3,000 or more lines8 reports per 100 lines for units with 1,001-2,999 lines10 reports per 100 lines for units with 1,000 or fewer lines
85%
85%
80%
80%
15

R.01-09-001, I.01-09-002 COM/SK1/MP1/bb1
There have been many criticisms throughout this proceeding of ambiguities and omissions of GO 133-B pertaining to issues such as the definition of “primary line”, use of automated response units, and the count of busy or abandoned calls. We describe and discuss the most significant.
1. Definition of “Primary Line” is UnclearThere is disagreement about what GO 133-B means when it
requires carriers to report held “primary” service orders. ORA contended the term “primary” means, essentially, that Pacific and Verizon must report data about all basic exchange service lines to a household, regardless of the number of lines at issue. Pacific contended that “primary” refers only to the first line in the house, and not additional lines. Although we believe that ORA’s arguments are most persuasive, we find ourselves left with the data in their current state. We note that we have opened a general rulemaking on service quality that will review our GO 133-B measures.9 It is clear that this rulemaking will offer the best forum for resolving this issue.
2. Automated Response Units (ARU) Another general criticism of the GO 133-B reporting is that GO
133-B fails to address the use of Automated Response Units (ARUs). Indeed, neither Pacific10 nor Verizon report or track11 the time a
9 R.02-12-004, filed Dec. 5, 2002, available at http://www.cpuc.ca.gov/published/final_decision/21982.htm (Service Quality OIR).10 23 RT 2973:11-17 (Resnick for Pacific). In this decision, RT refers to the hearing transcripts. Thus, 23 RT 2973:11-17 refers to Volume 23 of the transcript, at page 2973, lines 11-17. 11 23 RT 2974:17-23 (Resnick for Pacific; not aware that Pacific can measure how long customers wait in the ARU queue).
16
R.01-09-001, I.01-09-002 COM/SK1/MP1/bb1
customer spends navigating the companies’ ARUs before reaching a live operator. This omission complicates interpreting the carriers’ response times in their Business Office Answer Time (BOAT) reports and in connection with their reported Trouble Report Service Answer Time (TRSAT) reporting.
The time a customer spends in “voice mail jail,” as some refer to it, may well be as long or longer than the time the customer spends talking to a live operator or service representative. Indeed, since our answer time standards under GO 133-B require “operators,” “service attendants” and “business office representatives” to answer calls within mere seconds, it is probable that callers spend more time navigating voice mail menus than during their prescribed seconds-long wait for a company representative.
We find that the evidence in this proceeding substantiates this assumption, at least as to Pacific’s residence customers. Pacific stated that the time its residence customers spend in its ARU system ranges from a low of 50 seconds to a high of 300 seconds – that is, from a range of almost 1 minute to 5 minutes.12 After that, Pacific places customers in a waiting queue for another 35 seconds on average before reaching a live operator.13
GO 133-B’s failure to address the use of ARUs reflects changes in technology since the Commission adopted the standard, and this technology gap should be closed.14 Thus, the use of ARUs will likely
12 Exh. 2B:139 at 8 n.12 (Piiru Opening Testimony, citing Pacific response to TD data request 02-01-01-1-I (iii). Verizon responded in discovery that it does not track this information “on a regular basis.” Id. at 7, n.11. 13 Id. at 7 & n.12.14 Although Pacific asserts it has used ARUs since 1990, it provided no evidence that the Commission was aware of its practice or considered the
17

R.01-09-001, I.01-09-002 COM/SK1/MP1/bb1
require a modification of GO 133-B, for without this measure we do not have an accurate picture of the service provided to customers.
3. Busy or Abandoned Calls Not Counted Under GO 133-BGO 133-B does not track busy or abandoned calls. TURN argued
that a large percentage of either could indicate poor customer service. While some FCC requirements cover these calls, they only do so as part of the time-limited merger monitoring reports we discuss later in this decision. Once again, GO 133-B’s failure to require tracking busy and abandoned calls may cause us to miss an important element of customer dissatisfaction.
4. Commission Recognizes Need to Revise GO 133-B We recently instituted a rulemaking to examine GO 133-B in its
entirety as it applies to all carriers.15 That rulemaking will consider what changes to existing GO 133-B measures and standards are appropriate. The Commission may use the record of this proceeding to assist it in making its decisions regarding how to revise GO 133-B. However, where it is clear that Pacific or Verizon are not properly interpreting the requirements of GO 133-B, this decision will identify such misinterpretations and order conforming changes.
Based on the evidence in this proceeding, it is very clear that GO 133-B should be amended. Because a change to GO 133-B would affect other carriers besides Pacific and Verizon, this change would appropriately occur outside this proceeding, and is best addressed in our Service Quality OIR (R.02-12-004).
use of ARUs at the time BOAT and TRSAT measures were adopted in 1992.15 R.02-12-004, filed Dec. 5, 2002, available at http://www.cpuc.ca.gov/published/final_decision/21982.htm (Service Quality OIR).
18

R.01-09-001, I.01-09-002 COM/SK1/MP1/bb1
In addition, the evidence in this proceeding establishes that data collected under the Order are not always identical among carriers or from year to year for each service quality measure due to the composition of the data underlying the reported service quality results. We acknowledge the limitations of using such data. However, until uniform standards for data collection are established, we have to draw our conclusions based on the existing data.
B. Performance of Pacific and Verizon Against GO 133-B MeasuresAs noted above, the GO 133-B measures and standards are the
principal service quality measures used by this Commission to promote the quality of landline telephone service in California. For this reason, we begin our assessment by examining the performance of Pacific and Verizon against our standards and over time.
1. Held Primary Service Orders
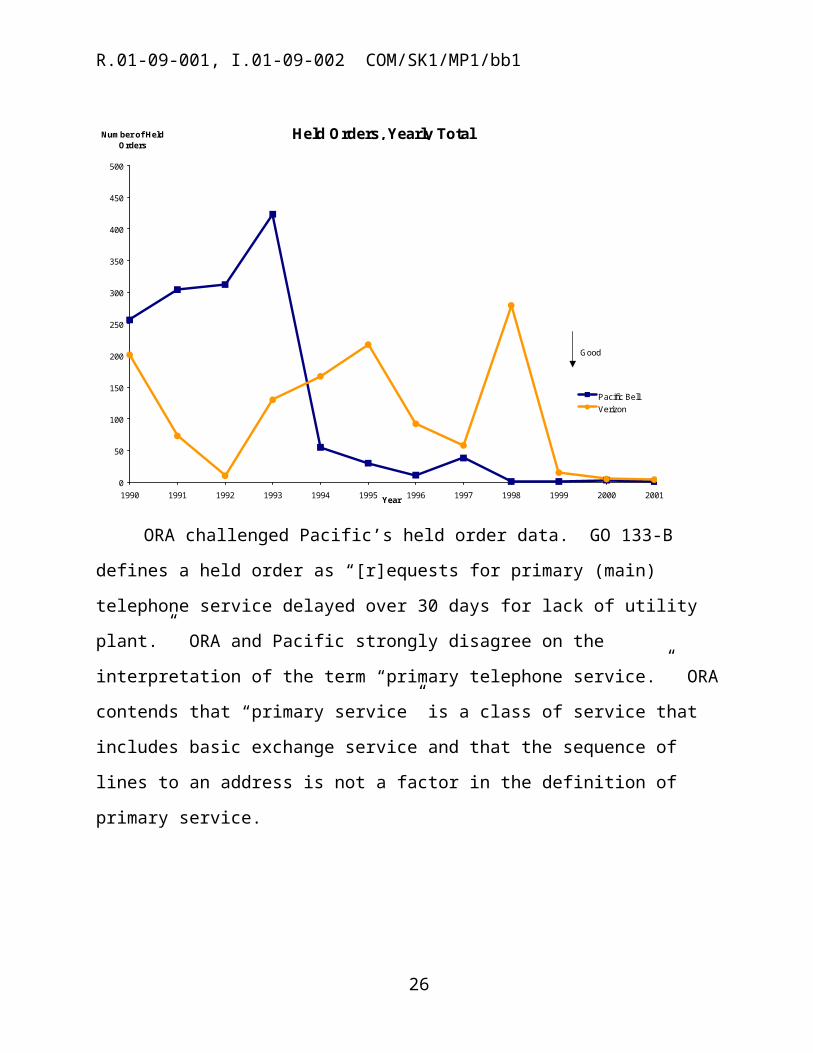
a) Position of the PartiesPacific reported that its held primary service order count has
significantly improved since early 1990s. Pacific’s witness Dr. Hauser stated that Pacific had no held orders from January to March 2002 and just a single held order in 2001.16
The chart below demonstrates Pacific’s performance over the period 1990 through 2001.17
16 Exh. 2B:354 at 14:15-16 (Hauser Direct Testimony).17 Id., Attachment 10.
19

R.01-09-001, I.01-09-002 COM/SK1/MP1/bb1
ORA challenged Pacific’s held order data. GO 133-B defines a held order as “[r]equests for primary (main) telephone service delayed over 30 days for lack of utility plant.” ORA and Pacific strongly disagree on the interpretation of the term “primary telephone service.” ORA contends that “primary service” is a class of service that includes basic exchange service and that the sequence of lines to an address is not a factor in the definition of primary service.
Pacific defines “primary service” as the first line into a home. ORA claims that Pacific is erroneously relying - out of context - on a definition contained in our rules for the California High Cost Fund-B (CHCF-B), which define a “primary line” in this manner: “Primary Line: For the purposes of the CHCF-B, ‘primary line’ is the first line
20
0
50
100
150
200
250
300
350
400
450
500
1990 1991 1992 1993 1994 1995 1996 1997 1998 1999 2000 2001
Pacific BellVerizon
Held Orders, Yearly Total
Good
Year
Number of Held Orders

R.01-09-001, I.01-09-002 COM/SK1/MP1/bb1
to [a] household.”18 This difference in interpretation clearly affects Pacific’s reporting of held orders. If, as ORA contends, Pacific is supposed to be counting all lines into the home as long as they deliver “basic exchange service,” then its held order figures could be higher than Pacific reports.
Verizon, in contrast to Pacific, defines “primary line” as any basic service line into a house or business. Verizon reported that “the number of primary service orders exceeding 30 days has shown improvement, with annual totals in single digits for the years 2000 and 2001, with only 5 and 4 orders respectively exceeding the GO 133-B threshold. The annual average for the years 1993 through 1998 was 155 held orders.”19
TURN “took no position on the content of the GO 133-B installation reporting of Pacific and Verizon.”20
b) Discussion: Measurement Problems for Pacific but Verizon Shows Improvement
We agree with Pacific that GO 133-B is ambiguous on the definition of “primary line.” Although we prefer ORA’s definition on a going forward basis, for this proceeding Pacific’s interpretation is acceptable. We therefore do not take action against Pacific at this time. We further note, however, that our Service Quality OIR is taking a close look at GO 133-B and intends to consider this definitional issue in that forum.
18 ORA Reply/Service Quality at 8, citing Pacific’s Tariff, Schedule Cal. P.U.C. No. A2. Network and Exchange Services: A2. General Regulations 2.1.1 Rule No. 1 - DEFINITION OF TERMS.19 Exh. 2B:214 at 30:7-12 (Thoms Direct Testimony).20 TURN Opening/Service Quality at 16.
21

R.01-09-001, I.01-09-002 COM/SK1/MP1/bb1
The Commission has not set any standards for the held order count and the data reported by Pacific has shown an improving trend for this measure. However, the parties have expressed concerns regarding Pacific’s data gathering methodology. GO 133-B requires that carriers report orders that are held – that is, remain pending – for more than 30 days beyond the commitment date (“held orders”).21 According to its testimony, Pacific counts such orders once a month. This creates a result that is inconsistent with GO 133-B’s intent that any order older than 30 days be reported to the Commission.
When Pacific’s witness Mr. Resnick explained Pacific’s practice, it became clear that Pacific does not capture all relevant orders because it counts such orders only once a month. For example, under certain circumstances, Pacific’s practice does not count an order that is 48 days overdue as a held order:
Q. Resnick, let's say a customer ordered primary residential service and the commitment date is set for December 29th. We are going to do this as a hypothetical. Due to problems establishing facilities at the customer's residence the line is not installed until February 14th, resulting in a 48-day installation interval from the initial commitment date. Do you have those hypothetical facts in mind, sir?
A. Yes.
Q. In your opinion does this installation meet the GO 133(b) definition of a held order?
A. No.
Q. Why not, sir?
A. . . . [T]he way we measure our GO 133 per the guidelines that are set forth by the Commission, we
21 GO 133-B, Section 3.1 – Held Primary Service Orders.
22
R.01-09-001, I.01-09-002 COM/SK1/MP1/bb1
measure held orders that are held for facilities over 30 days on the 25th of the month. So in this case we would look at January 25th as reporting date for GO 133. We would look back on any orders that were held for more than 30 days past the commitment date. In this case it was not. And so then it would not qualify. The following month, the subsequent month, February 25th, we would look back and this order would have been completed, so therefore it would not count.22
This method of counting is inconsistent with the requirement of GO 133-B that “An order will count as held when service is not provided within 30 days after commitment date.” (Section 3.1(a)). Pacific’s method results in it not reporting some orders held up to two months, making its reported performance appear better than its actual performance.
Within 30 days of the effective date of this decision, Pacific shall file a compliance document in this docket indicating that it has conformed its practice to the plain meaning of GO 133-B.23 Pacific shall, at the very least, change its practice of counting held orders so that it counts such orders as often during the month as is necessary to ensure that all orders for which Pacific does not provide service within 30 days after the commitment date show up in Pacific’s held order reporting. It is not acceptable for Pacific to continue its current method of making the count, as that practice causes Pacific to under-report its results.
Even though a limited definition of primary line and a faulty definition of held order contaminate an interpretation of this measure, statistical methods enable us to analyze the time trend in Pacific’s
22 22 RT 2793:24-2794:22 (Resnick).23 Parties who believe Pacific has violated GO 133-B may file a complaint based on such a claim and seek relief for any alleged violation.
23

R.01-09-001, I.01-09-002 COM/SK1/MP1/bb1
reported measure. An examination of the chart shows a dramatic decline in held orders. A statistical examination of Pacific’s performance over the period from 1990 to 2001 shows that Pacific’s performance has improved substantially in its unique and strange measure of held orders.24 However, we decline to make a finding in this area because of the substantial problems associated with Pacific’s measure of primary lines and its erroneous measurement of held orders.
Verizon had 201 held orders in 1990. It dropped to 10 in 1992 and then peaked to 279 in 1998. In the last three years Verizon has improved its performance in this area. The considerable fluctuations in Verizon’s performance make Verizon’s improving trend in the number of held orders over time not statistically significant.25
24 To determine whether there is a significant time trend in Pacific’s performance, we derived the coefficients that estimate how Pacific’s performance varies over time. In particular, we estimated a regression of Pacific’s performance on a linear time trend, y= + x, where y is the performance in a given year and x is the year. With this specification, the value of coefficient and its t–statistic determine whether there is a statistically significant time trend. For the held orders measure, the value of is –34.51 with t-statistic –4.17, significant at 1% level (R-square: 0.64, no. of observations: 12). The negative value of indicates that Pacific has improved its performance. 25 To determine whether there is a significant time trend in Verizon’s performance, we derived the coefficients that estimate how Verizon’s performance varies over time. In particular, we estimated a regression of Verizon’s performance on a linear time trend, y= + x, where y is the performance in a given year and x is the year. With this specification, the value of coefficient and its t–statistic determine whether there is a statistically significant time trend. For the held orders measure, the value of is –8.57 with t-statistic –1.1. The negative value of indicates that Verizon has improved its performance, but the t-statistic implies that this record of improvement is not statistically different than a record of noimprovement at either the 1% or 5% level (R-square: 0.11, no. of observations: 12).
24

R.01-09-001, I.01-09-002 COM/SK1/MP1/bb1
2. Installation-Line Energizing Commitments
a) Position of the PartiesPacific claimed it met and exceeded the GO 133-B installation-
line energizing commitment standard for all of the NRF period.26 Verizon reported that it has “met a minimum of 98% of its basic
installation order commitments over the past nine years, well above the GO 133-B standard.”27The chart below shows Pacific and Verizon’s performance from 1990 to 2001.28
90
91
92
93
94
95
96
97
98
99
100
1990 1991 1992 1993 1994 1995 1996 1997 1998 1999 2000 2001
Pacific BellVerizonBenchmark
Installation Commitments Met, Yearly Average
Good
Year
Percent Met
26 Pacific Opening/Service Quality at 11.
27 Exh. 2B:214 at 30:6-7 (Thoms Direct Testimony). 28 Exh. 2B:354/Attachment 5 (Hauser Direct Testimony).
25

R.01-09-001, I.01-09-002 COM/SK1/MP1/bb1
b) Annual Data: Pacific and Verizon Met GO 133-B Standard for Honoring Installation Commitments
Parties have not contested Pacific’s performance in this area. The data and the graph above show that Pacific has consistently exceeded the benchmark of meeting 95% of all line-energizing service installation orders for the years 1990 through 2001 (the solid line indicates the standard). Pacific’s annual average has been over 99 percent for eleven years out of twelve. This leads us to conclude that Pacific has a record of compliance with this standard. In addition, we have not observed any significant change in the annual average of Pacific’s installation commitments met.29
Turning now to Verizon, even though we observe a slight decline in Verizon’s trend, it is not statistically significant.30 Verizon has
29 As is our practice, to determine whether there is a significant time trend in Pacific’s performance, we derived the coefficients that estimate how Pacific’s performance varies over time. In particular, we estimated a regression of Pacific’s performance on a linear time trend, y= + x, where y is the performance in a given year and x is the year. With this specification, the value of coefficient and its t–statistic determine whether there is a statistically significant time trend. For this measure, the value of is –0.03, which shows almost no change in the yearly average of installation commitments met over the period investigated. Moreover, the t-statistic –1.52 is not significant at 1% or 5% level (R-square: 0.19, no. of observations: 12). Thus, we find no statistically significant trend.30 As is our practice, to determine whether there is a significant time trend in Verizon’s performance, we derived the coefficients that estimate how Verizon’s performance varies over time. In particular, we estimated a regression of Verizon’s performance on a linear time trend, y= + x, where y is the performance in a given year and x is the year. With this specification, the value of coefficient and its t–statistic determine whether
26

R.01-09-001, I.01-09-002 COM/SK1/MP1/bb1
consistently exceeded the GO 133-B standard. Further, no party contested Verizon's performance measure. We conclude that Verizon’s performance complies with this standard.
c) Monthly Data: Pacific and Verizon Met GO 133-B Standard for Honoring Installation Commitments for ALL 144 Months Under NRF
In comments, ORA argued that performing an analysis on monthly data would provide a more accurate picture of the performance of Pacific and Verizon in meeting GO 133-B standards. We accede to their request and include such data.
Installation Commitments Met
92.0
93.0
94.0
95.0
96.0
97.0
98.0
99.0
100.0
Jan-9
0Ju
l-90
Jan-9
1Ju
l-91
Jan-9
2Ju
l-92
Jan-9
3Ju
l-93
Jan-9
4Ju
l-94
Jan-9
5Ju
l-95
Jan-9
6Ju
l-96
Jan-9
7Ju
l-97
Jan-9
8Ju
l-98
Jan-9
9Ju
l-99
Jan-0
0Ju
l-00
Jan-0
1Ju
l-01
Perc
ent
BenchmarkPacific BellVerizon
Good
there is a statistically significant time trend. For this measure, the value of coefficient is –0.06. Moreover, the t-statistic –1.95 is not significant at 1% or 5% level (R-square: 0.27, no. of observations: 12). Thus, we find no statistically significant trend.
27
R.01-09-001, I.01-09-002 COM/SK1/MP1/bb1
A review of the monthly chart and an inspection of the underlying data show that for the 144 months for which we have data, both Pacific and Verizon met the standard in every month.
3. Customer Trouble Reports
a) Position of the Parties Pacific reported that customer trouble reports occurred about 1.0
to 1.8 times per 100 lines from 1990 to 2001. Verizon reported “[its] network trouble reports per 100 access
lines have not exceeded the GO 133-B standards since at least 1986. In that year, the trouble report rate was 3.4 reports per 100 lines. The rate declined to 1.3 by 1993 and averaged approximately 1 report per 100 lines between 1996 and 2001.”31The following chart shows the performance of Pacific and Verizon for the period from 1990 to 2001.32
31 Exh. 2B:214 at 29: 23 and 30:1-3 (Thoms Direct Testimony). 32 Exh. 2B:354/Attachment 11 (Hauser Direct Testimony).
28

R.01-09-001, I.01-09-002 COM/SK1/MP1/bb1
0
1
2
3
4
5
6
7
8
9
10
1990 1991 1992 1993 1994 1995 1996 1997 1998 1999 2000 2001
Pacific BellVerizonBenchmark
Customer Trouble Reports
Good
Year
Reports per 100 lines
b) Annual Data: Pacific and Verizon Met GO 133-B Standard for Incidence of Trouble Reports
A visual inspection of the chart above indicates that Pacific and Verizon have consistently exceeded the benchmark of no more than 6 trouble reports per 100 lines (the solid line on our graph). The statistical analysis also indicates that there was no significant change in Pacific’s performance over the period under consideration.33 On the
33 To determine whether there is a significant time trend in Pacific’s performance, we derived the coefficients that estimate how Pacific’s performance varies over time. In particular, we estimated a regression of Pacific’s performance on a linear time trend, y= + x, where y is the performance in a given year and x is the year. With this specification, the value of coefficient and its t–statistic determine whether there is a statistically significant time trend. For this measure, the value of is approximately zero, which shows almost no change in customer trouble
29

R.01-09-001, I.01-09-002 COM/SK1/MP1/bb1
average, Verizon has slightly improved its performance over the years.34
c) Monthly Data: Pacific and Verizon Met GO 133-B Standard for Incidence of Trouble Reports for ALL 144 Months Under NRF
reports, yearly average, over the years studied. Moreover, the t-statistic is 0.06, not significant at 1% or 5% level (R-square: 0.00, no. of observations: 12). 34 To determine whether there is a significant time trend in Verizon’s performance, we derived the coefficients that estimate how Verizon’s performance varies over time. In particular, we estimated a regression of Verizon’s performance on a linear time trend, y= + x, where y is the performance in a given year and x is the year. With this specification, the value of coefficient and its t–statistic determine whether there is a statistically significant time trend. For this measure, the value of is –0.08, indicating a slight improvement over this time period. More importantly, the t-statistic is –7.64, significant at 1% level (R-square: 0.85, no. of observations: 12). Thus, there is only one chance in a 100 that Verizon’s customer trouble reports did not decrease over time.
30

R.01-09-001, I.01-09-002 COM/SK1/MP1/bb1
Customer Trouble Reports
0
1
2
3
4
5
6
7
Jan-9
0Ju
l-90
Jan-9
1Ju
l-91
Jan-9
2Ju
l-92
Jan-9
3Ju
l-93
Jan-9
4Ju
l-94
Jan-9
5Ju
l-95
Jan-9
6Ju
l-96
Jan-9
7Ju
l-97
Jan-9
8Ju
l-98
Jan-9
9Ju
l-99
Jan-0
0Ju
l-00
Jan-0
1Ju
l-01
Rep
orts
per
100
line
s
BenchmarkPacific BellVerizon
Good
The chart above shows that both Pacific and Verizon met the GO 133-B performance standard for customer trouble reports per 100 lines for every month covered. There are 144 months for which we have data.
4. Toll Operator Answering Time
a) Position of the PartiesPacific reported that the trend in operator assistance answer
time, also known as toll operator answering time, has met and exceeded GO 133-B standards since the early 1990s.35
Verizon stated that “[its] responsiveness to customers calling for toll or directory assistance operators has consistently reflected a high
35 Exh. 2B:354 at 17:20-21 (Hauser Direct Testimony).
31
R.01-09-001, I.01-09-002 COM/SK1/MP1/bb1
level of service quality, as evidenced by the percentages of calls answered within the ten second and twelve second thresholds established by GO 133-B.”36
No other party addressed this measure.The following chart demonstrates Pacific and Verizon’s
performance from 1993 to 2001.37 The horizontal black line shows the benchmark standard, which rose from answering 80% of all calls within 10 seconds to 85%.
0
10
20
30
40
50
60
70
80
90
100
1990 1991 1992 1993 1994 1995 1996 1997 1998 1999 2000 2001
Pacific BellVerizonBenchmark
Operator Assistance Answer Time, Yearly Average
Good
Year
Percent of Calls Answered
in 10 sec
36 Exh: 2B:214 at 30:13-16 (Thoms Direct Testimony). 37 Exh: 2B:354/Attachment 7 (Hauser Direct Testimony).
32

R.01-09-001, I.01-09-002 COM/SK1/MP1/bb1
b) Annual Data: Pacific and Verizon Met GO 133-B Standard for Operator Assistance Answer Time
A review of the graph above shows that Pacific has met and exceeded the benchmark of answering 85% of all operator assistance calls in 10 seconds over the period under consideration. A closer inspection of the graph shows that Pacific’s performance peaked in 1993 and has not reached the same level since then. Nevertheless, statistical analysis finds no statistically significant time trend in operator assistance answer time.38
Verizon has also exceeded the benchmark since 1990. Its best performance was 90.25% in 1993. We do not observe any significant trend in Verizon’s performance.39
38 As discussed in previous footnotes, we apply the standard statistical methodology: we derive the coefficients that estimate how Pacific’s performance varies over time. In particular, we estimate a regression of Pacific’s performance on a linear time trend, y= + x, where y is the performance in a given year, and x is the year. With this specification, the value of coefficient and its t–statistic determine whether there is a statistically significant time trend. For this specification, the value of is -0.38, which shows a modest decrease in the percentage of phone calls answered within 10 seconds. This trend, however, is not statistically significant – the t-statistic is –2.04 , not significant at 1% or 5% level (R-square: 0.37, no. of observations: 9).39 To determine whether there is a significant time trend in Verizon’s performance, we derived the coefficients that estimate how Verizon’s performance varies over time. In particular, we estimated a regression of Verizon’s performance on a linear time trend, y= + x, where y is the performance in a given year and x is the year. With this specification, the value of coefficient and its t–statistic determine whether there is a statistically significant time trend. For this specification, the value of is 0.03, which is very close to zero. Moreover, the t-statistic is 0.14, not significant at 1% or 5% level (R-square: 0.00, no. of observations: 12). Thus, there is no statistically significant time trend.
33

R.01-09-001, I.01-09-002 COM/SK1/MP1/bb1
c) Monthly Data: Pacific Met Operator Assistance Answer Time Standard 107 of 108 Months; Verizon 140 of 144 Months
Operator Assistance Answer Time
75
80
85
90
95
100
Jan-9
3
May-93
Sep-93
Jan-9
4
May-94
Sep-94
Jan-9
5
May-95
Sep-95
Jan-9
6
May-96
Sep-96
Jan-9
7
May-97
Sep-97
Jan-9
8
May-98
Sep-98
Jan-9
9
May-99
Sep-99
Jan-0
0
May-00
Sep-00
Jan-0
1
May-01
Sep-01
Perc
ent o
f Cal
ls A
nsw
ered
in 1
0 se
c
BenchmarkPacific BellVerizon
Good
The chart above shows the monthly performance of Pacific and Verizon in meeting the GO 133-B performance standard for operator assistance answer time. The underlying data show that Pacific met this standard for 107 of the 108 months under NRF for which we have data. Verizon met this standard for 140 of the 144 months.
34

R.01-09-001, I.01-09-002 COM/SK1/MP1/bb1
5. Directory Assistance Operator Answering Time
a) Position of the PartiesPacific reported that the trend in directory assistance answering
time has exceeded GO 133-B standard of answering 85% of all directory assistance calls within 12 seconds since the early 1990s.40
Verizon also reports a record of compliance with the standard.The following chart demonstrates the performance of Pacific and
Verizon.41 Once again, the solid horizontal line represents the performance standard.
0
10
20
30
40
50
60
70
80
90
100
1990 1991 1992 1993 1994 1995 1996 1997 1998 1999 2000 2001
Pacific BellVerizonBenchmark
Directory Assistance Answer Time, Yearly Average
Good
Year
Percent of Calls Answered
in 12 sec
40 Exh. 2B:354 at 17:20-21 (Hauser Direct Testimony).
41 Id., Attachment 8.
35

R.01-09-001, I.01-09-002 COM/SK1/MP1/bb1
b) Annual Data: Pacific and Verizon Met GO 133-B Standards for Directory Assistance Answer Time
As a review of the graph indicates, Pacific has consistently exceeded the benchmark from 1993 to 2001. The annual average of Pacific’s performance has been over 90 percent for all years under consideration – an average of over 90 percent of directory assistance calls were answered within 12 seconds. We find no statistically significant upward or downward trend. 42
We find that Verizon has also exceeded the benchmark, and we find no statistically significant upward or downward trend.43
42 Following the usual procedure, to determine whether there is a significant time trend in Pacific’s performance, we derived the coefficients that estimate how Pacific’s performance varies over time. In particular, we estimated a regression of Pacific’s performance on a linear time trend, y= + x, where y is the percentage of calls answered within 12 seconds in a given year and x is the year. With this specification, the value of coefficient and its t–statistic determine whether there is a statistically significant time trend. For this specification, the value of is 0.07, indicating little systematic change over the years studied. Moreover, the t-statistic is 0.41, not significant at 1% or 5% level (R-square: 0.02, no. of observations: 9). Thus, the trend is not significantly different from zero.43 Following the usual procedure, to determine whether there is a significant time trend in Verizon’s performance, we derived the coefficients that estimate how Verizon’s performance varies over time. In particular, we estimated a regression of Verizon’s performance on a linear time trend, y= + x, where y is the percentage of calls answered within 12 seconds in a given year and x is the year. With this specification, the value of coefficient and its t–statistic determine whether there is a statistically significant time trend. For this specification, the value of is 0.33, indicating a modest improvement over the years studied. However, the t-statistic is 2.26, not significant at 1% or 5% level (R-square: 0.42, no. of observations: 9). Thus, this trend of improvement, although encouraging, is not statistically significant.
36

R.01-09-001, I.01-09-002 COM/SK1/MP1/bb1
c) Monthly Data: Pacific Met GO 133-B Standards for Directory Assistance Answer Time Every Month; Verizon in 106 of 108 Months
The following graph charts the performance of Pacific and Verizon against the directory assistance answer time for each month since January 1993.
Directory Assistance Answer Time
70.0
75.0
80.0
85.0
90.0
95.0
100.0
Jan-9
3
May-93
Sep-93
Jan-9
4
May-94
Sep-94
Jan-9
5
May-95
Sep-95
Jan-9
6
May-96
Sep-96
Jan-9
7
May-97
Sep-97
Jan-9
8
May-98
Sep-98
Jan-9
9
May-99
Sep-99
Jan-0
0
May-00
Sep-00
Jan-0
1
May-01
Sep-01
Perc
ent o
f Cal
ls A
nsw
ered
in 1
2 se
c
BenchmarkPacific BellVerizon
Good
A review of the chart above shows that both Pacific and Verizon have a strong record of meeting the GO 133-B performance standard for directory assistance answer time when measured on a monthly basis. This particular standard, answering 85% of calls in 12 seconds, was adopted in January 1993. Pacific met the standard for each of the 108 months under NRF charted above.
37

R.01-09-001, I.01-09-002 COM/SK1/MP1/bb1
Verizon met this performance standard 106 of the 108 months charted above. In addition, in the prior period for which the standard was maintaining an average directory assistance answer time of 9 seconds, Verizon met this performance standard for every month in the period from 1990-1992. Thus, Verizon met the directory assistance answer time standard for 142 of the 144 months under NRF.
6. Trouble Service Answering Time
a) Position of the PartiesPacific reported that the percentage of trouble service calls
answered on time – trouble report service answering time (TRSAT) – has shown steady improvement since 1996. Pacific has exceeded the standard – answering 80% of all calls within 20 seconds – every year starting in 1999.44
Verizon also shows a pattern of improvement, and has met the standard every year since 1996. The following chart demonstrates Pacific and Verizon’s performance from 1991 through 2001.45
44 Exh. 2B:354 at 18: 3-7 (Hauser Direct Testimony).
45 Exh. 2B:354/Attachment 6 (Hauser Direct Testimony).
38

R.01-09-001, I.01-09-002 COM/SK1/MP1/bb1
b) Annual Data: Pacific Has Met GO 133-B Standard for TRSAT Since 1999; Verizon Since 1996
On average, Pacific’s annual performance was below the standard of 80% of calls answered within 20 seconds from 1991 through 1998. Pacific’s performance has met the standard and shown improvement in 1999 through 2001, but we have not observed a statistically significant improvement over the NRF period 1991-2001.46
46 Following the usual procedure, to determine whether there is a significant time trend in Pacific’s performance, we derived the coefficients that estimate how Pacific’s performance varies over time. In particular, we estimated a regression of Pacific’s performance on a linear time trend, y= + x, where y is the percentage of trouble service calls answered within 20 seconds in a given year and x is the year. With this specification, the value of coefficient and its t–statistic determine whether there is a statistically significant time trend. For this measure, the value of is 0.75, indicating an
39
0
10
20
30
40
50
60
70
80
90
100
1990 1991 1992 1993 1994 1995 1996 1997 1998 1999 2000 2001
Pacific BellVerizonBenchmark
Trouble Service Answer Time, Yearly Average
Good
Year
Percent of Calls Answered
in 20 sec

R.01-09-001, I.01-09-002 COM/SK1/MP1/bb1
Verizon’s TRSAT failed to meet the minimum standard of 80% of calls answered within 20 seconds in 1993 and in 1995.
According to testimony, since 1994, there have been four months in which Verizon failed to meet the standard under TRSAT.47 ORA’s witness testified that Verizon had met the TRSAT standard 90% of the time since 1992.48 Our graph clearly shows that Verizon has met the standard since 1996.
We do not agree with TURN that these results for Verizon can be attributed to the Commission’s action against Pacific after the Commission’s Pacific Telesis-SBC merger order (D.97-03-067) threatened Pacific with sanctions for noncompliance with the TRSAT standard. The connection between the two actions is not only too tenuous to draw conclusions with any certainty, but is also undermined by the fact Verizon generally exceeded the TRSAT minimum standard after D.94-06-011 and before the Commission issued the merger order.
Overall, we find that, while Verizon had problems with respect to trouble report answer time in the early NRF period, Verizon appears to have developed a consistent track record of solid performance since then. On the average we find that Verizon has an improving trend in this area.49
improving trend over the years studied. However, the t-statistic is 1.77, not significant at 1% or 5% level (R-square: 0.26, no. of observations: 11). Thus, we do not find that the trend of improvement is statistically significant.47 19 RT 2318:28-2319:20.48 Exh. 2B:138 at 6 (Piiru Direct Testimony).49 Following the usual procedure, to determine whether there is a significant time trend in Verizon’s performance, we derived the coefficients that estimate how Verizon’s performance varies over time. In particular, we
40

R.01-09-001, I.01-09-002 COM/SK1/MP1/bb1
c) Monthly Data: Pacific Has Met GO 133-B Standard for TRSAT in 92 of 132 Months; Verizon in 104 of 132 Months
Trouble Report Service Answer Time
10.0
20.0
30.0
40.0
50.0
60.0
70.0
80.0
90.0
100.0
Jan-9
1Ju
l-91
Jan-9
2Ju
l-92
Jan-9
3Ju
l-93
Jan-9
4Ju
l-94
Jan-9
5Ju
l-95
Jan-9
6Ju
l-96
Jan-9
7Ju
l-97
Jan-9
8Ju
l-98
Jan-9
9Ju
l-99
Jan-0
0Ju
l-00
Jan-0
1Ju
l-01
Perc
ent o
f Cal
ls A
nsw
ered
in 2
0 se
c
BenchmarkPacific BellVerizon
Good
The messy chart above shows that Pacific and Verizon have had more difficulty in meeting the GO 133-B standard for “trouble report service answer time”. Pacific met this standard for 92 of the 132 months under NRF for which we have data. Verizon met this standard for 104 of the 132 months for which we have data, or approximately
estimated a regression of Verizon’s performance on a linear time trend, y= + x, where y is the percentage of trouble service calls answered within 20 seconds in a given year and x is the year. With this specification, the value of and its t–statistic determine whether there is a statistically significant time trend. For this measure, the value of is 1.65, indicating an improving trend over the years studied. Moreover, the t-statistic is 3.36, significant at 5% level (R-square: 0.62, no. of observations: 9). Thus, Verizon’s trend of improvement is statistically significant.
41

R.01-09-001, I.01-09-002 COM/SK1/MP1/bb1
79% of the time. Verizon has met the standard every month since December 1996.
7. Business Office Answering Time (BOAT)
a) Position of the PartiesPacific claims that the percentages of business office calls
answered on time – within the twenty second standard -- have shown steady improvement since 1996, and has exceeded the standard every year starting in 1997.50
Verizon claims that “the Business Office and Customer Care or Repair Centers have improved on the speed of answer requirements set by the PUC and since the 1996/1997 timeframe, both the Business Office and Customer Care Centers have consistently exceeded the levels established by the PUC.”51
The following chart shows Pacific’s and Verizon’s performance in this area.52 The stepping horizontal line illustrates the performance standard and how it has changed over time.
50 Exh. 2B:354 at 18:3-5 (Hauser Direct Testimony). 51 Exh. 2B:214 at 30:17-20 (Thoms Direct Testimony).52 Exh. 2B:354/Attachment 9 (Hauser Direct Testimony). Pacific’s adjusted BOAT data with billing calls are from TURN’s August 27, 2002 Supplemental Testimony.
42

R.01-09-001, I.01-09-002 COM/SK1/MP1/bb1
0
10
20
30
40
50
60
70
80
90
100
1990 1991 1992 1993 1994 1995 1996 1997 1998 1999 2000 2001
Pacific BellPacific Bell w/ Billing InquiriesVerizonBenchmark
Business Office Answer Time, Yearly Average
Good
Year
Percent of Calls Answered in
20 sec
TURN stated that Pacific’s alterations to its GO 133-B BOAT reporting has made it impossible to compare either Pacific’s performance over time or to Verizon (or other carriers) without adjustments to reinclude data that Pacific excluded.53 In particular, up until February 1999, calls regarding billing were included in Pacific’s BOAT reporting.
b) Annual Data: Pacific Has Met BOAT Standard Since 1997; Verizon Since 1998
The BOAT measure was added to GO 133-B in 1992,54 and the minimum standard, measured as the percent of calls answered within 20 seconds, was progressively increased from 70% beginning on 53 TURN Opening Brief at 15.
54 D.92-05-056.
43

R.01-09-001, I.01-09-002 COM/SK1/MP1/bb1
December 3, 1992, to 75% (beginning October 4, 1993), to 80% (beginning July 5, 1994). (See horizontal line on graph).
Pacific changed its practice regarding inclusion of billing calls in its BOAT reporting. Pacific now excludes billing calls, but included them in its GO 133-B reporting up until February 1999. This exclusion, however, is actually the required practice, because GO 133-B Section 1.3.b defines Business Office as “a Centralized Service Group which receives Small Business and/or Residence Customer requests for new installations or change in existing service. This does not include billing center inquiries.” Nevertheless, Pacific’s actions to correct this error make it difficult to draw conclusions regarding the meaning of this measure for service quality. Billing inquiries are a major source of customer interaction with the utility, and clearly of interest to those assessing the quality of service. As shown in the graph, when billing inquires are included, Pacific’s performance falls below the 80% benchmark and goes as low as the 50%-60% range.
Despite the fact that the GO 133-B standard requires the exclusion of billing inquiries, TURN alleges that Pacific’s answer times for billing calls are so poor as to warrant a finding that Pacific has violated Pub. Util. Code § 451. Pacific only answered 20% of billing calls in 20 seconds at one point after February 1999 (GO 133-B requires 80% of business office calls to be answered in that time), and the rate has only improved to approximately 50% of late.55 Moreover, when these calls are included in the BOAT measure, Pacific’s performance falls to 68% of calls answered within 20 seconds, far below the GO 133-B standard.
55 Exh. 2B:521, Table 1.
44

R.01-09-001, I.01-09-002 COM/SK1/MP1/bb1
Both Pacific and TURN recognize that the Commission has not set standards for billing call answer times. In addition, GO 133-B has specifically required their exclusion from its aggregate measure. Since GO 133-B specifically excludes billing inquiries from its measure of BOAT, we do not find that Pacific’s performance of 68% or fewer calls answered within 20 seconds is a violation of GO 133-B standards, when billing calls are included in that measure. Therefore, we do not find a § 451 violation of this standard. Nevertheless, Pacific’s performance concerning billing call answer time is clearly deficient. The failure of this Commission to establish a billing call answer time measure is a gap that the Commission has identified for consideration in R.02-12-004.
Pacific also once included DSL-related information in its GO 133-B data, but stopped doing so when it moved its DSL functions into a separate subsidiary. Thus, this measure has been highly unstable during the reporting period, making it particularly difficult to draw any conclusion concerning the trend in performance.
Based on the data submitted by Pacific, we find that Pacific did not meet the GO 133-B standard in 1993, 1995 and 1996. Pacific’s performance has met the standard since 1997. Even though there is a statistically significant positive trend in Pacific’s performance, we cannot say whether this improvement is due to the exclusion of billing calls after 1999 or Pacific’s actual improvements in performance.56 56 To determine whether there is a significant time trend in Pacific’s performance, we derived the coefficients that estimate how Pacific’s performance varies over time. In particular, we estimated a regression of Pacific’s performance on a linear time trend, y= + x, where y is the performance in a given year and x is the year. With this specification, the
45

R.01-09-001, I.01-09-002 COM/SK1/MP1/bb1
Due to lack of evidence on the number of billing calls included in Pacific’s performance before 1999, we have not been able to test for it.
We find that, on average, Verizon’s BOAT results failed to meet the minimum standard of 80% of calls answered within 20 seconds during the period from 1993 through 1997. Verizon’s BOAT performance was clearly substandard during the early part of the NRF period, but has shown steady improvement since 1997. In particular, Verizon failed to meet this performance standard in 1993, 1996 and 1997, but met the BOAT performance standard in 1994, 1995, and 1998-2001. Overall, Verizon has had a positive performance trend in this measure.57
As noted above, GO 133-B defines “Business Office” as “A Centralized Service Group which receives Small Business and/or Residence Customer requests for new installation or change in existing service. This does not include billing center inquiries.”58 However, Verizon states that it includes billing inquiries in its BOAT
value of coefficient and its t–statistic determine whether there is a statistically significant time trend. For this specification, the value of is 1.48, indicating improvement over this time period. More importantly, with a t-statistic 4.01, this trend is statistically different from zero at 1% level (R-square: 0.67, no. of observations: 10). Thus, there is only one chance in a 100 that percentage of the calls answered did not increase over time. However, the statistical improvement does not take into the account the data inconsistency problem created when Pacific excluded billing inquires in the latter part of the NRF period. Hence the statistical improvement is of diminished consequence.57 We derived coefficients by estimating a regression of Verizon’s performance on a linear time trend. For this measure the coefficient was 2.025 with a t-statistic 3.78, significant at 1% level (R-square: 0.67, no. of observations: 9).58 Id., Section 1.3(b).
46
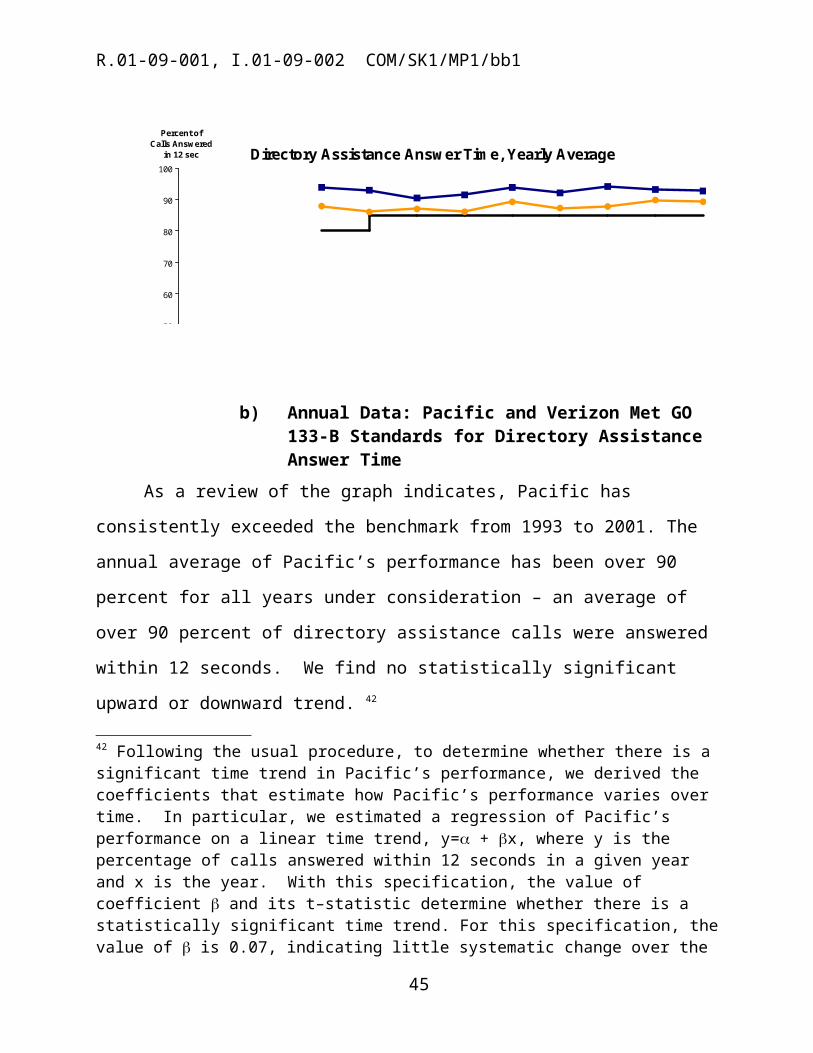
R.01-09-001, I.01-09-002 COM/SK1/MP1/bb1
measure.59 We do not wish to discourage such voluntary over inclusion, but we will require Verizon to notify us if it seeks to discontinue reporting billing inquiries. As we note elsewhere in this decision, one important use of the GO 133-B data is that we can use it to analyze a carrier’s performance over time. Such comparability requires that a carrier seek prior Commission authorization before making changes to the way it reports its data. This is an issue that urgently requires resolution in our service quality rulemaking, which should not only make these measures consistent across companies, but also manage the changes in the data included in measures so to preserve the meaningfulness of these measures.
59 22 RT 2786:10-17 (statement by Verizon’s counsel).
47
R.01-09-001, I.01-09-002 COM/SK1/MP1/bb1
c) Monthly Data: Pacific Has Met BOAT Standard for 67of 109 months; Verizon 80 of 109
Business Office Answer Time
20.0
30.0
40.0
50.0
60.0
70.0
80.0
90.0
100.0
Dec
-92
Apr
-93
Aug
-93
Dec
-93
Apr
-94
Aug
-94
Dec
-94
Apr
-95
Aug
-95
Dec
-95
Apr
-96
Aug
-96
Dec
-96
Apr
-97
Aug
-97
Dec
-97
Apr
-98
Aug
-98
Dec
-98
Apr
-99
Aug
-99
Dec
-99
Apr
-00
Aug
-00
Dec
-00
Apr
-01
Aug
-01
Dec
-01
Perc
ent o
f Cal
ls A
nsw
ered
in 2
0 se
c
Pacific Bell
Verizon
Benchmark
Good
The chart above shows the monthly performance of Pacific and Verizon against the BOAT standard in effect. During the period for which we have data, Pacific met or exceeded the BOAT standard for 67 of the 109 months under NRF for which we have data. Verizon met the standard for 80 of the 109 months for which we have data. Clearly, both companies have had problems meeting this service standard.
C. Summary of Empirical Assessment of Pacific’s and Verizon’s Performance on GO 133-B Measures
Concerning the six GO 133-B measures for which the Commission has required systematic reporting and has adopted a
48

R.01-09-001, I.01-09-002 COM/SK1/MP1/bb1
standard, the table below summarized the performance of Pacific in meeting that standard. In particular, we note that for the first four measures, “installation commitments met,” “repair reports per 100 lines,” “operator assistance answer time,” and “directory assistance answer time,” we find that Pacific has met or exceeded every GO 133-B for every month but one. For “trouble report service answer time, Pacific met the standard 69.7% of the months for which we have data. For “business office answer time,” Pacific met the standard only 61.5% of the time.
CPUC GO 133-B Measurement Total Months Reported
Months Meeting Standard
Percent Meeting Standard
Percent Installation Commitments Met 144 144 100.0%Repair Reports Per 100 Lines (RPHL) 144 144 100.0%Operator Assistance Answer Time 108 107 99.1%Directory Assistance Answer Time 108 108 100.0%Trouble Report Service Answer Time (TRSAT) 132 92 69.7%Business Office Answer Time (BOAT) 109 67 61.5%
Total 745 662 88.9%
Total of All Monthly Performance
Summary of GO 133-B Performance for SBC California January 1990 through December 2001
For measures with standards
During the NRF period, Pacific’s faulty definition of held order prevents us from reaching a finding on this measure.
When measured on an annual basis, Pacific has shown no statistically significant change in the percentage of line-energizing installation commitments met, the number of customer trouble reports per 100 lines, the yearly average of toll operator assistance answer time, and the yearly average of directory assistance answer
49

R.01-09-001, I.01-09-002 COM/SK1/MP1/bb1
time, and trouble service answer time. When measured on an annual basis, on no GO 133-B measure of service quality did Pacific show statistically significant decreases in performance during the period under NRF regulation. Thus, we find no evidence from Pacific’s performance that supports the hypothesis that NRF regulation decreases customer service quality.
Turning now to Verizon, concerning the six GO 133-B measures for which the Commission has required systematic reporting and has adopted a standard, the table below summarized the performance of Verizon in meeting that standard. In particular, we note that for the first four measures, “installation commitments met,” “repair reports per 100 lines,” “operator assistance answer time,” and “directory assistance answer time,” we find that Verizon has met or exceeded every GO 133-B for every month but six – or in 97% or more of the months for which we have data. For “trouble report service answer time, Verizon met the standard 78.8% of the months for which we have data. For “business office answer time,” Verizon met the standard only 73.4% of the time.
50

R.01-09-001, I.01-09-002 COM/SK1/MP1/bb1
CPUC GO 133-B MeasurementTotal
Months Reported
Months Meeting Standard
Percent Meeting Standard
Percent Installation Commitments Met 144 144 100.0%Repair Reports Per 100 Lines (RPHL) 144 144 100.0%Operator Assistance Answer Time 144 140 97.2%Directory Assistance Answer Time 144 142 98.6%Trouble Report Service Answer Time (TRSAT) 132 104 78.8%Business Office Answer Time (BOAT) 109 80 73.4%
Total 817 754 92.3%
Total of All Monthly Performance
Summary of GO 133-B Performance for Verizon CaliforniaFor the Period January 1990 through December 2001
During the NRF period, when measured on an annual basis, Verizon’s performance showed statistically significant improvement on the number of customer trouble reports per 100 lines, trouble service answer time, and on business office answer time. When measured on an annual basis, Verizon has shown no statistically significant change on the held orders, the percentage of line-energizing installation commitments met, the yearly average of toll operator assistance answer time, and the yearly average of directory assistance answer time. When measured on an annual basis, on no GO 133-B measure of service quality did Verizon show statistically significant decreases in performance during the period under NRF regulation. Thus, we find no evidence from Verizon’s performance that supports the hypothesis that NRF regulation decreases customer service quality.
51

R.01-09-001, I.01-09-002 COM/SK1/MP1/bb1
IV. Federal Measures of Service Quality – ARMIS and MCOT DataThere are two major sets of Federal measures of service quality.
The first set, known as the ARMIS measures, has been in place since 1987. More recently, as a condition of large telecommunications mergers, the FCC adopted additional service quality measures, known as MCOT measures. We now turn our attention to these measures of service quality.
A. ARMIS MeasuresThe FCC requires the carriers to submit reports on several
aspects of service quality, and the results for relevant years appear in the record of this proceeding.60 The Automated Reporting Management Information System (ARMIS) data stem from FCC Common Carrier Docket No. 87-313, which implemented service quality reporting requirements for local exchange carriers such as Pacific and Verizon. In 1991, the FCC added specific reports to collect service quality and network infrastructure information.
The ARMIS 43-05 report contains service quality performance measures which track, among other things, whether Pacific or Verizon meet their installation commitments for residential and business customers, trouble reports and repair intervals (e.g., both initial and repeat trouble reports, and the time required to dispatch and complete repairs in response to trouble reports), and switch downtime incidents.61 While there are no performance standards associated with these reports, they track very important service quality measures.
60 Exhs. 2B:707 (Verizon) and 2B:704 & 2B:706 (Pacific).61 The ARMIS reports appear in the record as Exhibits 704 and 706.
52

R.01-09-001, I.01-09-002 COM/SK1/MP1/bb1
The ARMIS 43-06 report tracks customer perceptions of Pacific’s and Verizon’s service quality and will be discussed in the Section entitled “Survey Data and Customer Satisfaction”.
B. Accuracy of Data
1. General Issues with Pacific’s DataA key issue in the proceeding concerned the accuracy of the
service quality data that Pacific reports to the FCC as part of its ARMIS reporting obligations. ORA claims that even where Pacific reports positive ARMIS results, the results are unreliable because of errors in the underlying data. Initially, ORA claimed Pacific provided ORA inaccurate installation data for the period 1998-2001. It later changed that assertion to limit the period of claimed inaccuracy to 1998-99, and we limit consideration of the accuracy of Pacific’s data to this time period.62
ORA relied principally on the work of Linette Young in this area. Ms. Young downloaded Pacific’s raw data into a database format, and then compared it to Pacific’s summary data as reported in ARMIS. Where there were inconsistencies across these two sets of data, ORA assumed the ARMIS reports were inaccurate. ORA made many corrections to the data over time as Pacific pointed out problems.
Ultimately, it became apparent that the data mismatches that ORA found were due not to Pacific’s misrepresentations, but rather to differences between the raw data ORA examined and the data Pacific uses to report to regulators. For example, Pacific modifies its raw data to remove certain types of telephone services that the ARMIS
62 Errata to Opening Brief of the Office of Ratepayer Advocates in Service Quality in Phase 2B, filed Sept. 10, 2002, at 1; Second Errata to Opening Brief of the Office of Ratepayer Advocates on Service Quality in Phase 2B, filed Sept. 11, 2002, at 1.
53

R.01-09-001, I.01-09-002 COM/SK1/MP1/bb1
regulatory requirements do not include. We find, therefore, that ORA did not establish that Pacific misreports its installation service results. Therefore, we deny ORA’s recommendation that we conduct an audit of Pacific’s historic installation data to determine the extent of data error and its subsequent impact on reported service quality results during the NRF period. We do not agree that such an audit is appropriate, since we conclude that ORA did not show that Pacific’s installation data are inaccurate.63
However, this incident illustrates the difficulties that arise when interactions between a utility and its regulators become needlessly adversarial. Pacific should have been far more helpful to ORA in pointing out problems with Pacific’s data up front. Pacific knew that ORA had requested raw data to allow it to test Pacific’s results.64 ORA, on the other hand, could have simply asked Pacific why the raw data did not match the ARMIS data. Instead, ORA conducted its analysis without any collegial interaction with Pacific, and Pacific responded by pointing out flaws after receiving ORA’s testimony. This approach to regulation wastes Commission time and results in regulatory drama, but little more. Most importantly, it hinders the development of a clear evidentiary record.
63 Our rejection of ORA’s recommendation does not in any way preclude the Commission staff from reviewing in the future Pacific’s service quality data or its data collection and reporting methods. Similarly, in denying this recommendation, we do not intend to preclude proposals in Phase 3B designed to ensure the accuracy of data reported to regulators, through audits or any other means. 64 Indeed, Pacific’s own staff worked on testing Ms. Young’s results, making clear that Pacific was well aware of the ORA’s purpose for requesting the data. Exh. 2B:357 at 29 (Resnick Reply Testimony) (“At my direction, several analysts in [Pacific’s] Network Services [organization] have worked with the data supplied by Ms. Young in her workpapers.”).
54

R.01-09-001, I.01-09-002 COM/SK1/MP1/bb1
As it was, ORA had to change its analysis each time Pacific explained problems in translating its raw data to reports made for regulatory purposes. In the end, the proceeding could have been much more productive had all such translation errors been resolved beforehand.
We next address ORA’s specific allegations regarding the accuracy of Pacific’s data.
2. Pacific’s Data Concerning Installation Orders Require ClarificationORA claims its analysis shows that Pacific closes installation
orders before they are complete. This would have the effect of systematically understating installation intervals in regulatory reports. ORA bases its conclusion on its examination of four informal complaints from residential customers who ordered multiple telephone lines at the same time. These lines were to be installed at the same address on the same commitment date. Ms. Young testified that when it was discovered there were not sufficient facilities available to install both lines, “apparently what occurred was Pacific installed one line, closed the order and then reopened or initiated a second order for the second line.” ORA is speculating on this point in its use of the term “apparently what occurred.” Pacific pointed out that ORA was speculating, and also stated “lack of facilities for four customers does not constitute a widespread problem.”
We agree that there is not enough evidence in the record for us to conclude that Pacific is closing installation orders prematurely. Because the record is unclear on this issue, we order Pacific to file and serve data in the form of a compliance filing in this docket that affirmatively addresses this point within 30 days of the effective date
55

R.01-09-001, I.01-09-002 COM/SK1/MP1/bb1
of this decision. Pacific shall answer the following questions in its submission:
a. Has Pacific at any time during the period 1990-2002 closed installation orders containing multiple lines to be installed on the same order after a portion of - but not all - the lines were installed?
b. If the answer to the previous question is yes, produce an annual summary of the number of such orders.
c. If Pacific reports that any multi-line order was closed before all lines associated with that order were installed, explain in detail how Pacific accounts for such orders when calculating its installation intervals for purposes of any regulatory reporting requirements.
3. Allegation that Pacific’s Reports Contain Erroneous Duplicate Records Has No Factual BasisORA also argued that the presence of “duplicate” records among
the data Pacific provided it indicates there are errors in Pacific’s data. However, ORA states in this regard that “ORA does not claim that all duplicate records are erroneous records,”65 and indeed later appears to concede that “the duplicate records should be included” in Pacific’s calculation of its installation intervals.66 ORA also confusingly asserts that, [t]he “erroneous duplicate records” that Pacific refers to are the same anomalous records (orders for basic service that do not contain commitment dates), which Pacific has previously claimed are not erroneous records. After having argued for the inclusion of the
65 ORA Reply/Service Quality at 3.66 Id. at 5.
56

R.01-09-001, I.01-09-002 COM/SK1/MP1/bb1
duplicate and anomalous records, Pacific cannot now claim that these ‘erroneous duplicate records’ are erroneous.”67
It appears from its statement that ORA no longer claims there is a problem with Pacific’s data due to the presence of duplicate records, and we find that this allegation has no factual basis
4. Allegation that Pacific’s Reports Contain Erroneous “Anomalous Records” Has No Factual BasisORA also claims there is a problem with “anomalous records” –
records without “commit dates” (dates on which Pacific committed it would complete an installation). ORA’s witness believed these records were suspicious based on her belief that “no order for services could flow through Pacific’s systems without a commitment date.” She claims Pacific told her of this restriction several times, but submitted no written evidence in the record of such a representation by Pacific. Indeed, the evidence is to the contrary. As Pacific points out, it is appropriate that certain orders – related to “supersedures” where a new resident at an address takes over the phone service of the existing customer – not contain “commit dates.”
5. Verizon’s Data Are AccurateORA raised similar issues concerning Verizon’s data. ORA
asserts that Verizon’s data includes duplicate data, that data fails to track across different data bases, that data on installation intervals is unreliable, that the data on the number of commitments met is in error, and that Verizon closes service orders too soon.
Verizon successfully responded to each of these challenges. We find that ORA’s challenges to Verizon’s data almost identical
to their challenges to Pacific’s and suffer from the same deficiencies.
67 Id.
57

R.01-09-001, I.01-09-002 COM/SK1/MP1/bb1
We reject ORA’s challenges to Verizon’s data for essentially the same reasons.
Although our experience with regulation makes us sympathetic to the complexities of data reporting and analysis, we find that many of the allegations arise from simple misinterpretations by ORA of the data presented to ORA by Verizon. For example, ORA alleged that any installation order that was reopened within 60 days represented a premature closing of the service record by Verizon. In response, Verizon noted that this is a common occurrence and explained by a variety of phenomena, and Verizon explained each of the examples used by ORA to illustrate its allegation. Thus, ORA’s allegation of misreporting of data was shown to have no validity.
Our purpose in an administrative proceeding such as this is to develop an evidentiary record that supports reasonable decisionmaking. As we noted above, professional collaboration between regulator and the regulated on data matters, in particular, serves the public interest better than adversarial interactions.
C. Summary Table of ARMIS 43-05 Measures
For the measures reported in ARMIS 43-05, we examined Pacific 68and Verizon’s69 performance over the years, and compared it with
68 In Hauser’s direct testimony, for Pacific, for the years 1991– 1994, the 1st quarter of the subsequent year was used for the number of access lines for the prior year, e.g. Q1 1993 was used for 1992. For 1995 annual access lines, the average of 1996 annual data and Q1 1995 was used.69 For Verizon, we did not replicate the calculations used to determine access in the years 1990 – 1995 because of limitations of data and time. In particular, instead of using Q1 of the next year for the number of access lines, we used Q4 of the current year. From 1996 on, all utilities reported data on an annual basis. Subsequent analysis showed that this method understates Verizon’s access line count by less than 1.24% (as compared to the use of the Pacific methodology). This conservative approach tends to
58

R.01-09-001, I.01-09-002 COM/SK1/MP1/bb1
each other and with the performance of the reference group.70 The major results of our statistical analysis are reported in the tables that
follow.71 Although we present the analysis at this point as a reference matter, we will not discuss the results in this section. Subsequently, we describe each measure and we graph each carrier’s performance in each of these measures.72 In these subsequent sections, we will comment on each utility’s performance and indicate whether any improving or deteriorating trend is observed and discuss the results of
understate slightly Verizon’s results in these early years as compared to the reference group and Pacific. From 1996, we were able to replicate Pacific’s methodology for counting access lines.70 The reference group is introduced in Hauser’s direct testimony and consists of the top ten local exchange carriers based on the number of total access lines in 2001. These companies include Verizon-NY Telephone, Southwestern-Texas, Illinois Bell, Verizon-New Jersey, Bell South-Florida, Verizon-Pennsylvania, Michigan Bell, GTE/CA, Verizon-New England, and Bell South-GA. We note that our analysis will include GTE/CA in both the reference group and as a company subject to analysis. Although this is not the preferred mode of data analysis, since GTE/CA’s performance exceeds both that of Pacific and the reference group for majority of the measures, including GTE/CA in the reference group leads to comparisons that understate the performance of both Pacific and GTE/CA in comparison to a reference group of utilities outside of California. 71 The first table, Trend in Pacific Bell ARMIS Performance, is from Exh.2B: 354/Attachment 5 (Hauser Reply Testimony). 72 The graphs and tables are based on ARMIS data reported by carriers to the FCC. Prior to 1996, carriers reported ARMIS data on a quarterly basis, and thereafter, annually. For years reporting quarterly data, quarterly results are summed to obtain annual trouble reports. Annual repair intervals are obtained by weighting and combining the quarterly data (i.e., multiplying quarterly repair intervals by quarterly trouble reports, summing the results and dividing the summed result by annual trouble reports). Similarly, Verizon’s annual trouble reports are obtained by summing GTE California (GTEC) and Contel trouble reports, and Verizon’s repair intervals are obtained by weighting and combining the GTEC and Contel repair intervals. Contel data was included starting 1997 since Verizon and Contel merged their operations in April 1996.
59
R.01-09-001, I.01-09-002 COM/SK1/MP1/bb1
our statistical analysis at that point. The reader unfamiliar with statistical analysis may jump over these tables to our subsequent discussion.
Trend in Pacific Bell ARMIS PerformanceSource: ARMIS 43-05
Measures for which a Negative Coefficient is Indicative of Better Performance
Measurement Subject Measurement Group Covered Coefficient1 T-statistic3 R-squaredNumber of
Observations
Initial Trouble Reports Residence -0.179 (-0.69) 0.05 11Business -0.609 (-5.52)** 0.77 11
Repeat Trouble Reports Residence 0.002 (0.05) 0.00 11Business -0.183 (-9.87)** 0.92 11
Initial Out-of-Service Residence -0.012 (-0.04) 0.00 8Business -0.024 (-0.29) 0.01 8
Repeat Out-of-Service Residence -0.020 (-0.41) 0.03 8Business -0.030 (-3.56)* 0.68 8
Initial Subsequent Trouble Reports Residence N/A4
Business N/A4
Repeat Subsequent Trouble Reports Residence N/A4
Business N/A4
Initial All Other Trouble Reports Residence 0.502 (3.14)* 0.62 8Business -0.231 (-4.16)** 0.74 8
Repeat All Other Trouble Reports Residence 0.077 (3.05)* 0.61 8Business -0.098 (-5.62)** 0.84 8
Repair Interval Initial Out-of-Service Residence 1.328 (0.85) 0.11 8Business 0.204 (0.63) 0.06 8
Repeat Out-of-Service Residence 0.855 (0.59) 0.06 8Business 0.234 (0.58) 0.05 8
Initial All Other Residence 0.073 (0.05) 0.00 8Business -0.875 (-2.49)* 0.51 8
Repeat All Other Residence 0.495 (0.31) 0.02 8Business -0.752 (-1.92) 0.38 8
Installation Average Installation Interval Residence -0.096 (-1.40) 0.25 8Business -0.079 (-1.32) 0.22 8
Switch Downtime Downtime per Switch Down Total2 -1.287 (-2.02) 0.31 11Switches Down per Switch Total2 -0.000 (0.00) 0.00 6
Number of Occurrences Over Two Minutes per Switch Total2 0.019 (0.80) 0.14 6Under Two Minutes per Switch Total2 -0.016 (-2.95)* 0.69 6Percent Unscheduled (under two minutes) Total2 -0.015 (-0.57) 0.07 6
Measures for which a Positive Coefficient is Indicative of Better Performance
Measurement Subject Measurement Group Covered Coefficient1 T-statistic3 R-squaredNumber of
ObservationsInstallation Installation Commitments Met Residence -0.038 (-1.15) 0.13 11
Business -0.176 (-4.51)** 0.69 11
Notes: 1. These coefficients were derived by estimating a regression of Pacific's performance on a linear time trend.2. Total is derived by summing the total of the Metropolitan Statistical Areas and the total of non-Metropolitan Statistical Areas for eachcompany, and then taking the average.3. If a t-statistic is significant at a 5% level, it is given an asterisk (*). If a t-statistic is significant at a 1% level, it is given two asterisks (**).4. These measurements only have 4 observations, so the results are not reported. Three of them are statistically insignificant and the fourth shows a significant decline in the number of subsequent trouble reports per 100 lines (i.e. improved Pacific performance).
Number of Trouble Reports Per 100 Lines
60

R.01-09-001, I.01-09-002 COM/SK1/MP1/bb1
Trend in Verizon ARMIS PerformanceSource: ARMIS 43-05
Measures for which a Negative Coefficient is Indicative of Better Performance
Measurement Subject Measurement Group Covered Coefficient1 T-statistic3 R-squaredNumber of
Observations
Initial Trouble Reports Residence -0.67 (-2.89)* 0.48 11Business -0.60 (-6.74)** 0.83 11
Repeat Trouble Reports Residence -0.16 (-3.66)** 0.60 11Business -0.13 (-2.82)* 0.47 11
Initial Out-of-Service Residence -0.01 (-0.14) 0.00 8Business -0.30 (-4.16)** 0.74 8
Repeat Out-of-Service Residence 0.00 (0.02) 0.00 8Business -0.11 (-1.34) 0.23 8
Initial All Other Trouble Reports Residence -0.12 (-1.45) 0.26 8Business -0.55 (-8.37)** 0.92 8
Repeat All Other Trouble Reports Residence -0.02 (-1.22) 0.20 8Business -0.11 (-7.47)** 0.90 8
Repair Interval Initial Out-of-Service Residence 0.44 (1.01) 0.15 8Business -0.13 (-0.85) 0.11 8
Repeat Out-of-Service Residence 0.60 (1.45) 0.26 8Business 0.08 (0.47) 0.03 8
Initial All Other Residence 0.69 (2.55)* 0.52 8Business 0.02 (0.19) 0.00 8
Repeat All Other Residence 0.77 (2.54)* 0.52 8Business 0.16 (0.97) 0.14 8
Installation Average Installation Interval Residence -0.20 (-0.92) 0.12 8Business -0.17 (-0.64) 0.06 8
Switch Downtime Downtime per Switch Down Total2 7.95 (4.28)** 0.67 11Switches Down per Switch Total2 -0.01 (-4.02)** 0.64 11
Number of Occurrences Under Two Minutes per Switch Total2 -0.04 (-4.63)** 0.70 11Percent Unscheduled (under two minutes) Total2 0.05 (3.65)** 0.60 11
Measures for which a Positive Coefficient is Indicative of Better Performance
Measurement Subject Measurement Group Covered Coefficient1 T-statistic3 R-squaredNumber of
ObservationsInstallation Installation Commitments Met Residence -0.05 (-0.69) 0.05 11
Business -0.05 (-0.43) 0.02 11
Notes:
2. Total is derived by summing the total of the Metropolitan Statistical Areas and the total of non-Metropolitan Statistical Areas.3. If a t-statistic is significant at a 5% level, it is given an asterisk (*). If a t-statistic is significant at a 1% level, it is given two asterisks (**).
Number of Trouble Reports Per 100 Lines
1. These coefficients were derived by estimating a regression of Verizon's performance on a linear time trend.
61

R.01-09-001, I.01-09-002 COM/SK1/MP1/bb1
Comparison of Pacific ARMIS Performance with the Reference Group ARMIS PerformanceSource: ARMIS 43-05
Measures for which a Negative Coefficient is Indicative of Better Performance
Measurement Subject Measurement Group Covered Coefficient1 T-statistic3 R-squaredNumber of
Observations
Initial Trouble Reports Residence -7.16 (-4.78)** 0.53 22Business -5.51 (-4.84)** 0.54 22
Repeat Trouble Reports Residence -1.68 (-8.79)** 0.79 22Business -0.85 (-3.67)** 0.4 22
Initial Out-of-Service Residence -3.28 (-4.41)** 0.58 16Business -3.01 (-7.39)** 0.8 16
Repeat Out-of-Service Residence -0.97 (-5.16)** 0.66 16Business -0.74 (-6.92)** 0.77 16
Initial All Other Trouble Reports Residence -2.79 (-3.56)** 0.48 16Business -2.35 (-4.55)** 0.6 16
Repeat All Other Trouble Reports Residence -0.86 (-8.04)** 0.82 16Business -0.37 (-3.11)** 0.41 16
Repair Interval Initial Out-of-Service Residence 12.76 (3.50)** 0.47 16Business -1.41 (-1.45) 0.13 16
Repeat Out-of-Service Residence 15.08 (4.6)** 0.6 16Business -0.04 (-0.04) 0 16
Initial All Other Residence 11.50 (2.9)* 0.38 16Business 0.18 (0.11) 0 16
Repeat All Other Residence 12.19 (3.22)** 0.43 16Business 1.82 (1.25) 0.1 16
Installation Average Installation Interval Residence -0.03 (-0.11) 0 16Business 0.60 (1.65) 0.16 16
Switch Downtime Downtime per Switch Down Total2 -14.10 (-4.21)** 0.46 22
Measures for which a Positive Coefficient is Indicative of Better Performance
Measurement Subject Measurement Group Covered Coefficient1 T-statistic3 R-squaredNumber of
ObservationsInstallation Installation Commitments Met Residence 0.27 (2.02) 0.17 22
Business 1.05 (2.84)* 0.29 22
Notes:
2. Total is derived by summing the total of the Metropolitan Statistical Areas and the total of non-Metropolitan Statistical Areas.3. If a t-statistic is significant at a 5% level, it is given an asterisk (*). If a t-statistic is significant at a 1% level, it is given two asterisks (**).
Number of Trouble Reports Per 100 Lines
1. These coefficients are the estimates of the difference between the average performance of Pacific and the reference group and they are derived by estimating a regression with a dummy variable with value 1 if data belongs to Pacific and 0 if the reference group. A negative coefficient indicates that the average performance of Pacific has a lower value. For measures for which a negative coefficient is indicative of better performance, a negative coefficient implies that Pacific's average performance is better than that of the reference group. For measures for which a positive coefficient is indicative of better performance, a negative coefficient implies that Pacific's average performance is worse than that of the reference group.
62

R.01-09-001, I.01-09-002 COM/SK1/MP1/bb1
Comparison of Verizon ARMIS Performance with the Reference Group ARMIS PerformanceSource: ARMIS 43-05
Measures for which a Negative Coefficient is Indicative of Better Performance
Measurement Subject Measurement Group Covered Coefficient1 T-statistic3 R-squaredNumber of
Observations
Initial Trouble Reports Residence -11.35 (-7.10)** 0.72 22Business -3.8 (-3.40)** 0.37 22
Repeat Trouble Reports Residence -3.08 (-11.93)** 0.88 22Business -0.88 (-3.73)** 0.41 22
Initial Out-of-Service Residence -8.77 (-25.88)** 0.98 16Business -3.71 (-7.84)** 0.81 16
Repeat Out-of-Service Residence -2.31 (-14.38)** 0.94 16Business -0.72 (-3.23)** 0.43 16
Initial All Other Trouble Reports Residence -1.87 (-3.18)** 0.42 16Business 0.65 (0.95) 0.06 16
Repeat All Other Trouble Reports Residence -1.21 (-17.26)** 0.96 16Business -0.21 (-1.67) 0.17 16
Repair Interval Initial Out-of-Service Residence -6.73 (-4.99)** 0.64 16Business -5.48 (-7.25)** 0.79 16
Repeat Out-of-Service Residence -6.68 (-4.83)** 0.62 16Business -5.77 (-7.61)** 0.81 16
Initial All Other Residence -13.37 (-6.34)** 0.74 16Business -6.15 (-5.06)** 0.65 16
Repeat All Other Residence -13.59 (-7.33)** 0.79 16Business -7.22 (-6.78)** 0.77 16
Installation Average Installation Interval Residence 0.46 (0.85) 0.05 16Business 1.32 (1.97) 0.22 16
Switch Downtime Downtime per Switch Down Total2 12.9 1.29 0.08 22
Measures for which a Positive Coefficient is Indicative of Better Performance
Measurement Subject Measurement Group Covered Coefficient1 T-statistic3 R-squaredNumber of
ObservationsInstallation Installation Commitments Met Residence 0.22 (0.86) 0.04 22
Business -0.48 (-1.02) 0.05 22
Notes:
2. Total is derived by summing the total of the Metropolitan Statistical Areas and the total of non-Metropolitan Statistical Areas.3. If a t-statistic is significant at a 5% level, it is given an asterisk (*). If a t-statistic is significant at a 1% level, it is given two asterisks (**).
Number of Trouble Reports Per 100 Lines
1. These coefficients are the estimates of the difference between the average performance of Verizon and the reference group and they are derived by estimating a regression with a dummy variable with value 1 if data belongs to Verizon and 0 if the reference group. A negative coefficient indicates that the average performance of Verizon has a lower value. For measures for which a negative coefficient is indicative of better performance, a negative coefficient implies that Verizon's average performance is better than that of the reference group. For measures for which a positive coefficient is indicative of better performance, a negative coefficient implies that Verizon's average performance is worse than that of the reference group.
63

R.01-09-001, I.01-09-002 COM/SK1/MP1/bb1
Comparison of Verizon ARMIS Performance with Pacific ARMIS PerformanceSource: ARMIS 43-05
Measures for which a Negative Coefficient is Indicative of Better Performance
Measurement Subject Measurement Group Covered Coefficient1 T-statistic3 R-squaredNumber of
Observations
Initial Trouble Reports Residence -4.19 (-3.34)** 0.36 22Business 1.71 (1.79) 0.14 22
Repeat Trouble Reports Residence -1.4 (-6.01)** 0.64 22Business -0.03 (-0.10) 0 22
Initial Out-of-Service Residence -5.49 (-7.6)** 0.81 16Business -0.7 (-2.04) 0.23 16
Repeat Out-of-Service Residence -1.34 (-11.69)** 0.91 16Business 0.02 (0.1) 0 16
Initial All Other Trouble Reports Residence 0.91 (1.55) 0.15 16Business 2.99 (5.43)** 0.68 16
Repeat All Other Trouble Reports Residence -0.35 (-3.88)** 0.52 16Business 0.16 (1.17) 0.09 16
Repair Interval Initial Out-of-Service Residence -19.49 (-5.32)** 0.67 16Business -4.07 (-5.17)** 0.66 16
Repeat Out-of-Service Residence -21.76 (-6.59)** 0.76 16Business -5.73 (-5.93)** 0.72 16
Initial All Other Residence -24.87 (-7.00)** 0.78 16Business -6.32 (-5.75)** 0.7 16
Repeat All Other Residence -25.79 (-7.26)** 0.79 16Business -9.04 (-8.09)** 0.82 16
Installation Average Installation Interval Residence 0.5 (0.96) 0.06 16Business 0.72 (1.2) 0.09 16
Switch Downtime Downtime per Switch Down Total2 27.03 (2.71)* 0.27 22
Measures for which a Positive Coefficient is Indicative of Better Performance
Measurement Subject Measurement Group Covered Coefficient1 T-statistic3 R-squaredNumber of
ObservationsInstallation Installation Commitments Met Residence -0.05 (-0.21) 0 22
Business -1.53 (-3.68)** 0.4 22
Notes:
2. Total is derived by summing the total of the Metropolitan Statistical Areas and the total of non-Metropolitan Statistical Areas.3. If a t-statistic is significant at a 5% level, it is given an asterisk (*). If a t-statistic is significant at a 1% level, it is given two asterisks (**).
Number of Trouble Reports Per 100 Lines
1. These coefficients are the estimates of the difference between the average performance of Verizon and Pacific and they are derived by estimating a regression with a dummy variable with value 1 if data belongs to Verizon and 0 if Pacific. A negative coefficient indicates that the average performance of Verizon has a lower value. For measures for which a negative coefficient is indicative of better performance, a negative coefficient implies that Verizon's average performance is better than that of Pacific. For measures for which a positive coefficient is indicative of better performance, a negative coefficient implies that Verizon's average performance is worse than that of Pacific.
64

R.01-09-001, I.01-09-002 COM/SK1/MP1/bb1
1. The Number of Initial Trouble Reports per 100 Lines: Pacific - Residential and Business Significantly Better than Reference Group, Business Significantly Improving Trend but No Trend for Residential; Verizon - Business and Residential Significantly Better than Reference Group and Trends Improving Significantly
The first ARMIS measure we examine is the number of initial trouble reports for a utility normalized on the number of access lines in the utility. These reports are related to problems that have not been reported within the thirty-day period. The normalization based on the number of access lines allows comparison among carriers and over time.
For residential lines, a visual inspection of the graph below shows that Pacific’s performance exceeds that of the reference group and suggests that it is improving over time. However, the statistical analysis indicates that Pacific’s performance on this measure of residential service does not demonstrate a statistically significant upward or downward trend.73 Pacific’s average residential performance, however, is significantly better than the average of the reference group.74
For business lines, we observe a statistically significant downward trend, which is an indicator of improving performance.75
73 The coefficient is -0.179 with t-statistic -0.69. Although this indicates a slight decrease in the number of trouble reports over time, it is not significant at 1% or 5% level (R-square: 0.05, no. of observations: 11). 74 For residential lines, the coefficient is -7.16 with t-statistic -4.78, significant at 1% level (R-square: 0.53, no. of observations: 22).75 The coefficient is -0.609 with t-statistic -5.52, significant at 1% level (R-square: 0.77, no. of observations: 11).
65

R.01-09-001, I.01-09-002 COM/SK1/MP1/bb1
Pacific’s average business performance is significantly better than the average of the reference group.76
0
4
8
12
16
20
24
28
32
36
40
1991 1992 1993 1994 1995 1996 1997 1998 1999 2000 2001
Pacific BellTop Ten AverageVerizon
Residential Initial Trouble Reports per 100 LinesReports per 100
Lines
Year
Good
0
4
8
12
16
20
24
28
32
36
40
1991 1992 1993 1994 1995 1996 1997 1998 1999 2000 2001
Pacific BellTop Ten AverageVerizon
Business Initial Trouble Reports per 100 LinesReports per 100
Lines
Year
Good
7676 For business customers, the coefficient is -5.51 with t-statistic -4.84, significant at 1% level (R-square: 0.54, no. of observations: 22).
66

R.01-09-001, I.01-09-002 COM/SK1/MP1/bb1
Turning now to Verizon, we find that for both residential and business lines, Verizon has demonstrated an improving trend and its average performance is significantly better than the average of the reference group.77 The average performance of Verizon is also better than Pacific for residential lines, but for business lines, the difference between the average performances is not statistically significant.78
In summary, both Pacific and Verizon show good performance on this measure of service quality, initial trouble reports per 100 access lines for both residential and business customers. Verizon exhibits a better record than Pacific.
2. The Number of Repeat Trouble Reports per 100 Lines : Pacific - Residential and Business Significantly Better Than Reference Group, Business Significantly Improving Trend but No Significant Trend for Residential; Verizon - Residential and Business Significantly Better Than Reference Group, Trends for Both Improving SignificantlyThe number of repeat trouble reports per 100 lines are the
reports concerning service quality that are received within thirty days
77 For residential lines, the coefficient is -0.67 with t-statistic -2.89, significant at 5% level (R-square: 0.48, no. of observations: 11). For business lines, the coefficient is -0.6 with t-statistic -6.74, significant at 1% level (R-square: 0.83, no. of observations: 11). In comparison with the reference group, for the residential lines, the coefficient is -11.35 with t-statistic -7.10, significant at 1% level (R-square: 0.72, no. of observations: 22). For the business lines, the coefficient is –3.8, with t-statistic –3.4, significant at 1% level (R-square: 0.37, no. of observations: 22). 78 For residential lines, the coefficient is –4.19 with t-statistic –3.34, significant at 1% level (R-square: 0.36, no. of observations: 22). For business lines, the coefficient is 1.71 with t-statistic 1.79, not significant at 1% or 5% level (R-square: 0.14, no. of observations: 22).
67
R.01-09-001, I.01-09-002 COM/SK1/MP1/bb1
after the resolution of an initial trouble report on the same line. This is a measure of the extent to which a utility has successfully resolved a trouble report on the first try.
A visual inspection of the graph below suggests that Pacific’s number of repeat trouble reports per 100 residential lines has not varied much over the years under review. Statistical analysis confirms our visual impression, and does not demonstrate a statistically significant upward or downward trend for residential lines.79
A visual inspection of the next graph shows that, for business lines, Pacific’s number of repeat trouble reports has improved. Statistical analysis documents this downward trend and finds it statistically significant.80 This leads us to conclude that Pacific’s performance has demonstrated improvement.
Finally, we observe that on both residential and business service, Pacific’s repeat trouble reports appear to fall below the reference group. Our statistical analysis indicates that difference between Pacific and the reference group’s average performances is statistically significant.81 This leads us to conclude that on this measure, Pacific’s performance is better than the reference group.
79 The coefficient is 0.002 with t-statistic 0.05, not significant at 1% or 5% level (R-square: 0.00, no. of observations: 11). 80 The coefficient is -0.183 with a t-statistic -9.87, significant at 1% level (R-square: 0.92, no. of observations: 11). 81 For residential lines, the coefficient is –1.68, with t statistic –8.79, significant at 1% level (R-square: 0.79, no. of observations: 22). For business lines, the coefficient is –0.85, with t-statistic –3.67, significant at 1% level (R-square: 0.40, no. of observations: 22).
68

R.01-09-001, I.01-09-002 COM/SK1/MP1/bb1
0
1
2
3
4
5
6
7
1991 1992 1993 1994 1995 1996 1997 1998 1999 2000 2001
Pacific BellTop Ten AverageVerizon
Residential Repeat Trouble Reports per 100 LinesReports per 100
Lines
Year
Good
0
1
2
3
4
5
6
7
1991 1992 1993 1994 1995 1996 1997 1998 1999 2000 2001
Pacific BellTop Ten AverageVerizon
Business Repeat Trouble Reports per 100 LinesReports per 100
Lines
Year
Good
69
R.01-09-001, I.01-09-002 COM/SK1/MP1/bb1
Turning now to Verizon, we find a similar story of good and improving service. A visual inspection shows that Verizon’s residential repeat trouble reports is better than the reference group and show a consistent pattern of improvement. For business repeat trouble reports, our visual inspection shows that with exception of 1996, Verizon shows a record of service better than that offered in the reference group. Statistical analysis confirms our visual impression. Verizon has an improving trend for business and residential lines and its average performance is significantly different than the reference group.82 Verizon’s average performance is significantly different (and better) than Pacific for only residential lines.83
In summary, both companies exhibit good service quality on these measures, significantly better than that of the reference group. On average, Verizon’s performance is better than Pacific’s, and this difference is statistically significant for only residential lines.
82 The coefficient for the residential lines is -0.16 with t-statistic -3.66, significant at 1% level (R-square: 0.60, no. of observations: 11). The coefficient for business lines is -0.13 with a t-statistic -2.82, significant at 5% level (R-square: 0.47, no. of observations: 11). In comparison with the reference group, for residential lines, the coefficient is –3.08 with t-statistic –11.93, significant at 1% level (R-square: 0.88, no. of observations: 22). For business lines, the coefficient is –0.88 with t-statistic –3.73, significant at 1% level (R-square: 0.41, no. of observations: 22).83 For residential lines, the coefficient is –1.4 with t-statistic –6.01, significant at 1% level (R-square: 0.64, no. of observations: 22). For business lines, the coefficient is –0.03, with t-statistic –0.10, not significant at 1% or 5% level (R-square:0, no. of observations: 22).
70

R.01-09-001, I.01-09-002 COM/SK1/MP1/bb1
3. The Number of Initial Out-of-Service Trouble Reports per 100 Lines: Pacific - Residential and Business Significantly Better Than Reference Group and No Significant Trend for Either; Verizon - Residential and Business Significantly Better Than Reference Group, Business Trend Improving Significantly, No Significant Trend for Residential The initial out-of-service trouble reports refer to the troubles
that cause the customer to be totally without telephone service. A visual inspection of the graphs below suggests that Pacific’s residential performance improved since 1997 and its business performance does not exhibit an upward or downward trend, and both appear better than the reference group. Our statistical analysis shows Pacific’s performance does not exhibit a statistically significant upward or downward trend for either business or residential measures.84 Pacific’s average performance has been significantly better than the average of the reference group.85
84 For residential lines, the coefficient is –0.012 with t-statistic -0.04, not significant at 1% level or 5% level (R-square: 0.00, no. of observations: 8). Similarly, for business lines, the coefficient is -0.024, with a t-statistic of -0.29, not significant at 1% or 5% level (R-square: 0.01, no. of observations: 8).85 For residential lines, the coefficient is –3.28 with t-statistic –4.41, significant at 1% level (R-square: 0.58, no. of observations: 16). For business lines, the coefficient is –3.01 with t-statistic –7.39, significant at 1% level (R-square: 0.80, no. of observations: 16).
71

R.01-09-001, I.01-09-002 COM/SK1/MP1/bb1
0
2
4
6
8
10
12
14
16
18
20
1991 1992 1993 1994 1995 1996 1997 1998 1999 2000 2001
Pacific BellTop Ten AverageVerizon
Residential Initial Out-of-Service Trouble Reports per 100 LinesReports per 100
Lines
Year
Good
0
2
4
6
8
10
12
14
16
18
20
1991 1992 1993 1994 1995 1996 1997 1998 1999 2000 2001
Pacific BellTop Ten AverageVerizon
Business Initial Out-of-Service Trouble Reports per 100 LinesReports per 100
Lines
Year
Good
72

R.01-09-001, I.01-09-002 COM/SK1/MP1/bb1
A visual inspection of the graphs above indicates that Verizon’s performance is better than the reference group, and better than Pacific’s for both residential and business lines. Moreover, a visual inspection suggests that for business lines, Verizon shows a record of improvement over time. A statistical analysis confirms our visual conclusions. Verizon’s performance exhibits a declining trend for its business lines, which indicates an improving performance.86 Our analysis finds no statistically significant upward or downward trend in Verizon’s performance for residential lines.87 Verizon’s average performance has been better than the average of the reference group.88 It also outperformed Pacific for residential lines.89
4. The Number of Repeat Out-of-Service Trouble Reports per 100 Lines: Pacific - Residential and Business Significantly Better Than Reference Group, Business Trend Improving Significantly and No Significant Trend for Residential; Verizon - Residential and Business Significantly Better Than Reference Group and No Significant Trend for EitherA visual inspection of the graphs below shows that Pacific’s
performance for residential lines does not exhibit a downward or upward trend, while its performance for business lines shows a slightly downward trend. Pacific’s performance in both categories 86 The coefficient is -0.3 with a t-statistic -4.16, significant at 1% level (R-square: 0.74, no. of observations: 8). 87 The coefficient is –0.01 with t-statistic –0.14, not significant at 1% or 5% level (R-square: 0.00, no. of observations: 8).88 For residential lines, the coefficient is –8.77 with t-statistic –25.88, significant at 1% level (R-square: 0.98, no. of observations: 16). For business lines, the coefficient is –3.71, with t-statistic –7.84, significant at 1% level (R-square: 0.81, no. of observations: 16). 89 For residential lines, the coefficient is –5.49 with t-statistic –7.6, significant at 1% level (R-square: 0.81, no. of observations: 16). For business lines, the coefficient is –0.7, with t-statistic –2.04, not significant at 1% or 5% level (R-square: 0.23, no. of observations: 16).
73

R.01-09-001, I.01-09-002 COM/SK1/MP1/bb1
appear better than that of the reference group. Our statistical analysis confirms both these impressions. Pacific’s performance does not demonstrate a statistically significant upward or downward trend for residential lines, but its performance exhibits improvement in business lines.90 Pacific’s average performance is significantly better than the average of the reference group.91
0
1
2
3
4
5
1991 1992 1993 1994 1995 1996 1997 1998 1999 2000 2001
Pacific BellTop Ten AverageVerizon
Residential Repeat Out-of-Service Trouble Reports per 100 LinesReports per 100
Lines
Year
Good
90 The coefficient is –0.02 with t-statistic -0.41, not significant at 1% or 5% level (R-square: 0.03, no. of observations: 8). For business lines, the coefficient is –0.03 with t-statistic -3.56, significant at 5% level (R-square: 0.68, no. of observations: 8).91For residential lines, the coefficient is -0.97 with t-statistic –5.16, significant at 1% level (R-square: 0.66, no. of observations: 16). For business lines, the coefficient is –0.74, with t-statistic –6.92, significant at 1% level (R-square: 0.77, no. of observations: 16).
74

R.01-09-001, I.01-09-002 COM/SK1/MP1/bb1
0
1
2
3
4
5
1991 1992 1993 1994 1995 1996 1997 1998 1999 2000 2001
Pacific BellTop Ten AverageVerizon
Business Repeat Out-of-Service Trouble Reports per 100 LinesReports per 100
Lines
Year
Good
A visual inspection indicates that Verizon’s performance is far better than the reference group for the residential customers and it is better than the reference group for the business customers except in 1996. Verizon’s performance does not exhibit any upward or downward trend in this area.92 Verizon’s average performance is statistically different than the reference group for both residential and
92 The coefficient is zero with t-statistic 0.02 for residential lines, not significant at 1% or 5% level (R-square: 0.00, no. of observations: 8). For business lines, the coefficient is -0.11 with t-statistic of -1.34, not significant at 1% or 5% level (R-square: 0.23, no. of observations: 8).
75

R.01-09-001, I.01-09-002 COM/SK1/MP1/bb1
the business lines.93 Verizon’s average performance was also better than Pacific for residential lines but not for the business lines.94
In all years except one, both Pacific and Verizon fared better than the reference group. Verizon performed better than Pacific in all years except 1994 and 1996 for business lines.
5. The Number of Subsequent Initial Trouble Reports and Subsequent Repeat Trouble Reports: Insufficient ObservationsPacific reported only four observations for each of these
measures and stated that the trends were not statistically significant, except for the number of subsequent trouble reports per 100 lines, i.e., Pacific’s performance has improved.95Verizon had also only four observations; therefore we did not check for the statistical significance of the trend.
6. The Number of Initial All Other Trouble Reports per 100 Lines: Pacific - Residential and Business Significantly Better Than Reference Group, Business Trend Improving Significantly, but Residential Trend Worsening Verizon - Residential Significantly Better Than Reference Group, Business Indistinguishable From Reference Group, Business Trend Improving Significantly but No Significant Trend for ResidentialThese reports refer to the complaints concerning static,
interrupted calls, and etc. For residential lines, a visual inspection of the graphs below shows that Pacific’s performance is deteriorating
93 For residential lines, the coefficient is –2.31 with t-statistic –14.38, significant at 1% level (R-square: 0.94, no. of observations: 16). For business lines, the coefficient is –0.72 with t-statistic –3.23, significant at 1% level (R-square: 0.43, no. of observations: 16).94 For residential lines, the coefficient is –1.34 with t-statistic –11.69, significant at 1% level (R-square: 0.91, no. of observations: 16). For business lines, the coefficient is 0.02 with t-statistic 0.10, not significant at 1% or 5% level (R-square: 0.00, no. of observations: 16).95 See Footnote 4 in Trend in Pacific Bell ARMIS Performance table.
76

R.01-09-001, I.01-09-002 COM/SK1/MP1/bb1
while for business lines it is improving. Pacific has been performing better than the reference group for business lines, but for residential lines it performed worse than the reference group in 1999 and 2000. Our statistical analysis confirms these results and shows that Pacific’s performance exhibits an upward trend in the number of initial all other trouble reports for residential lines and a downward trend for business lines.96 Pacific’s average performance, however, is significantly better than that of the reference group.97
0
3
6
9
12
15
1991 1992 1993 1994 1995 1996 1997 1998 1999 2000 2001
Pacific BellTop Ten AverageVerizon
Residential Initial All-Other Trouble Reports per 100 LinesReports per 100
Lines
Year
Good
96 For residential lines, the coefficient is 0.502 with t-statistic 3.14, significant at 5% level (R-square: 0.62, no. of observations: 8). For business lines, the coefficient is -0.231 with t-statistic -4.16, significant at 1% level (R-square: 0.74, no. of observations: 8). 97 For residential lines, the coefficient is –2.79 with t-statistic –3.56, significant at 1% level (R-square: 0.48, no. of observations: 16). For business lines, the coefficient is –2.35 with t-statistic –4.55, significant at 1% level (R-square: 0.60, no. of observations: 16).
77

R.01-09-001, I.01-09-002 COM/SK1/MP1/bb1
0
3
6
9
12
15
1991 1992 1993 1994 1995 1996 1997 1998 1999 2000 2001
Pacific BellTop Ten AverageVerizon
Business Initial All-Other Trouble Reports per 100 LinesReports per 100
Lines
Year
Good
Our visual inspection indicates that Verizon has performed better than the reference group for residential lines but its performance was worse than the reference group for business lines. Verizon’s performance for the residential lines did not exhibit any upward or downward trend, but its performance for business lines shows improvement.98 Its performance for residential lines is statistically better than the reference group for the residential lines, but we did not observe any statistically significant difference for the
98 For residential lines, the coefficient is –0.12 with t-statistic –1.45, not significant at 5% or 1% level (R-square: 0.26, no. of observations: 8). For business lines, the coefficient is –0.55 with t-statistic –8.37, significant at 1% level (R-square: 0.92, no. of observations: 8).
78

R.01-09-001, I.01-09-002 COM/SK1/MP1/bb1
business lines.99 Verizon’s average performance is not significantly different than Pacific for residential lines, but for business lines we observe a significant difference, i.e., Pacific’s performance is better than Verizon’s. 100
In summary, for residential lines, Verizon performed better than the reference group and Pacific performed better than the reference group until 1999. For business lines, Pacific performed better than both the reference group and Verizon, while Verizon failed to match the performance of the reference group.
7. The Number of Repeat All Other Trouble Reports per 100 Lines: Pacific - Residential and Business Significantly Better Than Reference Group, Business Trend Improving Significantly, but Residential Worsening; Verizon - Residential Significantly Better Than Reference Group but Business Indistinguishable From Reference Group, Business Trend Improving Significantly but No Significant Trend for ResidentialWe observe that Pacific’s performance is deteriorating for
residential lines and improving for business lines. The statistical analysis confirms that Pacific’s performance exhibits an upward trend in the number of repeat all other trouble reports for residential lines and a downward trend for business lines.101 Yet, Pacific’s average 99 The coefficient is –1.87 with t-statistic –3.18, significant at 1% level (R-square: 0.42, no. of observations: 16). The coefficient is 0.65 with t-statistic 0.95, not significant at 1% or 5% level (R-square: 0.06, no. of observations: 16).100 The coefficient is 0.91 with t-statistic 1.55, not significant at 1% or 5% level (R-square: 0.15, no. of observations: 16). The coefficient is 2.99 with t-statistic 5.43, significant at 1% level (R-square: 0.68, no. of observations: 16).101 For residential lines, the coefficient is 0.077 with t-statistic 3.05, significant at 5% level (R-square: 0.61, no. of observations: 8). For business
79

R.01-09-001, I.01-09-002 COM/SK1/MP1/bb1
performance is significantly better than the average of the reference group for both residential and business measures.102
0
1
2
3
4
5
1991 1992 1993 1994 1995 1996 1997 1998 1999 2000 2001
Pacific BellTop Ten AverageVerizon
Residential Repeat All-Other Trouble Reports per 100 LinesReports per 100
Lines
Year
Good
lines, the coefficient is –0.098 with t-statistic 5.62, significant at 1% level (R-square: 0.84, no. of observations: 8).102 For residential lines, the coefficient is –0.86 with t-statistic –8.04, significant at 1% level (R-square: 0.82, no. of observations: 16). For business lines, the coefficient is –0.37 with t-statistic –3.11, significant at 1% level (R-square: 0.41, no. of observations: 16).
80

R.01-09-001, I.01-09-002 COM/SK1/MP1/bb1
0
1
2
3
4
5
1991 1992 1993 1994 1995 1996 1997 1998 1999 2000 2001
Pacific BellTop Ten AverageVerizon
Business Repeat All-Other Trouble Reports per 100 LinesReports per 100
Lines
Year
Good
Verizon’s performance did not exhibit any upward or downward trend for residential lines, but showed improvement for business lines.103 Verizon’s average performance is significantly better than the reference group for residential lines, but not for the business lines.104 Verizon’s average performance is better than Pacific for residential line but not for the business lines.105
103 For residential lines, the coefficient is –0.02 with t-statistic –1.22, not significant at 1% or 5% level (R-square: 0.20, no. of observations: 8). For business lines, the coefficient is –0.11 with t-statistic –7.47, significant at 1% level (R-square: 0.90, no. of observations: 8).104 For residential lines, the coefficient is –1.21 with t-statistic –17.26, significant at 1% level (R-square: 0.96, no. of observations: 16). For business lines, the coefficient is –0.21 with t-statistic –1.67, not significant at 1% or 5% level (R-square: 0.16, no. of observations: 16).105 For residential lines, the coefficient is –0.35 with t-statistic –3.88, significant at 1% level (R-square: 0.52, no. of observations: 16). For business lines, the coefficient is 0.16 with t-statistic 1.17, not significant at 1% or 5% level (R-square: 0.09, no. of observations: 16).
81

R.01-09-001, I.01-09-002 COM/SK1/MP1/bb1
8. Initial Out of Service Repair Interval (in hours): Pacific - Residential Significantly Below Reference Group and Business Indistinguishable From Reference Group, No Significant Trends for Either; Verizon - Residential and Business Significantly Better Than Reference Group, No Significant Trends for Either On the initial out of service repair interval, Pacific’s record is
far different than the one developed on other measures, and it has been an area of recent Commission investigations.
In D.01-12-021, the Commission noted that Pacific’s “average initial repair interval for residential customers increased 45 percent between 1996 and 2000” (with its residential repeat trouble reports per 100 lines peaking in 1998106) and that in “every year since 1996, Pacific’s mean time to restore service to residential customers [was] higher than the 1996 base year.”107 The Commission found “a sharp decline in service quality of nearly 50% over a mere four years coupled with Pacific’s knowledge thereof and its lack of an attempt to remedy the deterioration.”108 We concluded that, “The Commission cannot find that SBC Pacific’s service quality is excellent when the initial out-of-service repair intervals for residential customers has (sic) increased 45% since 1996.”109
Pacific’s results improved beginning in 2001,110 with the exception of November 2002.111 Furthermore, in D.01-12-021, the Commission instituted a system of automatic penalties if Pacific’s
106 Exh. 2B:354, Attachment 16 (Hauser Direct Testimony).107 D.01-02-021, mimeo., at 8 & n.4; see also TURN Opening/Service Quality at 19.108 D.01-02-021, mimeo., at 11.109 Id. at 48.110 TURN, however, notes that ORA filed a complaint against Pacific in November 2000.
82

R.01-09-001, I.01-09-002 COM/SK1/MP1/bb1
repair times failed to meet standards established by that decision. Pacific’s record on this matter appears to illustrate the basic business school platitude that one gets what one measures. Indeed, we have so opined in other contexts: “Pacific Bell has exhibited a pattern of regulatory compliance during periods of special oversight, only to be followed by noncompliance in furtherance of Pacific Bell's revenue goals when the special oversight ends.”112 We conclude that our vigilance and enforcement can help ensure good service quality.
Our visual inspection of Pacific’s residential initial out of service interval indicates an upward trend with the data doubling between 1994 and 1998. Between 1998 and 2001, the data nearly declines as mush as the prior increase. In contrast to residential, there is no observable trend change in the business initial out-of-service repair interval. When fitted with a straight line, the statistical analysis does not indicate any significant upward or downward trend in Pacific’s performance in initial out-of-service repair intervals for business and residential customer groups.113 We note that the data begins to decline in 1999, a year prior to the ORA complaint filing. We cannot conclude to what effect, if any, initiation of the complaint proceeding had on the measure. However, we cannot alternatively conclude that
111 For November 2002, Pacific’s initial out of service repair interval for residential customers of 42.49 hours exceeds by more than 13 hours the standard of 29.3 hours established in D.01-12-021. Pacific attributes its missed objective to weather. Report of November 2002 ARMIS Data for Repair Intervals in Compliance with D.01-12-021.112 D.01-09-058, 2001 Cal. PUC LEXIS 914, at *146, finding of fact 62.113 For residential lines, the coefficient is 1.328 with t-statistic 0.85, not significant at 1% or 5% level (R-square: 0.11, no. of observations: 8). For business lines, the coefficient is 0.204 with t-statistic 0.63, not significant at 1% or 5% level (R-square: 0.06, no. of observations: 8).
83

R.01-09-001, I.01-09-002 COM/SK1/MP1/bb1
the upward trend was influence by NRF or by factors outside the utilities control. The statistical analysis we use in this decision does not seek to explain the trend – only to identify its presence. In Phase 3B we will determine whether it is possible to and whether we should fashion a reasonable remedy to this.
Pacific’s average performance is significantly worse than the reference group for residential lines, but the difference is not significant for the business lines.114 This leads us to the conclusion that Pacific’s residential initial out of service interval lags behind national standards. Since, however, we see no statistically significant time trend and a visual pattern of service erosion followed by improvement, it is not reasonable to attribute any of the change in residential initial out of service interval to NRF regulation.
0
5
10
15
20
25
30
35
40
45
50
55
1991 1992 1993 1994 1995 1996 1997 1998 1999 2000 2001
Pacific BellTop Ten AverageVerizon
Residential Initial Out-of-Service Repair Interval
Year
Good
Hours
114 For residential lines, the coefficient is 12.76 with t-statistic 3.50, significant at 1% level (R-square: 0.47, no. of observations: 16). For business lines, the coefficient is –1.41 with t-statistic –1.45, not significant at 1% or 5% level (R-square: 0.13, no. of observations: 16).
84

R.01-09-001, I.01-09-002 COM/SK1/MP1/bb1
0
5
10
15
20
25
30
35
40
45
50
55
1991 1992 1993 1994 1995 1996 1997 1998 1999 2000 2001
Pacific BellTop Ten AverageVerizon
Business Initial Out-of-Service Repair IntervalHours
Year
Good
Our visual inspection indicates deterioration in Verizon’s performance for residential lines, but its performance did not exhibit a statistically significant upward or downward trend.115 Verizon’s average performance was significantly better than the reference group for residential and the business lines.116 Furthermore, Verizon’s
115 For residential lines, the coefficient is 0.44 with t-statistic 1.01, not significant at 1% or 5% level (R-square: 0.15, no. of observations: 8). For business lines, the coefficient is –0.13 with t-statistic –0.85, not significant at 1% or 5% level (R-square: 0.11, no. of observations: 8).116 For residential lines, the coefficient is –6.73 with t-statistic –4.99, significant at 1% level (R-square: 0.64, no. of observations: 16). For business lines, the coefficient is –5.48 with t-statistic –7.25, significant at 1% level (R-square: 0.79, no. of observations: 16).
85

R.01-09-001, I.01-09-002 COM/SK1/MP1/bb1
average performance is significantly better than Pacific.117 Since Verizon’s performance is better than Pacific’s and better than the reference group, we have no reason to attribute either trends in or the level of Pacific’s initial out of service interval to the introduction of NRF regulation.
9. Repeat out-of-service repair interval (in hours): Pacific - Residential Significantly Worse Than Reference Group, Business Indistinguishable From Reference Group, No Significant Trend for Either; Verizon Residential and Business Significantly Better Than Reference Group, No Significant Trend for EitherOur visual inspection of the charts below indicates that Pacific’s
performance for residential nearly doubled between 1994 and 1998 then improved from the peak in 1999 and 2001, in contrast to business, which exhibits little variation. In fitting a straight line, the statistical test does not indicate any significant upward or downward trend in Pacific’s performance in repeat out-of-service repair intervals for business and residential customer groups.118 Pacific’s average performance is significantly worse than the reference group for residential lines but better for the business lines, however, the difference is not statistically significant for business lines.119 The fact that both the residential initial out of service interval and residential 117 For residential lines, the coefficient is –19.49 with t-statistic –5.32, significant at 1% level (R-square: 0.67, no. of observations: 16). For business lines, the coefficient is –4.07 with t-statistic –5.17, significant at 1% level (R-square: 0.66, no. of observations: 16).118 For residential lines, the coefficient is 0.855 with t-statistic 0.59, not significant at 1% or 5% level (R-square: 0.06, no. of observations: 8). For business lines, the coefficient is 0.234 with t-statistic 0.58, not significant at 1% or 5% level (R-square: 0.05, no. of observations: 8).119 For residential lines, the coefficient is 15.08 with t-statistic 4.6, significant at 1% level (R-square: 0.60, No. of observations: 16). For business lines, the coefficient is –0.04 with t-statistic –0.04, not significant at 1% or 5% level (R-square: 0.00, no. of observations: 16).
86

R.01-09-001, I.01-09-002 COM/SK1/MP1/bb1
repeat out of service interval statistically exceed that of the reference group indicates that Pacific has a problem with this particular operation.
0
5
10
15
20
25
30
35
40
45
50
55
1991 1992 1993 1994 1995 1996 1997 1998 1999 2000 2001
Pacific Bell
Top TenAverageVerizon
Business Repeat Out-of-Service Repair IntervalHours
Year
Good
87
0
5
10
15
20
25
30
35
40
45
50
55
1991 1992 1993 1994 1995 1996 1997 1998 1999 2000 2001
Pacific BellTop Ten AverageVerizon
Residential Repeat Out-of-Service Repair Interval
Hours
Year
Good

R.01-09-001, I.01-09-002 COM/SK1/MP1/bb1
Verizon also did not exhibit any statistically significant upward or downward trend for residential and business lines.120 For both the residential and business lines, Verizon’s performance was significantly better than the reference group.121 Verizon’s average performance was significantly better than Pacific for residential and business lines.122
10. Initial all other repair interval (in hours): Pacific - Residential Significantly Worse Than Reference Group but No Significant Trend, Business Indistinguishable From Reference Group but Significant Improving Trend; Verizon Residential and Business Better Than Reference Group, but Significant Worsening Trend for Residential and No Significant Trend for Business“Initial all other repair interval” is a grab-bag measure that
captures repair intervals not covered in the prior categories. On this measure, Pacific’s performance data appears to trend
upward and double between 1994 and 1997, then trend downward between 1997 and 2001. As a visual review of the graph below illustrates, Pacific has performed worse than the reference group
120 For residential lines, the coefficient is 0.6 with t-statistic 1.45, not significant at 1% or 5% level (R-square: 0.26, no. of observations: 8). For business lines, the coefficient is 0.08 with t-statistic 0.47, not significant at 1% or 5% level (R-square: 0.03, no. of observations: 8).121 For residential lines, the coefficient is –6.68 with t-statistic –4.83, significant at 1% level (R-square: 0.62, no. of observations: 16). For business lines, the coefficient is –5.77 with t-statistic –7.61, significant at 1% level (R-square: 0.80, no. of observations: 16).122 The coefficient is –21.76 with t-statistic –6.59, significant at 1% level (R-square: 0.76, no. of observations: 16). The coefficient is –5.73 with t-statistic –5.93, significant at 1% level (R-square: 0.72, no. of observations: 16).
88

R.01-09-001, I.01-09-002 COM/SK1/MP1/bb1
except in 2001. Again, in contrast with residential, Pacific’s performance for business lines appears more stable and exhibits an improving trend. In fitting a straight line, the statistical analysis shows that Pacific does not exhibit an upward or downward trend for residential lines and some improvement is observed for business lines.123 Pacific’s average performance for residential initial all other repair interval was statistically worse than the reference group. However, for business service, Pacific’s performance was not statistically different than the reference group.124
0
5
10
15
20
25
30
35
40
45
50
55
1991 1992 1993 1994 1995 1996 1997 1998 1999 2000 2001
Pacific BellTop Ten AverageVerizon
Residential Initial All-Other Repair IntervalHours
Year
Good
123 For residential lines, the coefficient is 0.073 with t-statistic 0.05, not significant at 1% or 5% level (R-square: 0.00, no. of observations: 8). For business lines, the coefficient is –0.875 with t-statistic 2.49, significant at 5% level (R-square: 0.51, no. of observations: 8).124 For residential lines, the coefficient is 11.50 with t-statistic 2.9, significant at 5% level (R-square: 0.38, no. of observations: 16). For business lines, the coefficient is 0.18 with t-statistic 0.11, not significant at 1% or 5% level (R-square: 0.00, no. of observations: 16).
89

R.01-09-001, I.01-09-002 COM/SK1/MP1/bb1
0
5
10
15
20
25
30
35
40
45
50
55
1991 1992 1993 1994 1995 1996 1997 1998 1999 2000 2001
Pacific BellTop Ten AverageVerizon
Business Initial All-Other Repair IntervalHours
Year
Good
Over this period, Verizon achieved a much better record of performance. Visual inspection shows that Verizon outperformed the reference group for each measure. Verizon’s performance, however, slightly deteriorated for the residential lines (although remaining better than that of the reference group), but did not exhibit any significant upward or downward trend for the business lines.125 Statistical analysis shows that Verizon’s performance is significantly
125 For residential lines, the coefficient is 0.69 with t-statistic 2.55, significant at 5% level (R-square: 0.52, no. of observations: 8). For business lines, the coefficient is 0.02 with t-statistic 0.19, not significant at 1% or 5% level (R-square: 0.00, no. of observations: 8).
90

R.01-09-001, I.01-09-002 COM/SK1/MP1/bb1
better than the reference group.126 Verizon’s performance is also significantly better than Pacific’s.127
11.Repeat All Other Repair Interval (in hours): Pacific - Residential Significantly Worse Than Reference Group, Business Indistinguishable From Reference Group, No Significant Trend for Either; Verizon - Residential and Business Better Than Reference Group, Significant Worsening Trend for Residential but No Significant Trend for BusinessVisual inspection of the graphs below indicates that Pacific’s
residential repeat all other repair interval fluctuate over the NRF period. All other repair interval nearly doubled from 1994 to 1998, then declined from 1998 to 2001. In fitting a straight line to such a curvilinear trend, the statistical analysis indicates that Pacific’s performance did not demonstrate any upward or downward trend for business and residential lines.128 Pacific’s average performance is significantly worse than the reference group for the residential lines and the difference is not significant for business lines.129
126 For residential lines, the coefficient is –13.37 with t-statistic –6.34, significant at 1% level (R-square: 0.74, no. of observations: 16). For business lines, the coefficient is –6.15 with t-statistic –5.06, significant at 1% level (R-square: 0.65, no. of observations: 16).127 For residential lines, the coefficient is –24.87 with t-statistic –7.00, significant at 1% level (R-square: 0.78, no. of observations: 16). For business lines, the coefficient is –6.32 with t-statistic –5.75, significant at 1% level (R-square: 0.70, no. of observations: 16).128 For residential lines, the coefficient is 0.495 with t-statistic 0.31, not significant at 1% or 5% level (R-square: 0.00, no. of observations: 8). For business lines, the coefficient is –0.752 with t-statistic 1.92, not significant at 1% or 5% level (R-square: 0.38, no. of observations: 8).129 For residential lines, the coefficient is 12.19 with t-statistic 3.22, significant at 1% level (R-square: 0.43, no. of observations: 16). For business lines, the coefficient is 1.82 with t-statistic 1.25, not significant at 1% or 5% level (R-square: 0.10, no. of observations: 16).
91

R.01-09-001, I.01-09-002 COM/SK1/MP1/bb1
Pacific showed a high level of repeat problems shortly after making an initial repair. In 2000, at least 2.73% of residential repeat out-of-service repairs occurred within 24 hours of a previous repair; the number in 2001 was 2.38%. In 2001, the number of repeat problems within one week of a previous repair was 6.76%, 8.84% within two weeks, and 10.10% within three weeks.130 It may be that these figures represented different problems for the same customers. Whatever the problem is, however, these high numbers certainly affected customers. The disruption caused by a repair is probably one of the more serious events that can occur in a carrier’s relationship with its customers. A second repair within such a short time is an even more serious disruption.
0
5
10
15
20
25
30
35
40
45
50
55
1991 1992 1993 1994 1995 1996 1997 1998 1999 2000 2001
Pacific BellTop Ten AverageVerizon
Residential Repeat All-Other Repair IntervalHours
Year
Good
130 Ex. 2B:133 at 13 (Hieta Opening Testimony). According to its witness, ORA based these figures on an analysis of raw repair data Pacific furnished ORA. Pacific used the raw repair data to calculate ARMIS numbers for the years 2000 and 2001. Id. at 12.
92

R.01-09-001, I.01-09-002 COM/SK1/MP1/bb1
0
5
10
15
20
25
30
35
40
45
50
55
1991 1992 1993 1994 1995 1996 1997 1998 1999 2000 2001
Pacific Bell
Top TenAverageVerizon
Business Repeat All-Other Repair IntervalHours
Year
Good
Verizon performance exhibits an upward trend for the residential customers, but its performance exhibits no significant change for the business lines.131 Verizon’s average performance is significantly better than the reference group.132 It is also significantly better than Pacific.133
131 For residential lines, the coefficient is 0.77 with t-statistic 2.54, significant at 5% level (R-square: 0.52, no. of observations: 8). For business lines, the coefficient is 0.16 with t-statistic 0.97, not significant at 1% or 5% level (R-square: 0.14, no. of observations: 8).132 For residential lines, the coefficient is –13.59 with t-statistic –7.33, significant at 1% level (R-square: 0.79, no. of observations: 16). For business lines, the coefficient is –7.22 with t-statistic –6.78, significant at 1% level (R-square: 0.77, no. of observations: 16).133 For residential lines, the coefficient is –25.79 with t-statistic –7.26, significant at 1% level (R-square: 0.79, no. of observations: 16). For business lines, the coefficient is –9.04 with t-statistic –8.09, significant at 1% level (R-square: 0.82, no. of observations: 16).
93

R.01-09-001, I.01-09-002 COM/SK1/MP1/bb1
12.Average Installation Interval: Pacific and Verizon Indistinguishable From Reference Group and No Significant TrendsWith regard to ARMIS data, Pacific claimed that, “both
residential and business installation intervals in 2001 are below the level they were in 1994, the first year the data were reported.”134
According to the data in the following graphs, Pacific’s ARMIS performance on installation intervals (residential and business) was generally consistent over the 1994-2001 period. Pacific’s data were slightly worse than Verizon’s in 2000-01. As the graphs reveal, Pacific’s installation intervals were generally better than Verizon’s during the NRF period, with business installation intervals remaining stable in the 3-4 day range during the entire period 1994-2001. Residence intervals were not as steady, with small spikes in 1995 and 1997, but the overall numbers were generally lower than Verizon’s except in 1994-95 and 2000-01. Concerning the reference group, it is difficult to draw any conclusions based on visual inspection. In some years, Pacific’s performance exceeded that of the reference group, and in some years it did not.
The statistical analysis indicates that Pacific’s performance does not exhibit an upward or downward trend.135 The average performance was not significantly different than the reference group.136
134 Pacific Opening/ Service Quality at 18.135 For residential lines, the coefficient is –0.096 with t-statistic -1.40, not significant at 1% or 5% level (R-square: 0.25, no. of observations: 8). For business lines, the coefficient is –0.079 with t-statistic 1.32, not significant at 1% or 5% level (R-square: 0.22, no. of observations: 8).136 For residential lines, the coefficient is –0.03 with t-statistic –0.11, not significant at 1% or 5% level (R-square: 0.00, no. of observations: 16). For business lines, the coefficient is 0.60 with t-statistic 1.65, not significant at 1% or 5% level (R-square: 0.16, no. of observations: 16).
94

R.01-09-001, I.01-09-002 COM/SK1/MP1/bb1
With respect to Pacific’s installation data, ORA asserted that, “[Pacific’s] ARMIS installation orders also include orders for vertical services such as Caller-ID and call waiting, as well as jack installations, etc. . . [and the] . . . increase in total installation orders reflects both the increased demand for access lines, and demand for new vertical services marketed in California during the mid to late 1990s.”137 ORA alleged that in 1999, for example, Pacific had approximately 10 million more orders for vertical services and other local services only than it did for orders for basic service, and that vertical services orders contributed to the low reported average installation intervals because vertical services orders are completed within a day of placing the order resulting in installation intervals of 0 or 1 day. Pacific includes vertical services orders in its data, as the ARMIS measure clearly requires. Moreover, Pacific can install these services quickly and in automated fashion without dispatching a service technician. Thus, as the percentage of vertical services orders increases, the average installation interval will automatically fall. We have, however, no reason to believe that this trend for Pacific differs from the trends observed in our reference group. While Pacific asserts that “in most cases, Pacific’s recent performance has improved relative to most of the years in which data were reported,”138
it did not show that the improvements in installation intervals were the result of actual improvement in performance instead of the result of an increasing proportion of “short interval” vertical services orders in the mix of installation interval data reported under ARMIS. Although this development makes the interpretation of this measure
137 Exh. 2B:132 at 8 (Young Opening Testimony). 138 Exh. 2B:355 at 9 (Hauser Reply Testimony).
95

R.01-09-001, I.01-09-002 COM/SK1/MP1/bb1
difficult, there is no easy remedy. A vertical service is indeed a service, should be measured, and has been part of this measure for a long time.
0
1
2
3
4
5
1991 1992 1993 1994 1995 1996 1997 1998 1999 2000 2001
Pacific BellTop Ten AverageVerizon
Residential Installation IntervalDays
Year
Good
0
1
2
3
4
5
6
7
1991 1992 1993 1994 1995 1996 1997 1998 1999 2000 2001
Pacific BellTop Ten AverageVerizon
Business Installation IntervalDays
Year
Good
96

R.01-09-001, I.01-09-002 COM/SK1/MP1/bb1
Turning now to Verizon, we note that it too includes vertical services in this measure, as do the reference utilities. With regard to installation intervals, the graph shows that Verizon performed less well than did Pacific for both residence and business installations from 1995-99, and that performance worsened between 1994 and 1998, doubling for residential lines from two to nearly 5 days, and nearly doubling for business from four to nearly seven days. In 2000-01, Verizon’s performance improved: average installation intervals for residence customers decreased from nearly 5 days in 1998 to under 1 days in 2000 and 2001, while the same interval for business customers went from nearly 7 days in 1998 to just over two days in 2000 and 2001. The graph of Verizon’s installation intervals exhibits significant volatility. When fitting a straight line to this curvilinear trend, it is not surprising that our statistical analysis shows that Verizon did not exhibit any statistically significant trend for residential and business lines.139 Its average performance is not significantly different than the reference group.140 Its average
139 For residential lines, the coefficient is –0.2 with t-statistic –0.92, not significant at 1% or 5% level (R-square: 0.12, no. of observations: 8). For business lines, the coefficient is –0.17 with t-statistic –0.64, not significant at 1% or 5% level (R-square: 0.06, no. of observations: 8).140 For residential lines, the coefficient is 0.46 with t-statistic 0.85, not significant at 1% or 5% level (R-square: 0.05, no. of observations: 16). For business lines, the coefficient is 1.32 with t-statistic 1.97, not significant at
97

R.01-09-001, I.01-09-002 COM/SK1/MP1/bb1
performance is not significantly different than Pacific, either.141 Thus, based on the linear statistical tests that we use, the great changes in Verizon’s installation intervals over this period remain unexplained. We cannot even reach a statistical conclusion on exactly what is happening with Verizon concerning installation intervals. Because of this particular pattern of data, in the next phase of this proceeding, we will pursue whether an alternative statistical tests on this particular variable would better explain and/or measure what is happening with this variable.
13.Switch Downtime: Pacific - Significantly Better Than Reference Group with No Significant Trend; Verizon - Statistically Indistinguishable From Reference Group with Significant Worsening TrendSwitch downtime occurs when call processing capability for an
end office is lost. This measure reports the switch downtime in minutes per switch experiencing downtime. As is shown in the chart below, Pacific has significantly improved its performance in the first few years of the NRF period. The statistical analysis shows that Pacific does not exhibit any statistically significant trend in downtime per switch down and performs better than the average of the reference group.142
1% or 5% level (R-square: 0.22, no. of observations: 16).141 For residential lines, the coefficient is 0.5 with t-statistic 0.96, not significant at 1% or 5% level (R-square: 0.06, no. of observations: 16). For business lines, the coefficient is 0.72 with t-statistic 1.2, not significant at 1% or 5% level (R-square: 0.09, no. of observations: 16).142 The coefficient is –1.287 with t-statistic -2.02, not significant at 1% or 5% level (R-square: 0.31, no. of observations: 11). In comparison with the reference group, the coefficient is –14.10 with t-statistic –4.21, significant at 1% level (R-square: 0.46, no. of observations: 22).
98

R.01-09-001, I.01-09-002 COM/SK1/MP1/bb1
05
101520253035404550556065707580859095
100105110
1991 1992 1993 1994 1995 1996 1997 1998 1999 2000 2001
PacificBellTop TenAverageVerizon
Average Downtime per Downed Switch
Year
Good
Minutes
Verizon’s downtime per switch exhibited an upward trend.143 Its average performance is significantly worse than Pacific.144 Verizon’s average performance is also worse than the reference group, but the difference is not statistically significant.145
14.Switches Down per Switch
Pacific had only six observations for this measure. The statistical analysis shows that Pacific does not exhibit a statistically significant trend in the number of switches down per switch while Verizon exhibits a slight improvement in this area.146 143 The coefficient is 7.95 with t-statistic 4.28, significant at 1% level (R-square: 0.67, no. of observations: 11). 144 The coefficient is 27.03 with t-statistic 2.71, significant at 5% level (R-square: 0.27, no. of observations: 22).145 The coefficient is 12.9 with t-statistic 1.29, not significant at 1% or 5% level (R-square: 0.08, no. of observations: 22).146 For Pacific, the coefficient is zero with t-statistic zero, not significant at 1% or 5 % level (R-square: 0.00, no. of observations: 6). For Verizon, the coefficient is –0.01 with t-statistic –4.02, significant at 1% level (R-square:
99

R.01-09-001, I.01-09-002 COM/SK1/MP1/bb1
15.Number of Switch “Occurrences”: Pacific - “Under Two Minutes” Trend Improving, No Significant Trend for “Over Two Minutes” or “Percent Unscheduled”; Verizon - “Under Two Minutes” Trend Improving, But “Percent Unscheduled” Trend Worsening
Pacific reported three measures under this category: the number of occurrences over two minutes per switch (the number of incidents of switch downtime over two minutes in duration), the number of occurrences under two minutes per switch (the number of incidents of switch downtime under two minutes in duration) and the percent of occurrences unscheduled (the percent of incidents of switch downtime under two minutes in duration that are not scheduled for routine maintenance or network upgrades). Pacific’s performance does not show a statistically significant upward or downward trend in the number of occurrences over two minutes per switch and the percent unscheduled. 147 Pacific exhibited a downward trend for the number of occurrences under two minutes per switch.148
Verizon had more data points for these measures. Verizon has exhibited a downward trend for the number of occurrences under two minutes per switch and an upward trend for the percent unscheduled.149
0.64, no. of observations: 11). 147 For the number of occurrences over two minutes per switch, the coefficient is 0.019 with t-statistic 0.80, not significant at 1% or 5 % level (R-square: 0.14, no. of observations:6). For the percent unscheduled, the coefficient is –0.015, with t statistic -0.57, not significant at 1% or 5% level (R-square: 0.01, no. of observations: 6).148 The coefficient is –0.016 with t-statistic -2.95, significant at 5% level (R-square: 0.69, no. of observations: 6).149 For the number of occurrences under two minutes, the coefficient is –0.04, with t-statistic –4.63, significant at 1% level (R-square: 0.70, no. of observations: 11). For the percent unscheduled, the coefficient is 0.05
100

R.01-09-001, I.01-09-002 COM/SK1/MP1/bb1
16. Installation Commitments Met: Pacific - Residential Performance Indistinguishable From Reference Group and No Distinguishable Trend, Business Significantly Better Than Reference Group But Trend Worsening; Verizon - Residential and Business Performance Indistinguishable From Reference Group with No Significant TrendsPacific’s residential installation “commitments met” data were
consistently good from 1991-2001, with the exception of a dip in “commitments met” in late 1997. For business customers, the percentage of commitments met declined notably from 1991 through 1997, improving again in 2001. Pacific has demonstrated a slight downward trend for its residential lines but it is not statistically significant while it has shown a slight deterioration for business lines.150 Its performance is not statistically different than the reference group for the residential lines but it is better for the business lines.151
with t-statistic 3.65, significant at 1% level (R-square: 0.60, no. of observations: 11). 150 For residential lines, the coefficient is –0.038 with t-statistic -1.15, not significant at 1% or 5% level (R-square: 0.13, no. of observations: 11). For business lines, the coefficient is –0.176 with t-statistic -4.51, significant at 1% level (R-square: 0.69, no. of observations: 11).151 For residential lines, the coefficient is 0.27 with t-statistic 2.02, not significant at 1% or 5% level (R-square: 0.17, no. of observations: 22). For business lines, the coefficient is 1.05 with t-statistic 2.84, significant at 5% level (R-square: 0.29, no. of observations: 22).
101

R.01-09-001, I.01-09-002 COM/SK1/MP1/bb1
95
96
97
98
99
100
1991 1992 1993 1994 1995 1996 1997 1998 1999 2000 2001
Pacific BellTop Ten AverageVerizon
Residential Percent Installation Commitments MetPercent Met
Year
Good
95
96
97
98
99
100
1991 1992 1993 1994 1995 1996 1997 1998 1999 2000 2001
Pacific BellTop Ten AverageVerizon
Business Percent Installation Commitments MetPercent Met
Year
Good
Other than in 1999, when Verizon’s percentage of residential commitments met dipped to below 97%, Verizon performed well during the 1991-2001 period on its residential commitments. Its performance did not vary much from Pacific’s, and neither party shows major problems in the “commitments met” area during the 1991-2001 period.
102

R.01-09-001, I.01-09-002 COM/SK1/MP1/bb1
Verizon’s results were less stable in the area of business commitments met, as the foregoing graph reveals. Verizon’s results showed a general declining trend between 1991 and 1998 and were most problematic in 1995 and 1998, dipping to 96% and 95.5% of commitments met for business customers in those years. For all years except 1999, the data show that Verizon’s performance was worse than Pacific’s.
The statistical analysis indicates that Verizon did not exhibit any statistically significant upward or downward trend for the residential and business lines.152 Its performance is not significantly different than the reference group.153Verizon's performance is also not statistically different than Pacific’s for residential lines but it is worse than Pacific for business lines.154
D. Summary of Empirical Assessment of Pacific’s and Verizon’s Performance on ARMIS 43-05 Measures
Concerning the ARMIS 43-05 measures, since there are no FCC service standards, we have compared the performance of Pacific and Verizon against a reference group of large utilities.
152 For residential lines, the coefficient is –0.05 with t-statistic –0.69, not significant at 1% or 5% level (R-square: 0.05, no. of observations: 11). For business lines, the coefficient is –0.05 with t-statistic –0.43, not significant at 1% or 5% level (R-square: 0.02, no. of observations: 11).153 For residential lines, the coefficient is 0.22 with t-statistic 0.86, not significant at 1% or 5% level (R-square: 0.04, no. of observations: 22). For business lines, the coefficient is –0.48 with t-statistic –1.02, not significant at 1% or 5% level (R-square: 0.05, no. of observations: 22).154 For residential lines, the coefficient is –0.05 with t-statistic –0.21, not significant at 1% or 5% level (R-square: 0.00, no. of observations: 22). For business lines, the coefficient is –1.53 with t-statistic –3.68, significant at 1% level (R-square: 0.40, no. of observations: 22).
103

R.01-09-001, I.01-09-002 COM/SK1/MP1/bb1
Compared to the reference group, Pacific’s record on the six measures of trouble reports has been better than that of the reference group. Pacific also performed better than the reference group in switch downtime and installation commitments met (business). We have not observed a statistically significant difference between Pacific and the reference group on initial out-of-service repair interval (business), initial all other repair interval (business), repeat all other repair interval (business), average installation interval (residential and business), installation commitments met (residential). Pacific’s performance lagged behind the reference group on the four residential repair interval measures: the initial out of service repair interval (residential), repeat out-of-service repair interval (residential), initial all other repair interval (residential), and repeat all other repair interval (residential).
PACIFIC ARMIS TO REFERENCE GROUP SUMMARY
Measure Type
Significantly Better Performance
Statistically Indistinguishable Performance
Significantly Worse Performance
Residential 6 2 4Business 7 5 0Bus. and Res. 1 0 0
104

R.01-09-001, I.01-09-002 COM/SK1/MP1/bb1
For Pacific, we statistically examined trends in performance during the NRF years. In particular, we find that during the NRF period Pacific’s performance showed statistically significant improvement on initial trouble reports per 100 lines (business), repeat trouble reports per 100 lines (business), repeat out-of-service reports (business), initial all other trouble reports (business), repeat all other trouble reports (business), initial all other repair interval (business), and the number of occurrences under two minutes. Pacific has shown no statistically significant change in initial trouble reports (residential), repeat trouble reports (residential), initial out-of-service reports (residential and business), repeat out-of-service reports (residential), initial out-of-service repair interval (residential and business), repeat out-of-service repair interval (residential and business), initial all other repair interval (residential), repeat all other repair interval (residential and business), average installation interval (residential and business), switch downtime, installation commitments met (residential), the number of switches down, the number of occurrences over two minutes, and the percent of unscheduled occurrences. Pacific’s performance has shown a worsening trend in initial all other trouble reports (residential), repeat all other trouble reports (residential) and installation commitments met (business).
PACIFIC ARMIS TREND SUMMARY
Measure Type
Significantly ImprovingTrend
No Statistically Discernible Trend
Significantly Worsening Trend
Residential 0 10 2Business 6 5 1Bus. and Res. 1 4 0
105

R.01-09-001, I.01-09-002 COM/SK1/MP1/bb1
From our statistical analysis, we note that Pacific had significant problems with both initial and repeat residential out of service repair intervals during a much of the period for which we have data. For both measures, repair intervals doubled from 1994 to 1998, a notable deterioration on an important measure. The repair intervals fell the most in 2001, after ORA filed its complaint alleging that Pacific’s performance on these measures violated a previous Commission order. Largely because both measures data are curvilinear, e.g., show a significant deterioration from 1994 through 1998 followed by improvement back toward 1994 levels in the 1999 through 2001 periods, our statistical analysis does not show a statistically significant linear trend over the period under review. Nevertheless, we consider the decline in quality from 1994 to 1998 to have been a notable problem. Fortunately, the data show that Pacific is now headed in the right direction on this measure. Pacific did not have these same problems with business out of service intervals (both initial and repeat), for which Pacific’s performance was relatively stable and not statistically different from the reference group.
Finally, we note that statistical methods we employ in this decision to identify trends are limited to linear trends. We hope that in future reviews of service quality, parties and the Commission will employ statistical methods that are better suited to analyze these type of performance.
We now turn to Verizon. Compared with the reference group, Verizon’s record has been better in almost all measures. With respect to the important measures of out of service intervals, for both residential and business customers, the data show that Verizon did
106
R.01-09-001, I.01-09-002 COM/SK1/MP1/bb1
not experience the same problems as Pacific. However, for initial all other trouble reports (business), repeat all other trouble reports (business), average installation intervals (residential and business), switch downtime, and installation commitments met (residential and business), we have not observed any statistically significant difference between Verizon’s performance and that of the reference group. Verizon’s performance did not lag behind the reference group in any of the measures.
VERIZON ARMIS TO REFERENCE GROUP SUMMARY
Measure Type
Significantly Better Performance
Statistically Indistinguishable Performance
Significantly Worse Performance
Residential 10 2 0Business 8 4 0Bus. and Res. 0 1 0
We also conducted a statistical examination of how Verizon’s service quality changed over time. We find that during the NRF period, Verizon’s performance showed statistically significant improvement on the number of initial trouble reports (residential and business), the number of repeat trouble reports (residential and business), the number of initial out-of-service trouble reports (business), the number of initial all other trouble reports (business), the number of repeat all other trouble reports (business), the number of switches down, and the number of occurrences under two minutes. Verizon’s performance has not shown any statistically significant change in the initial out of service trouble reports (residential), repeat out-of-service trouble reports (residential and business), initial all
107

R.01-09-001, I.01-09-002 COM/SK1/MP1/bb1
other trouble reports (residential), repeat all other trouble reports (residential), initial out-of-service repair interval (residential and business), repeat out-of-service repair interval (residential and business), initial all other repair interval (business), repeat all other repair interval (business), average installation interval (residential and business), and installation commitments met (residential and business). Verizon’s performance has shown a worsening trend only in initial all other repair interval (residential), repeat all other repair interval (residential), switch downtime, and the percent of unscheduled occurrences.
108

R.01-09-001, I.01-09-002 COM/SK1/MP1/bb1
VERIZON ARMIS TREND SUMMARY
Measure Type
Significantly ImprovingTrend
No Statistically Discernible Trend
Significantly Worsening Trend
Residential 2 8 2Business 5 7 0Bus. and Res. 2 0 2
Thus, we find that there is no evidence from Pacific and Verizon’s performance that supports the hypothesis that NRF regulation decreases customer service quality.
E. MCOT DataBoth Pacific and Verizon have undergone changes as a result of
large mergers they have entered into with other carriers. As a consequence of these mergers, the FCC has required specific reporting for time-limited periods so that it may monitor service quality impacts that may result from the mergers. (Throughout this proceeding, the parties have referred to these reports generically as “MCOT” requirements, and we use that nomenclature here.)155
1. MCOT Data – Pacific Shows No Service Diminishment Following Ameritech MergerAs a condition of SBC’s merger with Ameritech, the FCC
required additional quarterly, state-by-state service quality reporting for the period from June 1999 to November 2002.156 Categories of 155 The FCC’s Merger Compliance Oversight Team maintains a website reflecting the reported results of Pacific (http://www.fcc.gov/wcb/mcot/SBC_AIT/) and Verizon (http://www.fcc.gov/wcb/mcot/BA_GTE/). See also Exhibit (Exh.) 2B:507 at 22-23 (Schilberg Direct Testimony describing MCOT reporting). Exhibit 2B:507 refers to Exhibit 507 from Phase 2B of this proceeding.156 FCC 99-279, October 6, 1999, Appendix C, Condition XXIV, ¶ 62, available at http://www.fcc.gov/wcb/mcot/SBC_AIT/compliance_program/.
109

R.01-09-001, I.01-09-002 COM/SK1/MP1/bb1
reporting for retail services include installation and maintenance, switch outages, transmission facility outages, service quality-related complaints, and answer time performance. The FCC based the reporting categories on the NARUC157 Service Quality White Paper, authored in 1998.158
In late 2000, the FCC notified SBC that, “[t]he quarterly service quality reports filed by SBC Communications, Inc. (‘SBC’) pursuant to the SBC/Ameritech Merger Order indicate that the quality of service provided by SBC’s incumbent local exchange carriers (‘LECs’) has been deteriorating in several states since approval of the merger in October 1999.” The FCC representative went on to state that, “I am concerned that SBC’s performance data indicates that consumers in SBC’s region are experiencing increasing installation delays, longer repair times, and greater difficulties contacting SBC’s incumbent LECs about service quality and other issues. I note also that consumer complaints regarding service quality have increased in recent months in spite of SBC’s explicit commitment when the merger was pending to devote greater resources to service quality after the merger closed.”159
This comment offers an over-all assessment of SBC. We now turn to see how Pacific’s service quality fared following the merger.
157 National Association of Regulatory Utility Commissioners.158 The NARUC Service Quality White Paper is available at http://www.fcc.gov/Bureaus/Common_Carrier/Public_Notices/1999/da992441.txt.
159 Letter from Dorothy Atwood, Chief, FCC Common Carrier Bureau, to Mr. James W. Calloway, Group President – SBC Services, dated October 6, 2000, available at http://www.fcc.gov/wcb/mcot/SBC_AIT/service_quality/. We may take official notice of this letter pursuant to Commission Rule 73.
110

R.01-09-001, I.01-09-002 COM/SK1/MP1/bb1
The FCC produced charts for certain measures for the period July 1999 to June 2001. According to these charts Pacific’s performance shows negative spikes in California in the following areas: 1) answer time performance (business customers),160 2) trouble report rate per 100 lines (especially business customers),161 3) percentage of installation orders completed within 5 working days (especially residential customers),162 and 4) percentage of installation orders delayed over 30 days (business customers).163
These spikes, however, proved only transitory when subjected to statistical scrutiny. The data for these measures are also posted on the website for the period January 2000 through September 2001.164 In order to check whether there is a statistically significant upward or downward trend, we estimated a regression of Pacific’s performance on a linear time trend. Our statistical analysis showed that Pacific’s performance exhibits an improving trend in average answer time for residential and business customers.165 Pacific’s performance in average trouble duration is also improving for residential and business lines.166 Pacific is also improving its performance in trouble 160 http://www.fcc.gov/wcb/mcot/SBC_AIT/service_quality/OP1.pdf.161 http://www.fcc.gov/wcb/mcot/SBC_AIT/service_quality/RE3.pdf.162 http://www.fcc.gov/wcb/mcot/SBC_AIT/service_quality/IN1.pdf.163 http://www.fcc.gov/wcb/mcot/SBC_AIT/service_quality/IN2.pdf.164 http://www.fcc.gov/wcb/mcot/SBC_AIT/service_quality/data.xls165 For residential customers, the coefficient is –1.36 with t-statistic –3.12, significant at 1% level (R-square: 0.34, no. of observations: 21). For business customers, the coefficient is –0.46 with t-statistic –9.62, significant at 1% level (R-square: 0.83, no. of observations: 21). 166 For residential lines, the coefficient is –0.46 with t-statistic –9.62, significant at 1% level (R-square: 0.83, no. of observations: 21). For
111

R.01-09-001, I.01-09-002 COM/SK1/MP1/bb1
report rate per 100 lines.167Pacific’s performance does not show any change in installation completed within five business days for residential lines. 168 For business lines, our statistical analysis shows a slight improvement. 169
In summary, although the FCC has identified a trend of service deterioration in SBC affiliates following the Ameritech merger, Pacific’s operations appear largely unaffected by the Ameritech merger. The few spikes in poor service proved transitory. Moreover, since the period for which we have MCOT data is so short and covers only part of the period subject to our investigation, it does not permit us to draw any conclusion concerning how NRF regulation affected Pacific’s performance.
Recognizing the value of the MCOT reporting, during the hearings, Administrative Law Judge (ALJ) Sarah R. Thomas granted TURN’s motion seeking an order requiring Pacific to continue to report certain data to this Commission for measures required under the FCC’s MCOT requirements that expired in November 2002. (Verizon agreed with TURN voluntarily to continue the reporting until after a final decision in this proceeding.)
business customers, the coefficient is –1.50 with t-statistic –14.11, significant at 1% level (R-square: 0.91, no. of observations: 21).167 For residential lines, the coefficient is –0.04 with t-statistic –3.64, significant at 1% level (R-square: 0.41, no. of observations: 21). For business lines, the coefficient is –0.02 with t-statistic –5.96, significant at 1% level (R-square: 0.65, no. of observations: 21).168 The coefficient is zero with t-statistic 0.18, not significant at 1% or 5% level (R-square: 0.00, no. of observations: 12). 169 The coefficient is 0.003 with t-statistic 5.48, significant at 1% level (R-square: 0.75, no. of observations: 12).
112

R.01-09-001, I.01-09-002 COM/SK1/MP1/bb1
Judge Thomas ruled that Pacific should continue to report such information.170 She found that Pacific already has a mechanism in place to capture this data easily, that it has no plans to transfer or dismiss the employees who currently prepare the report, and that it would be wasteful to lose the important data the report captures at a time when the Commission is closely examining Pacific’s service quality. We hereby ratify that ruling of the judge pursuant to Pub. Util. Code § 310. We require Pacific to continue reporting these results until further notice of the Commission.
2. MCOT Data – Verizon California (GTE) Shows No Diminishment of Service Quality Following MergerThe FCC also imposed a 36-month reporting requirement as a
condition of the 2000 GTE merger with Bell Atlantic that created Verizon.171 As TURN pointed out in a motion filed during Phase 2B, the FCC requirement provides the Commission with information not otherwise available in GO 133-B. For example, while GO 133-B measures the handling of business office calls, it does not track billing calls even though such calls account for half of the calls to the business office.
According to the FCC data,172 Verizon showed negative spikes in California on several service quality measures at the following times during the period July 2000-June 2001, as compared to the rest of that period: 1) percentage of dissatisfied customers (with business customers reporting 50% dissatisfaction in November 2000 and
170 20 RT 2529-31 (ALJ Thomas’ ruling).171 FCC 00-221, Condition 51. 172 We take official notice of this data pursuant to Rule 73.
113

R.01-09-001, I.01-09-002 COM/SK1/MP1/bb1
residential customers reporting 20% dissatisfaction in March 2001),173
2) answer times (with business answer times in the 50-60 second range in September 2000 and in the 40-50 second range in January 2001 – as compared to a GO 133-B standard of 20 seconds); and residential times exceeding 20 seconds in November 2000 [30 seconds] and January 2001 [40 seconds],174 3) repair intervals for both residential and business customers spiking in the period January-March 2001,175 4) repeat trouble reports spiking for both types of customers in March 2001,176 and 5) trouble reports per hundred lines spiking in the January-March 2001 time period for residential customers.177 However, we have not observed a statistically significant upward or downward trend in Verizon’s performance for the following measures: complaints per one million lines (residential and business),178 the percentage of dissatisfied customers (residential and business),179 answer times (business),180 average repair interval 173 http://www.fcc.gov/wcb/mcot/BA_GTE/service_quality/GTE_States/CU2.pdf.174 http://www.fcc.gov/wcb/mcot/BA_GTE/service_quality/GTE_States/OP1.pdf.175 http://www.fcc.gov/wcb/mcot/BA_GTE/service_quality/GTE_States/RE1.pdf.176 http://www.fcc.gov/wcb/mcot/BA_GTE/service_quality/GTE_States/RE2.pdf.177 http://www.fcc.gov/wcb/mcot/BA_GTE/service_quality/GTE_States/RE3.pdf.178 For the residential lines, the coefficient is –0.30 with t-statistic –2.10, not significant at 1% or 5% level (R-square: 0.31, no. of observations: 12). For business lines, the coefficient is –0.21 with t-statistic –0.76, not significant at 1% or 5% level (R-square: 0.05, no. of observations: 12).179 For the residential lines, the coefficient is 0.74 with t-statistic 1.24, not significant at 1% or 5% level (R-square: 0.13, no. of observations: 12). For business lines, the coefficient is –0.33 with t-statistic –0.35, not significant at 1% or 5% level (R-square: 0.01, no. of observations: 12).180 For business lines, the coefficient is 0.25 with t-statistic 0.35, not significant at 1% or 5% level (R-square: 0.01, no. of observations: 12).
114

R.01-09-001, I.01-09-002 COM/SK1/MP1/bb1
(residential and business),181 the percentage of repeat trouble reports (residential and business),182 trouble report rates (residential and business),183 the percentage of orders completed within five working days (residential and business),184 the percentage of orders delayed over 30 days (business).185 Verizon’s performance shows a slight improvement in the percentage of orders delayed over 30 days for the residential lines186 and in the answer time performance for residential lines.187 As a result, we conclude that despite a visual spike illustrating a decrease in the quality of service in the January to
181 For the residential lines, the coefficient is 0.83 with t-statistic 1.24, not significant at 1% or 5% level (R-square: 0.13, no. of observations: 12). For business lines, the coefficient is 0.24 with t-statistic 1.73, not significant at 1% or 5% level (R-square: 0.23, no. of observations: 12).182 For the residential lines, the coefficient is 0.09 with t-statistic 0.71, not significant at 1% or 5% level (R-square: 0.05, no. of observations: 12). For business lines, the coefficient is zero with t-statistic –0.06, not significant at 1% or 5% level (R-square: 0.00, no. of observations: 12).183 For the residential lines, the coefficient is –0.005 with t-statistic –0.28, not significant at 1% or 5% level (R-square: 0.00, no. of observations: 12). For business lines, the coefficient is –0.004 with t-statistic –0.74, not significant at 1% or 5% level (R-square: 0.05, no. of observations: 12).184 For the residential lines, the coefficient is 0.10 with t-statistic 0.57, not significant at 1% or 5% level (R-square: 0.03, no. of observations: 12). For business lines, the coefficient is 0.14 with t-statistic 0.63, not significant at 1% or 5% level (R-square: 0.36, no. of observations: 12). 185 For the business lines, the coefficient is approximately zero with t-statistic 1.19, not significant at 1% or 5% level (R-square: 0.36, no. of observations: 12).186 For the residential lines, the coefficient is –0.001 with t-statistic –2.39, significant at 5% level (R-square: 0.36, no. of observations: 12).187 For the residential lines, the coefficient is –1.71 with t-statistic –2.99, significant 5% level (R-square: 0.47, no. of observations: 12).
115

R.01-09-001, I.01-09-002 COM/SK1/MP1/bb1
March 2001 time period, there is no statistically significant indicator of an ongoing decrease in quality.
While Verizon voluntarily agreed to continue reporting this MCOT data, we will expand on that agreement to make it parallel with Pacific’s, and require Verizon to continue to make its MCOT reports to this Commission until further notice.
V. Survey Data and Customer Satisfaction
A. Customer Satisfaction and Service Quality Surveys – Pacific
1. ORA SurveyAt the Commission’s direction, ORA’s witness Dr. Marek Kanter
readministered a survey of Pacific’s customers based on one ORA conducted in 1995. Based on the responses given to 36 survey questions concerning service quality, ORA concluded that “Pacific’s quality of service has declined in the period between 1995 and 2001.”188
ORA’s comparison showed problems in residential and small business customers’ perceptions of Pacific’s service quality. Of 36 questions in the survey germane to service quality, the responses to 23 questions showed a difference between customer perceptions in 1995 and 2001. In each of the following 19 questions, more customers chose a less favorable response in 2001 than they had in 1995:
Q8. How often have you noticed static or noise on the line?
Q9. How often have you noticed voices fading in or out?
Q10. How often have you heard voices echoing?
188 ORA Opening Brief at 18.
116

R.01-09-001, I.01-09-002 COM/SK1/MP1/bb1
Q15. How often was the line dead upon picking up the phone?
(Questions 21-27 relate to “long distance calls carried by your local telephone company.”)189
Q21. How often have you noticed static or noise in the last 30 days?
Q22. How often have you noticed voices fading in and out in the last 30 days?
Q23. How often have you heard voices echoing in the last 30 days?
Q24. How often have you not heard the other party in the last 30 days?
Q27. How often have you been disconnected while talking in the last 30 days?
(Questions 31-32 relate to contacts with the local company’s business office.)
Q31. Were the office personnel assisting you courteous?
Q32. Were you satisfied with the help you received from the office personnel?
Q34. Regarding contacts with the local company’s telephone operators, were you satisfied with the help you received from the operators?
(Questions 37-38 relate to telephone installation and repair.)
Q37. Was the work completed on time?
Q38. Were you satisfied with the work?
189 Pacific correctly pointed out, in our view, that this question might have confused customers, and more so in 2001 than in 1995 with the differentiation in local toll and long distance calling and the proliferation of long distance providers.
117

R.01-09-001, I.01-09-002 COM/SK1/MP1/bb1
Q40. Was your most recent local telephone bill correct?
Q42. How would you rate your local phone service for the last 30 days?
Q43. Compared with the last 6 months, rate your service in the last 30 days.
Q44. What is your overall satisfaction with your local telephone service?
Q46. Rate the service of [the] present provider, compared with previous providers you have had in the last three years.
For each of the following 4 questions, more customers chose a more favorable response in 2001 than they had in 1995:
Q13. How often have you heard other voices on the line?
Q16. How often have you reached a number not dialed?
Q26. How often have you heard other voices on the line in the last 30 days?
Q41. If your most recent bill was incorrect, has the problem been resolved?
Pacific’s witness Dr. Hauser states that ORA’s survey is “biased, noisy, and non-representative.”190 Dr. Hauser’s main objection is that the survey sample is not representative of all of Pacific’s customers, due to nonresponse bias. He claims ORA lacked procedures to minimize nonresponse bias, and ORA’s sample is highly likely to be biased towards customers who are more dissatisfied than the typical Pacific customer.191 Hauser also pointed out flaws regarding the ORA’s statistical analysis: use of inappropriate and biased hypothesis tests, incorrect calculations of the joint significance tests, inappropriate 190 Exh. 2B:354 at 40:11-12 (Hauser Direct). 191 Id. at 40: 17-21.
118

R.01-09-001, I.01-09-002 COM/SK1/MP1/bb1
comparisons over time and typographical mistakes.192 According to his analysis, if corrected, “37% of the statistically significant declines in service between 2001 and 1995 that ORA found are incorrectly labeled.”193 Due to all these flaws and mistakes, Hauser claims that ORA’s survey results are not a valid measure of Pacific’s service quality.
ORA did not change the survey questions – again at the Commission’s direction – because it wanted the results to be comparable over time. While Pacific criticizes the poor quality of the survey, we find that ORA did precisely what it was directed to do: use the same survey as it used in 1995 so as to have a basis to compare Pacific’s results. In this regard, the Commission stated in the OIR that, “Parties that conduct surveys are encouraged to adhere to the following principles. First, in developing the survey, the party should use as a starting point the surveys of Pacific and Verizon customers conducted by Commission staff in previous proceedings.”194
On the sample size, it is true that ORA did not follow up with customers in an attempt to increase the size of the sample of customers taking the survey. However, ORA did not follow up in 1995 either. As ORA points out, “had ORA attempted follow-up procedures that were different than the procedures in place in 1995, it would have lost the ability to do a fair comparison of the 1995 with the 2001 results.” Dr. Kanter also explained that, “had I done follow-up phone calls, I would have changed the cast of characters, so to speak. The people responding would not have been as directly comparable to the 192 Id. at 41: 12-15. 193 Id. at 73:8-11.194 R.00-09-001, mimeo., at A-3.
119

R.01-09-001, I.01-09-002 COM/SK1/MP1/bb1
people responding in 1995.”195 This, however, creates a serious dilemma because the sharp drop in the response rate in the 2001 survey from that of 1995 limits our ability to draw conclusions from the survey with statistical confidence.196
However, while the ORA 2001 response rate is less than 50% of its 1995 rate, the total number of responses in 2001 is 881, which does provide some credibility to the findings.197 Further, a disparity in the response rate similarly occurred with the ORA survey of Verizon customers. Unfortunately, that ORA survey of Verizon took place in 1991, not 1995, thereby reducing the validity of the Verizon experience as a control. Nevertheless, we would expect a similar survey response for Verizon as to that of Pacific. Yet the findings of the ORA survey of Verizon are opposite that of its findings for Pacific. Such a difference suggests that the bias that Pacific’s witness purports to exist is not powerful enough to explain away the general finding of the ORA survey: that there has been a diminishment in customers’ perception of Pacific’s service quality.
The methodological discussions brought up by Pacific in this proceeding regarding how to conduct a proper survey and analyze its results caution us on drawing conclusions based on ORA’s survey instrument. As with almost all the other data presented in this proceeding, ORA’s survey suffers from flaws. However, the survey still suggests that the consumer perception of Pacific’s service quality fell between 1995 and 2001. For this reason, it is critical to turn to other
195 ORA Opening/Service Quality at 20, citing 18 RT 2147:2-12.196 The overall response rate in the 2001 ORA survey was 12.1%. It was 28.1% in 1995.197 Direct Testimony of Marek Kanter, 4/15/02, Table 1, pg.6
120

R.01-09-001, I.01-09-002 COM/SK1/MP1/bb1
surveys to see if this pattern is repeated or if Pacific’s customers are not satisfied with Pacific’s service quality.
2. Pacific’s Surveys
a) J.D. Power Survey – Pacific Pacific also submitted its own surveys. A global marketing
information firm J.D. Power conducted one of them. Even though Pacific submitted little information about what the survey asked customers, Pacific’s witness, Dr. Hauser, explained that these surveys did not “measure satisfaction with recent service events with Pacific (e.g., installations or repairs), but rather provided a general measure of satisfaction with overall customer service and its aspects.”198 That is, overall customer satisfaction is determined “by surveying over 12,000 households on the areas of customer service, cost of service, corporate image, call quality, promotions, billing, calling cards, and operator service.”199
Pacific received a score of 110 in 2001 from J.D. Power, where 104 is the industrial average score.200 Furthermore, Pacific is ranked in the top six out of the sixteen local service providers surveyed. 201 Pacific’s witness, Dr. Hauser also stated that Pacific has consistently exceeded the industry average for every year from 1996 to 2001 and it has consistently ranked in the top six of local service providers.202
198 Exh. 2B:354 at 29:18-21 (Hauser Direct Testimony).199 Exh. 2B:354 at 30:3-6 (Hauser Direct Testimony).200 Id., at 30:10-11.201 Id., at 30:11-12. 202 Exh. 2B:354 at 30:16-19 (Hauser Direct Testimony).
121

R.01-09-001, I.01-09-002 COM/SK1/MP1/bb1
The information Pacific submitted indicated that the survey also included several factors that we consider peripheral to a true assessment of service quality, such as “corporate image” (which respondents ranked as one of the top three factors relevant to customer satisfaction, with 21% finding it important), “cost of service/value” (with 24%) and “calling card,” which appear to relate to Pacific’s prices and calling card services. These are not elements of service quality as examined in this decision. Thus, the J.D. Power surveys broader aspects of service quality than are the focus of our study. Nevertheless, it provides evidence that indicates that consumers are satisfied with Pacific’s assessment of service quality.
b) IDC Survey – Pacific Pacific’s expert Dr. Hauser also summarized the results of a
2000 survey of various local exchange carriers by IDC, entitled “Telecommunications Consumer Brands Survey.” According to Dr. Hauser, IDC is “a leading provider of technology forecasts, insights and advice.”203 Dr. Hauser reported that the IDC survey found that Pacific’s customers are more satisfied than the average local telephone customer for all attributes studied except one; Pacific’s customers are the second most overall satisfied for customer service; Pacific’s customers are the third most satisfied for voice quality; and Pacific is one of the top three providers in over 85% of the areas measured. According to Dr. Hauser, the IDC survey polled 805 households nationally, and measured local telephone service customers’ satisfaction with “customer service, fees, marketing, reputation, pricing-structure and voice/service quality.”204 203 Id., at 31:3-4.204 Id. (Hauser Direct Testimony).
122

R.01-09-001, I.01-09-002 COM/SK1/MP1/bb1
Attachment 31 to Dr. Hauser’s testimony summarizes the results of the IDC study. Two indicia of service quality contained in the survey are “customer service” and “voice or service quality.”205 For “customer service,” 73.8% of respondents ranked Pacific as a 4 or 5 (with 1 = not very satisfied, and 5 = very satisfied). This places Pacific in the middle of the range for comparable carriers. Of the non-SBC companies, GTE/Verizon’s comparable result was 83.1%, Bell Atlantic’s was 80.7%, and Bell South’s was 72.6%, and US West’s was 63.1%.
Similarly, on “voice or service quality,” 85.7% of customers ranked Pacific a 4 or 5. Of the non-SBC companies, Bell South scored 86.3, GTE scored 85.9, US West scored 83.8, and Bell Atlantic scored 83.5. Thus, when analyzing the tale of the distribution – those most satisfied – Pacific’s results for these two measures are comparable to the other non-SBC carriers’ results.
Unfortunately the sample size of this survey was small. Pacific’s witness recognized the survey results might not be statistically different from the results of other LECs.206 Thus, the results of this survey are not conclusive, although they do provide directional indication on comparisons of customer satisfaction.
c) Other Customer Surveys – Pacific Pacific’s witness, Dr. Hauser, explained that Pacific has a
centralized organization that collects data on an ongoing basis by 205 The other indicia, “overall satisfaction,” “fees and costs,” “marketing style,” “reputation of the provider,” and “simplicity of pricing structure” either do not measure service quality at all, or pertain to measures in addition to service quality.206 The sample for Pacific is small with the survey covering 42 Pacific customers. The 95% confidence interval around overall satisfaction would be plus or minus 12 percent. Exh. 2B:354 at 31.
123

R.01-09-001, I.01-09-002 COM/SK1/MP1/bb1
surveying customers with recent service interactions with Pacific. A sample of the customers is surveyed by an independent marketing firm, Market Insights, every month, 7-10 days after the service event and asked about their interaction with the business office and network operations.207 These surveys are the source of data provided to the FCC in the ARMIS 43-06 reports.208 The survey results are also reported to the CPUC under the P.A. 02-04 reporting requirement. The tables below summarize Pacific’s performance from 1990 through 2001. The December measures reported includes the result for the previous 11 months as well, and therefore offers a tabulation of the entire year.
207 Exh. 2B:354 at 32:16-20. (Hauser Direct Testimony).208 Id. at 33:2-3.
124

R.01-09-001, I.01-09-002 COM/SK1/MP1/bb1
D e c '0 1 D e c '0 0 D e c '9 9 D e c '9 8 D e c '9 7 D e c '9 6C o n s u m e r P ro v is io n in g 8 3 .6 8 0 .0 8 2 .0 8 5 .0 8 9 .0 9 0 .0
M a in te n a n c e 8 3 .4 7 2 .6 7 4 .0 7 5 .0 7 5 .0 8 1 .0A c c o u n t S e rv ic e -S a le s 8 6 .0A c c o u n t S e rv ic e -B illin g /In q u iry 8 2 .6A c c o u n t S e rv ic e -P ro v is io n in g 8 3 .6A c c o u n t S e rv ic in g 8 1 .4 8 4 .7 9 0 .0 9 1 .0B ill in g 7 8 .9 8 2 .0 7 6 .5 8 2 .0 8 0 .0S a le s a n d In q u iry 8 7 .1
S m a ll B u s in e s s P ro v is io n in g 8 4 .5 8 1 .6 8 2 .3 8 1 .4M a in te n a n c e 8 7 .7 8 2 .6 8 2 .6 8 2 .3A c c o u n t S e rv ic e -S a le s 8 7 .5A c c o u n t S e rv ic e -B illin g /In q u iry 8 3 .9A c c o u n t S e rv ic e -P ro v is io n in g 8 4 .6S a le s a n d In q u iry 8 1 .9 8 2 .2 8 2 .3B ill in g 7 8 .3 7 9 .7 7 7 .8
M e d iu m B u s in e s s A c tiva t io n /P ro v is io n in g 8 4 .0 7 8 .1 7 9 .3 8 0 .2A s s u ra n c e /M a in te n a n c e 8 7 .3 8 0 .4 7 9 .9 7 9 .4M a rk e tin g -A cc o u n t T e a m 8 1 .7M a rk e tin g -S a le s / In q u iry 8 4 .3M a rk e tin g -A c t iva tio n /P ro v is io n in g 8 4 .0B ill in g 7 8 .5 8 0 .9 4 3 .6
L a rg e B u s in e s s P ro v is io n in g 8 1 .4 8 6 .3 8 4 .0M a in te n a n c e 7 5 .2 8 0 .8 7 7 .9A c c o u n t T e a m 8 9 .8 9 2 .9 8 8 .8B ill in g 7 4 .2 7 7 .2 7 2 .3
R e g io n a l M a rk e t B u s in e s s P ro v is io n in g 8 6 .0 8 8 .0M a in te n a n c e 8 0 .0 8 2 .0A c c o u n t S e rv ic in g 8 5 .0 8 7 .0B ill in g 8 2 .0 8 3 .0
H ig h E n d A c c o u n ts P ro v is io n in g 7 3 .0M a in te n a n c e 6 9 .0A c c o u n t S e rv ic in g 8 6 .0B ill in g 7 2 .0
O p e ra to r S e rv ic e s O p e ra to r A s s is ta n c e 8 3 .7 8 1 .1 8 6 .0 8 6 .0D ire c to ry A s s is ta n c e 8 0 .1 8 2 .8 8 4 .0 8 4 .0
P a c if ic B e ll Q u a lity o f S e rv ic e P e r fo rm a n c e (2 0 0 1 -1 9 9 6 )% o f C u s to m e rs S a t is f ie d o r V e ry S a t is f ie d w ith S e rv ic e
S o u rc e P .A .0 2 -0 4
125

R.01-09-001, I.01-09-002 COM/SK1/MP1/bb1
Dec '95 Dec '94 Dec '93 Dec '92 Dec '91 Dec '90Consumer Provisioning 92.0 93.0 93.0 95.0 96.0 96.0
Maintenance 82.0 84.0 86.0 89.0 96.0 95.0Account Servicing 90.0 92.0 93.0 93.0 95.0 95.0Billing 82.0 81.0 81.0 82.0 98.0 93.0Sales and InquiryNetwork Services 99.0
Small Business Provisioning 92.0 93.0 95.0 95.0Maintenance 90.0 91.0 96.0 96.0Billing 83.0 81.0 93.0 95.0Account Servicing 91.0 91.0 94.0 94.0Network Services 99.0
Major Business Provisioning 91.0 91.0 95.0 95.0Maintenance 89.0 90.0 94.0 94.0Account Servicing 90.0 90.0 94.0 94.0Billing 84.0 83.0 98.0 97.0Network Services 99.0
Priority Business Provisioning 98.0 99.0Maintenance 98.0 98.0Account Servicing 97.0 95.0Billing 90.0 89.0Network Services 99.0 98.0
Regional Market Business Provisioning 91.0 91.0Maintenance 85.0 86.0Account Servicing 90.0 92.0Billing 82.0 84.0
National Accounts Provisioning 92.0 90.0 95.0 92.0Maintenance 94.0 88.0 93.0 89.0Account Servicing 88.0 94.0 89.0 92.0Billing 94.0 82.0 77.0 76.0
Public Sector Provisioning 93.0 93.0 96.0 94.0Maintenance 81.0 85.0 93.0 91.0Account Servicing 98.0 96.0 98.0 95.0Billing 81.0 81.0 86.0 85.0
Operator Services Operator Assistance 87.0 85.0 87.0 87.0 97.0 97.0Directory Assistance 85.0 84.0 86.0 87.0 95.0 95.0
Pacific Bell Quality of Service Performance (1990-1995)% of Customers Satisfied or Very Satisfied with Service
Source P.A.02-04
126

R.01-09-001, I.01-09-002 COM/SK1/MP1/bb1
While Pacific reports the CPUC the percentage of the customers satisfied or very satisfied with Pacific’s service, it also reports to the FCC the percentage of the customers dissatisfied or very dissatisfied with service as shown in the table below.
2001 2000 1999 1998 1997 1996 1995 Q2 1995 Q1 1994 Q2 1994 Q1Installation Residence 9.0 10.5 9.0 7.5 4.3 3.2 8.0 8.1 7.0 6.8
Small Business 8.7 10.2 9.4 10.3 6.4 4.7 10.0 8.9 8.5 9.3Large Business 9.0 13.6 8.1 8.3 7.8 7.4 12.4 7.0 8.2 10.7
Repairs Residence 10.7 18.0 16.4 16.3 11.2 8.0 17.0 19.0 16.6 14.4Small Business 7.0 9.2 9.4 9.8 8.9 7.9 15.0 15.5 16.6 13.4Large Business 5.8 10.5 8.6 9.6 9.6 7.9 14.1 13.9 15.1 16.7
Business Office Residence 8.5 10.4 7.6 6.9 2.7 2.1 10.0 9.5 8.6 7.0Small Business 7.2 9.4 8.8 9.8 5.2 4.1 10.0 10.7 8.4 8.6Large Business 10.2 12.4 6.7 7.7 7.1 2.7 8.1 6.9 6.3 9.0
Pacific Bell Quality of Service Performance % of Customers Dissatisfied or Very Dissatisfied with Service
Source ARMIS 43-06
2001 2000 1999 1998 1997 1996 1995 Q2 1995 Q1 1994 Q2 1994 Q1Installation Residence 11180 13517 13906 17205 28285 28335 14043 14355 14342 13407
Small Business 11015 13320 11796 16704 30498 27526 14109 14113 14245 13659Large Business 2329 2295 4466 3625 884 485 274 351 426 271
Repairs Residence 11153 13857 14312 16856 16949 17389 8609 9642 9575 9199Small Business 11060 13976 14332 16396 23015 20841 10439 11685 11660 11251Large Business 2084 2328 4466 3680 792 479 262 335 416 264
Business Office Residence 22159 25111 14083 18184 19081 18955 9308 9384 8625 8832Small Business 21268 27645 26096 16277 18233 16237 7210 7914 8068 7457Large Business 591 579 6654 4857 794 408 223 297 375 234
Pacific Bell Quality of Service Performance The Number of Customers Surveyed
Source ARMIS 43-06
Unlike the surveys discussed before, in these surveys “customers rate their overall satisfaction with their service interaction. In addition to their satisfaction with the service event, customers are asked about the ease of getting through to the office as well as several questions that measure the skill of the Pacific
127

R.01-09-001, I.01-09-002 COM/SK1/MP1/bb1
representative answering the call, e.g., was the representative courteous, and the performance of the Pacific service technician who performed any necessary repairs, e.g., doing quality work and completing the work in a timely manner.”209
Pacific has modified the surveys over the years by changing its rating scale in 1992 and 1998. The wording was also changed in 1998, with further changes following in 1999.210 Consequently, as Pacific’s witness, Dr. Hauser stated “In the Pacific CSQ survey, it is extremely difficult to compare responses prior to January 1998 with responses after the change in wording.211 Therefore, he compared the data for the years 1994-1997 and 1998-2001 and presented the results in Attachment 32 and 33 of his testimony. According to Dr. Hauser, “Pacific’s customers who are surveyed about repair work are three to six percentage points less dissatisfied than the average of the top ten LECs. Furthermore, Pacific’s customers are less dissatisfied about the business office and installation work for each customer group surveyed. This analysis suggests that Pacific’s service is good relative to its peers in 2001.”212 Dr. Hauser also examined the percentage change between 1998 and 2001 and reported the results in Attachment 32 of his testimony. According to his findings, Pacific’s customers’ dissatisfaction rose for only installation services for residential and large business customers and business office services for residential and large business customers. The dissatisfaction declined for all other services and categories. In comparison, over the 209 Exh. 2B: 358 at 7:5-12 (Flynn Direct Testimony)210 Id. at 7:16-22 and 8:1-17 (Flynn Direct Testimony).211 Exh. 2B:354 at 34:14-15 (Hauser Direct Testimony). 212 Id. at 37:16-21 (Hauser Direct Testimony).
128

R.01-09-001, I.01-09-002 COM/SK1/MP1/bb1
same period, the dissatisfaction for the services of the reference group rose for all categories except for repair services for large business customers. Pacific’s witness Mr. Flynn identified dissatisfied ratings as relatively stable from 1994 through 2001.213
During the audit phase of this proceeding, the Commission’s consultant, Overland Consulting (Overland), alleged that Pacific used a third-party research firm to conduct customer satisfaction surveys during the NRF period, and that Pacific did not file the surveys with the Commission as required by the NRF monitoring program.214 According to Overland, the surveys were conducted under Pacific’s Customer Service Quality (CSQ) process, and surveyed customers who had recent experience with Pacific in the areas of sales, billing, maintenance, installation, and operator services.
Overland reported that Pacific should have filed the surveys under NRF monitoring report P.A. 02-03, and that Pacific refused Overland’s requests for copies of the surveys. In response to Overland’s assertion that Pacific failed to file the surveys as required, Pacific states, “It is possible Overland has confused two monitoring reports, P.A-02-03 and P.A-02-04. Pacific understands that P.A-02-03, Customer Survey Report, refers to surveys initiated by the Commission . . . .”215 Pacific argues that it should not be obliged to produce its customer surveys because the requirement “has not been raised by the Commission or its staff in the last 11 years. . . .”216
213 Exh: at 12:2-3 (Flynn Direct Testimony). 214 Exh. 2A:404, at 21-19 (Audit Report)215 Exh. 2B:340 at 22-23 (Hayes Direct Testimony).216 Id.
129

R.01-09-001, I.01-09-002 COM/SK1/MP1/bb1
We have reviewed the origins and purposes of reports P.A. 02-03 and P.A. 02-04, and find substantial confusion. In 1991, the Commission in D.91-07-056 also directed the staff to produce “a written assessment explaining who prepares each monitoring report that the utilities provide to our staff, and what purpose each of these reports serves for the utility and for the staff.”217 The staff’s Monitoring Report Assessment, filed on May 1, 1992, contained the following description of “Customer Surveys” Pacific is required to file under report P.A. 02-03:
6. Customer Surveys: These surveys are given to customers who have direct contact with Pacific Bell and are used to measure customer satisfaction levels and perceptions of the company. These surveys are conducted through the Corporate Research organization at Pacific Bell, and historically have been provided to the DRA Telecommunications Rate Design Branch, and is [sic] used in DRA’s ongoing service quality evaluation. The surveys are provided as initiated. It is recommended that these surveys continue.”218
This appears to accurately describe the data submitted under PA 02-04.
The Monitoring Report Assessment also describes a separate set of ongoing survey results that Pacific is required to file monthly under Report P.A. 02-04, as follows:
“7. Quality of Service Performance – Customer Opinion Surveys: These surveys are conducted by the Company Measures and Statistics organization at Pacific Bell. A monthly report identifying the percentage of customers that are satisfied with Pacific Bell’s service quality is provided to the DRA Telecommunications Rate Design
217 Id., OP 6.218 New Regulatory Framework Monitoring Report Assessment, I.87-11-033,
Commission Advisory and Compliance Division, May 1, 1992, at 6 and 60 (emphasis added).
130

R.01-09-001, I.01-09-002 COM/SK1/MP1/bb1
Branch. DRA uses the information in these reports is used in it’s [sic] service quality monitoring efforts. It is recommended that these surveys continue.”219
The reports submitted under PA 02-04 do not appear to meet this description.
Pacific asserts that the P.A. 02-03 report refers only to surveys initiated by the Commission. Pacific’s witness states that, if Pacific’s understanding of its reporting obligation is incorrect, neither the Commission nor its staff has raised it as an issue in all the prior years of NRF monitoring. From the record of this proceeding, it is unclear whether any other survey data exist.
Despite the controversy surrounding the existence of PA.02-03 surveys, the extensive PA. 02-04 data were only minimally addressed in this proceeding by ORA. In addition, Pacific’s ARMIS 43-06 service quality data was not discussed by ORA. TURN cited D.01-12-021 and stated that “there is nothing in the record of this proceeding that warrants the Commission revisiting the conclusion it reached in D.01-12-021 – the customer perception measured by the ARMIS data is not synonymous with Pacific’s achieved level of service quality.”220
Although our previous decision rightly cautions reliance on survey data as a full measure of service quality, TURN’s citation to this decision is irrelevant for the matter before us. Here, we use survey data as part of a systematic assessment of service quality that relies principally on the statistical analysis of direct measures of service quality. The failure of ORA and TURN to address this survey data is disappointing, and confirms our independent judgment that Pacific’s surveys are accurate. Moreover, their principal finding of 219 Id.220 Opening Brief TURN at 31.
131

R.01-09-001, I.01-09-002 COM/SK1/MP1/bb1
consumer satisfaction is consistent with the conclusion that we have drawn from our analysis of direct measures – Pacific’s overall performance is good.
In conclusion, we note that Pacific has fully reported on its P.A. 02-04 surveys, which show a record of strong customer satisfaction. We find no reason to believe that anything other than a good-faith confusion has led to the lack of reports to be filed under P.A. 02-03. We will resolve this reporting confusion in the next phase of this proceeding. The central question that we will address is whether Pacific has provided the Commission all the data that it has. From our review of the record, it appears that this simple question was never directly asked or answered.
B. Customer Satisfaction and Service Quality Surveys – Verizon
1. ORA SurveyORA’s customer service quality survey for Verizon showed that
in the minds of the customers surveyed, Verizon’s service quality has improved since 1991.
2. Verizon’s SurveysVerizon claims it surveys its California customers by conducting
over 1,000 interviews per month covering Directory Assistance, Consumer and Business Provisioning (which covers installation of new service), Consumer and Business Repair (which covers diagnosis, repair, and restoration of existing service), and Consumer and Business Request and Inquiry (which covers requests and inquires directed to the Business Office regarding customer bills, products and services, prices, and company policies).221 The results of these
221 Verizon Opening/Service Quality at 51-52.
132

R.01-09-001, I.01-09-002 COM/SK1/MP1/bb1
surveys show that Verizon offers good service quality. Neither ORA nor TURN challenged the results of these surveys.
VI. Other Direct Measures of Service Quality In addition to the systematic study of service quality measures
and a survey based assessment of customer experiences, it is also important to examine the experiences of those customers who have had the worst experiences with telecommunications utilities. For this reason, we now examine the history of complaints for Pacific and Verizon, starting with customer complaints and ending with those that have led to formal regulatory proceedings.
Before our analysis of complaints, we must know the customers served by Pacific and Verizon. According to each company’s annual reports to the FCC for 2001 included in the table below, we find that Pacific has 25.4 million access lines, while Verizon has 6.3 million access lines.
CALIFORNIA LEC YEAR-2001 NUMBER OF ACCESS LINES222
SWITCHED NON-SWITCHED TOTAL
COMPANY ACCESS LINES ACCESS LINES ACCESS LINES
PACIFIC BELL
17,548,599
7,858,177
25,406,776
VERIZON CALIFORNIA,
INC.
4,721,336
1,621,152
6,342,488
Thus, with service levels of this size, it is reasonable to expect a number of complaints. Moreover, while making comparisons between the two utilities, we must remember that Pacific has approximately 4 times the number of access lines in California than does Verizon.
222 Source: Pacific and Verizon ARMIS 43-08 reports, Table III, for 2001, available at http://gullfoss2.fcc.gov/cgi-bin/websql/prod/ccb/armis1/forms/43-08/frame3.hts.
133

R.01-09-001, I.01-09-002 COM/SK1/MP1/bb1
A. Informal Complaints: Pacific Low Incidence
In the OII initiating this proceeding, the Commission listed informal complaint data for Pacific Bell in Appendix C, as follows:
Number of Informal Complaints Filed at the Commission January 1, 1995, through July 12, 2001
Pacific Bell
Category of Complaint
1995 1996
1997
1998
1999
2000
2001
1 Delayed Orders & Missed Appoint.
71 259 644 650 409 623 157
2 Quality of Service (e.g., static, crossed lines, intermittent service, etc.)
947 1,416
1,780
1,639
1,095
1,324
380
3 Disputed Bill 1,334
1,733
2,171
2,113
1,404
2,365
1,249
4 Disconnections 93 186 286 441 306 500 1735 Deposits 111 100 191 176 128 104 436 Disputed
Customer of Record
166 121 206 239 238 134 55
7 No Notice 39 65 104 125 127 15 08 Late Payment
Charge 12 6 10 10 13 0 0
9 Rate Design 175 62 82 150 39 20 1110
Rules 363 272 465 249 78 152 82
11
Directory 143 89 144 123 109 13 0
12
Company Practice
459 376 319 303 131 498 249
13
Miscellaneous 286 317 262 272 273 294 120
1 Baseline 0 0 1 1 0 0 0
134

R.01-09-001, I.01-09-002 COM/SK1/MP1/bb1
Pacific Bell
Category of Complaint
1995 1996
1997
1998
1999
2000
2001
415
Surcharges/Taxes
13 17 73 47 145 55 36
16
Number/Area Code
2 31 48 48 46 18 8
17
Rate Protest 8 24 6 105 11 3 6
18
Master/Sub Meters
0 0 0 2 0 0 0
19
Bill Format 5 5 18 4 10 1 0
20
Commission Policy/Practices
2 1 1 1 4 0 0
21
Operator Services
1 11 12 29 35 2 0
22
Annoyance Calls
18 26 37 53 58 3 0
23
Payment Arrangements
223 295 609 420 124 10 20
24
Commitment 7 52 923 301 100 55 6
25
Pay Per Call Service
65 44 94 26 17 3 1
26
Refusal to Serve
40 53 141 70 10 1 2
27
Estimated Billing
0 1 0 1 0 0 1
28
Deaf Program 0 1 1 2 7 2 2
29
Balance/Level Pay Plan
0 0 0 1 0 0 0
30
Illegal Activities
0 0 0 1 0 6 0
31
COPT 9 12 8 9 3 2 1
135

R.01-09-001, I.01-09-002 COM/SK1/MP1/bb1
Pacific Bell
Category of Complaint
1995 1996
1997
1998
1999
2000
2001
32
Custom Calling Features
160 426 129 294 271 472 42
33
Inside Wiring 98 54 70 100 62 28 6
34
Abusive Marketing
41 41 48 53 93 86 26
35
Backbilling 0 0 8 12 21 7 1
36
Centralized Credit Check System
21 7 4 29 59 7 0
37
Female/Minority Business Enterprise
0 1 4 2 0 0 0
38
Mergers 0 5 0 0 1 0 0
39
Low Income Programs
17 9 11 2 18 10 10
40
New Incentive Regulatory
274 7 6 7 13 5 2
41
Safety 0 5 9 10 4 11 3
42
Electromagnetic
0 0 0 1 0 0 0
43
Landline to Cellular
0 0 0 2 4 0 0
44
Improper Advertising
0 0 0 13 8 1 0
45
Cramming 0 0 1 30 27 77 75
46
Outages 0 0 0 4 7 64 15
47
Anonymous Call Rejection
0 0 0 21 5 0 0
4 Prepaid Phone 0 0 0 0 2 3 2
136

R.01-09-001, I.01-09-002 COM/SK1/MP1/bb1
Pacific Bell
Category of Complaint
1995 1996
1997
1998
1999
2000
2001
8 CardTOTALS 5,20
36,13
08,92
68,19
15,51
56,97
42,78
4
In Exhibit 2B:701(C),223 the Commission’s legal staff clarified how the data in the foregoing table were derived. The data were compiled from summary reports maintained in the database of the Commission’s Consumer Affairs Branch (CAB). An informal complaint, as the term is used in the context of the foregoing data, “is one that is handled by CAB staff in an attempt to come to a mutually agreed upon resolution between the consumer and the utility.”224 The numbers do not include formal complaints, which “consumers may also file . . . with the Commission and [which] are handled by the ALJ Division.” CAB also furnished Pacific Bell the underlying data from which it compiled the results.
Pacific did not object to receipt of the complaint information into evidence.225 Thus, we will assume the informal complaint figures are valid as reported.
Because the informal complaint data were not organized into categories reflective only of service quality problems, we have
223 The “C” designates a confidential exhibit. However, none of the summary statistics contained in Appendix C to the OII in this decision require confidential treatment, as they do not identify individual customers or otherwise compromise the trade secrets of any telephone company.224 Id. 225 See 23 RT 2998:10-25.
137

R.01-09-001, I.01-09-002 COM/SK1/MP1/bb1
summarized the results of complaints that relate most directly to service quality. The results are as follows:
138

R.01-09-001, I.01-09-002 COM/SK1/MP1/bb1
Note: 2001 has data for only part of the year
It is difficult to analyze these data in all their possible permutations, but we can make at least two observations. First, informal complaints were at their highest in 1997-98 and 2000. They spiked in 1997, and are lower now
It is difficult to assess what this data means. Clearly the data show that over the last six years, the number of complaints filed at this Commission has varied greatly without any linear trend. On the other hand, with 25.4 million access lines in California, the number of service quality complaints made by customers affects a very small percentage of lines in service. In 1997, the worst year, informal complaints made to the Commission totaled 7360, or only 0.04% of lines were affected by a service quality complaint. This is approximately 4 in 10,000 lines. In 1995, the best year in our
139
1995 1996 1997 1998 1999 2000 2001 TotalDisputed Bill 1334 1733 2171 2113 1404 2365 1249 12369Quality of Service 947 1416 1780 1639 1095 1324 380 8581Operator Services 1 11 12 29 35 2 0 90Safety 0 5 9 10 4 11 3 42Outages 0 0 0 4 7 64 15 90Delayed Orders & Missed Appts 71 259 644 650 409 623 157 2813Missed Commitments 7 52 923 301 100 55 6 1444Bill Format 5 5 18 4 10 1 0 43Payment Arrangements 223 295 609 420 124 10 20 1701Inside Wiring 98 54 70 100 62 28 6 418Backbilling 0 0 8 12 21 7 1 49Disconnections 93 186 286 441 306 500 173 1985Deposits 111 100 191 176 128 104 43 853Disputed Customer of Record 166 121 206 239 238 134 55 1159No Notice 39 65 104 125 127 15 0 475Late Payment Charge 12 6 10 10 13 0 0 51Company Practice 459 376 319 303 131 498 249 2335TOTAL 3566 4684 7360 6576 4214 5741 2357 34498
Pacific Complaint Data by Service Quality Related Categories(1995-July 12, 2001)

R.01-09-001, I.01-09-002 COM/SK1/MP1/bb1
sequence (2001 is a partial year), there were 3566 complaints. This is approximately .02%, or approximately 2 in 10,000 lines. Thus, the Commission’s complaint data provides information on the experiences of only a very small number of customers.
B. Informal Complaints: Verizon Very Low IncidenceThe OII initiating this proceeding also attached Verizon’s
informal complaint record, as follows:Number of Informal Complaints Filed at the Commission
Verizon - January 1, 1995, through July 12, 2001Category of Complaint
1995 1996 1997 1998 1999 2000 2001
1 Delayed Orders &
Missed Appoint.
20 7 44 94 44 80 44
2 Quality of Service
(e.g., static,
crossed lines,
intermittent
service, etc.)
183 250 243 217 193 188 77
3 Disputed Bill 502 655 767 807 489 692 365
4 Disconnections 29 56 61 106 61 59 35
5 Deposits 39 44 47 21 23 22 7
6 Disputed
Customer of
Record
27 21 53 59 67 37 12
7 No Notice 14 31 22 19 26 0 0
8 Late Payment
Charge
3 3 5 7 4 0 0
9 Rate Design 300 28 47 67 9 9 6
10 Rules 20 52 74 69 16 20 21
11 Directory 25 31 47 107 39 0 0
12 Company
Practice
26 79 54 58 21 60 44
13 Miscellaneous 76 54 47 77 61 57 25
14 Baseline 0 0 0 0 0 24 0
15 Surcharges/Taxes 15 2 18 36 28 8 14
16 Number/Area
Code
1 0 15 14 22 0 1
17 Rate Protest 1 0 2 3 2 0 0
18 Master/Sub
Meters
0 0 0 0 0 0 0
140

R.01-09-001, I.01-09-002 COM/SK1/MP1/bb1
19 Bill Format 5 1 3 2 1 0 0
20 Commission
Policy/Practices
0 1 1 0 0 0 0
21 Operator Services 0 2 8 6 9 0 0
22 Annoyance Calls 6 5 10 6 14 0 0
23 Payment
Arrangements
30 17 38 73 28 5 3
24 Commitment 0 1 9 16 12 2 1
25 Pay Per Call
Service
16 19 15 13 5 0 0
26 Refusal to Serve 11 2 14 12 2 1 1
27 Estimated Billing 0 0 0 1 0 0 0
28 Deaf Program 0 2 0 0 2 1 0
29 Balance/Level
Pay Plan
0 0 1 1 0 0 0
30 Illegal Activities 0 0 0 0 0 2 0
31 COPT 2 0 5 3 0 0 0
32 Custom Calling
Features
21 93 45 42 44 21 0
33 Inside Wiring 13 1 12 13 16 6 3
34 Abusive
Marketing
10 35 31 36 19 22 21
35 Backbilling 2 0 3 2 2 1 1
36 Centralized Credit
Check System
50 28 43 24 20 1 0
37 Female/Minority
Business
Enterprise
0 0 0 0 0 0 0
38 Mergers 0 0 0 0 0 0 0
39 Low Income
Programs
14 3 18 0 5 8 2
40 New Incentive
Regulatory
265 1 1 4 3 0 0
41 Safety 0 0 0 1 1 0 1
42 Electromagnetic 0 0 0 0 0 0 0
43 Landline to
Cellular
0 0 0 0 1 0 0
44 Improper
Advertising
0 0 0 0 3 0 0
45 Cramming 0 0 0 16 10 6 7
46 Outages 0 0 0 0 0 3 9
47 Anonymous Call
Rejection
0 0 0 0 0 0 1
48 Prepaid Phone
Card
0 0 0 1 1 1 0
141
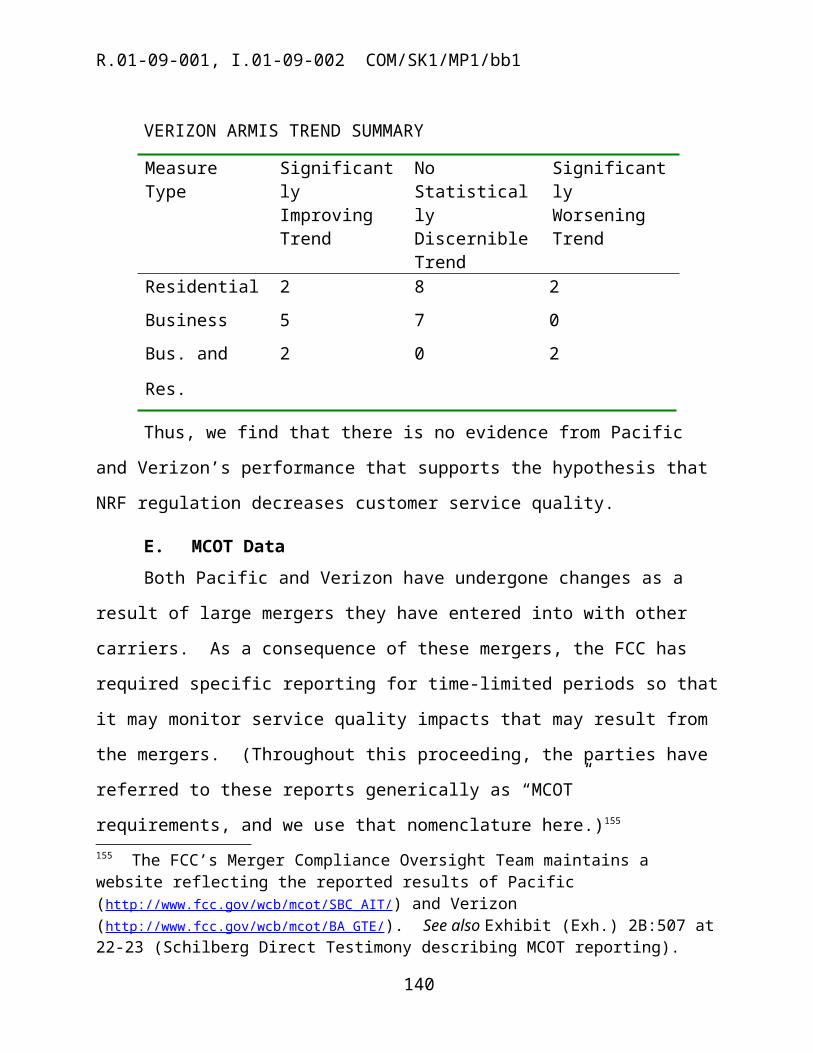
R.01-09-001, I.01-09-002 COM/SK1/MP1/bb1
TOTALS 1,726 1,524 1,803 2,033 1,303 1,336 701
Verizon’s totals compare to Pacific’s as follows:
Verizon 1995 1996 1997 1998 1999 2000 2001
Totals 1,726 1,524 1,803 2,033 1,303 1,336 701
Pacific
1995 1996 1997 1998 1999 2000 2001
Totals 5,203 6,130 8,926 8,191 5,515 6,974 2,784
We note that Verizon’s pattern of complaints has the same spiked pattern as Pacific’s, jumping in 1997 and 1998, and then declining. This repetition of the pattern suggest a causal factor beyond the companies’ control.
However, Pacific also has more than 4 times the number of access lines in California than does Verizon. If one organizes Verizon’s data into the same categories as we did for Pacific – that is, those most directly related to service
142

R.01-09-001, I.01-09-002 COM/SK1/MP1/bb1
quality, Verizon’s numbers are far lower proportionately than Pacific’s:
Pacific’s comparable numbers – with four times the access lines – are as follows:
If one multiplies the Verizon figures by 4, Verizon’s proportional numbers are generally lower than Pacific’s. This finding comports with the assessment that we earlier made on service quality measures: in general, Verizon’s service quality is better than Pacific’s.
143
1995 1996 1997 1998 1999 2000 2001 TotalDisputed Bill 502 655 767 807 489 692 365 4277Quality of Service 183 250 243 217 193 188 77 1351Operator Services 0 2 8 6 9 0 0 25Safety 0 0 0 1 1 0 1 3Outages 0 0 0 0 0 3 9 12Delayed Orders & Missed Appts 20 7 44 94 44 80 44 333Missed Commitments 0 1 9 16 12 2 1 41Bill Format 5 1 3 2 1 0 0 12Payment Arrangements 30 17 38 73 28 5 3 194Inside Wiring 13 1 12 13 16 6 3 64Backbilling 2 0 3 2 2 1 1 11Disconnections 29 56 61 106 61 59 35 407Deposits 39 44 47 21 23 22 7 203Disputed Customer of Record 27 21 53 59 67 37 12 276No Notice 14 31 22 19 26 0 0 112Late Payment Charge 3 3 5 7 4 0 0 22Company Practice 26 79 54 58 21 60 44 342TOTAL 893 1168 1369 1501 997 1155 602 7685
Verizon Complaint Data by Service Quality Related Categories(1995-July 12, 2001)
1995 1996 1997 1998 1999 2000 2001 Total
TOTAL 3566 4684 7360 6576 4214 5741 2357 34498
Pacific

R.01-09-001, I.01-09-002 COM/SK1/MP1/bb1
Beyond this obvious result, it is difficult to assess just what this data means. Once again, the percentages of lines affected by an informal Commission complaint are extremely small. In 1998, Verizon’s worst year, only 0.03% of lines were affected by a service quality complaint. This is approximately 3 per 10,000 lines. In Verizon’s best year, 1995 (2001 is not a complete year), the percentage is 0.02% or about 2 per 10,000 lines. Thus, only a very small percentage of access lines are affected by a Commission-filed customer complaint.
C. Formal Complaints – PacificTURN relies on several formal Commission proceedings to make
its case that service quality has declined under NRF. We briefly discuss each below. TURN also notes that the pace of such cases seems to have increased since 1995, indicating that the tendency for service quality decline under NRF has not diminished with the passage of time.
TURN’s list of proceedings shows that there have been at least six proceedings finding serious problems with Pacific’s service quality since 1995, as compared to two proceedings in the five-year period from January 1990-December 1994. TURN points to the following cases over the period 1991-present:
C.91-03-006/D.93-05-062 regarding late payment charges. Pacific was found to have imposed erroneous late payment charges for five years because it did not timely process payments as they came into its payment processing center.226 The decision found that, because of an apparent aversion to incurring increased costs, Pacific failed to implement internal recommendations to
226 D.93-05-062, mimeo., at 15, 1993 Cal. PUC LEXIS 394, at *21.
144

R.01-09-001, I.01-09-002 COM/SK1/MP1/bb1
fix its payment processing system.227 The Commission required Pacific to refund $34 million in unlawful late charges, and to pay a $15 million fine.
A.92-05-002/D.94-06-011 NRF review; settlement with ORA’s predecessor, DRA, regarding Pacific’s TRSAT answer times, among other things.228
A.95-12-043/D.97-03-021 regarding ISDN.229 The Commission found Pacific had insufficient staffing, and poor installation and customer service records, and noted that incentives to cut costs prevented Pacific from addressing the problem. We found that, “Pacific does not provide high quality customer services to its ISDN customers and potential ISDN customers . . . .”230
A.96-04-038/D.97-03-067 regarding the Pacific Telesis/SBC merger.231 In this case, ORA’s predecessor (DRA) presented evidence of Pacific’s poor performance on its TRSAT and BOAT reports. DRA also claimed that an inadequate workforce caused service deterioration in the TRSAT. The Commission concluded in D.97-03-067 that, “Pacific is and has been out of compliance with GO 133-B, apparently for some time. . . . Pacific failed to meet [the] standard for trouble report answering time almost 50% of the time for the period 1993 through the first six months of 1996 . . . .”232
227 D.93-05-062, 49 CPUC 2d 299, 309.228 1994 Cal. PUC LEXIS 456, at *158-59.229 1997 Cal. PUC LEXIS 142. ISDN was an early means of boosting the capacity of existing copper connections between a customer’s premises and Pacific’s switching facilities. 230 Id. at *50, finding of fact 17. See also Exh. 2B:507 at 10-11 (Schilberg Direct Testimony).231 1997 Cal. PUC LEXIS 629, at *131, 71 CPUC 2d 351, 395 (1997).232 D.97-03-067, 1997 Cal. PUC LEXIS 629, at *131, 71 CPUC 2d 351, 395 (1997).
145

R.01-09-001, I.01-09-002 COM/SK1/MP1/bb1
The Commission threatened Pacific with penalties if it did not improve its results in 90 days. Subsequently, Pacific’s TRSAT and BOAT results improved, and no penalties were imposed.
C.98-04-004/D.01-09-058 regarding Pacific marketing abuse.233 The Commission found that Pacific provided poor service quality and failed adequately to disclose information regarding its Caller ID, Wire Pro, and “The Basics” packaged services.
C.99-06-053/D.01-10-071, in which Pacific was accused of deceptively marketing its “Saver 60” intraLATA toll calling plan. D.01-10-071 found that “The facts of this case show that Pacific acknowledged its error, took steps to avoid perpetrating the error (including a self-imposed ban on averaging customers’ variable usage data), and promptly processed refunds for those customers disadvantaged by the error.” Pacific settled by agreeing to provide customers notification of the error, make refunds and establish a two-way feedback/complaint mechanism for telemarketing services.234
C.99-16-018/D.01-12-021 found that the 45% increase in the average number of hours to restore dial tone service to residential customers over the period 1996 – 2000 violates § 451., as well as a Commission-ordered condition of the SBC/Telesis merger.235 The Commission also found that Pacific did not inform customers of their right to be given a window of time within which a representative would complete required service.
C.02-01-007/D.02-10-073 regarding DSL. Settled with Commission adopting Pacific’s proposed penalty payment into the State general fund of $27 million. Pacific agreed in the settlement that “During the period of January 2000 through the [date of the settlement
233 2001 Cal. PUC LEXIS 914.234 D.01-10-071, 2001 Cal. PUC LEXIS 961, at *9-10.235 This finding comports with our own analysis of ARMIS data above.
146

R.01-09-001, I.01-09-002 COM/SK1/MP1/bb1
agreement], an estimated 30,000 to 70,000 [of Pacific’s DSL affiliate’s] customers complained about and/or experienced billing errors” and that these errors “were not resolved in a timely manner and/or required multiple calls and substantial investment of time to resolve.”236
Pacific does not appear to have addressed the formal complaint data TURN cites, except to note that those proceedings should not be considered part of the record of this proceeding, and are irrelevant to an assessment of Pacific’s service quality during the NRF period.
We may take official notice of actions of this Commission pursuant to Rule 73. Thus, the formal complaints Commission proceedings TURN or any party cites with regard to Pacific (or Verizon) need not be a part of the record of this proceeding in order for us to rely on them in rendering this decision.
Moreover, we disagree with Pacific’s contention that its performance in the context of the listed formal proceedings is irrelevant here. This proceeding is our opportunity to examine the entirety of Pacific’s record, and we find that these cases, when examined together, indicate that regulatory monitoring and enforcement is essential to maintenance of good service quality. Moreover, these regulatory findings from formal proceedings tend to complement our own findings made on an analysis of the GO 133-B and ARMIS data.
TURN is correct that the pace of meritorious complaints has increased since 1995. We find that there were far fewer instances where the Commission has found violations of service quality rules or related matters during a similar time period preceding NRF.
236 D.02-10-073, mimeo., at 8.
147

R.01-09-001, I.01-09-002 COM/SK1/MP1/bb1
What, however, do a mere eight enforcement proceedings spread out over more than a decade mean? Indeed, it is not possible to draw a statistical conclusion by simply observing the increase in formal proceedings when there are so few proceedings. In particular, we cannot say whether NRF itself caused the increase in formal complaints. Moreover, despite the increase in formal complaints, our data indicate a general improvement in Pacific’s service quality under most measures. (Trouble repair intervals, associated with several of the formal complaints, remain a notable exception to this trend.) As noted earlier, NRF triggered a more systematic monitoring of service quality than was conducted in the pre-NRF period, and led to a greater Commission focus on service quality issues. Moreover, in the next section, we will see that Verizon exhibited the exact opposite pattern, an outcome that sheds doubt on the assignment of causality to NRF regulation.
The problems addressed in these formal cases are likely independent from the existence of the NRF framework – they could still have occurred if Pacific had been subject to a GRC framework. For example, the largest fine associated with an enforcement case for Pacific was prior to the existence of NRF.237 The refunds and costs associated with that case – over $95 million – virtually equals the combined fine amount of all the formal cases in the post-NRF period. We cannot conclude based on the record of this case, that NRF is responsible for this increase in formal complaint decisions adverse to Pacific, or that the problems that prompted these complaints would have been less significant under rate of return regulation.
237 D.89-06-054.
148

R.01-09-001, I.01-09-002 COM/SK1/MP1/bb1
By the same token, we observe that these decisions reflect specific deficiencies in Pacific’s service quality that required the expenditure of significant resources – of the complaining parties and the Commission – to correct. NRF did not prevent these problems from developing and that it became necessary for parties to take the significant step of pursuing formal complaints in order to correct the problems.
Consistent with the legislative goal of providing high quality telecommunications services to all Californians, 238 the Commission strives to ensure that customers do not experience any problems that violate statutory and other service quality requirements. We invite parties in phase 3B of this proceeding to consider whether the foregoing complaints give rise to a need for monitoring, incentives, or other regulatory methods to address service quality problems identified in this decision, and to present proposals that might limit or prevent future violations of service quality statutes, rules and orders, without making it necessary for parties to pursue lengthy formal complaint processes. In addition, as noted previously, our open docket to revise GO 133-B (R.02-12-004) also provides an opportunity to consider reforms to service quality measures.
D. Formal Complaints – Verizon TURN cites two formal proceedings that it alleges show
problems with Verizon’s service quality:
A.92-05-002/D.94-06-011 regarding GTEC (Verizon’s predecessor) answer times and switch outages.239 The Commission found that GTEC’s answer times failed to
238 Section 709(a)239 1994 Cal. PUC LEXIS 456.
149

R.01-09-001, I.01-09-002 COM/SK1/MP1/bb1
meet minimum GO 133-B standards. For example, GTEC failed to meet the GO 133-B answering time standard for its Customer Care Centers in 17 out of the 24 months in 1991 and 1992. For the Customer Billing Centers, the average speed of answering time was approximately two minutes: 126.1 seconds and 113.1 seconds, respectively.240 GTEC also had a high customer billing error rate, a disproportionately high number of informal complaints, inconsistencies in its service quality monitoring data and problems with its calling cards.
C.98-04-004/D.98-12-084, approving GTEC’s payment of $13 million to settle marketing abuse claims stemming from the period 1989-92. 241 However, we later found that we did not have all the facts surrounding the abuse in requiring GTEC to distribute $ 3.2 million among local groups within the Hispanic community for the purpose of telecommunications education and to report the names of recipients and amounts of contributions above its normal contributions. 242
We disagree with TURN’s conclusion that this complaint data provides substantial evidence of poor service quality. The first complaint tracks the findings of our own data analysis – in some years Verizon failed to meet the GO 133-B service quality standards in certain months. The decision in this proceeding reflects some significant problems with Verizon’s service quality early in the NRF period, but, as the foregoing analysis shows, to Verizon’s credit, the company swiftly corrected these problems after they were identified.
The second complaint reflects a serious marketing abuse problem, again early in the NRF period. The problem has not recurred. Nevertheless, Verizon’s formal complaint history during the 240 1994 Cal. PUC LEXIS 456, at *154.241 D.98-12-084, 1998 Cal. PUC LEXIS 910, at *13.242 D.98-12-084, 1998 Cal. PUC LEXIS 910, at *13.
150

R.01-09-001, I.01-09-002 COM/SK1/MP1/bb1
NRF period compares favorably to Pacific’s record and to its own prior record. While GTEC did not bring to light the true facts surrounding the marketing abuses in the second case until 1997, the Commission did not find that the abuses themselves continued after 1992. Therefore, Verizon’s formal complaint history, standing alone, does not indicate a significant and continuing service quality problem.
VII. Other Issues In This ProceedingAs noted previously, this was a very contentious proceeding with
numerous issues and disputes arising between parties. Although few of these issues were germane to our analysis of service quality, we address them in this section of the report.
A. Allegation by TURN that Pacific Inappropriately Aggregated Data Lacks Merit
TURN criticizes Pacific for aggregating data as part of Dr. Hauser’s regression analysis.
We note that in our own analysis, we have not relied on any aggregate data. Moreover, we found much of the raw data contained in Dr. Hauser’s testimony proved critical to our analysis. Quite simply, we cannot understand the basis for TURN’s allegation. Our own analysis does not share that failing.
B. Technological Change and Affects on Pacific’s Service Quality – None Documented
TURN contends that Pacific’s deployment of advanced services – primarily its DSL service – threatens to create two classes of customers, those who have excellent service quality by virtue of their access to the most advanced telecommunications infrastructure, and “have nots” who have not had such architecture installed.
151

R.01-09-001, I.01-09-002 COM/SK1/MP1/bb1
TURN’s witness Terry Murray claimed that with Pacific’s introduction of “Project Pronto,” a project that involved broad deployment of advanced services technology, Pacific promised improvements in service quality from the new service. While Pacific backed off from several of its 1999 broadband network claims at hearing, in 1999 Pacific told investors that the new technology would 1) “be less vulnerable to weather conditions, thereby reducing trouble reports,” 2) have “reduced activity . . . in the remaining copper plant because of improved reliability,” 3) “avoid dispatches on many installations [and thereby] realize efficiencies in [SBC’s] installation and maintenance operations,” and 4) “substantially reduce the need to rearrange outside plant facilities when installing new or additional services.”243
Pacific’s witness confirmed the foregoing 1999 claims at hearing.244 For example, Pacific conceded that the use of fiber for voice service improves trouble report performance, that if fiber signal quality exceeds the minimum standard, Pacific does not reduce the quality to that minimum,245 and that, at least with regard to data
243 Exh. 2B:505A (Confidential Exhibits to Murray Direct Testimony), SBC Investor Briefing, “SBC Announces Sweeping Broadband Initiative,” dated Oct. 18, 1999, at 7. There is nothing confidential about the investor briefing; indeed, the parties referred to its contents during the hearing.244 Exh. 2B:360 at 9:10-23 (Boyer Reply Testimony); 23 RT 2915:11-14 & 2916:22-24 (Boyer) (“[T]he use of fiber to provide voice services could positively affect certain facts that contribute to trouble reports. . . . ALJ Thomas: And trouble reports affect customers? Witness Boyer: I will agree with that.”).245 23 RT 2914:23-26 (Boyer).
152

R.01-09-001, I.01-09-002 COM/SK1/MP1/bb1
transmission, fiber loops may allow data to travel at the standard 56k modem speed, while copper loops may not.246
There is, however, a clear disparity between claims and performance. DSL deployment, as our formal complaint history illustrates, has led to increases in service quality, not the nirvana promised. Thus, we greet both Pacific’s claims and TURN’s allegations with skepticism.
TURN also alleges that selective deployment of broadband services creates the risk of discrimination in service provision. TURN argues: “The service quality enhancement of Project Pronto and similar major network improvements raises the possibility of the improvements being deployed in a manner that produces two-tiered basic service and distinct sets of ‘haves’ served off an advanced system and ‘have-nots’ served off the unimproved network.”
Pacific claims any such potential was mitigated in the Commission’s SBC/Ameritech merger conditions addressing DSL availability in low-income neighborhoods and rural areas, there are at least three limitations on these conditions.
Despite the allegations made by TURN and ORA, our own experience indicates that the deployment of new technologies will not be correlated with socio-economic status. It turns out that it is the economically exclusive hillside homes in Northern and Southern California where advanced services such as DSL have proved problematic to deploy. Moreover, our own experience with previous
246 Exh. 2B:357 at 45:9-12 (Resnick Reply Testimony) (“Although some customers have been able to use their 56 kbps [computer] modems to transmit data over voice-grade lines, transmission speeds of 56 kbps may not be attainable on POTS voice-grade lines for a number of reasons, such as bridge tap or loop length. Load coils and loop lengths can inhibit data transmission . . . .”).
153

R.01-09-001, I.01-09-002 COM/SK1/MP1/bb1
telecommunications technologies is that even when the timing of the deployment of a technology is driven by market factors, eventually a technology becomes ubiquitous. In addition, the timing of deployment frequently proves poorly related to socio-economic factors. Indeed, the legacy infrastructure of offices in urban centers can even make it easier to deploy new technologies in declining areas than in areas of new growth.
Thus, we have no evidence that the deployment of new technologies will create a group of technology haves and have-nots. Furthermore, it is still unclear how income levels will affect subscription to advanced services, and there is no evidence before us on this matter. TURN and ORA have not suggested anything more than vague regulatory action at this stage. ORA simply states that “[b]ased on the record of this proceeding and on that of other proceedings before it, the Commission needs to verify the service quality impacts of Project Pronto. . . .”247 TURN suggests no regulatory changes either.
We see no need for action in this matter. We also note that we have recently opened a comprehensive rulemaking on broadband issues, which will address this issue based on facts, not speculation.248
C. Growth – Pacific Pacific makes the point that its “service quality performance
should be viewed in the context of developments during the NRF period . . . [including] growth in demand.”249 It points not only to changes in the California economy that increase or decrease demand, 247 ORA Opening Service Quality at 25.248 R.03-04-030249 Pacific Opening/Service Quality at 46.
154

R.01-09-001, I.01-09-002 COM/SK1/MP1/bb1
but technological change that stimulates demand for more telephone lines. Pacific further cites unbundling and interconnection requirements imposed in the Telecommunications Act of 1996.
Our own analysis based on statistical trends blends periods of fast growth with slow or no growth, thereby providing a picture of service quality largely independent of growth trends.
D. Staffing – Pacific TURN further alleges that Pacific has cut staff in customer-
facing areas, harming service quality. It cites evidence that field staff positions were reduced at Pacific from 1989-95.250 It claims the number of splicing technicians decreased by 26%, the number of systems technicians decreased by 35%, and that the average years of experience of Pacific’s service technicians declined over that time period.
TURN also challenges Pacific’s increasing use of outside contractors to perform fieldwork. On this latter point, TURN calculates that outside field contractors caused 14% of the cable cuts causing 911 outages in 2001.251 Pacific does not refute this statistic.252
TURN claims that Pacific’s “outsourcing” of its DSL business to an unregulated affiliate – SBC’s Advanced Services, Inc. (ASI) – caused a rise in service quality complaints, leading to C.02-01-007.
ORA makes similar claims, and also points out that Pacific lent service employees to other states without regard for the impact these
250 TURN Opening/Service Quality at 17, citing Exh. 2B:507 at 8, table 1 (Schilberg Direct Testimony).251 TURN Opening/Service Quality at 36-37.252 Pacific Reply/Service Quality at 57.
155
R.01-09-001, I.01-09-002 COM/SK1/MP1/bb1
employee transfers would have on Pacific’s service quality back in California.
Pacific focuses on a different, later time period, and states that evidence TURN’s own witness presented shows that from 1996-2001, Pacific increased its staffing levels of personnel with direct customer interaction by over 30%. TURN concedes that Pacific increased the number of service representatives by 61% from 1996 to 1998.253 Pacific’s witness Mr. Resnick explained further that, after the recession in the early 1990s when demand slowed for Pacific’s services, Pacific actually increased these staffing levels by over 57%.
While the record supports the claim that Pacific’s staff decreased during the early years of NRF, it also appears Pacific made up for those losses in the second half of the 1990s, at least in the area of the customer-facing employees who have the most direct impact on service quality. We do not find that the record of this proceeding, standing alone, supports the claim that Pacific’s customer-facing staffing levels caused problems with service quality, especially since the uncontradicted evidence shows that Pacific increased its customer-facing staff in the latter part of the decade. We see no reason to change any reporting requirements in this area.
E. Weather – PacificPacific claims that rainfall increased its trouble ticket rates and
that findings regarding its service quality during periods of excessive rainfall should be tempered by this fact.
In response, ORA points out, Pacific’s data showed that trouble tickets actually increased as rain declined in certain years.254 ORA’s witness, Dale Piiru, therefore points out that Pacific’s witness “does
253 TURN Opening/Service Quality at 24.
156

R.01-09-001, I.01-09-002 COM/SK1/MP1/bb1
not provide an adequate correlation between extreme weather events (rainfall totals) and resulting protracted out-of-service intervals.”255
According to Piiru, ORA found that in 1994-95, when rainfall was higher and economic damage throughout the state 355% higher as compared to 1998, Pacific’s average residential repair intervals in 1994-95 were 49.25% less than in 1998. Overall, Pacific’s average residential out-of-service repair interval increased by 130% from 1994 to 1998, with a 70.6% increase between 1996 and 1998.256 Piiru concludes that Pacific’s assertions about weather and its impact on service quality are “overly general and unsupported.”257
Pacific contends that ORA erroneously bases its analysis of weather on the dollar value of economic devastation in 1994-95 as compared to the El Niño year in 1997-98, and that the damage in the San Francisco area, where Pacific serves “millions of customers” was far higher during the El Niño season. An examination of weather data reveals that during the 1997-98 El Niño season, rainfall in downtown
254 ORA Opening/Service Quality at 23, citing Exh. 2B:356 (Resnick Direct Testimony) (Q2-Q3 1997, Q2-Q3 1998, Q2-Q3 1999 and Q2-Q3 2000).255 Exh. 2B:139 at 3 (Piiru Reply Testimony).256 Id. at 4.257 Id. at 2.
157

R.01-09-001, I.01-09-002 COM/SK1/MP1/bb1
San Francisco was 47.19 inches,258 230% of normal seasonal rainfall.259
In the 1994-95 season, the comparable total was 34.02 inches.260 Thus, Pacific is correct that the 1997-98 season had greater
rainfall in San Francisco (the location on which Pacific focused) than did the 1994-95 season; that difference may explain some of the increase in trouble reports for the El Niño season as compared to 1994-95.261
Our analysis seeks to explain broad trends in service quality, not year-to-year variation. Although it is true that meteorological events such as rainfall affect service quality, we see no reason to modify any of our findings.
F. Marketing – PacificThe Commission’s authority over service quality encompasses
more than network technical performance.262 The Commission 258 Another website lists the total as 47.22 inches. http://ggweather.com/sf/daily.html#b. 259 See http://ggweather.com/nino/calif_flood.html & http://tornado.sfsu.edu/geosciences/elnino.html. Mr. Piiru cited the former website, and his testimony was admitted into the record without objection. Exh. 2B:139 at 4 & n.3 (Piiru Reply Testimony).260 http://ggweather.com/sf/daily.html#b. We may take official notice of rainfall totals pursuant to Rule 73.261 Comparable totals were as follows:
2000-01 19.47 inches1999-00 24.89 inches1998-99 23.49 inches1997-98 47.19 inches1996-97 22.63 inches1995-96 24.89 inches1994-95 34.02 inches1993-94 15.22 inches1992-93 26.66 inches1991-9219.20 inches1990-9114.08 incheshttp://ggweather.com/sf/daily.html#2002
262 “The Commission shall require telephone corporations to provide customer service to telecommunication customers that includes, but is not limited to… reasonable statewide service quality standards, including standards regarding network technical quality, customer service, installation, repair, and billing.” Cal. Pub. Util. Code § 2896(c).
158

R.01-09-001, I.01-09-002 COM/SK1/MP1/bb1
recently stated it “believe[s] that service quality measures should go beyond technical performance measures, and should also include measures of customer service and related consumer impact measures.”263 Thus, it is appropriate to consider trends and patterns in customer-affecting practices such as cramming, slamming and other marketing abuses during our assessment of service quality under NRF.
Both TURN and ORA point to cases in which the Commission found that Pacific engaged in abusive marketing to show problems in Pacific’s service quality.
Pacific has already been penalized in connection with those cases. Moreover, our statistical and survey measures pick up any long-term or residual impacts on customers. Thus, we see no need to re-examine this issue.
G. Still Other Issues – PacificFinally, TURN points to changes since NRF that it contends also
merit a reexamination of the incentives the framework creates. It claims that “to enhance revenues, utilities under incentive regulation will seek to charge for services that were formerly free.” It cites Pacific’s decisions to restrict the availability of free telephone directories and to charge more for directory assistance calls.
Pacific takes issue with TURN’s facts regarding directories and directory assistance calls.
We have no evidence to find a connection between the NRF mechanism and the changes TURN alleges. Moreover, this Commission approved the requested rate changes after an examination of costs and consistent with NRF. It would therefore be
263 R.02-12-004, mimeo., at 29.
159

R.01-09-001, I.01-09-002 COM/SK1/MP1/bb1
wrong to either penalize utilities or declare NRF a failure because NRF it operates as designed.
H. Movement of Functions to Unregulated Affiliates – Verizon TURN notes that “Recently, Verizon’s California predecessor
(GTEC) and Pacific Bell have respectively been merged into the nation’s largest and second largest carriers.”264 However, it identifies no specific problems stemming from the Verizon merger. TURN notes the FCC’s MCOT requirements stemming from the Verizon-Bell Atlantic merger expired in November 2002, but in its motion seeking an order continuing Pacific’s parallel reporting requirements, TURN stated that Verizon agreed voluntarily to continue these reporting requirements until after a final decision issues in this proceeding.
To make Verizon’s obligation the same as Pacific’s regarding MCOT reporting, we will require Verizon to continue to report MCOT data to this Commission until further notice. We agree with TURN that we should consider the usefulness of MCOT data in Phase 3B of this proceeding and determine whether we should require the carriers to continue to report such data even after their merger obligations expire.
Moreover, the assigned Administrative Law Judge made clear during the hearing that regulatory changes in this area are outside the scope of Phase 2A, and instead should be addressed in Phase 3B, if at all.265 We therefore defer this issue to later in this proceeding.
We note that there is one significant difference between Pacific and Verizon in the area of advanced services such as DSL, on which 264 TURN Opening/Service Quality at 7.265 18 RT 2263-67. Any reference to Phase 3B in this decision should be interpreted to include a separate phase if the Commission further segments this proceeding in the future.
160

R.01-09-001, I.01-09-002 COM/SK1/MP1/bb1
TURN focused much of its concern. While Pacific continues to offer its advanced services in a separate affiliate, Verizon seeks to transfer those services back to the regulated utility.266 If granted, the transfer may limit the concerns TURN raises, but it is premature to address this issue. Moreover, the organizational structure concerning the delivery of DSL services also involves complex Federal/State issues that we see no reason to examine here.
I. Service Performance Guarantee - VerizonVerizon offers its customers a “service performance guarantee”
(SPG) when customers believe – “rightly or wrongly”267 – that Verizon has delivered problematic service.268 We wholeheartedly support the SPG program as a good way to offer recompense to customers immediately after they suffer service problems.
In order for such a program to work fairly, Verizon should ensure it properly discloses the SPG to all customers. Moreover, because a customer must request the credit in order to get it – “it’s our procedure that the customer requests the credit”269 – it is very important that every customer know of the credit up front in order for 266 A.01-11-014. The Commission has not yet acted on this application, in part due to uncertainty about whether the Commission should decide competitive issues Verizon’s competitors raise with regard to DSL services in A.01-11-014 or in another more comprehensive proceeding regarding the incumbent local exchange carriers’ obligations to share DSL lines with competitive carriers (R.93-04-003 et al.).267 Verizon Reply/Service Quality at 23.268 Verizon’s SPG was originally a provision of Contel of California’s (Contel’s) tariffs prior to the GTEC/Contel Merger. ORA’s predecessor argued during the merger proceeding that Contel’s SPG was superior to Verizon’s, and adoption of Contel’s SPG by Verizon should be a condition of the merger. However, before the Commission ruled on the issue, Verizon voluntarily adopted the SPG contained in Rule Nos. 18 and 19 of its tariffs. Advice Letter No. 5521, filed August 30, 1993.
161

R.01-09-001, I.01-09-002 COM/SK1/MP1/bb1
it to be applied fairly. Therefore, it is important for Verizon to follow their procedures clearly.
We note that the procedures are clear and embedded in Verizon’s tariff. Moreover, there is no allegation in this proceeding that Verizon fails to follow it procedures, and no complaints concerning this matter. We see no need for further action on this matter. Indeed, in the absence of complaints, it would appear that regulatory scrutiny of a voluntary service quality initiative in excess of standard review of Verizon’s tariffs would simply create regulatory disincentives and regulatory uncertainties that would discourage similar offerings by other carriers.
J. Technological Change – VerizonNeither TURN nor ORA made specific allegations about Verizon
related to the impact of technological change on its service quality.
K. Growth – Verizon TURN made the same arguments with regard to Verizon as it did
regarding Pacific. TURN states that a carrier should not benefit from relaxed service quality expectations because it experiences a period of great growth in demand, access lines, customers, or company size.
Verizon does not disagree with TURN in this regard. Rather, it simply reports increases in demand for its services and explains the investments it made to meet this growth.
We note that the statistical methods used in this analysis did not make adjustments for adverse impacts of growth on Verizon’s service quality.
269 20 RT 2493:20-21. See also id. at lines 17-19 (Q. “Does a customer get . . . a credit without ever having called Verizon to complaint? A. No, they shouldn’t be . . . .”).
162

R.01-09-001, I.01-09-002 COM/SK1/MP1/bb1
L. Staffing – Verizon TURN shows that Verizon’s field staff has declined over the
period 1989-1994. TURN states that Verizon’s field staffing declined by 35% from 1989, the year the Commission implemented NRF, to 2000, with a large reduction (42%) occurring from 1989-1994.
Verizon’s reply testimony suggests that a smaller decline occurred. Verizon acknowledges reductions in force, but claims that because Verizon redefined certain field positions, the raw numbers TURN used above and elsewhere in its testimony are misleading. It states that the total reduction in cable splicers or their equivalents was 17%, not the much higher percentage TURN claimed.
Our analysis, however, found that Verizon offers exceptional service quality, and we find no need to second-guess staffing decisions.
M. Weather – VerizonVerizon acknowledges that service quality suffered during the
first quarter of 2001 due to unusually heavy rains: “[T]he [repair] intervals were extraordinarily high during the January, February, and March period, due to some prolonged rains that we experienced at that particular point in time.”270
We note that although weather is clearly a factor affecting service quality, our findings of good service quality required no adjustments for weather.
N. Marketing – VerizonIn claiming Verizon has engaged in marketing abuse, TURN
again cites C.98-04-004/D.98-12-084, in which the Commission approved GTEC’s payment of $13 million to settle marketing abuse 270 20 RT 2488:5-7 (Anders).
163

R.01-09-001, I.01-09-002 COM/SK1/MP1/bb1
claims stemming from the period 1989-92.271 TURN also claims that Verizon has “misused customer contacts as marketing devices.”272
Clearly, this decision speaks for itself and for the Commission’s willingness to investigate and sanction marketing abuses. There is no need for further action.
O. Mergers and Structural Changes – VerizonNo party alleges that Verizon’s mergers and structural changes
have had an impact on service quality. Nor does Verizon – in contrast to Pacific – argue that changes in the company attributable to its growth in size are mitigating factors that explain its service quality results.
Our earlier analysis of MCOT data found no diminishment of service quality as a result of GTE’s merger with Bell Atlantic that resulted in Verizon. Based on this empirical analysis, we did not find that in Verizon’s case mergers or structural changes have had an impact on its service quality.
VIII. NRF Incentives, Service Quality, and Competition
A. NRF Incentives and Service Quality, Positions of Parties The parties dispute the impact of NRF incentives on service
quality. TURN claims that NRF creates incentives to save money at the expense of service quality. It contends that NRF’s emphasis on cost cutting and revenue enhancement has led to deterioration of service quality. It also believes the introduction of new technology affects service quality and may result in discrimination among technology “haves” and “have nots.” It alleges that NRF creates 271 We discuss this case in full in the Section entitled “NRF Incentives and Service Quality – Verizon – Introduction,” above.272 TURN Opening/Service Quality at 42.
164

R.01-09-001, I.01-09-002 COM/SK1/MP1/bb1
incentives for the regulated utility to move functions outside the utility to an unregulated environment, which can leave regulated customers without adequate service. It disputes Pacific’s claim that its other rates subsidize basic service, which Pacific claims minimizes its ability to cut costs for – and therefore undermine the quality of – basic telephone service. It does not believe that competition provides an incentive for good service quality. Finally, it believes that positive change will only result from active regulation in connection with NRF.
TURN points to evidence demonstrating that NRF incentives to cut costs and increase revenues have lowered service quality. TURN bases its allegations about repairs, installation and answer times on the reporting we discuss elsewhere in this decision. Concerning Pacific, TURN claims that the data show adverse impacts causing slow repairs, slow installation, slow telephone answer times, erroneous late payment charges, errors resulting from outsourcing company functions, charging for services that were formally free, and marketing abuses.
TURN relies on other formal Commission proceedings for its claims about late payment charges, outsourcing, service-charges, marketing abuses, and deteriorating service quality.
Similarly, ORA alleges that under NRF Pacific has “reduced [its] quality of service, grossly inflated staffing claims, . . . moved portions of the labor force out of California . . . , and had sustained facilities shortages. . . .”273
Pacific responds that these claims indicate fundamental disagreement with incentive-based regulation and that the criticisms do not belong here. Pacific states that in fact NRF gives it “strong
273 ORA Opening/Service Quality at 3.
165

R.01-09-001, I.01-09-002 COM/SK1/MP1/bb1
incentives to provide high-quality service, to retain as many customers as possible, and thereby reduce the opportunity for competitors to ‘cream-skim’ the most profitable, lower cost, and high-usage customers.”274 It claims that the Commission adequately regulates service quality under NRF through its GO 133-B requirements and other monitoring reports, and that “[t]he Commission has not taken any steps to rescind NRF because . . . Pacific has consistently met or exceeded the Commission’s benchmarks under GO 133-B.”275
As it does for Pacific, ORA alleges that under NRF Verizon – albeit to a lesser extent than Pacific – has “reduced [its] quality of service, grossly inflated staffing claims, . . . moved portions of the labor force out of California . . . , and had sustained facilities shortages. . . .”276
TURN cites several specific problems with Verizon that allegedly support its claims about NRF. It states that “like its TRSAT, Verizon’s BOAT was often below the GO 133-B standard, until shortly after the SBC/Pacific Bell merger decision, wherein the Commission stated that it would enforce the standards.”277
Verizon responds that “Verizon’s service quality results are compelling evidence that NRF gives strong incentives to provide high quality service.” Thus, it agrees that we must examine its specific service quality results in order to determine the veracity of TURN’s claims. However, Verizon also claims that NRF “encourages carriers 274 Pacific Opening/Service Quality at 8.275 Id.276 ORA Opening/Service Quality at 3.277 TURN Reply/Service Quality at 7.
166

R.01-09-001, I.01-09-002 COM/SK1/MP1/bb1
to focus on service quality,” citing several measures that Verizon has employed that go beyond the bare bones reporting that this Commission and the FCC require.278
B. Discussion: Incentives to Improve Service Quality Under NRF and Under Cost-of Service Regulation
A comparison of the incentives affecting service quality under rate of return regulation with those under NRF shows that although in a pure textbook world they are very different, in the real world they are in important respects very similar. Under rate of return regulation, as practiced in California, between general rate cases, a utility can keep all the cost savings that it can realize. Thus, traditional regulation provides substantial incentives to reduce service quality expenses between rate cases.
Two other features of rate of return regulation, however, tempered the incentive to cut expenses. If a utility had reduced its service quality expenses, between rate cases, a Commission would commonly set a lower revenue requirement at the next general rate case. In addition, if a service quality improvement required a capital investment, rate of return regulation provided an incentive to make the investment. On the other hand, service quality improvements that required additional labor carried only risk and no reward, until the next rate.
We also note that under cost of service regulation, this commission rarely systematically measured or assessed service quality during the first 60 years of rate regulation. Indeed, it was not until 1973 that the Commission first issued a General Order
278 Verizon Opening/Service Quality at 4.
167

R.01-09-001, I.01-09-002 COM/SK1/MP1/bb1
pertaining to service quality for telecommunications.279 –Based in part on these standards, in 1976, the Commission ordered Pacific to upgrade its service to curtail and reduce an increasing backlog of held service orders.280 In 1980, the Commission found that GTE California (now “Verizon”) failed to meet GO 133 service quality standards, and reduced its return on equity by 0.5% until it met standards.281
In summary, we note that rate of return regulation, as practiced in California, contained little standardized measurement of service quality before 1973. Rate of return regulation permitted shareholders to obtain benefits from reductions in expenses between rate case periods. However, the utility had to balance this incentive to reduce expenses against a potentially lower revenue requirement in future rate cases. Rate of return regulation provided an incentive to earn a return on service quality capital investments. This could potentially lead to, what was often criticized as, “gold plating” of the network.
Under NRF, the regulatory and financial incentives were somewhat different. First, with the implementation of NRF regulation, the Commission adopted a systematic program for measuring and reviewing the quality of service offered by a telecommunications company. In 1994, as part of its triennial NRF review for Pacific and Verizon, the Commission examined the quality of telephone service under the NRF. 282 A comparison of the information reviewed in this proceeding and this decision, conducted under NRF, far exceeds all past reviews in scope and level of detail. 279 D.80082 (73 CPUC 426)280 D.86593, 80 CPUC 599.281 D.92366, 4 CPUC 2nd 428, at 535.282 D.94-06-011, 55 CPUC 2nd 1.
168

R.01-09-001, I.01-09-002 COM/SK1/MP1/bb1
Thus, we conclude that under NRF, regulation systematically examined service quality and thereby provided strong regulatory incentives to promote service quality.
NRF also changed the financial incentives that utilities faced concerning expenditures on service quality. Instead of keeping 100% of all reductions in expenditures between rate cases, additional earnings were subject to an elaborate sharing mechanism, with ratepayers receiving a share of the benefits arising from reductions in expenditures.283 Over time, however, the Commission eliminated sharing, and the financial incentives began to grow stronger than those of rate of return regulation for cost cutting. In particular, the periodic NRF reviews, unlike general rate cases, did not alter rates based on cost savings or capital expenditures. Thus, shareholders could realize the benefits from cost savings for a longer time than the typical three-year period between general rate cases. As commenters have pointed out, in the regulation of energy companies, this Commission commonly offset financial incentives to cut service quality with other financial incentives tied to service quality standards.284 This point is well taken, but it overlooks the myriad measures of service quality and standards adopted by this Commission and the FCC as the regulation of telecommunications markets moved to NRF or price cap regulation.
In addition, with the eventual opening of markets to competition by other local carriers and by wireless service, telecommunications
283 Sharing of earnings between ratepayers and shareholders was subsequently eliminated.284 Comments of TURN on the Alternate Proposed Decision of Commissioners Kennedy and Peevey on Service Quality Issues, July 2, 2003, p. 4-6.
169

R.01-09-001, I.01-09-002 COM/SK1/MP1/bb1
customers had the ability to obtain telecommunications services from alternative carriers and from alternative technologies. Although this change was not a part of NRF, consumer choice is as much a part of the modern telecommunications market place as price cap regulation.
In summary, the implementation of NRF brought increasingly systematic and periodic reviews of the quality of service offered by telecommunications utilities. On the other hand, the economic incentives to reduce expenses became slightly stronger than those offered under cost of service regulation. Independent of NRF, changes in telecommunications technology and the opening of local markets gave consumers choices for the first time.
Finally, a theoretical analysis of incentives must take a back seat to our empirical results. As noted above, our examination of trends in service quality under NRF provided substantial evidence that service quality has improved, albeit with several problem areas that continued throughout the NRF period.
C. Effect of Competition on Service Quality – Positions of PartiesThe parties express only nuanced disagreement about the effects
of competition on service quality. TURN notes that even assuming, arguendo, that competition is
present in some of Pacific’s markets – for example, in the California DSL market – there is no guarantee that service quality will be good. “The extant competitive pressures were not sufficient to force Pacific and its affiliate Advanced Services, Inc. (‘ASI’) to provide high quality Digital Subscriber Line (‘DSL’) service to the thousands of
170

R.01-09-001, I.01-09-002 COM/SK1/MP1/bb1
Californians who experienced the billing problems that led to the settlement agreement in C.02-01-007.”285
For Verizon, TURN disputes any notion that competition necessarily improves service quality: “Their [Pacific and Verizon’s] theoretical argument, such as it is, rests on the thin air of hypothetical ‘competition.’”286
Pacific’s witness Hauser notes that “customers care about both service and price.”287 He then proceeds to point out that Southwest Airlines has successfully competed in the air transport market with a low-quality, low-frill, but low-priced marketing strategy. Pacific claims that, “as competition increases, this incentive [to maintain service quality which does not adversely affect the demand for Pacific’s competitive products] becomes ‘even more important.’”288 Thus, we note that Pacific’s position is not a blanket argument that competition supports service quality.
D. Competition and Service Quality - DiscussionThe positions of TURN and Pacific are consistent with our own
Commission decision. As we observed in our recent Service Quality OIR:
It has now been over four years since we issued R.98-06-029 and nearly seven years since local exchange competition was authorized. We have concerns that our policies in pursuit of increased competition are insufficient to ensure high quality telephone service for
285 Id. at 10, citing Exh. 2B:506 at 10-11 & Exh. TLM-R3 (Murray Reply Testimony).286 TURN Reply/Service Quality at 8.287 Ex. 2B-354 (Revised Direct Testimony of John Hauser), p. 8.288 Pacific Reply/Service Quality at 8 (citation omitted).
171

R.01-09-001, I.01-09-002 COM/SK1/MP1/bb1
all telephone subscribers, and especially for residential and small business customers.289
Thus, the key to determining how NRF regulation affects service quality is to look at and measure the performance of Pacific and Verizon, as we have done in this proceeding and to assess how customers perceive the quality of service, as we have done in the numerous surveys reviewed in this proceeding. As noted in our empirical sections above, our general conclusion is that Verizon has accumulated an across-the-board record of high service quality and strong customer satisfaction, while Pacific has a record of high service quality with several areas of weakness, but strong customer satisfaction. As a result, we find no evidence that NRF has had any adverse impact on service quality, and substantial evidence that under NRF California companies have achieved a record of service quality that exceeds that of comparable utilities.
Even if parties believed that competition requires high quality service (which they do not), there remains a factual question over whether there is adequate competition in the local service market to create incentives to improve service quality. In our recent decision allowing Pacific into the long distance market, we found that competition in this market is less than robust: “Local telephone competition in California exists in the technical and quantitative data; but it has yet to find its way into the residences of the majority of California’s ratepayers.”290
289 R.02-12-004, mimeo., at 9.290 D.02-09-050, mimeo., at 263, available at
http://www.cpuc.ca.gov/WORD_PDF/FINAL_DECISION/19433.doc.
172

R.01-09-001, I.01-09-002 COM/SK1/MP1/bb1
We note, however, that NRF introduced a regulatory regime to measure and review periodically the quality of service provided by Pacific and Verizon. Thus, NRF does not rely on the false assumption that competitive markets always produce high service quality, or the equally false assumption that local telecommunications markets are fully competitive. Instead, NRF created a series of regulatory and organizational incentives by increasing the attention given to measuring and reviewing the service quality records produced by Pacific and Verizon. We expect the parties to present recommendations in Phase 3B of this proceeding concerning how to build on the record of high service quality produced under NRF and to improve on those areas of weakness in service quality.
IX. Comments on Proposed DecisionThe proposed decision of the ALJ in this matter was mailed to
the parties in accordance with Section 311(d) of the Public Utilities Code and Rule 77.1 of the Rules of Practice and Procedure. Pacific, Verizon, TURN and ORA filed both opening and reply comments.
Pacific argues that the findings reached in this decision indicate that there are no structural deficiencies in NRF and therefore it is not necessary to consider revisions in Phase 3B of this proceeding. In addition, it states that there are no survey issues that require further resolution. Furthermore, Pacific argues that we should refrain from making conclusions in this proceeding concerning the need to amend GO 133-B, which is addressed in another proceeding. Pacific also argues that under a literal reading of GO 133-B, their measure of held primary service orders complies with the language of GO 133-B, and recommends that we clarify this reporting procedure in the Service Quality OIR, not in this proceeding. Finally, Pacific makes a series of
173

R.01-09-001, I.01-09-002 COM/SK1/MP1/bb1
recommendations to narrow the scope of particular discussions, which Pacific argues “are not supported by the evidentiary record.”291
TURN responds that Pacific’s allegations of “errors” lack merit. TURN notes that we identify numerous service issues herein, and argues that addressing these issues in Phase 3B is consistent with the original scope of this proceeding. TURN replies that we do not prejudge the Service Quality OIR, but simply make observations on what we have found.
Likewise, ORA argues that consideration of regulatory modifications to NRF in Phase 3 does not require a finding of structural deficiencies in NRF. ORA also notes that the issues concerning the provision of survey data does remain unclear, and that it is reasonable to resolve it in Phase 3. ORA also replies that our observations regarding ARUs do not direct findings in the Service Quality OIR. ORA points out that it would be inefficient for the Commission to ignore the facts that warrant modifications to GO 133-B. Finally, ORA cites and discusses GO 133-B in support of its argument that Pacific’s interpretation of the rules concerning “held primary service orders” is wrong.
We find no merit to the issues raised by Pacific in its comments. As both ORA and TURN point out, a finding of structural deficiencies is not a prerequisite to the modification of NRF’s service quality provisions in order to resolve the issues identified. Further, both TURN and ORA correctly note our findings concerning Pacific’s service quality do not prejudge the Service Quality OIR – we are simply making observations. In particular, as ORA points out it would 291 Comments of SBC California on the Alternate Proposed Decision of Commissioner Kennedy and President Peevey Regarding Phase 2B Service Quality Issues, July 2, 2003, p. 8.
174

R.01-09-001, I.01-09-002 COM/SK1/MP1/bb1
indeed be inefficient to ignore the data and reporting issues discovered herein. Finally, ORA shows that Pacific’s interpretation of GO 133-B measurement procedure for “held primary service orders” lies outside the bounds of any plausible interpretations of the General Order.
Verizon’s opening comments expressed general and specific support for the proposed decision. In particular, it notes that the comprehensive approach applied herein complies with PU Code §1757(a)(4) that requires that any decision be based on the whole record in a proceeding.292 Verizon is adamant that the findings reached are “amply based on the record.”293 Verizon argues that its record of compliance with GO 133-B, its performance on ARMIS and MCOT measures, and its low level of customer complaints “all point separately and independently to the conclusion that Verizon’s service quality is high and has not declined during NRF.”294
Only ORA addresses Verizon’s comments. ORA argues that the statistical analysis goes beyond the record and therefore the our conclusions concerning Verizon do not have an evidentiary basis.
We will address ORA’s objections concerning the record next. However, we will note here that we find them without merit.
TURN and ORA raise similar issues in their comments, and we will summarize them together. TURN and ORA object to our reliance
292 See also United Steel Corp. v. Public Utilities Commission, 29 Cal. 3d 603, 608-9 (1981) (CPUC has duty to consider all facts that might bear on exercise of Commission’s discretion to set just and reasonable rates.293 Comments of Verizon California, Inc. on Alternate Iterim Opinion Regarding Phase 2B Issues Service Quality of Pacific Bell and Verizon California, Inc., July 2, 2003, p. 4.294 Ibid., p.6.
175

R.01-09-001, I.01-09-002 COM/SK1/MP1/bb1
on data in the record and on our analysis of that data. TURN objects that this review of service quality is a “sterile mathematical exercise” and that a comparison of Pacific and Verizon to other carriers using ARMIS data contradicts D.01-12-021.295 In addition, TURN reargues its assertion that NRF creates incentives to cut service quality and that this is different than the incentives under cost-of-service regulation. Further, TURN argues that the Commission’s prior resolution of compliant cases is given inadequate weight in our analysis.
Regarding the statistical analysis contained herein, TURN levies specific charges: 1) that record evidence establishes that there are flaws in the statistical analysis; 2) that the alternate fails to state a hypothesis that it is testing; 3) that the alternate’s regression analysis show low R squares; and 4) that there are flawed assumptions and conclusions embedded in the regression analysis. In addition, TURN objects to 1) the comparative performance analysis as applied to Verizon; 2) the use of ARMIS data to make carrier-to-carrier comparisons; 3) that the reference group is not appropriate. Finally, TURN makes other allegations, contending that we, despite its pervious analysis, should have reached further conclusions concerning year-to-year variations in the data.
ORA joins in criticism of this analysis, arguing that findings reached in various Commission decisions should trump the statistical analysis and findings. Similarly, ORA alleges that Pacific has failed to provide surveys that it was required to do so under P.A.02-03, and it holds that this situation is not confusing. Moreover, ORA objects to 295 Comments of The Utility Reform Network on the Alternate Proposed Decision of Commissioners Kennedy and Peevey on Service Quality Issues, July 2, 2003, p. 2.
176
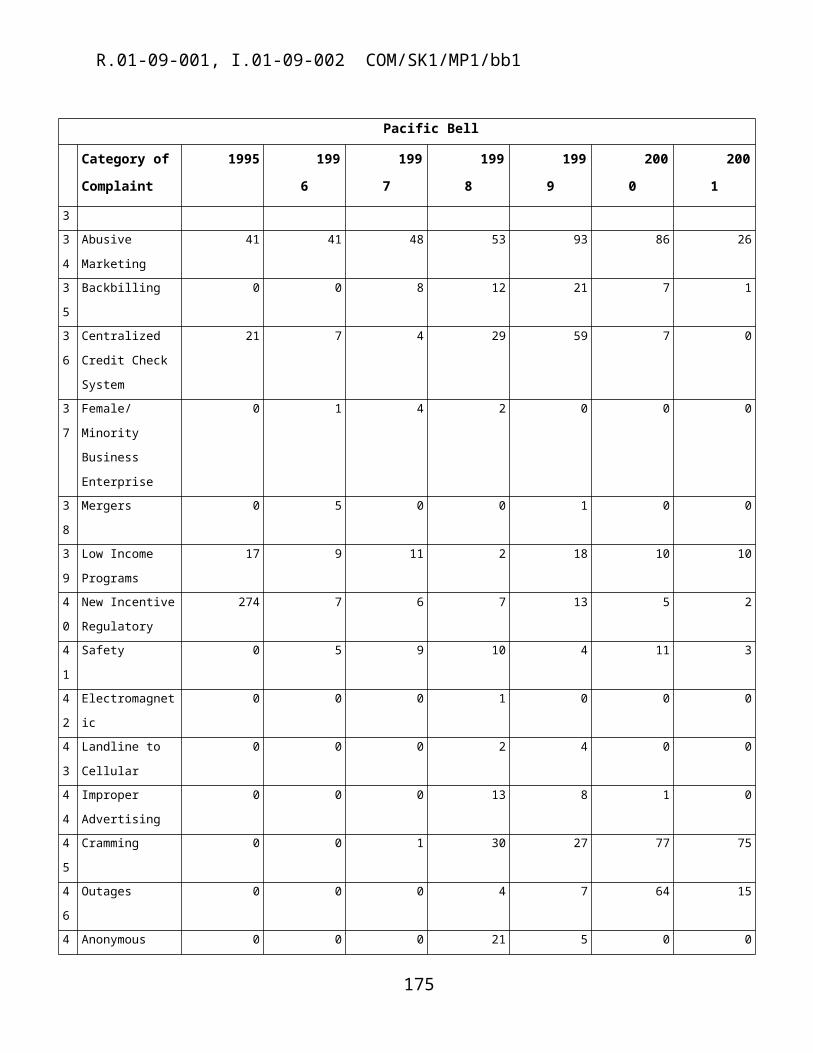
R.01-09-001, I.01-09-002 COM/SK1/MP1/bb1
our efforts to clear this situation up in the next phase of the proceeding; instead, it recommends that we delay this proceeding while awaiting resolution of this issue.296
Like TURN, ORA also objects to the analysis of data by the Commission, arguing that our analysis “not part of the record.”297 In addition, ORA argues that the data contain flaws that invalidate the findings.
We reject the allegations of TURN and ORA as based on the wrong understanding of the purpose of this proceeding. The purpose of this proceeding is to develop an assessment of the service quality of Pacific and Verizon based on the entire record. In contrast, the principal thrust of TURN and ORA’s allegations is to limit our assessment to the conclusions reached on the several occasions during NRF when the Commission considered formal complaints about the performance of Verizon and Pacific on particular measures.When we assess the entire record, the findings reached in our prior decisions become embedded in a larger factual context and necessarily carry less weight.
In addition, the contention of TURN and ORA that the analysis of ARMIS data relies on evidence not in the record has no factual or legal basis. First, Verizon’s ARMIS data is in the record and properly before the Commission.298 Second, not only is Pacific’s ARMIS data in the record, but also the statistical methodology used in this proceeding and the comparison of Pacific’s performance to that of the 296 Comments of the Office of Ratepayer Advocates on the Proposed Alternate Decision of Commissioners Kennedy and Peevey, July 1, 2003, p. 10.297 Ibid., p. 12.298 Thoms, Ex. 2b: 214.
177

R.01-09-001, I.01-09-002 COM/SK1/MP1/bb1
reference group.299 ORA and TURN had every opportunity cross-examine Dr. Hauser about the strengths and weakness of his method and the proper scope of its application. The only thing not exposed to cross-examination were the simple mathematical calculations necessary to apply the methods to Verizon’s data.
There is no legal precedent that would prevent the Commission from conducting such an analysis of the data in the record. Indeed, as Verizon has pointed out,300 the D.C. Circuit has rejected that very argument when made by litigants seeking to constrain the FCC’s use of data:
Part of [petitioners] objection seems to be that the Commission “had not relied on the raw [Form L] data itself” but instead “performed undisclosed analyses of that data; [took] official notice of the results of those analyses; and drew inferences as to decisional factors on the basis of those results. . . .” We are at a loss to understand this objection. Statistics are of little use without analysis and inferential reasoning. A legitimate part of the Commission’s role in such a proceeding is to interpret the data before it. [Petitioner] was on notice that the Commission was looking to Form L statistics, and the kind of analyses the agency did – seemingly just tabulation and averaging – was hardly arcane. [Petitioner] had ample opportunity to join issue on the point with data or analyses of its own.301 [emphasis added]
299 Hauser, Ex. 2b:355:7. 300 Reply Comments of Verizon California Inc. on Alternate Interim Opinion Regarding Phase 2B Issues Service Quality of Pacific Bell and Verizon California, Inc., p. 4.301 Telocator Network of America v. FCC, 691 F.2d 525, 546 (D.C. Cir. 1982).
178

R.01-09-001, I.01-09-002 COM/SK1/MP1/bb1
The facts mandating rejection of that argument are indistinguishable from the facts here. The ARMIS data was in the record, Dr. Hauser’s analysis is standard and was disclosed in advance of hearings, and ORA and TURN had every opportunity to dispute the data and analysis or offer their own. Thus, on every score, ORA’s and TURN’s assertion that the APD strayed outside the record fails.
TURN’s and ORA’s criticisms of the methodology used herein, however, in addition to falling outside the record, are transparently wrong. In particular, as Verizon points out:
Among the assumptions that TURN infers were used by Dr. Hauser – and hence by the APD – are the assumptions that if service quality is stable, NRF is not problematical, and that if service quality shows an improving trend, NRF is good. TURN challenges these assumptions o the ground that the absence of deterioration or the presence of improvement in service quality most likely is attributable to pressure arising from the Commission’s formal complaint proceedings. As a matter of fact, the record shows this is wrong with respect to Verizon.302
Moreover, Verizon points out that neither TURN nor ORA introduced relevant evidence or asked the questions during their opportunity to cross-examine Dr. Hauser that would challenge his analysis.
Dr. Hauser was a particularly forthcoming witness concerning the shortcomings of ARMIS data. In particular, he stated “comparisons of Pacific's ARMIS measures with other LECs can be difficult to interpret because of the variations in data methodologies across LECs." (Ex 2B: 354 at 20). We note that we carefully apply the methodology that Dr. Hauer used in analyzing Pacific’s
302 Reply Comments of Verizon California Inc. on Alternate Interim Opinion Regarding Phase 2B Issues Service Quality of Pacific Bell and Verizon California, Inc., July 7, 2003, p. 6.
179

R.01-09-001, I.01-09-002 COM/SK1/MP1/bb1
performance to the data we have on the performance of Verizon. Moreover, our analytic approach does not interpret ARMIS data alone, but, like Dr. Hauser, considers the ARMIS data within the larger context of GO 133-B data, survey data, and complaint data.
TURN’s contention that the analysis “suffers from the absence of a hypothesis” is not accurate. The analysis, however, clearly relies on the “null hypothesis.” The basic methodology employed is to test whether the null hypothesis of no relationship between the performance measure and time can be rejected by the data. Moreover, the Commission itself ordained the use of the null hypothesis when it implemented NRF. The Commission stated that the success of NRF would be judged by whether monitoring efforts indicated that ratepayers were being harmed “through deteriorating service quality.”303 Thus,we not only do not fail to test an hypothesis, but the hypothesis that we test is the very one previously determined by the Commission.
Similarly, TURN’s criticism that the low R-Squared “reflect[s] poor explanation of the underlying data” indicates a misunderstanding of statistical methods. R-Squared is a measure of the “goodness” of fit of a regression and its ability to predict the dependent variable. Our analysis, however, does not try to predict the level of service quality, the dependent variable. It only tests to determine whether there are significant trends in service quality during the NRF period. Thus, the value of R-Squared is not critical to the analysis.
ORA’s and TURN’s arguments that the comparative use of ARMIS data contravenes D.01-12-021 carries little weight. This argument rests on a footnote in this complaint case, in which the
303 D.89-10-031, p. 153.
180

R.01-09-001, I.01-09-002 COM/SK1/MP1/bb1
Commission said that “it is not possible to make meaningful comparisons between Pacific and other carriers using ARMIS data.”304
Unfortunately, ORA and TURN are choosing to ignore the difference between the arbitrary comparisons of carriers using ARMIS data that were rightly dismissed in D.01-12-021, and the systematic comparisons to a quality standard developed in the evidentiary record and used in our analysis.
Our primary use of ARMIS comparisons is quite different. First, relying on the evidentiary testimony of Dr. Hauser, we established a reference standard of quality by averaging the ARMIS results of a reference group of similar large LECs that operate in different service territories and under different regulatory regimes. The use of a large group of LECs operating throughout the country could be expected both to cancel out the differences in operating procedures between carriers and to yield a reasonable standard to judge the performance of Pacific and Verizon.305
Second, our analysis does not reach conclusions based on just one or a few measures. Instead, we compared Verizon and Pacific to the reference group across a broad range of ARMIS measures to highlight whether a carrier deviated significantly from performance norms or historical trends established by the carriers in the reference group. As Hauser testified:
. . . we have to look at the totality of the measures, recognizing that any single measure is not perfect. By looking at the general trend of a variety of measures and a variety of different data sources, this would be a valid
304 ORA Comments, pp. 10-11; TURN Comments, p. 17.305 See Vol. 18, Tr. 2183 (August 12, 2002) (Hauser cross-examination).
181

R.01-09-001, I.01-09-002 COM/SK1/MP1/bb1
way of getting at the underlying construct of consumer satisfaction.”306
This is the approach taken in our analysis.Thus, the ARMIS comparisons relied on in our analysis are
readily distinguishable form the comparisons that the Commission discouraged in the complaint case. Moreover, the comparisons are fully supported in the record and the conclusions we reach are based on comparisons that fairly reflect the evidence before us. In addition, we note that our statistical analysis of ARMIS results is jut one of many bases for our conclusion that Verizon’s service quality was good and improved under NRF.
Finally, we note that we have reviewed all the comments and replies, including those not explicitly addressed in our discussion. We have amended our analysis in response to these comments as we deemed necessary.
X. Setting Aside Submission for Acceptance of New Information into Record of Proceeding
By e-mail message dated July 17, 2003, Commissioner Kennedy indicated that she was considering setting aside the submission to accept into the record four items of evidence and requested comments from the parties on this possibility. The four items are: (1) work-papers associated with the analysis contained herein; (2) charts and tables showing Verizon’s GO 133-B results on a monthly basis (produced in response to a data request); (3) charts and tables showing Pacific’s GO 133-B results on a monthly basis; (4) Dr. Hauser’s workpapers supporting the ARMIS attachments to his opening and reply testimony (provided to ORA in response to Data
306 Vol. 18, Tr. 2184-85 (August 12, 2002) (Hauser cross-examination).
182

R.01-09-001, I.01-09-002 COM/SK1/MP1/bb1
Request Pacific 031-02). The e-mail message provided a cycle for comments and replies. In addition, the e-mail announced the Commission’s openness to consider other items for inclusion into the record. Finally, the e-mail message stated that the purpose of including these items in the record was to make the calculations easier to follow.
Verizon, TURN, and ORA filed opening comments. Verizon, Pacific, TURN and ORA filed reply comments.
Verizon stated that it had no objection to the proposal. In particular, TURN noted that Dr. Hauser’s workpapers were available for review and use by any party. Verizon also noted that on January 28, 2002, ALJ Kenney ruled that responses to data requests from the Commission’s Telecommunications Division to Pacific and to Verizon were to be provided to any parties and further noted that “[p]arties may use the information contained in the responses, as appropriate, in their pleadings submitted in this proceeding.” Verizon further notes that included in the referenced data requests was one requesting the actual monthly performance data for GO 133-B.
ORA argues that admitting the documents will not cure the defect in the alternate. In particular, ORA argues that the procedure described herein fails to comply with Rule 84. In addition, ORA argues that Rule 69(b) requires that the documents be certified as true and correct. ORA also argues that setting aside submission and accepting the materials into the record would jeopardize ORA’s due process rights. Nevertheless, ORA requests the inclusion of a list of items that it believes should be entered into the record.
TURN states that it opposes setting aside of submission, but requests that if the Commission elects to do so, that the Commission
183
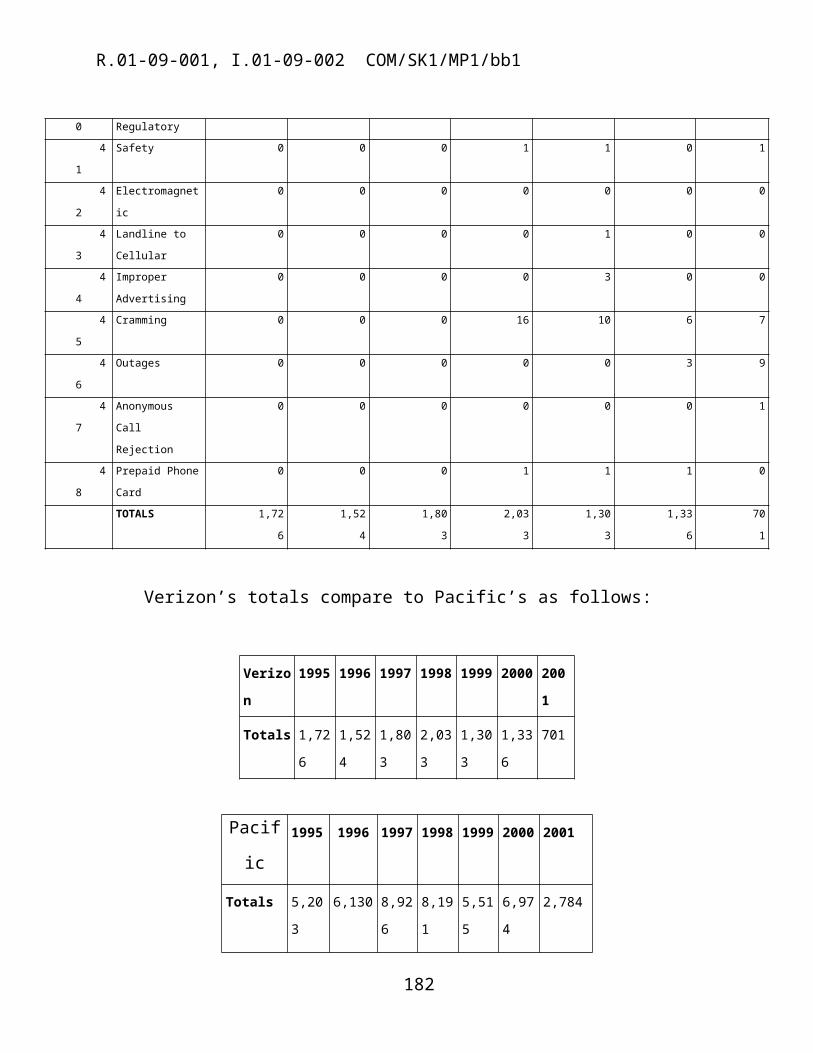
R.01-09-001, I.01-09-002 COM/SK1/MP1/bb1
accept its statistical analysis – similar to that contained herein but truncated at 1998 – into the record as well.
Pacific and Verizon filed reply comments. Pacific states that although it does not object to reopening the record, it sees no reason to do so – that the existing record fully supports the conclusions reached herein. Pacific opposes the introduction of TURN’s statistical analysis, noting that it ignores performance during the most recent three years. Similarly, Pacific opposes the admission of the materials identified by ORA as including material not available to the parties before, new declarations from people who did not testify, material subject to prior motions, and material that should have been addressed in comments. Verizon objects to the inclusion of TURN’s statistical analysis and the workpapers of Linette Young. Verizon does not object to items 1, 5 and 6 as proposed by ORA. Verizon notes that Item 1 consists of exactly the GO 133-B monthly data referenced above, that Item 5 consists of MCOT data already in the record, and that Item 6, to the extent that ORA is referring to Pacific’s and Verizon’s ARMIS results, is already in the record.
Upon consideration of the comments, we have decided to set aside submission and to receive into evidence the four items referenced above. We find ORA’s objections to lack merit. First, the Commission has in past cases set aside submission in the absence of a petition from a party.307 Thus, Rule 84 does not preclude the assigned 307 See, e.g., Application of San Diego Gas & Electric Company (U 902-E) for Approval of Utility Retained Generation Cost Recovery Mechanism, Opinion Granting Motion to Dismiss, D.03-03-023, A.02-02-015, 2003 Cal. PUC LEXIS 182 *1-2 (March 13, 2003) (“By ruling on January 15, 2003, the Administrative Law Judge noted the potential impact that recent decisions in the Commission’s procurement rulemaking … might have on SDG&E’s proposals in this proceeding. The ruling set aside submission of Application (A.) 02-02-015 to take comments regarding any modifications to SDG&E’s
184
R.01-09-001, I.01-09-002 COM/SK1/MP1/bb1
Commissioner from setting aside submission.308 Second, Rule 63 authorizes the presiding officer to “take such other action as may be necessary and appropriate to the discharge of his or her duties, consistent with the statutory or other authorities under which the Commission functions and with the rules and policies of the Commission.”309 If the presiding office has this authority, so does the assigned Commissioner. Third, Rule 69 does not require certification of the items of evidence. In particular, these items are offered by the Commission to clarify this record, not by the parties to the proceeding, and are thus explicitly excluded from the provisions of Rule 69. Fourth, the Commission has previously discussed the reliability of ARMIS and GO 133-B data and stated its expectation that this data is accurate.310 Moreover, the items of evidence proposed for admission here constitute exactly that GO 133-B and ARMIS data that the Commission has declared reliable and which the Commission has formerly taken official notice. Fifth, the proposed items of evidence proposals that might be appropriate in view of the Commission’s actions . . . .”); Carol Fisch v. Garrapata Water Co., Inc., D.01-04-013, 2001 Cal. PUC LEXIS 545 *3-4 (April 10, 2001) (“By ruling on December 4, the ALJ set aside submission and requested the Commission’s Water Division to direct staff engineer to inspect the meter box on Fisch’s property in the company of representative of both parties and to submit a report, with copies to the parties. Neither party objected to evidentiary use of the report or requested additional proceedings.”).308 ORA claims that Rules 45(f) and 46 require that it have an opportunity to respond to a motion or petition to reopen the proceeding. By inviting the parties to submit comments on whether the matter should be set aside and additional evidence received, Dr. Sullivan’s email afforded ORA a sufficient opportunity to respond. And ORA in fact has filed comments. This eliminates any possibility that ORA’s rights under those rules, assuming they are applicable, have been violated.309 CPUC Rule 63.310 D.01-12-021.
185

R.01-09-001, I.01-09-002 COM/SK1/MP1/bb1
will not deprive ORA of its due process or cross-examination rights. In particular, both the data, the methodology of Dr. Hauser which our analysis follows, and Dr. Hauser’s workpapers were fully available to ORA for cross-examination in the proceeding. ORA’s failure to explore these issues in the proceeding does not entitle it to redo its cross examination now. Sixth, in its comments on our analysis, ORA argued that we should base our analysis on monthly results, not yearly. We have granted ORA’s request, and find it difficult to understand why it now objects.
Since there is no credible objection to our reopening the record and receiving these four items into the record, we plan to do so. Although the record in this proceeding is in no way deficient or dependent on this data, we believe that admitting this evidence will enable the parties to better understand both the statistical methodology and the analysis that was used throughout this decision.
Finally, we reject the additional material offered by TURN and by ORA. TURN’s analysis has an arbitrary cut-off date for its analysis, and including this in the record makes little sense for we would give it no weight. ORA has provided no explanation as to why its proposed material should be added to the record. Moreover, we note that it had full opportunity to move this information into evidence throughout the proceeding and has made no case as to why we should do so now.
XI. Assignment of ProceedingSusan P. Kennedy is the Assigned Commissioner and Sarah R.
Thomas is the assigned ALJ in this phase of this proceeding.
186

R.01-09-001, I.01-09-002 COM/SK1/MP1/bb1
Findings of Fact1. The Order Instituting Rulemaking for this proceeding called for
an examination of the service quality of Pacific and Verizon in this phase of the proceeding.
2. The Order Instituting Rulemaking for this proceeding asked us to assess how the quality of service fared under the New Regulatory Framework (NRF).
3. Substantial methodological difficulties arise in the assessment of service quality because there is no record of service quality in the period preceding the adoption of NRF and because we lack a control group of utilities that did not change regulation during this period.
4. More typical methodological obstacles arise because companies often define or measure a particular service quality attribute differently.
5. With the passage of time, the activities of utilities change, and those changes affect what is measured in particular service quality attribute. These changes can arise from corporate reorganizations, which move certain telecommunications activities to subsidiaries not subject to regulation, or from changes in a company’s sales, which affect the distribution of activities included in a particular measure of service quality.
6. General Order (GO) 133-B defines specific measures associated with the quality of telecommunications services and set standards for all but one.
7. The Federal Communication Commission’s (FCC) ARMIS measures permit the comparison of utility performance against a reference group and the comparison of Pacific and Verizon with each other.
187

R.01-09-001, I.01-09-002 COM/SK1/MP1/bb1
8. Following certain mergers, the FCC began measuring additional service attributes in a series known as “MCOT” measures.
9. Direct measures of utility performance do not necessarily indicate how consumers value specific service attributes.
10. Survey data that directly asks customers their view of service quality is a valuable means of acquiring insight concerning customer views.
11. Pacific has presented results from its ARMIS 43-06 survey, its NRF monitoring report, surveys conducted by IDC and a survey by JD Power.
12. Verizon has presented results from its ARMIS 43-06 survey, and surveys it conducts as part of its customer service operations.
13. Complaints filed at this Commission also offer a source of information on customer experiences.
14. Through GO 133-B, the Commission requires utilities to provide data on seven different measures and has established performance standards for six.
15. Under GO 133-B, the utilities report to the Commission the requests for primary telephone service delayed over 30 days due to lack of utility plant. There is no performance standard for this measure.
16. Under GO 133-B, utilities report to the Commission the percentage of installation line energizing commitments met. Currently, the performance standard for this measure is that a utility should meet 95% of its installation line energizing commitments.
17. Under GO 133-B, utilities report to the Commission the number of initial trouble reports relating to dissatisfaction with
188

R.01-09-001, I.01-09-002 COM/SK1/MP1/bb1
telephone company-provided equipment and/or service. The performance standards adopted vary with the size of the end office. Currently, for end offices with more than 3000 lines, the standard is 6 or fewer trouble reports for 100 lines.
18. Under GO 133-B, utilities report the percentage of toll and operator assistance calls answered within 10 seconds. Currently, the performance standard is that 85% of all calls should be answered within 10 seconds.
19. Under GO 133-B, utilities report the percentage of directory assistance calls answered within 12 seconds. Currently, the performance standard for this measure is that the utility must answer 85% of these calls within 12 seconds.
20. Under GO 133-B, utilities report to the Commission the percentage of calls reporting trouble that are answered within 20 seconds. This is known as “Trouble Report Answering Time (TRSAT).” Currently, the performance standard for this measure is that the utility must answer 80% of these calls within 20 seconds.
21. Under GO 133-B, utilities report to the Commission the percentage of calls to the business office that are answered within 20 seconds. This is known as “Business Office Answering Time (BOAT).” Currently, the performance standard for this measure is that the utility must answer 80% of these calls within 20 seconds.
22. Pacific defines as “primary service orders” those containing to the first line into a house. Verizon defines as “primary service orders” the first order for any line.
23. GO 133-B fails to define “primary service” in an unambiguous way.
189

R.01-09-001, I.01-09-002 COM/SK1/MP1/bb1
24. R.02-12-004 is the appropriate forum for resolving how to define “primary service” in an unambiguous way.
25. GO 133-B fails to address the amount of time that a customer spends dealing with “Automated Response Units (ARU)” and neither Verizon nor Pacific consistently track this time.
26. Pacific stated that the time its residence customers spend in its ARU system ranges from a low of 50 seconds to a high of 300 seconds.
27. GO 133-B’s failure to address the use of ARUs reflects changes in technology since the Commission adopted the standard, and this technology gap should be closed.
28. GO 133-B fails to track the number of calls blocked by busy customer service lines or the number of calls abandoned by customers.
29. Pacific measures the number of primary service held orders in a way that is inconsistent with GO 133-B’s intention to have any order older than 30 days reported to the Commission. Pacific counts orders held over 30 days only once a month.
30. Pacific’s “primary service held orders” shows significant improvement during the NRF period. However, Pacific’s definition of primary service and erroneous measurement of orders held over 30 days prevent us from making a finding.
31. Verizon’s “primary service held orders” shows great volatility over the period 1990 to 2001. Statistical analysis suggests improvement over the NRF period, but the trend of improvement is not statistically significant.
32. When measured on an annual basis, Pacific has exceeded the standard for “installation line-energizing commitments met”
190

R.01-09-001, I.01-09-002 COM/SK1/MP1/bb1
throughout the entire NRF study period. We find no significant time trend during the period under NRF regulation.
33. When Pacific’s performance is measured on a monthly basis, we find that Pacific met the GO 133-B standard for “installation line-energizing commitments met” for every one of the 144 months for which we have data.
34. When measured on an annual basis, Verizon has exceeded the GO 133-B standard for “installation line-energizing commitments met” throughout the entire NRF study period. We find no significant time trend during the period under NRF regulation.
35. When Verizon’s performance is measured on a monthly basis, we find that Verizon met the GO 133-B standard for “installation line-energizing commitments met” for every one of the 144 months for which we have data.
36. When measured on an annual basis, Pacific has consistently exceeded the GO 133-B standard for “number of trouble reports per 100 lines” throughout the entire NRF study period. We find no significant time trend during the period under NRF regulation.
37. When measured on a monthly basis, Pacific has met or exceeded the GO 133-B standard for “number of trouble reports per 100 lines” for each of the 144 months for which we have data.
38. When measured on an annual basis, Verizon has consistently exceeded the GO 133-B standard for “number of trouble reports per 100 lines” throughout the entire NRF study period. A statistical test shows that Verizon has significantly improved its performance during the period under NRF regulation.
191

R.01-09-001, I.01-09-002 COM/SK1/MP1/bb1
39. When measured on a monthly basis, Verizon has exceeded the GO 133-B standard for “number of trouble reports per 100 lines” for each of the 144 months for which we have data.
40. When measured on an annual basis, Pacific has consistently exceeded the GO 133-B standard for “operator assistance answer time, yearly average” throughout the entire NRF study period. A statistical test shows no statistically significant time trend during the period under NRF regulation.
41. When measured on a monthly basis, Pacific has exceeded the GO 133-B standard for “operator assistance answer time, yearly average” for 107 of the 108 months of the NRF period for which we have data.
42. When measured on an annual basis, Verizon has consistently exceeded the GO 133-B standard “operator assistance answer time, yearly average” throughout the entire NRF study period. A statistical test shows no statistically significant time trend during the period under NRF regulation.
43. When measured on a monthly basis, Verizon has met or exceeded the GO 133-B standard “operator assistance answer time” for 140 of the 144 months in the NRF study period
44. When measured on a yearly basis, Pacific has consistently exceeded the GO 133-B standard of 12 seconds for “directory assistance answer time, yearly average” from 1993 to 2001. A statistical test shows no statistically significant time trend during the period under NRF regulation.
45. When measured on a monthly basis, Pacific has met or exceeded the GO 133-B standard of 12 seconds for “directory
192

R.01-09-001, I.01-09-002 COM/SK1/MP1/bb1
assistance answer time” each of the 108 months for which we have data.
46. When measured on an annual basis, Verizon has consistently exceeded the GO 133-B standard of 12 seconds for “directory assistance answer time, yearly average” from 1993 to 2001. A statistical test shows no statistically significant time trend during the period under NRF regulation.
47. When measured on a monthly basis, Verizon has met or exceeded the GO 133-B standard for “directory assistance answer time” for 142 of the 144 months under NRF.
48. When measured on an annual basis, Pacific failed to meet the GO 133-B standard of answering 80% of all “trouble service calls answer time, yearly average” (TRSAT) within 20 seconds from 1991 to 1998, but has met the standard in 1999-2001.
49. When measured on a monthly basis, Pacific met or exceeded the standard of answering 80% of all “trouble service calls answer time” (TRSAT) within 20 seconds for 92 of 132months for which we have data.
50. When measured on an annual basis, Verizon’s trouble service report answer time (TRSAT) failed to meet the minimum standard of 80% of trouble calls answered within 20 seconds in 1993 and in 1995. Verizon met the standard in 1994 and 1996-2001. Verizon’s performance shows statistically significant improvement over the NRF period.
51. When measured on a monthly basis, Verizon’s trouble service report answer time (TRSAT) met the minimum standard of 80% of trouble calls answered within 20 seconds for 104 of the 132
193
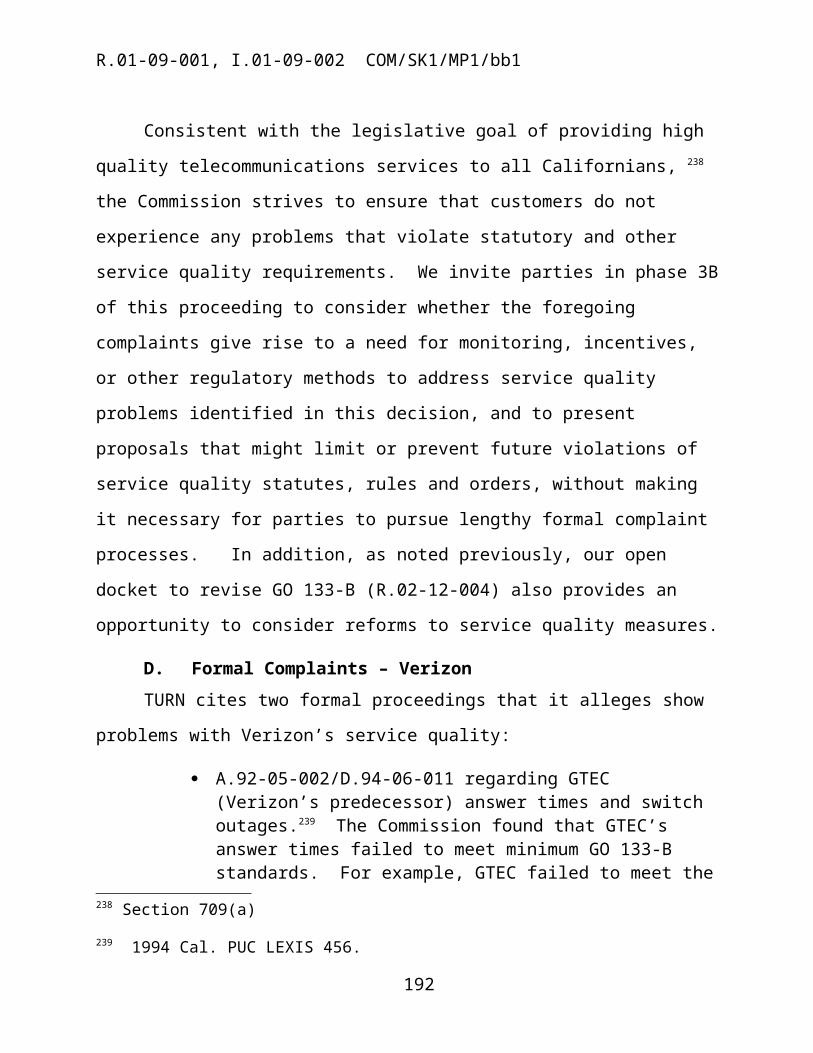
R.01-09-001, I.01-09-002 COM/SK1/MP1/bb1
months for which we have data. Verizon has met the standard every month since December 1996.
52. GO 133-B requires the exclusion of billing inquiries from its measure of business office answer time (BOAT).
53. Pacific included billing inquiries in its measure of business office answer time (BOAT) from 1992 until February 1999, but then excluded them. This complicates interpretation of this measure.
54. When measured on an annual basis, Pacific failed to meet the GO 133-B standard of answering 80% of calls to its business office within 20 seconds (excluding billing calls) in 1993, 1995, and 1996. Pacific met the standard in 1992, 1994, 1997-2001. Pacific shows a statistically significant improvement over the NRF period. Unfortunately, changes in policy over the inclusion of billing inquiries make it impossible to interpret this as an indication of improvement.
55. When measured on a monthly basis, Pacific met or exceeded the business office answer time standard 67 of 109 months under NRF for which we have data.
56. GO 133-B fails to require measurement of the time taken to answer an inquiry concerning billing.
57. Evidence in this record show that Pacific’s response to billing inquiries is particularly slow, with only 50% of billing calls now answered within 20 seconds.
58. Despite GO 133-B’s prohibition, Verizon included billing inquiries in its measurement of business office answer time (BOAT).
59. When measured on an annual basis, Verizon met the BOAT performance standard in 1994, 1995, and 1998-2001. Verizon failed to meet this performance standard in 1993, 1996 and 1997. Verizon shows a statistically significant improvement over the NRF period.
194

R.01-09-001, I.01-09-002 COM/SK1/MP1/bb1
60. When measured on a monthly basis, Verizon met the BOAT performance standard in 80 of the 109 months under NRF for which there is data.
61. During the NRF period, Pacific’s performance showed statistically significant improvement on business office answer time (although this measure has serious data problems).
62. During the NRF period, Pacific has shown no statistically significant change in the percentage of line-energizing installation commitments met, the number of customer trouble reports per 100 lines, the yearly average of toll operator assistance answer time, the yearly average of directory assistance answer time, and the trouble service answer time.
63. During the NRF period, Pacific did not show a statistically significant decrease on any GO 133-B measure of service quality.
64. During the NRF period, Verizon’s performance showed statistically significant improvement on the number of customer trouble reports, trouble service answer time, and business office answer time.
65. During the NRF period, Verizon has shown no statistically significant change on the held orders, the percentage of line-energizing installation commitments met, the yearly average of toll operator assistance time, and the yearly average of directory assistance time.
66. During the NRF period, Verizon did not show a statistically significant decrease on any GO 133-B measure of service quality.
67. We find no evidence from Pacific and Verizon’s performance that supports the hypothesis that NRF regulation decreases the quality of customer service.
195

R.01-09-001, I.01-09-002 COM/SK1/MP1/bb1
68. The Automated Reporting Management Information System (ARMIS) data stem from FCC Common Carrier Docket No. 87-313, which implemented service quality reporting requirements for local exchange carriers such as Pacific and Verizon.
69. The FCC requires the carriers to make reports on several aspects of service quality, and the results for relevant years appear in the record of this proceeding.
70. The ARMIS 43-05 report contains service quality performance measures which track, among other things, whether Pacific or Verizon meet their installation commitments for residential and business customers, trouble reports and repair intervals (e.g., both initial and repeat trouble reports, and the time required to dispatch and complete repairs in response to trouble reports), and switch downtime incidents.
71. The ARMIS 43-06 report tracks customer perceptions of Pacific and Verizon’s service quality.
72. ORA challenged the accuracy of Pacific’s reports to the FCC.
73. Through the course of the proceeding, it became apparent that mismatches in data between FCC and data provided to ORA arose from differences in the data provided to ORA and the data contained in final reports provided to the FCC.
74. ORA failed to show that Pacific’s historic data on service installation is inaccurate.
75. There is no need to conduct a data audit.76. The resolution of complicated data issues requires
professional cooperation, not adversarial interaction.
196

R.01-09-001, I.01-09-002 COM/SK1/MP1/bb1
77. Adversarial interaction concerning issues arising from data collection invariably waste Commission time and hinders the development of a clear evidentiary record.
78. ORA did not provide sufficient evidence to permit us to conclude that Pacific is closing installation orders prematurely.
79. ORA argued that the presence of “duplicate” records among the data Pacific provided to ORA indicates that there are errors in Pacific’s data.
80. ORA also argued that Pacific should include duplicate records in Pacific’s calculation of its installation intervals.
81. There is no basis for finding that duplicate records among Pacific’s data are erroneous.
82. ORA alleged that certain data were suspicious because ORA believed that no order for services could flow though Pacific’s systems without a commitment date.
83. Pacific pointed out that some orders do not require a commitment date when a new resident takes over the phone service of an existing customer.
84. There is no basis for ORA’s claim that the “anomalous” data are suspicious.
85. ORA raised issues concerning Verizon’s data and Verizon successfully responded to each of them.
86. Pacific’s witness, Dr. Hauser, presented a comparison of Pacific’s performance on ARMIS measures against the average performance of a “reference group” of the top ten local exchange carriers in the country.
197

R.01-09-001, I.01-09-002 COM/SK1/MP1/bb1
87. It is reasonable to compare the performance of Pacific and Verizon on ARMIS measures against the average performance of a reference group of similar large telecommunications utilities.
88. The ARMIS measure, “initial trouble reports,” when normalized on the number of access lines in a utility, permits a comparison among carriers and over time.
89. For residential access lines, a visual inspection shows that Pacific’s initial trouble reports per 100 access lines is better than that of the reference group and suggests that its performance is improving over time.
90. Statistical analysis shows that Pacific ‘s average residential initial trouble reports per access line is significantly better than the performance of the reference group, when statistical significance is assessed at the 1% level.
91. Statistical analysis shows that the improvement in Pacific’s average initial residential trouble reports per access line is not statistically significant.
92. For business lines, visual inspection indicates that that Pacific’s average number of initial trouble reports per access line is better than that of the reference group and has improved during the NRF period.
93. For business lines, Pacific’s average number of initial trouble reports per access line has significantly improved over the NRF period when significance is assessed at the 1% level.
94. For business lines, Pacific’s average number of initial trouble reports per access line is significantly better than the performance of the reference group of utilities when significance is assessed at the 1% level.
198

R.01-09-001, I.01-09-002 COM/SK1/MP1/bb1
95. For residential lines, Verizon’s average number of initial trouble reports has decreased (and improved) during the NRF period, and that decrease is statistically significant when significance is assessed at the 5% level.
96. For business lines, Verizon’s average number of initial trouble reports has decreased (and therefore improved) during the NRF period, and that decrease is statistically significant when significance is assessed at the 1% level.
97. For residential lines, Verizon’s average number of initial trouble reports is less than (and therefore better than) the performance of the reference group, and that difference is statistically significant when significance is assessed at the 1% level.
98. For business lines, Verizon’s average number of initial trouble reports is less than (and therefore better than) the performance of the reference group, and that difference is statistically significant when significance is assessed at the 1% level.
99. For residential lines, Verizon’s average number of initial trouble reports is less than (and therefore better than) that of Pacific, and that difference is statistically significant when significance is assessed at the 1% level.
100. For business lines, Verizon’s average number of initial trouble reports is more (and therefore worse) than that of Pacific, but that difference is not statistically significant.
101. Both Pacific and Verizon show excellent performance on both the business and residential measures of initial trouble reports per 100 access lines.
102. For residential lines, Pacific’s average number of repeat trouble reports has remained virtually unchanged during the NRF
199

R.01-09-001, I.01-09-002 COM/SK1/MP1/bb1
period. The coefficient of change is not statistically different from zero when significance is assessed at either the 1% level or 5% level.
103. For business lines, Pacific’s average number of repeat trouble reports has decreased (and therefore improved) during the NRF period, and that decrease is statistically significant when significance is assessed at the 1% level.
104. For residential lines, Pacific’s average number of repeat trouble reports is less than (and therefore better than) the performance of the reference group, and that difference is statistically significant when significance is assessed at the 1% level.
105. For business lines, Pacific’s average number of repeat trouble reports is less than (and therefore better than) the performance of the reference group, and that difference is statistically significant when significance is assessed at the 1% level.
106. For residential lines, Verizon’s average number of repeat trouble reports has decreased (and therefore improved) during the NRF period, and that decrease is statistically significant when significance is assessed at the 1% level.
107. For business lines, Verizon’s average number of repeat trouble reports has decreased (and therefore improved) during the NRF period, and that decrease is statistically significant when significance is assessed at the 5% level.
108. For residential lines, Verizon’s average number of repeat trouble reports is less than (and therefore better than) the performance of the reference group, and that difference is statistically significant when significance is assessed at the 1% level.
109. For business lines, Verizon’s average number of repeat trouble reports is less than (and therefore better than) the
200

R.01-09-001, I.01-09-002 COM/SK1/MP1/bb1
performance of the reference group, and that differences is statistically significant when significance is assessed at the 1% level.
110. For residential lines, Verizon’s average number of repeat trouble reports is less than (and therefore better than) Pacific’s, and that difference is significant when significance is assessed at the 1% level of significance.
111. For business lines, Verizon’s average number of repeat trouble reports is not significantly different from that of Pacific, when significance is assessed at either the 1% or 5% level.
112. Both Pacific and Verizon show excellent performance on both the business and residential measures of repeat trouble reports per 100 access lines.
113. For residential lines, Pacific’s average number of initial out-of-service trouble reports has improved since 1997. The coefficient of change for the entire NRF period is not statistically different from zero when significance is assessed at either the 1% level or 5% level.
114. For business lines, Pacific’s average number of initial out-of-service trouble reports has remained largely unchanged during the NRF period. The coefficient of change is not statistically different from zero when significance is assessed at either the 1% or 5% level.
115. For residential lines, Pacific’s average number of initial out-of-service trouble reports is less than (and therefore better than) the performance of the reference group, and that difference is statistically significant when significance is assessed at the 1% level.
116. For business lines, Pacific’s average number of initial out-of-service trouble reports is less than (and therefore better than) the
201

R.01-09-001, I.01-09-002 COM/SK1/MP1/bb1
performance of the reference group, and that differences is statistically significant when significance is assessed at the 1% level.
117. For residential lines, Verizon’s average number of initial out-of-service trouble reports has remained virtually unchanged during the NRF period. The coefficient of change is not statistically different from zero when significance is assessed at either the 1% level or 5% level.
118. For business lines, Verizon’s average number of initial out-of-service trouble reports has decreased (and therefore improved) during the NRF period, and that decrease is statistically significant when significance is assessed at the 1% level.
119. For residential lines, Verizon’s average number of initial out-of-service trouble reports is less than (and therefore better than) the performance of the reference group, and that difference is statistically significant when significance is assessed at the 1% level.
120. For business lines, Verizon’s average number of initial out-of-service trouble reports is less than (and therefore better than) the performance of the reference group, and that difference is statistically significant when significance is assessed at the 1% level.
121. For residential lines, Verizon’s average number of initial out-of-service trouble reports is less than (and therefore better than) Pacific’s, and that difference is significant when significance is assessed at the 1% level of significance.
122. For business lines, Verizon’s average number of initial out-of-service trouble reports is less than (and therefore better than) Pacific’s, but that difference is not statistically significant when significance is assessed at the 1% or 5% level of significance.
202

R.01-09-001, I.01-09-002 COM/SK1/MP1/bb1
123. Both Pacific and Verizon show excellent performance on both the business and residential measures of initial out-of-service trouble reports per 100 access lines.
124. For residential lines, Pacific’s average number of repeat out-of-service trouble reports has remained virtually unchanged during the NRF period. The coefficient of change is not statistically different from zero when significance is assessed at either the 1% level or 5% level.
125. For business lines, Pacific’s average number of repeat out-of-service trouble reports has decreased during the NRF period. The coefficient of change is statistically different from zero when significance is assessed at 5% level.
126. For residential lines, Pacific’s average number of repeat out-of-service trouble reports is less than (and therefore better than) the performance of the reference group, and that difference is statistically significant when significance is assessed at the 1% level.
127. For business lines, Pacific’s average number of repeat out-of-service trouble reports is less than (and therefore better than) the performance of the reference group, and that differences is statistically significant when significance is assessed at the 1% level.
128. For residential lines, Verizon’s average number of repeat out-of-service trouble reports has remained virtually unchanged during the NRF period. The coefficient of change is not statistically different from zero when significance is assessed at either the 1% level or 5% level.
129. For business lines, Verizon’s average number of repeat out-of-service trouble reports has decreased (and therefore improved)
203

R.01-09-001, I.01-09-002 COM/SK1/MP1/bb1
during the NRF period, but that decrease is not statistically significant when significance is assessed at the 1% or 5% level.
130. For residential lines, Verizon’s average number of repeat out-of-service trouble reports is less than (and therefore better than) the average performance of the reference group, and that differences is statistically significant when significance is assessed at the 1% level.
131. For business lines, Verizon’s average number of repeat out-of-service trouble reports is less than (and therefore better than) the performance of the reference group, and that difference is statistically significant when significance is assessed at the 1% level.
132. For residential lines, Verizon’s average number of repeat out-of-service trouble reports is less than (and therefore better than) Pacific’s, and that difference is significant when significance is assessed at the 1% level.
133. For business lines, Verizon’s average number of repeat out-of-service trouble reports is not significantly better than that of Pacific when significance is assessed at the 1% or 5% level.
134. Both Pacific and Verizon show excellent performance on both the business and residential measures of repeat out-of-service trouble reports per 100 access lines.
135. Pacific and Verizon had insufficient observations for the number of subsequent initial trouble reports and subsequent repeat trouble reports to permit a statistical finding.
136. For residential lines, Pacific’s average number of initial “all other” trouble reports per 100 lines has increased (and therefore worsened) during the NRF period. The coefficient of change is
204

R.01-09-001, I.01-09-002 COM/SK1/MP1/bb1
statistically different from zero when significance is assessed at the 5% level.
137. For business lines, Pacific’s average number of initial “all other” trouble reports per 100 lines has decreased during the NRF period. The coefficient of change is statistically different from zero when significance is assessed at the 1% level.
138. For residential lines, Pacific’s average number of initial “all other” trouble reports per 100 lines is less than (and therefore better than) the performance of the reference group, and that difference is statistically significant when significance is assessed at the 1% level.
139. For business lines, Pacific’s average number of initial “all other” trouble reports per 100 lines is less than (and therefore better than) the performance of the reference group, and that difference is statistically significant when significance is assessed at the 1% level.
140. For residential lines, visual inspection shows that Verizon’s initial “all other” trouble reports is better than that of the reference group. For business lines, visual inspection shows that Verizon’s performance is worse than that of the reference group.
141. For residential lines, Verizon’s average number of initial “all other” trouble reports per 100 lines has remained virtually unchanged during the NRF period. The coefficient of change is not statistically different from zero when significance is assessed at either the 1% level or 5% level.
142. For business lines, Verizon’s average number of initial “all other” trouble reports per 100 lines has decreased (and therefore improved) during the NRF period, and that decrease is statistically significant when significance is assessed at the 1% level.
205

R.01-09-001, I.01-09-002 COM/SK1/MP1/bb1
143. For residential lines, Verizon’s average number of initial “all other” trouble reports per 100 lines is less than (and therefore better than) the performance of the reference group, and that differences is statistically significant when significance is assessed at the 1% level.
144. For business lines, Verizon’s average number of initial “all other” trouble reports per 100 lines is not significantly different than the performance of the reference group when significance is assessed at the 1% level or 5% level.
145. For residential lines, Verizon’s average number of initial “all other” trouble reports per 100 lines is not significantly different than Pacific’s when significance is assessed at the 1% or 5% level of significance.
146. For business lines, Verizon’s average number of initial “all other” trouble reports per 100 lines is worse than that of Pacific when significance is assessed at the 1%.
147. Both Pacific and Verizon show excellent performance on the business measure of initial “all other” trouble reports per 100 lines.
148. For residential lines, Pacific’s average number of repeat “all other” trouble reports per 100 lines has increased during the NRF period. The coefficient of change is statistically different from zero when significance is assessed at the 5% level.
149. For business lines, Pacific’s average number of repeat “all other” trouble reports per 100 lines has decreased (and therefore improved) during the NRF period. The coefficient of change is statistically different from zero when significance is assessed at the 1% level.
206
R.01-09-001, I.01-09-002 COM/SK1/MP1/bb1
150. For residential lines, Pacific’s average number of repeat “all other” trouble reports per 100 lines is less than (and therefore better than) the performance of the reference group, and that difference is statistically significant when significance is assessed at the 1% level.
151. For business lines, Pacific’s average number of repeat “all other” trouble reports per 100 lines is less than (and therefore better than) the performance of the reference group, and that difference is statistically significant when significance is assessed at the 1% level.
152. For residential and business lines, visual inspection shows that Verizon’s repeat “all other” trouble reports is better than that of the reference group.
153. Verizon’s average number of repeat “all other” trouble reports per 100 lines has remained virtually unchanged during the NRF period. The coefficient of change is not statistically different from zero when significance is assessed at either the 1% level or 5% level.
154. For business lines, Verizon’s average number of repeat “all other” trouble reports per 100 lines has decreased (and therefore improved) during the NRF period, and that decrease is statistically significant when significance is assessed at the 1% level of significance.
155. For residential lines, Verizon’s average number of repeat “all other” trouble reports per 100 lines is less than (and therefore better than) the performance of the reference group, and that difference is statistically significant when significance is assessed at the 1% level.
207

R.01-09-001, I.01-09-002 COM/SK1/MP1/bb1
156. For business lines, Verizon’s average number of repeat “all other” trouble reports per 100 lines is not significantly different than the performance of the reference group when significance is assessed at the 1% level or 5% level.
157. For residential lines, Verizon’s average number of repeat “all other” trouble reports per 100 lines is better than Pacific’s when significance is assessed at the 1% level of significance.
158. For business lines, Verizon’s average number of repeat “all other” trouble reports per 100 lines is not significantly different than that of Pacific when significance is assessed at the 1% or 5% level.
159. Both Pacific and Verizon show excellent performance on the business measure of repeat “all other” trouble reports per 100 lines. For residential lines, Verizon also showed good performance on the repeat “all other” trouble reports per 100 lines.
160. Visual inspection indications that Pacific’s residential initial out-of-service interval had considerable fluctuations over the NRF period, but we find no observable trend in business initial out of service intervals.
161. For residential lines, Pacific’s initial out-of-service repair interval (in hours) has increased (and thereby worsened) during the NRF period. The coefficient of change, however, is not statistically different from zero when significance is assessed at the 1% or 5% level.
162. For business lines, Pacific’s average number of initial out-of-service repair interval (in hours) has increased (and therefore worsened) during the NRF period. The coefficient of change, however, is not statistically different from zero when significance is assessed at the 1% or 5% level.
208

R.01-09-001, I.01-09-002 COM/SK1/MP1/bb1
163. For residential lines, Pacific’s initial out-of-service repair interval (in hours) is greater than (and therefore worse than) the performance of the reference group, and that difference is statistically significant when significance is assessed at the 1% level.
164. For business lines, Pacific’s average number of initial out-of-service repair interval (in hours) is less than (and therefore better than) the performance of the reference group, but that difference is not statistically significant when significance is assessed at the 1% level or 5% level. Thus, we cannot statistically distinguish Pacific’s performance from that of the reference group.
165. For residential and business lines, visual inspection shows that Verizon’s initial out-of-service interval is better than that of the reference group.
166. For residential lines, Verizon’s initial out-of-service repair interval (in hours) has deteriorated slightly during the NRF period. The coefficient of change, however, is not statistically different from zero when significance is assessed at either the 1% level or 5% level.
167. For business lines, Verizon’s initial out-of-service repair interval (in hours) has decreased (and therefore improved) slightly during the NRF period, but that decrease is not statistically significant when significance is assessed at the 1% or 5% level of significance.
168. For residential lines, Verizon’s initial out-of-service repair interval (in hours) is less than (and therefore better than) the performance of the reference group, and that difference is statistically significant when significance is assessed at the 1% level.
169. For business lines, Verizon’s initial out-of-service repair interval (in hours) is less than (and therefore better than) the
209

R.01-09-001, I.01-09-002 COM/SK1/MP1/bb1
performance of the reference group when significance is assessed at the 1% level.
170. For residential lines, Verizon’s average number of initial out-of-service repair interval (in hours) is better than Pacific’s when significance is assessed at the 1% level of significance.
171. For business lines, Verizon’s initial out-of-service repair interval (in hours) is significantly better than that of Pacific when significance is assessed at the 1% level.
172. Since Pacific and Verizon were both subject to NRF regulation during this period, and since Verizon’s performance is better than that of Pacific and that of the reference group, it is not reasonable to attribute Pacific’s poor performance to NRF regulation.
173. Verizon shows excellent performance on the residential and business measure of initial out-of-service repair interval (in hours).
174. Since Pacific’s initial out-of-service repair interval for residential service is worse than that of the reference group and its business service is indistinguishable from that of the reference group, we conclude that Pacific’s performance in this area is below average.
175. Visual inspection indicates that Pacific’s residential repeat out-of-service repair interval data appears curvilinear, where the data rises from 1994, peaks in 1998, and declines by 2001.
176. For residential lines, Pacific’s repeat out-of-service repair interval (in hours) has a coefficient of change that is not statistically different from zero when significance is assessed at the 1% or 5% level.
177. For business lines, Pacific’s average number of repeat out-of-service repair interval (in hours) has a coefficient of change that is
210

R.01-09-001, I.01-09-002 COM/SK1/MP1/bb1
not statistically different from zero when significance is assessed at the 1% or 5% level.
178. For residential lines, Pacific’s repeat out-of-service repair interval (in hours) is greater than (and therefore worse than) the performance of the reference group, and that difference is statistically significant when significance is assessed at the 1% level.
179. For business lines, Pacific’s average number of repeat out-of-service repair interval (in hours) is less than (and therefore better than) the performance of the reference group, but that difference is not statistically significant when significance is assessed at the 1% level or 5% level. Thus, we cannot statistically distinguish Pacific’s performance from that of the reference group.
180. For residential and business lines, visual inspection shows that Verizon’s repeat out-of-service interval is better than that of the reference group and relatively stable over the entire NRF period.
181. For residential lines, Verizon’s repeat out-of-service repair interval (in hours) has a coefficient of change that is not statistically different from zero when significance is assessed at either the 1% level or 5% level.
182. For business lines, Verizon’s repeat out-of-service repair interval (in hours) a coefficient of change that is not statistically significant when significance is assessed at the 1% or 5% level.
183. For residential lines, Verizon’s repeat out-of-service repair interval (in hours) is less than (and therefore better than) the performance of the reference group, and that difference is statistically significant when significance is assessed at the 1% level.
184. For business lines, Verizon’s repeat out-of-service repair interval (in hours) is less than (and therefore better than) the
211

R.01-09-001, I.01-09-002 COM/SK1/MP1/bb1
performance of the reference group when significance is assessed at the 1% level.
185. For residential lines, Verizon’s average number of repeat out-of-service repair interval (in hours) is better than Pacific’s when significance is assessed at the 1% level of significance.
186. For business lines, Verizon’s repeat out-of-service repair interval (in hours) is significantly better than that of Pacific when significance is assessed at the 1% level.
187. Since Pacific and Verizon were both subject to NRF regulation during this period, and since Verizon’s performance is better than that of Pacific and that of the reference group, it is not reasonable to attribute Pacific’s poorer performance in residential repeat out of service interval to NRF regulation.
188. Verizon shows excellent performance on the residential and business measure of repeat out-of-service repair interval (in hours).
189. Since Pacific’s repeat out-of-service repair interval for residential service is worse than that of the reference group and its business service is indistinguishable from that of the reference group, we conclude that Pacific’s performance in this area is below average.
190. Visual inspection indicates that Pacific’s residential initial “all-other” repair interval data appears curvilinear, where the data rises from 1994, peaks in 1997, and declines by 2001. Visual inspection indicates that Pacific’s business initial “all-other” repair interval appears more stable, comparable to the reference group, and improving over the NRF period.
191. For residential lines, Pacific’s initial “all-other” repair interval (in hours) has a coefficient of change that is not statistically
212
R.01-09-001, I.01-09-002 COM/SK1/MP1/bb1
different from zero when significance is assessed at the 1% or 5% level.
192. For business lines, Pacific’s average number of initial “all-other” repair interval (in hours) has a coefficient of change that indicates an improving trend when significance is assessed at the 5% level.
193. For residential lines, Pacific’s initial “all-other” repair interval (in hours) is greater than (and therefore worse than) the performance of the reference group, and that difference is statistically significant when significance is assessed at the 5% level.
194. For business lines, Pacific’s average number of initial “all-other” repair interval (in hours) is not statistically different from that of the reference group when significance is assessed at the 1% level or 5% level. Thus, we cannot statistically distinguish Pacific’s performance from that of the reference group.
195. For residential and business lines, visual inspection shows that Verizon’s initial “all-other” interval is better than that of the reference group and relatively stable over the entire NRF period.
196. Verizon’s initial “all-other” repair interval (in hours) has a coefficient of change that indicates a deterioration of service when significance is assessed at the 1% level.
197. For business lines, Verizon’s initial “all-other” repair interval (in hours) a coefficient of change that is not statistically significant when significance is assessed at the 1% or 5% level.
198. For residential lines, Verizon’s initial “all-other” repair interval (in hours) is less than (and therefore better than) the performance of the reference group, and the difference is statistically significant when significance is assessed at the 1% level.
213
R.01-09-001, I.01-09-002 COM/SK1/MP1/bb1
199. For business lines, Verizon’s initial “all-other” repair interval (in hours) is less than (and therefore better than) the performance of the reference group when significance is assessed at the 1% level.
200. For residential lines, Verizon’s average number of initial “all-other” repair interval (in hours) is better than Pacific’s when significance is assessed at the 1% level of significance.
201. For business lines, Verizon’s initial “all-other” repair interval (in hours) is significantly better than that of Pacific when significance is assessed at the 1% level.
202. Since Pacific and Verizon were both subject to NRF regulation during this period, and since Verizon’s performance is better than that of Pacific and that of the reference group, it is not reasonable to attribute Pacific’s poorer performance in residential initial “all-other” repair interval to NRF regulation.
203. Verizon shows excellent performance on the residential and business measure of initial “all-other” repair interval (in hours).
204. Since Pacific’s initial “all-other” repair interval for residential service is worse than that of the reference group and its business service is indistinguishable from that of the reference group, we conclude that Pacific’s performance in this area is below average.
205. Visual inspection indicates that Pacific’s residential repeat “all-other” repair interval fluctuates over the NRF period.
206. Visual inspection indicates that Pacific’s residential repeat “all-other” repair interval data appears curvilinear, where the data rises from 1994, peaks in 1998, and declines by 2001.
207. For residential lines, Pacific’s repeat “all-other” repair interval (in hours) has a coefficient of change that is not statistically
214

R.01-09-001, I.01-09-002 COM/SK1/MP1/bb1
different from zero when significance is assessed at the 1% or 5% level.
208. For business lines, Pacific’s average number of repeat “all-other” repair interval (in hours) has a coefficient of change that is not statistically different from zero when significance is assessed at the 1% or 5% level.
209. For residential lines, Pacific’s repeat “all-other” repair interval (in hours) is greater than (and therefore worse than) the performance of the reference group, and that difference is statistically significant when significance is assessed at the 1% level.
210. For business lines, Pacific’s average number of repeat “all-other” repair interval (in hours) is not statistically different from that of the reference group when significance is assessed at the 1% level or 5% level. Thus, we cannot statistically distinguish Pacific’s performance from that of the reference group.
211. Pacific shows a disturbing increase in the number of repeat problems within 24-hours of the initial repair. Such a pattern is consistent with not properly correcting the problem the first time.
212. Visual inspection shows that Verizon’s repeat “all-other” repair interval is better than that of the reference group and relatively stable over the entire NRF period for both residential and business customers.
213. For residential lines, Verizon’s repeat “all-other” repair interval (in hours) has a coefficient of change that indicates a deterioration of service when significance is assessed at the 1% level.
214. For business lines, Verizon’s repeat “all-other” repair interval (in hours) has a coefficient of change that is not statistically significant when significance is assessed at the 1% or 5% level.
215

R.01-09-001, I.01-09-002 COM/SK1/MP1/bb1
215. For residential lines, Verizon’s repeat “all-other” repair interval (in hours) is less than (and therefore better than) the performance of the reference group, and that difference is statistically significant when significance is assessed at the 1% level.
216. For business lines, Verizon’s repeat “all-other” repair interval (in hours) is less than (and therefore better than) the performance of the reference group when significance is assessed at the 1% level.
217. For residential lines, Verizon’s average number of repeat “all-other” repair interval (in hours) is better than Pacific’s when significance is assessed at the 1% level of significance.
218. For business lines, Verizon’s repeat “all-other” repair interval (in hours) is significantly better than that of Pacific when significance is assessed at the 1% level.
219. Since Pacific and Verizon were both subject to NRF regulation during this period, and since Verizon’s performance is better than that of Pacific and that of the reference group, it is not reasonable to attribute Pacific’s poorer performance in residential repeat “all-other” out of service interval to NRF regulation.
220. Verizon shows excellent performance on the business measure of repeat “all-other” repair interval (in hours).
221. Since Pacific’s repeat “all-other” repair interval for residential service is worse than that of the reference group and its business service is indistinguishable from that of the reference group, we conclude that Pacific’s performance in this area has been below average. Recent residential service measures have matched the reference group, and if they prove stable, Pacific’s performance will be average.
216
R.01-09-001, I.01-09-002 COM/SK1/MP1/bb1
222. Visual inspection indicates that Pacific’s residential and business average installation interval was consistent and improving over the NRF period.
223. For average installation interval, our reference group shows a declining trend over the NRF period.
224. Utilities include vertical services, which are easy to install, in their installation interval data. It is highly likely that these orders are responsible for the declining trend for all utilities.
225. For residential lines, Pacific’s average installation interval has a coefficient of change that is not statistically different from zero when significance is assessed at the 1% or 5% level.
226. For business lines, Pacific’s average number of average installation interval has a coefficient of change that is not statistically different from zero when significance is assessed at the 1% or 5% level.
227. For residential lines, Pacific’s average installation interval is not statistically different than the performance of the reference group when significance is assessed at the 1% level or 5% level. Thus, we cannot statistically distinguish Pacific’s performance from that of the reference group.
228. For business lines, Pacific’s average installation interval is not statistically different from that of the reference group when significance is assessed at the 1% level or 5% level. Thus, we cannot statistically distinguish Pacific’s performance from that of the reference group.
229. Visual inspection shows that Verizon’s average installation interval was unstable over the entire NRF period for both residential and business customers.
217

R.01-09-001, I.01-09-002 COM/SK1/MP1/bb1
230. Verizon’s average installation interval has a coefficient of change that is not statistically significant at either the 1% or 5% level.
231. For business lines, Verizon’s average installation interval has a coefficient of change that is not statistically significant when significance is assessed at the 1% or 5% level.
232. For residential lines, Verizon’s average installation interval is not statistically different from that of the reference group when significance is assessed at the 1% or 5% level.
233. For business lines, Verizon’s average installation interval is not statistically different from that of the reference group when significance is assessed at the 1% or 5% level.
234. For residential lines, Verizon’s average number of average installation interval is not significantly different from that of Pacific when significance is assessed at the 1% or 5% level of significance.
235. For business lines, Verizon’s average number of average installation interval is not significantly different from that of Pacific when significance is assessed at the 1% or 5% level of significance.
236. Verizon shows performance on the residential and business measure of average installation interval consistent with that of the reference group.
237. Pacific’s shows performance on the residential and business measure of average installation interval consistent with that of the reference group.
238. Visual inspection indicates that Pacific’s switch downtime was consistent and excellent over the NRF period.
239. Pacific’s average switch downtime has a coefficient of change that is not statistically different from zero when significance is assessed at the 1% or 5% level.
218

R.01-09-001, I.01-09-002 COM/SK1/MP1/bb1
240. Pacific’s average switch downtime is significantly better than the group of reference utilities when significance is assessed at the 1% level.
241. Visual inspection of the graph of switch downtime suggests that Verizon’s service has deteriorated over the NRF period and that its performance is not as good as the reference group.
242. Verizon’s average switch downtime has increased (and therefore worsened) over the NRF period, and it has a coefficient of change that is statistically significant at the 1% level.
243. Verizon’s average switch downtime is worse than that of the reference group, but the difference is not statistically significant at 1% or 5% level.
244. Verizon’s average switch downtime is worse than that of Pacific when significance is assessed at the 5% level.
245. Since Pacific and Verizon show different patterns of switch downtime and both were subject to the same NRF regulation, it is not reasonable to attribute Verizon’s poorer performance to NRF regulation.
246. Pacific had only six observations for the number of switches down per switch. The statistical analysis shows that Pacific does not exhibit a statistically significant trend in the number of switches down per switch while Verizon exhibits a slight improvement in this area.
247. Pacific’s performance does not show a statistically significant upward or downward trend in the number of occurrences over two minutes per switch and the percent unscheduled.
248. Pacific exhibited a downward trend for the number of occurrences under two minutes per switch.
219

R.01-09-001, I.01-09-002 COM/SK1/MP1/bb1
249. Verizon has exhibited a downward trend for the number of occurrences under two minutes per switch and an upward trend for the percent unscheduled.
250. Visual inspection indicates that Pacific’s residential installation “commitments met” was consistently good from 1991 to 2001, with the exception of 1997, but overall it appears to track the performance of the reference group.
251. For residential lines, Pacific’s residential installation “commitments met” has a coefficient of change that is not statistically different from zero when significance is assessed at the 1% or 5% level.
252. For business lines, Pacific’s installation “commitments met” has a coefficient of change that shows a worsening of service, statistically significant, when significance is assessed at the 1%.
253. For residential lines, Pacific’s installation “commitments met” is not statistically different than the performance of the reference group when significance is assessed at the 1% level or 5% level. Thus, we cannot statistically distinguish Pacific’s performance from that of the reference group.
254. For business lines, Pacific’s installation “commitments met” is better than that of the reference group when significance is assessed at the 1% level.
255. Visual inspection shows that Verizon’s installation “commitments met” tracks that of the reference group, although in 1999 Verizon shows a marked improvement in business service, and a marked decline in residential service.
220

R.01-09-001, I.01-09-002 COM/SK1/MP1/bb1
256. For residential lines, Verizon’s installation “commitments met” has a coefficient of change that is not statistically significant at either the 1% or 5% level.
257. For business lines, Verizon’s installation “commitments met” has a coefficient of change that is not statistically significant when significance is assessed at the 1% or 5% level.
258. For residential lines, Verizon’s installation “commitments met” is not statistically different from that of the reference group when significance is assessed at the 1% or 5% level.
259. For business lines, Verizon’s installation “commitments met” is not statistically different from that of the reference group when significance is assessed at the 1% or 5% level.
260. For residential lines, Verizon’s installation “commitments met” is not significantly different from that of Pacific when significance is assessed at the 1% or 5% level of significance.
261. For business lines, Verizon’s installation “commitments met” is worse than that of Pacific when significance is assessed at the 1% level of significance.
262. Overall, Pacific’s performance on installation “commitments” met is above average, while Verizon’s is average.
263. As a condition of SBC’s merger with Ameritech, the FCC required additional quarterly measures of state-by-state service quality. Categories of reporting for retail services include installation and maintenance, switch outages, transmission facility outages, service quality-related complaints, and answer time performance.
264. For the period July 1999 to June 2001, Pacific shows negative spikes in California in the following areas: 1) answer time performance (business customers), 2) trouble report rate per 100
221

R.01-09-001, I.01-09-002 COM/SK1/MP1/bb1
lines (especially business customers), 3) percentage of installation orders completed within 5 working days (especially residential customers), and 4) percentage of installation orders delayed over 30 days (business customers).
265. Our statistical analysis of Pacific’s MCOT data shows that Pacific’s performance exhibits an improving trend in average answer time for residential and business customers, average trouble duration, and the report rate when significance is measured at the 1% level.
266. Pacific’s operations appear largely unaffected by the Ameritech merger.
267. Our statistical analysis of Verizon’s MCOT data shows that Verizon’s performance does not exhibit an improving or deteriorating trend in majority of the measures.
268. Since the period for which we have MCOT data is so short and covers only part of the period subject to our investigation, it does not permit us to draw any conclusion concerning how NRF regulation affected Pacific’s performance.
269. The FCC imposed a 36-month reporting requirement as a condition of the 2000 GTE merger with Bell Atlantic that created Verizon.
270. While GO 133-B measures the handling of business office calls, it does not track billing calls even though such calls account for half of the calls to the business office.
271. Verizon showed negative spikes in California on several service quality measures at the following times during the period July 2000-June 2001, as compared to the rest of that period: 1) percentage of dissatisfied customers (with business customers reporting 50% dissatisfaction in November 2000 and residential
222

R.01-09-001, I.01-09-002 COM/SK1/MP1/bb1
customers reporting 20% dissatisfaction in March 2001), 2) answer times (with business answer times in the 50-60 second range in September 2000 and in the 40-50 second range in January 2001 – as compared to a GO 133-B standard of 20 seconds); and residential times exceeding 20 seconds in November 2000 [30 seconds] and January 2001 [40 seconds], 3) repair intervals for both residential and business customers spiking in the period January-March 2001, 4) repeat trouble reports spiking for both types of customers in March 2001, and 5) trouble reports per hundred lines spiking in the January-March 2001 time period for residential customers.
272. In spite of these spikes, we have not observed a significant upward or downward trend in Verizon’s performance for the following measures: complaints per one million lines (residential and business), the percentage of dissatisfied customers (residential and business), answer times (business), average repair interval (residential and business), the percentage of repeat trouble reports (residential and business), trouble report rates (residential and business), the percentage of orders completed within five working days (residential and business), the percentage of orders delayed over 30 days (business).
273. Verizon’s performance shows slight improvement in the percentage of orders delayed over 30 days for the residential lines.
274. Verizon has shown improvement in the answer time performance for residential lines.
275. For Verizon, we conclude that despite a visual spike illustrating a decrease in the quality of service in the January to March 2001 time period, there is no statistically significant indicator of an ongoing decrease in quality.
223

R.01-09-001, I.01-09-002 COM/SK1/MP1/bb1
276. ORA conducted a survey of service quality in 2001 using the same questions as it did in 1995, pursuant to Commission direction.
277. ORA’s survey shows that Pacific’s service quality declined over time, but a big drop in the response rate in the 2001 ORA survey from that of 1995 limits our ability to draw conclusions from the survey with statistical confidence.
278. Despite its statistical weaknesses, ORA’s survey suggests that there has been a diminishment in customers’ perception of Pacific’s service quality.
279. The JD Power survey does not measure consumer satisfaction with Pacific’s service performance, but provides an overall measure of consumer satisfaction with the company.
280. On the JD Power Survey, Pacific received a score of 110 in 2001 from J.D. Power, where 104 is the industrial average score.
281. On the JD Power Survey, Pacific ranked in the top six out of the sixteen local service providers surveyed.
282. An IDC survey of local exchange carriers found that Pacific’s customers are more satisfied than the average local telephone customer for all attributes studied except one. Pacific’s customers are the second most overall satisfied for customer service; Pacific’s customers are the third most satisfied for voice quality; and Pacific is one of the top three providers in over 85% of the areas measured.
283. In responses on the IDC survey to customer service and voice or service quality, Pacific showed results comparable to other utilities. Because of the small sample size used in the IDC survey, it is not possible to draw conclusions with statistical confidence.
224

R.01-09-001, I.01-09-002 COM/SK1/MP1/bb1
284. Market Insights conducts surveys for Pacific every month, 7-10 days following a service event to obtain information about the service interaction. The results of these surveys are reported to the FCC under ARMIS report 43-06 and to the CPUC under P.A. 02-04 in a slightly different format.
285. The Market Insights surveys indicate that Pacific’s customers in the 1998-2001 period are three to six percentage points less dissatisfied than the average of the top ten LECs.
286. The Market Insights surveys indicated that Pacific’s customers’ dissatisfaction rose for only installation services for residential and large business customers and business office services for residential and large business customers between 1998 and 2001. The dissatisfaction declined for all other services and categories. This trend was largely counter that of the reference group of utilities.
287. ORA failed to discuss the survey results reported in P.A. 02-04 and ARMIS 43-06.
288. There is no basis for finding that the dispute over Pacific’s P.A. 02-03 reporting requirements arises from anything other than confusion. The next phase of this proceeding offers the appropriate venue for resolving this confusion.
289. ORA’s survey of Verizon’s customers showed that service has improved since 1991.
290. Verizon’s surveys of its customers show that Verizon offers good service quality.
291. Analyzing complaint data provides information on those customers having the worst experiences with telecommunications utilities.
292. Pacific has 25.4 million access lines.
225

R.01-09-001, I.01-09-002 COM/SK1/MP1/bb1
293. Verizon has 6.3 million access lines.294. Only an extremely small percentage of customers file a
complaint at the Commission. In Pacific’s worst year, 1997, only 0.04% of lines were affected by a service quality complaint. This is approximately 4 in 10,000 lines.
295. In 1995, Pacific’s best year, only 0.02%, or 2 in 10,000 lines were affected by a service quality complaint.
296. In 1998, Verizon’s worst year, only 0.03% of lines were affected by a service quality complaint. This is approximately 3 per 10,000 lines.
297. In 1995, Verizon’s best year, only 0.02% of lines, or approximately 2 per 10,000, were affected by a complaint.
298. There have been six formal Commission proceedings finding problems with Pacific’s service quality since 1995.
299. There is no evidence that NRF was responsible for the increase in formal complaints against Pacific, and our data indicate a general improvement in Pacific’s service quality under most measures.
300. We cannot conclude, based on the record of this case, that NRF is responsible for this increase in formal complaint decisions adverse to Pacific, or that the problems that prompted these complaints would have been less significant under rate of return regulation.
301. Verizon does not show an increase in formal complaints, thereby casting doubt that NRF regulation is the cause of an increase in formal complaints.
226

R.01-09-001, I.01-09-002 COM/SK1/MP1/bb1
302. There is no evidence in this proceeding that the deployment of new technologies in the telecommunications network will create classes of technology haves and have-nots.
303. There is not evidence in this proceeding that the deployment of net technologies in the telecommunications network is linked to socio-economic status.
304. In the past, eventually new technologies were ubiquitously employed throughout the public switched telephone network.
305. In the past, the deployment of new technologies has not been linked to socio-economic status.
306. Although during the NRF period Pacific dealt with economic growth and the regulatory requirements of unbundling, we do not consider these factors as legitimate excuses for poor service quality.
307. Pacific’s staffing during the NRF period shows decreases followed by increases.
308. Pacific has increased its number of customer-facing staff in the last part of the 1990’s.
309. The 1997-98 El Niño season with its substantially increased rainfall led to increases in Pacific’s trouble reports.
310. Pacific’s rate changes introduced during the NRF period had the approval of the Commission.
311. It is reasonable to continue Pacific’s and Verizon’s MCOT reporting requirements.
312. Verizon’s customer service performance guarantee recompenses customers immediately after that suffer service problems.
227

R.01-09-001, I.01-09-002 COM/SK1/MP1/bb1
313. Verizon provides this service pursuant to tariff, and there is no evidence that Verizon fails to follow its tariff.
314. Verizon’s service performance guarantee is a welcome development in telecommunications service delivers.
315. Although Verizon has reduced its number of employees, we find no effect on service quality.
316. No party alleges that Verizon’s mergers and structural changes have had an adverse impact on service quality.
317. The financial incentives affecting service quality under rate of return regulation and those under NRF regulation very similar but differ in degree. Both permit the shareholders to benefit from all savings that the company can realize, including those savings realized by reducing customer service. Under rate of return regulation, however, the failure to spend on service quality could lead to a lowering of rates, while under NRF regulation this result did not occur. Thus, financial incentives under NRF to reduce service quality costs exceed those under rate of return regulation.
318. Under cost-of-service regulation, this Commission rarely systematically measured or assessed service quality provided by telecommunications utilities.
319. The Commission first adopted a General Order concerning service quality and setting performance standards for telecommunications utilities in 1973.
320. In the pre-NRF period, the Commission reviewed service quality only intermittently for telecommunications utilities, with major proceedings taking place in 1976 for Pacific and 1980 for Verizon.
321. Since the adoption of NRF in 1989, the Commission has reviewed service quality in 1994 and again this year.
228

R.01-09-001, I.01-09-002 COM/SK1/MP1/bb1
322. The examination of service quality in the telecommunications industry under NRF has been more comprehensive and consistent than that under cost of service regulation, and has created regulatory incentives to maintain or improve service quality.
323. No party to this proceeding claims that competition will ensure service quality in the provision of telecommunications services.
324. The key to determining how NRF regulation affects service quality is to look at and measure the performance of Pacific and Verizon, not arguments from first principles.
325. NRF created a series of regulatory and organizational incentives that increased the attention given to measuring and reviewing the service quality records produced by Pacific and Verizon.
326. Phase 3B of this proceeding will offer an opportunity for parties to suggest how to build on the record of high service quality produced under NRF and to improve on those areas of weakness in service quality.
CONCLUSION OF LAW
1. NRF’s impact on service quality was a key concern when we adopted the new framework in 1989.
2. Pursuant to the plan of this proceeding and our previous rulings, we have conducted extensive fact finding on the quality of service in this phase of the proceeding.
3. Although D.89-10-031, the decision establishing the NRF framework, did not institute specific service quality reporting requirements, the Commission subsequently adopted specific
229

R.01-09-001, I.01-09-002 COM/SK1/MP1/bb1
monitoring requirements and has periodically and systematically examined service quality.
4. Any changes that we make to NRF should be coordinated with revisions to GO 133-B that result from the rulemaking we recently opened to make such revisions, Rulemaking 02-12-004.
5. GO 133-B defines a held order as “[r]equests for primary (main) telephone service delayed over 30 days for lack of utility plant.”
6. Pacific’s method of counting held orders fails to comply with GO 133-B.
7. It is reasonable to require Pacific to continue to report the FCC’s MCOT results until further notice of the Commission.
8. It is reasonable to require Verizon to continue to report the FCC’s MCOT results until further notice of the Commission.
9. It is reasonable to use GO 133-B measures to assess Pacific and Verizon’s service quality.
10. It is reasonable to use the FCC’s ARMIS measures and a reference group to assess Pacific and Verizon’s service quality.
11. It is reasonable to use statistical methods to assess Pacific and Verizon’s service quality.
12. It is not reasonable to draw conclusions based on single deficiencies in performance since service quality depends on a company’s overall performance.
13. It is appropriate to consider the results of formal complaints and other formal Commission proceedings initiated during the NRF period in assessing Pacific and Verizon’s service quality.
14. The Commission intends to consider clarifying the meaning of the term “primary (main) telephone service” in GO 133-B in its Service Quality OIR, R.02-12-004. GO 133-B’s reference to “primary
230

R.01-09-001, I.01-09-002 COM/SK1/MP1/bb1
(main) telephone service” is unclear and requires clarification. It is unclear whether the quoted phrase refers to a class of service that includes basic exchange service and that the sequence of lines to an address is not a factor in the definition of primary service; or whether “primary (main) telephone service” refers only to the first line into a home. However, this is not the appropriate proceeding to revise this term.
15. GO 133-B specifically excludes billing inquiries from its measure of BOAT.
16. Pacific did not violate Pub. Util. Code § 451 in connection with its answer times for billing calls.
17. The Commission intends to consider whether to include billing calls within the GO 133-B standards in its Service Quality Order Instituting Rulemaking.
18. It is appropriate pursuant to Commission Rule 73 we take official notice of the Commission’s actions in the complaints or other formal proceedings as cited herein.
19. It is reasonable to use survey data in assessing customer perceptions concerning service quality.
20. It is reasonable to use statistically valid methods to determine the evidentiary weight to assign to a specific survey instrument.
21. It is reasonable to conclude that meeting GO 133-B standards adopted by the Commission is a sign that a carrier is providing good service quality.
22. It is reasonable to conclude that a utility that earns better scores on ARMIS service quality measures than the scores of a
231

R.01-09-001, I.01-09-002 COM/SK1/MP1/bb1
reference group that includes the major large utilities is providing good service quality.
23. It is reasonable that any assessment of the quality of service offered by a telecommunications utility focus on direct measures of service quality.
ORDER
IT IS ORDERED that:1. Pacific Bell (Pacific) shall conform its method of counting orders
held over 30 days to the requirements of General Order (GO) 133-B as stated in this decision. Within 30 days of the effective date of this decision, Pacific shall file a compliance document in this docket demonstrating its compliance with the requirements of this decision with regard to the calculation of such held orders.
2. Pacific shall continue to report data to this Commission for measures required under the Federal Communications Commission’s (FCC’s) Merger Compliance Oversight Team (MCOT) requirements that expired in November 2002 until further notice of the Commission.
3. Verizon California, Inc. (Verizon) shall continue to report data to this Commission for measures required under the FCC’s MCOT requirements contained in its order FCC 00-221 until further notice of the Commission.
4. We deny the Office of Ratepayer Advocates’ (ORA’s) recommendation that we conduct an audit of Pacific’s or Verizon’s historic installation data to determine the extent of data error and its
232

R.01-09-001, I.01-09-002 COM/SK1/MP1/bb1
subsequent impact on reported service quality results during the New Regulatory Framework (NRF) period
5. Pacific shall file and serve data in the form of a compliance filing in this docket that answers the questions concerning closed installation orders containing multiple lines as enumerated herein within 30 days of the effective date of this decision.
6. We deny The Utility Reform Network’s (TURN’s) request for a finding that Pacific has violated Pub. Util. Code § 451 with regard to its billing calls.
7. The Commission will consider in Phase 3B of this proceeding what regulatory actions it should take to ensure the continuation of high quality service by Pacific and Verizon and the improvement of service, where necessary or possible. The parties shall address such issues in their Phase 3B testimony.
8. Verizon shall notify us in advance if it seeks to discontinue reporting billing inquiries in its Business Office Answer Time (BOAT) results to make any other change in the types of calls it includes in its BOAT reporting.
9. Neither Pacific nor Verizon shall change the way they count their GO 133-B results (except as ordered herein) without advance permission of this Commission.
10. The Commission will consider in Phase 3B of this proceeding how to resolve the issues concerning the reporting of survey data under the P.A. 02-03 and P.A. 02-04 filing categories as described herein. The focus of the Commission’s consideration is to determine whether additional unreported data exists from the period under review and how Pacific and Verizon should file survey data on a going forward basis.
233

R.01-09-001, I.01-09-002 COM/SK1/MP1/bb1
11. The parties shall address any needed regulatory changes related to the findings this decision makes in Phase 3B of this proceeding.
This order is effective today.Dated October 30, 2003, at San Francisco, California.
MICHAEL R. PEEVEYPresident
GEOFFREY F. BROWN SUSAN P. KENNEDY
CommissionersI reserve the right to file a concurrence./s/ GEOFFREY F. BROWNCommissioner
I will file a concurrence./s/ SUSAN P. KENNEDYCommissioner
I reserve the right to file a dissent./s/ LORETTA M. LYNCHCommissioner
I reserve the right to file a dissent./s/ CARL W. WOODCommissioner
234

R.01-09-001, I.01-09-002 COM/SK1/MP1/bb1
APPENDIX A

R.01-09-001, I.01-09-002 COM/SK1/MP1/bb1
************ APPEARANCES ************
Gregory Hoffman Attorney At Law AT&T COMMUNICATIONS OF CALIFORNIA, INC. 795 FOLSOM STREET SAN FRANCISCO CA 94107 (415) 442-3776 [email protected]
M. Manuel Fishman Attorney At Law BARTKO ZANKEL TARRANT MILLER 900 FRONT STREET, STE 300 SAN FRANCISCO CA 94111 (415) 956-1900 [email protected]
Gregory Bowling TERRY J. HOULIHAN Attorney At Law BINGHAM MCCUTHEN LLP THREE EMBARCADERO CENTER SAN FRANCISCO CA 94111 (415) 393-2101 [email protected]
Erinn Putzi C/O PACIFIC BELL TELEPHONE COMPANY 140 NEW MONTGOMERY, SUITE 1900 SAN FRANCISCO CA 94105 [email protected]
Paul P. Strange C/O PACIFIC BELL TELEPHONE COMPANY 140 NEW MONTGOMERY, SUITE 1900 SAN FRANCISCO CA 94105 (415) 542-7552 [email protected]
Mark P. Schreiber Attorney At Law COOPER, WHITE & COOPER, LLP 201 CALIFORNIA STREET, 17TH FLOOR SAN FRANCISCO CA 94111 (415) 433-1900 [email protected] For: ROSEVILLE TELEPHONE COMPANY
Darwin Farrar Legal Division RM. 4107 505 VAN NESS AVE San Francisco CA 94102 (415) 703-1599 [email protected]
W. Jeffery Edwards Attorney At Law HUNTON & WILLIAMS 951 EAST BYRD STREET RICHMOND VA 23219-4074 (804) 788-8721 [email protected] For: Verizon California Incorporated
Gayatri Schilberg JBS ENERGY 311 D STREET, SUITE A WEST SACRAMENTO CA 95605 (916) 372-0534 [email protected]
Terry L. Murray MURRAY & CRATTY 227 PALM DRIVE PIEDMONT CA 94610 (415) 929-8876 - 309
- 1 -

R.01-09-001, I.01-09-002 COM/SK1/MP1/bb1
Glenn Semow CALIFORNIA CABLE & TELECOMM. ASSOC. 4341 PIEDMONT AVENUE OAKLAND CA 94611 (510) 428-2225 [email protected] For: CCTA
Jeffrey F. Beck SEAN P. BEATTY, E. GARTH BLACK Attorney At Law COOPER, WHITE & COOPER ,L.L.P. 201 CALIFORNIA ST., 17TH FLOOR SAN FRANCISCO CA 94111 (415) 433-1900 [email protected]
Gregory L. Castle Attorney At Law PACIFIC BELL 140 NEW MONTGOMERY ST. RM. 1627 SAN FRANCISCO CA 94105 (415) 542-7083 [email protected]
Michael D. Sasser JAMES B. YOUNG PACIFIC BELL 140 NEW MONTGOMERY STREET, 16TH FLOOR SAN FRANCISCO CA 94105 (415) 542-7552 [email protected]
Cynthia Wales PACIFIC BELL TELEPHONE COMPANY 140 NEW MONTGOMERY STREET, ROOM 1728 SAN FRANCISCO CA 94105 (415) 542-1259 [email protected]
David Discher Attorney At Law PACIFIC BELL TELEPHONE COMPANY 140 NEW MONTGOMERY STREET, 15TH FLOOR SAN FRANCISCO CA 94105 (415) 542-7673 [email protected]
Evelyn C. Lee Attorney At Law PACIFIC GAS AND ELECTRIC COMPANY
Thomas E. Morgan Senior Legal Analyst PILLSBURY WINTHROP, LLP 50 FREMONT STREET SAN FRANCISCO CA 94105 (415) 983-1145 For: per e-mail 10-10-02
Christine Mailloux Attorney At Law THE UTILITY REFORM NETWORK 711 VAN NESS AVENUE, SUITE 350 SAN FRANCISCO CA 94102 (415) 929-8876 [email protected]
Robert Finkelstein
2

R.01-09-001, I.01-09-002 COM/SK1/MP1/bb1
POST OFFICE BOX 7442 SAN FRANCISCO CA 94120 (415) 973-2786 [email protected]
L. Nelsonya Causby Attorney At Law PACIFIC TELESIS 140 NEW MONTGOMERY STREET, ROOM 1623 SAN FRANCISCO CA 94105 (415) 542-0322 [email protected] For: Pacific Bell
Katherine S. Ritchey Attorney At Law PILLSBURY WINTHROP LLP 50 FREMONT STREET SAN FRANCISCO CA 94105-2228 (415) 983-1655 [email protected] For: Pacific Bell Telephone Company
Patrick S. Thompson Attorney At Law PILLSBURY WINTHROP LLP 50 FREMONT STREET, 5TH FLOOR SAN FRANCISCO CA 94105 (415) 983-1511 [email protected] For: SBC Pacific Bell
Attorney At Law THE UTILITY REFORM NETWORK 711 VAN NESS AVE., SUITE 350 SAN FRANCISCO CA 94102 (415) 929-8876 [email protected] For: TURN
James B. Drimmer Attorney At Law THORSNES, BARTOLOTTA & MCGUIRE 2550 FIFTH AVENUE, SUITE 1100 SAN DIEGO CA 92109 (916) 236-9363 [email protected]
Terrance A. Spann Regulatory Law Office US ARMY LEGAL SERVICES AGENCY DEPARTMENT OF THE ARMY JALS-RL 901 N. STUART STREET, SUITE 700 ARLINGTON VA 22203-1837 [email protected] For: DEPARTMENT OF DEFENSE/ALL OTHER FEDERAL EXECUTIVE AGENCIES
Rudolph M. Reyes VERIZON 711 VAN NESS AVENUE, SUITE 300 SAN FRANCISCO CA 94102 (415) 749-5539 [email protected] For: VERIZON
3

R.01-09-001, I.01-09-002 COM/SK1/MP1/bb1
Elaine Duncan Attorney At Law VERIZON CALIFORNIA 711 VAN NESS AVE, SUITE 300 SAN FRANCISCO CA 94102 (415) 474-0648 [email protected]
Woodbridge Attorney WORLDCOM, INC. 201 SPEAR STREET, 9TH FLOOR SAN FRANCISCO CA 94105 (415) 228-1140 [email protected]
Richard B. Severy Director WORLDCOM, INC. 201 SPEAR STREET, 9TH FLOOR SAN FRANCISCO CA 94105 (415) 228-1121 [email protected] For: WORLDCOM
********** STATE EMPLOYEE ***********
Michael C. Amato Telecommunications Division RM. 3203 505 VAN NESS AVE San Francisco CA 94102 (415) 703-1863 [email protected]
Bill Chang Telecommunications Division AREA 3-C 505 VAN NESS AVE San Francisco CA 94102 (415) 703-2381 [email protected]
Brian M. Chang Office of Ratepayer Advocates RM. 4101 505 VAN NESS AVE San Francisco CA 94102 (415) 703-1333 [email protected]
Charles H. Christiansen Telecommunications Division AREA 3-D 505 VAN NESS AVE San Francisco CA 94102 (415) 703-1901 [email protected]
Cherrie Conner Telecommunications Division AREA 3-D 505 VAN NESS AVE San Francisco CA 94102 (415) 703-2767 [email protected]
Laura E Gasser Legal Division RM. 4107 505 VAN NESS AVE
4

R.01-09-001, I.01-09-002 COM/SK1/MP1/bb1
Jeanne Beauregard Legal Division RM. 4208 505 VAN NESS AVE San Francisco CA 94102 (415) 703-3084 [email protected]
Robert Benjamin Telecommunications Division AREA 3-D 505 VAN NESS AVE San Francisco CA 94102 (415) 703-1069 [email protected]
San Francisco CA 94102 (415) 703-2169 [email protected]
Timothy Kenney Administrative Law Judge Division RM. 5020 505 VAN NESS AVE San Francisco CA 94102 (415) 703-1626 [email protected]
Thomas Lew Office of Ratepayer Advocates RM. 4205 505 VAN NESS AVE San Francisco CA 94102 (415) 703-1784 [email protected]
Alan Lofaso Executive Division 770 L STREET, SUITE 1050 Sacramento CA 95814 (916) 327-7788 [email protected]
Joseph Loo Water Division AREA 3-B 505 VAN NESS AVE San Francisco CA 94102 (415) 703-2224 [email protected] For: Telco Division
Carlos A Machado
James Simmons Office of Ratepayer Advocates RM. 4101 505 VAN NESS AVE San Francisco CA 94102 (415) 703-3512 [email protected]
Richard Smith Telecommunications Division AREA 3-E 505 VAN NESS AVE San Francisco CA 94102 (415) 703-1633 [email protected]
Craig A Stevens Telecommunications Division
5

R.01-09-001, I.01-09-002 COM/SK1/MP1/bb1
Executive Division 770 L STREET, SUITE 1050 Sacramento CA 95814 (916) 327-3277 [email protected]
Monica L. McCrary Legal Division RM. 5134 505 VAN NESS AVE San Francisco CA 94102 (415) 703-1288 [email protected]
Nazmeen Rahman Telecommunications Division AREA 3-D 505 VAN NESS AVE San Francisco CA 94102 (415) 703-1625 [email protected]
Randy Chinn Chief Consultant SENATE ENERGY UTILITIES & COMMUNICATIONSROOM 4040 STATE CAPITOL SACRAMENTO CA 95814 (916) 445-9764 [email protected]
Danilo E. Sanchez Office of Ratepayer Advocates RM. 4205 505 VAN NESS AVE San Francisco CA 94102 (415) 703-2771 [email protected]
AREA 3-D 505 VAN NESS AVE San Francisco CA 94102 (415) 703-5265 [email protected]
Maria E. Stevens Executive Division RM. 500 320 WEST 4TH STREET SUITE 500 Los Angeles CA 90013 (213) 576-7012 [email protected]
Michael Sukhov Office of Ratepayer Advocates RM. 4101 505 VAN NESS AVE San Francisco CA 94102 (415) 703-1349 [email protected]
Lee-Whei Tan Office of Ratepayer Advocates RM. 4101 505 VAN NESS AVE San Francisco CA 94102 (415) 703-1185 [email protected]
Sarah R Thomas Administrative Law Judge Division RM. 5105 505 VAN NESS AVE San Francisco CA 94102 (415) 703-2310 [email protected]
6

R.01-09-001, I.01-09-002 COM/SK1/MP1/bb1
Sue Wong Telecommunications Division AREA 3-D 505 VAN NESS AVE San Francisco CA 94102 (415) 703-2308 [email protected]
Sindy J. Yun Legal Division RM. 4107 505 VAN NESS AVE San Francisco CA 94102 (415) 703-1999 [email protected]
********* INFORMATION ONLY **********
Andrew O. Isar Director-State Affairs ASSOCIATION OF COMMUNICATIONS ENTERPRISE7901 SKANSIE AVE., SUITE 240 GIG HARBOR WA 98335 (253) 851-6700 [email protected]
Stephen P. Bowen Attorney At Law BOWEN LAW GROUP 235 MONTGOMERY STREET, SUITE 920 SAN FRANCISCO CA 94104 (415) 394-7500 [email protected]
Barry Ross Executive Vice President CALIFORNIA TELEPHONE ASSOCIATION 1851 HERITAGE LN STE 255 SACRAMENTO CA 95815-4923
Douglas Garrett JOSE [email protected] COX CALIFORNIA TELCOM, L.L.C. 2200 POWELL STREET, STE. 1035 EMERYVILLE CA 94608 (510) 923-6220 [email protected]
David Marchant Attorney At Law DAVIS WRIGHT TREMAINE LLP ONE EMBARCADERO CENTER, STE 600 SAN FRANCISCO CA 94111-3834 (415) 276-6500 [email protected]
Lee Burdick Attorney At Law FERRIS & BRITTON 401 WEST A STREET, SUITE 1600 SAN DIEGO CA 92101 (619) 233-3131 [email protected] For: Cox California Telecom, LLC
Cheryl Hills ICG COMMUNICATIONS, INC. 180 GRAND AVENUE, SUITE 450 OAKLAND CA 94612 (510) 239-7201 [email protected]
Cynthia Walker ICG TELECOM GROUP, INC. 180 GRAND AVENUE, SUITE 450 OAKLAND CA 94612 (510) 239-7089 [email protected]
7

R.01-09-001, I.01-09-002 COM/SK1/MP1/bb1
Ellen Lee CONTRA COSTA TIMES 2640 SHADELANDS DRIVE WALNUT CREEK CA 94598 (925) 847-2125 [email protected]
Doug Garrett COX CALIFORNIA TELCOM LLC 2200 POWELL STREET, SUITE 1035 EMERYVILLE CA 94608 (510) 923-6220 [email protected]
Earl Nicholas Selby Attorney At Law LAW OFFICES OF EARL NICHOLAS SELBY 418 FLORENCE STREET PALO ALTO CA 94301-1705 (650) 323-0990 [email protected]
Margaret L. Tobias Attorney At Law LAW OFFICES OF EARL NICHOLAS SELBY 418 FLORENCE STREET PALO ALTO CA 94301 (415) 641-7873 [email protected]
Henry Weissmann Attorney At Law MUNGER, TOLLES & OLSON LLP 355 SOUTH GRAND AVENUE, SUITE 3500 LOS ANGELES CA 90071-1560 (213) 683-9150 [email protected] For: Verizon California Incorporated
Martin A. Mattes Attorney At Law NOSSAMAN GUTHNER KNOX & ELLIOTT, LLP 50 CALIFORNIA STREET, 34TH FLOOR SAN FRANCISCO CA 94111-4799 (415) 398-3600 [email protected]
Ethan Sprague PAC-WEST TELECOMM, INC. 1776 WEST MARCH LANE 250
George Sanchez, Jr. Chief Operations Officer RICHARD HEATH & ASSOCIATES, INC. 7847 CONVOY COURT 102 SAN DIEGO CA 92111 (858) 514-4025 [email protected]
Kristine Lucero RICHARD HEATH AND ASSOCIATES, INC. 590 W. LOCUST AVENUE, SUITE 103 FRESNO CA 93650 (559) 447-7000 [email protected]
David A. Simpson Attorney At Law SIMPSON PARTNERS LLP 900 FRONT STREET SAN FRANCISCO CA 94111 (415) 773-1790
8

R.01-09-001, I.01-09-002 COM/SK1/MP1/bb1
STOCKTON CA 95207 (209) 926-3416 [email protected]
William J. Dorgan PILLSBURY WINTHROP LLP 50 FREMONT STREET SAN FRANCISCO CA 94105-2228 (415) 983-1145 [email protected]
Karen P Paull Legal Division RM. 5027 505 VAN NESS AVE San Francisco CA 94102 (415) 703-2630 [email protected]
Patrick J. Mcguire RCN TELECOM SERVICES, INC 105 CARNEGIE CENTER, 2ND FLOOR PRINCETON NJ 08540 (609) 919-8247 [email protected]
Taura O'Lariscy Project Manager RHA 1225 8TH ST., SUITE 580 SACRAMENTO CA 95814 (916) 444-9828 [email protected]
Richard B. Lee SNAVELY KING & MAJOROS O'CONNOR &LEE INC1220 L STREET N.W. SUITE 410 WASHINGTON DC 20005 (202) 371-9151 [email protected]
Craig Neeld TECHNOLOGIES MANAGEMENT INC. 210 N. PARK AVE. WINTER PARK FL 32789 (407) 740-3017 [email protected]
Michael Shames Attorney At Law UTILITY CONSUMERS' ACTION NETWORK 3100 FIFTH AVENUE, SUITE B SAN DIEGO CA 92103 (619) 696-6966 [email protected]
Lupita Reyes VERIZON CALIFORNIA INC. 112 LAKEVIEW CANYON, CA501LS THOUSAND OAKS CA 91362 (805) 372-6965 [email protected]
David M. Wilson Attorney At Law WILSON & BLOOMFIELD LLP
9
R.01-09-001, I.01-09-002 COM/SK1/MP1/bb1
1901 HARRISON STREET, SUITE 1630 OAKLAND CA 94612 (510) 625-8250 [email protected]
END OF APPENDIX A
10


![a]pyrimidines Chapter 1 Synthesis and biological ...shodhganga.inflibnet.ac.in/bitstream/10603/31449/7/07_chapter 1.pdf · Chapter 1 Synthesis and biological evaluation of 1,2,4-triazolo[1,5-a]pyrimidines](https://static.fdocuments.in/doc/165x107/5e80fabdbbde9517e2220083/apyrimidines-chapter-1-synthesis-and-biological-1pdf-chapter-1-synthesis.jpg)