
DockerCon SF 2015: Docker, Enabling Continuous (Food) Delivery
Upload
docker-incCategory
view
3.247download
2
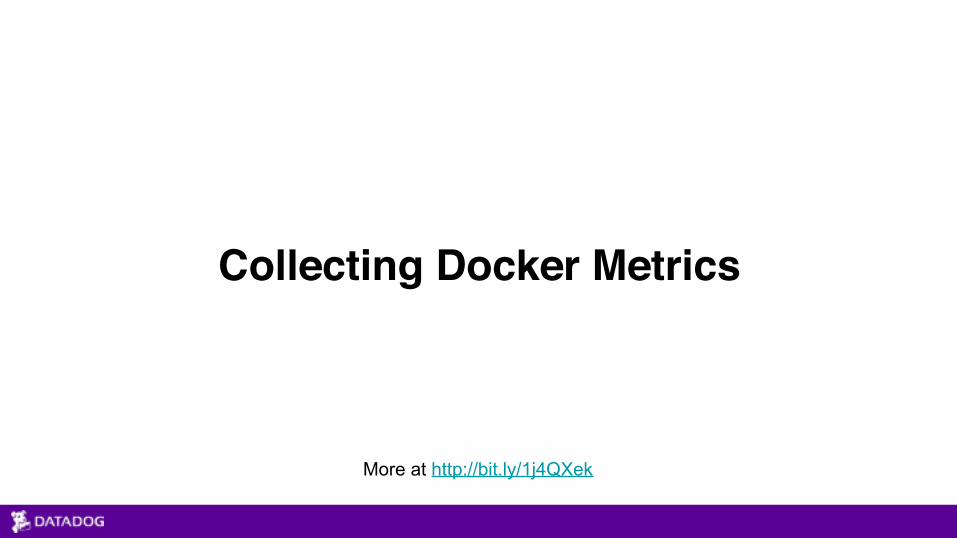
Monitoring Docker
Ilan RabinovitchDirector, Community - Datadog

Agenda
• Monitoring 101 - Crash Course• Challenges in Monitoring Dynamic Infrastructure • Key Docker Metrics

About Me • Long time Datadog user.
• Prior to Datadog built automation and monitoring tooling at Ooyala and Edmunds.com
• Community Event Organizer:SCALE and Texas Linux FestDevOpsDay LA DevOpsDay Silicon Valley
Ilan RabinovitchDatadog

Quick Overview of Datadog Datadog gathers performance data from all your application and infrastructure components.
• Monitoring for modern applications1. Dynamic Infrastructure2. Containers (Docker, ECS, Mesos, k8s, and more…)3. Microservices
• Time series storage of metrics and events• Trending, alerting and anomaly detection.• We’re hiring! (Remote, NY, Boston, Paris)

https://www.datadoghq.com/docker-adoption/

Docker Adoption Growth We’ve see 5x increase of Docker adoption over the last year.

Monitor Everything
Culture Automation Metrics Sharing
Damon Edwards and John WillisDevOpsDay LA


Operational Complexity
• Average containers per host: N (N=4, 10/2015)• N-times as many “hosts” to manage• Affects
• provisioning: prep’ing & building containers• configuration: passing config to containers• orchestration: deciding where/when containers run• monitoring: making sure containers run properly

So what does that mean for monitoring and management?

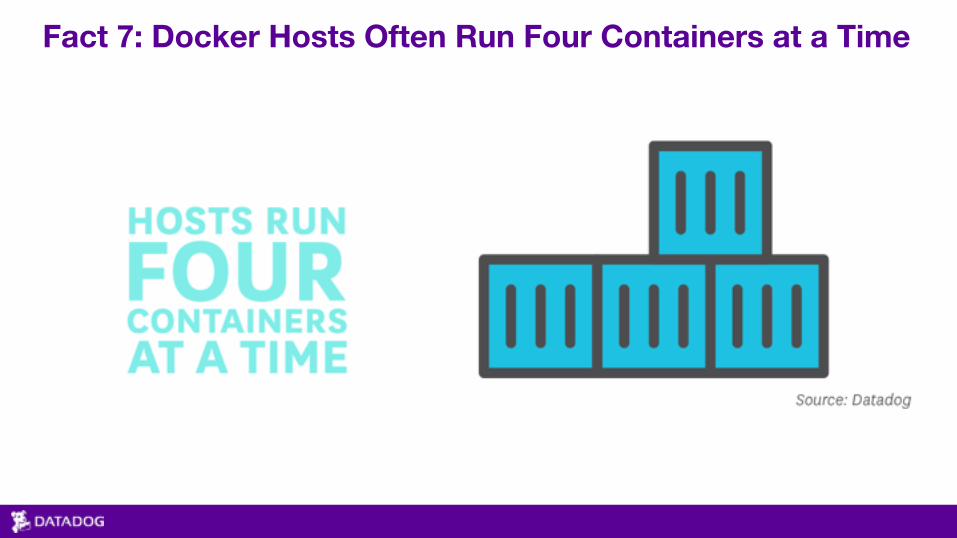
Fact 7: Docker Hosts Often Run Four Containers at a Time


Operational Complexity: Scale
100instances
400containers

Operational Complexity: Scale
160metrics per host
640metrics per host
Assuming 4 containers per host

Operational Complexity: Scale
100instances
64,000metrics
Assuming 4 containers per host

Operational Complexity: Velocity


Monitoring Needs and Pains
• Avoid Static config files tracking dynamic infrastructure.

Monitoring Needs and Pains: Static vs Dynamic
• Avoid Static config files tracking dynamic infrastructure. Configuration management is awesome, but….

Monitoring Needs and Pains
• Avoid Static config files tracking dynamic infrastructure. • Avoid a host centric view. Focus on service level.

Monitoring Needs and Pains: Host Centric vs Service Centric

Monitoring Needs and Pains: Host Centric vs Service Centric

Monitoring Needs and Pains
• Avoid Static config files tracking dynamic infrastructure. • Avoid a host centric view. Focus on service level. • Use tags, labels, etc on your hosts and metrics to form queries.

Monitoring Needs and Pains: Query Based Monitoring
“Show me rate of HTTP 500 responses from nginx” “… in region us-east-1 across all availability zones” “… running my app version 2….”
• Use tags, labels, etc on your hosts and metrics to form queries. • Pull in labels from your infrastructure whether EC2, Docker or your
scheduler. • Ask questions that will ring true regardless of your scale that day.

Monitoring Needs and Pains
• Avoid Static config files tracking dynamic infrastructure. • Avoid a host centric view. Focus on service level. • Use tags, labels, etc on your hosts and metrics to form queries. • Know your underlying tech. In this case Docker and how to pull
metrics from it.

Collecting Docker Metrics: Pseudo Files
• Access via sysfs in /sys/fs/cgroup or /cgroup• By default do not require root access.• Fast and light weight• Limited I/O and Network metrics.

Collecting Docker Metrics: stats
• Continuous live stream of basic CPU, memory, & network metrics.• Available via API in JSON (see unix:///var/run/docker.sock)• At least version 1.5.0 of Docker (released Feb 2015)

Collecting Docker Metrics: stats api
• Similar to stats command provides a stream of metrics but more details.
• Data is returned in JSON (see unix:///var/run/docker.sock)


Collecting Docker Metrics: Summary
CPU METRICSMEMORY METRICS I/O METRICS
NETWORK METRICS
pseudo-files Yes Yes Some Yes, in 1.6.1+
stats command Basic Basic No Basic
API Yes Yes Some Yes