Do public fund windfalls increase corruption? Evidence ... · PDF fileDo public fund windfalls...
47
Do public fund windfalls increase corruption? Evidence from a natural disaster Elena Nikolova and Nikolay Marinov Summary We show that unexpected financial windfalls increase corruption in local government. Our analysis uses a unique data set on flood-related transfers, and the associated spending infringements which the Bulgarian central government distributed to municipalities following torrential rains in 2004 and 2005. We build an index of corruption using information from the publicly available audit reports, and exploit the quasi-random nature of the rainfall shock (conditional on controls for ground flood risk) to isolate exogenous variation in the amount of funds received by each municipality. Our results imply that a 10 per cent increase in the per capita amount of disbursed funds leads to a 12.2 per cent increase in corruption. We also present suggestive evidence that while corruption had little effect on the re-election probability of the incumbent mayor, this was partly due to more corrupt mayors dropping out of the election race. Our results highlight the governance pitfalls of non-tax transfers, such as disaster relief or assistance from international organisations, in weak democracies. Keywords: corruption, flooding, public funds, Bulgaria. JEL Classification: D73, H7, P35. Contact details: Elena Nikolova, One Exchange Square, London EC2A 2JN, United Kingdom Phone: +44 20 7338 7931; Fax: +44 20 7338 6110; email: [email protected]. Elena Nikolova is a Research Economist at the European Bank for Reconstruction and Development. Nikolay Marinov is Assistant Professor at the Department of Political Science, University of Mannheim. We would like to thank Erik Bergl¨ of, C ¸a˘ gatay Bircan, Ralph De Haas, Sergei Guriev, Sandra Sequeira and seminar participants at Brunel, the EBRD and LSE for useful comments, and Erik Bergl¨ of and Stefka Slavova for help with obtaining Bulgarian rainfall data. Daniel Bierbaumer and Milena Djourelova provided excellent research assistance. The views expressed in this paper are those of the authors only and not necessarily of the EBRD. The working paper series has been produced to stimulate debate on economic transition and development. Views presented are those of the authors and not necessarily of the EBRD. Working Paper No.179 Prepared in April 2015
Transcript of Do public fund windfalls increase corruption? Evidence ... · PDF fileDo public fund windfalls...

Do public fund windfalls increase corruption?Evidence from a natural disaster
Elena Nikolova and Nikolay Marinov
SummaryWe show that unexpected financial windfalls increase corruption in local government. Our analysis uses a uniquedata set on flood-related transfers, and the associated spending infringements which the Bulgarian centralgovernment distributed to municipalities following torrential rains in 2004 and 2005. We build an index ofcorruption using information from the publicly available audit reports, and exploit the quasi-random nature of therainfall shock (conditional on controls for ground flood risk) to isolate exogenous variation in the amount of fundsreceived by each municipality. Our results imply that a 10 per cent increase in the per capita amount of disbursedfunds leads to a 12.2 per cent increase in corruption. We also present suggestive evidence that while corruption hadlittle effect on the re-election probability of the incumbent mayor, this was partly due to more corrupt mayorsdropping out of the election race. Our results highlight the governance pitfalls of non-tax transfers, such as disasterrelief or assistance from international organisations, in weak democracies.
Keywords: corruption, flooding, public funds, Bulgaria.
JEL Classification: D73, H7, P35.
Contact details: Elena Nikolova, One Exchange Square, London EC2A 2JN, United KingdomPhone: +44 20 7338 7931; Fax: +44 20 7338 6110; email: [email protected].
Elena Nikolova is a Research Economist at the European Bank for Reconstruction and Development. NikolayMarinov is Assistant Professor at the Department of Political Science, University of Mannheim.
We would like to thank Erik Berglof, Cagatay Bircan, Ralph De Haas, Sergei Guriev, Sandra Sequeira and seminar participants at Brunel, theEBRD and LSE for useful comments, and Erik Berglof and Stefka Slavova for help with obtaining Bulgarian rainfall data. Daniel Bierbaumerand Milena Djourelova provided excellent research assistance. The views expressed in this paper are those of the authors only and notnecessarily of the EBRD.
The working paper series has been produced to stimulate debate on economic transition and development. Viewspresented are those of the authors and not necessarily of the EBRD.
Working Paper No.179 Prepared in April 2015

1 Introduction
How do financial windfalls affect governance? One strand of the literature has related non-taxwealth (mainly derived from natural resources) to weakened democratic institutions (Gervasoni,2010; Jensen and Wantchekon, 2004; Ramsay, 2011; Ross, 2001), corruption (Ahmed, 2013;Caselli and Michaels, 2013; Vicente, 2010) and poor quality of politicians (Brollo et al., 2013).In contrast, a different body of work has questioned these effects. Several counter-arguments havebeen advanced: (1) some countries may in fact experience a “resource blessing” (Dunning, 2008;Haber and Menaldo, 2011); (2) a deterioration in leader accountability following a resource boommay be short-lived, particularly when institutional constraints are strong (Monteiro and Ferraz,2010); and (3) access to information may play a key role in reversing the negative link betweenwindfalls and governance (Guiteras and Mobarak, 2014).
Despite the growth of this literature, scholars have paid relatively little attention to the gover-nance consequences of non-resource windfalls, such as natural disaster relief. While most ofthe existing work has utilised cross-country evidence, the few existing micro-level papers havefocused on a limited set of large developing countries (Argentina, Bangladesh and Brazil). How-ever, lessons from Latin America and Asia may be difficult to apply to the transition countriesin central and eastern Europe, due to geographic, cultural and historical differences. These areimportant omissions, since both corruption and local transfers (from central governments as wellas international organisations such as the European Union) in these new democracies are non-negligible and subject to much discussion.
We fill this gap by examining how intra-governmental transfers affect local corruption in Bul-garia. We use a unique data set on the amount and use of disaster aid distributed to local govern-ments following unexpected torrential rains which led to flooding in 2004 and 2005. The awardedfunds represented a non-negligible financial injection (amounting to around 15.6 per cent of mu-nicipal income for the average municipality), and local governments were the ultimate authorityon how the money would be spent. Moreover, what was not known at the time of disbursementwas that an independent national auditing watchdog would be summoned in 2006 to issue detailedreports on how the money was used for 227 out of 257 municipalities receiving assistance.1 Theresulting public reports chronicle a variety of infringements including: (1) contracts not awardedto the highest bidder or no bidding; (2) money channelled for the repair of buildings experiencingno damage; and (3) money given for no work. We exploit this information to create an objective– as opposed to a perception-based – measure of corruption, which sums all the infringementsrecorded in a municipality between 2004 and 2005.2
We use this corruption index to test an important hypothesis: do public fund transfers resultin more corruption in local government? Our identification strategy exploits the quasi-randomnature of the rainfall shock (conditional on several proxies for ground flood risk) to isolate ex-ogenous variation in the amount of funds received by each municipality. Our data are very richand include a wide range of additional municipal characteristics, such as unemployment and the
1These municipalities comprised 96.8 per cent of disbursed funds.2Objective corruption measures similar to ours may be more accurate than perception-based variables (Olken,
2009). See also Treisman (2007).
1

political affiliation of the local government. According to our instrumental variable estimates, a10 per cent rise in per capita relief funds increased corruption by 12.2 per cent in the averagemunicpality, which is a sizeable effect.
Furthermore, suggestive evidence implies that corruption had little effect on the re-election chancesof the incumbent mayor. This is partly due to the fact that mayors in high-corruption municipal-ities were less likely to run for re-election, with a stronger effect in municipalities in which theincumbent had previously won by a narrow margin. More tentatively, we find that the link be-tween funds and corruption varies with municipal characteristics. The negative impact of floodassistance on governance is stronger in municipalities which are more developed economicallyand which have a weaker media. All in all, our suggestive evidence on mechanisms indicates thatpolitical accountability informs the decision to steal: mayors engage in corrupt behaviour whenthey feel they can get away with it, or when the prize of stealing more outweighs the benefit ofrunning for office again.
Our work complements a growing literature on the drivers of corruption in developing and transi-tion countries, particularly using non-survey measures and arguably identified designs (Bertrandet al., 2007; Ferraz and Finan, 2011; Findley et al., Forthcoming; Fisman and Miguel, 2007;Mironov and Zhuravskaya, 2014; Reinikka and Svensson, 2005). Our study is also related towork on the impact of natural disasters on economic and political outcomes, such as Bechtel andHainmueller (2011); Lazarev et al. (Forthcoming); Leeson and Sobel (2008) and Quiroz Floresand Smith (2013).3
We contribute to earlier studies in at least three important ways. First, the unique research de-sign we utilise, along with the richness of our data, helps us to determine the impact of intra-governmental transfers on local corruption. Second, while the analysis is circumscribed to aparticular country and event, our findings may nevertheless provide useful lessons for other coun-tries in the transition region where external transfers (such as those administered by the EuropeanUnion or foreign donors) are particularly important. Bulgaria is possibly the most corrupt statein the European Union, and the target of large public fund infusions. More broadly, our resultsrelate to the policy debate among international financial institutions as to whether weather-relatedinsurance should be provided publicly or by the market. While the eastern European experiencedemonstrates that privatisation is far from a panacea, this work warns that local governments maybe tempted to pocket at least some of the disaster relief, thus stalling vital reconstruction efforts.
3See also Dell et al. (2014) for a review of this literature.
2

2 Public fund transfers and corruption incentives
Consider a municipality which receives an unexpected financial windfall, such as flood relieffrom the central government. First, municipalities may spend some or all of the allocated moneyfor reconstruction. Local politicians who utilise aid effectively may be more likely to be re-elected in localities directly affected by the disaster as the population exhibits “voter gratitude”(Bechtel and Hainmueller, 2011), while corrupt leaders may be punished at the polls (Klasnjaet al., 2012).4 In addition, efficient handling of relief funds may serve as a signal of (local ornational) government presence and competence even for voters in localities which may not havebeen directly affected by the disaster. In Russia, for instance, Lazarev et al. (Forthcoming) findthat such “demonstration effects” are responsible for unexpectedly high levels of governmentapproval.5 Importantly, political parties may be able to build on the reputation of municipalpoliticians to win national elections, thus improving even further the re-election chances of localbureaucrats (Brollo and Nannicini, 2012).
Alternatively, local policymakers may also pocket some or all of the money for their own benefit,even if they care about subsequent re-election. First, patronage can be distributed to particulargroups of voters that may be more likely to support incumbents at the polls, such as public sectorworkers (Monteiro and Ferraz, 2010). Similarly, firms which obtain lucrative reconstructioncontracts may “repay the favour” by financing a mayor’s re-election campaign. Second, localgovernments may misappropriate relief aid if they believe that the risk of being caught is low.For example, voters may not easily update their beliefs about politicians’ competence when themedia is weak (Ferraz and Finan, 2008; Reinikka and Svensson, 2005). Likewise, less educatedvoters may find it more difficult to judge leaders’ performance and to hold them accountable.Finally, incumbents may opt to steal funds now simply because doing so is more profitable thanthe uncertain payoff from a future election. Sizeable and unexpected disaster relief may makecorrupt activities particularly tempting compared with waiting to grab other political rents later.
In this paper, we are interested in answering the following question: does an increase in intra-governmental transfers affect corruption in local government and, if so, via what mechanisms?Credibly identifying the impact of relief funds on local government corruption raises two chal-lenges: (1) constructing a reliable corruption measure; and (2) isolating exogenous variation indisaster aid. To deal with the first point, we exploit the fact that in early 2006 the central gov-ernment commissioned an independent audit agency (the Bulgarian National Audit Agency) toconduct comprehensive inspections on how the funds had been used by each municipality. Webuild an index of corruption using information on the various spending infringements recordedby the agency in each municipality, in the spirit of Ferraz and Finan (2008, 2011).
The main difficulty in solving the second identification issue lies in the fact that unobservable
4It is also possible that voters in a high-corruption environment may react to corruption only when the state ofthe economy is also poor – see, for instance, Klasnja and Tucker (2013).
5In Romania, Pop-Eleches and Pop-Eleches (2012) show that even small amounts of targeted public spending(a e 200 voucher towards the purchase of a computer) make it more likely that recipients vote for the parties of theincumbent governing coalition. See also De La O (2013) and Manacorda et al. (2011) for similar findings in Mexicoand Uruguay, respectively.
3

characteristics may drive both the amount of disaster aid which the municipality receives andsubsequent corruption. For example, charismatic mayors may be more likely to be awarded ahigher amount of funds as well as to commit and get away with spending violations. A “naive”regression exploring the link between disaster aid and corruption may also suffer from reversecausality: more corrupt politicians may be able to extract a higher amount of assistance fromcentral government.
Previous work has addressed the latter concern in several ways. In Argentina, Gervasoni (2010)studies the impact of federal transfers on sub-national democracy and instruments the formerwith the reciprocal of state population. A similar but more rigorous approach is undertakenby Brollo et al. (2013) and Litschig and Morrison (2013) who use a regression discontinuitydesign. In Brazil, intra-governmental transfers change discontinuously and exogenously at givenpopulation thresholds, with all municipalities in the same state and the same population bracketreceiving the same transfers.6
Although these contributions are important, they leave some questions on the table. Instrument-ing intra-governmental transfers with population size is problematic because the exclusion re-striction is unlikely to be satisfied. This is not only because internal (and external) migration maydepend on the quality of political institutions,7 but also because population size may either affectlocal governance directly, or through omitted variables (for example, the quality of politicians).Moreover, since rule-based allocations of local transfers are rare in practice, researchers have fo-cused predominantly on the Brazilian case. Although lessons from Latin America are important,they may not be immediately relevant for the countries in the transition region due to geographicand historical differences. At the very least, testing for effects in a different context will helpvalidate existing insights and further the debate to issues not raised by Latin American cases.
In this paper, we utilise a new instrument for disaster-related assistance, derived from the case ofBulgaria during the 2004-05 floods. While the central government did not follow pre-agreed rulesfor distributing the funds to the municipalities (for instance, related to the number of destroyedbuildings), one of the intentions was to allocate more money to localities which experienced moreflooding. We exploit this information to construct a novel instrument for flood aid: the monthlyrainfall deviations (relative to a historical average) in each municipality over the period 2004-05.We argue that, conditional on controls for ground flood risk and other municipal characteristics,the instrument captures exogenous variation in the amount of flood aid received by each munici-pality. We describe in more detail our data and IV strategy in the next two sections.
Formally, we want to test the following hypothesis:
Hypothesis 1. Municipalities which received more flood-related transfers experienced more cor-ruption.
6Exploiting further the Brazilian case, Caselli and Michaels (2013) and Monteiro and Ferraz (2010) utilise off-shore oil-induced fiscal windfalls among Brazilian municipalities, arguing that such transfers are exogenous con-ditional on observable municipal characteristics and geographical rules for royalty distribution. See also Vicente(2010) who studies the effect of (arguably exogenous) oil discoveries on corruption using a difference-in-differenceframework which compares oil-rich Sao Tome and Principe with Cape Verde.
7See, for instance, Nikolova (Forthcoming).
4

Due to the richness and granularity of our data, we are also in a position to suggest some plausiblemechanisms driving the hypothesised relationship, which we discuss in more detail in Section 7.
5

3 Background
3.1 Floods
Between June 2004 and December 2005, Bulgaria was unexpectedly hit by several waves oftorrential rain which caused extensive flooding, with an estimated cost exceeding e 500 million.8
Just in August 2005 alone, nearly 1 billion litres of water fell over a total area of 6,000 squarekilometres, while the capacity of existing dams was only 250 million square metres. Accordingto hydrologists, such extreme rainfall is very rare, as the probability of its occurrence is between1/1000 and 1/10,000.9
To deal with the destruction following the floods, the central government awarded nearly e 67million to 257 flood-stricken municipalities.10 Each municipality had to apply for financing,specifying the particular projects, usually related to rebuilding roads, bridges or buildings, forwhich the awarded funds would be used. Although relatively small in absolute terms, thesedisbursements presented a substantial financial injection for many of Bulgaria’s impoverishedlocal governments. The average municipality received slightly over e 250,000, which amountedto approximately 15.6 per cent of its 2000 income and 21 per cent of its annual budget (usingdata from 2004 and 2005).11
The media reported multiple instances of fund misuse by local governments. For example, inBelovo municipality, a major bridge connecting the two parts of the town (located on either sideof a large river) was destroyed in spring 2005. On 16 August 2005, the municipality receivede 200,000 to deal with the damage. Within two days firms had already been contracted and paidfor works that in reality had not been done, as the bridge was still not functional in 2006. Inaddition, e 27,000 were paid for building an existing 12 km road.12 Such media reports and thepoor handling of the disaster by the central government created tension in parliament, which ledto a subsequent investigation and audits.13
8Newspaper Trud, 29 May 2005.9See Bulgarian National Television website, http://plovdiv.meteo.bg/phare/docs/Navodnenia.pdf .
10Mediapool.bg at www.mediapool.bg/firmi-na-dps-usvoyavali-zle-parite-za-ukrepvane-sled-starite-poroi-news115354.html. One euro is equivalent to around two leva (Bulgaria’s currency).
11Nearly e 150 million (including e 15.2 million from the European Union) were also disbursed in 2006. Since,as we discuss below, a fund use audit was ordered by the central government in March 2006, we only focus on fundsgiven in 2004 and 2005.
12Newspaper Sega at www.segabg.com/article.php?id=273924.13In the online Appendix, we discuss more extensively the political parties comprising the government coalition
which was in power at the time, as well as who controlled key ministries responsible for distributing the flood-relatedfunds.
6

3.2 Audits
The central government ordered detailed audits of all municipalities which received flood-relatedfunds in March 2006. Two different government agencies were summoned. The Bulgarian Na-tional Audit Agency (BNAA) audits entities financed by the national budget and alerts otheragencies (including parliament or a court) in the instances of suspected criminal activity. Theagency is non-partisan, and several pieces of evidence suggest that this is true not only on paperbut also in practice.
First, BNAA has complete control over its budget which cannot be changed by parliament. Sec-ond, although its senior management (consisting of a director and 10 board members) is electedby parliament, their terms are for nine years, as compared with the four-year election cycle.14
Third, BNAA must follow international financial audit criteria, such as those developed by theInternational Organization of Supreme Audit Institutions (INTOSAI) and the European Court ofAuditors (ECA). During the period studied in this paper, the European Union subjected BNAA toparticularly close scrutiny over the compliance with these standards due to Bulgaria’s accessionin 2007.
Even so, one may still be concerned that parliament’s involvement in the selection of BNAA’sleadership may compromise its independence. A recent report by Transparency Internationalsuggests that it is difficult for state institutions to exercise control over the agency’s activities.15
Moreover, the long tenures of BNAA’s directors make it less likely that it caters to narrow politicalinterests. BNAA’s independence is also strengthened by its high transparency, as informationfrom its audits and internal documents is readily available on its website and in the media.
BNAA audits are conducted by highly competent teams of auditors who must pass a public exam-ination and earn very competitive salaries. Supplementary paid employment (with the exceptionof research activities at a university) is prohibited. BNAA staff involved in a financial inspectionhave access to all of the auditee’s documents and can request additional data and written or oralexplanations. Once an audit is completed, auditors produce a report and recommendations foraction, which are shared with the Ministry of Finance and parliament. BNAA then follows up onthe execution of these recommendations, and if the actions undertaken by the audited entity areunsatisfactory, it alerts other government agencies.16
The Public Financial Inspection Agency (PFIA), by contrast, can either conduct self-initiated au-dits of public entities, or act upon external recommendations (by BNAA or a court, for instance).The crucial difference between PFIA and BNAA is that the former can directly impose legallybinding penalties. At the same time, experts agree that BNAA is very active when it comes
14This structure was in place from 2005 until 2011. Currently, the BNAA director is elected for a term of six years(with no re-election possible), while the eight board members are elected for a term of seven years. Elections for anew management board can take place no less than three months before the incumbents’ terms expire. None of theBNAA managers may have been involved in government or local administration positions in the last three years.
15www.transparency.bg/media/publications/NIS%20BULGARIA%20ENG(1).pdf .16See www.bulnao.government.bg/bg/articles/zakon-za-smetnata-palata-876 and www.bulnao.
government.bg/bg/articles/istorija-897. Unfortunately, data on the number and type of issued recommen-dations are not available in our data set.
7
to detecting misbehaviour and alerting the appropriate agency. BNAA’s reports are discussedextensively in the media and policy circles. In addition to holding responsibility for detectingirregularities in the spending of EU funds, the agency recently expanded its audits to politicalparties and to commercial companies in energy and pharmaceuticals, among others. This sug-gests that information from the BNAA audit reports is not simply “cheap talk” and should capturemeaningful variation in corruption across municipalities.
The major problem with interpreting the data from the PFIA audits is that the agency is politicallyaffiliated, as it is part of the Ministry of Finance. Its director is appointed by the Finance Ministerfor a four-year term, and while PFIA employees must have university-level training in economics,they are not required to pass an examination. In fact, PFIA recorded spending violations inless than a third of the municipalities in which BNAA detected corruption, and the correlationbetween the two corruption measures is less than 0.10. As a result, in the regressions below wefocus mostly on the BNAA corruption index. We present results with the PFIA data, which aresimilar but very imprecisely estimated, when conducting robustness checks.
Both agencies started their audits in March 2006 and finished them in September 2006. PFIAcovered all 257 municipalities which received flood-related assistance, while BNAA audited onlythose municipalities where the amount of funds was particularly large (227 in total). In the nextsection, we demonstrate that municipalities which were audited by BNAA are very similar tothose which were not audited along a variety of observable characteristics (including municipalpolitical affiliation), suggesting that selection is unlikely to drive our results.
8

4 Data
4.1 Measures of corruption
For each municipality, BNAA provides information on the amount of flood-related assistance,along with a description of the activities for which the funds were used. In the regressions below,we sum these amounts over 2004 and 2005 and divide them by the population of each munici-pality (we take the logarithm of the final quantity). Chart 1 shows the geographical distributionof per capita funds in the country.
[Chart 1]
For each of the audited municipalities, BNAA recorded all infringements related to the use offlood aid received during the period 1 January 2004 to 31 December 2005. BNAA groups in-fringements into four broad categories: (1) public procurement (for example, no public procure-ment procedure was used by the municipality to select firms); (2) use of funds (for instance, therewas payment for activities not listed in the contract); (3) reporting (for instance, no reports onfund use were sent to the Ministry of Finance); and (4) accounting and control (for instance, in-accurate accounting recording of the contracts). We provide more details on these categories andsub-categories in the online Appendix. Our corruption index sums all the recorded infractionsfor each municipality.17 Charts 2 and 3 summarise the geographical distribution of infringe-ments recorded by BNAA and PFIA, respectively (areas in striped font indicate that no audit wasperformed in that particular municipality).
[Charts 2 and 3]
One issue with our approach could be that the constructed corruption index may capture a mixtureof “corruption” and “mismanagement”. If our dependent variable is a proxy for the latter, ourresults could simply indicate that municipalities which receive more flood assistance do not havethe administrative capacity to deal with the increased reporting burden. There are several reasonsthat make this critique less convincing. First, all of the 2004-05 flood-related inspections wereclassified as “performance audits”, a specific type of BNAA audit which pays particular attentionto public fund fraud.18
While our measure includes items that have been associated with corruption in the rest of the lit-erature,19 it also contains infringements related to mis-reporting and mis-classifying the disaster
17Unfortunately, we have no information on the amount of funds associated with each violation.18In contrast, “financial audits” are conducted when the goal is to investigate whether the entity has followed the
administrative regulations for financial reporting.19As in Ferraz and Finan (2008, 2011), our data set covers infringements related to fraud in the procurement of
goods and services; diversion of funds; overinvoicing; incomplete public works (paid but in reality not finished); or(possibly) the use of fake receipts and phantom firms.
9

aid. At first glance, the latter type of infractions may seem benign. However, an examinationof official documents outlining the BNAA audit criteria speaks to the contrary. BNAA followsspecific rules designed by the European Union and the International Standards of Supreme AuditInstitutions (adopted by the Bulgarian parliament in 2000) on what constitutes public fund fraud.For example, although incomplete accounting procedures may be due to misinformation and ne-glect, the audit guidelines explain that such omissions are usually deliberate and are thereforestrong signals of fraud or corruption. Auditors are provided detailed examples (including fromreal-life situations) of when accounting mis-reporting indicates corruption, and instructed to in-vestigate further if the errors are purely accidental or in fact committed purposefully. Accountingoversights which are likely to be associated with fund fraud are then recorded against each au-dit criterion in the report, while purely administrative infringements are described in a separatesection. Importantly, we have excluded the latter as part of our dependent variable.
The audit reports provide further evidence that all infringements documented by BNAA are im-portant indicators of fraud. For example, in Elhovo municipality, BGN 136,675 (approximately68,000 Euros) from the funds earmarked for post-flood reconstruction were withdrawn in De-cember 2005 even though the repair works were not completed. In the municipality’s accounts,however, this sum was not recorded as “withdrawn,” providing strong evidence that the moneywas misappropriated. In Straldja municipality, the files reporting on how the funds were usedwhich the municipality was required to send to the Ministry of Finance were incomplete. Inparticular, no firm contract was supplied and there were no pictures showing the condition of therepaired objects once the works were completed. Once more, the auditors’ check showed thatsince these omissions were deliberate, they were most likely due to corrupt activities.
Since corruption in general is extremely difficult to measure, it would be difficult to claim thatour dependent variable is a perfect indicator of local government fraud. Even though auditorswork in teams and follow strict auditing criteria, it is possible that infringements related to cor-ruption may be confused with those capturing only mismanagement. To the extent that this is notsystematic, this should not be an overwhelming concern in our analysis. In addition, our rich setof municipal controls, which ranges from unemployment to urbanisation and media, should helpremove, at least partially, any contaminating effects which may be correlated with local observ-able characteristics. It is also reassuring that our results survive when we calculate the corruptionindex using principal component analysis (in the robustness checks), suggesting that our findingsare not driven by the idiosyncrasies of a particular coding approach.
4.2 Flood damage and risk
We obtain monthly rainfall data for 2004-05 from the Bulgarian National Institute for Meteorol-ogy and Hydrology. Since the number of municipalities is greater than that of weather stations(101), we adopt an interpolation procedure using a radius of 45 km and weights which are theinverse of the municipality’s distance to a station. To make sure that our rainfall data do notsimply capture long-term precipitation patterns, we calculate the rainfall variable used in the re-gressions as the monthly rainfall percent change relative to a monthly historical average. Thelatter is based on precipitation data for the period 1931-1985 from Koleva and Peneva (1990)
10

interpolated using the same procedure. For example, the rainfall quantity for January is sim-ply Rain f all january,2004−Rain f all january,1931−1985
Rain f all january,1931−1985. For each municipality, we then take the average rainfall
value for all months in 2004 and 2005 for which the change relative to the historical value wasat least 10 per cent. To give a better sense of this measure, Chart 4 plots it graphically for eachmonth and municipality, with the red horizontal line indicating our 10 per cent cut-off value. Thechart shows that the summer months of 2004 and 2005, along with February 2004, were periodsof particularly heavy rainfall for many municipalities.20
[Chart 4]
We include three proxies for ground flood risk. First, we control for the number of settlementsthat are located within 1 km of a water body (dam, lake or river), since households located close towater are more likely to experience flooding when there is extreme rainfall. Second, we controlfor average municipal elevation and slope, as flooding may be more intense in municipalitieslocated at a higher altitude and with a sloping terrain. We also include controls for latitude andlongitude.
4.3 Additional variables
In various specifications, we include controls for four categories of municipal characteristics:(1) economic conditions (log municipal income per capita, unemployment and net privatisationincome); (2) media and civil society (local newspaper circulation per capita, share of populationwith university degree, share of urban population and voter turnout in the 2003 local elections);(3) whether the mayor and council belong to the ruling coalition, and whether the mayor andcouncil belong to the party holding the disaster funds portfolio.21 In the robustness tables, wealso include two mayor characteristics, margin of victory in the 2003 elections and a dummyfor whether the mayor had any political experience before 2003.22 All of these data cover yearsprior to 2004, and the online Appendix provides detailed information on exact definitions andmeasurement.
4.4 Selection and summary statistics
Although the BNAA audit covered most municipalities (227 out of 257) and 96.8 per cent ofdisbursed funds, one concern could be that auditors selected municipalities non-randomly. In
20We experiment with alternative cut-off values (20 per cent, 30 per cent, 40 per cent and 50 per cent, in therobustness checks) and obtain very similar results.
21The Movement for Rights and Freedoms (MRF), a party whose electorate comprises mainly Bulgarian Turks,controlled the ministries allocating the flood aid. See the online Appendix for more details.
22We collected other mayor characteristics such as gender, field of education and years of political experienceusing an internet search. However, the data were very patchy so we do not include them in the regressions.
11

Table A1, we compare audited and non-audited municipalities across a variety of observablecharacteristics. The major difference between the two groups of municipalities is that localitieswhich received more funds were more likely to be audited. On average, audited municipalitiesreceived assistance amounting to BGN 43.3 (around e 20) per capita, while for non-audited onesthe figure is around BGN 10 (around e 5). This is not surprising, since official BNAA documentspoint out that the agency chose to audit those municipalities in which the amount of disbursedfunds was particularly high.
Few additional characteristics are associated with the probability of audit. Audited municipalitiesare more likely to be urban and with less unemployment. The average municipality receivedBGN 513,285 (around e 250,000), which amounted to 15.6 per cent of municipal income and21 per cent of its average annual budget in 2004-05. Corruption infringements were recorded in105 (47.1 per cent) of audited municipalities, and the average corrupt municipality committed0.775 violations (see also Chart A1 for a histogram of the corruption index). Both groups ofmunicipalities have municipal income per capita around BGN 240 (e 120). Importantly, thetable also shows that the audit choice was not driven by political considerations.23
23If anything, municipalities with mayors and/or councils affiliated with MRF were more likely to be audited.
12

5 Estimation strategy
Our estimation strategy exploits the unexpected nature of the natural disaster to isolate exogenousvariation in the amount of flood aid received by each municipality. To identify the impact offlood-related assistance on local government corruption, we estimate an instrumental variablesregression, where the second stage is given by:
CorruptionIndexir = αir +β1Log f undsir +β2FloodRiskir +Xirβ3 + γr + εir,
For each municipality i in region r, CorruptionIndexir is calculated by summing the spendinginfringements identified by BNAA during 2004-05, Log f undsir is the total flood-related assis-tance received by the municipality (in logs and per capita) during 2004-05, and FloodRiskir isproxied by the number of settlements within 1 km of a water body, average elevation and slope.Xir is a matrix of municipality-level characteristics that vary across specifications and includethe following broad categories described above: (1) geography; (2) economic conditions (mea-sured prior to 2004); (3) media and civil society (measured prior to 2004); (4) composition oflocal government since the 2003 local elections; and (5) mayor characteristics (in the robustnesschecks only). As a proxy for auditor effort, we also control for each municipality’s distance to theclosest BNAA territorial division, since auditors may audit less thoroughly municipalities whichare located further from the agency’s regional centre.24 Regional dummies (at the NUTS-2 level)and robust standard errors are also included.
We instrument Log f undsir as follows. For each municipality, we calculate the average monthlyrainfall change (relative to a historical average) for all months in 2004 and 2005 for which itexceeded the historical average by least 10 per cent, as explained above. The corresponding firststage is:
Log f undsir = αFir +β
F1 Rain f allir +β
F2 FloodRiskir +Xirβ
F3 + γ
Fr + ε
Fir,
We do not include our proxies for flood risk as additional instruments, as the exclusion restrictionis unlikely to be satisfied. In contrast to our rainfall instrument which captures short-term climaticfluctuations, fixed characteristics such as distance to water or elevation may also proxy for long-term factors which may directly affect municipal corruption.
The adopted IV strategy would be valid provided that three conditions are satisfied. First, thefirst-stage relationship between Rain f all and Log f unds must be strong. Second, rainfall shouldnot affect corruption directly. Third, the instrument should not be correlated with the error termin the second-stage regression. We examine the validity of each of these assumptions below.
24BNAA has six regional divisions, located in Burgas, Varna, Plovdiv, Vidin, Ruse and Sofia.
13

Our regressions below indicate that rainfall indeed explains a significant portion of the variationin funds received, with F statistics exceeding 10. Moreover, concerns about omitted unobservablecharacteristics are less salient, since our estimations include a wide range of municipal controls(including the three different proxies of flood risk) and mayor characteristics, along with regionaldummies. More importantly, by construction, our instrumental variable parses out any historicalrainfall effects and exploits essentially random precipitation fluctuations within a narrow two-year period. This particular characteristic of our IV also makes a direct effect of rainfall oncorruption less likely.
14

6 Results
6.1 Main results
Table 1 presents results from running several variants of our estimating equation. In columns(1) and (2), we present “naive” OLS specifications. Column (1) includes controls for geography,economic conditions, and media and civil society, while column (2) also accounts for the politicalcomposition of local government. Although these estimations cannot be interpreted as causal,they serve as a useful benchmark for our IV regressions. The coefficient estimate in column (2)(0.245) suggests that a 10 per cent increase in flood-related assistance (per capita) is associatedwith a 0.023-unit increase in the corruption index, which is around 3 per cent relative to its mean(0.775).
The next three columns show estimates from our IV specifications. All in all, the results provideevidence in favour of Hypothesis 1. Columns (3) and (4) are the IV equivalents of column (1)and (2), respectively. The coefficients on funds per capita are positive and around four timeshigher compared with the OLS estimates, suggesting that omitted variables bias the coefficienton funds received downwards in the latter specification. This could be due to reverse causalityin the OLS estimates: it is possible that the central government opted to give historically morecorrupt municipalities less funding, knowing that a large portion of the aid would be stolen. Sim-ilarly, municipalities with more competent and honest leaders may have received more fundingand experienced less corruption, which would again attenuate the OLS coefficient on funds re-ceived. The first-stage regressions are precisely estimated, with an F-statistic exceeding 10 (Chart5 presents the first-stage relationship graphically). Crucially, the coefficient on funds per capitachanges very little when we also account for whether the municipality’s mayor and/or councilbelong to the ruling coalition (column (4)). The coefficients on the political affiliation variables(not shown) are insignificant, suggesting that the quality of BNAA’s audits did not depend on thepolitical sympathies of the municipality.25 The point estimate in column (4) implies that a 10 percent increase in funds per capita leads to an increase in the corruption index of 0.09 points, or12.2 per cent relative to the sample mean, which is a very strong effect.
In column (5) we relax the linearity assumption on which our previous regressions are based andrun an IV-Poisson specification, which is appropriate since the corruption index takes a value of0 for approximately half of the municipalities in our sample. The coefficient estimate on fundsreceived (shown as a marginal effect) is slightly smaller than that obtained in column (4), thoughit remains strongly significant.
[Table 1]
[Chart 5]25Results are unchanged if we instead look at whether the mayor and/or council are affiliated with MRF, or
whether the municipality is controlled by an opposition party (the latter intended to proxy for swing municipalities).
15
In Table 2 we present results from our first-stage regressions. The table shows that our rainfallmeasure is a strong predictor of the amount of disbursed flood assistance. Relief slope is the onlysignificant ground flood risk proxy, though in unreported results settlements near water becomespositive and significant once the former variable is excluded.
[Table 2]
6.2 Identification threats
One possible critique to our empirical approach is that local governments could have adjustedtheir behaviour in expectation of the audits. Four pieces of evidence suggest that the inspec-tions were largely unforeseen. Although municipal audits were performed by both BNAA andPFIA prior to 2006, they were mostly ad-hoc and never covered a large number of municipalities.Moreover, official correspondence between the government and the two agencies characterisesthe audits as “emergency checks”. In addition, the law stipulates that BNAA’s work must bebased on an annual plan, in which the government can request only a maximum of five additionalaudits, unless there are exceptional events to consider. Finally, as discussed above, newspaperpublications indicate that the central government ordered the municipal audits following exten-sive pressure from the opposition parties as well as the media.
Second, our results could be driven by political biases in the auditing process. For example, swingmunicipalities (those not affiliated with the central government coalition) may be more likely toreceive disaster aid and to be exposed as corrupt. This is less of a concern not only because ourinstrument captures only exogenous variation in the amount of received funds, but also becauseour results change once we include municipal political controls in our regressions. BNAA’s non-partisanship, which we discussed extensively above, also speaks against this scenario.
Even if BNAA’s audits were not politically motivated, a third critique could be that, due to pres-sure from the media and parliament, the agency simply audited more intensely municipalitieswhich received more funds. However, our regressions use per capita flood assistance and controlfor each municipality’s distance to the closest BNAA territorial division (since inspections inmunicipalities located further from the agency’s regional centre may have been less thorough).Controlling additionally for total flood assistance (reported in Table A2) makes no difference tothe results. Furthermore, BNAA guidelines (issued for the specific audits which we examine)specify explicitly that all auditors must follow the same criteria in all municipalities. Althoughauditors were not assigned randomly, they were rotated across municipalities, further alleviatingconcerns that some municipalities were more scrutinised than others. In addition, as we discussedabove, the audits were nearly universal and covered more than 80 per cent of municipalities and96.8 per cent of funds disbursed.26
26Note that even if the audits were indeed random (as in Ferraz and Finan (2008, 2011)) ruling out completely theissue of varying auditor effort is challenging even in this case, since the latter is unobservable.
16

A third possibility is that historically corrupt municipalities may have been less ready for thefloods, since funds earmarked for flood prevention or levee building may have been more likelyto be stolen. Under this scenario, such localities could have received more disaster aid and wouldhave experienced more flood-related corruption. This is less likely to be the case for three rea-sons. First, all of our regressions include different measures of ground flood risk (number ofsettlements within 1 km of a water body, slope and elevation), along with a wide range of mu-nicipal geographic, economic and political characteristics which may also affect flood readiness.Second, the management of water resources deteriorated throughout the country since the early1980s, with riverbed cleaning and the upkeep of levees and other protective equipment neglecteddue to lack of funds.27 Many rivers were also diverted without any control, and the supervisionof water dams was often lax, leading to water volumes frequently being increased over the legallimit. Third, monitoring and containing weather risk has been uniformly poor. Even today, nosystem of early warning exists, and rainfall measuring apparatus, which would have provideddetailed information to generate early flood warnings, are still lacking in most dams.
A final concern relates to the possibly endogenous location of weather stations in our data set.In Table A3 we compare municipalities in which there is at least one weather station with thosewhere we need to interpolate rainfall. On average, both groups of municipalities are similaracross a variety of observable characteristics. At the same time, municipalities with interpolatedrainfall have a stronger media, more unemployment, are less urban and have fewer people with auniversity degree. The table also shows that municipalities in which there is no weather stationare no more corrupt than those in which there is a weather station. This is interesting since thefirst group of municipalities received more flood-related funds per capita, despite experiencingthe same level of rainfall and having fewer settlements near water. This suggests that our interpo-lation procedure should make our first-stage estimates less precise in the pooled sample, meaningthat the point estimates in Table 1 should be treated as lower bounds on the true effect of floodfunds on corruption. This is exactly what we find in Table A5, which replicates the baselinespecification excluding those municipalities in which rainfall is interpolated and shows that thecoefficient on funds received increases.28
27Mediapool.bg at www.mediapool.bg/firmi-na-dps-usvoyavali-zle-parite-za-ukrepvane-sled-starite-poroi-news115354.html.
28We further explore the endogeneity of weather station locations in Table A4, where we exploit the fact that before1989, the number of weather stations was nearly double that of today. We examine to what extent municipalities inwhich weather stations were closed were different from those in which weather stations still exist today. Importantly,the table shows that while municipalities differ on some of the same observables as in Table A3, historical andcontemporary rainfall patterns are very similar for both groups of localities.
17

7 Discussion: robustness and suggestive mechanisms
We experiment with a different coding approach for our dependent variable in Table A2. Incolumn (1), we calculate our corruption index using principal component analysis, which makeslittle difference to the coefficient on funds received. In column (2), our dependent variable isa corruption index calculated using data provided by the Public Financial Inspection Agency(PFIA). As we explained above, this body is not politically independent, so its audit data may beless reliable than the BNAA reports. Indeed, the coefficient on funds received is positive but veryimprecisely estimated, and the first stage is weak. This is what we would expect if the agencywere shielding wrong-doers. In column (3), we account for mayor characteristics (margin withwhich the mayor was elected in the 2003 elections, and a dummy for whether the mayor wasin politics prior to 2003), which has little effect on the results. In column (4), we employ analternative measure of rainfall, using only those months in 2004 and 2005 for which the changein rainfall, relative to the historical average, was at least 50 per cent (in unreported specifications,we also experiment with cut-offs of 20 per cent, 30 per cent, 40 per cent, without difference tothe results). The point estimate is now stronger, implying that a 10 per cent increase in fundsreceived leads to a 0.104-point increase in the corruption index, or 13.4 per cent relative to thesample mean. Finally, our results are robust to including log of total funds along with log fundsper capita (column 5, OLS).
As we discussed in Section 2, the relationship between corruption and re-election in our case isa priori ambiguous. On the one hand, corrupt politicians may be more likely to be re-electedwhen stolen funds are used to buy off influential groups of voters or when the punishment formisbehaviour is weak. Alternatively, as budget size increases, re-election probability may alsoincrease as imperfectly informed voters may find it more difficult to hold politicians accountable.In addition, a larger budget may induce a decline in the average ability of the pool of individualsentering politics, making it more likely for incumbents to be re-elected, despite also experiencingmore corruption (Brollo et al., 2013).
On the other hand, it is also possible that information about local corruption had a negative effecton the electoral performance of incumbent mayors, particularly since the BNAA audit reportswere highly publicised.29 One direct implication of this hypothesis is that highly corrupt mayorswill anticipate such punishment and take themselves out of the re-election race. Moreover, suchan effect is likely to be stronger among incumbents who were elected with smaller margins in theprevious election.
Although lack of longitudinal data and information on how politicians spent the stolen fundsprevents us from distinguishing precisely among these mechanisms, we can nevertheless studyto what extent corruption affected re-election of the incumbent mayor in the 2007 municipalelections in Tables 3 and 4 (using probit specifications). In both tables, we try to purge thecorruption index of endogeneity by constructing its predicted value using the results in Table1.30 Columns (1) and (2) of Table 3 show that mayors from more corrupt municipalities wereless likely to run for re-election, possibly because they anticipated voter punishment at the polls.
29See also Ferraz and Finan (2008).30Results are similar if we simply include sequentially rainfall, funds and corruption in an OLS regression.
18

Columns (3) and (4) demonstrate that corruption is not a significant predictor of mayor re-election(the latter measured as dummy variable), and that mayors who were in politics before 2003 weremore than 70 percentage points more likely to be re-elected.
[Table 3]
In Table 4, we replicate the results in Table 3 on the sub-sample of close elections, which wedefine as those in which the 2003 mayor was elected with a margin of less than 10 per cent.31 Theeffect of corruption on the decision to run for re-election is now stronger: a one-point increasein the BNAA corruption index (holding all other variables constant) makes mayors around 6percentage points less likely to run for re-election. However, columns (3) and (4) show that thosemayors who did decide to run were more likely to be re-elected. One explanation could be thatthese are mayors with less excessive corruption violations who use misappropriated funds to buyoff key voters, although this is admittedly speculative since we lack information on how corruptpoliticians spent what they stole.32
[Table 4]
In Table A6, we further investigate if the effect of flood aid on corruption is conditional onmunicipal characteristics. In columns 1 and 2, we rerun our baseline regression (using column(4) from Table 1) on the subsample of municipalities whose municipal income per capita is belowthe median (column (1)) and above the median (column (2)). In columns (3)-(6) we implementthe same approach for unemployment and per-capita newspaper circulation.
Because we split the sample using endogenous variables, results should be interpreted as highlysuggestive and simply as correlations. Furthermore, one needs to keep in mind that dividing thesample in this way eliminates useful variation and, in several cases, weakens our first-stage IVresults. At the same time, this exercise is informative since it may shed some light on whereexactly the effects identified in our baseline specifications are coming from.
More precisely, the estimates in Table A6 indicate that the negative link between funds and gov-ernance identified earlier is stronger in municipalities which are richer, with less unemployment,and with fewer newspapers. One potential explanation could be that such municipalities maybe less likely to hold governments accountable to spending infringements. Corruption may be-come less salient for voters when the size of the pie is bigger as in Brollo et al. (2013), whileimperfectly informed voters may be less likely to punish dishonest politicians.
Finally, we use additional data from the the Life in Transition Survey (LiTS), a household sur-vey which includes questions on subjects ranging from demographics and income to attitudes
31Unfortunately, smaller cut-offs shrink our sample considerably.32In unreported results, we also investigated whether municipal corruption affected the mayor’s party’s electoral
performance in the 2009 general elections and found no significant effects. Neither did we find that voters with moreeducation or those located in municipalities with a stronger media were more likely to punish corrupt mayors.
19

and perceptions of institutions, to further probe the effects of the natural disaster and associatedtransfers on corruption perceptions. We exploit the fact that the survey was conducted in Bul-garia in late September 2006, shortly after the BNAA and PFIA audit reports were publicisedextensively in the media. The regressions are reported in Table A7 in the online Appendix,33
though results should be interpreted as suggestive only due to the very small number of munic-ipalities covered in the LiTS (37). Using the same instrumentation strategy as in our baselinespecification, we find some evidence that respondents reported higher perceived corruption inmunicipalities which received more flood-related assistance. These results help confirm the va-lidity of our corruption measures from a perception-based perspective. In addition, they suggestthat fraud may result not only in the immediate deflection of public resources but also in lingeringperceptions of heightened local corruption more generally. Moreover, we find no evidence thatpeople living in municipalities which received more flood-related assistance are more trusting of(local or national) institutions. Even if politicians distributed at least some of the proceeds tothose affected by the floods or to key groups of voters, this does not seem to have led to a moresatisfied electorate.
33This table also includes two additional robustness checks (described in more detail in the online Appendix).
20

8 Conclusion
In this paper, we exploit a unique corruption-related policy outcome – transfers from Bulgaria’scentral government to municipalities intended to aid reconstruction following torrential rain in2004 and 2005. We leverage exogenous variation in allocated funds to demonstrate that un-expected windfalls were not merely allocated to more corrupt places, but rather that increaseddisaster aid led to more corrupt spending by local governments.
Our analysis has three additional strengths. First, we utilise publicly available audit data on howthe transfers were spent by municipalities to build an objective measure of corruption. Second,we control for several proxies for ground flood risk (distance to water body, elevation and slope)and show that flood prevention was neglected throughout the country even before the fall ofcommunism in 1989. Third, we include a wide range of observable municipal characteristics,such as unemployment, media and political affiliation of the different layers of government.
Our results suggest that potentially welfare-enhancing transfers such as disaster relief or aid frominternational organisations may unintentionally deteriorate governance in weak democracies. Al-though our analysis is focused on a single country and covers a relatively narrow time period, webelieve that our findings are relevant for a much broader set of developing and transition countriesin which financial windfalls, whether derived from natural resources or not, are particularly high.Many countries, Bulgaria included, re-distribute public funds, such as foreign aid or budgetarytransfers, to the local level. Our findings imply that continuing such transfers without strength-ening mechanisms of control, such as the judiciary, can create and deepen tendencies to engagein fraud. We also highlight the value of creating independent budgetary watchdogs. Agency con-trol matters, and can generate the kind of transparency that constitutes a necessary condition forpublic control over local politicians.
21

References
F. Z. Ahmed (2013), “Remittances deteriorate governance”, Review of Economics and Statistics,95(4), 1166–1182.
M. M. Bechtel and J. Hainmueller (2011), “How lasting is voter gratitude? An analysis of theshort- and long-term electoral returns to beneficial policy”, American Journal of Political Sci-ence, 55(4), 852–868.
M. Bertrand, S. Djankov, R. Hanna, and S. Mullainathan (2007), “Obtaining a driver’s licensein India: an experimental approach to studying corruption”, Quarterly Journal of Economics,1639–1676.
F. Brollo and T. Nannicini (2012), “Tying your enemy’s hands in close races: The politics offederal transfers in Brazil”, American Political Science Review, 106(04), 742–761.
F. Brollo, T. Nannicini, R. Perotti, and G. Tabellini (2013), “The political resource curse”, Amer-ican Economic Review, 103(5), 1759–1796.
F. Caselli and G. Michaels (2013), “Do oil windfalls improve living standards? Evidence fromBrazil”, American Economic Journal: Applied Economics, 5(1), 208–238.
A. De La O (2013), “Do conditional cash transfers affect electoral behavior? Evidence from arandomized experiment in Mexico”, American Journal of Political Science, 57(1), 1–14.
M. Dell, B. F. Jones, and B. A. Olken (2014), “What do we learn from the weather? The newclimate-economy literature”, Journal of Economic Literature, 52(3), 740–98.
T. Dunning (2008), Crude Democracy: Natural Resource Wealth and Political Regimes, Cam-bridge University Press.
C. Ferraz and F. Finan (2008), “Exposing corrupt politicians: The effects of Brazil’s publiclyreleased audits on electoral outcomes”, Quarterly Journal of Economics, 123(2), 703–745.
C. Ferraz and F. Finan (2011), “Electoral accountability and corruption: Evidence from the auditsof local governments”, American Economic Review, 101, 1274–1311.
M. G. Findley, D. L. Nielson, and J. C. Sharman (Forthcoming), “Causes of non-compliance withinternational law: Evidence from a field experiment on anonymous incorporation”, AmericanJournal of Political Science.
R. Fisman and E. Miguel (2007), “Corruption, norms, and legal enforcement: Evidence fromdiplomatic parking tickets”, Journal of Political Economy, 115(6), 1020–1048.
C. Gervasoni (2010), “A rentier theory of subnational regimes: Fiscal federalism, democracy, andauthoritarianism in the Argentine provinces”, World Politics, 62(02), 302–340.
R. Guiteras and A. M. Mobarak (2014), “Does development aid undermine political account-ability? Leader and constituent responses to a large-scale intervention”, Working paper, YaleUniversity.
22

S. Haber and V. Menaldo (2011), “Do natural resources fuel authoritarianism? A reappraisal ofthe resource curse”, American Political Science Review, 105(01), 1–26.
N. Jensen and L. Wantchekon (2004), “Resource wealth and political regimes in Africa”, Com-parative Political Studies, 37(7), 816–841.
M. Klasnja and J. A. Tucker (2013), “The economy, corruption, and the vote: Evidence fromexperiments in Sweden and Moldova”, Electoral Studies, 32(3), 536–543.
M. Klasnja, J. A. Tucker, and K. Deegan-Krause (2012), “Pocketbook vs. sociotropic corruptionvoting”, British Journal of Political Science, 1–28.
E. Koleva and R. Peneva (1990), “Klimatichen spravochnik (valeji v Bulgaria) - in Bulgarian”,Bulgarian Academy of Sciences, Sofia.
Y. Lazarev, A. Sobolev, I. Soboleva, and B. Sokolov (Forthcoming), “Trial by fire: a naturaldisaster’s impact on support for the authorities in rural Russia”, World Politics.
P. T. Leeson and R. S. Sobel (2008), “Weathering corruption”, Journal of Law and Economics,51(4), 667–681.
S. Litschig and K. M. Morrison (2013), “The impact of intergovernmental transfers on educationoutcomes and poverty reduction”, American Economic Journal: Applied Economics, 5(4),206–240.
M. Manacorda, E. Miguel, and A. Vigorito (2011), “Government transfers and political support”,American Economic Journal: Applied Economics, 3(3), 1–28.
M. Mironov and E. Zhuravskaya (2014), “Corruption in procurement: Evidence from financialtransactions data”, Unpublished working paper. Social Science Research Network.
J. Monteiro and C. Ferraz (2010), “Does oil make leaders unaccountable? Evidence from Brazil’soffshore oil boom”, Working paper, PUC-Rio.
E. Nikolova (Forthcoming), “Destined for democracy? Labor markets and political change incolonial British America”, British Journal of Political Science.
B. A. Olken (2009), “Corruption perceptions vs. corruption reality”, Journal of Public Eco-nomics, 93(7), 950–964.
C. Pop-Eleches and G. Pop-Eleches (2012), “Targeted government spending and political prefer-ences”, Quarterly Journal of Political Science, 7(3), 285–320.
A. Quiroz Flores and A. Smith (2013), “Leader survival and natural disasters”, British Journal ofPolitical Science, 43(04), 821–843.
K. W. Ramsay (2011), “Revisiting the resource curse: Natural disasters, the price of oil, anddemocracy”, International Organization, 65(03), 507–529.
R. Reinikka and J. Svensson (2005), “Fighting corruption to improve schooling: Evidence froma newspaper campaign in Uganda”, Journal of the European Economic Association, 3(2-3),259–267.
23
M. L. Ross (2001), “Does oil hinder democracy?”, World Politics, 53(03), 325–361.
G. Soos, G. Toka, and G. Wright (2002), The State of Local Democracy in Central Europe, LocalGovernment and Public Service Reform Initiative, Open Society Institute.
D. Treisman (2007), “What have we learned about the causes of corruption from ten years ofcross-national empirical research?”, Annual Review of Political Science, 10, 211–244.
UNDP (2002), “Bulgaria human development index: Municipalities in the context of districts”,United Nations Development Program, Sofia.
P. C. Vicente (2010), “Does oil corrupt? Evidence from a natural experiment in west Africa”,Journal of Development Economics, 92(1), 28–38.
24

Chart 1: Geographical distribution of flood funds (per capita)
Source: Bulgarian National Audit Agency
25

Chart 2: Geographical distribution of infringements
Source: Bulgarian National Audit Agency
26

Chart 3: Geographical distribution of infringements
Source: Public Financial Inspection Agency
27
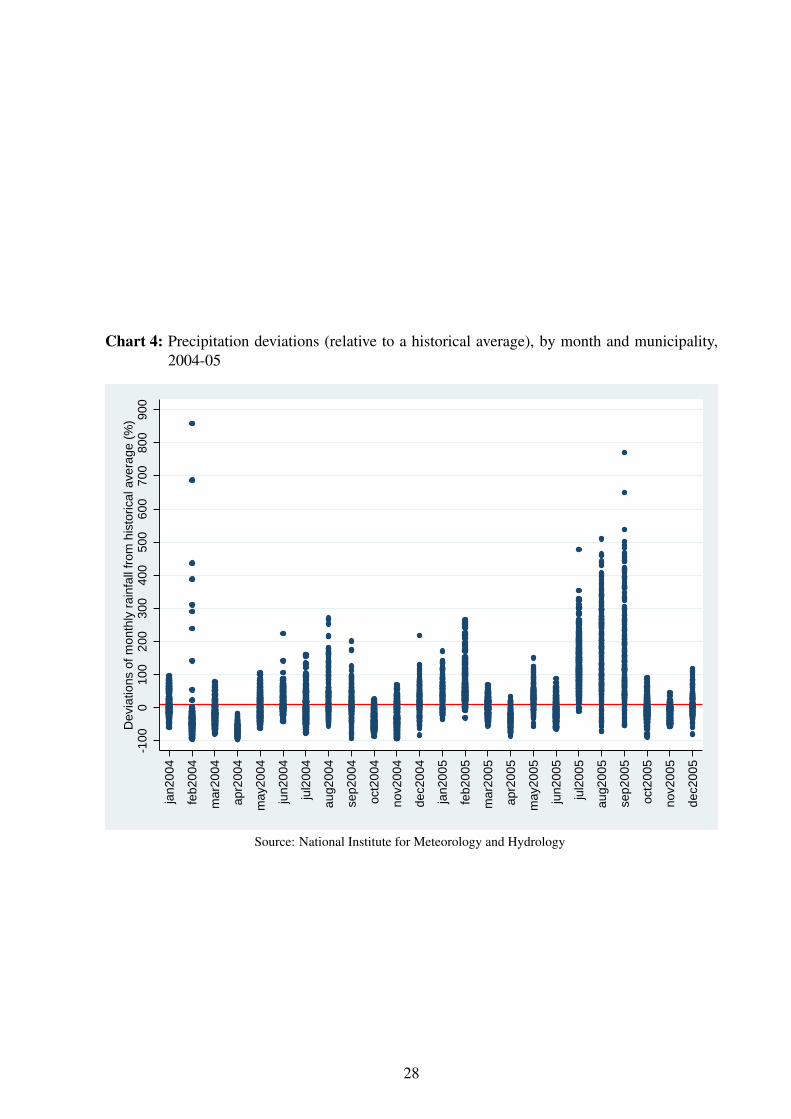
Chart 4: Precipitation deviations (relative to a historical average), by month and municipality,2004-05
-100
010
020
030
040
050
060
070
080
090
0D
evia
tions
of m
onth
ly r
ainf
all f
rom
his
toric
al a
vera
ge (
%)
jan2
004
feb2
004
mar
2004
apr2
004
may
2004
jun2
004
jul2
004
aug2
004
sep2
004
oct2
004
nov2
004
dec2
004
jan2
005
feb2
005
mar
2005
apr2
005
may
2005
jun2
005
jul2
005
aug2
005
sep2
005
oct2
005
nov2
005
dec2
005
Source: National Institute for Meteorology and Hydrology
28

Chart 5: Baseline specification: relationship between Rainfall and Funds in the first stage
Nesebar
Rila
BelogradchikBoboshevo
Pomorie
Kyustendil
Bobovdol
Blagoevgrad
Kaynardzha
Topolovgrad
Plovdiv
Ruen
Kazanlak
Dimitrovgrad
Gotse Delchev
ProvadiaNevestino
Pirdop
Zlatograd
Kardzhali
Tutrakan
Dolna Mitropolia
Stara ZagoraSatovcha
Lovech
Pleven
TranBurgas
Kocherinovo
Pavel Banya
KozloduyTroyanDolni DabnikAytos
Vetrino
KnezhaPernik
Chuprene
Slivnitsa
Dolni Chiflik
ZemenTryavna
Koprivshtitsa
Dobrich - town
Garmen
Kubrat
Hadzhidimovo
Oryahovo
Sungurlare
Cherven Bryag
KirkovoSimitli
Devnya
Alfatar
Brezovo
Lukovit
Dzhebel
Chirpan
Kovachevtsi
KostinbrodTvarditsa
Radomir
Dragoman
Dalgopol
BreznikVenets
ZavetHisarya
Letnitsa
Varna
Beloslav
MaglizhGeorgi Damyanovo
Rudozem
Montana
Zlataritsa
StamboliyskiGurkovoKaspichan
Razgrad
Silistra
Dobrich
Byala Varna
Lyaskovets
AntonRuse
Smyadovo
Valchi Dol
Dulovo
Godech
Suvorovo
Elena
Ardino
Nikola KozlevoBanskoNedelino
TervelPeshtera
Bozhurishte
Avren
Slivo Pole
Kaolinovo
Krushari
Ugarchin
Madzharovo
Veliko Tarnovo
MadanApriltsiSamuil
Tsar Kaloyan
Gramada
ChernoocheneBratsigovo
Novi Pazar
Dve Mogili
Vetovo
Smolyan
SvogeBanite
Nikolaevo
SeptemvriKresnaLevskiLoznitsa
AsenovgradBratya Daskalovi
Devin
Krumovgrad
General ToshevoDupnitsa
Momchilgrad
ChiprovtsiBelitsa
ElhovoVeliki Preslav
Rakitovo
Sitovo
Isperih
Razlog
Aksakovo
Kameno
GlavinitsaStolichna
Strazhitsa
Sliven
Velingrad
Yakimovo
Straldzha
Varbitsa
Balchik
Radnevo
Vratsa
Zlatitsa
Antonovo
YambolBoychinovtsi
Galabovo
Treklyano
Hitrino
Karnobat
Borovo
PopovoNikopol
Stambolovo
Perushtitsa
Lom
Chepelare
Dospat
Borino
Pazardzhik
Strumyani
Sozopol
Lesichovo
Chavdar
Krivodol
Saedinenie
Kotel
Ivanovo
Chelopech
Simeonovgrad
Tsenovo
Sevlievo
LakiYakoruda
Mezdra
Kavarna
Gabrovo
Omurtag
Byala Ruse
Sredets
Nova Zagora
Mirkovo
Opaka
Karlovo
BatakBerkovitsaDolna BanyaShumen
Vidin
HayredinPrimorsko
Belovo
Ihtiman
Strelcha
Panagyurishte
Tundzha
Gorna Malina
Teteven
Bolyarovo
Samokov
Etropole
Malko Tarnovo
Elin Pelin
Targovishte
Svishtov
Petrich
Kostenets
Sandanski
Roman
Tsarevo
Botevgrad
Pavlikeni
Pravets
Shabla
Belene
-2-1
01
2lo
g fu
nds
per
capi
ta
-.4 -.2 0 .2 .4 .6rainfall % deviation, 10% cut-off
coef = 1.1792315, (robust) se = .36970197, t = 3.19
29

Table 1: Baseline specification
OLS IV IV-Poisson
(1) (2) (3) (4) (5)BNAA BNAA BNAA BNAA BNAA
Log funds per cap 0.257∗∗∗ 0.245∗∗∗ 0.975∗∗ 0.991∗∗ 0.701∗∗∗
(0.0899) (0.0889) (0.398) (0.388) (0.230)
Geography X X X X X
Economic conditions X X X X X
Civil society X X X X X
Composition of local gov. X X X
F-stat. 9.352 10.17Rainfall % deviation, 10% cutoff 1.149∗∗∗ 1.179∗∗∗
(0.376) (0.370)Number of observations 225 225 225 225 225
Notes: Regional dummies included in all specifications. Robust standard errors are in parentheses. Significance levels: *p < 0.1, ** p < 0.05, *** p < 0.01.
30

Table 2: Baseline specification: first-stage results
(1) (2) (3)Log funds per cap Log funds per cap Log funds per cap
Rainfall % deviation, 10% cut-off 1.149∗∗∗ 1.179∗∗∗ 1.166∗∗∗
(0.376) (0.370) (0.380)
Distance to BNAA regional center −0.00327∗ −0.00338∗ −0.00325∗
(0.00188) (0.00193) (0.00192)
Elevation 0.000208 0.000293 0.000207(0.000364) (0.000366) (0.000367)
Relief slope 0.0476∗∗ 0.0416∗ 0.0472∗∗
(0.0220) (0.0228) (0.0220)
Longitude 0.144 0.154 0.154(0.187) (0.192) (0.190)
Latitude 0.136 0.171∗ 0.127(0.0898) (0.0924) (0.0929)
Settlements near water 0.00237 0.00470 0.00239(0.00664) (0.00675) (0.00673)
Log municipal income per capita 0.738∗∗∗ 0.774∗∗∗ 0.748∗∗∗
(0.236) (0.239) (0.239)
Unemployment 0.00273 0.00338 0.00203(0.00777) (0.00775) (0.00801)
Net privatisation income 0.00475 0.00529 0.00464(0.00572) (0.00560) (0.00591)
Newspaper circ. per capita 0.000272 0.000185 0.000290(0.000246) (0.000234) (0.000254)
Share university degree −12.26∗∗∗ −12.99∗∗∗ −12.23∗∗∗
(1.795) (1.882) (1.797)
Share urban population −0.272 −0.269 −0.261(0.292) (0.286) (0.297)
Voter turnout 2003 −0.0746∗∗ −0.0656∗ −0.0739∗∗
(0.0348) (0.0346) (0.0353)
Mayor triple coal. −0.142(0.157)
Council majority triple coal. −0.147(0.225)
Mayor & council triple coal. −0.00324(0.259)
Mayor MRF 0.0907(0.155)
Council majority MRF 0.00162(0.300)
Mayor & council MRF −0.0226(0.348)
Region dummies X X X
Number of observations 225 225 225
Notes: Regional dummies included in all specifications. Robust standard errors are in parentheses.Significance levels: * p < 0.1, ** p < 0.05, *** p < 0.01.
31
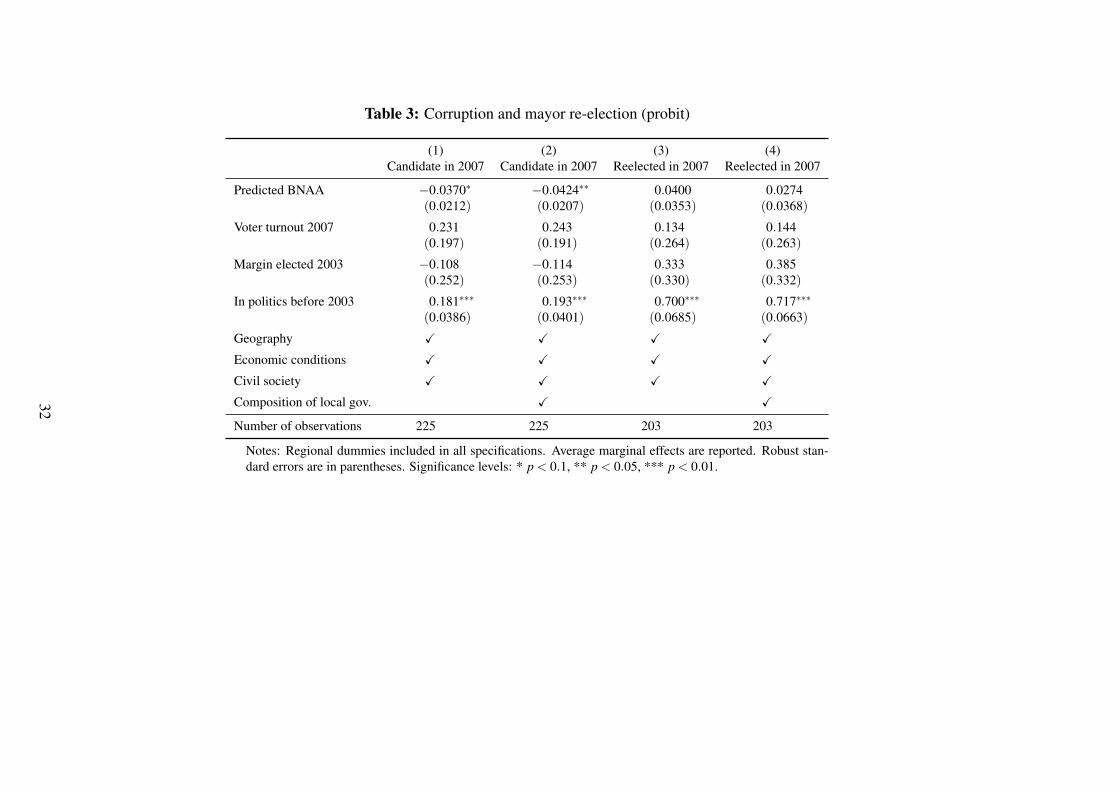
Table 3: Corruption and mayor re-election (probit)
(1) (2) (3) (4)Candidate in 2007 Candidate in 2007 Reelected in 2007 Reelected in 2007
Predicted BNAA −0.0370∗ −0.0424∗∗ 0.0400 0.0274(0.0212) (0.0207) (0.0353) (0.0368)
Voter turnout 2007 0.231 0.243 0.134 0.144(0.197) (0.191) (0.264) (0.263)
Margin elected 2003 −0.108 −0.114 0.333 0.385(0.252) (0.253) (0.330) (0.332)
In politics before 2003 0.181∗∗∗ 0.193∗∗∗ 0.700∗∗∗ 0.717∗∗∗
(0.0386) (0.0401) (0.0685) (0.0663)
Geography X X X X
Economic conditions X X X X
Civil society X X X X
Composition of local gov. X X
Number of observations 225 225 203 203
Notes: Regional dummies included in all specifications. Average marginal effects are reported. Robust stan-dard errors are in parentheses. Significance levels: * p < 0.1, ** p < 0.05, *** p < 0.01.
32

Table 4: Corruption and mayor re-election: close elections (probit)
(1) (2) (3) (4)Candidate in 2007 Candidate in 2007 Reelected in 2007 Reelected in 2007
Predicted BNAA −0.0621∗∗∗ −0.0560∗∗∗ 0.116∗∗∗ 0.115∗∗
(0.0210) (0.0158) (0.0366) (0.0465)
Voter turnout 2007 0.618∗∗ 0.641∗∗∗ 0.252 0.225(0.257) (0.242) (0.284) (0.283)
Margin elected 2003 −0.967∗ −0.920∗ 1.664∗ 1.977∗∗
(0.580) (0.549) (0.962) (0.943)
In politics before 2003 0.208∗∗∗ 0.221∗∗∗ 0.701∗∗∗ 0.713∗∗∗
(0.0404) (0.0386) (0.0725) (0.0752)
Geography X X X X
Economic conditions X X X X
Civil society X X X X
Composition of local gov. X X
Number of observations 162 162 145 145
Notes: Regional dummies included in all specifications. Average marginal effects are reported. Robust stan-dard errors are in parentheses. Significance levels: * p < 0.1, ** p < 0.05, *** p < 0.01.
33
ONLINE APPENDIX: NOT FOR PUBLICATION
A Political background and distribution of flood-related funds
Bulgaria is a parliamentary republic, whose central government is usually run by coalitions (byvirtue of its closed-list proportional system). Until August 2005, flood-relief funds were man-aged by the Ministry for Agriculture and Forestry and a floating ministry (“without portfolio”)controlled by the Movement for Rights and Freedoms (MRF), a party whose electorate comprisesmainly Bulgarian Turks. From 2001 to 2005, MRF was part of a ruling coalition led by NationalMovement Simeon II (NDSV, the party run by Bulgaria’s former king, Simeon Sakskoburgotski)which also included the Bulgarian Socialist Party (BSP). Following the 2005 general elections, a“triple” coalition government comprising the same partners but led by the Socialists was formed.In addition to the Ministry for Agriculture and Forestry, MRF also gained control of the Ministryfor Environment and Water as well as of a newly formed Ministry for Disasters. All of the latterministries played a central role in the control and management of flood-related aid disbursed fromcentral government to municipalities.
At the local level, municipal finances are controlled by an elected council (holding the highestauthority) which operates along an elected mayor. There are no term limits for either the mayor orthe councillors, and local elections, conducted every four years, are usually held two years beforegeneral elections (local governments dealing with the 2004-05 floods were elected in 2003) (Sooset al., 2002).
B Additional robustness checks
We further probe the robustness of our results in Table A7. To conserve space, we only presentthe inclusive version of the model, that is column (4) in Table 1. In Table 1, we did not findevidence that the positive relationship between funds received and corruption can be explainedby whether the local government is affiliated with the triple coalition or with MRF. To probe thisfurther, in column (1) of Table A7 we include a triple interaction between local newspapers percapita, and dummies for whether the mayor and the council are affiliated with the triple coalition.The coefficient on log funds per capita remains unchanged from that in Table 1, but there issome evidence that mayors belonging to the triple coalition stole more in municipalities with astronger media. In addition, municipalities in which the majority of the council was controlledby the ruling coalition were more likely to be corrupt, while higher newspaper circulation isassociated with less corruption.34 In column (2), we control for a municipality’s distance to one
34Unreported coefficients for column (1): newspapers circ. per capita: -0.000873**; mayor triple coal. -0.0870;council majority triple coal: 0.786**; mayor& council triple coal: -0.735. In unreported results, we instead includedcontrols for whether the local government is affiliated with MRF (rather than the broader triple coalition), along withits interaction with newspapers. We obtained very similar results.
34

of the nearest 28 province (also called oblast) centres, which is at the NUTS-3 level, with littlechange to the results.
In columns (3) and (4), we exploit the fact that, for a small number of municipalities, we alsohave information on corruption perceptions from a household survey conducted by the EBRD andthe World Bank in late September 2006 (the Life in Transition Survey), shortly after the BNAAand PFIA audit reports were publicized extensively in the media. LiTS respondents (in Bulgariaand in the rest of the transition region, excluding Turkmenistan) were drawn randomly, using atwo-stage sampling method with primary and secondary sampling units. Secondary SamplingUnits are households, while Primary Sampling Units (for the case of Bulgaria) are electoraldistricts.35 We match each of the 50 PSUs to their respective municipality and obtain 37 uniquemunicipalities. Our dependent variable is a corruption index which sums positive answers fromthe following question: “In your opinion, how often is it necessary for people like you to have tomake unofficial payments/gifts in these situations?” (including eight options, such as “Interactwith the road police,” or “Request unemployment benefits” with answer options 1 (never) to 5(always)).
Although this exercise is informative, results should be interpreted as suggestive only due to thesmall number of municipalities covered in the LiTS. Moreover, our dependent variable in thiscase captures corruption perceptions. Even with these caveats in mind, column (3) shows thatthe positive coefficient on funds received still survives, although it is smaller and less preciselyestimated.36
Even though our analysis thus far has shown that more money was stolen in municipalities whichreceived more funds, as we discussed in Section 2 politicians may have also distributed at leastsome of the proceeds to those affected by the floods, or to key groups of voters in order tomaximise re-election chances. As a result, municipalities with more disbursed funds may alsohave a more satisfied electorate. However, column (4) suggests that this is not the case: peopleliving in municipalities which received more flood-related assistance are no more trusting of(local and national) institutions.
[Table A7]
35Further details on the Life in Transition Survey, and the full data set, can be accessed at www.ebrd.com/what-we-do/economic-research-and-data/data/lits.html .
36We use the 50 per cent rainfall cut-off in the LiTS specifications as otherwise our first-stage estimates are weak.
35

C Additional charts and tables
Chart A1: Histogram of BNAA corruption index
020
4060
8010
012
0F
requ
ency
0 1 2 3 4 5BNAA
Source: Bulgarian National Audit Agency
36

Table A1: Comparison between audited and non-audited municipalities
Mean t-stat
Audited by BNAA Not Audited by BNAA
BNAA 0.775Funds per capita 43.396 10.022 3.533∗∗∗
Rainfall % deviation, 10% cutoff 0.820 0.901 −2.288∗∗
Rainfall % deviation, 50% cutoff 1.393 1.446 −0.773Historical rainfall, mm 670.608 645.630 1.627GeographyDistance to BNAA regional centre 72.110 72.050 0.010Elevation 505.593 248.838 3.905∗∗∗
Relief slope 7.534 4.380 3.905∗∗∗
Longitude 42.765 42.931 −1.291Latitude 25.198 24.407 2.893∗∗∗
Settlements near water 7.177 4.973 1.478Economic conditionsMunicipal income per capita 244.627 235.590 0.739Unemployment 19.946 25.294 −3.128∗∗∗
Net privatisation income 4.384 2.644 1.287Civil societyNewspaper circ. per capita 139.237 205.978 −1.518Share university degree 0.069 0.062 0.945Share urban population 0.467 0.336 2.675∗∗∗
Voter turnout 2003 0.569 0.477 0.448Composition of local gov.Mayor triple coal. 0.674 0.757 −1.003Council majority triple coal. 0.432 0.541 −1.233Mayor&council triple coal. 0.348 0.432 −0.990Mayor MRF 0.163 0.027 2.196∗∗
Council majority MRF 0.119 0.027 1.686∗
Mayor&council MRF 0.106 0.027 1.517Mayor characteristicsMargin elected 2003 0.078 0.066 1.020In politics before 2003 0.712 0.703 0.120
Total observations 227 37
Notes: The table compares municipalities which were audited by BNAA with those which were notaudited by BNAA. Significance levels: * p < 0.1, ** p < 0.05, *** p < 0.01.
37

Table A2: Public funds and corruption: robustness 1
IV OLS
(1) (2) (3) (4) (5)BNAA through pca PFIA BNAA BNAA BNAA
Log funds per cap 0.863∗∗ 4.137 0.949∗∗ 1.093∗∗ 0.257∗
(0.409) (2.940) (0.377) (0.502) (0.149)
Margin elected 2003 −1.844∗
(1.059)
In politics before 2003 −0.00753(0.187)
Log funds −0.0140(0.124)
Geography X X X X X
Economic conditions X X X X X
Civil society X X X X X
Composition of local gov. X X X X X
F-stat. 10.18 3.803 10.74 10.17Rainfall % deviation, 10% cutoff 1.179∗∗∗ 0.708∗∗ 1.208∗∗∗
(0.370) (0.363) (0.369)Rainfall % deviation, 50% cutoff 0.511∗∗∗
(0.160)Number of observations 225 254 225 225 225
Notes: Regional dummies are included in all specifications. Robust standard errors are in parentheses. Significancelevels: * p < 0.1, ** p < 0.05, *** p < 0.01.
38

Table A3: Comparison between municipalities with and without weather stations
Mean t-stat
Interpolation No interpolation
BNAA 0.691 0.909 −1.543Funds per capita 44.084 29.174 2.151∗∗
Rainfall % deviation, 10% cutoff 0.817 0.857 −1.539Rainfall % deviation, 50% cutoff 1.386 1.427 −0.816Historical rainfall, mm 670.666 660.776 0.887GeographyDistance to BNAA regional centre 70.868 74.295 −0.792Elevation 466.542 474.653 −0.166Relief slope 7.110 7.054 0.093Longitude 42.793 42.778 0.159Latitude 24.997 25.248 −1.249Settlements near water 5.381 9.495 −3.904∗∗∗
Economic conditionsMunicipal income per capita 247.016 237.002 1.145Unemployment 21.866 18.635 2.596∗∗∗
Net privatisation income 4.170 4.087 0.085Civil societyNewspaper circ. per capita 192.707 70.110 3.951∗∗∗
Share university degree 0.055 0.091 −8.045∗∗∗
Share urban population 0.380 0.572 −5.625∗∗∗
Voter turnout 2003 0.629 0.426 1.372Composition of local gov.Mayor triple coal. 0.710 0.642 1.140Council majority triple coal. 0.462 0.421 0.633Mayor&council triple coal. 0.391 0.305 1.385Mayor MRF 0.160 0.116 0.975Council majority MRF 0.124 0.074 1.280Mayor&council MRF 0.112 0.063 1.312Mayor characteristicsMargin elected 2003 0.077 0.075 0.317In politics before 2003 0.720 0.695 0.437
Total observations 169 95
Notes: The table compares municipalities with and without weather stations. Signifi-cance levels: * p < 0.1, ** p < 0.05, *** p < 0.01.
39

Table A4: Endogeneity of weather stations
Mean t-stat
Closed after 89 Exists today
BNAA 0.686 0.926 −1.435Funds per capita 39.093 30.309 1.499Rainfall % deviation, 10% cutoff 0.820 0.863 −1.392Rainfall % deviation, 50% cutoff 1.396 1.449 −0.869Historical rainfall, mm 672.231 662.141 0.759GeographyDistance to BNAA regional centre 71.106 74.731 −0.733Elevation 476.988 488.713 −0.209Relief slope 7.427 7.250 0.250Longitude 42.886 42.759 1.189Latitude 24.896 25.177 −1.213Settlements near water 5.860 9.505 −2.764∗∗∗
Economic conditionsMunicipal income per capita 230.796 236.764 −0.776Unemployment 21.990 18.310 2.747∗∗∗
Net privatisation income 4.094 3.939 0.139Civil societyNewspaper circ. per capita 166.450 74.465 2.836∗∗∗
Share university degree 0.060 0.089 −5.290∗∗∗
Share urban population 0.414 0.574 −4.511∗∗∗
Voter turnout 2003 0.751 0.430 1.603Composition of local gov.Mayor triple coal. 0.674 0.644 0.441Council majority triple coal. 0.477 0.426 0.696Mayor&council triple coal. 0.395 0.307 1.264Mayor MRF 0.140 0.119 0.420Council majority MRF 0.128 0.079 1.096Mayor&council MRF 0.105 0.069 0.858Mayor characteristicsMargin elected 2003 0.071 0.079 −0.808In politics before 2003 0.729 0.683 0.686
Total observations 86 101
Notes: The table compares municipalities in which there was a weather station before1989 (which no longer exists) with those in which there was a station both before andafter 1989. Significance levels: * p < 0.1, ** p < 0.05, *** p < 0.01.
40

Table A5: Public funds and corruption: excluding municipalities in which rainfall is interpolated
OLS IV IV-Poisson
(1) (2) (3) (4) (5)BNAA BNAA BNAA BNAA BNAA
Log funds per cap 0.435∗∗∗ 0.453∗∗∗ 1.016∗∗ 1.139∗∗ 0.746∗∗
(0.162) (0.169) (0.468) (0.515) (0.297)
Geography X X X X X
Economic conditions X X X X X
Civil society X X X X X
Composition of local gov. X X X
F-stat. 12.26 11.64Rainfall % deviation, 10% cutoff 1.236∗∗∗ 1.291∗∗∗
(0.353) (0.378)Number of observations 88 88 88 88 88
Notes: Regional dummies are included in all specifications. Robust standard errors are in parentheses. Last columnreports marginal effects from an IV-Poisson regression. Significance levels: * p < 0.1, ** p < 0.05, *** p < 0.01.
41

Table A6: Public funds and corruption: heterogeneous effects
Muncipal income per cap Unemployment Newspapers circ.
< median >= median < median >= median < median >= median(1) (2) (3) (4) (5) (6)
BNAA BNAA BNAA BNAA BNAA BNAA
Log funds per cap 0.479 0.877∗∗∗ 1.322∗∗ 0.106 1.150∗∗ −0.204(0.624) (0.334) (0.653) (0.257) (0.484) (0.418)
Geography X X X X X X
Economic conditions X X X X X X
Civil society X X X X X X
Composition of local gov. X X X X X X
F-stat. 3.064 8.795 4.538 5.696 8.281 3.508Rainfall % deviation, 10% cutoff 0.902∗ 1.675∗∗∗ 0.890∗∗ 1.673∗∗ 1.618∗∗∗ 0.923∗
(0.515) (0.565) (0.418) (0.701) (0.562) (0.493)Number of observations 113 112 117 108 118 107
Notes: Regional dummies are included in all specifications. Robust standard errors are in parentheses. Significance levels: *p < 0.1, ** p < 0.05, *** p < 0.01.
42

Table A7: Public funds and corruption: robustness 2
LiTS
(1) (2) (3) (4)BNAA BNAA Frequency of unofficial payments Trust in institutions
Log funds per cap 1.052∗∗∗ 0.915∗∗ 0.481∗ 0.455(0.395) (0.370) (0.246) (0.281)
Newspapers per cap. * mayor triple coal. 0.00182∗
(0.00104)
Newspapers per cap. * council majority triple coal. −0.00394(0.00246)
Newspapers per cap. * mayor & council triple coal. 0.00236(0.00269)
Distance to province centre 0.00488(0.00409)
Respondent characteristics X X
Geography X X X X
Economic conditions X X X X
Civil society X X X X
Composition of local gov. X X X X
F-stat. 9.673 10.32 40.61 43.39Rainfall % deviation, 10% cutoff 1.174∗∗∗ 1.202∗∗∗ 0.871∗∗∗ 0.893∗∗∗
(0.378) (0.374) (0.137) (0.136)Rainfall % deviation, 50% cutoff
Number of observations 225 225 945 924
Notes: Regional dummies included in all specifications (except last two columns). Robust standard errors are in parentheses. Significance levels: *p < 0.1, ** p < 0.05, *** p < 0.01.
43

D Data information
Dependent variable
Corruption Index (from the BNAA audit report data). Sums dummies for the spending violationscommitted by each municipality in 2004 and 2005. BNAA groups the infractions in the followingcategories:
1. Infringements related to following the procedures and laws for public procurement
– no public procurement procedure (number of municipalities in which recorded: 38)
– no provision for guarantees, no control procedures or building control (number ofmunicipalities in which recorded: 11)
– not following the system of double signature (both the mayor and chief accountantneed to approve contracts) (number of municipalities in which recorded: 10).
2. Infringements related to fund use and reporting:
– payment for activities not listed in the contract (number of municipalities in whichrecorded: 1)
– final payment prior to issuing documents certifying that the work has been completed(number of municipalities in which recorded: 6)
– using the funds for unauthorised works (number of municipalities in which recorded:3)
– not returning on time funds that have not been used (number of municipalities inwhich recorded: 7)
– the value of the building and repair activities exceeds the funds disbursed by theCommission (number of municipalities in which recorded: 2)
– no control procedures related to using the funds from the Commission (number ofmunicipalities in which recorded: 8)
– no building control; payment without works completed; pre-payment of building andrepair activities (number of municipalities in which recorded: 7).
3. Infringements related to reporting how funds were used and preparing reports for each ofthe repaired objects:
– no files were prepared and sent to the Commission and the Ministry of Finance abouthow the funds were used or returned (if not used); or these files were incomplete(number of municipalities in which recorded: 28)
– three-month reports to the Commission and the Ministry of Finance were not sent; orwere not complete; or were not sent to the oblast governor (number of municipalitiesin which recorded: 31).
44

4. Infringements related to following the municipal procedures in relation to the laws aboutreporting the incurred expenses:
– no system for financial management and control exists; infringements related to thissystem; no financial controller used (number of municipalities in which recorded: 12)
– inaccurate accounting recording of the funds (number of municipalities in whichrecorded: 12).
Independent variables
Log funds per capita. Total funds received (in 2004 and 2005) is from the BNAA audit reports.Population is from the 2001 census.
Rainfall. Monthly rainfall (in mm) for all 101 weather stations for 2004 and 2005 from theNational Institute for Meteorology and Hydrology. The interpolated value for each municipalityis the inverse distance weighted average of all values measured in stations within a 45 km radiusfrom the centroid of the municipality. Monthly historical rainfall values are from Koleva andPeneva (1990). See text on how the rainfall variable used in the regressions is calculated.
Ground flood risk. Number of settlements within 1 km of a water body (river, lake or dam;from GIS); elevation (in metres; from National Statistical Institute), slope (from the NationalStatistical Institute).
Geography. Latitude, longitude (both from NSI) and distance to a BNAA regional centre (calcu-lated by authors and using data from BNAA).
Economic conditions. Log municipal income per capita (in 2000; from UNDP (2002)); un-employment (in 2003, from NSI); net privatisation income (in 2003, from NSI).
Media and civil society. Local newspaper circulation per capita (in 2004; only available at theoblast level from NSI); share of population with university degree (2003; from NSI); share ofurban population (2003; from NSI); voter turnout (voter turnout at the 2003 local elections fromthe Central Electoral Commission).
Composition of local government and re-election. Political affiliation of the mayor and coun-cil are from 2003 election data from the Central Electoral Commission. Re-election is from 2007data from the Central Electoral Commission. One caveat to interpreting the political affiliationdata is that some mayors either switched parties after the 2003 elections (mostly from a relativelysmall party to one of the large parties) or, while independent on paper, were actually supported bya political party. In the former case, we have coded the mayor’s most recent political affiliation,while in the latter case, being endorsed by a party was taken as equivalent to party membership.For instance, 127 mayors belonged to the triple coalition on paper, while following our adjust-ment their numbers increases to 181 (the respective figures for MRF affiliation are 35 and 38,respectively). The results presented in the main text are robust to using the original mayor affili-
45

ation.
Mayor characteristics. Margin elected (2003; Central Electoral Commission); dummy for whetherthe mayor has any political experience prior to 2003 (internet search).
Additional variables
Corruption from the PFIA audit reports. Sum of PFIA infringements recorded in each munici-pality. Unlike BNAA, PFIA does not group infractions in categories.
Corruption from LiTS 2006. Index constructed from the following question: “In your opin-ion, how often is it necessary for people like you to have to make unofficial payments/gifts inthese situations?” (including eight options, such as “Interact with the road police”, or “Requestunemployment benefits” with answer options 1 (never) to 5 (always)).
Control variables from LiTS 2006. Respondent age, age squared, household income (proxied bythe share of household resources spent on food, an asset index, and the household self-perceivedposition on a 10-step income ladder), whether the respondent is employed, respondent’s educa-tion, respondent’s father’s education, and whether the respondent or any members of his familywere part of the former Communist Party.
46