Do Prices Determine Vertical Integration? Files/ACFN_fb8517f9-7cfa-4609-9ce9... · Do Prices...
47
Do Prices Determine Vertical Integration? * Laura Alfaro Harvard Business School and NBER Paola Conconi Universit´ e Libre de Bruxelles (ECARES) and CEPR Harald Fadinger University of Vienna Andrew F. Newman Boston University and CEPR February 2014 Abstract What is the relationship between product prices and vertical integration? While the litera- ture has focused on how integration affects prices, this paper provides evidence that prices can affect integration. Many theories in organizational economics and industrial organi- zation posit that integration, while costly, increases productivity. It follows from firms’ maximizing behavior that higher prices induce more integration. The reason is that at low prices, increases in revenue resulting from enhanced productivity are too small to justify the cost, whereas at high prices the revenue benefit exceeds the cost. Trade policy pro- vides a source of exogenous price variation to assess the validity of this prediction: higher tariffs should lead to higher prices and therefore to more integration. We construct firm- level indices of vertical integration for a large set of countries and industries and exploit cross-section and time-series variation in import tariffs to examine their impact on firm boundaries. Our empirical results provide strong support for the view that output prices are a key determinant of vertical integration. JEL classifications : D2, L2, Keywords : Theory of the firm, vertical integration, product prices. * We are grateful to Daron Acemoglu, Robby Akerlof, Nick Bloom, Francesco Decarolis, Bob Gibbons, Davin Chor, Gene Grossman, Maria Guadalupe, Ali Horta¸csu, Louis Kaplow, Patrick Legros, Margaret McMillan, Emanuel Ornelas, Mike Powell, Raffaella Sadun, Chad Syverson, John Van Reenen, Chris Woodruff and numerous seminar and conference participants for their valuable suggestions and comments. Research funding from the FNRS and the European Commission (PEGGED collaborative project) is gratefully acknowledged by Conconi. For their hospitality and support, Newman is grateful to the Yale Economic Growth Center and the Brown Population Studies and Training Center. We thank Francisco Pino, Andrea Colombo and Qiang Wang for excellent research assistance.
Transcript of Do Prices Determine Vertical Integration? Files/ACFN_fb8517f9-7cfa-4609-9ce9... · Do Prices...

Do Prices Determine Vertical Integration?∗
Laura AlfaroHarvard Business School and NBER
Paola ConconiUniversite Libre de Bruxelles (ECARES) and CEPR
Harald FadingerUniversity of Vienna
Andrew F. NewmanBoston University and CEPR
February 2014
Abstract
What is the relationship between product prices and vertical integration? While the litera-ture has focused on how integration affects prices, this paper provides evidence that pricescan affect integration. Many theories in organizational economics and industrial organi-zation posit that integration, while costly, increases productivity. It follows from firms’maximizing behavior that higher prices induce more integration. The reason is that at lowprices, increases in revenue resulting from enhanced productivity are too small to justifythe cost, whereas at high prices the revenue benefit exceeds the cost. Trade policy pro-vides a source of exogenous price variation to assess the validity of this prediction: highertariffs should lead to higher prices and therefore to more integration. We construct firm-level indices of vertical integration for a large set of countries and industries and exploitcross-section and time-series variation in import tariffs to examine their impact on firmboundaries. Our empirical results provide strong support for the view that output pricesare a key determinant of vertical integration.
JEL classifications: D2, L2,
Keywords: Theory of the firm, vertical integration, product prices.
∗We are grateful to Daron Acemoglu, Robby Akerlof, Nick Bloom, Francesco Decarolis, Bob Gibbons, DavinChor, Gene Grossman, Maria Guadalupe, Ali Hortacsu, Louis Kaplow, Patrick Legros, Margaret McMillan,Emanuel Ornelas, Mike Powell, Raffaella Sadun, Chad Syverson, John Van Reenen, Chris Woodruff and numerousseminar and conference participants for their valuable suggestions and comments. Research funding from theFNRS and the European Commission (PEGGED collaborative project) is gratefully acknowledged by Conconi.For their hospitality and support, Newman is grateful to the Yale Economic Growth Center and the BrownPopulation Studies and Training Center. We thank Francisco Pino, Andrea Colombo and Qiang Wang forexcellent research assistance.
1 Introduction
The relationship between vertical integration and product prices has long been a source of con-
troversy among economists and policy makers. Two strands of thought, broadly opposed, have
emerged. In the foreclosure view, firms may integrate with their suppliers to reduce competi-
tion with their rivals, thus pushing product prices higher.1 The efficiency view, by contrast,
maintains that integration increases productivity, thereby reducing prices.2 Discussion usually
revolves around which of these opposing effects is likely to dominate in a particular market or
merger case. Either way, causality runs from vertical integration to prices.
Efficiency theories have another implication, however, that can generate a positive association
between prices and integration, but unlike foreclosure, do so even under perfect competition. To
see this, suppose that integration increases productivity, but does so at a cost. For instance,
integration might improve coordination among suppliers, but engender administrative costs that
are independent of output and product price. Then a price-taking firm will choose to integrate
only if the benefits in terms of increased profitability outweigh the cost of integrating. At low
prices, the productivity gains resulting from integration are not very valuable, too small to justify
the cost. At higher prices, integration becomes worthwhile.3 In other words, if integration affects
productivity, there is a force running in the opposite direction, from prices to vertical integration.
The possibility that product prices influence vertical integration through this “pecuniary”
channel has important consequences for industrial organization (Legros and Newman, 2013).
It implies that demand shocks can generate merger and divestiture waves that in turn affect
the performance of individual firms and whole industries. It can help to explain intra-industry
heterogeneity in organization and productivity. It introduces a re-organizational component
to the diffusion of productivity shocks that may dampen technological progress. And it has
implications for antitrust policy.
This paper is a first attempt to provide evidence that product prices affect integration. Our
results suggest that this pecuniary mechanism is operative in a wide range of industries around
the world. The main empirical challenge is to find sources of price variation that are exogenous
1Key theoretical contributions on market foreclosure include Salinger (1988), Ordover, Saloner, and Salop(1990), Hart and Tirole (1990) and Bolton and Whinston (1993). Market foreclosure concerns have been en-shrined in anti-trust policies and have motivated policies such as “divorcement” legislation. See, for example, theguidelines on the assessment of non-horizontal mergers in the United States (1984 Merger Guidelines) and in theEuropean Union (Council Regulation 2008/C 265/07).
2Numerous channels have been identified through which integration enhances productivity. Technologicalsynergies and efficiencies in asset use are frequently cited by policy makers and antitrust defendants. Organizationeconomists have emphasized other benefits, and often associated costs: reductions in the costs of transactions,adaptation, or opportunism (Williamson, 1971, 1975; Klein, Crawford, and Alchian, 1978); better multitaskingincentives (Holmstrom and Milgrom, 1991); alignment of control and incentives (Grossman and Hart, 1986; Hartand Moore, 1990); or improved coordination (Hart and Holmstrom, 2010). A complementary class of theoriesemphasize allocative, rather than productive, efficiency gains achieved by the elimination of double markups,though these shall not concern us. See Perry (1989) and Riordan (2008) for further discussion.
3As discussed in Section 3, this logic is not limited to perfect competition.
1

to firms’ vertical integration decisions. Our strategy is to exploit cross-section and time-series
variation in Most-Favored-Nation (MFN) tariffs applied by GATT/WTO members. Since tariffs
raise product prices in the domestic market, they should lead to more vertical integration among
firms selling in that market.
MFN tariffs can be taken as exogenous to vertical integration for several reasons. First,
they emerge from long rounds of multilateral trade negotiations. At the end of each round,
governments commit not to exceed certain tariff rates (tariff bounds); if a country raises its
tariffs above the bound level, other countries can take it to dispute settlement. Second, they
must be applied in a non-discriminatory manner to imports from all countries, which severely
limits negotiators’ flexibility to respond to political pressure.4 Consequently, if they respond at
all to short-term political pressure, governments resort to other measures for regulating imports,
such as anti-dumping and countervailing duties (e.g. Finger, Hall and Nelson, 1982). Third,
MFN tariffs are persistent, significantly more so than integration choices. In our main analysis,
we study vertical integration of firms in 2004. In that year, the prevailing tariffs resulted from the
eight-year Uruguay Round of trade negotiation that was completed ten years earlier.5 Finally,
while larger firm size and more industry concentration might lead to higher final good tariffs
by alleviating free-riding problems in lobbying (Mitra, 1999; Bombardini, 2008), there is little
reason to believe that vertical structure should have such an effect.6
The effect of product prices on integration that we investigate should apply broadly, to
many different markets. We therefore draw our evidence from the WorldBase dataset of Dun
and Bradstreet (D&B), which includes firms in many different countries and industries. This
approach allows us to exploit cross-country and cross-sector variation in MFN tariffs.7 WorldBase
contains listed and unlisted plant-level observations for a large set of countries and territories.
For each plant, the dataset includes information about its production activities (at the 4-digit
SIC level) and ownership (e.g. domestic or global parent). To measure vertical integration,
we apply the approach of Fan and Lang (2000): combining information on firms’ production
activities with input-output tables, we construct firm-level vertical integration indices, which
measure the fraction of inputs used in the production of a firm’s final good that can be produced
4The MFN treatment obligation stipulated in Article I of the General Agreement on Tariffs and Trade (GATT)forbids members to discriminate between trading partners. It requires that equal treatment be afforded to allimported goods, irrespective of their origin.
5By 2004, most GATT/WTO members had reduced their tariffs to meet the binding obligations agreed to in1994, at the end of the Uruguay Round of trade negotiations (Bchir, Jean and Laborde, 2006).
6If anything, vertical integration will tend to make free-riding problems in lobbying for protection more severe:vertically integrated suppliers will have a diversity of interests that would weaken their lobbying incentives;moreover, coordination to lobby will be harder among suppliers that are in the same sector but belong todifferent firms than among independent suppliers. Our results are unaffected when controlling for firm size andindustry concentration.
7The GATT non-discrimination principle implies that there is only one MFN tariff rate per industry in eachcountry; the length of multilateral trade rounds — and the long gaps between them — imply that MFN tariffsvary little over time. Most of the variation is thus within countries across industries and within industries acrosscountries (see Section 4.4).
2
in house.
Our empirical results provide strong support for the view that output prices are a key deter-
minant of vertical integration. We find that the higher is the MFN tariff applied by a country
on the imports of a good, the more vertically integrated are the country’s producers of the good.
The effect is larger where we would expect organizational decisions to be more responsive to
import tariffs (i.e. for firms that only serve the domestic market) and in sectors in which MFN
tariffs have a larger impact on domestic prices.8 Our empirical specifications always control for
fixed effects at the country and sector level, and are robust to the inclusion of other controls
varying at the the sector-country level (e.g., the interaction of a sector’s capital intensity with
a country’s legal quality), which have been suggested in the literature as potential determinants
of vertical integration.
Our estimates imply that price changes can have large effects on firm boundaries. Depending
on the specification, we obtain estimates of the tariff elasticity of vertical integration that range
from 0.02 to 0.09. Given that tariffs are expressed in ad-valorem terms, these translate into price
elasticities that, at the mean tariff of about 5 percent, are much larger, in the range of 0.4-2.1.9
In our empirical analysis, we rule out several alternative mechanisms that could generate the
positive correlation between tariffs and vertical integration. First, tariffs can have an impact on
the degree of competition faced by domestic firms, which may also shape vertical integration
decisions. To isolate the effect of product prices, we restrict our analysis to highly competitive
sectors, in which tariffs will have little or no effect on the degree of competition. Confining
attention to the subsample of competitive sectors yields even stronger results: the effect of
tariffs on vertical integration is larger than for the full sample.
Another possible explanation for the positive effect of tariffs on vertical integration is that,
in the presence of credit constraints, protected firms may have more disposable cash to acquire
their suppliers. This mechanism would be expected to be strongest where credit markets are
least efficient, or in industries which are most financially dependent. We verify that the effect of
tariffs on integration does not vary with either of these factors, as captured by standard measures
of financial development and financial dependence.
Tariffs might also affect vertical integration through their impact on input prices. Higher
tariffs on inputs might lead some firms to abandon outsourcing from foreign suppliers in favor of
8In our main empirical analysis, we focus on firms that have plants only in one country. There are threemain reasons for this choice. First, these firms provide a cleaner analysis of the effects of product prices onfirms’ ownership structure; in the case of firms operating in many markets, it is harder to identify the relevantprices and tariffs. Second, focusing on national firms avoids issues having to do with the strategic behavior ofmultinationals across markets (e.g. transfer pricing, tariff jumping, export platforms). Finally, when integrationoccurs across international borders as opposed to within them, trade policy can alter bargaining power (surplusdivision) among suppliers as well as the value of what they jointly produce, further complicating the predictedeffects (Ornelas and Turner, 2008; Antras and Staiger, 2012).
9Another way to get a sense of the effects of prices on organization would be to instrument prices with MFNtariffs. However, this would require comparable cross-country data on domestic prices, which are extremelydifficult to obtain (see Bradford, 2003).
3
domestic in-house production. Notice that this logic involves a relationship between input tariffs
and vertical integration and thus does not apply to our results, which are about output tariffs.
Still, to the extent that input and output tariffs are positively correlated, our estimates could
suffer from omitted variable bias. To deal with this concern, we show that our results continue
to hold when we include input tariffs in our regressions.
We also verify that our results are not driven by other potential omitted variables, which
could be correlated with both vertical integration decisions and MFN tariffs on final products.
In particular, our results are unaffected when including measures of industry concentration and
tariffs in export markets. They are also robust to constructing vertical integration indices in
different ways, using alternative econometric methodologies, and focusing on different samples
of firms and countries.
An alternative strategy to verify the impact of product prices on firm boundaries is to exploit
time variation in import tariffs, examining the effects of trade liberalization reforms — major
unilateral or multilateral liberalization episodes, or the creation of regional trade agreements —
on vertical integration decisions. The challenge with implementing this strategy is data availabil-
ity, since we can only construct firm-level vertical integration measures for recent years, during
which there have been few trade liberalization reforms.10 The only major trade liberalization
episode that has occurred in recent years is arguably the entry of China into the WTO in 2001: to
be accepted as a WTO member, China agreed to undertake substantial reductions in its import
tariffs. We examine the organizational effects of these tariff changes, comparing the ownership
structure of Chinese firms before and after WTO accession (in 1999 and 2007). Consistent with
the predictions of our theoretical model, we find that firm-level vertical integration has fallen
more in sectors that have experienced larger tariff cuts.
Finally, we investigate the effect of trade policy on organizational convergence across coun-
tries. Our theory suggests that countries with similar domestic price levels should have firms
with similar ownership structures (Conconi, Legros, and Newman, 2012). In line with this pre-
diction, we show that differences in vertical integration across countries are significantly larger
in sectors in which differences in MFN tariffs (and therefore differences in domestic prices) are
larger. Moreover, differences in vertical integration indices are smaller for country pairs engaged
in regional trade agreements.11 This effect is stronger for customs unions, which impose common
external tariffs vis-a-vis non-members and should therefore achieve greater price convergence.
This paper focuses on vertical integration, which involves complementary goods linked in
a buyer-supplier relationship. In principle, the theoretical mechanism we investigate may also
10The first year for which we can use WorldBase to construct vertical integration indices is 1999. Importantmultilateral or regional trade liberalization episodes, such as the Uruguay Round Agreements, the NAFTA freetrade area between the U.S., Canada and Mexico, or the MERCOSUR customs union between Argentina, Brazil,Paraguay and Uruguay, all occurred in the early or mid-nineties.
11Under Article I of the GATT, countries have to apply the same MFN tariff to all trading partners. Preferentialtreatment can only be granted to partners in regional trade agreements (under Article XXIV of the GATT) ordeveloping countries (in the context of the Generalized System of Preferences, under the Enabling Clause).
4
apply to horizontal integration, which involves substitute goods, or lateral integration, involving
goods sold in separate markets that are complementary either in production or consumption.
To the extent that these forms of integration also are costly but enhance productive efficiency,
we should expect firms to be more integrated in these other dimensions when tariffs — and thus
product prices — are higher. However, data limitations and the lack of unconfounded integration
measures make it difficult to apply the methodology to these other cases, as discussed in Section
4.3. We thus feel that vertical integration provides the cleanest test of the theory.
The rest of the paper is organized as follows. Section 2 discusses the related literature. Section
3 presents a simple illustration of the logic of pecuniary determinants of vertical integration that
motivates our empirical analysis. Section 4 describes our data. Section 5 and 6 present our main
results, exploiting cross-sectional and time-series variation in tariffs. Section 7 analyzes the
impact of trade policy on the degree organizational convergence of firms in different countries.
The last section concludes.
2 Related literature
Understanding vertical integration decisions has been a fundamental concern of organization
economics since Coase (1937)’s seminal paper. We have already mentioned (footnote 2) some of
the seminal contributions, both formal and informal, that have shaped economists’ understanding
of how ownership structure affects productivity of individual firms. Recent theoretical work has
embedded models of firms into market settings to study how firms’ boundary choices are affected
by market conditions. In particular, market thickness, demand elasticities, and terms of trade
in supplier markets may have an impact on firms’ vertical integration decisions (e.g. McLaren,
2000; Grossman and Helpman, 2002; Legros and Newman, 2008). Legros and Newman (2013) is
the first paper to point out that product prices can have a causal impact on integration decisions.
So far, evidence on the implications of these models is sparse. This paper shows that market
conditions — in particular, the level of product prices — do affect vertical integration decisions.
There is a very large empirical literature that examines the determinants of firms’ vertical
integration decisions (i.e. firm boundaries/ownership structure), usually with a view to assessing
the importance of different tradeoffs that determine firm boundaries, or to examining effects of
vertical integration on market outcomes (for an excellent survey, see Lafontaine and Slade,
2007). Most studies focus on single industries.12 In this literature, Hortacsu and Syverson
(2007) concentrate on the U.S. cement industry and examine whether vertical integration leads
to higher prices. In contrast with the predictions of market foreclosure theories, they find that
12These include the seminal papers by Stuckey (1983) on integration between aluminum refineries and bauxitemines and Joskow (1987) on ownership arrangements in electricity generating plants, as well as the more recentstudies by Baker and Hubbard (2003, 2004) on the trucking industry, Woodruff (2002) on Mexican footwear; orForbes and Lederman (2009, 2011) on airlines.
5

more integration leads to lower prices; they do not address the opposite direction of causality
that is our concern.
A few studies examine a single country. For example, Acemoglu, Aghion, Griffith and Zilibotti
(2010) use data on British manufacturing plants to study the relationship between vertical
integration and rates of innovation. Aghion, Griffith and Howitt (2006) investigate whether the
propensity for firms to vertically integrate varies systematically with the extent of competition
in the product market.
As for multi-country studies, one stream of the literature has analyzed other aspects of
organization, such as management practices or the degree of delegation within firms. Bloom and
Van Reenen (2007) study managerial practices in medium-sized manufacturing firms in the U.S.
and Europe (France, Germany and the UK), finding that best practices are strongly associated
with superior firm performance. Bloom, Sadun and Van Reenen (2010), using survey data on
manufacturing firms across a dozen countries, reveal that greater product market competition
increases decentralization. Bloom, Sadun and Van Reenen (2012) use survey data they collected
from several countries to show that firms headquartered in high trust regions are more likely
to decentralize. Guadalupe and Wulf (2012) show that the 1989 Canada-United States Free
Trade Agreement (CUSFTA) led large U.S. firms to flatten their hierarchies. Other papers have
studied how trade liberalization, by increasing the degree of competition, affects the number
of horizontally differentiated product varieties a firm chooses to manufacture (Eckel and Neary,
2010; Bernard, Redding and Schott, 2011).
Various papers examine whether goods are sold within or across firm boundaries in the global
economy (e.g. Antras, 2003; Nunn, 2007). This literature considers the organizational choices
of multinational firms and highlights the role of contract enforcement and relationship-specific
investments. By contrast, we focus on the organizational choices of firms that operate in a single
country.
In terms of data and methodology, our analysis is closely related to the paper by Ace-
moglu, Johnson and Mitton (2009), who study the determinants of vertical integration using a
cross-section of D&B data for 93 countries, emphasizing the role of financial development and
contracting costs. Ours is the first paper to investigate the impact of product prices on vertical
integration decisions.
3 Conceptual framework
The fundamental logic of how product prices influence firm boundaries can simply be illustrated
with a “reduced form” model, in which vertical integration has three main features: (i) it
enhances productivity; (ii) it does so at a cost; (iii) the cost is independent of product price.
The first assumption is the defining attribute of efficiency theories of vertical integration. The
second is necessary if there is anything to discuss: without it, given the first assumption, firms
6
would always integrate to the maximal extent. The third is commonly made, either directly or
derived from more fundamental assumptions.
Consider a price-taking enterprise that requires N ≥ 2 inputs, each of which contributes
equally to the production of a final good priced at P . Before production, the enterprise chooses
the degree of vertical integration n, which for present purposes can be taken to be the number
of inputs that will be produced inside a single firm (in practice of course, inputs do not all
contribute equally to the final product, and an empirical integration measure will take this into
account). The effects of integration on productivity are modeled in the simplest possible way:
the cost of producing Q units of output is ψ(n)C(Q), where ψ(·) is decreasing and C(Q) is
increasing and convex. This function captures various possible sources of efficiency gains from
integration suggested in the literature. Thus, the more integrated the firm (the higher is n), the
lower the unit cost of producing Q.
Integration is costly (if not, we would always have n = N). Let Φ(n) be the cost of integrating
n units into the firm Φ(·) is increasing and Φ(0) = 0. This function captures different types
of costs (e.g. legal, administrative, monitoring; or private costs of effort, subordination, or
conformity). Note that here the integration cost is independent of P and Q. The enterprise’s
net profit is then
PQ− ψ(n)C(Q)− Φ(n). (1)
The enterprise chooses n and Q to maximize profit, taking P as given.
Since ψ(·) is decreasing and C(·) is increasing, the profit has (strictly) increasing differences (is
strictly supermodular) in the choice variables n and Q. Basic principles of monotone comparative
statics (e.g. Topkis, 1998; Vives, 2000) tell us that optimal choices of these variables will therefore
co-vary. Since profit has (strictly) increasing differences in P and Q, the optimal quantity and
the optimal degree of integration will increase with P . The intuition is that the efficiency gains
generated by integration are more valuable when the price of output is higher, so integration
incentives are greater at higher prices.13
The model can be enriched by introducing exogenous variation in productivity. If marginal
costs decline with productivity, then the enterprise’s objective has increasing differences in pro-
ductivity and integration, implying that higher productivity firms will be more integrated (see
Legros and Newman, 2013).
The increasing relationship between P and Q is, of course, just the firm’s supply behavior.
But note that upward movement along this supply curve also entails increases in n: supply
embeds the organizational decision of the firm in addition to its quantity choice. Now consider
13To be sure, in some models, particularly those in which incentives play a role, the extent of the efficiency gainsmay depend on other variables besides n, such as the price P or the distribution of the profits among the variousproduction units. These more general specifications may also lead to nonlinearities and non-monotonicities inthe predicted relationship between integration and price (Legros and Newman, forthcoming). However, thesecomplications do not affect the basic contention that product prices influence integration decisions. We did notfind evidence of these more complex patterns in our data.
7
an industry in one country composed of many price-taking firms. Addition of the supplies across
all the firms yields an “organizationally augmented” industry supply curve (OAS), denoted S(P ),
which can be used to perform standard economic exercises, such as tracing the effects of demand
shocks, to simultaneously determine prices, quantities and vertical integration decisions of all
firms.
As discussed in the introduction, testing the key prediction of this framework — that a
higher price on the final good should lead a firm to be more vertically integrated — requires an
exogenous source of price variation. Trade policy provides an ideal proving ground: the degree
of trade protection provided by MFN tariffs affects product prices, but is unlikely to be affected
by firms’ boundary choices. The OAS provides a simple tool for understanding how vertical
integration relates to tariffs and for illustrating our empirical strategy.
Consider an industry composed by many price-taking enterprises within a single country,
which is part of a world trading system. An equilibrium of that system will determine a world
market-clearing price P ∗ for the industry. In the country in question, the industry is “import
competing”: at P ∗, domestic demand D(P ∗) exceeds the supply S(P ∗), so that some of domestic
demand must be satisfied by imports. Suppose further that the country in which our industry
resides is “small,” i.e. its tariffs do not affect the world price.14 Consider the introduction of
an ad-valorem tariff t, which drives a wedge between the domestic price P and the world price:
P = (1 + t)P ∗. By increasing the domestic price, the tariff increases the gains from integration
for domestic firms, leading them to be more vertically integrated. The effects of a tariff on firm
boundaries is illustrated in Figure 1.
In our main empirical analysis, we will exploit cross-country variation in applied MFN tariffs
for a given sector to identify the effect of tariffs on vertical integration. Effectively, we will be
comparing the degree of vertical integration of firms that produce the same manufacturing good,
but are located in countries that apply different tariffs on this good. In robustness checks, we
will alternatively use time variation in the tariffs applied by China to identify the impact of
tariffs on firm boundaries.
Our analysis will yield estimates of the tariff elasticity of vertical integration. What we are
really interested in is the effect of product prices on integration. Crucially, the fact that import
tariffs are expressed in ad-valorem terms allows us to derive the price elasticity of integration
without actually knowing the price. To see this, note that the tariff elasticity of domestic
price P = (1 + t)P ∗ for a small country (P ∗ unaffected by its tariff) is ∂P∂t
tP
= t1+t
. Denote
the tariff elasticity of integration by β ≡ ∂n∂t
tn. Then the price elasticity of integration is just
∂n∂P
Pn
= β(1+tt
). Thus the price elasticity exceeds the tariff elasticity, by some twentyfold for the
average tariff of 5 percent.15
14See Conconi, Legros, and Newman (2012) for a model in which vertical integration decisions are embeddedin an international trade model and P ∗ is endogenously determined.
15As mentioned above, in our main empirical analysis we exploit cross-country variation in tariffs. In thiscase, the relationship between the estimated tariff elasticity of vertical integration and the corresponding price
8

Figure 1: Equilibrium with an import tariff
S(P)
D(P)
Q
P*
P*(1+t)
P
increas
ing int
egratio
n
The basic prediction of our theoretical framework does not hinge on the assumption of per-
fect competition. The same logic applies if the domestic firm is a monopolist: as long as the
tariff-augmented price is below the monopoly price, an increase in the tariff will increase the
monopolist’s revenue, inducing more integration.16
Several corollaries and qualifications follow from this basic logic. First, the impact of import
tariffs on integration choices should be stronger for firms that only serve the domestic market,
since their profits depend only on the domestic price; the effect should be weaker for firms
that also serve foreign markets (i.e. exporting firms and multinationals), since their profits and
integration decisions also depend on prices prevailing in other countries.
Second, the impact of trade policy on the degree of vertical integration should also depend
on the extent to which import tariffs affect domestic prices. In particular, higher shares of
imports subject to the tariff (i.e. lower shares of goods imported duty-free from regional trading
partners), should be associated with larger effects of the tariff on prices and organization.
Finally, the law of one price implies a law of one organization: trade policy should affect the
degree of organizational convergence across countries. In particular, vertical integration choices
should be more alike among countries in sectors in which their import tariffs (and thus their do-
mestic prices) are closer. We also expect a tendency for convergence in prices and organizational
elasticity is independent of country size, as long as all countries face the same world equilibrium price.16In case of monopoly, the firm faces an inverse demand P (Q) rather than a constant price P , but cannot
charge more than the tariff-augmented world price P ∗(1 + t). It will charge less if the monopoly price P (Q) isless than P ∗(1 + t). Thus its objective is to maximize min {P ∗(1 + t), P (Q)}Q − ψ(n)C(Q) − Φ(n), which hasthe same properties (nondecreasing differences in t and Q, supermodularity in n and Q) as the competitive firm’sobjective.
9

choices among members of regional trade agreements; this result should be stronger for customs
unions — in which members adopt common external tariffs – than in free trade areas — in which
differences in external tariffs and rules of origins reduce the extent of price convergence.17
For the purpose of our empirical analysis, the main predictions of our theoretical framework
can be summarized as follows:
P.1: Higher import tariffs on final goods should induce domestic firms producing these
goods to be more vertically integrated.
P.2: The effect of tariffs on integration should be larger for firms serving only the domestic
market.
P.3: The effect of tariffs on integration should be larger in sectors in which a smaller
fraction of imports are exempt from the tariff.
P.4: Country pairs should have similar ownership structures in sectors where they face
similar levels of protection; regional trade agreements, especially customs unions, should
display similar ownership structures among members.
It should be stressed that the above predictions apply to tariffs on final goods, which raise
output prices, increasing the revenue of the enterprise. Our theory generates no clearcut pre-
dictions concerning the effects of input tariffs on boundary choices: whether higher input prices
strengthen or weaken the incentives for integration depends on whether inputs sales are part of
the revenue of the enterprise or part of its costs.18
4 Dataset and variables
In Sections 5-7, we will provide evidence that product prices affect vertical integration decisions
in a wide range of countries and industries, in line with the above predictions. Focusing on
many countries and industries allows us to exploit MFN tariffs as a source of exogenous price
variation.19 In this section, we describe our dataset and the variables used in our empirical
analysis.
17See Cadot, de Melo, and Olarreaga (1999), for a comparison of different types of regional trade agreementsand a discussion of rules of origin in free trade areas.
18For example, if an automobile manufacturer produces more automotive stampings than it needs and sells theremainder on the market, then the sale of stampings will enter its revenue; in this case, the higher the price ofstampings, the higher the incentives to integrate. On the other hand, if stampings are purchased on the openmarket, an increase in their price will diminish revenue and reduce the incentives to integrate.
19As discussed in Section 1, MFN tariffs are very persistent, i.e. vary little in between rounds of multilateraltrade negotiations. At a given point in time, given the GATT principle of non-discrimination (see footnote 4),MFN tariffs vary mostly across countries (for a given industry) and across industries (for a given country).
10
4.1 The WorldBase database
Increasingly, researchers use multi-country firm-level data to study issues of organization eco-
nomics (e.g. Bloom and Van Reenen, 2007; Bloom, Sadun and Van Reenen, 2012). However,
cross-country empirical investigations at the firm level are notoriously challenging due to both
the lack of data and the difficulty of comparing the few high quality time-series datasets that
are available (mostly in rich countries). The reason for the data constraint is simple: economic
censuses of firms are infrequently collected due to high costs and institutional restrictions, espe-
cially in poor countries. No institution has the capacity or resources to collect census data for a
wide range of countries and periods. This is why researchers have to use other sources, such as
business “compilations” (registries, tax sources) or surveys.
To measure vertical integration, we use data from Dun & Bradstreet’s WorldBase, a database
covering public and private companies in more than 200 countries and territories.20 The unit of
observation is the establishment/plant. With a full sample, plants belonging to the same firm
can be linked via information on domestic and global parents using the DUNS numbers.21
The WorldBase dataset has been used extensively in the literature. Early examples include
Caves’ (1975) analysis of size and diversification patterns between Canadian and U.S. plants.
More recent uses include Harrison, Love, and McMillian (2004), Black and Strahan (2002),
Alfaro and Charlton (2009), and Acemoglu, Johnson and Mitton (2009). One of the advantages of
WorldBase compared to other international datasets is that it is compiled from a large number of
sources (e.g. partner firms, telephone directory records, websites, self-registration). Admittedly,
sample coverage may vary across countries, but this problem can be mitigated by focusing on
manufacturing firms above a size threshold of twenty employees (see discussion below).22
20WorldBase is the core database with which D&B populates its commercial data products, includ-ing Who Owns WhomTM, Risk Management SolutionsTM, Sales & Marketing SolutionsTM, and SupplyManagement SolutionsTM. These products provide information about the “activities, decision makers, fi-nances, operations and markets” of the clients’ potential customers, competitors and suppliers.The datasetis not publicly available but was released to us by Dun and Bradstreet. For more information see:http://www.dnb.com/us/about/db database/dnbinfoquality.html.
21D&B uses the United States Government Department of Commerce, Office of Management and Budget,Standard Industrial Classification Manual 1987 edition to classify business establishments. The Data UniversalNumbering System — the D&B DUNS Number — introduced in 1963 to identify businesses numerically for data-processing purposes, supports the linking of plants and firms across countries and tracking of plants’ historiesincluding name changes.
22Other datasets use different methodologies in different countries. For example, the Amadeus dataset, providedlike Orbis by Bureau Van Dijk, uses data from the national public body in charge of collecting the annual accountsin some countries (e.g. the UK) and collects it directly from firms in other countries (most of Eastern Europe).Because of different disclosure requirements, the amount and type of information also varies among countries.See Alfaro and Charlton (2009) for a more detailed discussion of the WorldBase data and comparisons with otherdata sources.
11

4.2 The sample
Our main sample is based on the 2004 WorldBase dataset (for the analysis of China’s accession
to the WTO, we use data from 1999 and 2007). As mentioned above, the unit of observation in
WorldBase is the establishment/plant, a single physical location at which business is conducted
or services or industrial operations are performed.
For each establishment, we use different categories of data recorded in WorldBase:
1. Industry information: the 4-digit SIC code of the primary industry in which each estab-
lishment operates, and the SIC codes of as many as five secondary industries.
2. Ownership information: information about the firms’ family members (number of family
members, domestic parent and global parent).23
3. Location information: country, state, city, and street address of each family member (used
to link establishments within a family to the relevant tariff data).
4. Basic operational information: sales and employment.
5. Information on the trade status (exporting/non-exporting).
We carry out the analysis at the firm level, using DUNS numbers to link plants that have the
same ultimate owner. As discussed below, however, since the overwhelming majority of firms in
our sample have only one establishment, the qualitative results of our analysis are unaffected if
we measure vertical integration at the plant level or include only single-plant firms.
We restrict the sample to Word Trade Organization (WTO) members for which we have data
on tariffs/regional trading arrangements (see discussion below). Table A-1 in the Appendix lists
the countries included in our main sample.24 In robustness checks, we consider two subsamples
of countries: members of the OECD, and countries for which we have information on at least
1000 plants.
We focus on manufacturing firms (i.e. firms with a primary SIC code between 2000 and 3999),
which best fit our theory of vertical integration and for which tariff data are widely available. We
exclude firms that do not report their primary activity, government/public sector firms, firms
in the service sector (for which we have no tariff data) or agriculture (due to the existence of
many non-tariff barriers), and firms producing primary commodities (i.e. mining and oil and
gas extraction).
We further exclude firms with less than 20 employees, as our theory is less apt to apply to self-
employment or small firms with little prospect of vertical integration (see also Acemoglu, Aghion,
23D&B also provides information about the firm’s status (joint-venture, corporation, partnership) and itsposition in the hierarchy (branch, division, headquarters).
24Further restrictions were imposed by data availability constraints related to the control variables, as explainedin the next subsections.
12
Griffith and Zilibotti, 2010). Restricting the analysis to firms with more than 20 employees also
enables us to correct for possible differences in the collection of data on small firms across
countries (see Klapper, Laeven, and Rajan, 2006).
In our main sample, we focus on firms that are located only in one country. This provides
a cleaner setting to verify the predictions of our theoretical model, since the degree of vertical
integration of these firms should only depend on the price at which they sell their product in their
country. In the case of multinational corporations, on the other hand, it is harder to identify the
relevant prices and tariffs. Moreover, focusing on national firms avoids issues having to do with
the strategic behavior of multinationals across markets (e.g. transfer pricing, tariff jumping).
Multinational corporations are included in the robustness analysis (see Section 5.4).
We next describe the construction of the vertical integration indices and the other variables
used in our empirical analysis. Appendix Table A-2 presents summary statistics for all variables.
4.3 Vertical integration indices
Constructing measures of vertical integration is highly demanding in terms of data, requiring
firm-level information on sales and purchases of inputs by various subsidiaries of a firm. Such
data are generally not directly available and, to the best of our knowledge, there is no source for
such data for a wide sample of countries.
To measure the extent of vertical integration for a given firm, we build on the methodology
developed by Fan and Lang (2000). We combine information on plant activities and ownership
structure from WorldBase with input-output data to construct the index Vf,k,c, which measures
the degree of vertical integration of firm f, with primary sector k, located in country c.25
Given the difficulty of finding input-output matrices for all the countries in our dataset, we
follow Acemoglu, Johnson and Mitton (2009) in using the U.S. input-output tables to provide
a standardized measure of input requirements for each sector. As the authors note, the U.S.
input-output tables should be informative about input flows across industries to the extent that
these are determined by technology.26
The input-output data are from the Bureau of Economic Analysis (BEA), Benchmark IO
Tables, which include the make table, use table, and direct and total requirements coefficients
tables. We use the Use of Commodities by Industries after Redefinitions 1992 (Producers’ Prices)
25In Acemoglu, Johnson and Mitton (2009), the sample is restricted to a maximum of the 30,000 largest recordsper country in the 2002 WorldBase file (a limit imposed by cost constraints). For countries with more than 30,000observations, they select the 30,000 largest, ranked by annual sales. Having information on the full sample ofestablishments in WorldBase, we are able to link establishments to firms (see discussion below).
26Note that the assumption that the U.S. IO structure carries over to other countries can potentially bias ourempirical analysis against finding a significant relationship between vertical integration and prices by introducingmeasurement error in the dependent variable of our regressions. In addition, using the US input-output tablesto construct vertical integration indices for other countries mitigates the possibility that the IO structure andcontrol variables are endogenous. In robustness checks, we verify that our results are unaffected when restrictingthe analysis to OECD countries, which are closer to the U.S. in terms of technology (See Section 5.4).
13
tables. While the BEA employs six-digit input-output industry codes, WorldBase uses the SIC
industry classification. The BEA website provides a concordance guide, but it is not a one-to-
one key.27 For codes for which the match was not one-to-one, we randomized between possible
matches in order not to overstate vertical linkages. The multiple matching problem, however, is
not particularly relevant when looking at plants operating only in the manufacturing sector (for
which the key is almost one-to-one).
For every pair of industries, i, j, the input-output accounts provide the dollar value of i
required to produce a dollar’s worth of j. By combining information from WorldBase on firms’
activities with U.S. input-output data, we construct the input-output coefficients for each firm
f , IOfij. Here, IOf
ij ≡ IOij ∗ Ifij, where IOij is the input-output coefficient for the sector pair
ij, stating the cents of output of sector i required to produce a dollar of j, and Ifij ∈ {0, 1} is
an indicator variable that equals one if and only if firm f owns plants in both sectors i and j.
A firm that produces i as well as j will be assumed to supply itself with all the i it needs to
produce j; thus, the higher IOij for an i-producing plant owned by the firm, the more integrated
in the production of j the firm will be measured to be.
The firm’s integration index in activity j is
V jf,k,c =
∑i
IOf,kij , (2)
the sum of the IO coefficients for each industry in which the firm is active. Our measure of
vertical integration is based on the firm’s primary activity:
Vf,k,c = V jf,k,c, j = k. (3)
In the case of multi-plant firms, we link the activities of all plants that report to the same
headquarters and consider the main activity of the headquarters as the primary sector.
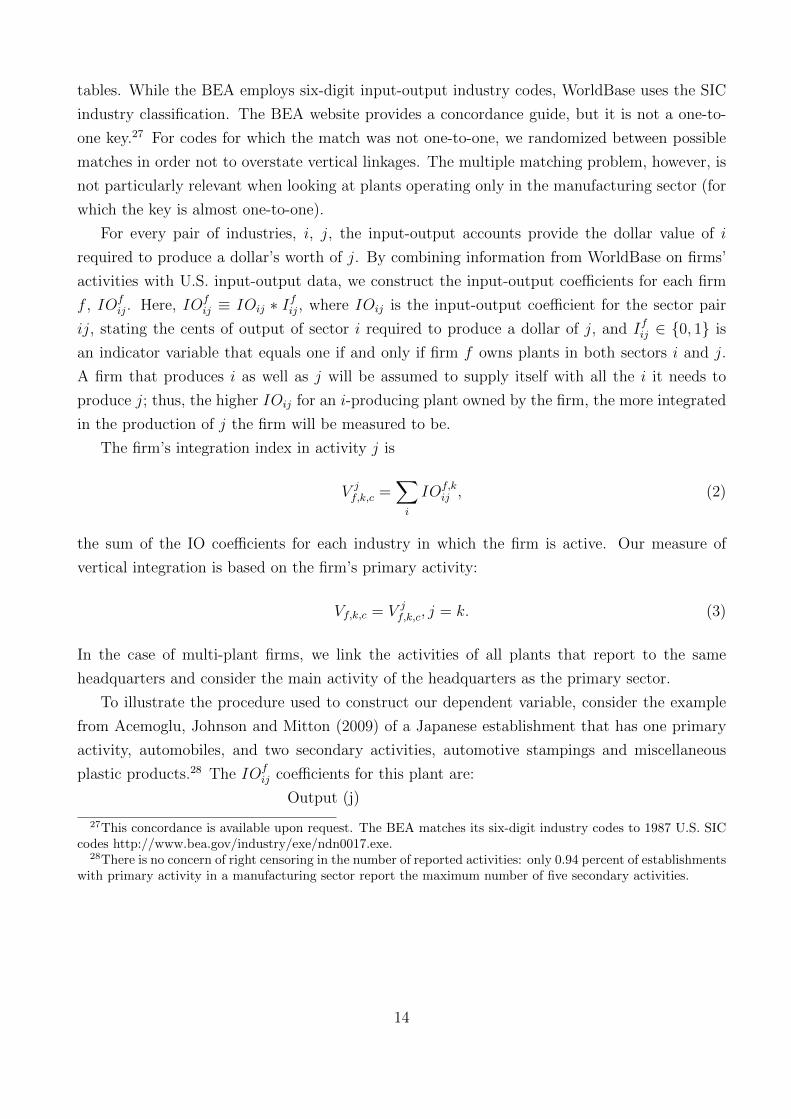
To illustrate the procedure used to construct our dependent variable, consider the example
from Acemoglu, Johnson and Mitton (2009) of a Japanese establishment that has one primary
activity, automobiles, and two secondary activities, automotive stampings and miscellaneous
plastic products.28 The IOfij coefficients for this plant are:
Output (j)
27This concordance is available upon request. The BEA matches its six-digit industry codes to 1987 U.S. SICcodes http://www.bea.gov/industry/exe/ndn0017.exe.
28There is no concern of right censoring in the number of reported activities: only 0.94 percent of establishmentswith primary activity in a manufacturing sector report the maximum number of five secondary activities.
14
Input (i)
Autos Automotive stampings Plastics
Autos 0.0043 0.0000 0.0000
Stampings 0.0780 0.0017 0.0000
Plastics 0.0405 0.0024 0.0560
SUM 0.1228 0.0041 0.0560
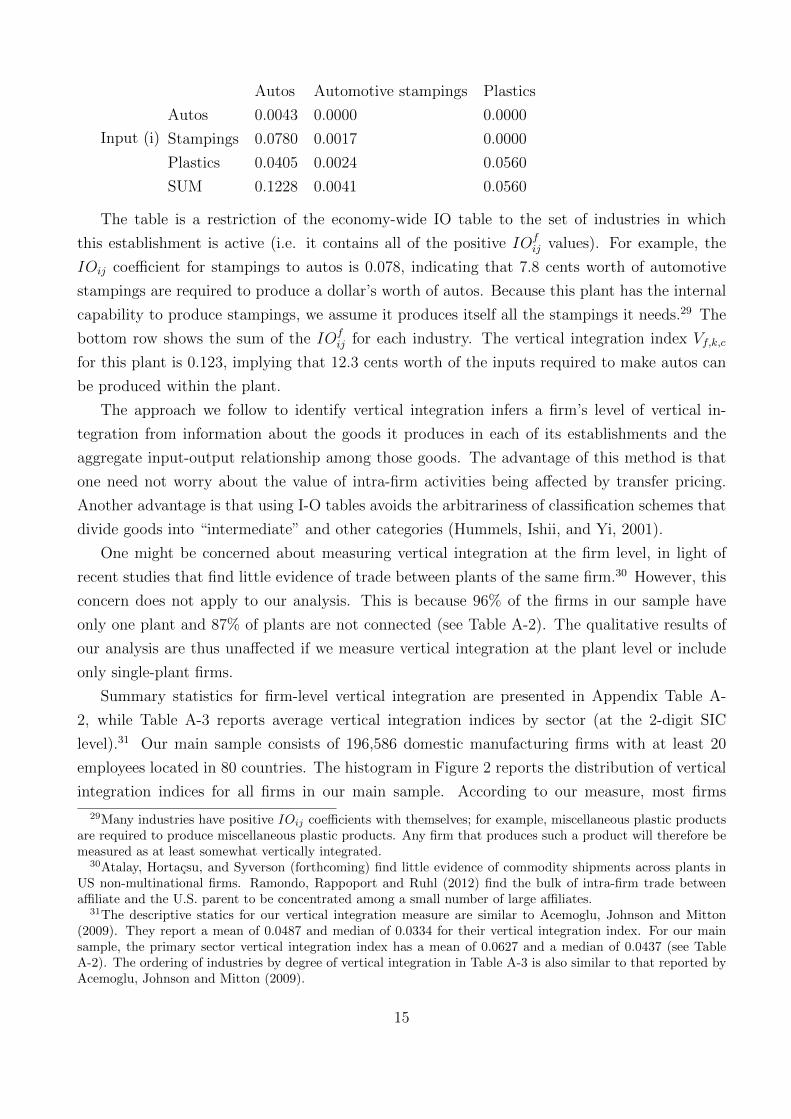
The table is a restriction of the economy-wide IO table to the set of industries in which
this establishment is active (i.e. it contains all of the positive IOfij values). For example, the
IOij coefficient for stampings to autos is 0.078, indicating that 7.8 cents worth of automotive
stampings are required to produce a dollar’s worth of autos. Because this plant has the internal
capability to produce stampings, we assume it produces itself all the stampings it needs.29 The
bottom row shows the sum of the IOfij for each industry. The vertical integration index Vf,k,c
for this plant is 0.123, implying that 12.3 cents worth of the inputs required to make autos can
be produced within the plant.
The approach we follow to identify vertical integration infers a firm’s level of vertical in-
tegration from information about the goods it produces in each of its establishments and the
aggregate input-output relationship among those goods. The advantage of this method is that
one need not worry about the value of intra-firm activities being affected by transfer pricing.
Another advantage is that using I-O tables avoids the arbitrariness of classification schemes that
divide goods into “intermediate” and other categories (Hummels, Ishii, and Yi, 2001).
One might be concerned about measuring vertical integration at the firm level, in light of
recent studies that find little evidence of trade between plants of the same firm.30 However, this
concern does not apply to our analysis. This is because 96% of the firms in our sample have
only one plant and 87% of plants are not connected (see Table A-2). The qualitative results of
our analysis are thus unaffected if we measure vertical integration at the plant level or include
only single-plant firms.
Summary statistics for firm-level vertical integration are presented in Appendix Table A-
2, while Table A-3 reports average vertical integration indices by sector (at the 2-digit SIC
level).31 Our main sample consists of 196,586 domestic manufacturing firms with at least 20
employees located in 80 countries. The histogram in Figure 2 reports the distribution of vertical
integration indices for all firms in our main sample. According to our measure, most firms
29Many industries have positive IOij coefficients with themselves; for example, miscellaneous plastic productsare required to produce miscellaneous plastic products. Any firm that produces such a product will therefore bemeasured as at least somewhat vertically integrated.
30Atalay, Hortacsu, and Syverson (forthcoming) find little evidence of commodity shipments across plants inUS non-multinational firms. Ramondo, Rappoport and Ruhl (2012) find the bulk of intra-firm trade betweenaffiliate and the U.S. parent to be concentrated among a small number of large affiliates.
31The descriptive statics for our vertical integration measure are similar to Acemoglu, Johnson and Mitton(2009). They report a mean of 0.0487 and median of 0.0334 for their vertical integration index. For our mainsample, the primary sector vertical integration index has a mean of 0.0627 and a median of 0.0437 (see TableA-2). The ordering of industries by degree of vertical integration in Table A-3 is also similar to that reported byAcemoglu, Johnson and Mitton (2009).
15
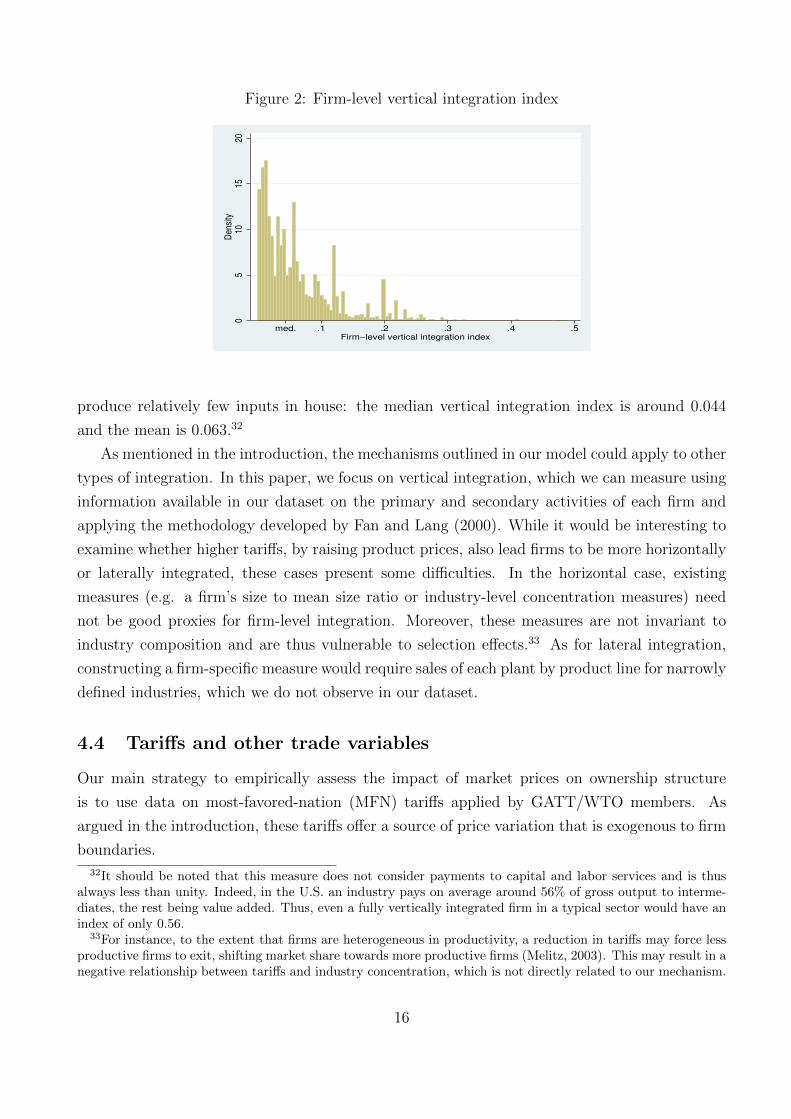
Figure 2: Firm-level vertical integration index
05
1015
20D
ensi
ty
.1med. .2 .3 .4 .5Firm−level vertical integration index
produce relatively few inputs in house: the median vertical integration index is around 0.044
and the mean is 0.063.32
As mentioned in the introduction, the mechanisms outlined in our model could apply to other
types of integration. In this paper, we focus on vertical integration, which we can measure using
information available in our dataset on the primary and secondary activities of each firm and
applying the methodology developed by Fan and Lang (2000). While it would be interesting to
examine whether higher tariffs, by raising product prices, also lead firms to be more horizontally
or laterally integrated, these cases present some difficulties. In the horizontal case, existing
measures (e.g. a firm’s size to mean size ratio or industry-level concentration measures) need
not be good proxies for firm-level integration. Moreover, these measures are not invariant to
industry composition and are thus vulnerable to selection effects.33 As for lateral integration,
constructing a firm-specific measure would require sales of each plant by product line for narrowly
defined industries, which we do not observe in our dataset.
4.4 Tariffs and other trade variables
Our main strategy to empirically assess the impact of market prices on ownership structure
is to use data on most-favored-nation (MFN) tariffs applied by GATT/WTO members. As
argued in the introduction, these tariffs offer a source of price variation that is exogenous to firm
boundaries.
32It should be noted that this measure does not consider payments to capital and labor services and is thusalways less than unity. Indeed, in the U.S. an industry pays on average around 56% of gross output to interme-diates, the rest being value added. Thus, even a fully vertically integrated firm in a typical sector would have anindex of only 0.56.
33For instance, to the extent that firms are heterogeneous in productivity, a reduction in tariffs may force lessproductive firms to exit, shifting market share towards more productive firms (Melitz, 2003). This may result in anegative relationship between tariffs and industry concentration, which is not directly related to our mechanism.
16
We collect applied MFN tariffs at the 4-digit SIC level for all countries for which this informa-
tion is available. We restrict the analysis to WTO members, which are constrained under Article
I of the GATT by the MFN principle of non-discrimination: each country c applies the tariff
Tariff k,c to all imports of final good k that originate in other WTO member countries. Prefer-
ential treatment is only allowed for imports originating from RTA members or from developing
countries (see discussion below).
The source for MFN tariffs is the World Integrated Trade Solution (WITS) database, which
combines information from the UNCTAD TRAINS database (default data source) with the WTO
integrated database (alternative data source). In our main empirical analysis, we use applied
MFN tariffs for 2004.34 The original classification for tariff data is the harmonized system (HS)
6-digit classification. Tariffs are converted to the more aggregate SIC 4-digit level using internal
conversion tables of WITS. Here, SIC 4-digit level MFN tariffs are computed as simple averages
over the HS 6-digit tariffs.
Applied MFN tariffs vary substantially both across sectors within countries and across coun-
tries for a given sector. For example, U.S. manufacturing tariffs in 2004 averaged 2.4 percent,
with a minimum of zero and a maximum of 350 percent. As an example of cross-country vari-
ation, for a sector like SIC 3631 (Household Cooking Equipment), the MFN tariffs applied in
2004 varied between zero and 29 percent, with an average of 3.15 percent.35
Our analysis focuses on tariffs on final goods in the domestic market. In some regressions, we
also control for the tariffs applied to imported inputs, using the variable Input Tariff k,c. This is
a weighted average of 4-digit SIC applied MFN tariffs, using normalized IO-coefficients from the
US input-output table as weights.36 To proxy for the level of protection faced by exporters in
foreign markets, we use the variable Foreign Tariff k,c. We construct this variable by weighting
tariffs in destination markets with bilateral sectoral export shares using information from the
UN Comtrade database.
The variable MFN sharek,c measures the fraction of imports to which MFN tariffs apply, for
each country and sector. This excludes imports from countries with which the importer has a
preferential trade agreement, which do not face tariff restrictions. The higher is this share, the
more sensitive its domestic prices should be to MFN tariffs. For example, the U.S. will have low
MFN shares in sectors in which it imports a lot from its NAFTA trading partners (Canada and
Mexico). In these sectors, the MFN tariff that the U.S. imposes on other WTO members will
have little impact on domestic prices. In contrast, the effect may be substantial in sectors where
most imports originate in countries with which the U.S. has no preferential trade agreement.
34If information on applied MFN tariffs is unavailable for that year, we use the closest available data point in afive year window around 2004 (2002-2006), with priority given to earlier years. For example, if data are availablefor 2003 and 2005, but not 2004, the 2003 data are chosen.
35The total variance of MFN tariffs in our sample is 52. The variance of MFN tariffs across sectors for a givencountry is around 61 percent of this number, while the variance across countries for a given sector is around 49percent of the total variance of MFN tariffs.
36InputTariffk,c ≡∑
i∈Nkwi,kTariffi,c, where wi,k ≡ IOik/
∑i∈Nk
IOik
17
To distinguish between firms selling only in the domestic market and exporting firms, we
construct two measures. The dummy variable Domesticf is constructed from WorldBase and
takes the value of 1 if firm f does not report to be an exporter. The variable Import-competingk,c
is a country-sector specific measure of import-competition constructed using information from
Comtrade. This is a dummy indicating whether a firm operates in one of the 25 percent most
import-competing sectors, based on the ratio of a country’s total imports/exports by sector.
We also collect information on all regional trade agreements in force in 2004 from the WTO
Regional Trade Agreements Information System (RTA-IS).37 We construct the dummy RTAc,c′
that equals one when countries c and c′ belong to a regional trade agreement formed under
Article XXIV of the GATT.38 To distinguish between different types of RTAs, we construct the
dummy variables Customs Unionc,c′ and Free Trade Areac,c′ . We expect the former, which imply
a common external tariff and no internal trade barriers, to have a stronger effect on organizational
convergence than the latter, which permit member countries to maintain different external tariffs.
4.5 Other controls
We collect a number of country- and sector-specific variables to control for alternative factors
emphasized in the literature on vertical integration.
In terms of country-specific variables, the empirical and theoretical literatures have studied
the role of institutional characteristics and financial development.39 We use the variable Legal
Qualityc to proxy for the quality of a country’s institutions. This is the variable “rule of law”
from Kaufmann, Kraay, and Mastruzzi (2003), which is a weighted average of a number of
variables (perception of incidences of crime, effectiveness and predictability of the judiciary, and
enforceability of contracts) between 1997 and 1998. The variable ranges from 0 to 1 and is
increasing in the quality of institutions. The variable Financial Development c measures private
credit by deposit money banks and other financial institutions as a fraction of GDP for 2004
and is taken from Beck, Demigurc-Kunt, and Levine (2006).
We also construct the variable Capital Intensityk, using data from the NBER-CES manu-
facturing industry database (Bartelsmann and Gray, 2000) at the 4-digit-SIC level. In line with
the literature, capital intensity is defined as the log of total capital expenditure relative to value
added averaged over the period 1993-1997.
37Available online (http://rtais.wto.org/UI/PublicMaintainRTAHome.aspx).38This variable does not include a number of preferential trade agreements under the Enabling Clause that do
not imply the full elimination of trade barriers.39Poor legal institutions may affect vertical integration decisions through their impact on the severity of hold-
up problems. Financial development may affect integration positively if a sufficient level may be necessary forupstream and downstream firms to be able to integrate, or negatively insofar as integration facilitates borrowingand therefore substitutes for poor financial institutions. As Acemoglu, Johnson and Mitton (2009) note, theeffect of each of these variables may be ambiguous when considered separately and there may be more robustpredictions of their combined effect.
18

To control for degree of competition, we construct the variable Concentrationk,c, using infor-
mation on sales of all plants in a given country and sector (including sales by foreign-owned plants
operating in the country-sector). In our main analysis, this variable is the Herfindahl-Hirschman
Index (HHI). We also use the C4 concentration ratio in robustness checks.
To proxy for the degree of product differentiation, we use two dummy variables. The vari-
able Homogeneous1 k is equal to 1 when a sector is homogeneous according to the well-known
classification by Rauch (1999).40 The dummy variable Homogeneous2 k,c is constructed using
information on sector-country-specific import demand elasticities estimated by Broda, Green-
field and Weinstein (2006).41 It takes value 1 whenever the elasticity is above the median for
the country. Broda, Greenfield and Weinstein (2006) show that sectors with more homogeneous
products are characterized by higher import demand elasticities.
In some specifications, we include the variable Sizef , using information on firm-level employ-
ment from WorldBase. Since firm size is clearly endogenous to vertical integration, we always use
predicted size as an instrument, constructed by regressing firm size on sector-country dummies.
Similarly, we construct labor productivity measured as firm sales divided by employment. Again,
we instrument this variable using predicted (with sector-country dummies) labor productivity.
In the regressions on organizational convergence, we also use a number of bilateral variables
from CEPII: bilateral Distance measured as the simple distance between the most populated
cities (in km), dummies for Contiguityc,c′ , for Common Languagec,c′ (official or primary), and
Colonial Relationshipc,c′ (current or past). In some specifications, we also include the variable
Difference GDP c,c′ for the year 2004 constructed from the World Development indicators.
5 Tariffs and vertical integration
In this section, we assess the empirical validity predictions P.1 to P.3 of our theoretical model
concerning the effect of tariffs on vertical integration. To examine the organizational effects of
trade policy, we exploit variation in applied MFN output tariffs across countries and sectors (the
following section exploits time-series variation in the degree of protection faced by firms). We
estimate the following reduced form regression model:
Vf,k,c = α + β1 Tariffk,c + β2Xf,k,c + δk + δc + εf,k,c, (4)
where Xf,k,c is the vector of explanatory variables, δk and δc are sector and country dummies
and εf,k,c is an error term with E(εf,k,c|Xf,k,c, δk, δc) = 0. Thus, the effect of Tariff k,c on Vf,k,c is
40Rauch (1999) classifies products according to three different types: homogeneous goods, which are traded inorganized exchanges; goods that are are not traded in organized exchanges, but for which a published referenceprice can be found; and differentiated goods, which fall under neither of the two previous categories.
41We thank David Weinstein for making these data available to us.
19
causal conditional on covariates.42
We study the determinants of Vf,k,c, the vertical integration index of firm f , with primary
sector k, located in country c, as defined in (3). Since the distribution of vertical integration
indices is rather skewed (see Figure 2), we use log of one plus Vf,k,c as our dependent variable.43
Our main regressor of interest is the variable Tariff k,c, which is the log of one plus the MFN
tariff applied to output in sector k by country c.44 Our model predicts that higher final good
tariffs within an industry should lead firms in that industry to be more vertically integrated. We
thus expect the coefficient β1 to be positive.45
The vector Xf,k,c includes a series of firm- and sector-country-specific controls, that we will
discuss below. We also include sector fixed effects at the 4-digit SIC level (δk), which allows us to
capture cross-industry differences in technological or other determinants of vertical integration.
Finally, we add country fixed effects (δc), which capture cross-country differences in institutional
determinants of vertical integration and also control for country-specific differences in the way
firms are sampled. Given that tariffs vary only at the sector-country level, while the dependent
variable varies at the firm level, we cluster standard errors at the sector-country level.
5.1 Main results
Table 1 reports the results of estimations in which we test the first three predictions of our
theoretical framework. Column (1) presents the results of the basic specification, which includes
only the variable Tariff and country and sector fixed effects. The estimated coefficient for
the tariff is 0.02 (implying a tariff elasticity of vertical integration of the same magnitude) and
strongly significant. Consistent with P.1, higher tariffs lead firms to be more vertically integrated.
Using the relationship between tariff and price elasticities observed in in Section 3, at the mean
tariff of 4.8%, this corresponds to a price elasticity of vertical integration of slightly over 0.4.
As discussed below, when we restrict our analysis to the most competitive sectors, we estimate
larger price elasticities, up to 2.1.
In columns (2) and (3) we verify whether the effect of domestic tariffs on organization is
larger for firms that operate only in the domestic market (for which only this price should
42Observe that around 77 percent of the variance of firm-level vertical integration is explained by sector-countryspecific factors, with the rest being due to between firm differences for given sector-country pairs.
43We have also used the log of the vertical integration index (removing zero observations), obtaining similarresults. There are very few zeros in the dependent variable, so there is no need to perform a Tobit analysis. Allresults not shown due to space considerations are available upon request.
44Tariffs are expressed in ad-valorem terms. In the main specifications, we use log of (one plus the tariff) inorder to be able to include zero tariffs. Although the distribution of tariffs is extremely skewed, the log of (oneplus the tariff) is approximately normally distributed. The estimated tariff elasticity of vertical integration V will
be (1+V )t(1+t)V times the estimate of β1; around the mean values of V and t this factor is only slightly less than one,
so the elasticity is close to the reported coefficient. In alternative specifications, we used log vertical integrationand log tariffs, obtaining very similar results.
45We have also performed a series of estimations including a quadratic term for Tariff k,c, finding no evidenceof a non-monotonic relationship between tariffs and vertical integration.
20
affect the degree of vertical integration). To do so, we interact the variable Tariff k,c with
two dummy variables: Domesticf , which is constructed using information on from WorldBase
and takes the value of 1 if firm f does not report to be an exporter; and Import-competingk,c,
which is constructed using information from Comtrade and indicates whether a firm operates
in one of the 25 percent most import-competing sectors, based on the ratio of a country’s total
imports/exports by sector. We expect the coefficients on the interaction terms to be positive, in
line with the second prediction of our theoretical model.
In column (2) the coefficient for tariffs (which measures the impact of tariffs on vertical
integration for exporters) is positive but insignificantly different from zero. On the other hand,
the coefficient on the interaction term is positive, strongly significant and similar in magnitude
to the baseline specification. These results imply that import tariffs have a significant effect on
vertical integration only for firms that sell exclusively in the domestic market. In column (3), we
use the alternative measure to identify firms that do not export to foreign markets. Again, the
coefficient on the interaction term is positive and significant at the five-percent level, indicating
that import tariffs have a bigger impact on vertical integration decisions for firms that operate
in import-competing sectors.46
In column (4) we verify the third prediction of our model, whereby tariffs should have a
larger impact on vertical integration when the share of imports to which they apply is larger
(implying a bigger effect on domestic prices). To do this, we include the variable MFN sharek,c,
capturing the fraction of imports to which MFN tariffs apply in a given country and sector, as
well as the interaction between this variable and the tariff. The coefficient in the first row now
measures the impact of MFN tariffs when no imports are subject to them (i.e. in a sector in
which a country imports only from regional trading partners). Not surprisingly, this coefficient
is not significant, since in this case MFN tariffs should have no impact on domestic prices. The
interaction term is instead positive and significant at the one-percent level, indicating that the
effect of MFN tariffs on vertical integration is positive and increasing in their effect on import
volumes.
In columns (5)-(8) we repeat the same specifications, adding interaction terms that have been
emphasized in previous studies on vertical integration. In particular, Acemoglu, Johnson and
Mitton (2009) find evidence that contracting costs and financial development have a stronger im-
pact on vertical integration in more capital-intensive sectors. We thus introduce two interaction
terms: one between Capital Intensityk and Financial Development c and the other one between
Capital Intensityk and Legal Qualityc. The coefficient on the first interaction term is positive
and significant, indicating that more capital-intensive sectors are more integrated in countries
with more developed financial markets. The second interaction term has the expected negative
46The negative coefficients of the variables Domesticf and Import-competingk,c can be explained by combiningthe fact that firms operating only domestically tend to be less productive (see Melitz and Redding, forthcoming)and the implication of our theoretical framework that integration is less worthwhile for low productivity firms.
21

sign but it is not significant. In all specifications, our results on the effect of tariffs on firm-level
vertical integration are unaffected.
5.2 Alternative mechanisms
Our theoretical analysis focuses on a perfectly competitive setting, in which firms are price
takers. According to our model, tariff changes should affect organizational choices through their
impact on product prices: higher tariffs should raise prices and thus increase the incentives for
vertical integration.
In reality, tariff changes may also affect vertical integration decisions through their impact
on the degree of competition faced by firms. In particular, Aghion, Griffith and Howitt (2006)
suggest a U-shaped relationship between competition and vertical integration: a small increase in
competition reduces a producer’s incentive to integrate by improving the outside option of non-
integrated suppliers and hence raising their incentive to make relationship-specific investments;
too much competition raises the producer’s incentive to integrate, by allowing non-integrated
suppliers to capture most of the surplus.
To isolate the organizational effects of product prices, in Table 2 we restrict our analysis to
highly competitive sectors, in which tariffs changes should have little or no effect on the degree
of competition. In all specifications, we impose two restrictions to define competitive indus-
tries: i) there are at least 20 domestic firms operating in that country and sector; ii) goods are
homogeneous. Further restrictions are imposed in some specifications, as discussed below. To
distinguish between differentiated and homogeneous sectors, we adopt two alternative method-
ologies: in Panel A, we use the dummy variable Homogeneous1 k, which identifies industries in
which goods are traded in organized exchanges, classified as homogeneous according to Rauch
(1999); in Panel B, we use instead the variable Homogeneous2 k,c, which identifies sectors with
high import demand elasticities according to Broda, Greenfield and Weinstein (2006). Notice
that the sample is much larger in the bottom panel, since the variable Homogeneous2 k,c varies
at the country-sector level.
In the baseline specifications of columns (1)-(2), competitive sectors are identified based
only on the two criteria discussed above. Additional restrictions are imposed in the rest of the
table. Columns (3)-(4) include only sectors with low levels of protection (Tariff k,c < 10%), in
which domestic firms face a high level of foreign competition. In columns (5)-(6) the sample
is restricted to sectors in which some foreign-owned firms have plants in the domestic market,
further increasing the competitive pressure on domestic firms. In columns (7)-(8) we exclude
concentrated sectors, i.e. industries for which the Concentrationk,c index is above 0.1.
In all specifications, the coefficient for Tariff k,c is positive and significant at least at the five-
percent level. The results of Table 2 allow us to identify the price-level effects of tariff changes on
firm boundaries, abstracting from possible competition effects. In line with the first prediction
22

of our theoretical model, these results suggest that higher import tariffs lead domestic firms to
be more vertically integrated, by increasing the price at which they sell their final products.
Table 2 implies that in competitive sectors, the tariff elasticity of vertical integration ranges
between 0.027 and 0.088.47 Recall from Section 3 that the price elasticity of integration is 1+tt
times as large. At the average tariff rate of around 5 percent, the estimates in the upper panel
of Table 2 imply that the price elasticity of vertical integration ranges between 0.6 (columns 1
and 2) and 2.1 (column 8). Price changes can have significant effects on firm boundaries.
The fact that tariffs continue to positively affect vertical integration when restricting the
analysis to homogeneous and highly competitive sectors is consistent with the predictions of our
theoretical model. By contrast, it is difficult to reconcile this result with models in which tariffs
affect firm boundaries through their impact on the degree of competition.
Another possible explanation for our results could be that protected firms have more dispos-
able cash to acquire their suppliers. Notice that this explanation relies on the fact that firms
are credit constrained, so that the amount of cash available matters for takeovers decisions. If
this is the reason behind the positive impact of tariffs on vertical integration, we would expect
the effect to be stronger in sectors and countries in which credit constraints are more severe.
To verify this, we have interacted the tariff variable with the inverse of our measure Financial
Developmentc and with a standard measure of financial dependence, which capture the extent
of financial market imperfections in different countries and sectors.48 We have tried different
specifications (e.g. including the interaction terms separately or together, including a triple in-
teraction between tariffs, financial dependence and the inverse of financial development). In all
cases, the interaction terms were insignificant and the sign and significance of the tariff coefficient
was unaffected, suggesting that cash availability is not the reason behind the positive effect of
tariffs on vertical integration.49
5.3 Additional controls
Our analysis shows that firms are more vertically integrated when import tariffs on their final
product are higher. In this section, we deal with endogeneity concerns, to establish a causal
relationship between tariffs and organization decisions. As argued above, reverse causality is
unlikely to be a problem in our analysis, since there is no reason to believe that firms’ ownership
structures affect applied MFN tariff rates. However, MFN tariffs on final products could be
47These estimates are for the mean level of integration and mean tariff for the subsample in question (see TableA-2 in the Appendix for details). Otherwise expressed, a one standard deviation increase in tariffs implies up to0.12 standard deviations increase in vertical integration.
48Following Rajan and Zingales (1998), we define a firm’s external dependence on finance as capital expendituresminus cash flow from operations divided by capital expenditures. Our sectoral measure of external dependence onfinance is the median firm’s external dependance on finance in a given sector in the U.S in the period 1999-2006,constructed from Compustat.
49The results of these regressions are omitted due to space considerations, but are available upon request.
23

correlated with omitted variables that may also affect vertical integration decisions.
In what follows, we show that our results are robust to controlling for two sets of potential
omitted variables. First, we include measures of domestic input tariffs and foreign import tariffs,
which are correlated with output tariffs and may also affect vertical integration decisions.50 Sec-
ond, we control for firm size, labor productivity and industry concentration, which can affect the
degree of protection through their impact on lobbying pressure (e.g. Mitra, 1999; Bombardini,
2008) and may also be correlated with firms’ ownership structures.
The results of these regressions are presented in Table 3. For comparison, in the first two
columns, we report the results of the baseline specifications. In column (3)-(8), we include
additional controls, first one by one and then simultaneously: Input Tariff k,c, Foreign Tariff k,c,
Concentrationk,c, Sizef (instrumented with sector-country average size) and Labor Productivityf
(instrumented with sector-country average labor productivity). Notice that, in all specifications,
the coefficient on Tariff is positive, highly significant, and very stable. These results indicate
that omitted variables are not a concern and that higher output tariffs lead to more vertical
integration.
Of the additional controls, Concentrationk,c is not significant. This remains true if we use
the C4 concentration ratio rather than HHI to measure the degree of competition. Firm size and
labor productivity have a positive and significant effect on organization, a result that continues
to hold in all additional robustness checks. The fact that more productive firms are more likely to
be integrated is consistent with our theoretical framework: firms with higher levels of exogenous
productivity have more incentives to vertically integrate at any given price.51
The estimated coefficient on input tariffs in Table 3 is positive and significant, though this
result disappears in some of the robustness checks (e.g. Table A-4).
Finally, notice that the coefficient on Foreign Tariff k,c is insignificant in all specifications
and in the additional robustness checks (see Table A-4). This finding is consistent with the
conceptual framework described in Section 3, in which tariffs in foreign markets should have no
effect on domestic prices and thus on vertical integration decisions by domestic firms.52
5.4 Additional robustness checks
In line with the predictions of our theoretical model, our empirical analysis shows that higher
output tariffs lead domestic firms to be more vertically integrated. This effect is stronger for
50The simple correlation of output tariffs with input tariffs is 0.78 and the one with foreign tariffs is 0.31.51We cannot formally test whether the instruments (average firm size and labor productivity in a given country-
sector pair) are valid, since the model is exactly identified. However, we are confident that controlling for predictedfirm size or productivity does not introduce any endogeneity bias, since the coefficient of the variable Tariff isunaffected when including these controls.
52By contrast, this result is hard to reconcile with models of vertical integration choices by multinationals,in which tariffs affect location decisions, and these are inextricably intertwined with boundary decisions. Forexample, in the two-country model by Diez (forthcoming) tariffs in one country should always decrease verticalintegration in the other country, so tariffs faced by exporters should have a negative effect on vertical integration.
24
firms serving only the domestic market — for which organizational choices should depend solely
on domestic prices — and operating in sectors in which a smaller share of imports originate from
regional trading partners — for which MFN tariffs should have a larger impact on domestic
prices.
The results presented in Tables 1-3 already show that the organizational effects of tariffs
are robust to the inclusion of many different controls that account for alternative drivers of
vertical integration decisions. In a series of additional robustness checks, we have verified that
higher tariff on final goods continue to have a positive and significant effect on firm-level vertical
integration when using different econometric methodologies or focusing on alternative samples.
In Table A-4 in the Appendix, we have reproduced all the specifications of Table 3, using
a Poisson quasi-maximum likelihood (PQML) estimator to assess the effect of tariffs on verti-
cal integration. The rationale for this exercise is that Santos Silva and Tenreyro (2006) have
shown that for log-linear models the OLS estimator gives biased estimates in the presence of
heteroscedasticity and have suggested the PQML estimator as an alternative with good statis-
tical properties. Vertical integration is now estimated in levels, which allows for the inclusion of
observations for which the dependent variable is zero, while the explanatory variables are in logs
and can thus be interpreted as elasticities. Standard errors are again clustered at the sector-
country level. Our main result on the impact of output tariffs is unaffected: in all specifications,
the coefficient for the output tariff is always positive and significant. By contrast, domestic
tariffs on inputs and foreign tariffs on final goods have no significant effect on firm-level vertical
integration.
The organizational effects of output tariffs were also unaffected in a series of additional
estimations discussed below. The results of these specifications are omitted from the paper due
to space considerations, but are available upon request.
In our analysis, we have used U.S. input-output tables to capture technological linkages
between sectors. As pointed out before, this methodology actually makes it harder to find
a significant effect of tariffs on vertical integration, by introducing measurement error in the
dependent variable (see footnote 26). In robustness checks, we have verified that our results
continue to hold when restricting the sample to OECD countries, which are more similar to the
United States in terms of technology.53
We have used an alternative measure of vertical integration, constructed based on all the
firm’s activities rather than its primary activity: V f,k,c = 1nf
∑j V jf,k,c, where nf is the number of
industries in which firm f is active. The coefficients for MFN tariffs remained strongly significant
but, not surprisingly, they dropped slightly in magnitude.
In our main regressions, we have cluster standard errors at the sector-country level. Alter-
53Moreover, most MFN tariffs applied by OECD countries in 2004 coincide with the bindings set in the UruguayRound of multilateral trade negotiations (1986-1994), particularly in non-agricultural sectors (Bchir, Jean andLaborde, 2006). Governments have thus no room to adjust them under the pressure of import-competing firms.
25
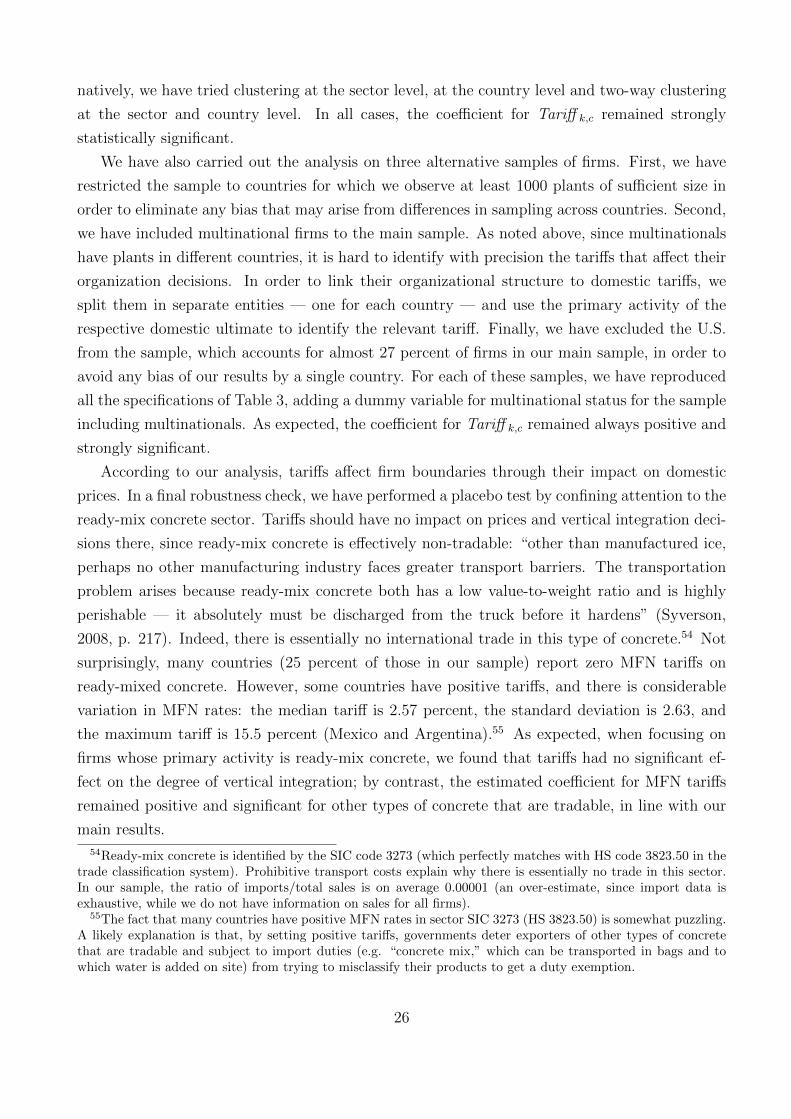
natively, we have tried clustering at the sector level, at the country level and two-way clustering
at the sector and country level. In all cases, the coefficient for Tariff k,c remained strongly
statistically significant.
We have also carried out the analysis on three alternative samples of firms. First, we have
restricted the sample to countries for which we observe at least 1000 plants of sufficient size in
order to eliminate any bias that may arise from differences in sampling across countries. Second,
we have included multinational firms to the main sample. As noted above, since multinationals
have plants in different countries, it is hard to identify with precision the tariffs that affect their
organization decisions. In order to link their organizational structure to domestic tariffs, we
split them in separate entities — one for each country — and use the primary activity of the
respective domestic ultimate to identify the relevant tariff. Finally, we have excluded the U.S.
from the sample, which accounts for almost 27 percent of firms in our main sample, in order to
avoid any bias of our results by a single country. For each of these samples, we have reproduced
all the specifications of Table 3, adding a dummy variable for multinational status for the sample
including multinationals. As expected, the coefficient for Tariff k,c remained always positive and
strongly significant.
According to our analysis, tariffs affect firm boundaries through their impact on domestic
prices. In a final robustness check, we have performed a placebo test by confining attention to the
ready-mix concrete sector. Tariffs should have no impact on prices and vertical integration deci-
sions there, since ready-mix concrete is effectively non-tradable: “other than manufactured ice,
perhaps no other manufacturing industry faces greater transport barriers. The transportation
problem arises because ready-mix concrete both has a low value-to-weight ratio and is highly
perishable — it absolutely must be discharged from the truck before it hardens” (Syverson,
2008, p. 217). Indeed, there is essentially no international trade in this type of concrete.54 Not
surprisingly, many countries (25 percent of those in our sample) report zero MFN tariffs on
ready-mixed concrete. However, some countries have positive tariffs, and there is considerable
variation in MFN rates: the median tariff is 2.57 percent, the standard deviation is 2.63, and
the maximum tariff is 15.5 percent (Mexico and Argentina).55 As expected, when focusing on
firms whose primary activity is ready-mix concrete, we found that tariffs had no significant ef-
fect on the degree of vertical integration; by contrast, the estimated coefficient for MFN tariffs
remained positive and significant for other types of concrete that are tradable, in line with our
main results.
54Ready-mix concrete is identified by the SIC code 3273 (which perfectly matches with HS code 3823.50 in thetrade classification system). Prohibitive transport costs explain why there is essentially no trade in this sector.In our sample, the ratio of imports/total sales is on average 0.00001 (an over-estimate, since import data isexhaustive, while we do not have information on sales for all firms).
55The fact that many countries have positive MFN rates in sector SIC 3273 (HS 3823.50) is somewhat puzzling.A likely explanation is that, by setting positive tariffs, governments deter exporters of other types of concretethat are tradable and subject to import duties (e.g. “concrete mix,” which can be transported in bags and towhich water is added on site) from trying to misclassify their products to get a duty exemption.
26

6 Time-series evidence: China’s accession to the WTO
As noted in the introduction, China’s accession to the WTO in 2001 is arguably the only major
trade liberalization episode that has occurred in the last decade, for which we can use D&B data
to construct vertical integration measures. To be accepted as a member of the WTO, China
agreed to undertake a series of important commitments to better integrate in the world economy
and offer a more predictable environment for trade and foreign investment in accordance with
WTO rules.56 In particular, China had to substantially expand market access to goods from
foreign countries, reducing its import tariffs from an average of 13.3 percent in 2001 to 6.8
percent by the end of the implementation period.57
Our identification strategy is based on the comparison of two periods, a pre-accession one
and a post-accession one, to verify whether firm-level vertical integration was reduced by more in
those sectors that experienced larger tariff cuts. We thus construct vertical integration measures
for all Chinese manufacturing firms that are in the WorldBase dataset for the years 1999 (pre
accession) and 2007 (post accession), following the same procedure described in Section 4.3.
We use 2007 instead of 2004 as the post-accession period because we expect firms’ ownership
structure to react slowly to price changes induced by tariff reductions.
Figure 3 provides the histograms of the MFN tariffs applied by China in 1999 and 2007.
The sample is based on those manufacturing sectors for which we observe firms (with at least
20 employees, excluding multinationals) in both years, consisting of almost 29,000 firms that we
observe in at least one year. For the sectors in this sample, applied tariffs fell from an average 20
to an average of 9.9 percent between 1999 and 2007, with a lot variation across sectors.58 At the
same time, the average level of vertical integration for the sample of firms declined from 0.111
to 0.084.59 Figure 4 visualizes the leftward shift in the distribution of VI indices between 1999
and 2007.
In what follows, we examine whether Chinese firms have adjusted their vertical integration
structure following WTO accession in response to the tariff reductions. To this purpose, we run
two sets of regressions. First, we use a very similar specification as in our main test (4), using
56A detailed list of China’s commitments can be found in its Protocol of Accession. China’s accession impliedfew trade policy changes for other WTO members, since most of them had already been granting it MFN status.
57The implementation period lasted until 2010, though most tariff reductions had to be completed by 2005.58The maximum reduction in tariffs was 415 percent (SIC 3578, Calculating and Accounting Machines), the
median reduction was 51 percent. Only in a few sectors, tariffs did not change or actually increased (e.g. SIC2084 Wines, Brandy and Brandy Spirits).
59One may be concerned that tariff levels and reductions may be endogenous to industry characteristics, forexample because industries with larger firms, more concentrated industries, or industries with more prevalenceof public ownership would lobby for higher initial tariff levels and smaller subsequent tariff reductions. If on theother hand, these sectors are systematically different in terms of vertical integration, one may spuriously obtainnegative correlations between vertical integration and tariffs. In our sample, however, this is not the case: thelevel of tariffs in 1999 is neither significantly correlated with sector-level average firm size, nor with industryconcentration or public ownership in the same year. Moreover, changes in tariffs between 1999 and 2007 are alsonot significantly correlated with the level of the previous variables in 1999.
27
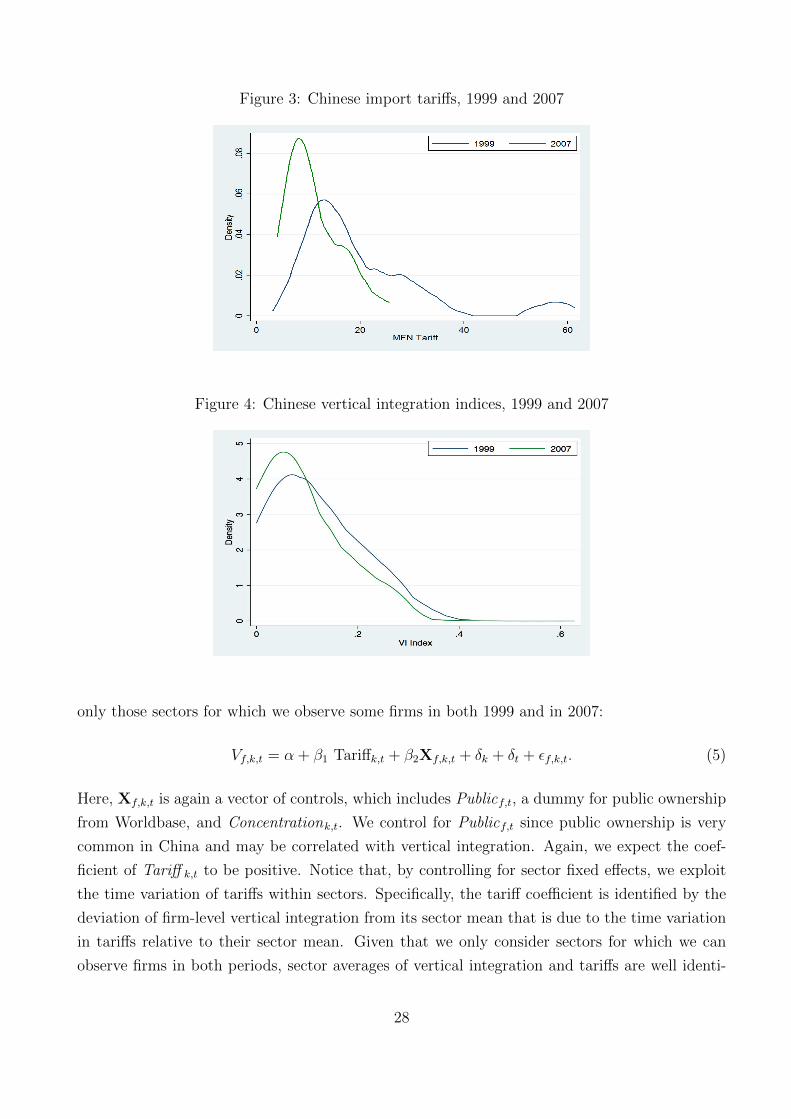
Figure 3: Chinese import tariffs, 1999 and 2007
Figure 4: Chinese vertical integration indices, 1999 and 2007
only those sectors for which we observe some firms in both 1999 and in 2007:
Vf,k,t = α + β1 Tariffk,t + β2Xf,k,t + δk + δt + εf,k,t. (5)
Here, Xf,k,t is again a vector of controls, which includes Publicf,t, a dummy for public ownership
from Worldbase, and Concentrationk,t. We control for Publicf,t since public ownership is very
common in China and may be correlated with vertical integration. Again, we expect the coef-
ficient of Tariff k,t to be positive. Notice that, by controlling for sector fixed effects, we exploit
the time variation of tariffs within sectors. Specifically, the tariff coefficient is identified by the
deviation of firm-level vertical integration from its sector mean that is due to the time variation
in tariffs relative to their sector mean. Given that we only consider sectors for which we can
observe firms in both periods, sector averages of vertical integration and tariffs are well identi-
28
fied. General trends in vertical integration, which may be due to other reforms that occurred in
China over the sample period, are picked up by time dummies.60
In a second set of regressions, we focus on within-firm variation in VI indices. Unfortunately,
the overlap between the firms sampled in 1999 and 2007 is small. Once we exclude multinationals
and plants with less than 20 employees, as we have done in our earlier analysis, there are 145
firms that we can observe in both years. For this set of firms, we take time differences of equation
(5) and estimate
∆Vf,k = α + β1∆ Tariffk + β2∆Xf,k + ∆εf,k. (6)
Again, we expect the coefficient of ∆Tariff k to be positive. In these regressions, we control not
only for changes in firm size, industry concentration and public ownership status, but also for
changes in the degree of state ownership by sector, by including the variable Privatization. This
measures the fraction of government-owned firms that were privatized in a given sector (at the
2-digit industry level) between 1999 and 2004 and is taken from Bai, Lu and Tao (2009).
Table 4 presents the results for both sets of regressions. Columns (1)-(4) reports the results
for the regressions with sector dummies. In all specifications, we find a positive and significant
(at the one percent level) coefficient on the tariff variable, implying larger reductions in vertical
integration in sectors that have experienced larger tariff reductions. The magnitude of the
coefficient is around 0.03, which is slightly larger than our cross-section estimates.61 The dummy
for public ownership is positive and highly significant, indicating that state-owned firms are
more vertically integrated. Finally, the level of industry concentration has no significant effect
on vertical integration.
Turning to the specification in differences, in columns (5)-(10) we obtain similar results.
The coefficient of tariff changes is always positive, significant and similar in magnitude to the
specification with sector dummies. In column (6) we add changes in industry concentration
as control, which leaves the tariff coefficient unaffected. Column (7) adds change in public
ownership status as control, which is insignificant and does not change the tariff coefficient. In
column (8) we alternatively use Privatization as a control, which is again insignificant and also
leaves the coefficient of tariffs unchanged. Finally, in columns (9) and (10), we simultaneously
control for changes in public ownership structure and changes in industry concentration by adding
the concentration measure. While changes in tariffs remain positive and significant, changes in
industry concentration and changes in public ownership have no significant effects.
60In these regressions, unobserved firm-specific effects are assumed to be common for all firms in a given sector.61These estimates may be biased downward due to terms-of-trade effects, insofar as China is a large country
in some importing industries.
29
7 Trade policy and organizational convergence
The purpose of this section is to assess the validity of the last prediction of our model (P.4),
concerning the impact of trade policy on price (and thus organizational) convergence.
To measure organizational convergence, we construct sector-country-specific measures of ver-
tical integration by regressing firm-level vertical integration on industry-sector dummies and
firm size. The estimate for the sector-country dummy gives us a measure of the average level of
vertical integration of industry k in country c, denoted by Vk,c.
We first examine whether cross-country differences in sectoral organizational structure are af-
fected by differences in tariffs. For a given country-pair c, c′, we expect organizational differences
to be smaller in sectors characterized by similar levels of protection.
To verify this, we estimate the following model:
|Vk,c − Vk,c′| = α + β1| Tariffk,c − Tariffk,c′|+ β2|Xk,c −Xk,c′|+ δk + δc,c′ + εk,c,c′ . (7)
The dependent variable is the absolute difference between countries c and c′ in the estimated
vertical integration indices for sector k. All differences are expressed in logs. The main regressor
of interest is the (log of the) absolute difference between these countries’ MFN tariffs in sector
k. The term |Xk,c −Xk,c′ | captures differences in other sector-country characteristics that may
affect the degree of organizational convergence. Note that, since we are including dyad fixed
effects (δc,c′), β1 is identified by the cross-sectoral variation in the tariff difference for a given
country pair. To allow for correlation of the errors between sectors for a given country pair, we
cluster standard errors by dyad.
The results of these regressions are reported in Panel A of Table 5. In column (1), the only
explanatory variable is the log-difference in MFN tariffs. In line with our predictions, we find
that, for a given country-pair differences in sectoral vertical integration indices are significantly
(at the one percent level) larger in sectors in which differences in MFN tariffs are larger. A 100
percent increase in the difference in MFN tariffs leads to a roughly 0.9 percent increase in the
difference in vertical integration indices. The second column adds interactions between Capital
Intensity and differences in Financial Development and Legal Quality. The coefficient on the
difference in MFN tariffs remains relatively unchanged in magnitude and is significant at the 5
percent level.
We next examine the relation between the degree of sectoral organizational convergence and
common membership in a regional trade agreement (RTA). In contrast to the regressions on
tariff differences, a causal interpretation of these regression results is more difficult, since it is
possible that countries that are generally more similar are more likely to form RTAs.
To assess the validity of our final empirical prediction, we explore how RTAs affect the extent
30
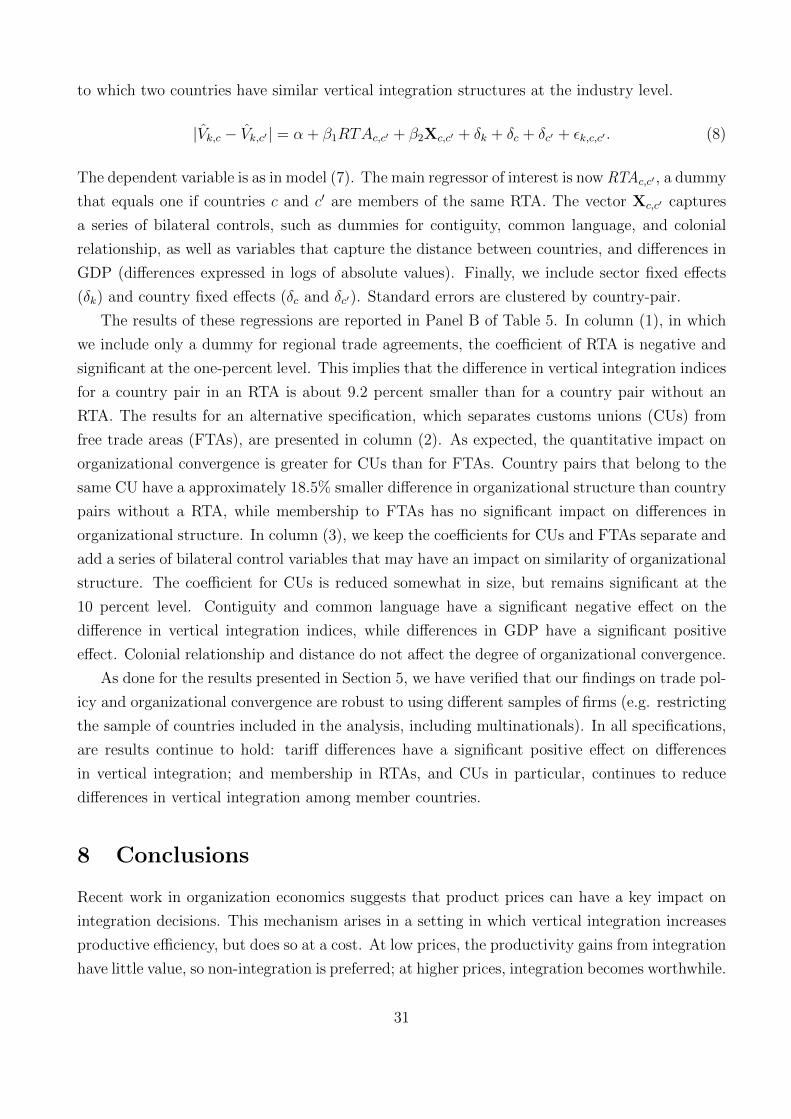
to which two countries have similar vertical integration structures at the industry level.
|Vk,c − Vk,c′| = α + β1RTAc,c′ + β2Xc,c′ + δk + δc + δc′ + εk,c,c′ . (8)
The dependent variable is as in model (7). The main regressor of interest is now RTAc,c′ , a dummy
that equals one if countries c and c′ are members of the same RTA. The vector Xc,c′ captures
a series of bilateral controls, such as dummies for contiguity, common language, and colonial
relationship, as well as variables that capture the distance between countries, and differences in
GDP (differences expressed in logs of absolute values). Finally, we include sector fixed effects
(δk) and country fixed effects (δc and δc′). Standard errors are clustered by country-pair.
The results of these regressions are reported in Panel B of Table 5. In column (1), in which
we include only a dummy for regional trade agreements, the coefficient of RTA is negative and
significant at the one-percent level. This implies that the difference in vertical integration indices
for a country pair in an RTA is about 9.2 percent smaller than for a country pair without an
RTA. The results for an alternative specification, which separates customs unions (CUs) from
free trade areas (FTAs), are presented in column (2). As expected, the quantitative impact on
organizational convergence is greater for CUs than for FTAs. Country pairs that belong to the
same CU have a approximately 18.5% smaller difference in organizational structure than country
pairs without a RTA, while membership to FTAs has no significant impact on differences in
organizational structure. In column (3), we keep the coefficients for CUs and FTAs separate and
add a series of bilateral control variables that may have an impact on similarity of organizational
structure. The coefficient for CUs is reduced somewhat in size, but remains significant at the
10 percent level. Contiguity and common language have a significant negative effect on the
difference in vertical integration indices, while differences in GDP have a significant positive
effect. Colonial relationship and distance do not affect the degree of organizational convergence.
As done for the results presented in Section 5, we have verified that our findings on trade pol-
icy and organizational convergence are robust to using different samples of firms (e.g. restricting
the sample of countries included in the analysis, including multinationals). In all specifications,
are results continue to hold: tariff differences have a significant positive effect on differences
in vertical integration; and membership in RTAs, and CUs in particular, continues to reduce
differences in vertical integration among member countries.
8 Conclusions
Recent work in organization economics suggests that product prices can have a key impact on
integration decisions. This mechanism arises in a setting in which vertical integration increases
productive efficiency, but does so at a cost. At low prices, the productivity gains from integration
have little value, so non-integration is preferred; at higher prices, integration becomes worthwhile.
31
We assess the empirical validity of this mechanism by studying the organizational effects of
trade policy, which provides a source of price variation that is exogenous to firms’ ownership
decisions. To study the impact of prices on firm boundaries, we have constructed firm-level
vertical integration indices for a large set of countries and industries and exploited cross-country
and cross-sectoral differences in applied MFN tariffs, as well as time variation in tariffs resulting
from China’s accession to the WTO. In line with our model’s predictions, we find that higher
tariffs on final goods lead firms to be more vertically integrated; this effect is stronger for non-
exporting firms, which are more sensitive to domestic prices, and for sectors in which domestic
prices are more sensitive to import tariffs.
As we suggested for the cases of horizontal and lateral integration, the basic logic by which
prices influence firms’ vertical integration decisions applies to other “investments,” both orga-
nizational and non-organizational, that increase productive efficiency. But there is a caveat.
While our logic applies directly at the firm level, where the cost of investment is exogenous
to the firm’s choice, at the industry level, there may be countervailing effects. For instance,
consider investment in high-quality management, the supply of which is likely to be relatively
inelastic. When output prices increase, all firms will try to invest in better management. But
in aggregate, given the inelastic supply, there would be little observed effect. By contrast, in
the theories of integration that have inspired this investigation, a significant part of the cost of
integration is private, so these “general equilibrium effects” should matter less. Nevertheless,
subject to availability of appropriate measures, investigating other channels through which prices
can influence productive efficiency is an interesting topic for future research.
Our analysis has implications for antitrust policy. Positive correlations between prices and
vertical integration have been observed in many industries. For example, a 1989 report on the
beer industry by the British Monopolies and Mergers Commission found that retail prices were
higher in integrated than non-integrated pubs (Slade, 1998). Similarly, Hastings (2004) noted
that increases in gasoline prices in California in the 1990’s were associated with increases in the
number of vertically integrated gasoline stations. In these instances, policymakers appear to
have drawn a causal inference from this correlation: vertical integration causes higher prices.62
Though it is still certainly possible that vertical integration may raise prices in some industries
in the manner suggested by foreclosure theories, our analysis suggests that a positive correlation
between vertical integration and prices may also reflect causality working in the opposite way:
higher prices may induce more vertical integration.
62Recent empirical studies have questioned this inference in the context of specific industries, either by providingalternative explanations for a positive correlation between prices and integration (Hastings, 2004) or by showingthat the correlation is actually negative (Hortacsu and Syverson, 2007).
32
References
Acemoglu, D., P. Aghion, R. Griffith, and F. Zilibotti (2010). “Vertical Integration and Tech-
nology: Theory and Evidence,” Journal of European Economic Association, 8, 1-45.
Acemoglu, D., S. Johnson, and T. Mitton (2009). “Determinants of Vertical Integration: Fi-
nancial Development and Contracting Costs,” Journal of Finance 63, 1251-1290.
Aghion, P., R. Griffith, and P. Howitt (2006). “Vertical Integration and Competition,” American
Economic Review Papers and Proceedings 96, 97-102.
Alfaro, L., and A. Charlton (2009). “Intra-Industry Foreign Direct Investment,” American
Economic Review 99, 2096-2119.
Antras, P. (2003). “Firms, Contracts, and Trade Structure,” Quarterly Journal of Economics
118, 1375-1418.
Antras, P., and R. W. Staiger (2012). “Offshoring and the Role of Trade Agreements,” American
Economic Review 102, 3140-3183.
Atalay, E., Hortacsu, A., and C. Syverson (forthcoming). “Vertical Integration and Input
Flows,” American Economic Review.
Bai, C., J. Lu, and Z. Tao (2009). “How Does Privatization Work in China,” Journal of
Comparative Economics 37, 453-470.
Baker, G., and T. Hubbard (2003). “Make Versus Buy in Trucking: Asset Ownership, Job
Design and Information,” American Economic Review 93, 551-572.
(2004). “Contractibility and Asset Ownership: On-Board Computers and Governance in
US Trucking,” Quarterly Journal of Economics 119, 1443-1479.
Bartelsman, E. J., and W. Gray (1996). “The NBER Manufacturing Productivity Database,”
NBER Technical Working Paper 205.
Beck T., A. Demigurc-Kunt, and R. Levine (2006). A New Database on Financial Development
and Structure (1960-2006).
Bchir, H., S. Jean, and D. Laborde (2006). “Binding Overhang and Tariff-Cutting Formulas,”
Review of World Economics 142, 207-232.
Bernard, A. B., S. J. Redding, and P. K. Schott (2011). “Multi-Product Firms and Trade
Liberalization,” Quarterly Journal of Economics, 126, 1271-1318.
Black, S. E., and P. E. Strahan (2002). “Entrepreneurship and Bank Credit Availability,”
Journal of Finance 57, 2807-2833.
Bloom, N., and J. Van Reenen (2007). “Measuring and Explaining Management Practices
Across Firms and Countries,” Quarterly Journal of Economics 122, 1351-1408.
Bloom, N., R. Sadun, and J. Van Reenen (2010) “Does Product Market Competition Lead
Firms to Decentralize?,” American Economic Review 100, 434-438.
33
(2012). “The Organization of Firms Across Countries,” Quarterly Journal of Economics
127, 1663-1705.
Bolton, P. and M. D. Whinston (1993). “Incomplete Contracts, Vertical Integration, and Supply
Assurance,” Review of Economic Studies 60, 121-148.
Bombardini, M. (2008). “Firm Heterogeneity and Lobby Participation,” Journal of International
Economics 75, 329-348.
Bradford, S. (2003). “Paying the Price: Final Goods Protection in OECD Countries,” Review
of Economics and Statistics 85,24-37.
Broda, C., J. Greenfield, and D. Weinstein (2006). “From Groundnuts to Globalization: A
Structural Estimate of Trade and Growth,” NBER Working Paper No. 12512.
Cadot, O., J. de Melo, and M. Olarreaga (1999). “Regional Integration and Lobbying for Tariffs
against Nonmembers,” International Economic Review 40, 635-657.
Caves, R. E. (1975). “Diversification, Foreign Investment and Scale in North American Manu-
facturing Industries,” Canadian Public Policy 2, 274-276.
Coase, R. H. (1937). “The Nature of the Firm,”Economica 4, 386-405.
Conconi, P., Legros, P., and A. F. Newman (2012). “Trade Liberalization and Organizational
Change,” Journal of International Economics 86, 197-208.
Diez, F. J. (forthcoming). “The Asymmetric Effects of Tariffs on Intra-Firm Trade and Off-
shoring Decisions,” Journal of International Economics.
Eckel, C., and P. J. Neary (2010). “Multi-product Firms and Flexible Manufacturing in the
Global Economy,” Review of Economic Studies 77, 188-217.
Fan, J. P. H., and L. H. Lang (2000). “The Measurement of Relatedness: An Application to
Corporate Diversification,” Journal of Business 73, 629-660.
Finger, J. M., H. K. Hall, and D. R. Nelson (1982). “The Political Economy of Administered
Protection,” American Economic Review 72, 452-466.
Forbes, S. J., and M. Lederman (2009). “Adaptation and Vertical Integration in the Airline
Industry,” American Economic Review 99, 1831-1849.
(2011). “Does Vertical Integration Affect Firm Performance? Evidence from the Airline
Industry,” Rand Journal of Economics 41, 765-790.
Grossman S. J., and O. D. Hart (1986). “The Costs and Benefits of Ownership: A Theory of
Vertical and Lateral Integration,” Journal of Political Economy 94, 691-719.
Grossman, G. M., and E. Helpman (1994). “Protection for Sale,”American Economic Review
84, 833-850.
(2002) “Integration Versus Outsourcing In Industry Equilibrium,”Quarterly Journal of
Economics 117, 85-120.
34

Guadalupe, M., and J. Wulf (2012). “The Flattening Firm and Product Market Competition:
The Effect of Trade Liberalization,” American Economic Journal: Applied Economics 4,
105-127.
Harrison, A. E., I. Love, and M. S. McMillian (2004). “Global Capital Flows and Financing
Constraints,” Journal of Development Economics 75, 269-301.
Hart, O. D., and B. R. Holmstrom (2010). “A Theory of Firm Scope,” Quarterly Journal of
Economics 125, 483-513.
Hart, O. D., and J. H. Moore (1990). “Property Rights and the Nature of the Firm,” Journal
of Political Economy 98, 1119-1158.
Hart, O. D., and J. Tirole (1990). “Vertical Integration and Market Foreclosure,” Brookings
Papers on Economic Activity, 205-276.
Hastings, J. (2004). “Vertical Relationships and Competition in Retail Gasoline Markets: Em-
pirical Evidence from Contract Changes in Southern California,” American Economic Re-
view 94, 317-328.
Holmstrom, B. and P. Milgrom (1991). “Multitask Principal-Agent Analyses: Incentive Con-
tracts, Asset Ownership, and Job Design,” Journal of Law, Economics and Organization
7, 24-52.
Hortacsu, A., and C. Syverson (2007). “Cementing Relationships: Vertical Integration, Fore-
closure, Productivity and Prices,” Journal of Political Economy 115, 250-301.
Hummels, D., J. Ishii, and K. Yi (2001). “The Nature and Growth of Vertical Specialization in
World Trade,” Journal of International Economics 54, 75-96.
Johnson, J. P. and D. P. Myatt (2003). “Multiproduct Quality Competition: Fighting Brands
and Product Line Pruning,” American Economic Review 93, 748-774.
Joskow, P. (1987). “Contract Duration and Relationship-Specific Investments: Empirical Evi-
dence from Coal Markets,” American Economic Review 77, 168-185.
Kaufmann, D., A. Kraay, and M. Mastruzzi (2004). “Governance Matters III: Governance
Indicators for 1996, 1998, 2000, and 2002,” World Bank Economic Review 18, 253-287.
Klapper, L., L. Laeven, and R. Rajan (2006). “Entry Regulation as a Barrier to Entrepreneur-
ship,” Journal of Financial Economics 82, 591-629.
Klein, B., R. G. Crawford, and A. Alchian (1978).“Vertical Integration, Appropriable Rents and
the Competitive Contracting Process,” Journal of Law and Economics, 21, 297-326.
Lafontaine, F., and M. Slade (2007). “Vertical Integration and Firm Boundaries: The Evidence”
Journal of Economic Literature, 45, 629-685.
Legros, P., and A. F. Newman (2008). “Competing for Ownership,” Journal of the European
Economic Association 6, 1279-1308.
35

(2013). “A Price Theory of Vertical and Lateral Integration,” Quarterly Journal of
Economics 128, 725-770.
(forthcoming). “Contracts, Ownership, and Industrial Organization: Past and Future,”
Journal of Law Economics and Organization.
McLaren, J. (2000). “Globalization and Vertical Structure,” American Economic Review 90,
1239-1254.
Melitz, M. J. (2003). “The Impact of Trade on Intra-Industry Reallocations and Aggregate
Industry Productivity,” Econometrica 71, 1695-1725.
Melitz, M. J., and S. J. Redding (forthcoming). “Heterogeneous Firms and Trade,” in Handbook
of International Economics.
Mitra, D. (1999). “Endogenous Lobby Formation and Endogenous Protection: A Long-Run
Model of Trade Policy Determination,” American Economic Review 89, 1116-1134.
Nunn, N. (2007). “Relationship-Specificity, Incomplete Contracts, and the Pattern of Trade,”
Quarterly Journal of Economics 122, 569-600.
Ornelas, E., and J. Turner (2008). “Trade Liberalization, Outsourcing, and the Hold Up Prob-
lem,” Journal of International Economics 74, 225-241.
Ordover, J. A., G. Saloner, and S. C. Salop (1990). “Equilibrium Vertical Foreclosure,” American
Economic Review 80, 127-142.
Perry, M. K. (1989). “Vertical Integration: Determinants and Effects,” in R. Schmalensee and
R. Willig (eds.) Handbook of Industrial Organization I, North-Holland.
Rajan, R., and L. Zingales (1998). “Financial Dependence and Growth,” American Economic
Review 88, 559-586.
Ramondo, N., V. Rappoport, and K. Ruh (2012). “Horizontal versus Vertical FDI: Revisiting
Evidence about U.S. Multinationals,” mimeo.
Rauch, J. (1999). “Networks Versus Markets in International Trade,” Journal of International
Economics 48, 7-35.
Riordan, M. H. (2008). “Competitive Effects of Vertical Integration,” in P. Buccirossi (ed.),
Handbook of Antitrust Economics, MIT Press.
Salinger, M. A. (1988). “Vertical Mergers and Vertical Foreclosure,” Quarterly Journal of
Economics 103, 345-356.
Santos-Silva, J. M.C, and S. Tenreyro (2006). “The Log of Gravity,” Review of Economics and
Statistics 88, 641-658.
Syverson, C. (2008). “Markets: Ready-Mixed Concrete,” Journal of Economic Perspectives22,
217-234.
Slade, M. E. (1998). “Beer and the Tie: Did Divestiture of Brewer-Owned Public Houses Lead
to Higher Beer Prices?,” Economic Journal 108, 1-38.
36
Stuckey, J. A. (1983). Vertical Integration and Joint Ventures in the Aluminium Industry.
Harvard University Press, Cambridge, MA.
Topkis, D. (1998). Supermodularity and Complementarity, Princeton University Press.
Vives, X. (2000). Oligopoly Pricing: Old Ideas and New tools, MIT Press.
Williamson, O. (1971). “The Vertical Integration of Production: Market Failure Considera-
tions,” American Economic Review 61, 112-123.
(1975). Markets and Hierarchies: Analysis and Antitrust Implications, Free Press.
Woodruff, C. (2002). “Non-contractible Investments and Vertical Integration in the Mexican
Footwear Industry, International,” Journal of Industrial Organization 20, 1197-1224.
37
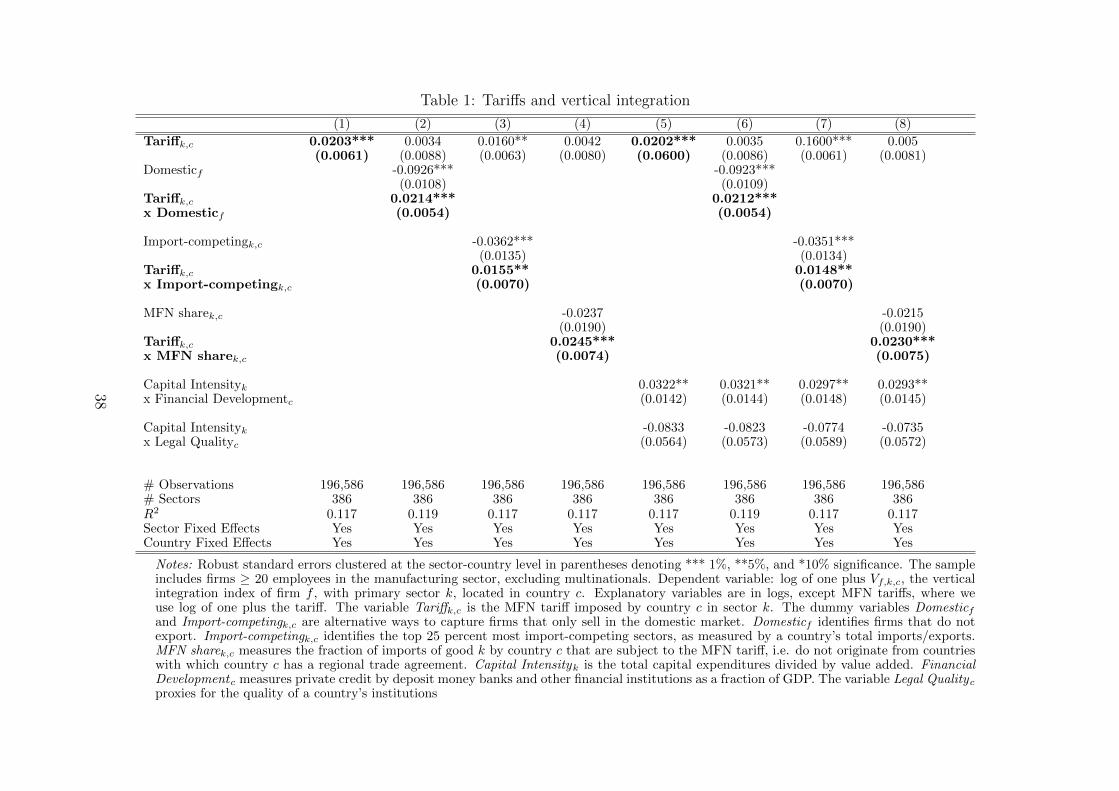
Table 1: Tariffs and vertical integration
(1) (2) (3) (4) (5) (6) (7) (8)
Tariffk,c 0.0203*** 0.0034 0.0160** 0.0042 0.0202*** 0.0035 0.1600*** 0.005(0.0061) (0.0088) (0.0063) (0.0080) (0.0600) (0.0086) (0.0061) (0.0081)
Domesticf -0.0926*** -0.0923***(0.0108) (0.0109)
Tariffk,c 0.0214*** 0.0212***x Domesticf (0.0054) (0.0054)
Import-competingk,c -0.0362*** -0.0351***(0.0135) (0.0134)
Tariffk,c 0.0155** 0.0148**x Import-competingk,c (0.0070) (0.0070)
MFN sharek,c -0.0237 -0.0215(0.0190) (0.0190)
Tariffk,c 0.0245*** 0.0230***x MFN sharek,c (0.0074) (0.0075)
Capital Intensityk 0.0322** 0.0321** 0.0297** 0.0293**x Financial Developmentc (0.0142) (0.0144) (0.0148) (0.0145)
Capital Intensityk -0.0833 -0.0823 -0.0774 -0.0735x Legal Qualityc (0.0564) (0.0573) (0.0589) (0.0572)
# Observations 196,586 196,586 196,586 196,586 196,586 196,586 196,586 196,586# Sectors 386 386 386 386 386 386 386 386R2 0.117 0.119 0.117 0.117 0.117 0.119 0.117 0.117Sector Fixed Effects Yes Yes Yes Yes Yes Yes Yes YesCountry Fixed Effects Yes Yes Yes Yes Yes Yes Yes Yes
Notes: Robust standard errors clustered at the sector-country level in parentheses denoting *** 1%, **5%, and *10% significance. The sampleincludes firms ≥ 20 employees in the manufacturing sector, excluding multinationals. Dependent variable: log of one plus Vf,k,c, the verticalintegration index of firm f , with primary sector k, located in country c. Explanatory variables are in logs, except MFN tariffs, where weuse log of one plus the tariff. The variable Tariffk,c is the MFN tariff imposed by country c in sector k. The dummy variables Domesticfand Import-competingk,c are alternative ways to capture firms that only sell in the domestic market. Domesticf identifies firms that do notexport. Import-competingk,c identifies the top 25 percent most import-competing sectors, as measured by a country’s total imports/exports.MFN sharek,c measures the fraction of imports of good k by country c that are subject to the MFN tariff, i.e. do not originate from countrieswith which country c has a regional trade agreement. Capital Intensityk is the total capital expenditures divided by value added. FinancialDevelopmentc measures private credit by deposit money banks and other financial institutions as a fraction of GDP. The variable Legal Qualityc
proxies for the quality of a country’s institutions
38
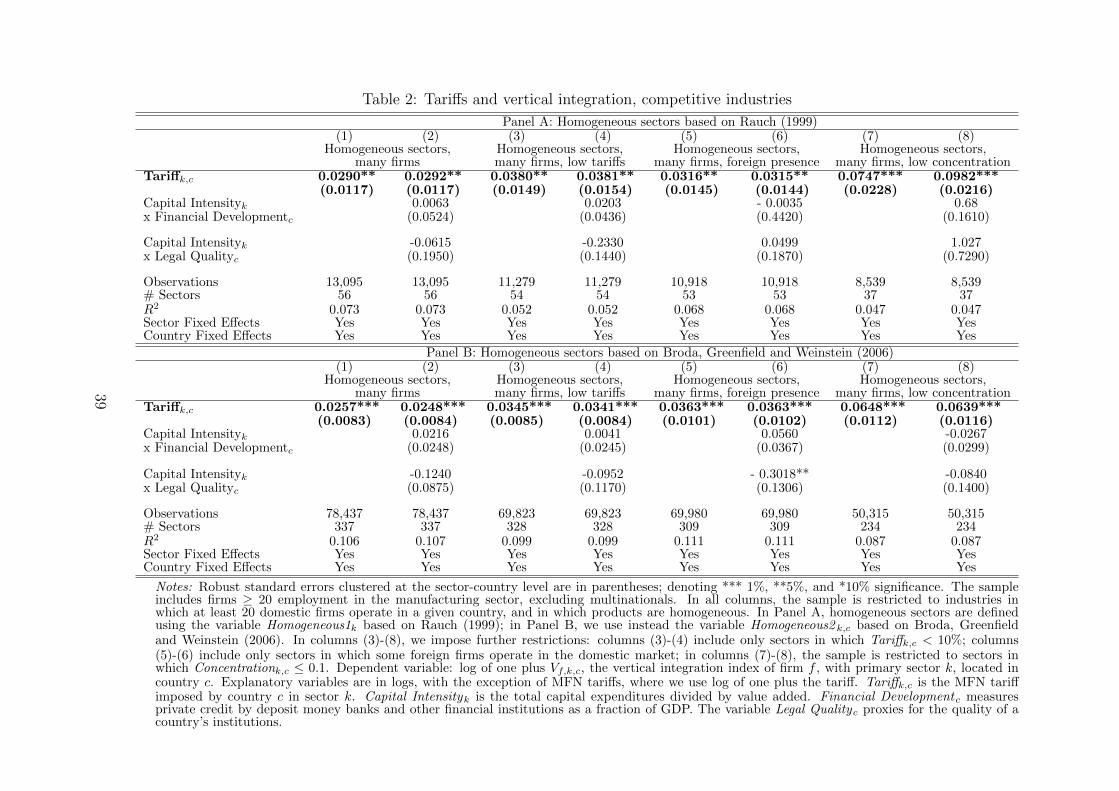
Table 2: Tariffs and vertical integration, competitive industries
Panel A: Homogeneous sectors based on Rauch (1999)(1) (2) (3) (4) (5) (6) (7) (8)
Homogeneous sectors, Homogeneous sectors, Homogeneous sectors, Homogeneous sectors,many firms many firms, low tariffs many firms, foreign presence many firms, low concentration
Tariffk,c 0.0290** 0.0292** 0.0380** 0.0381** 0.0316** 0.0315** 0.0747*** 0.0982***(0.0117) (0.0117) (0.0149) (0.0154) (0.0145) (0.0144) (0.0228) (0.0216)
Capital Intensityk 0.0063 0.0203 - 0.0035 0.68x Financial Developmentc (0.0524) (0.0436) (0.4420) (0.1610)
Capital Intensityk -0.0615 -0.2330 0.0499 1.027x Legal Qualityc (0.1950) (0.1440) (0.1870) (0.7290)
Observations 13,095 13,095 11,279 11,279 10,918 10,918 8,539 8,539# Sectors 56 56 54 54 53 53 37 37R2 0.073 0.073 0.052 0.052 0.068 0.068 0.047 0.047Sector Fixed Effects Yes Yes Yes Yes Yes Yes Yes YesCountry Fixed Effects Yes Yes Yes Yes Yes Yes Yes Yes
Panel B: Homogeneous sectors based on Broda, Greenfield and Weinstein (2006)(1) (2) (3) (4) (5) (6) (7) (8)
Homogeneous sectors, Homogeneous sectors, Homogeneous sectors, Homogeneous sectors,many firms many firms, low tariffs many firms, foreign presence many firms, low concentration
Tariffk,c 0.0257*** 0.0248*** 0.0345*** 0.0341*** 0.0363*** 0.0363*** 0.0648*** 0.0639***(0.0083) (0.0084) (0.0085) (0.0084) (0.0101) (0.0102) (0.0112) (0.0116)
Capital Intensityk 0.0216 0.0041 0.0560 -0.0267x Financial Developmentc (0.0248) (0.0245) (0.0367) (0.0299)
Capital Intensityk -0.1240 -0.0952 - 0.3018** -0.0840x Legal Qualityc (0.0875) (0.1170) (0.1306) (0.1400)
Observations 78,437 78,437 69,823 69,823 69,980 69,980 50,315 50,315# Sectors 337 337 328 328 309 309 234 234R2 0.106 0.107 0.099 0.099 0.111 0.111 0.087 0.087Sector Fixed Effects Yes Yes Yes Yes Yes Yes Yes YesCountry Fixed Effects Yes Yes Yes Yes Yes Yes Yes Yes
Notes: Robust standard errors clustered at the sector-country level are in parentheses; denoting *** 1%, **5%, and *10% significance. The sampleincludes firms ≥ 20 employment in the manufacturing sector, excluding multinationals. In all columns, the sample is restricted to industries inwhich at least 20 domestic firms operate in a given country, and in which products are homogeneous. In Panel A, homogeneous sectors are definedusing the variable Homogeneous1k based on Rauch (1999); in Panel B, we use instead the variable Homogeneous2 k,c based on Broda, Greenfieldand Weinstein (2006). In columns (3)-(8), we impose further restrictions: columns (3)-(4) include only sectors in which Tariffk,c < 10%; columns(5)-(6) include only sectors in which some foreign firms operate in the domestic market; in columns (7)-(8), the sample is restricted to sectors inwhich Concentrationk,c ≤ 0.1. Dependent variable: log of one plus Vf,k,c, the vertical integration index of firm f , with primary sector k, located incountry c. Explanatory variables are in logs, with the exception of MFN tariffs, where we use log of one plus the tariff. Tariffk,c is the MFN tariffimposed by country c in sector k. Capital Intensityk is the total capital expenditures divided by value added. Financial Developmentc measuresprivate credit by deposit money banks and other financial institutions as a fraction of GDP. The variable Legal Qualityc proxies for the quality of acountry’s institutions.
39

Table 3: Tariffs and vertical integration, controlling for possible omitted variables
(1) (2) (3) (4) (5) (6) (7) (8) (9)
Tariffk,c 0.0203*** 0.0202*** 0.0203*** 0.0190*** 0.0214*** 0.0210*** 0.0212*** 0.0198*** 0.0183***(0.0061) (0.0060) (0.0074) (0.0058) (0.0065) (0.0059) (0.0059) (0.0057) (0.0061)
Capital Intensityk 0.0322** 0.0333** 0.0387** 0.0425** 0.0401** 0.0319** 0.0390** 0.0507**x Financial Developmentc (0.0142) (0.0161) (0.0154) (0.0176) (0.0187) (0.0146) (0.0189) (0.0234)
Capital Intensityk -0.0833 -0.0785 -0.100* -0.106 -0.103 -0.0836 -0.0944 -0.127x Legal Qualityc (0.0564) (0.0617) (0.0604) (0.0682) (0.0711) (0.0577) ( 0.0705) (0.0885)
Input Tariffk,c 0.0391*** 0.0330** 0.0464***(0.0142) (0.0141) ( 0.0170)
Foreign Tariffk,c 0.00252 -0.0038 -0.0049(0.0052) (0.0060) (0.0063)
Concentrationk,c 0.0128 0.0141(0.0228) ( 0.0316)
Sizef 0.0352*** 0.0440***(0.0075) (0.0111)
Labor Productivityf 0.0267*** 0.0287***(0.0054) (0.0069)
# Observations 196,586 196,586 154,915 185,630 146,228 178,199 196,586 178,448 133,545# Sectors 386 386 311 386 311 386 386 386 311R2 0.117 0.117 0.119 0.123 0.125 0.117 0.122 0.125 0.132Sector Fixed Effects Yes Yes Yes Yes Yes Yes Yes Yes YesCountry Fixed Effects Yes Yes Yes Yes Yes Yes Yes Yes Yes
Notes: Robust standard errors clustered at the sector-country level are in parentheses denoting *** 1%, **5%, and *10% significance. The sample includesfirms ≥ 20 employment in the manufacturing sector, excluding multinationals. Dependent variable: log of one plus Vf,k,c, the vertical integration index offirm f , with primary sector k, located in country c. Explanatory variables are in logs, with the exception of output tariffs, input tariff and foreign tariff,where we use log of one plus the tariff. Tariffk,c is the MFN tariff imposed by country c in sector k. Capital Intensityk is the total capital expendituresdivided by value added. Financial Developmentc measures private credit by deposit money banks and other financial institutions as a fraction of GDP. Thevariable Legal Qualityc proxies for the quality of a country’s institutions. Import Tariffk,c is the tariff imposed by country c on inputs of good k. ForeignTariffk,c is the tariff faced by firms exporting good k from country c. Concentrationk,c is the HHI of sector k in country c. In columns (7)-(9) we report 2SLSestimates. Sizef measures firm size (instrumented with employment predicted with sector-country dummies). Labor productivityf is measured as sales perworker (instrumented with sales per worker predicted with sector-country dummies).
40
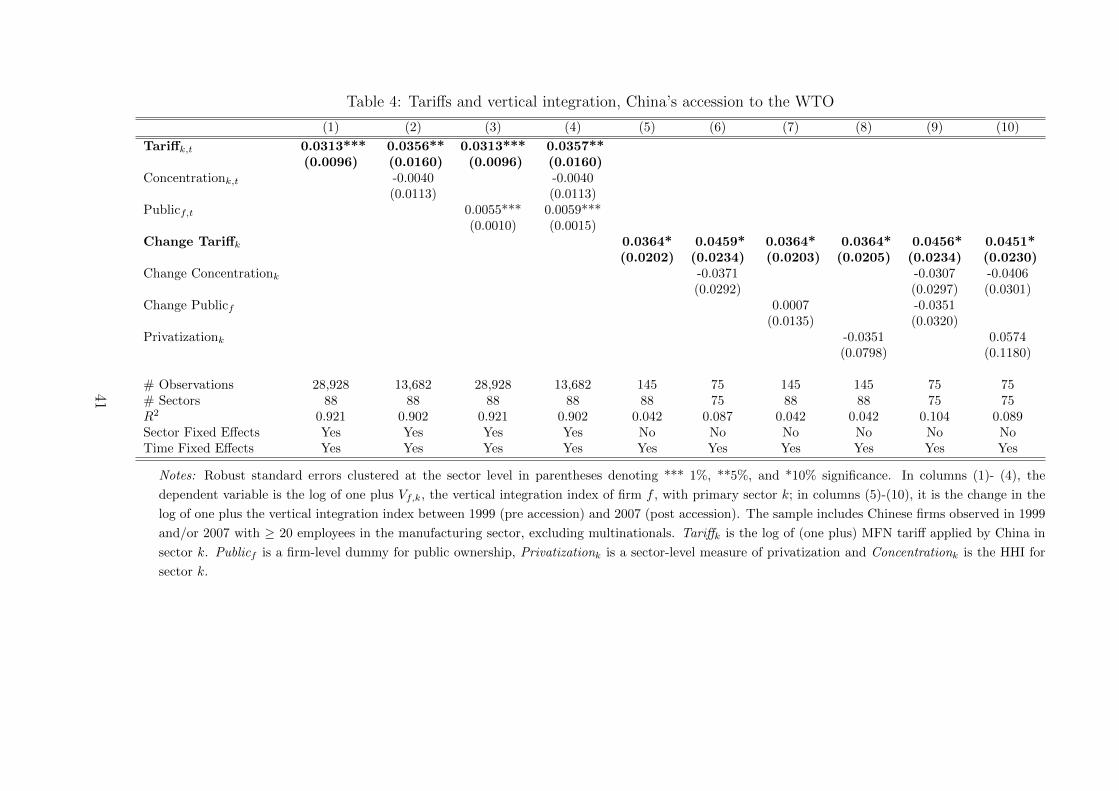
Table 4: Tariffs and vertical integration, China’s accession to the WTO
(1) (2) (3) (4) (5) (6) (7) (8) (9) (10)
Tariffk,t 0.0313*** 0.0356** 0.0313*** 0.0357**(0.0096) (0.0160) (0.0096) (0.0160)
Concentrationk,t -0.0040 -0.0040(0.0113) (0.0113)
Publicf,t 0.0055*** 0.0059***(0.0010) (0.0015)
Change Tariffk 0.0364* 0.0459* 0.0364* 0.0364* 0.0456* 0.0451*(0.0202) (0.0234) (0.0203) (0.0205) (0.0234) (0.0230)
Change Concentrationk -0.0371 -0.0307 -0.0406(0.0292) (0.0297) (0.0301)
Change Publicf 0.0007 -0.0351(0.0135) (0.0320)
Privatizationk -0.0351 0.0574(0.0798) (0.1180)
# Observations 28,928 13,682 28,928 13,682 145 75 145 145 75 75# Sectors 88 88 88 88 88 75 88 88 75 75R2 0.921 0.902 0.921 0.902 0.042 0.087 0.042 0.042 0.104 0.089Sector Fixed Effects Yes Yes Yes Yes No No No No No NoTime Fixed Effects Yes Yes Yes Yes Yes Yes Yes Yes Yes Yes
Notes: Robust standard errors clustered at the sector level in parentheses denoting *** 1%, **5%, and *10% significance. In columns (1)- (4), the
dependent variable is the log of one plus Vf,k, the vertical integration index of firm f , with primary sector k; in columns (5)-(10), it is the change in the
log of one plus the vertical integration index between 1999 (pre accession) and 2007 (post accession). The sample includes Chinese firms observed in 1999
and/or 2007 with ≥ 20 employees in the manufacturing sector, excluding multinationals. Tariffk is the log of (one plus) MFN tariff applied by China in
sector k. Publicf is a firm-level dummy for public ownership, Privatizationk is a sector-level measure of privatization and Concentrationk is the HHI for
sector k.
41

Table 5: Trade policy and organizational convergence
Panel A: Tariff differences
(1) (2)Difference Tariffsk,c,c′ 0.0089*** 0.0086**
(0.0034) (0.0037)Capital Intensityk 0.0020x Difference Financial Developmentc,c′ (0.0066)
Capital Intensityk 0.0419***x Difference Legal Qualityk,c,c′ (0.0062)
# Observations 212,770 171,908# Country pairs 80 80R2 0.164 0.164Sector and Country-pair Fixed Effects Yes Yes
Panel B: Regional Trade Agreements
(1) (2) (3)RTAc,c′ -0.0921***
(0.0235)Customs Unionc,c′ -0.185*** -0.0760*
(0.0376) (0.046)Free Trade Areac,c′ -0.0404 0.0203
(0.0266) (0.0264)
Distancec,c′ 0.0188(0.0146)
Contiguityc,c′ -0.196***(0.0754)
Common Languagec,c′ -0.119***(0.0313)
Colonial Relationshipc,c′ 0.0663(0.0421)
Difference GDPc,c′ 0.0389***(0.0087)
# Observations 299,649 299,649 299,649# Country pairs 101 101 101R2 0.109 0.109 0.111Sector and Country Fixed Effects Yes Yes Yes
Notes: Robust standard errors clustered at the country-pair level in parentheses
denoting *** 1%, **5%, and *10% significance. Dependent variable: log of (one
plus) the absolute difference between countries c and c′ in the estimated ver-
tical integration index of firms with primary sector k. The variable Difference
Tariffsk,c,c′ is the difference between the MFN tariff imposed by country c and
c′ in sector k. Capital Intensityk is the total capital expenditures divided by
value added. Difference Financial Developmentcc′ measures differences in pri-
vate credit by deposit money banks and other financial institutions as a fraction
of GDP. The variable Difference in Legal Qualityc proxies differences in the qual-
ity of institutions across between two countries. The variables Contiguityc,c′ ,
Colonial Relationshipc,c′ , Common Languagec,c′ and Difference GDPc,c′ capture
bilateral geographical, cultural and economic linkages.
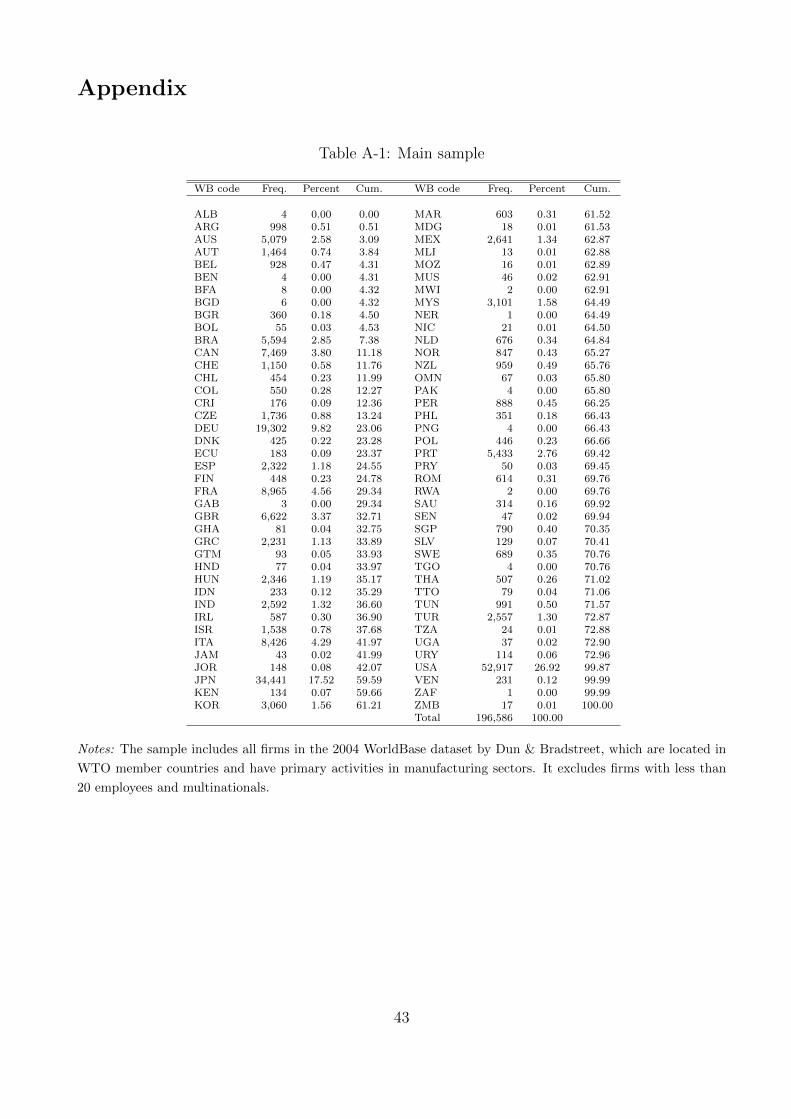
Appendix
Table A-1: Main sample
WB code Freq. Percent Cum. WB code Freq. Percent Cum.
ALB 4 0.00 0.00 MAR 603 0.31 61.52ARG 998 0.51 0.51 MDG 18 0.01 61.53AUS 5,079 2.58 3.09 MEX 2,641 1.34 62.87AUT 1,464 0.74 3.84 MLI 13 0.01 62.88BEL 928 0.47 4.31 MOZ 16 0.01 62.89BEN 4 0.00 4.31 MUS 46 0.02 62.91BFA 8 0.00 4.32 MWI 2 0.00 62.91BGD 6 0.00 4.32 MYS 3,101 1.58 64.49BGR 360 0.18 4.50 NER 1 0.00 64.49BOL 55 0.03 4.53 NIC 21 0.01 64.50BRA 5,594 2.85 7.38 NLD 676 0.34 64.84CAN 7,469 3.80 11.18 NOR 847 0.43 65.27CHE 1,150 0.58 11.76 NZL 959 0.49 65.76CHL 454 0.23 11.99 OMN 67 0.03 65.80COL 550 0.28 12.27 PAK 4 0.00 65.80CRI 176 0.09 12.36 PER 888 0.45 66.25CZE 1,736 0.88 13.24 PHL 351 0.18 66.43DEU 19,302 9.82 23.06 PNG 4 0.00 66.43DNK 425 0.22 23.28 POL 446 0.23 66.66ECU 183 0.09 23.37 PRT 5,433 2.76 69.42ESP 2,322 1.18 24.55 PRY 50 0.03 69.45FIN 448 0.23 24.78 ROM 614 0.31 69.76FRA 8,965 4.56 29.34 RWA 2 0.00 69.76GAB 3 0.00 29.34 SAU 314 0.16 69.92GBR 6,622 3.37 32.71 SEN 47 0.02 69.94GHA 81 0.04 32.75 SGP 790 0.40 70.35GRC 2,231 1.13 33.89 SLV 129 0.07 70.41GTM 93 0.05 33.93 SWE 689 0.35 70.76HND 77 0.04 33.97 TGO 4 0.00 70.76HUN 2,346 1.19 35.17 THA 507 0.26 71.02IDN 233 0.12 35.29 TTO 79 0.04 71.06IND 2,592 1.32 36.60 TUN 991 0.50 71.57IRL 587 0.30 36.90 TUR 2,557 1.30 72.87ISR 1,538 0.78 37.68 TZA 24 0.01 72.88ITA 8,426 4.29 41.97 UGA 37 0.02 72.90JAM 43 0.02 41.99 URY 114 0.06 72.96JOR 148 0.08 42.07 USA 52,917 26.92 99.87JPN 34,441 17.52 59.59 VEN 231 0.12 99.99KEN 134 0.07 59.66 ZAF 1 0.00 99.99KOR 3,060 1.56 61.21 ZMB 17 0.01 100.00
Total 196,586 100.00
Notes: The sample includes all firms in the 2004 WorldBase dataset by Dun & Bradstreet, which are located in
WTO member countries and have primary activities in manufacturing sectors. It excludes firms with less than
20 employees and multinationals.
43
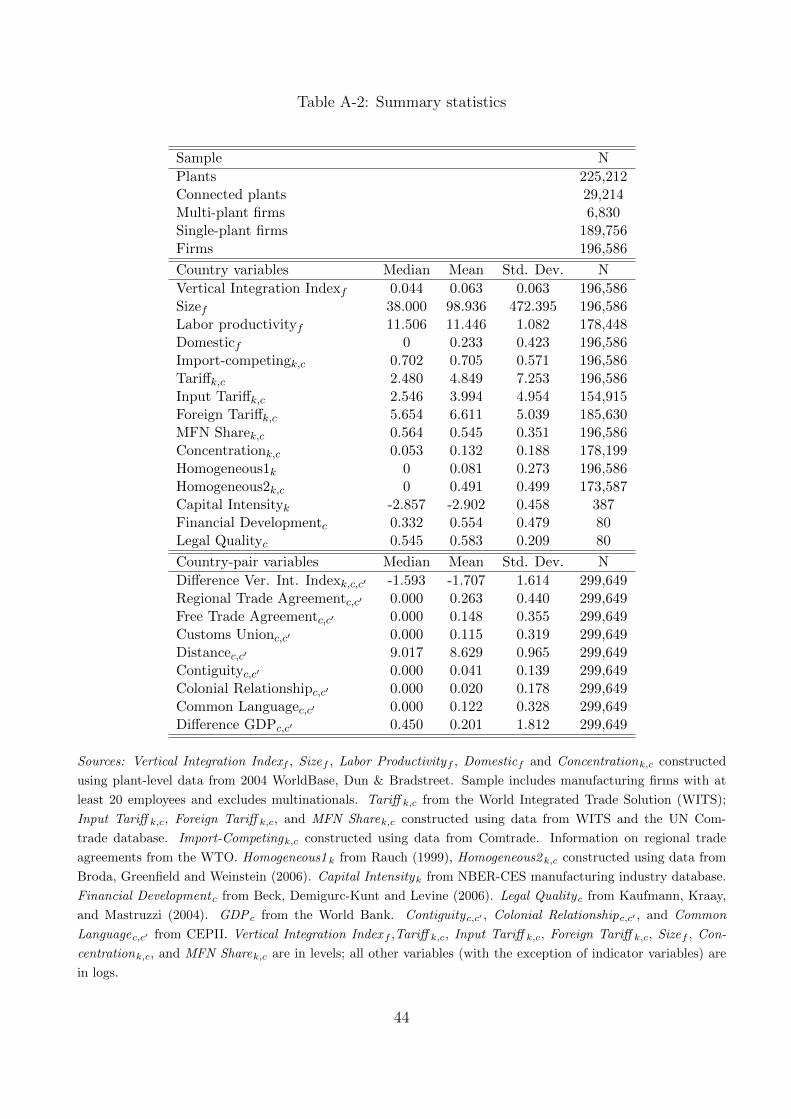
Table A-2: Summary statistics
Sample N
Plants 225,212Connected plants 29,214Multi-plant firms 6,830Single-plant firms 189,756Firms 196,586
Country variables Median Mean Std. Dev. N
Vertical Integration Indexf 0.044 0.063 0.063 196,586Sizef 38.000 98.936 472.395 196,586Labor productivityf 11.506 11.446 1.082 178,448Domesticf 0 0.233 0.423 196,586Import-competingk,c 0.702 0.705 0.571 196,586Tariffk,c 2.480 4.849 7.253 196,586Input Tariffk,c 2.546 3.994 4.954 154,915Foreign Tariffk,c 5.654 6.611 5.039 185,630MFN Sharek,c 0.564 0.545 0.351 196,586Concentrationk,c 0.053 0.132 0.188 178,199Homogeneous1k 0 0.081 0.273 196,586Homogeneous2k,c 0 0.491 0.499 173,587Capital Intensityk -2.857 -2.902 0.458 387Financial Developmentc 0.332 0.554 0.479 80Legal Qualityc 0.545 0.583 0.209 80
Country-pair variables Median Mean Std. Dev. N
Difference Ver. Int. Indexk,c,c′ -1.593 -1.707 1.614 299,649Regional Trade Agreementc,c′ 0.000 0.263 0.440 299,649Free Trade Agreementc,c′ 0.000 0.148 0.355 299,649Customs Unionc,c′ 0.000 0.115 0.319 299,649Distancec,c′ 9.017 8.629 0.965 299,649Contiguityc,c′ 0.000 0.041 0.139 299,649Colonial Relationshipc,c′ 0.000 0.020 0.178 299,649Common Languagec,c′ 0.000 0.122 0.328 299,649Difference GDPc,c′ 0.450 0.201 1.812 299,649
Sources: Vertical Integration Indexf , Sizef , Labor Productivityf , Domesticf and Concentrationk,c constructed
using plant-level data from 2004 WorldBase, Dun & Bradstreet. Sample includes manufacturing firms with at
least 20 employees and excludes multinationals. Tariff k,c from the World Integrated Trade Solution (WITS);
Input Tariff k,c, Foreign Tariff k,c, and MFN Sharek,c constructed using data from WITS and the UN Com-
trade database. Import-Competingk,c constructed using data from Comtrade. Information on regional trade
agreements from the WTO. Homogeneous1 k from Rauch (1999), Homogeneous2 k,c constructed using data from
Broda, Greenfield and Weinstein (2006). Capital Intensityk from NBER-CES manufacturing industry database.
Financial Developmentc from Beck, Demigurc-Kunt and Levine (2006). Legal Qualityc from Kaufmann, Kraay,
and Mastruzzi (2004). GDPc from the World Bank. Contiguityc,c′ , Colonial Relationshipc,c′ , and Common
Languagec,c′ from CEPII. Vertical Integration Index f ,Tariff k,c, Input Tariff k,c, Foreign Tariff k,c, Sizef , Con-
centrationk,c, and MFN Sharek,c are in levels; all other variables (with the exception of indicator variables) are
in logs.
44
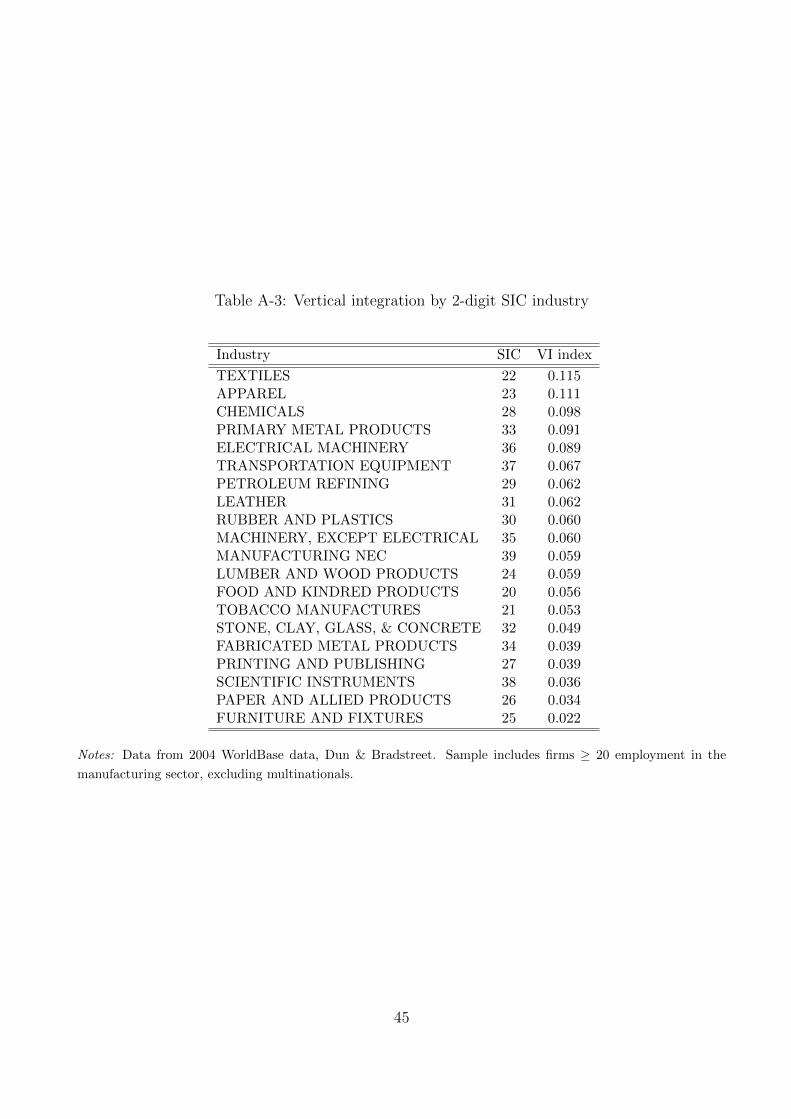
Table A-3: Vertical integration by 2-digit SIC industry
Industry SIC VI index
TEXTILES 22 0.115APPAREL 23 0.111CHEMICALS 28 0.098PRIMARY METAL PRODUCTS 33 0.091ELECTRICAL MACHINERY 36 0.089TRANSPORTATION EQUIPMENT 37 0.067PETROLEUM REFINING 29 0.062LEATHER 31 0.062RUBBER AND PLASTICS 30 0.060MACHINERY, EXCEPT ELECTRICAL 35 0.060MANUFACTURING NEC 39 0.059LUMBER AND WOOD PRODUCTS 24 0.059FOOD AND KINDRED PRODUCTS 20 0.056TOBACCO MANUFACTURES 21 0.053STONE, CLAY, GLASS, & CONCRETE 32 0.049FABRICATED METAL PRODUCTS 34 0.039PRINTING AND PUBLISHING 27 0.039SCIENTIFIC INSTRUMENTS 38 0.036PAPER AND ALLIED PRODUCTS 26 0.034FURNITURE AND FIXTURES 25 0.022
Notes: Data from 2004 WorldBase data, Dun & Bradstreet. Sample includes firms ≥ 20 employment in the
manufacturing sector, excluding multinationals.
45
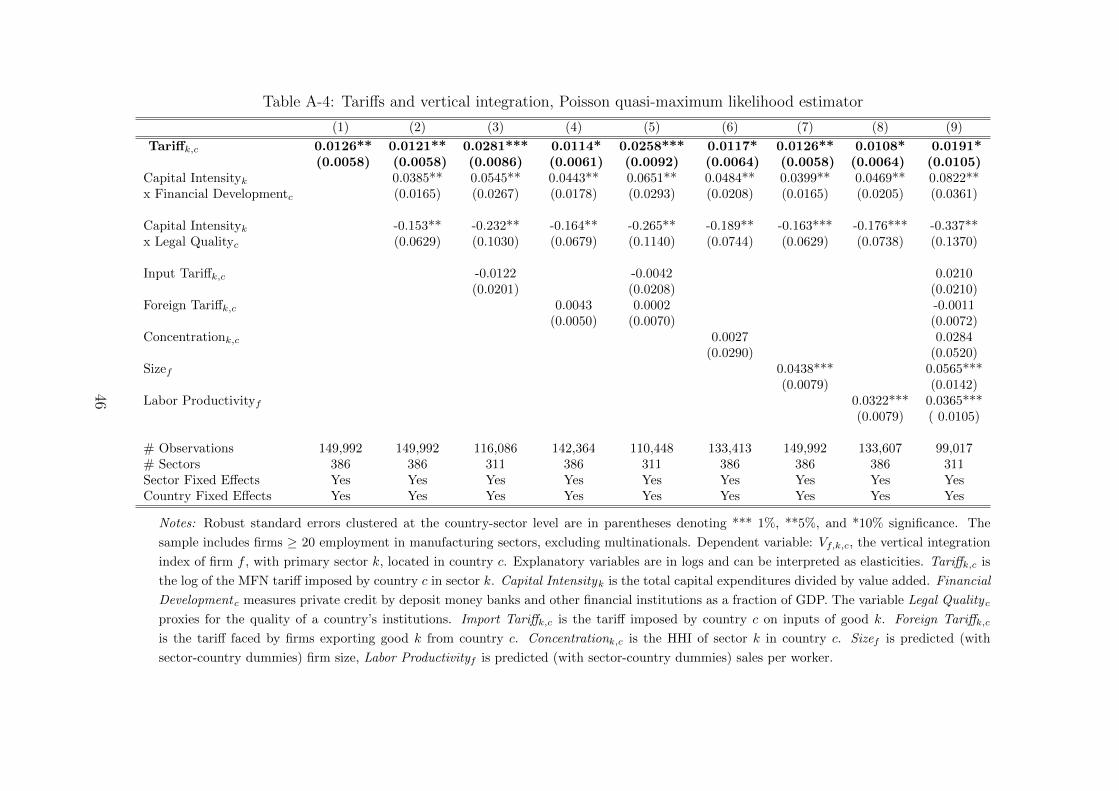
Table A-4: Tariffs and vertical integration, Poisson quasi-maximum likelihood estimator
(1) (2) (3) (4) (5) (6) (7) (8) (9)
Tariffk,c 0.0126** 0.0121** 0.0281*** 0.0114* 0.0258*** 0.0117* 0.0126** 0.0108* 0.0191*(0.0058) (0.0058) (0.0086) (0.0061) (0.0092) (0.0064) (0.0058) (0.0064) (0.0105)
Capital Intensityk 0.0385** 0.0545** 0.0443** 0.0651** 0.0484** 0.0399** 0.0469** 0.0822**x Financial Developmentc (0.0165) (0.0267) (0.0178) (0.0293) (0.0208) (0.0165) (0.0205) (0.0361)
Capital Intensityk -0.153** -0.232** -0.164** -0.265** -0.189** -0.163*** -0.176*** -0.337**x Legal Qualityc (0.0629) (0.1030) (0.0679) (0.1140) (0.0744) (0.0629) (0.0738) (0.1370)
Input Tariffk,c -0.0122 -0.0042 0.0210(0.0201) (0.0208) (0.0210)
Foreign Tariffk,c 0.0043 0.0002 -0.0011(0.0050) (0.0070) (0.0072)
Concentrationk,c 0.0027 0.0284(0.0290) (0.0520)
Sizef 0.0438*** 0.0565***(0.0079) (0.0142)
Labor Productivityf 0.0322*** 0.0365***(0.0079) ( 0.0105)
# Observations 149,992 149,992 116,086 142,364 110,448 133,413 149,992 133,607 99,017# Sectors 386 386 311 386 311 386 386 386 311Sector Fixed Effects Yes Yes Yes Yes Yes Yes Yes Yes YesCountry Fixed Effects Yes Yes Yes Yes Yes Yes Yes Yes Yes
Notes: Robust standard errors clustered at the country-sector level are in parentheses denoting *** 1%, **5%, and *10% significance. The
sample includes firms ≥ 20 employment in manufacturing sectors, excluding multinationals. Dependent variable: Vf,k,c, the vertical integration
index of firm f , with primary sector k, located in country c. Explanatory variables are in logs and can be interpreted as elasticities. Tariffk,c is
the log of the MFN tariff imposed by country c in sector k. Capital Intensityk is the total capital expenditures divided by value added. Financial
Developmentc measures private credit by deposit money banks and other financial institutions as a fraction of GDP. The variable Legal Qualityc
proxies for the quality of a country’s institutions. Import Tariffk,c is the tariff imposed by country c on inputs of good k. Foreign Tariffk,c
is the tariff faced by firms exporting good k from country c. Concentrationk,c is the HHI of sector k in country c. Sizef is predicted (with
sector-country dummies) firm size, Labor Productivityf is predicted (with sector-country dummies) sales per worker.
46