Do Postsecondary Graduates Land High-skilled Jobs? · attainment (the highest level completed and...
58
Analytical Studies Branch Research Paper Series Catalogue no. 11F0019M — No. 388 ISSN 1205-9153 ISBN 978-0-660-07170-1 by Marc Frenette and Kristyn Frank Do Postsecondary Graduates Land High-skilled Jobs? Release date: January 24, 2017
Transcript of Do Postsecondary Graduates Land High-skilled Jobs? · attainment (the highest level completed and...
Analytical Studies Branch Research Paper Series
Catalogue no. 11F0019M — No. 388 ISSN 1205-9153ISBN 978-0-660-07170-1
by Marc Frenette and Kristyn Frank
Do Postsecondary Graduates Land High-skilled Jobs?
Release date: January 24, 2017

Standard table symbolsThe following symbols are used in Statistics Canada publications:
. not available for any reference period
.. not available for a specific reference period
... not applicable 0 true zero or a value rounded to zero 0s value rounded to 0 (zero) where there is a meaningful distinction between true zero and the value that was rounded p preliminary r revised x suppressed to meet the confidentiality requirements of the Statistics Act E use with caution F too unreliable to be published * significantly different from reference category (p < 0.05)
How to obtain more informationFor information about this product or the wide range of services and data available from Statistics Canada, visit our website, www.statcan.gc.ca. You can also contact us by email at [email protected] telephone, from Monday to Friday, 8:30 a.m. to 4:30 p.m., at the following numbers:
• Statistical Information Service 1-800-263-1136 • National telecommunications device for the hearing impaired 1-800-363-7629 • Fax line 1-514-283-9350
Depository Services Program
• Inquiries line 1-800-635-7943 • Fax line 1-800-565-7757
Published by authority of the Minister responsible for Statistics Canada
© Minister of Industry, 2017
All rights reserved. Use of this publication is governed by the Statistics Canada Open Licence Agreement.
An HTML version is also available.
Cette publication est aussi disponible en français.
Note of appreciationCanada owes the success of its statistical system to a long-standing partnership between Statistics Canada, the citizens of Canada, its businesses, governments and other institutions. Accurate and timely statistical information could not be produced without their continued co-operation and goodwill.
Standards of service to the publicStatistics Canada is committed to serving its clients in a prompt, reliable and courteous manner. To this end, Statistics Canada has developed standards of service that its employees observe. To obtain a copy of these service standards, please contact Statistics Canada toll-free at 1-800-263-1136. The service standards are also published on www.statcan.gc.ca under “Contact us” > “Standards of service to the public.”

Do Postsecondary Graduates Land High-skilled Jobs?
by
Marc Frenette and Kristyn Frank
Social Analysis and Modelling Division Statistics Canada
11F0019M No. 388
ISSN 1205-9153
ISBN 978-0-660-07170-1
January 2017
Analytical Studies Branch Research Paper Series
The Analytical Studies Branch Research Paper Series provides for the circulation, on a pre-publication basis, of research conducted by Analytical Studies Branch staff, visiting fellows, and academic associates. The Analytical Studies Branch Research Paper Series is intended to stimulate discussion on a variety of topics, including labour, business firm dynamics, pensions, agriculture, mortality, language, immigration, and statistical computing and simulation. Readers of the series are encouraged to contact the authors with their comments and suggestions.
Papers in the series are distributed to research institutes, and specialty libraries. These papers can be accessed for free at www.statcan.gc.ca.

Analytical Studies — Research Paper Series - 4 - Statistics Canada – Catalogue no. 11F0019M, no. 388
Table of contents
Abstract ........................................................................................................................................................ 5
Executive summary .................................................................................................................................... 6
1 Introduction ......................................................................................................................................... 7
2 Methodology ........................................................................................................................................ 8
3 Results ............................................................................................................................................... 12
4 Conclusion ......................................................................................................................................... 26
Appendix A Additional results tables and charts ............................................................................... 27
Appendix B O*NET definitions of skills ............................................................................................... 54
Appendix C Examples of job tasks to determine skill-level ratings ................................................. 56
References ................................................................................................................................................. 58

Analytical Studies — Research Paper Series - 5 - Statistics Canada – Catalogue no. 11F0019M, no. 388
Abstract
This study examines the relationship between occupational skill requirements and educational attainment (the highest level completed and the field of study). Using the 2011 National Household Survey matched to data from the Occupational Information Network (which contains information on occupational skill requirements), the study uncovers many new findings on the skill requirements of jobs held by Canadians aged 25 to 34 with different educational qualifications.
First, skill-level requirements in all areas generally increase with higher educational levels. There are three notable exceptions to this trend, however: requirements for technical operation and maintenance skills do not generally increase with more schooling; doctoral graduates require considerably less resource management skills than other university graduates; and professional-degree holders have jobs that require lower mathematics skills than other university graduates, although this is entirely because of law graduates. Moreover, skill requirements are almost always higher among bachelor’s degree holders and college graduates of specific disciplines, compared with high school graduates.
Second, skill requirements vary considerably by field of study. For example, bachelor’s degree holders in architecture, engineering, and related technologies generally work in multidimensional jobs requiring diverse, high-level skills. In fact, these graduates rank at the top or very close to the top in eight of the nine skills examined. In contrast, bachelor’s degree holders in three fields (education; visual and performing arts, and communications technologies; and humanities) generally rank lower than other bachelor’s degree holders in most skills examined. However, the skill requirements of college graduates and bachelor’s degree holders are very different across fields of study. While skill requirements are almost always higher among bachelor’s degree holders than among college graduates from the same discipline, the relative ranking of disciplines tends to differ for each level.
Finally, there are considerably more gender differences among college graduates than among bachelor’s degree holders with regard to skill requirements by field of study.
Keywords: postsecondary education, occupational skills

Analytical Studies — Research Paper Series - 6 - Statistics Canada – Catalogue no. 11F0019M, no. 388
Executive summary
This study examines the skills required for the jobs held by young Canadians, with a focus on postsecondary graduates. The information on occupational skill requirements is drawn from the Occupational Information Network (O*NET), which was developed in the United States. These data have been matched at the occupational level to the 2011 National Household Survey (NHS) in Canada.
In total, 495 of the 500 National Occupational Classification codes were assigned information on skill requirements in the 2011 NHS. This information consisted of the skill level and the importance of the skill for each occupation, obtained from job incumbents and rated by occupational analysts. This study focuses primarily on the skill level. In O*NET, 35 skill areas are available, but these were reduced to 9 by factor analysis to simplify the analysis. These skill areas include reading comprehension; writing; mathematics; science; process, complex problem solving, and systems; social; technical operation and maintenance; technical design and analysis; and resource management.
The main analytical sample consists of men and women between the ages of 25 and 34, to focus on young graduates who likely obtained their credentials in recent years. In addition, only individuals who worked 30 or more hours as a paid employee in a defined occupation during the census reference week are retained. These sample restrictions result in a final sample of 247,781 men and 196,302 women.
The study uncovers many new findings on the skill requirements of jobs held by Canadians with different schooling backgrounds.
First, skill-level requirements in all areas generally increase with higher educational levels. There are three notable exceptions to this trend, however: requirements for technical operation and maintenance skills do not generally increase with more schooling, doctoral graduates require considerably less resource management skills than other university graduates, and professional-degree holders have jobs that require lower mathematics skills than other university graduates, although this is entirely because of law graduates. Moreover, skill requirements are almost always higher among bachelor’s degree holders and college graduates of specific disciplines, compared with high school graduates.
Second, skill requirements vary considerably by field of study. For example, bachelor’s degree holders in architecture, engineering, and related technologies generally work in multidimensional jobs requiring diverse, high-level skills. In fact, these graduates rank at the top or very close to the top in eight of the nine skills examined. In contrast, bachelor’s degree holders in three fields (education; visual and performing arts, and communications technologies; and humanities) generally rank lower than other bachelor’s degree holders in most skills examined. However, the skill requirements of college graduates and bachelor’s degree holders are very different across fields of study. While skill requirements are almost always higher among bachelor’s degree holders than among college graduates from the same discipline, the relative ranking of disciplines tends to differ for each level.
Finally, there are considerably more gender differences among college graduates than among bachelor’s degree holders with regard to skill requirements by field of study.

Analytical Studies — Research Paper Series - 7 - Statistics Canada – Catalogue no. 11F0019M, no. 388
1 Introduction
Postsecondary students generally base their choice of program on a combination of several factors, including interest, program availability and cost, and outcomes associated with the program choice. The most readily available information on graduate outcomes consists of employment and earnings (e.g., Frank, Frenette and Morissette 2015; Ostrovsky and Frenette 2014). Some studies have looked at over qualification rates among university graduates (e.g., Uppal and LaRochelle-Côté 2014).
This study contributes to the literature on postsecondary graduate outcomes by considering an alternative outcome, namely occupational skill requirements.
To date, there is no information available on the specific skills that graduates actually use in their jobs. The skill requirements of jobs held by postsecondary graduates are clearly important to students, because these are indicative of what they are likely to be doing after graduation. More generally, an informed choice of program may affect job match, insofar as well-informed students may be able to avoid career paths that take them outside their areas of interest. If postsecondary programs were directly linked to specific occupations, students could simply look up an occupation and select the required program of study. However, graduates from the same program often hold diverse jobs, and, as a result, many graduates may end up in jobs they did not anticipate when they initially enrolled in their program.1
The study is also informative for policy purposes. Understanding which skills graduates tend to use in the jobs that they land may be useful for educators in the design of programs and courses.
In this study, data from the Occupational Information Network (O*NET) are matched to those of the 2011 National Household Survey (NHS) to examine the skill requirements of jobs held by Canadians aged 25 to 34 with different levels of education and fields of study. The focus is on postsecondary graduates. O*NET was developed in the United States and contains detailed information on skill levels and the importance of each skill within detailed occupations.2,3 Nine skill categories were used in this study, including reading comprehension; writing; mathematics; science; process, complex problem solving, and systems; social; technical operation and maintenance; technical design and analysis; and resource management.
The study is organized as follows. Section 2 reviews the methodology used in the study, and Section 3 describes the results. The study is concluded in Section 4.
1. See Robst (2007) and Table 1 in Section 3 (“Results”) of the present paper. 2. While skills can vary to some degree within occupations (Autor and Handel 2013), the skill data used in this study
provide information about the skill requirements for graduates at the occupation level. 3. This study focuses primarily on skill levels; however, results on the importance of skills are also presented in
Appendix A.
Analytical Studies — Research Paper Series - 8 - Statistics Canada – Catalogue no. 11F0019M, no. 388
2 Methodology
The ultimate goal of the data-construction portion of the study is to assign the information on occupational skill requirements from O*NET4 (described below) to the 2011 NHS at the occupational level.
O*NET is a database produced by the U.S. Department of Labor5 that provides information on occupational characteristics, such as skills, abilities and general work activities, for several hundred occupations. O*NET was developed to provide high-quality occupational information to “inform important activities in workforce development, economic development, career development, academic and policy research, and human resource management” (National Research Council 2010, p. 2). For the purposes of this study, only the O*NET skills data are used. The O*NET skills data are based on ratings from job incumbents, collected in a two-stage survey of employers and workers, and from trained occupational analysts who base their ratings on a variety of resources, including job titles, descriptions and updated job incumbent ratings. This approach was developed from established job-analysis methods used by researchers in the fields of industrial and organizational psychology (U.S. Department of Labor 2012). Studies of inter-rater agreement for O*NET data have examined the variability in ratings between different groups of occupational analysts (Fleisher and Tsacoumis 2012) and between job incumbents and analysts (Tsacoumis and Van Iddekinge 2006). Researchers have found a high degree of consistency in between-group ratings, particularly with respect to how skills are ranked within and across occupations; these results indicate that both job incumbents and analysts provide reliable ratings (Tsacoumis and Van Iddekinge 2006; Walmsley, Natali and Campbell 2012).
The O*NET data are based on occupational codes from the 2010 Standard Occupational Classification (SOC2010). To apply the O*NET information to Canadian occupational data, a concordance between the six-digit SOC2010 codes (provided in the O*NET database) and the four-digit 2011 National Occupational Classification (NOC2011) codes was developed. This concordance was determined based on the similarity of the occupational descriptions.6 After occupations with no skills data in the O*NET database were dropped, there were 1,153 SOC2010–NOC2011 matched pairs. In cases where one SOC2010 code mapped to one or more NOC2011 codes, there were no issues in assigning the O*NET skill information to the NOC2011 codes. However, when more than one SOC2010 code mapped to one NOC2011 code, skill information had to be obtained from a higher SOC2010 level (i.e., from the five-digit, four-digit or three-digit level). Since no Canadian data are coded using SOC2010, the 2010 American Community Survey (ACS) was used to assign weights to each contributing SOC2010 code. These weights were based on the relative population frequency of SOC2010 codes in the ACS.
In some instances, a six-digit SOC2010 code had “breakout” (i.e., new or emerging) sub-occupations. Since there were no estimates of population size for these sub-occupations, it was assumed that they were of equal size within a six-digit SOC2010 code. After the breakout
4. O*NET (version 17.0) data used in this study were downloaded from http://www.onetcenter.org on July 13, 2012.
More details about O*NET are also available through this website. 5. Although O*NET was developed in the United States, it has been applied to Canadian data in previous studies
(e.g., Imai, Stacey and Warman 2014) and used in comparative research conducted by the Organisation for Economic Co-operation and Development (OECD) (Quintini and Venn 2013). In addition, Handel (2012) has found that O*NET and country-specific skill measures are largely consistent across OECD countries.
6. The efforts of Joe He of Statistics Canada in developing this concordance are greatly appreciated.

Analytical Studies — Research Paper Series - 9 - Statistics Canada – Catalogue no. 11F0019M, no. 388
occupations were aggregated, 1,058 SOC2010–NOC2011 matched pairs remained. This number included 495 unique four-digit NOC2011 codes.7
Of these 495 unique NOC2011 codes, 336 were matched with a six-digit SOC2010 code. For the remaining 159 NOC2011 codes, higher-level SOC2010 codes had to be used, because more than one six-digit SOC2010 code mapped to them (i.e., the ACS data were used at this stage). Among these 159 NOC2011 codes, 119 were matched with five-digit SOC2010 codes, 38 were matched with four-digit SOC2010 codes, and the remaining 2 were matched with three-digit SOC2010 codes.
At this stage, the 495 unique NOC2011 codes contained the information on occupational skill requirements from O*NET. The data on occupational skill requirements were then linked to the NOC2011 codes in the NHS data. Specifically, the skills information includes the skill-importance requirements and the skill-level requirements in 35 areas. The information on skill requirements was provided by job incumbents (selected in a two-step random sample of business establishments and workers) who filled out a questionnaire. Job incumbents were asked to rate the importance of specific skills to the performance of their current job, as well as the level of these skills needed to perform their current job. The importance scale ranges from 1 to 5, with a value of 1 indicating “not important” and a value of 5 indicating “extremely important.” If more than 75% of respondents rated a skill as “not important,” occupational analysts identified the corresponding skill level as “not relevant.”8 In this study, these occupations were assigned a skill-level value of 0. When skills are rated as “somewhat important” or higher, skill levels are determined based on a scale of 1 to 7, where 7 is the highest level. Examples of tasks were provided for some of the values as a guide for job incumbents to determine the level of complexity of skills.9 In this study, the primary focus is on the skill level. However, results were also produced for the measure of skill importance (shown in Tables A.7 to A.9 in Appendix A).
The list of occupational skill requirements was shortened from 35 specific skills to 9 skill groups through confirmatory factor analysis. In this approach, the factors (skill groups) were determined a priori, on conceptual grounds. Similar to the approach used by Imai, Stacey and Warman (2014), a high factor loading was required for specific skills to be retained in the factors.10 The threshold for factor loadings was set at 0.75, and all skills met this requirement. The nine skill groups that emerged from the factor analysis,11 along with lists of specific skills12 when applicable, are the same for the measures of skill level and skill importance. They are the following:
Reading comprehension
Writing
Mathematics
Science
Process, complex problem solving, and systems
7. These 495 occupations represent 99% of the four-digit-level (unit group) occupations in NOC2011 (495 out of 500).
The occupations that are not included are legislators, commissioned officers of the Canadian Forces, non-commissioned ranks of the Canadian Forces, binding and finishing machine operators, and photographic and film processors. Less than 1% of the sample studied was employed in these five occupations.
8. Refer to the O*NET Data Dictionary, version 17.0, for further details (National Center for O*NET Development 2012).
9. For example, the skill-level scale for reading comprehension includes examples, such as “Read step-by-step instructions for completing a form” (rated 2), “Read a memo from management describing new personnel policies” (rated 4), and “Read a scientific journal article describing surgical procedures” (rated 6) (O*NET Resource Center, n.d., p. 2). For additional examples for each skill group, refer to Appendix C.
10. Imai, Stacey and Warman (2014) applied a threshold of 0.8. The threshold was lowered slightly to 0.75 in the present study, because this allowed for the inclusion of two skills that would otherwise have been excluded (i.e., instructing and installation). Detailed factor analysis results are available upon request.
11. The only instance where the factor loadings suggested more than one factor underlying the group of variables was that of technical skills. In this case, two groups emerged: technical operation and maintenance, and technical design and analysis.
12. Refer to Appendix B for definitions of the skills listed.

Analytical Studies — Research Paper Series - 10 - Statistics Canada – Catalogue no. 11F0019M, no. 388
o Active learning o Complex problem solving o Critical thinking o Judgement and decision making o Learning strategies o Monitoring o Systems analysis o Systems evaluation
Social o Active listening o Coordination o Instructing o Negotiation o Persuasion o Service orientation o Social perceptiveness o Speaking
Technical operation and maintenance o Equipment maintenance o Equipment selection o Installation o Operation and control o Operation monitoring o Quality control analysis o Repairing o Troubleshooting
Technical design and analysis o Operations analysis o Programming o Technology design
Resource management o Management of financial resources o Management of material resources o Management of personnel resources o Time management.
The analytical sample includes men and women between the ages of 25 and 34, to focus on young graduates who likely obtained their credentials in recent years. Some results are generated by highest level of completed education, including less than a high school diploma, a high school diploma, a trades certificate, a college certificate, registered apprenticeship, a bachelor’s degree, a master’s degree, a doctorate, or a professional degree. People with a university certificate above or below a bachelor’s degree are excluded, given the small sample sizes. Among postsecondary graduates, only those whose location of study was in Canada are included. Individuals with a bachelor’s degree whose field of study was “Law (LLB, JD, BCL)” are coded as professional-degree holders.13,14 In addition, only individuals who worked 30 or more hours as a paid employee in a defined occupation during the reference week are retained. These sample restrictions result in a final sample of 247,781 men and 196,302 women.
The standardized factors were derived from this broad sample and were then regressed by ordinary least squares on measures of educational attainment, as well as age, age squared and
13. The law degrees identified are Bachelor of Laws (LLB), Juris Doctor (JD) and Bachelor of Civil Law (BCL). 14. In addition to individuals who hold a bachelor’s degree in law, the “professional degree” category also includes
those with a degree in medicine, dentistry, veterinary medicine or optometry.

Analytical Studies — Research Paper Series - 11 - Statistics Canada – Catalogue no. 11F0019M, no. 388
immigrant status. In all cases, the regressions were estimated on the broad sample, even though results are shown separately by sex, level of education and field of study. Thus, comparisons may be made across these three dimensions.
The fields of study are based on the primary groupings of the Classification of Instructional Programs (CIP) Canada 2011. Eleven groupings are used:15
Education
Visual and performing arts, and communications technologies
Humanities
Social and behavioural sciences and law
Business, management and public administration
Physical and life sciences and technologies
Mathematics, computer and information sciences
Architecture, engineering, and related technologies
Agriculture, natural resources and conservation
Health and related fields
Personal, protective and transportation services. The coefficients of interest in the regression models are those associated with the highest level of completed education and field of study. When these variables are included in the model, the usual approach is to drop one category and interpret the coefficients relative to this reference category. While this method may be effective for examining educational levels (given the inherent hierarchy across levels that is based on usual time to completion), it may be less suitable for the analysis of fields of study. In this study, this method is particularly problematic because the selected reference field of study that is omitted may, depending on the skill examined, be a top, middle or bottom category. Therefore, to facilitate comparisons across skill categories, the coefficients of interest were expressed relative to the average coefficient, as described by Andrews et al. (1967).16 This approach, termed “multiple classification analysis,” requires that all coefficients be included in the model. The coefficients were interpreted as the number of standard deviations above or below the average skill level (the positive coefficient and the negative coefficient, respectively). For consistency, this approach was also used for the analysis of educational levels.
15. The “personal improvement and leisure” primary grouping was excluded since it is not associated with an
educational qualification. Also, “other” was excluded due to low sample sizes. 16. This approach requires running a regression with one omitted category (as usual), and then adjusting each
coefficient (including the one associated with the omitted category, which is set to zero) by subtracting from each of them the value of the linear combination of all the coefficients associated with each category and their relative population share. The standard errors were obtained through non-parametric bootstrapping with 100 iterations.

Analytical Studies — Research Paper Series - 12 - Statistics Canada – Catalogue no. 11F0019M, no. 388
3 Results
Table A.4 in Appendix A shows the detailed results of regressions of the skill-level requirement values on the highest level of completed education and other covariates. The coefficients are expressed in standard deviations and are relative to the average relationship between educational level and the occupational skill in question. To facilitate analysis of all skills, the average coefficient across all skill areas is shown for each level of schooling. Charts 1 and 2 illustrate these results for both men and women.17
17. The covariates in the skill level model estimated for Table A.4 and presented in Charts 1 and 2 included a series of
dummy variables indicating the highest level of completed education, interacted with a female dummy variable, along with an independent quadratic age term and an independent dummy variable to indicate immigrant status. The model for Tables A.5 and A.6 is similar (presented in Charts 3 to 11), except that the college and bachelor’s degree categories are dropped in favour of the full set of field of study dummy variables. Since in both models age and immigrant status are stand-alone variables, there is an omitted interaction effect (between age and immigrant status, and the other variables in the model) that is absorbed by all variables in the models. The omitted interaction effect is very small, as evidenced by the very slight difference in the predicted values for graduates at the same level across models. Given this negligible effect, the models were run in this way to preserve computational efficiency (a non-negligible issue given the bootstrap approach used). The same logic also applies to the skill importance models presented in Appendix A.
-1.5
-1.0
-0.5
0.0
0.5
1.0
1.5
2.0
Less than
high school
High
school
Trades
certificate
Registered
apprenticeship
College Bachelor's
degree
Master's
degree
Doctorate Professional
degree
regression coefficient
Educational levels
Chart 1
Regression results for skill-level requirements, by educational
level, men aged 25 to 34
Reading comprehension Social
Writing Technical operation and maintenance
Mathematics Technical design and analysis
Science Resource management
Process, complex problem solving, and systems
Sources: Statistics Canada, 2011 National Household Survey; and U.S. Department of Labor, Occupational Information Network (O*NET) version 17.0.

Analytical Studies — Research Paper Series - 13 - Statistics Canada – Catalogue no. 11F0019M, no. 388
In general, young men and women who are more highly educated face higher levels of occupational skill requirements, including in social skills.
However, there are some notable exceptions to this trend, particularly in technical operation and maintenance skills. On average, university graduates require below-average technical operation and maintenance skills (i.e., the coefficients are negative). Above-average technical operation and maintenance skills are required for male non-university postsecondary graduates, particularly those who report a registered apprenticeship or a trades certificate as their highest level of completed education. For women, technical operation and maintenance skill requirements are below the average regardless of completed schooling. Moreover, such skills are no more required among women with a trades certificate or a registered apprenticeship than among other women.
In addition, graduates with a professional degree face lower mathematics skill requirements in their jobs than other university graduates. However, this result is attributable to graduates of law programs. Non-law professional-degree holders (in medicine, dentistry, optometry and veterinary medicine) rank as high as other university graduates in mathematics skill requirements.18
Another exception to the positive relationship between educational attainment and skill requirements concerns doctoral graduates. The resource management skill requirements for both men and women, although above the overall average, are below those of other university graduates.19
Charts 1 and 2 also display interesting differences by sex, although the results are very different for university graduates and for non-university graduates. Among individuals with a university degree, men generally require higher skills than women in mathematics, technical operation and maintenance, technical design and analysis, and resource management. In all other skill areas,
18. These results are available upon request. 19. The differences are statistically significant at 5% in all cases.
-1.0
-0.5
0.0
0.5
1.0
1.5
2.0
Less than
high school
High
school
Trades
certificate
Registered
apprenticeship
College Bachelor's
degree
Master's
degree
Doctorate Professional
degree
regression coefficient
Educational levels
Chart 2
Regression results for skill-level requirements, by educational
level, women aged 25 to 34
Reading comprehension Social
Writing Technical operation and maintenance
Mathematics Technical design and analysis
Science Resource management
Process, complex problem solving, and systems
Sources: Statistics Canada, 2011 National Household Survey; and U.S. Department of Labor, Occupational Information Network (O*NET) version 17.0.

Analytical Studies — Research Paper Series - 14 - Statistics Canada – Catalogue no. 11F0019M, no. 388
job requirements are similar for university-educated men and women. Among non-university-educated individuals, requirements are lower for men than for women in reading comprehension, writing and social skills. Technical operation and maintenance skills are lower for women without a university degree than for their male counterparts. In all other skill areas, requirements are similar.
The distribution of occupations in which graduates from specific fields tend to work is worth describing, because it can provide a useful reference point for the results by field of study that follow. To this end, Table 1 shows the 10 most common occupations for men aged 25 to 34 who hold a bachelor’s degree, by field of study.20
The field of study that is associated with the most concentrated set of occupations is education: 76.2% of its male bachelor’s degree holders are either secondary school teachers or elementary school and kindergarten teachers. The humanities field and the social and behavioural sciences and law field are the most diverse with respect to occupational distribution: the top 10 occupations account for approximately one-quarter of graduates in both cases. In fact, no occupation accounts for as much as 5% of male bachelor’s degree holders from these two fields.
One occupation without a clear association to any specific field of study is retail salesperson. Although this occupation is in the top 10 for 8 of the 11 fields of study, it always accounts for less than 5% of graduates in any discipline.
The detailed results of the skills analysis by field of study appear in Table A.5 in Appendix A for bachelor’s degree holders. The coefficients also appear in Charts 3 to 11. Graduates from every discipline require above-average reading comprehension skills; writing skills; process, complex problem-solving, and systems skills; and social skills. Interestingly, graduates from technical fields, such as architecture, engineering, and related technologies, rank first in reading comprehension and writing skill requirements. Graduates in mathematics, computer and information sciences also rank among the top fields for both of these skill measures. In contrast, education graduates and humanities graduates rank near the bottom in both areas.
It is important to note that this study tracks the skills required to perform the duties associated with the jobs (occupations) that graduates land. Graduates from a given discipline may possess very high skills (e.g., in reading comprehension); however, this does not guarantee that they will find jobs that require them to fully utilize these skills.
20. Results for female bachelor’s degree holders, as well as for male and female college graduates, are available in
Tables A.1 to A.3 in Appendix A.

Analytical Studies — Research Paper Series - 15 - Statistics Canada – Catalogue no. 11F0019M, no. 388
Field of study and occupation Share
percent
Education
Secondary school teachers 44.4
Elementary school and kindergarten teachers 31.8
College and other vocational instructors 1.7
School principals and administrators of elementary and secondary education 1.6
Retail salespersons 0.9
Elementary and secondary school teacher assistants 0.7
Nurse aides, orderlies and patient service associates 0.5
Education policy researchers, consultants and program officers 0.5
Other customer and information services representatives 0.5
Police officers (except commissioned) 0.5
Visual and performing arts, and communications technologies
Graphic designers and illustrators 14.9
Retail salespersons 4.1
Producers, directors, choreographers and related occupations 3.0
Retail and wholesale trade managers 2.9
Industrial designers 2.8
Web designers and developers 2.3
Food and beverage servers 2.3
Musicians and singers 2.2
Audio and video recording technicians 2.1
Elementary school and kindergarten teachers 1.8
Humanities
Retail salespersons 3.9
Professional occupations in religion 3.6
Other customer and information services representatives 2.4
Elementary school and kindergarten teachers 2.4
Retail and wholesale trade managers 2.3
Professional occupations in advertising, marketing and public relations 2.1
Secondary school teachers 2.1
Police officers (except commissioned) 1.9
Sales and account representatives - wholesale trade (non-technical) 1.9
Corporate sales managers 1.8
Social and behavioural sciences and law
Police officers (except commissioned) 4.2
Professional occupations in advertising, marketing and public relations 3.5
Retail salespersons 3.3
Other financial officers 2.5
Social and community service workers 2.3
Retail and wholesale trade managers 2.2
Banking, credit and other investment managers 1.9
Other customer and information services representatives 1.9
Business development officers and marketing researchers and consultants 1.9
Sales and account representatives - wholesale trade (non-technical) 1.7
Table 1-1
The 10 most common occupations held by bachelor's degree holders, by field of
study, men aged 25 to 34
Source: Statistics Canada, 2011 National Household Survey.

Analytical Studies — Research Paper Series - 16 - Statistics Canada – Catalogue no. 11F0019M, no. 388
Field of study and occupation Share
percent
Business, management and public administration
Financial auditors and accountants 14.0
Other financial officers 4.5
Financial and investment analysts 4.5
Banking, credit and other investment managers 3.4
Financial managers 2.9
Corporate sales managers 2.7
Retail and wholesale trade managers 2.6
Retail salespersons 2.5
Financial sales representatives 2.5
Sales and account representatives - wholesale trade (non-technical) 2.5
Physical and life sciences and technologies
Postsecondary teaching and research assistants 6.8
Geoscientists and oceanographers 6.0
Biologists and related scientists 3.6
Chemists 3.4
Retail salespersons 2.7
Information systems analysts and consultants 2.6
Chemical technologists and technicians 2.6
Secondary school teachers 2.3
Computer programmers and interactive media developers 2.1
Technical sales specialists - wholesale trade 2.0
Mathematics, computer and information sciences
Computer programmers and interactive media developers 28.4
Information systems analysts and consultants 16.5
Software engineers and designers 5.5
Computer network technicians 4.7
Computer and information systems managers 3.9
User support technicians 3.1
Web designers and developers 2.6
Computer engineers (except software engineers and designers) 1.7
Database analysts and data administrators 1.3
Mathematicians, statisticians and actuaries 1.2
Architecture, engineering, and related technologies
Mechanical engineers 13.3
Civil engineers 11.2
Electrical and electronics engineers 9.8
Computer programmers and interactive media developers 5.2
Software engineers and designers 4.6
Computer engineers (except software engineers and designers) 3.6
Industrial and manufacturing engineers 3.4
Information systems analysts and consultants 3.0
Petroleum engineers 2.9
Construction managers 2.4
Table 1-2
The 10 most common occupations held by bachelor's degree holders, by field of
study, men aged 25 to 34
Source: Statistics Canada, 2011 National Household Survey.

Analytical Studies — Research Paper Series - 17 - Statistics Canada – Catalogue no. 11F0019M, no. 388
Field of study and occupation Share
percent
Agriculture, natural resources and conservation
Agricultural representatives, consultants and specialists 6.7
Natural and applied science policy researchers, consultants and program officers 6.1
Forestry professionals 5.3
Biologists and related scientists 5.2
Managers in agriculture 4.2
Chemical technologists and technicians 3.7
Retail salespersons 2.6
Inspectors in public and environmental health and occupational health and safety 2.1
Corporate sales managers 2.1
Technical occupations in geomatics and meteorology 1.7
Health and related fields
Registered nurses and registered psychiatric nurses 16.5
Pharmacists 9.8
Program leaders and instructors in recreation, sport and fitness 4.1
Other professional occupations in therapy and assessment 3.4
Secondary school teachers 3.2
Physiotherapists 2.8
Police officers (except commissioned) 2.3
Elementary school and kindergarten teachers 2.2
Inspectors in public and environmental health and occupational health and safety 2.1
Firefighters 2.0
Personal, protective and transportation services
Police officers (except commissioned) 29.5
Air pilots, flight engineers and flying instructors 13.3
Correctional service officers 4.8
Security guards and related security service occupations 3.5
Probation and parole officers and related occupations 3.2
Employment insurance, immigration, border services and revenue officers 2.9
Retail salespersons 1.6
Corporate sales managers 1.6
Aircraft mechanics and aircraft inspectors 1.5
Deck officers, water transport 1.5
Table 1-3
The 10 most common occupations held by bachelor's degree holders, by field of
study, men aged 25 to 34
Source: Statistics Canada, 2011 National Household Survey.

Analytical Studies — Research Paper Series - 18 - Statistics Canada – Catalogue no. 11F0019M, no. 388
0.00
0.10
0.20
0.30
0.40
0.50
0.60
0.70
0.80
0.90
1.00
1.10
1.20
Men Women
regression coefficient
Sex and fields of study
Chart 3
Regression results for reading comprehension skill-level
requirements, bachelor's degree holders
Education Visual and performing arts, and communications technologies
Humanities Social and behavioural sciences and law
Business, management and public administration Physical and life sciences and technologies
Mathematics, computer and information sciences Architecture, engineering, and related technologies
Agriculture, natural resources and conservation Health and related fields
Personal, protective and transportation services
Sources: Statistics Canada, 2011 National Household Survey; and U.S. Department of Labor, Occupational Information Network (O*NET) version 17.0.
0.00
0.10
0.20
0.30
0.40
0.50
0.60
0.70
0.80
0.90
1.00
Men Women
regression coefficient
Sex and fields of study
Chart 4
Regression results for writing skill-level requirements, bachelor's
degree holders
Education Visual and performing arts, and communications technologies
Humanities Social and behavioural sciences and law
Business, management and public administration Physical and life sciences and technologies
Mathematics, computer and information sciences Architecture, engineering, and related technologies
Agriculture, natural resources and conservation Health and related fields
Personal, protective and transportation services
Sources: Statistics Canada, 2011 National Household Survey; and U.S. Department of Labor, Occupational Information Network (O*NET) version 17.0.

Analytical Studies — Research Paper Series - 19 - Statistics Canada – Catalogue no. 11F0019M, no. 388
-0.50
-0.25
0.00
0.25
0.50
0.75
1.00
1.25
1.50
Men Women
regression coefficient
Sex and fields of study
Chart 5
Regression results for mathematics skill-level requirements,
bachelor's degree holders
Education Visual and performing arts, and communications technologies
Humanities Social and behavioural sciences and law
Business, management and public administration Physical and life sciences and technologies
Mathematics, computer and information sciences Architecture, engineering, and related technologies
Agriculture, natural resources and conservation Health and related fields
Personal, protective and transportation services
Sources: Statistics Canada, 2011 National Household Survey; and U.S. Department of Labor, Occupational Information Network (O*NET) version 17.0.
-0.30-0.20-0.100.000.100.200.300.400.500.600.700.800.901.001.101.201.301.401.501.60
Men Women
regression coefficient
Sex and fields of study
Chart 6
Regression results for science skill-level requirements, bachelor's
degree holders
Education Visual and performing arts, and communications technologies
Humanities Social and behavioural sciences and law
Business, management and public administration Physical and life sciences and technologies
Mathematics, computer and information sciences Architecture, engineering, and related technologies
Agriculture, natural resources and conservation Health and related fields
Personal, protective and transportation services
Sources: Statistics Canada, 2011 National Household Survey; and U.S. Department of Labor, Occupational Information Network (O*NET) version 17.0.
Note: The coefficient for men in Social and behavioural sciences and law is not missing; rather, it is very close to zero (0.002).

Analytical Studies — Research Paper Series - 20 - Statistics Canada – Catalogue no. 11F0019M, no. 388
0.00
0.10
0.20
0.30
0.40
0.50
0.60
0.70
0.80
0.90
1.00
1.10
1.20
Men Women
regression coefficient
Sex and fields of study
Chart 7
Regression results for process, complex problem solving, and
systems skill-level requirements, bachelor's degree holders
Education Visual and performing arts, and communications technologies
Humanities Social and behavioural sciences and law
Business, management and public administration Physical and life sciences and technologies
Mathematics, computer and information sciences Architecture, engineering, and related technologies
Agriculture, natural resources and conservation Health and related fields
Personal, protective and transportation services
Sources: Statistics Canada, 2011 National Household Survey; and U.S. Department of Labor, Occupational Information Network (O*NET) version 17.0.
0.00
0.10
0.20
0.30
0.40
0.50
0.60
0.70
0.80
0.90
1.00
1.10
Men Women
regression coefficient
Sex and fields of study
Chart 8
Regression results for social skill-level requirements, bachelor's
degree holders
Education Visual and performing arts, and communications technologies
Humanities Social and behavioural sciences and law
Business, management and public administration Physical and life sciences and technologies
Mathematics, computer and information sciences Architecture, engineering, and related technologies
Agriculture, natural resources and conservation Health and related fields
Personal, protective and transportation services
Sources: Statistics Canada, 2011 National Household Survey; and U.S. Department of Labor, Occupational Information Network (O*NET) version 17.0.

Analytical Studies — Research Paper Series - 21 - Statistics Canada – Catalogue no. 11F0019M, no. 388
-0.80
-0.70
-0.60
-0.50
-0.40
-0.30
-0.20
-0.10
0.00
0.10
0.20
0.30
0.40
0.50
0.60
Men Women
regression coefficient
Sex and fields of study
Chart 9
Regression results for technical operation and maintenance
skill-level requirements, bachelor's degree holders
Education Visual and performing arts, and communications technologies
Humanities Social and behavioural sciences and law
Business, management and public administration Physical and life sciences and technologies
Mathematics, computer and information sciences Architecture, engineering, and related technologies
Agriculture, natural resources and conservation Health and related fields
Personal, protective and transportation services
Sources: Statistics Canada, 2011 National Household Survey; and U.S. Department of Labor, Occupational Information Network (O*NET) version 17.0.
-0.50-0.40-0.30-0.20-0.100.000.100.200.300.400.500.600.700.800.901.001.101.201.301.401.501.601.701.801.902.002.10
Men Women
regression coefficient
Sex and fields of study
Chart 10
Regression results for technical design and analysis skill-level
requirements, bachelor's degree holders
Education Visual and performing arts, and communications technologies
Humanities Social and behavioural sciences and law
Business, management and public administration Physical and life sciences and technologies
Mathematics, computer and information sciences Architecture, engineering, and related technologies
Agriculture, natural resources and conservation Health and related fields
Personal, protective and transportation services
Sources: Statistics Canada, 2011 National Household Survey; and U.S. Department of Labor, Occupational Information Network (O*NET) version 17.0.

Analytical Studies — Research Paper Series - 22 - Statistics Canada – Catalogue no. 11F0019M, no. 388
Bachelor’s degree graduates from most disciplines require above-average skill levels in mathematics, science, technical design and analysis, and resource management. In all cases, graduates who require below-average skill levels in these areas come from one of three disciplines: education; visual and performing arts, and communications technologies; and humanities.
Most graduates require below-average or average technical operation and maintenance skills. Graduates from a small number of disciplines require above-average technical operation and maintenance skills, including those from architecture, engineering, and related technologies. This is also the case for men from programs in mathematics, computer and information sciences, and men from programs in personal, protective and transportation services.
Graduates from programs in architecture, engineering, and related technologies tend to land jobs requiring the most diverse set of advanced skills. More specifically, they rank first in all areas of skill requirements, with the exception of technical design and analysis skills for men (second) and social skills for men and women (fourth among men and third among women).
The very diverse skill set required of graduates from the field of architecture, engineering, and related technologies coincides with their superior pay. In fact, they rank near the top of the lifetime earnings distribution among graduates, along with graduates from the field of business, management and public administration (Ostrovsky and Frenette 2014). Although the skill requirements for graduates from programs in business, management and public administration are mostly above average, these graduates rank fairly low in requirements for science skills and technical operation and maintenance skills. Interestingly, they rank second (among men) and third (among women) in resource management skill requirements.
Graduates from the field of mathematics, computer and information sciences also require higher-level skills relative to other disciplines. They rank second (behind graduates from programs in
-0.30
-0.10
0.10
0.30
0.50
0.70
0.90
1.10
Men Women
regression coefficient
Sex and fields of study
Chart 11
Regression results for resource management skill-level
requirements, bachelor's degree holders
Education Visual and performing arts, and communications technologies
Humanities Social and behavioural sciences and law
Business, management and public administration Physical and life sciences and technologies
Mathematics, computer and information sciences Architecture, engineering, and related technologies
Agriculture, natural resources and conservation Health and related fields
Personal, protective and transportation services
Sources: Statistics Canada, 2011 National Household Survey; and U.S. Department of Labor, Occupational Information Network (O*NET) version 17.0.

Analytical Studies — Research Paper Series - 23 - Statistics Canada – Catalogue no. 11F0019M, no. 388
architecture, engineering, and related technologies) based on their average skill requirements across all nine areas (see Table A.5-2).
At the opposite end of the spectrum, the graduates who tend to require the lowest skill levels in the jobs they land are those from programs in education; visual and performing arts, and communications technologies; and humanities. In general, graduates from these disciplines tend to earn considerably less than other graduates over their lifetime (Ostrovsky and Frenette 2014). Male graduates from these 3 fields can be found in the bottom 4 fields (out of 11) in six of the nine skill areas, and female graduates from the same 3 fields can be found in the bottom 3 fields in six of the nine skill areas. These graduates—men and women—are never in the top four disciplines in any skill areas. Interestingly, graduates from programs in visual and performing arts, and communications technologies rank last in social skill requirements for their jobs, but are about average with respect to requirements for technical operation and maintenance skills and technical design and analysis skills.
Some fields consistently rank in the middle of several skill groups. In particular, graduates from programs in social and behavioural sciences and law have a mid-level ranking among bachelor’s degree holders in writing; mathematics; social; technical design and analysis; and resource management skills. In addition, graduates from programs in agriculture, natural resources and conservation have mid-level rankings for reading comprehension and writing skills, while humanities graduates rank near the middle for social skills.
How do bachelor’s degree holders from the lower-ranked disciplines compare with high school graduates? Table A.5 provides the answer by redisplaying the high school results from Table A.4. In general, compared with the skill requirements for high school graduates, skill requirements tend to be greater for bachelor’s degree holders from programs in education; visual and performing arts, and communications technologies; and humanities. However, there are some notable exceptions. For example, technical operation and maintenance skill requirements are considerably higher for male high school graduates. For women, technical operation and maintenance skill requirements are about the same for high school graduates as for graduates of these three disciplines. In addition, some skill requirements are higher for high school graduates than for bachelor’s degree holders in education (e.g., technical design and analysis, and, for women, mathematics). Finally, high school graduates and bachelor’s degree holders in education face similar resource management skill requirements in their jobs.21
The results also indicate that the relative rankings of fields are generally similar for men and women, although there are some interesting differences between men and women with degrees in health and related fields. Indeed, women in this field have higher skill-level requirements than their male counterparts across all areas except technical operation and maintenance skills and technical design and analysis skills. This contrast in skill requirements is largely attributable to differences in the choice of specific field of study within the broader field. Women studied primarily in nursing programs, comprising 56% of female graduates in health and related fields. In comparison, only 12% of male graduates in health and related fields studied nursing, while just over 40% studied physical education and fitness. Graduates from nursing programs generally
21. The covariates in the skill level model estimated for Table A.4 and presented in Charts 1 and 2 included a series
of dummy variables indicating the highest level of completed education, interacted with a female dummy variable, along with a quadratic age term and a dummy variable to indicate immigrant status. The model for Tables A.5 and A.6 is similar (presented in Charts 3 to 11), except that the college and bachelor’s degree categories are dropped in favour of the full set of field of study dummy variables. Since in both models age and immigrant status are stand-alone variables, there is an omitted interaction effect (between age and immigrant status, and the other variables in the model) that is absorbed by other variables in the models. The omitted interaction effect is very small, as evidenced by the very slight difference in the predicted values for graduates at the same level across models. Given this negligible effect, the models were run in this way to preserve computational efficiency (a non-negligible issue given the bootstrap approach used). The same logic also applies to the skill importance models presented in Appendix A.

Analytical Studies — Research Paper Series - 24 - Statistics Canada – Catalogue no. 11F0019M, no. 388
landed jobs that require higher skill levels in a broad range of areas, compared with physical education and fitness graduates.
Table A.6 in Appendix A presents the detailed results for college graduates, by field of study, and the coefficients from these models appear in charts A.1 to A.9 (also in Appendix A). The relative rankings among college graduates are somewhat different from those that are registered among bachelor’s degree holders. In particular, the relative ranking of male college graduates in architecture, engineering, and related technologies is considerably lower than that of their counterparts with a bachelor’s degree in the same discipline. The differences are most striking in the areas of reading comprehension; writing; and process, complex problem solving, and systems. At the bachelor’s degree level, male graduates from programs in architecture, engineering, and related technologies rank first in all three of these skill areas. At the college level, they rank ninth in reading comprehension and writing skills, and eighth in process, complex problem solving, and systems skills. However, they rank highly in technical operation and maintenance skills and technical design and analysis skills among college graduates.
Male college graduates from programs in mathematics, computer and information sciences have the highest overall ranking across all nine areas of skill requirements. In fact, they rank in the top three in all skill areas (first in skill areas such as reading comprehension; writing; mathematics; process, complex problem solving, and systems; and technical design and analysis). At the bachelor’s degree level, male graduates from these programs land in the top three in only five skill areas.
Graduates from programs in education, in visual and performing arts, and communications technologies, and in humanities, who rank near the bottom in most skill areas among bachelor’s degree holders, fare somewhat better in a relative sense among college graduates. While they still rank below the average in most skill areas at the college level, they are closer to the middle in many cases.
College graduates and bachelor’s degree holders from the same discipline may also be compared. Skill requirements are generally higher among bachelor’s degree holders in all areas except technical operation and maintenance. Male college graduates in most fields land jobs that require higher technical operation and maintenance skills than their counterparts with a bachelor’s degree. For women, technical operation and maintenance skill requirements are generally similar for college graduates and bachelor’s degree holders in most fields. Interestingly, science skill requirements are about the same for bachelor’s degree holders and college graduates in physical and life sciences and technologies.
At the college level, the relative rankings of disciplines across all nine skill areas are quite different for men and women. For example, graduates from programs in social and behavioural sciences and law rank 6th overall among men, but last (11th) among women. Graduates from programs in personal, protective and transportation services rank 7th among men, but only 10th among women. Finally, graduates from programs in mathematics, computer and information sciences rank first overall among men, but third among women. More importantly, their overall skill level is about one-half of a standard deviation above the average for men, but very close to the average for women.22
It was shown above that among bachelor’s degree holders, female graduates in health and related fields require higher skills than their male counterparts in seven of the nine areas, largely because of the higher propensity of female graduates to select nursing. At the college level, it is male graduates who require higher skills in five areas. Women in health and related fields at the college level are only somewhat more likely to select nursing programs (15%) than men (10%).
22. The average includes all individuals (men and women combined) between the ages of 25 and 34 who otherwise
satisfy the sample criteria.

Analytical Studies — Research Paper Series - 25 - Statistics Canada – Catalogue no. 11F0019M, no. 388
Lastly, although the skill requirements of college graduates are much closer to those of high school graduates (compared with the proximity of skill requirements between bachelor’s degree holders and high school graduates), it is almost always the case that college graduates in any discipline require higher levels of skills in their job than high school graduates.

Analytical Studies — Research Paper Series - 26 - Statistics Canada – Catalogue no. 11F0019M, no. 388
4 Conclusion
This study examined the skills required for the jobs held by Canadians aged 25 to 34, with a focus on postsecondary graduates. The information on occupational skill requirements was drawn from the Occupational Information Network, which was developed in the United States. These data were matched to the 2011 National Household Survey at the occupational level. The skills information consisted of the level and importance of each skill for each occupation, obtained from job incumbents and rated by occupational analysts. The primary focus of the study was on the skill level, although results based on the importance of skills were also produced.
The study uncovered many new findings on the skill requirements of jobs held by postsecondary graduates.
First, skill-level requirements in all areas generally increase with higher educational levels. There are three notable exceptions to this trend, however: requirements for technical operation and maintenance skills do not generally increase with more schooling, doctoral graduates require considerably less resource management skills than other university graduates, and professional-degree holders have jobs that require lower mathematics skills than other university graduates, although this is entirely because of law graduates. Moreover, skill requirements are almost always higher among bachelor’s degree holders and college graduates of specific disciplines, compared with high school graduates.
Second, skill requirements vary considerably by field of study. For example, bachelor’s degree holders in architecture, engineering, and related technologies generally work in multidimensional jobs requiring diverse, high-level skills. In fact, these graduates rank at the top or very close to the top in eight of the nine skills examined. In contrast, bachelor’s degree holders in three fields (education; visual and performing arts, and communications technologies; and humanities) generally rank lower than other bachelor’s degree holders in most skills examined. However, the skill requirements of college graduates and bachelor’s degree holders are very different across fields of study. While skill requirements are almost always higher among bachelor’s degree holders than among college graduates from the same discipline, the relative ranking of disciplines tends to differ for each level.
Finally, there are considerably more gender differences among college graduates than among bachelor’s degree holders with regard to skill requirements by field of study.
An important next step in this literature would be to develop a measure of skill match that compares occupational skill requirements to the worker’s assessed skills.

Analytical Studies — Research Paper Series - 27 - Statistics Canada – Catalogue no. 11F0019M, no. 388
Appendix A Additional results tables and charts
This appendix contains the top 10 occupations for female bachelor’s degree-holders and male and female college graduates in Tables A.1 to A.3. In addition, it also contains all the detailed results for skill levels in Tables A.4 to A.6, and for skill importance in Tables A.7 to A.9. Finally, the coefficients of the skill level results by college field of study are shown in Charts A.1 to A.9.
The results for skill-importance scores by educational level are generally similar to the findings for skill-level requirements (Table A.7). Skill importance increased with educational levels across most skill groups, with a few exceptions. The results indicate that mathematics skills are less important for professional-degree holders, and the importance of technical design and analysis skills is highest for master’s degree holders. The results for technical operation and maintenance skills among men are a notable exception, as these skills are most important for the jobs held by graduates of registered apprenticeship programs (nearly 1.5 standard deviations above the average); these skills decrease in importance as the educational level increases. In addition, social skills and resource management skills are less important for doctoral graduates than for all other university graduates.
The skill-importance measures also provide further information about the skill requirements of postsecondary graduates by field of study.
In some cases, results for bachelor’s degree holders (Table A.8) are similar to the skill-level findings. For example, with the exception of social skills, male and female graduates from programs in architecture, engineering, and related technologies registered the highest or near highest skill-importance scores.
Differences between skill level and skill importance are apparent for some fields of study, providing a more nuanced understanding of the role of skills in the work of graduates. For instance, although education graduates with a bachelor’s degree generally work in occupations with lower skill-level requirements than other bachelor’s degree holders, their importance scores for social skills rank first for both men and women. And, their skill-importance scores for process, complex problem solving, and systems skills are among the highest for bachelor’s degree holders. Male education graduates also have the third- and fourth-highest skill-importance scores in writing and reading comprehension, respectively, indicating that they hold jobs where these core skills are valuable. In addition, although graduates from programs in business, management and public administration generally do not have the highest skill levels in most areas, they rank highly in skill-importance scores for writing, mathematics, and resource management.
The skill-importance results also provide a different perspective on the skill requirements for college graduates (Table A.9). For example, the skill-level requirements and skill-importance scores for college graduates reveal differences across fields for core skills such as reading comprehension, writing, and mathematics. Although female graduates from programs in physical and life sciences and technologies face the highest skill-level requirements in reading comprehension and writing, these skills are most important in the occupational requirements of graduates from programs in business, management and public administration. Among men, college graduates from programs in mathematics, computer and information sciences have the highest skill-level requirements in writing and mathematics, but these skills are most important for graduates from programs in education and in business, management and public administration, respectively.

Analytical Studies — Research Paper Series - 28 - Statistics Canada – Catalogue no. 11F0019M, no. 388
Field of study and occupation Share
percent
Education
Elementary school and kindergarten teachers 52.0
Secondary school teachers 25.9
Early childhood educators and assistants 2.9
Elementary and secondary school teacher assistants 1.3
College and other vocational instructors 1.1
Education policy researchers, consultants and program officers 1.0
Social and community service workers 0.6
Retail salespersons 0.6
Administrative assistants 0.6
Educational counsellors 0.5
Visual and performing arts, and communications technologies
Graphic designers and illustrators 10.8
Retail salespersons 5.1
Interior designers and interior decorators 3.8
Administrative officers 3.0
Professional occupations in advertising, marketing and public relations 2.9
Administrative assistants 2.8
Retail and wholesale trade managers 2.8
Food and beverage servers 2.5
Theatre, fashion, exhibit and other creative designers 2.3
Other customer and information services representatives 2.0
Humanities
Administrative assistants 4.4
Administrative officers 4.2
Elementary school and kindergarten teachers 4.0
Professional occupations in advertising, marketing and public relations 3.8
Retail salespersons 2.8
Translators, terminologists and interpreters 2.8
Secondary school teachers 2.7
Other customer and information services representatives 2.3
Retail and wholesale trade managers 2.3
Social and community service workers 2.3
Social and behavioural sciences and law
Professional occupations in advertising, marketing and public relations 6.1
Social and community service workers 5.2
Administrative officers 3.6
Administrative assistants 3.4
Elementary school and kindergarten teachers 2.3
Human resources professionals 2.1
General office support workers 2.0
Other customer and information services representatives 1.9
Retail salespersons 1.8
Family, marriage and other related counsellors 1.8
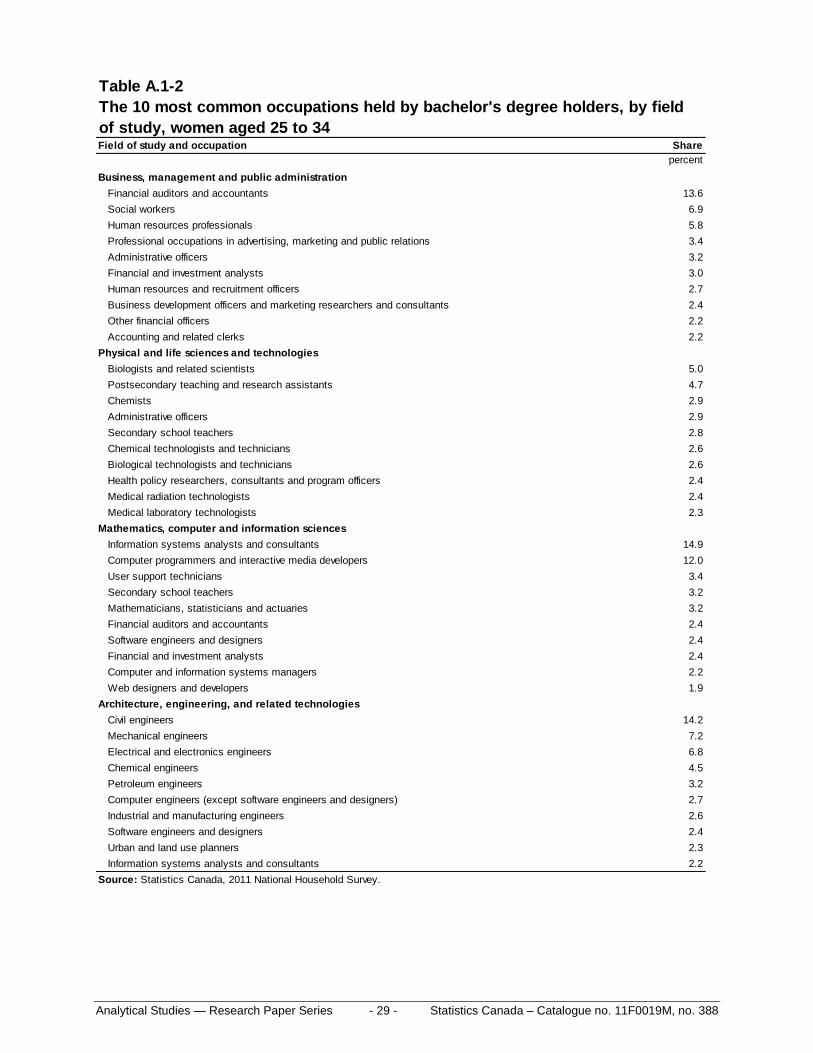
Table A.1-1
The 10 most common occupations held by bachelor's degree holders, by field
of study, women aged 25 to 34
Source: Statistics Canada, 2011 National Household Survey.
Analytical Studies — Research Paper Series - 29 - Statistics Canada – Catalogue no. 11F0019M, no. 388
Field of study and occupation Share
percent
Business, management and public administration
Financial auditors and accountants 13.6
Social workers 6.9
Human resources professionals 5.8
Professional occupations in advertising, marketing and public relations 3.4
Administrative officers 3.2
Financial and investment analysts 3.0
Human resources and recruitment officers 2.7
Business development officers and marketing researchers and consultants 2.4
Other financial officers 2.2
Accounting and related clerks 2.2
Physical and life sciences and technologies
Biologists and related scientists 5.0
Postsecondary teaching and research assistants 4.7
Chemists 2.9
Administrative officers 2.9
Secondary school teachers 2.8
Chemical technologists and technicians 2.6
Biological technologists and technicians 2.6
Health policy researchers, consultants and program officers 2.4
Medical radiation technologists 2.4
Medical laboratory technologists 2.3
Mathematics, computer and information sciences
Information systems analysts and consultants 14.9
Computer programmers and interactive media developers 12.0
User support technicians 3.4
Secondary school teachers 3.2
Mathematicians, statisticians and actuaries 3.2
Financial auditors and accountants 2.4
Software engineers and designers 2.4
Financial and investment analysts 2.4
Computer and information systems managers 2.2
Web designers and developers 1.9
Architecture, engineering, and related technologies
Civil engineers 14.2
Mechanical engineers 7.2
Electrical and electronics engineers 6.8
Chemical engineers 4.5
Petroleum engineers 3.2
Computer engineers (except software engineers and designers) 2.7
Industrial and manufacturing engineers 2.6
Software engineers and designers 2.4
Urban and land use planners 2.3
Information systems analysts and consultants 2.2
Table A.1-2
The 10 most common occupations held by bachelor's degree holders, by field
of study, women aged 25 to 34
Source: Statistics Canada, 2011 National Household Survey.
Analytical Studies — Research Paper Series - 30 - Statistics Canada – Catalogue no. 11F0019M, no. 388
Field of study and occupation Share
percent
Agriculture, natural resources and conservation
Natural and applied science policy researchers, consultants and program officers 8.4
Biologists and related scientists 7.3
Agricultural representatives, consultants and specialists 6.7
Urban and land use planners 3.4
Inspectors in public and environmental health and occupational health and safety 2.9
Chemical technologists and technicians 2.4
Retail and wholesale trade managers 2.2
Biological technologists and technicians 2.2
Agricultural and fish products inspectors 1.9
Managers in agriculture 1.9
Health and related fields
Registered nurses and registered psychiatric nurses 51.0
Pharmacists 7.1
Occupational therapists 3.3
Physiotherapists 3.2
Other professional occupations in therapy and assessment 2.1
Elementary school and kindergarten teachers 1.2
Health policy researchers, consultants and program officers 1.1
Secondary school teachers 1.1
Dietitians and nutritionists 1.0
Social and community service workers 1.0
Personal, protective and transportation services
Police officers (except commissioned) 18.0
College and other vocational instructors 6.3
Security guards and related security service occupations 4.9
Employment insurance, immigration, border services and revenue officers 4.6
Lawyers and Quebec notaries 3.6
Probation and parole officers and related occupations 3.6
Inspectors in public and environmental health and occupational health and safety 3.3
General office support workers 2.9
Administrative officers 2.1
Correctional service officers 1.8
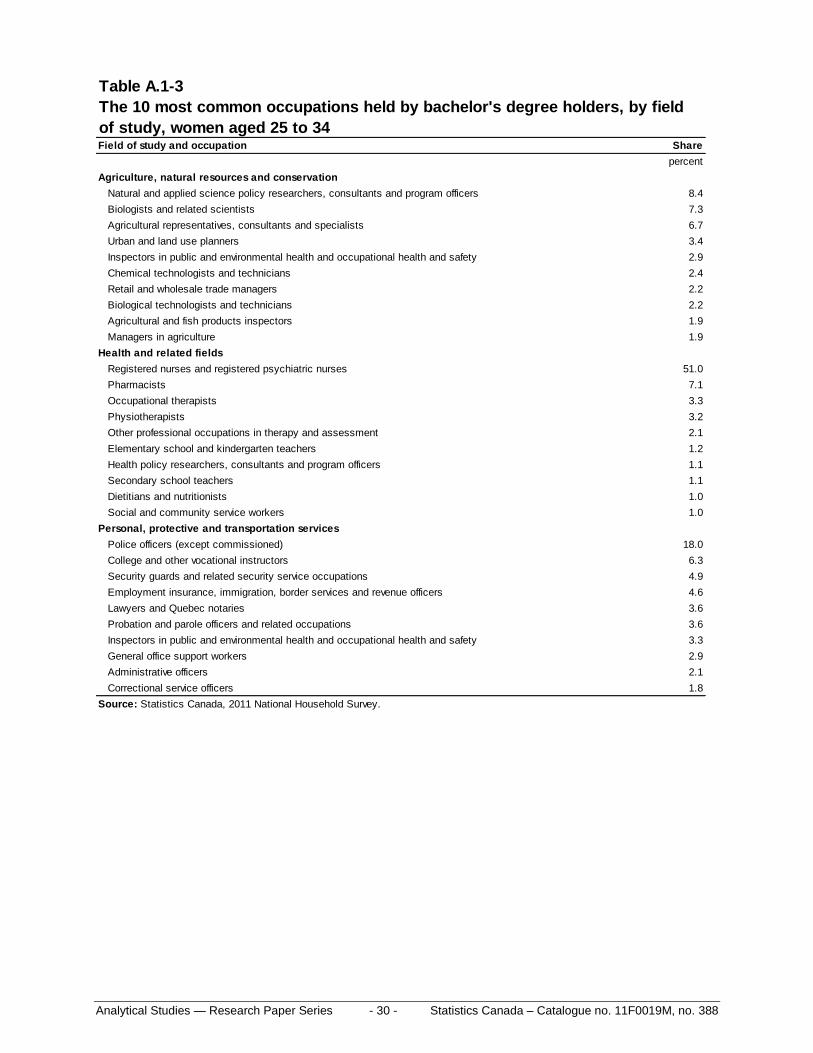
Table A.1-3
The 10 most common occupations held by bachelor's degree holders, by field
of study, women aged 25 to 34
Source: Statistics Canada, 2011 National Household Survey.

Analytical Studies — Research Paper Series - 31 - Statistics Canada – Catalogue no. 11F0019M, no. 388
Field of study and occupation Share
percent
Education
Instructors of persons with disabilities 27.2
Elementary and secondary school teacher assistants 12.9
Social and community service workers 11.1
Elementary school and kindergarten teachers 5.1
Secondary school teachers 4.5
Other customer and information services representatives 2.5
Construction trades helpers and labourers 2.5
Banking, insurance and other financial clerks 2.0
Early childhood educators and assistants 1.8
College and other vocational instructors 1.4
Visual and performing arts, and communications technologies
Graphic designers and illustrators 13.5
Retail salespersons 3.8
Audio and video recording technicians 3.5
Retail and wholesale trade managers 2.9
Producers, directors, choreographers and related occupations 2.6
Computer programmers and interactive media developers 2.5
Graphic arts technicians 1.9
Web designers and developers 1.7
Other customer and information services representatives 1.7
Sales and account representatives - wholesale trade (non-technical) 1.3
Humanities
Retail salespersons 7.2
Retail and wholesale trade managers 4.1
Other customer and information services representatives 2.6
Material handlers 2.3
Professional occupations in religion 2.3
Corporate sales managers 2.1
Cooks 2.0
Shippers and receivers 2.0
Transport truck drivers 1.8
Construction trades helpers and labourers 1.7
Social and behavioural sciences and law
Police officers (except commissioned) 4.8
Retail salespersons 3.9
Retail and wholesale trade managers 3.2
Early childhood educators and assistants 2.5
Journalists 2.5
Security guards and related security service occupations 2.4
Technical occupations in geomatics and meteorology 2.1
Professional occupations in advertising, marketing and public relations 2.0
Other customer and information services representatives 2.0
Social and community service workers 2.0
Table A.2-1
The 10 most common occupations held by college graduates, by field of study,
men aged 25 to 34
Source: Statistics Canada, 2011 National Household Survey.

Analytical Studies — Research Paper Series - 32 - Statistics Canada – Catalogue no. 11F0019M, no. 388
Field of study and occupation Share
percent
Business, management and public administration
Retail salespersons 6.1
Retail and wholesale trade managers 5.3
Sales and account representatives - wholesale trade (non-technical) 2.6
Financial auditors and accountants 2.6
Other financial officers 2.5
Insurance agents and brokers 2.4
Other customer and information services representatives 2.4
Corporate sales managers 2.1
Restaurant and food service managers 2.0
Financial sales representatives 1.9
Physical and life sciences and technologies
Chemical technologists and technicians 10.7
Geological and mineral technologists and technicians 3.3
Electrical and electronics engineering technologists and technicians 2.4
Petroleum, gas and chemical process operators 2.4
Chemical plant machine operators 2.3
Biological technologists and technicians 2.2
Medical laboratory technicians and pathologists' assistants 2.1
Retail salespersons 1.9
Retail and wholesale trade managers 1.7
Chemists 1.6
Mathematics, computer and information sciences
Computer network technicians 13.5
Computer programmers and interactive media developers 13.1
Information systems analysts and consultants 10.5
User support technicians 9.8
Electronic service technicians (household and business equipment) 3.8
Computer and information systems managers 2.6
Web designers and developers 2.3
Retail salespersons 2.2
Other customer and information services representatives 1.7
Retail and wholesale trade managers 1.4
Architecture, engineering, and related technologies
Automotive service technicians, truck and bus mechanics and mechanical repairers 5.9
Electrical and electronics engineering technologists and technicians 3.9
Electricians (except industrial and power system) 3.6
Construction millwrights and industrial mechanics 2.6
Drafting technologists and technicians 2.5
Welders and related machine operators 2.4
Carpenters 2.1
Mechanical engineering technologists and technicians 1.9
Electronic service technicians (household and business equipment) 1.8
Computer network technicians 1.7
Table A.2-2
The 10 most common occupations held by college graduates, by field of study,
men aged 25 to 34
Source: Statistics Canada, 2011 National Household Survey.

Analytical Studies — Research Paper Series - 33 - Statistics Canada – Catalogue no. 11F0019M, no. 388
Field of study and occupation Share
percent
Agriculture, natural resources and conservation
Managers in agriculture 8.4
Landscape and horticulture technicians and specialists 4.9
Landscaping and grounds maintenance labourers 4.1
Forestry technologists and technicians 4.1
General farm workers 3.4
Retail salespersons 2.4
Contractors and supervisors, landscaping, grounds maintenance and horticulture services 2.1
Conservation and fishery officers 2.0
Biological technologists and technicians 1.8
Transport truck drivers 1.8
Health and related fields
Paramedical occupations 17.6
Registered nurses and registered psychiatric nurses 6.5
Nurse aides, orderlies and patient service associates 4.3
Program leaders and instructors in recreation, sport and fitness 4.1
Retail salespersons 2.5
Firefighters 2.5
Medical radiation technologists 2.1
Social and community service workers 2.0
Licensed practical nurses 2.0
Other medical technologists and technicians (except dental health) 1.6
Personal, protective and transportation services
Police officers (except commissioned) 18.5
Security guards and related security service occupations 7.4
Firefighters 6.8
Chefs 5.7
Cooks 4.0
Correctional service officers 3.1
Air pilots, flight engineers and flying instructors 2.8
Transport truck drivers 2.2
Retail salespersons 1.7
Heavy equipment operators (except crane) 1.3
Table A.2-3
The 10 most common occupations held by college graduates, by field of study,
men aged 25 to 34
Source: Statistics Canada, 2011 National Household Survey.

Analytical Studies — Research Paper Series - 34 - Statistics Canada – Catalogue no. 11F0019M, no. 388
Field of study and occupation Share
percent
Education
Instructors of persons with disabilities 22.5
Elementary and secondary school teacher assistants 17.5
Early childhood educators and assistants 12.6
Social and community service workers 9.7
Elementary school and kindergarten teachers 3.9
Retail salespersons 1.6
Secondary school teachers 1.6
Administrative assistants 1.6
Nurse aides, orderlies and patient service associates 1.3
College and other vocational instructors 1.3
Visual and performing arts, and communications technologies
Graphic designers and illustrators 11.7
Retail salespersons 5.5
Interior designers and interior decorators 5.0
Retail and wholesale trade managers 4.7
Administrative assistants 3.4
Other customer and information services representatives 3.0
Theatre, fashion, exhibit and other creative designers 2.4
Receptionists 2.1
Food and beverage servers 1.8
Sales and account representatives - wholesale trade (non-technical) 1.7
Humanities
Administrative assistants 6.3
Retail salespersons 5.6
Retail and wholesale trade managers 4.3
Other customer and information services representatives 4.1
General office support workers 4.1
Administrative officers 3.5
Early childhood educators and assistants 3.0
Food counter attendants, kitchen helpers and related support occupations 2.7
Food and beverage servers 2.6
Social and community service workers 2.2
Social and behavioural sciences and law
Early childhood educators and assistants 27.8
Legal administrative assistants 6.7
Paralegal and related occupations 5.4
Social and community service workers 4.0
Administrative assistants 3.2
Elementary and secondary school teacher assistants 2.5
Administrative officers 2.0
General office support workers 2.0
Other customer and information services representatives 2.0
Professional occupations in advertising, marketing and public relations 1.9
Table A.3-1
The 10 most common occupations held by college graduates, by field of study,
women aged 25 to 34
Source: Statistics Canada, 2011 National Household Survey.

Analytical Studies — Research Paper Series - 35 - Statistics Canada – Catalogue no. 11F0019M, no. 388
Field of study and occupation Share
percent
Business, management and public administration
Administrative assistants 8.1
Administrative officers 5.7
Accounting and related clerks 4.6
General office support workers 4.2
Social and community service workers 3.7
Other customer and information services representatives 3.4
Financial auditors and accountants 3.0
Accounting technicians and bookkeepers 2.8
Retail salespersons 2.6
Receptionists 2.4
Physical and life sciences and technologies
Chemical technologists and technicians 16.0
Medical laboratory technicians and pathologists' assistants 9.9
Medical laboratory technologists 5.1
Biological technologists and technicians 4.8
Elementary and secondary school teacher assistants 4.0
Other medical technologists and technicians (except dental health) 2.5
Retail salespersons 2.3
Biologists and related scientists 2.0
Other customer and information services representatives 1.7
Post-secondary teaching and research assistants 1.6
Mathematics, computer and information sciences
Information systems analysts and consultants 6.8
Computer programmers and interactive media developers 5.3
Administrative assistants 4.7
Computer network technicians 4.3
User support technicians 3.8
Library and public archive technicians 3.4
Accounting and related clerks 3.3
Other customer and information services representatives 3.2
Records management technicians 2.9
Administrative officers 2.8
Architecture, engineering, and related technologies
Drafting technologists and technicians 7.5
Architectural technologists and technicians 4.7
Civil engineering technologists and technicians 3.0
Chemical technologists and technicians 2.4
Electrical and electronics engineering technologists and technicians 2.4
Retail salespersons 2.2
Construction managers 2.1
Construction inspectors 2.0
Inspectors in public and environmental health and occupational health and safety 1.8
Other customer and information services representatives 1.6
Table A.3-2
The 10 most common occupations held by college graduates, by field of study,
women aged 25 to 34
Source: Statistics Canada, 2011 National Household Survey.

Analytical Studies — Research Paper Series - 36 - Statistics Canada – Catalogue no. 11F0019M, no. 388
Field of study and occupation Share
percent
Agriculture, natural resources and conservation
Animal health technologists and veterinary technicians 5.8
Retail salespersons 4.2
Managers in agriculture 4.0
Purchasing agents and officers 3.5
Forestry technologists and technicians 3.2
General farm workers 3.1
Landscape and horticulture technicians and specialists 3.0
Chemical technologists and technicians 2.8
Administrative officers 2.7
Landscaping and grounds maintenance labourers 2.6
Health and related fields
Registered nurses and registered psychiatric nurses 14.5
Nurse aides, orderlies and patient service associates 6.8
Licensed practical nurses 6.3
Dental assistants 4.7
Dental hygienists and dental therapists 4.3
Other medical technologists and technicians (except dental health) 3.9
Receptionists 3.8
Animal health technologists and veterinary technicians 3.0
Administrative assistants 2.5
General office support workers 2.5
Personal, protective and transportation services
Police officers (except commissioned) 9.8
Hairstylists and barbers 7.8
Estheticians, electrologists and related occupations 5.6
Cooks 3.8
Security guards and related security service occupations 3.5
Social and community service workers 2.8
Chefs 2.7
Retail and wholesale trade managers 2.7
Correctional service officers 2.7
Administrative assistants 2.6
Table A.3-3
The 10 most common occupations held by college graduates, by field of study,
women aged 25 to 34
Source: Statistics Canada, 2011 National Household Survey.

Analytical Studies — Research Paper Series - 37 - Statistics Canada – Catalogue no. 11F0019M, no. 388
Sex and educational level
coefficient standard
error
coefficient standard
error
coefficient standard
error
coefficient standard
error
coefficient standard
error
Men
Less than high school -0.880 *** 0.008 -0.885 *** 0.008 -0.488 *** 0.009 -0.438 *** 0.006 -0.750 *** 0.008
High school -0.551 *** 0.005 -0.542 *** 0.005 -0.301 *** 0.005 -0.360 *** 0.004 -0.450 *** 0.005
Trades certificate -0.654 *** 0.008 -0.670 *** 0.008 -0.249 *** 0.009 -0.153 *** 0.007 -0.445 *** 0.008
Registered apprenticeship -0.657 *** 0.008 -0.674 *** 0.008 0.025 ** 0.009 0.030 *** 0.007 -0.283 *** 0.007
College 0.005 0.005 -0.036 *** 0.005 0.076 *** 0.005 0.158 *** 0.005 0.103 *** 0.005
Bachelor's degree 0.697 *** 0.004 0.656 *** 0.005 0.615 *** 0.006 0.488 *** 0.007 0.671 *** 0.005
Master's degree 0.936 *** 0.011 0.891 *** 0.010 0.661 *** 0.018 0.733 *** 0.017 0.811 *** 0.012
Doctorate 1.415 *** 0.025 1.332 *** 0.029 0.744 *** 0.042 1.135 *** 0.051 0.942 *** 0.027
Professional degree 1.518 *** 0.027 1.294 *** 0.023 0.066 ** 0.022 1.099 *** 0.040 1.172 *** 0.018
Women
Less than high school -0.609 *** 0.015 -0.555 *** 0.016 -0.458 *** 0.014 -0.640 *** 0.009 -0.658 *** 0.017
High school -0.232 *** 0.006 -0.189 *** 0.007 -0.220 *** 0.006 -0.540 *** 0.004 -0.347 *** 0.007
Trades certificate -0.290 *** 0.012 -0.235 *** 0.011 -0.256 *** 0.011 -0.328 *** 0.011 -0.386 *** 0.012
Registered apprenticeship -0.477 *** 0.018 -0.352 *** 0.018 -0.307 *** 0.018 -0.243 *** 0.017 -0.361 *** 0.018
College 0.110 *** 0.004 0.150 *** 0.004 -0.061 *** 0.004 -0.108 *** 0.005 -0.048 *** 0.005
Bachelor's degree 0.582 *** 0.004 0.591 *** 0.004 0.187 *** 0.005 0.300 *** 0.006 0.479 *** 0.004
Master's degree 0.869 *** 0.008 0.886 *** 0.008 0.277 *** 0.011 0.673 *** 0.012 0.699 *** 0.008
Doctorate 1.370 *** 0.032 1.251 *** 0.034 0.370 *** 0.040 1.086 *** 0.059 0.876 *** 0.035
Professional degree 1.478 *** 0.022 1.299 *** 0.018 0.015 0.014 1.138 *** 0.034 1.105 *** 0.018
Table A.4-1
Regression results for skill-level requirements, by educational level, men and women aged 25 to 34
Reading comprehension Writing Mathematics Science
Process, complex
problem solving, and
systems
** significantly different from reference category (p < 0.01)
*** significantly different from reference category (p < 0.001)
Note: Results account for differences in age, age squared, and immigrant status.
Sources: Statistics Canada, 2011 National Household Survey; and U.S. Department of Labor, Occupational Information Network (O*NET) version 17.0.

Analytical Studies — Research Paper Series - 38 - Statistics Canada – Catalogue no. 11F0019M, no. 388
Sex and educational level
Average coefficient
across all skill areas
coefficient standard
error
coefficient standard
error
coefficient standard
error
coefficient standard
error
mean
Men
Less than high school -0.819 *** 0.009 0.519 *** 0.008 -0.497 *** 0.007 -0.442 *** 0.010 -0.520
High school -0.468 *** 0.006 0.338 *** 0.005 -0.300 *** 0.004 -0.219 *** 0.006 -0.317
Trades certificate -0.637 *** 0.008 0.868 *** 0.009 -0.221 *** 0.007 -0.281 *** 0.007 -0.271
Registered apprenticeship -0.579 *** 0.008 1.359 *** 0.009 -0.071 *** 0.006 -0.114 *** 0.008 -0.107
College -0.033 *** 0.005 0.446 *** 0.005 0.302 *** 0.005 0.096 *** 0.005 0.124
Bachelor's degree 0.506 *** 0.004 -0.165 *** 0.005 0.753 *** 0.008 0.477 *** 0.005 0.522
Master's degree 0.629 *** 0.009 -0.343 *** 0.012 0.784 *** 0.020 0.514 *** 0.014 0.624
Doctorate 0.710 *** 0.021 -0.406 *** 0.026 0.736 *** 0.038 0.196 *** 0.035 0.756
Professional degree 1.296 *** 0.020 -0.477 *** 0.019 0.341 *** 0.020 0.668 *** 0.017 0.775
Women
Less than high school -0.445 *** 0.017 -0.362 *** 0.010 -0.582 *** 0.012 -0.434 *** 0.018 -0.527
High school -0.126 *** 0.007 -0.457 *** 0.005 -0.394 *** 0.005 -0.221 *** 0.007 -0.303
Trades certificate -0.162 *** 0.012 -0.425 *** 0.007 -0.421 *** 0.009 -0.281 *** 0.012 -0.309
Registered apprenticeship -0.225 *** 0.019 -0.265 *** 0.017 -0.376 *** 0.014 -0.334 *** 0.023 -0.327
College 0.150 *** 0.005 -0.467 *** 0.004 -0.180 *** 0.004 -0.104 *** 0.006 -0.062
Bachelor's degree 0.571 *** 0.004 -0.561 *** 0.003 0.105 *** 0.004 0.249 *** 0.005 0.278
Master's degree 0.738 *** 0.008 -0.571 *** 0.006 0.341 *** 0.010 0.360 *** 0.010 0.475
Doctorate 0.858 *** 0.030 -0.627 *** 0.022 0.310 *** 0.033 0.166 *** 0.038 0.629
Professional degree 1.259 *** 0.018 -0.561 *** 0.012 0.224 *** 0.015 0.582 *** 0.016 0.727
Table A.4-2
Regression results for skill-level requirements, by educational level, men and women aged 25 to 34
*** significantly different from reference category (p < 0.001)
Note: Results account for differences in age, age squared, and immigrant status.
Sources: Statistics Canada, 2011 National Household Survey; and U.S. Department of Labor, Occupational Information Network (O*NET) version 17.0.
Social
Technical operation and
maintenance
Technical design and
analysis Resource management

Analytical Studies — Research Paper Series - 39 - Statistics Canada – Catalogue no. 11F0019M, no. 388
Sex and field of study
coefficient standard
error
coefficient standard
error
coefficient standard
error
coefficient standard
error
coefficient standard
error
Men
Education 0.407 *** 0.013 0.439 *** 0.015 -0.149 *** 0.018 -0.206 *** 0.011 0.349 *** 0.010
Visual and performing arts, and communications
technologies 0.152 *** 0.031 0.184 *** 0.031 -0.214 *** 0.033 -0.163 *** 0.030 0.145 *** 0.031
Humanities 0.375 *** 0.018 0.411 *** 0.019 0.066 ** 0.022 -0.105 *** 0.019 0.311 *** 0.020
Social and behavioural sciences and law 0.526 *** 0.014 0.570 *** 0.015 0.256 *** 0.016 0.002 0.014 0.464 *** 0.014
Business, management and public administration 0.677 *** 0.007 0.734 *** 0.007 0.769 *** 0.011 0.046 *** 0.010 0.750 *** 0.009
Physical and life sciences and technologies 0.728 *** 0.022 0.649 *** 0.022 0.517 *** 0.025 0.847 *** 0.031 0.504 *** 0.020
Mathematics, computer and information sciences 0.815 *** 0.011 0.644 *** 0.011 0.648 *** 0.015 0.822 *** 0.018 0.803 *** 0.013
Architecture, engineering, and related technologies 1.147 *** 0.009 0.923 *** 0.008 1.462 *** 0.015 1.580 *** 0.015 1.107 *** 0.009
Agriculture, natural resources and conservation 0.519 *** 0.043 0.519 *** 0.041 0.442 *** 0.048 0.825 *** 0.060 0.430 *** 0.039
Health and related fields 0.587 *** 0.021 0.544 *** 0.020 0.057 * 0.024 0.855 *** 0.026 0.545 *** 0.017
Personal, protective and transportation services 0.458 *** 0.048 0.421 *** 0.055 0.222 ** 0.074 0.369 *** 0.076 0.591 *** 0.060
High school -0.551 *** 0.005 -0.542 *** 0.005 -0.301 *** 0.005 -0.360 *** 0.004 -0.450 *** 0.005
Women
Education 0.177 *** 0.008 0.196 *** 0.008 -0.400 *** 0.009 -0.110 *** 0.008 0.248 *** 0.007
Visual and performing arts, and communications
technologies 0.242 *** 0.022 0.289 *** 0.021 -0.110 *** 0.032 -0.243 *** 0.020 0.133 *** 0.022
Humanities 0.458 *** 0.016 0.514 *** 0.017 -0.007 0.016 -0.212 *** 0.017 0.224 *** 0.017
Social and behavioural sciences and law 0.575 *** 0.009 0.613 *** 0.009 0.078 *** 0.010 0.012 0.012 0.382 *** 0.010
Business, management and public administration 0.709 *** 0.007 0.768 *** 0.008 0.516 *** 0.010 0.135 *** 0.011 0.638 *** 0.009
Physical and life sciences and technologies 0.709 *** 0.016 0.659 *** 0.016 0.387 *** 0.019 0.789 *** 0.027 0.423 *** 0.015
Mathematics, computer and information sciences 0.808 *** 0.020 0.724 *** 0.021 0.611 *** 0.029 0.591 *** 0.033 0.724 *** 0.023
Architecture, engineering, and related technologies 1.099 *** 0.019 0.915 *** 0.015 1.367 *** 0.028 1.405 *** 0.032 1.056 *** 0.020
Agriculture, natural resources and conservation 0.696 *** 0.036 0.667 *** 0.033 0.510 *** 0.048 0.747 *** 0.063 0.505 *** 0.040
Health and related fields 0.809 *** 0.007 0.745 *** 0.007 0.251 *** 0.009 1.334 *** 0.013 0.762 *** 0.008
Personal, protective and transportation services 0.595 *** 0.066 0.608 *** 0.078 0.033 0.066 0.166 * 0.075 0.471 *** 0.079
High school -0.231 *** 0.006 -0.189 *** 0.007 -0.220 *** 0.006 -0.540 *** 0.004 -0.347 *** 0.007
Note: Results account for differences in age, age squared, and immigrant status.
Sources: Statistics Canada, 2011 National Household Survey; and U.S. Department of Labor, Occupational Information Network (O*NET) version 17.0.
Process, complex
problem solving, and
systemsReading comprehension Writing Mathematics Science
Table A.5-1
Regression results for skill-level requirements of bachelor's degree holders, by field of study, men and women
aged 25 to 34
* significantly different from reference category (p < 0.05)
** significantly different from reference category (p < 0.01)
*** significantly different from reference category (p < 0.001)

Analytical Studies — Research Paper Series - 40 - Statistics Canada – Catalogue no. 11F0019M, no. 388
Sex and field of study
Average coefficient
across all skill areas
coefficient standard
error
coefficient standard
error
coefficient standard
error
coefficient standard
error
mean
Men
Education 0.521 *** 0.012 -0.643 *** 0.013 -0.417 *** 0.012 -0.134 * 0.061 0.019
Visual and performing arts, and communications
technologies 0.137 *** 0.029 -0.250 *** 0.035 0.373 *** 0.040 0.094 *** 0.021 0.051
Humanities 0.412 *** 0.019 -0.325 *** 0.019 0.121 *** 0.023 0.236 *** 0.048 0.167
Social and behavioural sciences and law 0.510 *** 0.013 -0.423 *** 0.012 0.216 *** 0.015 0.354 *** 0.031 0.275
Business, management and public administration 0.634 *** 0.008 -0.583 *** 0.009 0.432 *** 0.011 0.613 *** 0.016 0.453
Physical and life sciences and technologies 0.366 *** 0.019 -0.069 *** 0.020 0.555 *** 0.027 0.273 *** 0.050 0.486
Mathematics, computer and information sciences 0.353 *** 0.011 0.190 *** 0.016 2.086 *** 0.028 0.376 *** 0.013 0.749
Architecture, engineering, and related technologies 0.530 *** 0.008 0.568 *** 0.012 1.883 *** 0.016 0.917 *** 0.009 1.124
Agriculture, natural resources and conservation 0.257 *** 0.035 0.017 0.037 0.419 *** 0.043 0.306 *** 0.034 0.415
Health and related fields 0.709 *** 0.020 -0.218 *** 0.019 0.095 *** 0.019 0.334 *** 0.024 0.390
Personal, protective and transportation services 0.557 *** 0.064 0.069 0.068 0.091 † 0.049 0.487 *** 0.016 0.363
High school -0.468 *** 0.006 0.338 *** 0.005 -0.300 *** 0.004 -0.219 *** 0.006 -0.317
Women
Education 0.359 *** 0.007 -0.708 *** 0.004 -0.456 *** 0.005 -0.209 *** 0.007 -0.100
Visual and performing arts, and communications
technologies 0.257 *** 0.022 -0.550 *** 0.015 0.161 *** 0.026 0.138 *** 0.028 0.035
Humanities 0.386 *** 0.016 -0.664 *** 0.009 -0.056 *** 0.015 0.109 *** 0.018 0.084
Social and behavioural sciences and law 0.552 *** 0.009 -0.665 *** 0.006 0.056 *** 0.009 0.228 *** 0.011 0.203
Business, management and public administration 0.672 *** 0.009 -0.759 *** 0.005 0.258 *** 0.009 0.429 *** 0.009 0.374
Physical and life sciences and technologies 0.382 *** 0.013 -0.247 *** 0.015 0.274 *** 0.019 0.171 *** 0.015 0.394
Mathematics, computer and information sciences 0.435 *** 0.019 -0.203 *** 0.025 1.287 *** 0.048 0.320 *** 0.021 0.589
Architecture, engineering, and related technologies 0.590 *** 0.015 0.253 *** 0.018 1.527 *** 0.033 0.930 *** 0.023 1.016
Agriculture, natural resources and conservation 0.386 *** 0.032 -0.310 *** 0.032 0.360 *** 0.033 0.322 *** 0.042 0.432
Health and related fields 1.036 *** 0.008 -0.321 *** 0.005 0.044 *** 0.007 0.514 *** 0.009 0.575
Personal, protective and transportation services 0.571 *** 0.071 -0.427 *** 0.057 0.003 0.057 0.206 ** 0.079 0.247
High school -0.126 *** 0.007 -0.457 *** 0.005 -0.394 *** 0.005 -0.220 *** 0.007 -0.303
Table A.5-2
Regression results for skill-level requirements of bachelor's degree holders, by field of study, men and women aged
25 to 34
Sources: Statistics Canada, 2011 National Household Survey; and U.S. Department of Labor, Occupational Information Network (O*NET) version 17.0.
Social
Technical operation and
maintenance
Technical design and
analysis Resource management
* significantly different from reference category (p < 0.05)
** significantly different from reference category (p < 0.01)
*** significantly different from reference category (p < 0.001)
† significantly different from reference category (p < 0.10)
Note: Results account for differences in age, age squared, and immigrant status.

Analytical Studies — Research Paper Series - 41 - Statistics Canada – Catalogue no. 11F0019M, no. 388
Sex and field of study
coefficient standard
error
coefficient standard
error
coefficient standard
error
coefficient standard
error
coefficient standard
error
Men
Education 0.089 † 0.053 0.154 ** 0.054 -0.289 *** 0.049 -0.227 *** 0.044 0.084 † 0.051
Visual and performing arts, and communications
technologies -0.047 * 0.019 -0.045 * 0.020 -0.261 *** 0.020 -0.252 *** 0.016 -0.057 ** 0.020
Humanities -0.282 *** 0.040 -0.232 *** 0.042 -0.221 *** 0.037 -0.349 *** 0.023 -0.204 *** 0.041
Social and behavioural sciences and law 0.140 *** 0.031 0.204 *** 0.037 -0.123 *** 0.036 -0.143 *** 0.025 0.079 ** 0.029
Business, management and public administration 0.183 *** 0.012 0.219 *** 0.013 0.216 *** 0.013 -0.280 *** 0.010 0.218 *** 0.013
Physical and life sciences and technologies 0.135 ** 0.047 0.076 † 0.045 0.268 *** 0.053 0.643 *** 0.054 0.066 0.044
Mathematics, computer and information sciences 0.503 *** 0.012 0.310 *** 0.012 0.313 *** 0.016 0.517 *** 0.014 0.515 *** 0.014
Architecture, engineering, and related technologies -0.156 *** 0.009 -0.225 *** 0.009 0.197 *** 0.010 0.360 *** 0.009 0.029 ** 0.009
Agriculture, natural resources and conservation -0.382 *** 0.034 -0.333 *** 0.034 -0.101 ** 0.037 0.201 *** 0.037 -0.205 *** 0.033
Health and related fields -0.030 0.025 -0.114 *** 0.024 -0.255 *** 0.028 0.576 *** 0.026 0.086 *** 0.024
Personal, protective and transportation services -0.103 *** 0.015 -0.100 *** 0.016 -0.226 *** 0.013 0.028 * 0.014 0.029 † 0.015
High school -0.551 *** 0.005 -0.542 *** 0.005 -0.301 *** 0.005 -0.360 *** 0.004 -0.450 *** 0.005
Women
Education 0.039 0.024 0.167 *** 0.020 -0.300 *** 0.019 -0.294 *** 0.015 0.018 0.024
Visual and performing arts, and communications
technologies 0.077 *** 0.018 0.133 *** 0.020 -0.083 *** 0.023 -0.352 *** 0.016 -0.009 0.021
Humanities 0.039 0.033 0.079 * 0.033 -0.089 ** 0.031 -0.470 *** 0.026 -0.131 *** 0.037
Social and behavioural sciences and law 0.000 0.012 0.167 *** 0.012 -0.295 *** 0.012 -0.359 *** 0.010 -0.193 *** 0.013
Business, management and public administration 0.263 *** 0.007 0.252 *** 0.007 0.111 *** 0.007 -0.448 *** 0.007 -0.025 ** 0.008
Physical and life sciences and technologies 0.334 *** 0.035 0.279 *** 0.034 0.376 *** 0.037 0.883 *** 0.062 0.092 ** 0.034
Mathematics, computer and information sciences 0.276 *** 0.021 0.158 *** 0.024 0.049 † 0.027 -0.083 ** 0.026 0.046 † 0.027
Architecture, engineering, and related technologies 0.200 *** 0.023 0.150 *** 0.021 0.483 *** 0.031 0.360 *** 0.027 0.185 *** 0.023
Agriculture, natural resources and conservation -0.122 ** 0.045 -0.091 * 0.044 -0.029 0.047 0.167 *** 0.050 -0.183 *** 0.046
Health and related fields 0.062 *** 0.008 0.106 *** 0.008 -0.172 *** 0.009 0.527 *** 0.013 -0.007 0.009
Personal, protective and transportation services -0.231 *** 0.020 -0.152 *** 0.020 -0.283 *** 0.015 -0.285 *** 0.014 -0.183 *** 0.021
High school -0.231 *** 0.006 -0.189 *** 0.007 -0.220 *** 0.006 -0.540 *** 0.004 -0.347 *** 0.007
Table A.6-1
Regression results for skill-level requirements of college graduates, by field of study, men and women aged 25 to 34
Writing Mathematics Science
Process, complex
problem solving, and
systemsReading comprehension
Note: Results account for differences in age, age squared, and immigrant status.
Sources: Statistics Canada, 2011 National Household Survey; and U.S. Department of Labor, Occupational Information Network (O*NET) version 17.0.
* significantly different from reference category (p < 0.05)
** significantly different from reference category (p < 0.01)
*** significantly different from reference category (p < 0.001)
† significantly different from reference category (p < 0.10)

Analytical Studies — Research Paper Series - 42 - Statistics Canada – Catalogue no. 11F0019M, no. 388
Sex and field of study
Average coefficient
across all skill areas
coefficient standard
error
coefficient standard
error
coefficient standard
error
coefficient standard
error
mean
Men
Education 0.332 *** 0.053 -0.558 *** 0.054 -0.363 *** 0.034 -0.295 *** 0.061 -0.119
Visual and performing arts, and communications
technologies -0.088 *** 0.019 -0.028 0.022 0.288 *** 0.022 -0.043 * 0.021 -0.059
Humanities -0.107 * 0.048 0.022 0.033 -0.188 *** 0.032 -0.043 0.048 -0.178
Social and behavioural sciences and law 0.160 *** 0.029 -0.229 *** 0.026 0.051 † 0.030 0.061 * 0.031 0.022
Business, management and public administration 0.319 *** 0.013 -0.275 *** 0.013 0.077 *** 0.012 0.303 *** 0.016 0.109
Physical and life sciences and technologies -0.177 *** 0.042 0.477 *** 0.043 0.219 *** 0.048 -0.011 0.050 0.188
Mathematics, computer and information sciences 0.208 *** 0.011 0.632 *** 0.020 1.483 *** 0.024 0.254 *** 0.013 0.526
Architecture, engineering, and related technologies -0.316 *** 0.009 1.053 *** 0.010 0.349 *** 0.010 0.013 0.009 0.145
Agriculture, natural resources and conservation -0.373 *** 0.033 0.536 *** 0.030 -0.148 *** 0.028 -0.053 0.034 -0.095
Health and related fields 0.200 *** 0.024 0.084 *** 0.019 -0.135 *** 0.017 -0.046 † 0.024 0.041
Personal, protective and transportation services 0.089 *** 0.016 0.185 *** 0.015 -0.186 *** 0.012 0.142 *** 0.016 -0.016
High school -0.468 *** 0.006 0.338 *** 0.005 -0.300 *** 0.004 -0.219 *** 0.006 -0.317
Women
Education 0.294 *** 0.024 -0.732 *** 0.010 -0.349 *** 0.013 -0.416 *** 0.028 -0.175
Visual and performing arts, and communications
technologies 0.125 *** 0.020 -0.440 *** 0.016 0.161 *** 0.022 0.067 * 0.026 -0.036
Humanities 0.121 *** 0.034 -0.572 *** 0.022 -0.250 *** 0.032 -0.076 † 0.042 -0.150
Social and behavioural sciences and law 0.041 *** 0.012 -0.626 *** 0.007 -0.251 *** 0.009 -0.461 *** 0.015 -0.220
Business, management and public administration 0.204 *** 0.008 -0.679 *** 0.006 -0.215 *** 0.007 0.016 * 0.008 -0.058
Physical and life sciences and technologies -0.005 0.034 0.132 *** 0.038 0.026 0.030 -0.056 0.044 0.229
Mathematics, computer and information sciences 0.035 0.024 -0.200 *** 0.027 0.487 *** 0.040 -0.012 0.029 0.084
Architecture, engineering, and related technologies -0.051 * 0.023 0.230 *** 0.032 0.330 *** 0.025 0.160 *** 0.027 0.228
Agriculture, natural resources and conservation -0.189 *** 0.046 -0.144 *** 0.034 -0.179 *** 0.032 -0.127 ** 0.045 -0.100
Health and related fields 0.246 *** 0.008 -0.268 *** 0.007 -0.288 *** 0.007 -0.126 *** 0.009 0.009
Personal, protective and transportation services 0.021 0.022 -0.383 *** 0.014 -0.317 *** 0.013 -0.076 ** 0.024 -0.210
High school -0.126 *** 0.007 -0.457 *** 0.005 -0.394 *** 0.005 -0.220 *** 0.007 -0.303
Social
Technical operation and
maintenance
Technical design and
analysis Resource management
Table A.6-2
Regression results for skill-level requirements of college graduates, by field of study, men and women aged 25 to 34
Note: Results account for differences in age, age squared, and immigrant status.
Sources: Statistics Canada, 2011 National Household Survey; and U.S. Department of Labor, Occupational Information Network (O*NET) version 17.0.
* significantly different from reference category (p < 0.05)
** significantly different from reference category (p < 0.01)
*** significantly different from reference category (p < 0.001)
† significantly different from reference category (p < 0.10)

Analytical Studies — Research Paper Series - 43 - Statistics Canada – Catalogue no. 11F0019M, no. 388
Sex and educational level
coefficient standard
error
coefficient standard
error
coefficient standard
error
coefficient standard
error
coefficient standard
error
Men
Less than high school -0.866 *** 0.008 -0.914 *** 0.008 -0.470 *** 0.008 -0.417 *** 0.006 -0.710 *** 0.008
High school -0.553 *** 0.005 -0.560 *** 0.005 -0.276 *** 0.005 -0.357 *** 0.003 -0.433 *** 0.006
Trades certificate -0.688 *** 0.007 -0.734 *** 0.007 -0.287 *** 0.008 -0.170 *** 0.007 -0.441 *** 0.008
Registered apprenticeship -0.718 *** 0.007 -0.825 *** 0.008 -0.105 *** 0.009 0.000 0.007 -0.308 *** 0.007
College -0.061 *** 0.005 -0.090 *** 0.005 0.003 0.005 0.116 *** 0.005 0.067 *** 0.005
Bachelor's degree 0.633 *** 0.004 0.610 *** 0.005 0.563 *** 0.006 0.427 *** 0.007 0.632 *** 0.005
Master's degree 0.861 *** 0.009 0.838 *** 0.009 0.584 *** 0.017 0.662 *** 0.016 0.752 *** 0.012
Doctorate 1.008 *** 0.018 0.967 *** 0.021 0.586 *** 0.038 1.179 *** 0.058 0.781 *** 0.030
Professional degree 1.335 *** 0.021 1.257 *** 0.023 -0.119 *** 0.023 1.268 *** 0.044 1.290 *** 0.021
Women
Less than high school -0.608 *** 0.016 -0.504 *** 0.016 -0.190 *** 0.017 -0.619 *** 0.009 -0.627 *** 0.017
High school -0.202 *** 0.007 -0.118 *** 0.006 -0.027 *** 0.008 -0.527 *** 0.004 -0.357 *** 0.007
Trades certificate -0.220 *** 0.012 -0.158 *** 0.011 -0.148 *** 0.012 -0.295 *** 0.011 -0.365 *** 0.012
Registered apprenticeship -0.467 *** 0.019 -0.333 *** 0.017 -0.156 *** 0.019 -0.194 *** 0.019 -0.253 *** 0.020
College 0.173 *** 0.004 0.226 *** 0.004 -0.064 *** 0.005 -0.063 *** 0.005 -0.074 *** 0.005
Bachelor's degree 0.669 *** 0.004 0.671 *** 0.004 0.187 *** 0.005 0.322 *** 0.006 0.534 *** 0.004
Master's degree 0.908 *** 0.007 0.891 *** 0.008 0.195 *** 0.011 0.688 *** 0.013 0.728 *** 0.009
Doctorate 1.000 *** 0.023 1.035 *** 0.024 0.269 *** 0.037 1.186 *** 0.065 0.805 *** 0.039
Professional degree 1.313 *** 0.020 1.256 *** 0.018 -0.156 *** 0.014 1.322 *** 0.038 1.227 *** 0.019
Reading comprehension Writing Mathematics Science
Process, complex
problem solving, and
systems
Table A.7-1
Regression results for skill-importance requirements by educational level, men and women aged 25 to 34
*** significantly different from reference category (p < 0.001)
Sources: Statistics Canada, 2011 National Household Survey; and U.S. Department of Labor, Occupational Information Network (O*NET) version 17.0.
Note: Results account for differences in age, age squared, and immigrant status.

Analytical Studies — Research Paper Series - 44 - Statistics Canada – Catalogue no. 11F0019M, no. 388
Sex and educational level
coefficient standard
error
coefficient standard
error
coefficient standard
error
coefficient standard
error
Men
Less than high school -0.760 *** 0.009 0.562 *** 0.008 -0.478 *** 0.007 -0.395 *** 0.010
High school -0.417 *** 0.006 0.359 *** 0.005 -0.282 *** 0.004 -0.187 *** 0.006
Trades certificate -0.689 *** 0.008 0.929 *** 0.010 -0.210 *** 0.007 -0.277 *** 0.007
Registered apprenticeship -0.747 *** 0.008 1.419 *** 0.010 -0.081 *** 0.006 -0.137 *** 0.009
College -0.150 *** 0.005 0.422 *** 0.005 0.315 *** 0.005 0.073 *** 0.005
Bachelor's degree 0.334 *** 0.004 -0.247 *** 0.004 0.733 *** 0.008 0.426 *** 0.005
Master's degree 0.394 *** 0.010 -0.407 *** 0.010 0.749 *** 0.018 0.433 *** 0.013
Doctorate 0.262 *** 0.023 -0.445 *** 0.021 0.650 *** 0.033 0.111 *** 0.032
Professional degree 0.997 *** 0.019 -0.523 *** 0.017 0.293 *** 0.019 0.598 *** 0.014
Women
Less than high school -0.202 *** 0.016 -0.329 *** 0.010 -0.577 *** 0.012 -0.388 *** 0.017
High school 0.063 *** 0.007 -0.438 *** 0.005 -0.381 *** 0.005 -0.187 *** 0.008
Trades certificate 0.031 ** 0.011 -0.401 *** 0.007 -0.398 *** 0.010 -0.238 *** 0.012
Registered apprenticeship 0.018 0.019 -0.235 *** 0.017 -0.359 *** 0.015 -0.287 *** 0.024
College 0.236 *** 0.004 -0.464 *** 0.004 -0.168 *** 0.004 -0.087 *** 0.006
Bachelor's degree 0.627 *** 0.004 -0.566 *** 0.003 0.072 *** 0.004 0.239 *** 0.005
Master's degree 0.654 *** 0.009 -0.579 *** 0.006 0.319 *** 0.009 0.325 *** 0.010
Doctorate 0.536 *** 0.031 -0.623 *** 0.018 0.253 *** 0.027 0.091 * 0.038
Professional degree 0.969 *** 0.015 -0.595 *** 0.010 0.190 *** 0.015 0.519 *** 0.016
Table A.7-2
Regression results for skill-importance requirements by educational level, men and women
aged 25 to 34
Note: Results account for differences in age, age squared, and immigrant status.
Sources: Statistics Canada, 2011 National Household Survey; and U.S. Department of Labor, Occupational Information Network (O*NET) version 17.0.
Social
Technical operation and
maintenance
Technical design and
analysis Resource management
* significantly different from reference category (p < 0.05)
** significantly different from reference category (p < 0.01)
*** significantly different from reference category (p < 0.001)

Analytical Studies — Research Paper Series - 45 - Statistics Canada – Catalogue no. 11F0019M, no. 388
Sex and field of study
coefficient standard
error
coefficient standard
error
coefficient standard
error
coefficient standard
error
coefficient standard
error
Men
Education 0.653 *** 0.012 0.696 *** 0.056 -0.042 ** 0.015 -0.176 *** 0.012 0.773 *** 0.012
Visual and performing arts, and communications
technologies 0.101 ** 0.032 0.195 *** 0.020 -0.301 *** 0.033 -0.215 *** 0.027 0.071 * 0.032
Humanities 0.405 *** 0.019 0.419 *** 0.043 0.060 ** 0.021 -0.121 *** 0.018 0.318 *** 0.022
Social and behavioural sciences and law 0.538 *** 0.015 0.584 *** 0.037 0.220 *** 0.017 -0.025 † 0.013 0.420 *** 0.014
Business, management and public administration 0.687 *** 0.008 0.739 *** 0.014 0.853 *** 0.013 -0.002 0.009 0.672 *** 0.010
Physical and life sciences and technologies 0.581 *** 0.019 0.521 *** 0.042 0.452 *** 0.024 0.932 *** 0.035 0.461 *** 0.020
Mathematics, computer and information sciences 0.769 *** 0.011 0.494 *** 0.012 0.523 *** 0.015 0.625 *** 0.016 0.766 *** 0.013
Architecture, engineering, and related technologies 0.823 *** 0.008 0.706 *** 0.009 1.202 *** 0.014 1.398 *** 0.014 0.919 *** 0.008
Agriculture, natural resources and conservation 0.357 *** 0.037 0.423 *** 0.032 0.355 *** 0.042 0.896 *** 0.063 0.378 *** 0.037
Health and related fields 0.496 *** 0.022 0.555 *** 0.025 0.041 0.027 0.936 *** 0.029 0.679 *** 0.020
Personal, protective and transportation services 0.585 *** 0.051 0.477 *** 0.015 0.100 0.074 0.397 *** 0.074 0.732 *** 0.066
High school -0.553 *** 0.005 -0.560 *** 0.005 -0.276 *** 0.005 -0.357 *** 0.003 -0.433 *** 0.006
Women
Education 0.546 *** 0.007 0.520 *** 0.008 -0.156 *** 0.008 -0.041 *** 0.008 0.724 *** 0.008
Visual and performing arts, and communications
technologies 0.233 *** 0.024 0.300 *** 0.021 -0.153 *** 0.035 -0.265 *** 0.020 0.033 0.024
Humanities 0.566 *** 0.017 0.598 *** 0.016 0.000 0.016 -0.212 *** 0.016 0.192 *** 0.018
Social and behavioural sciences and law 0.632 *** 0.009 0.678 *** 0.009 0.050 *** 0.011 0.007 0.012 0.329 *** 0.011
Business, management and public administration 0.818 *** 0.008 0.796 *** 0.007 0.565 *** 0.012 0.097 *** 0.011 0.563 *** 0.010
Physical and life sciences and technologies 0.583 *** 0.014 0.582 *** 0.013 0.345 *** 0.018 0.893 *** 0.030 0.357 *** 0.016
Mathematics, computer and information sciences 0.814 *** 0.017 0.695 *** 0.017 0.576 *** 0.030 0.471 *** 0.031 0.694 *** 0.023
Architecture, engineering, and related technologies 0.801 *** 0.015 0.739 *** 0.013 1.146 *** 0.026 1.263 *** 0.032 0.881 *** 0.019
Agriculture, natural resources and conservation 0.516 *** 0.031 0.559 *** 0.028 0.378 *** 0.042 0.823 *** 0.067 0.392 *** 0.040
Health and related fields 0.839 *** 0.008 0.837 *** 0.007 0.047 *** 0.010 1.475 *** 0.014 0.932 *** 0.009
Personal, protective and transportation services 0.639 *** 0.072 0.693 *** 0.071 -0.080 0.067 0.176 * 0.074 0.516 *** 0.085
High school -0.202 *** 0.007 -0.118 *** 0.006 -0.027 *** 0.008 -0.527 *** 0.004 -0.356 *** 0.007
Note: Results account for differences in age, age squared, and immigrant status.
Sources: Statistics Canada, 2011 National Household Survey; and U.S. Department of Labor, Occupational Information Network (O*NET) version 17.0.
Table A.8-1
Regression results for skill-importance requirements of bachelor's degree holders, by field of study, men and women
aged 25 to 34
* significantly different from reference category (p < 0.05)
** significantly different from reference category (p < 0.01)
*** significantly different from reference category (p < 0.001)
† significantly different from reference category (p < 0.10)
Reading comprehension Writing Mathematics Science
Process, complex
problem solving, and
systems

Analytical Studies — Research Paper Series - 46 - Statistics Canada – Catalogue no. 11F0019M, no. 388
Sex and field of study
coefficient standard
error
coefficient standard
error
coefficient standard
error
coefficient standard
error
Men
Education 0.975 *** 0.012 -0.578 *** 0.013 -0.502 *** 0.013 -0.027 * 0.012
Visual and performing arts, and communications
technologies 0.084 * 0.033 -0.268 *** 0.033 0.417 *** 0.040 0.040 0.040
Humanities 0.419 *** 0.020 -0.332 *** 0.017 0.143 *** 0.023 0.256 *** 0.025
Social and behavioural sciences and law 0.439 *** 0.013 -0.431 *** 0.012 0.215 *** 0.014 0.335 *** 0.017
Business, management and public administration 0.490 *** 0.010 -0.592 *** 0.008 0.409 *** 0.011 0.590 *** 0.011
Physical and life sciences and technologies 0.185 *** 0.019 -0.116 *** 0.019 0.500 *** 0.025 0.224 *** 0.023
Mathematics, computer and information sciences -0.080 *** 0.013 0.029 * 0.014 2.270 *** 0.031 0.262 *** 0.015
Architecture, engineering, and related technologies 0.035 *** 0.008 0.260 *** 0.010 1.758 *** 0.015 0.732 *** 0.012
Agriculture, natural resources and conservation 0.153 *** 0.037 -0.010 0.036 0.374 *** 0.044 0.331 *** 0.034
Health and related fields 0.705 *** 0.021 -0.251 *** 0.018 0.096 *** 0.020 0.340 *** 0.026
Personal, protective and transportation services 0.538 *** 0.069 0.058 0.070 0.115 * 0.047 0.462 *** 0.072
High school -0.417 *** 0.006 0.359 *** 0.005 -0.282 *** 0.004 -0.187 *** 0.006
Women
Education 1.037 *** 0.007 -0.652 *** 0.003 -0.537 *** 0.005 -0.069 *** 0.007
Visual and performing arts, and communications
technologies 0.287 *** 0.025 -0.550 *** 0.014 0.185 *** 0.027 0.106 *** 0.030
Humanities 0.444 *** 0.014 -0.643 *** 0.008 -0.044 ** 0.015 0.114 *** 0.018
Social and behavioural sciences and law 0.538 *** 0.009 -0.656 *** 0.005 0.056 *** 0.009 0.209 *** 0.011
Business, management and public administration 0.542 *** 0.009 -0.743 *** 0.005 0.234 *** 0.009 0.413 *** 0.009
Physical and life sciences and technologies 0.267 *** 0.016 -0.275 *** 0.013 0.198 *** 0.017 0.128 *** 0.015
Mathematics, computer and information sciences 0.163 *** 0.025 -0.293 *** 0.020 1.356 *** 0.050 0.244 *** 0.022
Architecture, engineering, and related technologies 0.177 *** 0.016 0.018 0.013 1.346 *** 0.029 0.784 *** 0.024
Agriculture, natural resources and conservation 0.264 *** 0.034 -0.328 *** 0.029 0.308 *** 0.032 0.322 *** 0.045
Health and related fields 1.026 *** 0.007 -0.381 *** 0.004 0.006 0.008 0.404 *** 0.009
Personal, protective and transportation services 0.524 *** 0.067 -0.422 *** 0.051 0.045 0.056 0.215 ** 0.078
High school 0.063 *** 0.007 -0.438 *** 0.005 -0.381 *** 0.005 -0.187 *** 0.008
Table A.8-2
Regression results for skill-importance requirements of bachelor's degree holders, by field of study,
men and women aged 25 to 34
Sources: Statistics Canada, 2011 National Household Survey; and U.S. Department of Labor, Occupational Information Network (O*NET) version 17.0.
Social
Technical operation and
maintenance
Technical design and
analysis Resource management
* significantly different from reference category (p < 0.05)
** significantly different from reference category (p < 0.01)
*** significantly different from reference category (p < 0.001)
Note: Results account for differences in age, age squared, and immigrant status.

Analytical Studies — Research Paper Series - 47 - Statistics Canada – Catalogue no. 11F0019M, no. 388
Sex and field of study
coefficient standard
error
coefficient standard
error
coefficient standard
error
coefficient standard
error
coefficient standard
error
Men
Education 0.248 *** 0.061 0.262 *** 0.056 -0.340 *** 0.056 -0.182 *** 0.047 0.271 *** 0.062
Visual and performing arts, and communications
technologies -0.123 *** 0.017 -0.037 † 0.020 -0.344 *** 0.018 -0.295 *** 0.014 -0.135 *** 0.019
Humanities -0.272 *** 0.044 -0.265 *** 0.043 -0.181 *** 0.036 -0.347 *** 0.022 -0.199 *** 0.044
Social and behavioural sciences and law 0.155 *** 0.033 0.220 *** 0.037 -0.156 *** 0.037 -0.158 *** 0.024 0.045 0.029
Business, management and public administration 0.170 *** 0.013 0.213 *** 0.014 0.264 *** 0.014 -0.299 *** 0.009 0.167 *** 0.013
Physical and life sciences and technologies 0.019 0.044 0.046 0.042 0.246 *** 0.050 0.687 *** 0.057 0.004 0.043
Mathematics, computer and information sciences 0.431 *** 0.012 0.197 *** 0.012 0.188 *** 0.015 0.341 *** 0.013 0.444 *** 0.013
Architecture, engineering, and related technologies -0.250 *** 0.008 -0.332 *** 0.009 0.081 *** 0.010 0.294 *** 0.008 -0.044 *** 0.009
Agriculture, natural resources and conservation -0.433 *** 0.031 -0.410 *** 0.032 -0.166 *** 0.035 0.271 *** 0.039 -0.197 *** 0.033
Health and related fields -0.224 *** 0.027 -0.092 *** 0.025 -0.423 *** 0.026 0.665 *** 0.028 0.091 *** 0.024
Personal, protective and transportation services -0.125 *** 0.017 -0.094 *** 0.015 -0.291 *** 0.013 0.048 *** 0.014 0.150 *** 0.016
High school -0.553 *** 0.005 -0.560 *** 0.005 -0.276 *** 0.005 -0.357 *** 0.003 -0.433 *** 0.006
Women
Education 0.163 *** 0.028 0.263 *** 0.022 -0.384 *** 0.024 -0.220 *** 0.015 0.164 *** 0.028
Visual and performing arts, and communications
technologies 0.044 * 0.019 0.170 *** 0.019 -0.093 *** 0.024 -0.368 *** 0.015 -0.118 *** 0.020
Humanities 0.073 * 0.036 0.163 *** 0.036 0.029 0.030 -0.460 *** 0.026 -0.159 *** 0.039
Social and behavioural sciences and law 0.080 *** 0.012 0.269 *** 0.012 -0.432 *** 0.012 -0.296 *** 0.010 -0.208 *** 0.014
Business, management and public administration 0.353 *** 0.007 0.372 *** 0.007 0.216 *** 0.007 -0.440 *** 0.007 -0.096 *** 0.008
Physical and life sciences and technologies 0.190 *** 0.032 0.293 *** 0.028 0.290 *** 0.047 1.029 *** 0.067 0.022 0.033
Mathematics, computer and information sciences 0.283 *** 0.019 0.184 *** 0.022 0.049 † 0.028 -0.150 *** 0.024 -0.037 0.027
Architecture, engineering, and related technologies 0.101 *** 0.019 0.109 *** 0.021 0.383 *** 0.030 0.334 *** 0.026 0.047 * 0.023
Agriculture, natural resources and conservation -0.141 ** 0.043 -0.113 ** 0.043 -0.009 0.046 0.253 *** 0.052 -0.228 *** 0.045
Health and related fields 0.159 *** 0.009 0.151 *** 0.008 -0.248 *** 0.010 0.644 *** 0.014 0.017 † 0.010
Personal, protective and transportation services -0.207 *** 0.021 -0.084 *** 0.021 -0.198 *** 0.017 -0.241 *** 0.014 -0.076 *** 0.022
High school -0.202 *** 0.007 -0.118 *** 0.006 -0.027 *** 0.008 -0.527 *** 0.004 -0.356 *** 0.007
Sources: Statistics Canada, 2011 National Household Survey; and U.S. Department of Labor, Occupational Information Network (O*NET) version 17.0.
Note: Results account for differences in age, age squared, and immigrant status.
Table A.9-1
Regression results for skill-importance requirements of college graduates, by field of study, men and women
aged 25 to 34
* significantly different from reference category (p < 0.05)
** significantly different from reference category (p < 0.01)
*** significantly different from reference category (p < 0.001)
† significantly different from reference category (p < 0.10)
Reading comprehension Writing Mathematics Science
Process, complex
problem solving, and
systems

Analytical Studies — Research Paper Series - 48 - Statistics Canada – Catalogue no. 11F0019M, no. 388
Sex and field of study
coefficient standard
error
coefficient standard
error
coefficient standard
error
coefficient standard
error
Men
Education 0.568 *** 0.058 -0.525 *** 0.053 -0.366 *** 0.038 -0.215 *** 0.061
Visual and performing arts, and communications
technologies -0.175 *** 0.019 -0.040 † 0.021 0.341 *** 0.022 -0.103 *** 0.021
Humanities -0.019 0.049 0.030 0.035 -0.174 *** 0.033 -0.023 0.049
Social and behavioural sciences and law 0.137 *** 0.029 -0.240 *** 0.025 0.058 † 0.030 0.058 † 0.031
Business, management and public administration 0.335 *** 0.014 -0.286 *** 0.013 0.085 *** 0.012 0.320 *** 0.015
Physical and life sciences and technologies -0.346 *** 0.037 0.429 *** 0.042 0.184 *** 0.048 -0.046 0.052
Mathematics, computer and information sciences -0.133 *** 0.012 0.474 *** 0.018 1.554 *** 0.024 0.178 *** 0.013
Architecture, engineering, and related technologies -0.519 *** 0.008 1.044 *** 0.010 0.339 *** 0.010 -0.037 *** 0.009
Agriculture, natural resources and conservation -0.427 *** 0.032 0.546 *** 0.032 -0.155 *** 0.028 0.028 0.038
Health and related fields 0.191 *** 0.024 0.081 *** 0.019 -0.154 *** 0.017 -0.093 *** 0.026
Personal, protective and transportation services 0.121 *** 0.018 0.201 *** 0.016 -0.157 *** 0.012 0.188 *** 0.018
High school -0.417 *** 0.006 0.359 *** 0.005 -0.282 *** 0.004 -0.187 *** 0.006
Women
Education 0.569 *** 0.024 -0.694 *** 0.010 -0.328 *** 0.015 -0.318 *** 0.026
Visual and performing arts, and communications
technologies 0.158 *** 0.019 -0.454 *** 0.015 0.199 *** 0.022 0.042 † 0.025
Humanities 0.282 *** 0.033 -0.560 *** 0.020 -0.235 *** 0.032 -0.042 0.042
Social and behavioural sciences and law 0.189 *** 0.011 -0.587 *** 0.007 -0.215 *** 0.010 -0.388 *** 0.015
Business, management and public administration 0.288 *** 0.007 -0.658 *** 0.005 -0.198 *** 0.007 0.050 *** 0.009
Physical and life sciences and technologies -0.132 *** 0.039 0.090 * 0.036 -0.028 0.027 -0.070 † 0.039
Mathematics, computer and information sciences -0.079 ** 0.027 -0.261 *** 0.024 0.516 *** 0.040 -0.056 † 0.031
Architecture, engineering, and related technologies -0.203 *** 0.024 0.179 *** 0.032 0.305 *** 0.023 0.127 *** 0.026
Agriculture, natural resources and conservation -0.175 *** 0.043 -0.153 *** 0.033 -0.185 *** 0.031 -0.076 0.048
Health and related fields 0.326 *** 0.008 -0.293 *** 0.007 -0.304 *** 0.007 -0.160 *** 0.009
Personal, protective and transportation services 0.238 *** 0.020 -0.366 *** 0.013 -0.286 *** 0.013 -0.028 0.024
High school 0.063 *** 0.007 -0.438 *** 0.005 -0.381 *** 0.005 -0.187 *** 0.008
Table A.9-2
Regression results for skill-importance requirements of college graduates, by field of study, men and
women aged 25 to 34
Note: Results account for differences in age, age squared, and immigrant status.
Sources: Statistics Canada, 2011 National Household Survey; and U.S. Department of Labor, Occupational Information Network (O*NET) version 17.0.
Social
Technical operation and
maintenance
Technical design and
analysis Resource management
* significantly different from reference category (p < 0.05)
** significantly different from reference category (p < 0.01)
*** significantly different from reference category (p < 0.001)
† significantly different from reference category (p < 0.10)

Analytical Studies — Research Paper Series - 49 - Statistics Canada – Catalogue no. 11F0019M, no. 388
-0.40
-0.30
-0.20
-0.10
0.00
0.10
0.20
0.30
0.40
0.50
0.60
Men Women
regression coefficient
Sex and fields of study
Chart A.1
Regression results for reading comprehension skill-level
requirements, college graduates
Education Visual and performing arts, and communications technologies
Humanities Social and behavioural sciences and law
Business, management and public administration Physical and life sciences and technologies
Mathematics, computer and information sciences Architecture, engineering, and related technologies
Agriculture, natural resources and conservation Health and related fields
Personal, protective and transportation services
Sources: Statistics Canada, 2011 National Household Survey; and U.S. Department of Labor, Occupational Information Network (O*NET) version 17.0.
Note: The coefficient for women in Social and behavioural sciences and law is not missing; rather, it is very close to zero (0.0001).
-0.40
-0.30
-0.20
-0.10
0.00
0.10
0.20
0.30
0.40
Men Women
regression coefficient
Sex and fields of study
Chart A.2
Regression results for writing skill-level requirements, college
graduates
Education Visual and performing arts, and communications technologies
Humanities Social and behavioural sciences and law
Business, management and public administration Physical and life sciences and technologies
Mathematics, computer and information sciences Architecture, engineering, and related technologies
Agriculture, natural resources and conservation Health and related fields
Personal, protective and transportation services
Sources: Statistics Canada, 2011 National Household Survey; and U.S. Department of Labor, Occupational Information Network (O*NET) version 17.0.

Analytical Studies — Research Paper Series - 50 - Statistics Canada – Catalogue no. 11F0019M, no. 388
-0.30
-0.20
-0.10
0.00
0.10
0.20
0.30
0.40
0.50
Men Women
regression coefficient
Sex and fields of study
Chart A.3
Regression results for mathematics skill-level requirements,
college graduates
Education Visual and performing arts, and communications technologies
Humanities Social and behavioural sciences and law
Business, management and public administration Physical and life sciences and technologies
Mathematics, computer and information sciences Architecture, engineering, and related technologies
Agriculture, natural resources and conservation Health and related fields
Personal, protective and transportation services
Sources: Statistics Canada, 2011 National Household Survey; and U.S. Department of Labor, Occupational Information Network (O*NET) version 17.0.
-0.50
-0.40
-0.30
-0.20
-0.10
0.00
0.10
0.20
0.30
0.40
0.50
0.60
0.70
0.80
0.90
Men Women
regression coefficient
Sex and fields of study
Chart A.4
Regression results for science skill-level requirements, college
graduates
Education Visual and performing arts, and communications technologies
Humanities Social and behavioural sciences and law
Business, management and public administration Physical and life sciences and technologies
Mathematics, computer and information sciences Architecture, engineering, and related technologies
Agriculture, natural resources and conservation Health and related fields
Personal, protective and transportation services
Sources: Statistics Canada, 2011 National Household Survey; and U.S. Department of Labor, Occupational Information Network (O*NET) version 17.0.

Analytical Studies — Research Paper Series - 51 - Statistics Canada – Catalogue no. 11F0019M, no. 388
-0.30
-0.20
-0.10
0.00
0.10
0.20
0.30
0.40
0.50
0.60
Men Women
regression coefficient
Sex and fields of study
Chart A.5
Regression results for process, complex problem solving and
systems skill-level requirements, college graduates
Education Visual and performing arts, and communications technologies
Humanities Social and behavioural sciences and law
Business, management and public administration Physical and life sciences and technologies
Mathematics, computer and information sciences Architecture, engineering, and related technologies
Agriculture, natural resources and conservation Health and related fields
Personal, protective and transportation services
Sources: Statistics Canada, 2011 National Household Survey; and U.S. Department of Labor, Occupational Information Network (O*NET) version 17.0.
-0.40
-0.30
-0.20
-0.10
0.00
0.10
0.20
0.30
0.40
Men Women
regression coefficient
Sex and fields of study
Chart A.6
Regression results for social skill-level requirements, college
graduates
Education Visual and performing arts, and communications technologies
Humanities Social and behavioural sciences and law
Business, management and public administration Physical and life sciences and technologies
Mathematics, computer and information sciences Architecture, engineering, and related technologies
Agriculture, natural resources and conservation Health and related fields
Personal, protective and transportation services
Sources: Statistics Canada, 2011 National Household Survey; and U.S. Department of Labor, Occupational Information Network (O*NET) version 17.0.

Analytical Studies — Research Paper Series - 52 - Statistics Canada – Catalogue no. 11F0019M, no. 388
-0.80-0.70-0.60-0.50-0.40-0.30-0.20-0.100.000.100.200.300.400.500.600.700.800.901.001.10
Men Women
regression coefficient
Sex and fields of study
Chart A.7
Regression results for technical operation and maintenance
skill-level requirements, college graduates
Education Visual and performing arts, and communications technologies
Humanities Social and behavioural sciences and law
Business, management and public administration Physical and life sciences and technologies
Mathematics, computer and information sciences Architecture, engineering, and related technologies
Agriculture, natural resources and conservation Health and related fields
Personal, protective and transportation services
Sources: Statistics Canada, 2011 National Household Survey; and U.S. Department of Labor, Occupational Information Network (O*NET) version 17.0.
-0.40-0.30-0.20-0.100.000.100.200.300.400.500.600.700.800.901.001.101.201.301.401.50
Men Women
regression coefficient
Sex and fields of study
Chart A.8
Regression results for technical design and analysis skill-level
requirements, college graduates
Education Visual and performing arts, and communications technologies
Humanities Social and behavioural sciences and law
Business, management and public administration Physical and life sciences and technologies
Mathematics, computer and information sciences Architecture, engineering, and related technologies
Agriculture, natural resources and conservation Health and related fields
Personal, protective and transportation services
Sources: Statistics Canada, 2011 National Household Survey; and U.S. Department of Labor, Occupational Information Network (O*NET) version 17.0.

Analytical Studies — Research Paper Series - 53 - Statistics Canada – Catalogue no. 11F0019M, no. 388
-0.50
-0.40
-0.30
-0.20
-0.10
0.00
0.10
0.20
0.30
0.40
Men Women
regression coefficient
Sex and fields of study
Chart A.9
Regression results for resource management skill-level
requirements, college graduates
Education Visual and performing arts, and communications technologies
Humanities Social and behavioural sciences and law
Business, management and public administration Physical and life sciences and technologies
Mathematics, computer and information sciences Architecture, engineering, and related technologies
Agriculture, natural resources and conservation Health and related fields
Personal, protective and transportation services
Sources: Statistics Canada, 2011 National Household Survey; and U.S. Department of Labor, Occupational Information Network (O*NET) version 17.0.

Analytical Studies — Research Paper Series - 54 - Statistics Canada – Catalogue no. 11F0019M, no. 388
Appendix B O*NET definitions of skills
The following definitions of skills are from the National Center for O*NET Development (n.d., p. 8, 9). Reading comprehension: Understanding written sentences and paragraphs in related documents.
Writing: Communicating effectively in writing as appropriate for the needs of the audience.
Mathematics: Using mathematics to solve problems.
Science: Using scientific rules and methods to solve problems.
Process, complex problem solving, and systems
Active learning: Understanding the implications of new information for both current and future problem-solving and decision-making.
Complex problem solving: Identifying complex problems and reviewing related information to develop and evaluate options and implement solutions.
Critical thinking: Using logic and reasoning to identify the strengths and weaknesses of alternative solutions, conclusions or approaches to problems.
Judgement and decision making: Considering the relative costs and benefits of potential actions to choose the most appropriate one.
Learning strategies: Selecting and using training/instructional methods and procedures appropriate for the situation when learning or teaching new things.
Monitoring: Monitoring/assessing performance of yourself, other individuals, or organizations to make improvements or take corrective action.
Systems analysis: Determining how a system should work and how changes in conditions, operations, and the environment will affect outcomes.
Systems evaluation: Identifying measures or indicators of system performance and the actions needed to improve or correct performance, relative to the goals of the system.
Social
Active listening: Giving full attention to what other people are saying, taking time to understand the points being made, asking questions as appropriate, and not interrupting at inappropriate times.
Coordination: Adjusting actions in relation to others’ actions.
Instructing: Teaching others how to do something.
Negotiation: Bringing others together and trying to reconcile differences.
Persuasion: Persuading others to change their minds or behaviour.
Service orientation: Actively looking for ways to help people.
Social perceptiveness: Being aware of others’ reactions and understanding why they react as they do.
Speaking: Talking to others to convey information effectively.

Analytical Studies — Research Paper Series - 55 - Statistics Canada – Catalogue no. 11F0019M, no. 388
Technical operation and maintenance
Equipment maintenance: Performing routine maintenance on equipment and determining when and what kind of maintenance is needed.
Equipment selection: Determining the kind of tools and equipment needed to do a job.
Installation: Installing equipment, machines, wiring or programs to meet specifications.
Operation and control: Controlling operations of equipment or systems.
Operation monitoring: Watching gauges, dials or other indicators to make sure a machine is working properly.
Quality control analysis: Conducting tests and inspections of products, services or processes to evaluate quality or performance.
Repairing: Repairing machines or systems using the needed tools.
Troubleshooting: Determining causes of operating errors and deciding what to do about it.
Technical design and analysis
Operations analysis: Analyzing needs and product requirements to create a design.
Programming: Writing computer programs for various purposes.
Technology design: Generating or adapting equipment and technology to serve user needs.
Resource management
Management of financial resources: Determining how money will be spent to get the work done, and accounting for these expenditures.
Management of material resources: Obtaining and seeing to the appropriate use of equipment, facilities, and materials needed to do certain work.
Management of personnel resources: Motivating, developing, and directing people as they work, identifying the best people for the job.
Time management: Managing one’s own time and the time of others.

Analytical Studies — Research Paper Series - 56 - Statistics Canada – Catalogue no. 11F0019M, no. 388
Appendix C Examples of job tasks to determine skill-level ratings
The following is a selection of examples of job-related activities provided to job incumbents to help them assess their skill-level requirements on a scale of 1 to 7. These examples are from the O*NET Skills Questionnaire (O*NET Resource Center, n.d., p. 2–4, 7, 10, 12, 14, 19). Examples are shown below for one selected skill in each of the nine skill groups. Reading comprehension
“What level of reading comprehension is needed to perform your current job?” Examples include “Read step-by-step instructions for completing a form” (rated 2), “Read a memo from management describing new personnel policies” (rated 4), and “Read a scientific journal article describing surgical procedures” (rated 6).
Writing
“What level of writing is needed to perform your current job?” Examples include “Take a telephone message” (rated 2), “Write a memo to staff outlining new directives” (rated 4), and “Write a novel for publication” (rated 6).
Mathematics
“What level of mathematics is needed to perform your current job?” Examples include “Count the amount of change to be given to a customer” (rated 2), “Calculate the square footage of a new home under construction” (rated 4), and “Develop a mathematical model to simulate and resolve an engineering problem” (rated 6).
Science
“What level of science is needed to perform your current job?” Examples include “Conduct standard tests to determine soil quality” (rated 2), “Conduct product tests to ensure safety standards are met, following written instructions” (rated 4), and “Conduct analyses of aerodynamic systems to determine the practicality of an aircraft design” (rated 6).
Process, complex problem solving, and systems
“What level of complex problem solving is needed to perform your current job?” Examples include “Layout tools to complete a job” (rated 2), “Redesign a floor layout to take advantage of new manufacturing techniques” (rated 4), and “Develop and implement a plan to provide emergency relief for a major metropolitan area” (rated 6).
Social
“What level of social perceptiveness is needed to perform your current job?” Examples include “Notice that customers are angry because they have been waiting too long” (rated 2), “Be aware of how a coworker’s promotion will affect a work group” (rated 4), and “Counsel depressive patients during a crisis period” (rated 6).
Technical operation and maintenance
“What level of equipment maintenance is needed to perform your current job?” Examples include “Add oil to an engine as indicated by a gauge or warning light” (rated 2), “Clean moving parts in production machinery” (rated 4), and “Conduct maintenance checks on an experimental aircraft” (rated 6).

Analytical Studies — Research Paper Series - 57 - Statistics Canada – Catalogue no. 11F0019M, no. 388
Technical design and analysis
“What level of programming is needed to perform your current job?” Examples include “Write a program in BASIC to sort objects in a database” (rated 2), “Write a statistical analysis program to analyze demographic data” (rated 4), and “Write expert system programs to analyze ground radar geological data for probable existence of mineral deposits” (rated 6).
Resource management
“What level of management of personnel resources is needed to perform your current job?” Examples include “Encourage a coworker who is having difficulty finishing a piece of work” (rated 2), “Direct the activities of a road repair crew with minimal disruption of traffic flow” (rated 4), and “Plan, implement, and manage recruitment, training, and incentive programs for a high performance company” (rated 6).

Analytical Studies — Research Paper Series - 58 - Statistics Canada – Catalogue no. 11F0019M, no. 388
References
Andrews, F.M., J.N. Morgan, J.A. Sonquist, and L. Klem. 1967. Multiple Classification Analysis: A Report on a Computer Program for Multiple Regression Using Categorical Predictors. Ann Arbor, Michigan: Institute for Social Research.
Autor, D.H., and M.J. Handel. 2013. “Putting tasks to the test: Human capital, jobs tasks and wages.” Journal of Labor Economics 31 (S1): S59–S96.
Fleisher, M.S., and S. Tsacoumis. 2012. O*NET Analyst Occupational Skills Ratings: Analysis Cycle 12 Results. Alexandria, Virginia: Human Resources Research Organization.
Frank, K., M. Frenette, and R. Morissette. 2015. Labour Market Outcomes of Young Postsecondary Graduates, 2005 to 2012. Economic Insights, no. 50. Statistics Canada Catalogue no. 11-626-X. Ottawa: Statistics Canada.
Handel, M. 2012. Trends in Job Skill Demand in OECD Countries. OECD Social, Employment and Migration Working Papers, no. 143. Paris: OECD Publishing.
Imai, S., D. Stacey, and C. Warman. 2014. From Engineer to Taxi Driver? Language Proficiency and the Occupational Skills of Immigrants. Working Paper no. 40. Toronto: Department of Economics, Ryerson University.
National Center for O*NET Development. 2012. Data Dictionary: O*NET® 17.0 Database. Available at: http://www.onetcenter.org/dl_files/DataDictionary17_0.pdf (accessed September 1, 2016).
National Center for O*NET Development. n.d. The O*NET Content Model: Detailed Outline with Descriptions. Available at: https://www.onetcenter.org/dl_files/ContentModel_DetailedDesc.pdf (accessed May 25, 2016).
National Research Council. 2010. A Database for a Changing Economy: Review of the Occupational Information Network (O*NET). Ed. N.T. Tippins, M.L. Hilton, Panel to Review the Occupational Information Network (O*NET), Committee on National Statistics, Division of Behavioral and Social Sciences and Education. Washington, D.C.: National Academies Press.
O*NET Resource Center. n.d. O*NET Skills Questionnaire. Available at: http://www.onetcenter.org/dl_files/MS_Word/Skills.pdf (accessed September 1, 2016).
Ostrovsky, Y., and M. Frenette. 2014. The Cumulative Earnings of Postsecondary Graduates over 20 Years: Results by Field of Study. Economic Insights, no. 40. Statistics Canada Catalogue no. 11-626-X. Ottawa: Statistics Canada.
Quintini, G., and D. Venn. 2013. Back to Work: Re-employment, Earnings and Skill Use After Job Displacement. OECD Employment Analysis and Policy Division. Paris: OECD Publishing.
Robst, J. 2007. “Education and job match: The relatedness of college major and work.” Economics of Education Review 26 (4): 397–407.
Tsacoumis, S., and C.H. Van Iddekinge. 2006. A Comparison of Incumbent and Analyst Ratings of O*NET Skills. Alexandria, Virginia: Human Resources Research Organization.
Uppal, S., and S. LaRochelle-Côté. 2014. “Overqualification among recent university graduates in Canada.” Insights on Canadian Society. April. Statistics Canada Catalogue no. 75-006-X.
U.S. Department of Labor. 2012. O*NET Data Collection Program: Office of Management and Budget Clearance Package Supporting Statement, Part A. Washington, D.C.: Employment and Training Administration, U.S. Department of Labor.
Walmsley, P.T., M.W. Natali, and J.P. Campbell. 2012. “Only incumbent raters in O*NET? Oh yes! Oh no!” International Journal of Selection and Assessment 20 (3): 283–296.