Do Politicians Reward their Supporters? Regression … · FIRST DRAFT PRELIMINARY AND INCOMPLETE...
36
FIRST DRAFT PRELIMINARY AND INCOMPLETE – PLEASE DO NOT CITE Do Politicians Reward their Supporters? Regression Discontinuity Evidence from Ghana Edward Miguel * University of California, Berkeley and NBER Farhan Zaidi University of California, Berkeley January 2003 Abstract: We use a unique dataset collected from a random sample of schools in Ghana to test the “Patronage” hypothesis, that central government funds are targeted to districts that support the ruling party. We find evidence of patronage targeting to administrative districts, the level of government at which the national budget is allocated. However, there are no significant patronage effects at the parliamentary seat level. We further use 1996 and 2000 parliamentary election results to estimate incumbency effects for members of parliament, and can rule out even small incumbency effects (of 4 percentage points). These findings suggest a partial re-evaluation of the “conventional wisdom” on new African democracies: while there is some evidence of patronage, certain institutional arrangements – such as fiscal decentralization – partially limit the manipulation of public funds for political gain. These safeguards also appear to neutralize any potential electoral advantage that incumbents might reap from their position of power. *Correspondence to: Department of Economics, University of California, 549 Evans Hall #3880, Berkeley, CA 94720-3880, phone: (510) 642-7162, fax: (510) 642-6615, email: [email protected]. Frances Fontanilla has provided excellent research assistance. We thank Xiao Ye for her assistance with the data, and David Lee for many helpful discussions.
Transcript of Do Politicians Reward their Supporters? Regression … · FIRST DRAFT PRELIMINARY AND INCOMPLETE...

FIRST DRAFTPRELIMINARY AND INCOMPLETE –PLEASE DO NOT CITE
Do Politicians Reward their Supporters?Regression Discontinuity Evidence from Ghana
Edward Miguel*
University of California, Berkeley and NBER
Farhan ZaidiUniversity of California, Berkeley
January 2003
Abstract: We use a unique dataset collected from a random sample of schools in Ghana to testthe “Patronage” hypothesis, that central government funds are targeted to districts that supportthe ruling party. We find evidence of patronage targeting to administrative districts, the level ofgovernment at which the national budget is allocated. However, there are no significantpatronage effects at the parliamentary seat level. We further use 1996 and 2000 parliamentaryelection results to estimate incumbency effects for members of parliament, and can rule out evensmall incumbency effects (of 4 percentage points). These findings suggest a partial re-evaluationof the “conventional wisdom” on new African democracies: while there is some evidence ofpatronage, certain institutional arrangements – such as fiscal decentralization – partially limit themanipulation of public funds for political gain. These safeguards also appear to neutralize anypotential electoral advantage that incumbents might reap from their position of power.
*Correspondence to: Department of Economics, University of California, 549 Evans Hall #3880, Berkeley, CA94720-3880, phone: (510) 642-7162, fax: (510) 642-6615, email: [email protected]. Frances Fontanillahas provided excellent research assistance. We thank Xiao Ye for her assistance with the data, and David Lee formany helpful discussions.

1
1. Introduction
One relatively unexplored consequence of the wave of democratization that swept across Africa in the
1990s concerns the effect of democratization on the distribution of public resources. The Political
Science literature has conventionally categorized Africa’s historically autocratic governments as
“neopatrimonialist” regimes – that is, political systems wherein the ruler maintains the support needed to
remain in power by selectively distributing rents to loyal backers. To the extent that “patronage politics”
persisted through the early years of democratic transition, districts represented by the ruling party would
systematically receive higher funds, as a way to reward supporters.
The presence of “patronage” effects in public expenditure distributions in recently democratized
African countries would have important welfare consequences. African governments face the challenge
of providing public goods, such as health and education, to an impoverished citizenry often lacking the
resources to privately procure these services, and thus relatively small differences in public funding
across districts can produce large welfare disparities.
We use public funding data collected from a random sample of schools in Ghana to test the
“patronage” hypothesis. In particular, we estimate how 1996 Ghanaian parliamentary electoral
outcomes affected public school funding levels during 1998-99, using regression discontinuity and non-
parametric regression estimation methods. Note that public educational spending accounted for a
massive 35 percent of all Ghanaian government discretionary recurrent budget expenditures in 1998,
making it a key government expense. In the main finding of this paper, we find evidence of patronage
effects at the administrative district, the level of government at which the national budget is allocated:
administrative districts that the ruling party “swept” in the 1996 elections receive significantly more
public school funding. However, there is no evidence for patronage effects at the parliamentary seat level
(a lower level of government than administrative districts).
A related issue in newly democratizing African countries is the possibility of an electoral
“incumbency effect.” The advantage incumbents possess in re-election has been a major topic of study in

2
Political Science and has been estimated to be large in mature democracies.1 There might be an even
more pronounced incumbency effect in the developing world – and in new African democracies in
particular – due to the frequent weakness of government and civil society institutions designed to limit the
ability of incumbents to manipulate public funds to their political advantage. We use the 1996 and 2000
parliamentary election results to estimate incumbency effects in Ghana using a similar regression
discontinuity design, and find no significant effects. In fact, we can rule out small incumbency effects (of
four percentage points).
We believe the contribution of this paper to be threefold. First, this is the first paper (to our
knowledge) that exploits high-quality micro-level public finance data from less developed countries to
test these political economy theories of public investment. Second, we employ econometric methods –
regression discontinuity regression and non-parametric regression – that have rarely been employed in the
political economy, to generate more credible empirical results.
Finally, and perhaps most importantly, our findings suggest a partial re-evaluation of the
conventional wisdom about African democracies, that ruling parties are able to reward their supporters
and use the advantages of incumbency to win subsequent elections. In particular, we believe that
institutional arrangements – in the case of Ghana, the disparity between the unit of federal funds
disbursements (administrative districts) and the government unit of elections2 (parliamentary seats) –
partially severs the link between electoral outcomes and receipt of federal funds. The lack of a
meaningful incumbency advantage is consistent with a political system where the ruling party does not
have adequate mechanisms at its disposal to accurately target funds down to the level of parliamentary
seats. Of course, we do recognize that results from Ghana may not be fully generalizeable to all other
African settings – particularly where public finance institutions differ – and also acknowledge some
important limitations of our dataset, including the small sample size (192 schools), which leads to
statistically imprecise estimates.
1 Lee (2001) finds an incumbency effect of 8 percent in 1946-1998 U.S. House of Representatives elections.2 There are 110 administrative districts and 200 parliamentary seats in Ghana, as we discuss below.

3
The paper is organized as follows. Section 2 discusses the competing political economy theories
of public investment, Section 3 presents a brief overview of Ghanaian politics and its educational system,
and Section 4 describes our data from Ghana. Section 5 presents the empirical estimation strategy,
Section 6 the results, and the final section concludes.
2. Political Economy Theories of Public Spending
2.1.The Patronage Model of Politics
Weber (1968) defined patrimonial regimes as systems wherein a single individual rules with complete
authority and power in the context of traditional polities, and the common people are not citizens of a
state but rather mere extensions of the ruler’s household; as such, their rights are defined only as set forth
by the ruler. The ruler, in turn, “ensures the political stability of the regime and personal political
survival…by selectively distributing favors and material benefits to loyal followers who are not citizens
of the polity so much as the ruler’s clients.” (Bratton and van de Walle 1997) Weber distinguished
“patrimonial” authorities from “rational-legal” authorities, where in the latter the lines between the public
and private spheres are more concrete, and laws are established to protect the citizenry from political
leaders exercising personal discretion over the distribution of rights and privileges.
Whereas the pure patrimonialist concept was useful in analyzing villages or regional chiefdoms,
there was a need to generalize the concept to extend its applicability to national political regimes. The
term neopatrimonialism was coined for this purpose – specifically, to describe political systems that are a
hybrid of “patrimonial” traditions and “rational-legal” institutions. While neopatrimonialism was defined
to characterize a generic system of governance, its strongest applicability is in the analysis of developing
countries, and African countries in particular. Clapham (1985) claims that neopatrimonialism is “the
most salient type of authority” in the Third World because it “corresponds to the normal forms of social
organization in precolonial societies.” Bratton and van de Walle (1997: p. 62) assert that “although
neopatrimonial practices can be found in all polities, it is the core feature of politics in

4
Africa….[W]hereas personal relationships occur on the margins of all bureaucratic systems, they
constitute the foundation and superstructure of political institutions in Africa.”
Bratton and van de Walle go on to describe three political institutions characterizing these
neopatrimonialist regimes. First is presidentialism, which implies “the concentration of political power in
the hands of one individual.” (p. 63) Second is systematic clientelism, wherein “rulers rely on the award
of personal favors – including public sector jobs and the distribution of public resources through licenses,
contracts, and projects – in return for the mobilization of political support.” (p. 65) Third is the use of
state resources for political legitimization, “dipping into the state treasury for [leaders’] own political
needs.” (p. 66)
A natural implication of these institutions is that public resources in neopatrimonialist regimes
should be concentrated in areas where an autocratic ruler receives the strongest support, thus rewarding
loyalty and punishing disloyalty. It is possible that all districts won by the ruling party would
systematically receive higher funds, as a way to reward patrons of the party; alternatively, the “step” in
the function could occur only at a higher level of political support, or the function might be continuously
(rather discreetly) increasing with vote share. A key issue is how this pattern might persist through the
early years of democratic transition -- analyzing how election outcomes influence public investment
patterns allows us to test for this. The patronage effect is in contrast to the public choice theory prediction
that districts represented by the ruling party would receive, on average, funding no different from that of
opposition districts, controlling for the expected political vulnerability of the seat, as discussed below.
2.2. An Alternative Framework: “Public Choice” Models
Public choice theorists argue that the assumption of purely altruistic politicians is overly optimistic, and
instead assume that politicians have some private incentives and preferences that may lead to significant
departures from social welfare-maximizing behavior. In one widely used model, political representatives
devote significant effort towards ensuring their re-election (Levitt and Snyder, 1997). One important
application of this model is in the area of public spending. Several studies have confirmed the existence

5
of a political business cycle, wherein public spending fluctuates during the electoral cycle (Nordhaus
1975, Sachs and Alesina 1988, Remmer 1993, Block 2000). Other studies have attempted to establish the
distributional impact of re-election incentives on public spending by modeling the behavior of
representatives who seek to maximize their districts’ federal funds allocations in order to favorably
influence future voter decisions.
These models make two testable empirical assumptions, both of which find some support in the
data. The first is that federal spending levels actually influence voting behavior in ensuing elections.
Early attempts to estimate the relationship between funding levels and subsequent vote share generally
found weak results (Feldman and Jondrow 1984), in part because of omitted-variable bias problems; that
is, only at-risk politicians might exert effort to bring additional federal funds to their district. Yet using
district-level federal expenditure data from the US in the 1980s, Levitt and Snyder (1997) implement a
more convincing instrumental variable (IV) method and find that securing an additional $100 per capita in
non-transfer federal spending translates into a two percent vote increase for incumbent representatives.
The second, and perhaps more crucial, assumption is that the institutional framework of
government provides mechanisms by which politicians can increase the level of federal spending they
secure for their constituents. Studies of the U.S Congress have shown a relationship between
representatives’ individual characteristics (including tenure, committee assignments, and party rank) and
their districts’ levels of federal funding (Owens and Wade 1984). However, as it remains unclear how
much of a role individual politicians’ “effort” plays in targeting funds, a potentially more attractive
alternative is to examine incentives at the level of political parties. Of course, at this unit of analysis, the
optimization problem also changes, from maximizing individual re-election chances to maximizing
expected party seats won (or perhaps the likelihood of winning a majority of seats).
Still, evidence of party-level discretion in distributing public funds is somewhat limited. Levitt
and Snyder (1995) find that the number of Democratic voters in a district is positively correlated with
federal outlay receipts, and that this correlation is stronger for programs initiated in years where the
Democrats held the presidency and Congressional majorities than for programs initiated in years of

6
divided or Republican control,3 arguing that this is the cumulative effect of the predominance of the
Democratic Party during their period of study. However, they find no systematic effect of a
representative’s party affiliation on the funds currently received by his or her district. Studies of parties in
European democracies have generally found stronger evidence of intraparty cooperation and discretion
over public expenditure patterns (Budge and Keman 1990, Castles 1982, and Rallings 1987).
Given the evidence for these two critical assumptions, strong empirical patterns should emerge
relating electoral outcomes to subsequent funding. To the extent that a narrow margin of victory is a
measure of an incumbent’s vulnerability, and that political parties will target public funds to vulnerable
districts, we expect higher levels of central government funding in the districts with closer prior elections
– this is the main theoretical prediction of the public choice model.
While there are few studies testing this exact hypothesis, there has been extensive work done on
the parallel issue of the relationship between political competitiveness and campaign spending.4
Although most existing studies examine U.S. or European contexts, these issues have a special salience
with regards to African political economy, as the recent wave of democratization in Africa has created
environments potentially highly conducive to the political manipulation of public investment, for several
reasons. First, many parties led by former dictators – often with questionable democratic credentials –
retained a stronghold on government at least in the initial multiparty period, and were willing to use all
tactics at their disposal (Ghana and Kenya are good examples). Second, the relatively new and weak
institutional safeguards against corruption in most African countries makes possible the manipulation of
public funds through legal or illegal channels. Moreover, the rents from political office are higher where
corruption activity is widespread, and thus these environments provide stronger incentives for ruling
3 Levitt and Snyder cite other U.S.-based studies, including Browning (1970), Ritt (1976) and Owens and Wade(1984) that find small effects of party influence on distributive politics, but identify econometric issues with thesepapers that may have biased their results.4 The argument is essentially analogous: political parties should allocate disproportionate resources in closeelections. Jacobsen (1978) finds that campaign spending among US Congressional incumbents is inverselyproportional to reelection margins, suggesting that the most vulnerable incumbents do spend more to ensure theirreelection. Similarly, Colantoni, Levesque, and Ordeshook (1975) find that US presidential candidates devote moreresources (defined by campaign visits) in states where the expected outcome is closer.

7
parties to strategically target funds. Finally, many voters in the new African democracies are poorly
educated, and politically inexperienced or uninformed, and thus their support for the incumbent may be
more easily influenced through improved government services and benefits.
3. Background on Ghana
3.1. Political History
The 1996 elections marked the first free and fair elections in Ghana since the immediate post-
independence period. Ghana gained independence from Britain in 1957, and the democratically elected
Convention People’s Party (CPP) controlled the government for the next decade. Amidst growing
instability and demands for regional autonomy and separatism, Kwame Nkrumah, Ghana’s first president
and founder of the CPP, pressed for legislation declaring a one-party state in 1965. This action, combined
with mounting criticism that Nkrumah’s government had neglected the rural sector and fostered
corruption, catalyzed a military coup that brought the National Liberation Council to power in 1966. This
was the first in a series of military coups over the next sixteen years, a period that was marked by political
instability and economic decline: from 1974-1981, GDP dropped 15 percent and cocoa exports, the
leading source of foreign exchange, shrank by more than 40 percent (Lyons 1999). The period
culminated with two coups spearheaded by Lieutenant Jerry Rawlings, landing him and his Provisional
National Defence Council (PNDC) party in power in 1982. By that time, “Ghana was in the midst of a
multifaceted crisis of political enfeeblement, social fragmentation, and economic decline.” (Chazan 1991)
Rawlings claimed power under the mantle of restoring the public’s confidence in an honest
government, and retaking control of the national economy from foreign businessmen. He immediately
dissolved parliament and imposed a ban on party politics, ostensibly establishing an authoritarian regime
that would last ten years. Rawlings also embarked on an aggressive program of economic reform, the
Economic Recovery Program, in conjunction with the World Bank and IMF. The reforms were
successful during the 1980s, and made Ghana Africa’s showcase example of successful structural
adjustment. However, despite renewed economic growth, pressure from domestic pro-democracy forces

8
persisted, and forced Rawlings to move toward political liberalization. In 1988, the District Assembly
was formed, and local elections were held for the initial 65 (now 110) district representative positions. In
1991, amidst continued pressure to democratize, the PNDC elected an assembly to draft a democratic
constitution (a concession made only after 1990-1991 opinion surveys showed Rawlings likely to win a
fair national election), setting the stage for the elections of 1992.
Five parties competed for the presidency in 1992, with Rawlings’ party winning in a landslide.
However, the opposition parties boycotted the parliamentary elections, protesting that the presidential
elections had been wrought with fraud, and that the PNDC had bribed and intimidated voters in securing
the winning margin. The voter registration process was questioned, as the registered total of 8.4 million
voters represented over half of the Ghanaian population of 16 million, an impossibly high number given
that half of the country’s population was under the age of 15. Furthermore, Rawlings was accused of
exploiting his incumbency and access to public funds to influence voter sentiment; for instance, he
initiated high-profile public-works projects and gave public employees a 60 percent pay raise during the
run-up to voting (Jebuni and Oduro 1998). With the opposition boycott, the PNDC won 189 of 200
available parliamentary seats.
Strides were made in the years after the rigged 1992 elections to improve the electoral process.
The Supreme Court demonstrated increasing independence from the ruling party, independent newspapers
began publication, and opposition parties continued to operate outside of parliament, building awareness
and popular support through mass rallies and press conferences. The allegedly-partisan Electoral
Commission was augmented with the Inter-Party Advisory Committee (IPAC), which would share the
preparation responsibilities for the 1996 elections. The voter registry was re-compiled, with the
involvement of agents and observers from all political parties, and by Election Day in 1996, the
opposition had by and large accepted the accuracy of the voter rolls. A large number of party agents and
international observers monitored polling stations on Election Day, and generally concluded that the
elections had been carried out fairly (Lyons 1999).

9
Although the NDC retained control of the presidency and parliament in 1996, the opposition had
narrowed the gap considerably. Rawlings defeated John Kufuor of the New Patriotic Party (NPP) – the
main opposition party – by a 17-point margin in the presidential election, but the opposition won 67 of the
200 parliament seats (with 61 going to the NPP and the rest to smaller parties).
Considerable democratic advances were made between 1992 and 1996, but the run-up to the 1996
elections still featured instances where the NDC exploited its incumbency for political gain. For instance,
the state-owned media was accused of a strong pro-NDC bias: while radio and television coverage
allotted an equal number of campaign slots to the government and opposition parties, regular news
coverage often ignored opposition-related stories and consistently directed attention toward Rawlings’
campaign activities (Ayee 1998). The major national newspapers, also state-owned, further contributed
to the bias.5 There were also numerous examples of voter intimidation and bribery, and the between 1992
and 1996, business people “who had supported the opposition parties were blacklisted, denied
government contracts and their business openly sabotaged. The president himself went on [the radio] and
asked the people not to patronize the products of opposition businessmen.” (Oquaye 1998).
Most importantly for our purposes, though, the government accelerated public spending in the
1996 run-up to gain popular support. The government launched Phase II of its Self-Help Electrification
Project in 1995 in order to bring electricity to one thousand towns and villages in time for the 1996
elections (Sandbrook 2000). Several road construction projects were also launched around election time,
including two large projects in the Ashanti region, where the NDC was most in need of a political boost
(Sandbrook 2000). Furthermore, NDC agents traveled throughout the country and distributed televisions,
clothing, shoes, rice, cooking oil, bicycles, money, NDC souvenir items, and other commodities to
influence voter sentiment (Oquaye 1998).
5 The Rawlings campaign often made front page headlines in the Daily Graphic and the Ghanaian Times, andadvertisements carried by those publications often detailed societal gains achieved during the Rawlings era (Ayee1998). The Daily Graphic’s editor went so far as to announce that he was an NDC member and believed his paper’spurpose was to promote the government (Oquaye 1998).

10
While the NDC maintained its stronghold on the government after the 1996 elections, and
continued attempting to exploit its incumbency, the party’s appeal had waned considerably by the 2000
election. Persistent allegations of corruption against Rawlings and his party began to overshadow its
early economic accomplishments. Furthermore, the country suffered a dramatic economic slowdown in
the 1990s, and was plagued by a growing budget deficit. Public sector employment was cut back, and
government-provided education and health care services curtailed. To make matters worse for the NDC,
Rawlings two-term limit had been reached, and the party lacked a charismatic successor. Despite the use
of the heavy-handed tactics employed in the previous two elections, the NDC was unable to overcome the
opposition’s momentum heading into the 2000 elections. John Kufuor, once again the NPP candidate,
defeated John Atta Mills of the NDC in the presidential election, and the NPP also captured a majority of
100 seats in parliament, to 92 seats for the NDC (and 8 for smaller parties, and for independents).
3.2. The Education System in Ghana
The education system in Ghana lasts twelve years; six years in primary school, three years in junior
secondary school, and three of senior secondary school. “Basic education,” consisting of primary and
junior secondary schooling, is obligatory and legally free, although in actuality schools collect mandatory
fees from the students to supplement government subsidies.
Public educational spending accounted for a massive 35 percent of all Ghanaian government
discretionary recurrent budget expenditures in 1998. The Ghanaian government manages and finances
the education system through two managerial offices, the Ministry of Education (MOE) and the Ghana
Education Services (GES). The MOE is responsible for budget allocations and national education
policies, while the GES administers these policies and distributes funds at the local level. The GES has
regional offices in each of the ten administrative regions and district offices in each of the 110
administrative districts to handle the disbursement of funds to schools. The financing of primary and
junior secondary schools then occurs through four principal channels. The first channel is through the
Controller Accountant General (CAG), which receives its budget from the Ministry of Finance, and

11
“oversees the disbursement of all government employees’ salaries through the banking system,” including
public school teachers (Canagarajah and Ye 2001). Second, the District GES distributes funds to schools
for recurrent expenditures such as transport, maintenance and repair, and supplies. Third, GES
headquarters procures education materials such as textbooks and supplies, and distributes these materials
either through the district offices or directly to schools. Finally, the District Assembly Common Fund
(DACF) distributes funds for rehabilitation and development purposes in all public sectors, including
education. The DACF allocates funds to local district assembly offices, which in turn allocate their
budgets to schools according to need.
The CAG and GES must submit detailed, district-level budget proposals to the MOF, which in
turn submits their budget for ratification by the Cabinet and parliament. Thus, note that although
parliamentary representatives can alter and ultimately approve the distribution of funds across districts –
they cannot target funds directly to their home parliamentary districts, but rather only to their home
administrative districts (which may include other parliamentary districts as well). Once the funds reach
the district GES office, they are handled by administrators responsible for evenly allocating the funds to
all schools in the district.
The DACF, which accounts for 5 percent of the District Assembly’s annual revenue (collected
through district levies), is allocated somewhat differently. District assembly members, working in
conjunction with government appointed District Chief Executives, make requests based on the
rehabilitation and development needs of public facilities in their respective electoral areas. These
requests are considered by the District Assembly Common Fund Administrator, who then develops a
budget for allocating the Fund which is subject to a District Assembly vote. (The District Assembly is
comprised of 80 percent locally-elected representatives, and 20 percent government appointees.)
In allocating central government funds to local school facilities, the government is supposed to
consider a number of factors. First is need, where one metric used to measure need is the teacher to pupil

12
ratio.6 Second is the equalizing factor: a significant portion of the budget is shared equally (on a per
capita basis) among all 110 districts. Third is a reciprocal rule – districts that generate revenue through
tax and fee collections are to receive larger allocations from the central government (although we find that
there is little evidence that this actually occurs). Finally, the government considers any contingencies or
unforeseen circumstances on a district-by-district basis and is allowed to adjust allocations accordingly,
thus seemingly leaving open the possibility of political manipulation of public investment.
4. Data
The school funding data comes from the World Bank’s pilot Public Expenditure Tracking Survey (PETS)
conducted in Ghana in 2000. The survey collected detailed data on school funding in 1998 and 1999,
including cash and in-kind receipts through the four channels of central government funding, as well as
locally collected fees, and non-governmental organization (NGO) and charitable donations. The data was
collected for a stratified sample of 200 primary and junior secondary schools – roughly 1.5 percent of all
schools in the country – as follows. First, four administrative districts were chosen from each of the ten
regions (thus the dataset includes observations from 40 of the 110 administrative districts). These
districts were chosen “quasi-randomly” according to those who collected the data (Canagarajah and Ye
2001), with precedence given to districts that were part of the 1998/99 Ghana Living Standard Survey
(GLSS), part of the World Bank Living Standards Measurement Survey (LSMS) series, to facilitate
linking across datasets.
For each district, three primary schools and two junior secondary schools were randomly selected
for surveying from a list provided by the GES district office. Aggregate district-level education funding
data was collected from these offices as well; Table 1 presents summary statistics for the 192 of 200
6 Teachers are hired through the national teacher education system, which consists of 38 Teacher Training Collegesdispersed across all ten administrative regions. The number of new trainees at each college each year is based on aquota allocated by the MOE. Akyeampong et al. (2000) note that the regional quotas change each year and donot appear to be linked to their analysis of teacher demand.

13
schools that possessed adequate financial records for the survey. Average total educational spending per
pupil per year in Ghanaian primary and junior secondary schools is roughly 23.3 USD (1998), with
teachers’ salaries accounting for the bulk of spending (Table 1, Panel B). The figure was considerably
higher for junior secondary schools, 32.2 USD to 17.3 USD for primary schools. There was also
considerable range in the spending per pupil across schools, ranging from 5.3 at the low end to 89.1 at the
high end. While on average, infrastructure spending and NGO donations account for a small percentage
of overall spending per pupil, for those schools receiving these types of funding (fifteen receiving
infrastructure funding, sixty-five receiving NGO donations), they tend to be a substantial proportion of
total expenditure.
Using school-level expenditure data as opposed to central government budget numbers is a
significant advantage of our approach. As Canagarajah and Ye (2002) note, there are often substantial
differences between budgeted and actual outlays to district offices and schools due to leakage and
corruption and it is precisely these types of activities that may facilitate the manipulation of funds towards
favored districts. In other words, the central government budget numbers may not capture patterns of
public school fund targeting, but the school-level expenditure data should.
The PETS data also provides detailed location information for each surveyed school, including
both its administrative and parliamentary district,7 and this permits linking the PETS data directly to
parliamentary election data from 1996 and 2000. Furthermore, the location information allows us to link
PETS to the GLSS household surveys, providing district-level controls in the regression analysis. Table
1, Panel C presents descriptive statistics for controls from the 1991-92 GLSS.8 The parliamentary
7 There are 200 parliamentary districts and 110 administrative districts in Ghana. All parliamentary districts arewholly contained within an administrative district. The number of parliamentary districts in an administrativedistrict ranges from one in sparsely populated areas to 13 in the capital city of Accra. The 40 administrative districtssampled in the PETS data contain 55 parliamentary districts.8 While the 1998/99 GLSS was also available, the 1991/92 data was used since it is not affected by any changes inpublic funding that occurred after the 1996 elections.

14
election data was obtained from the results published by the Ghana Electoral Commission; for summary
statistics refer to appendix Tables A1 and A2.
5. Identification Strategy
The main empirical test of this paper is for the existence of a patronage effect, a discrete increase in
school funding levels (from the Ghana PETS data) in administrative districts (parliamentary seats) that the
ruling party has swept (won). One important complication concerns whether to focus on the
administrative district or parliamentary seat as the key level of analysis, and of course which is more
relevant depends on the decision-rule of policymakers in Ghana. As described earlier, official decisions
on school funding allocations are made on the administrative district level, while elections take place at
the parliamentary district level, and it is possible that the ruling NDC was able to target funds down to the
level of parliamentary seats by deploying party agents to GES district offices, or by bribing or coercing
nonpartisan district-level administrators to funnel funds to particular schools. We thus explore both levels
of analysis in what follows.
Under the scenario that the NDC can only target funds at the administrative district
level, given that GES district office personnel are generally nonpartisan administrative staff, the relevant
variable would not be whether the NDC won a particular parliamentary district, but how the NDC fared in
the administrative district as a whole. We focus on the case in which the ruling party swept a particular
administrative district in 1996 (SWEEPkr). The specification is as follows9:
(1) ( ) sdkrsdkr
Z
z
zkrzkrrsdkr XVOTESWEEPFUNDS 11
1111 εβφλα +′+
∑+⋅+=
=
FUNDSsdkr is the log of average annual per capita federal funding received during 1998-1999 by school s
9 Using the proportion of seats won by the NDC in an administrative district instead of a sweep-district indicatordampens the measured effect – see Section 6 for a discussion.

15
in parliamentary district d, administrative district k, in region r. VOTEkr refers to the 1996 average margin
of victory of the ruling party across all parliamentary elections in the administrative district, and Equation
1 contains a series of polynomial VOTEkr terms. Xsdkr is a vector of school and district-level
characteristics, including an indicator for primary schools (as opposed to junior secondary schools), as
well as baseline socio-economic controls drawn from the linked 1991/1992 GLSS. There are region-
specific intercept terms α1r, and disturbance terms are allowed to be clustered at the district level.
We additionally run a regression similar to equation (1) for the GES district office-level data
collected in the PETS, but omit the vote differential polynomial terms (replacing those terms with an
indicator variable to capture the average closeness of elections in the administrative district), some of our
district-level controls, and the region-specific intercept terms to compensate for the limited sample size
(N=35).
Next we test for the patronage and public choice effects at the parliamentary seat level. At this
finer level of analysis, we no longer have to aggregate the vote share or election-result variables, which
enables us to employ a regression discontinuity design to test for these patronage effects. The basic
regression specification is:
(2) ( ) sdkrsdkrz
dkr
Z
zzdkrrsdkr XVOTEWINFUNDS 22
1222 εβγθα +′+
∑ ⋅+⋅+=
=
Here, WINdkr is an indicator variable that takes on a value of one if the ruling NDC won the district in
1996, and VOTEdkr is the margin of victory/defeat for the ruling party in parliamentary district d (which is
negative if the NDC was defeated). Note the difference in subscripts between this and the average
administrative district vote share.
The inclusion of the polynomial vote share terms captures continuous changes in funding levels
with respect to vote share, and allows us to isolate the effect of the ruling party winning the election using
close elections near a zero vote differential as a kind of “natural experiment”, as in Lee (2001). In other
words, econometric identification relies on the plausible assumption that districts where the ruling party

16
candidate barely won a parliamentary seat – by only a few votes, say – are ex ante comparable to districts
where the ruling party candidate barely lost the election, allowing us to estimate the true causal impact of
ruling party victory on subsequent central government educational funding received by the district.10 The
patronage hypothesis can be re-stated in this framework as θ2 > 0.
Given the potential difficulty of interpreting the coefficients on the polynomial vote share terms,
we also use a non-parametric regression to explore whether the relationship between funding and
electoral competitiveness corresponds to the predictions of the public choice theory.11
We also test for incumbency effects using both the and 2000 parliamentary elections results,
again employing the regression-discontinuity design. The VOTEdkr2000 term is the vote share of the ruling
party in seat d, administrative district k and region r in 2000 election. The regression specification is:
(3) dkrdkrdkrdkrdkrdkrrdkr XVOTEWINVOTEWINVOTE 33)2(
3)1(
3332000 )*( εβδδθα +′+⋅+⋅+⋅+=
The incumbency effect, in terms of 2000 vote-share for the ruling party, is measured by θ3.
6. Empirical Results
6.1. Administrative District Level Results
Schools in administrative districts where the NDC swept the parliamentary elections received 27 percent
higher funding per pupil than other schools (Table 2, regression 3). This coefficient is significant at the
99 percent level, and is robust to the exclusion of regional fixed effects, varying the set of socio-economic
controls, or log/linear specification of the dependent variable. Replacing the sweep indicator with the
10 This hypothesis can be tested by running “false experiments”, in which the dependent variable is a localcharacteristic – for instance, a socioeconomic measure. To the extent that initial district characteristics varycontinuously with ruling party vote share, there should be no relationship between a ruling party victory in thedistrict in 1996 and the characteristic. Several local socioeconomic, educational, and demographic characteristicsare statistically insignificantly related to a ruling party victory in 1996, although several others are significantlyrelated (results not shown), thus providing mixed evidence that the assumptions underlying the regressiondiscontinuity (RD) framework are plausible. Angrist and Lavy (1998) provide further discussion of the RD method.11 Refer to Deaton (1997) for other applications of the non-parametric regression method.

17
proportion of seats the NDC won in the administrative district lowers the point estimate to 0.15, but it
remains significant at the 95 percent level (results not shown). The dampening of the effect observed by
substituting in the proportion of seats won for the sweep-indicator suggests that the NDC’s patronage
decision rule may be non-linear in the proportion of seats won in the administrative district. There is a
negative and significant coefficient on the quadratic term of the average margin of victory (Table 2,
regression 3), providing some evidence of the public choice hypothesis, but this result is not robust to all
specifications, and is also difficult to interpret given the coefficients on the other polynomial terms, and
the fact that this margin of victory variable is an average over the administrative district.
Table 3 provides NDC sweep coefficient estimates for each key funding dependent variable (in a
specification analogous to Table 2, regression 3), including log total funding per pupil, log teacher
salaries per pupil, log recurrent expenditures per pupil, infrastructure investments per pupil, and NGO
funding per pupil.12 The patronage effect appears to be driven by the teacher salaries sub-category – in
other words, from having more teachers assigned to schools in districts the ruling party won – while the
point estimate on recurrent expenditures is large but not significantly different from zero. The main
results are robust to dropping schools with extremely high and low funding values – for instance, the top
five and bottom five schools in terms of per capita funding – indicating that the results are not being
driven by a small number of outliers (results not shown).
A natural concern with these results is omitted variable bias: the districts where the NDC sweeps
may be different than other districts in unobserved dimensions. Although the inclusion of vote share
polynomials and a rich set of districts controls partially ameliorates this concern, it does not entirely
eliminate them.
12 Log form regression could not be carried out for the infrastructure and NGO funding variables, since there weremany observations with zero funding, in which case logs are undefined. A second set of regressions for thesefunding categories was carried out by constructing indicator variables for if a school received non-zero funding inthe given category, and this yielded similar results (results not shown).There also exists data on central government funding for health clinics, and this yields similarly small andstatistically insignificant point estimates on the effect of ruling party victory; however, due to the small sample sizeof clinics, the relatively large number of missing observations, and concerns over health clinic data reliability, wefocus on educational expenditures in this paper.

18
Some interesting patterns emerge from the coefficients on the control variables. There is a
negative and significant (-0.26) coefficient on proportion of urban households in the main specification.
This effect is largely from the teacher salaries sub-category of total funding, and likely reflects the NDC's
generally pro-rural policies. The coefficient on the proportion of individuals in the district having
received vaccinations is very large, positive, and significant at 99 percent confidence level, and this
control variable may serve as a proxy for the accessibility of public services, or perhaps the NDC's
propensity to provide services to an area (an omitted factor relating to the political importance or
sensitivity of a particular district). None of the educational attainment controls are robustly significant at
90 percent confidence. The measure of local religious fractionalization is consistently negatively and
significantly related to central government funding.
These results are consistent with the analysis of the administrative district GES office data (Table
4): we find that schools in administrative districts where the NDC swept the parliamentary elections
received 15 USD (1998) more per pupil than other schools, while schools in districts where all election
margins were less than 20 percent in 1996 received 22.5 USD more per pupil than schools in districts
where none of the elections had a margin of less than 20 percent (regression 4). Given the limited sample
size and some inconsistencies in the district-level funding data, as well as the fact that these results are not
robust to the omission of controls (regression 3), we do not emphasize these results. Yet they reinforce
the above finding of patronage (and possibly public choice) effects at the administrative district level.
6.2. Parliamentary Seat Level Results
The main regression, which includes the log of total school funding per pupil as the dependent variable,
and GLSS controls and regional fixed effects as controls, has a coefficient of -0.06 (Table 5, regression 3)
on the win-seat indicator variable: in other words, since the dependent variable is in logs, there is roughly
a six percentage point decrease in 1998-1999 central government funding in schools located in
parliamentary seats the ruling party won in 1996, but the coefficient is not statistically significant. The
standard errors are fairly large in this specification, but we can reject effects larger than 10 percent at 95
19
percent confidence, thus ruling out large patronage effects (or certainly those on the order of the results
found at the administrative district level). Without the district controls and region fixed effects, the point
estimate is also negative, at -0.13 (regression 1), and also statistically insignificant. Results using funds
per pupil, rather than log funds per pupil, yield similar results (regressions 4 to 6).
Furthermore, the coefficient estimates on all funding sub-categories are statistically insignificant,
and in the regressions with log of expenditures on teacher salaries per pupil and log recurrent
expenditures per pupil the coefficient estimates are near zero (at –0.04 in both cases – see Table 6). An
additional set of dependent variables not reported included in Table 6 are self-reported assessments by the
schools on whether certain aspects of central government provision had improved in the previous three
years (i.e. 1996-1999); we also find no clear pattern in these coefficient estimates (results not shown).
Note that the omitted variable bias problem described in Section 6.1 is less relevant for this
analysis, due to the regression discontinuity design. In this framework, identification comes from
variation across school funding in parliamentary districts where the ruling party barely won, versus those
where it barely lost. It is plausible that such districts are similar along most socio-economic and other
district-level dimensions. It is more difficult to make this argument in the administrative district analysis,
where identification comes from variation in funding levels for schools in administrative districts where
the NDC swept the elections versus all other schools.
6.3 Non-parametric Regression
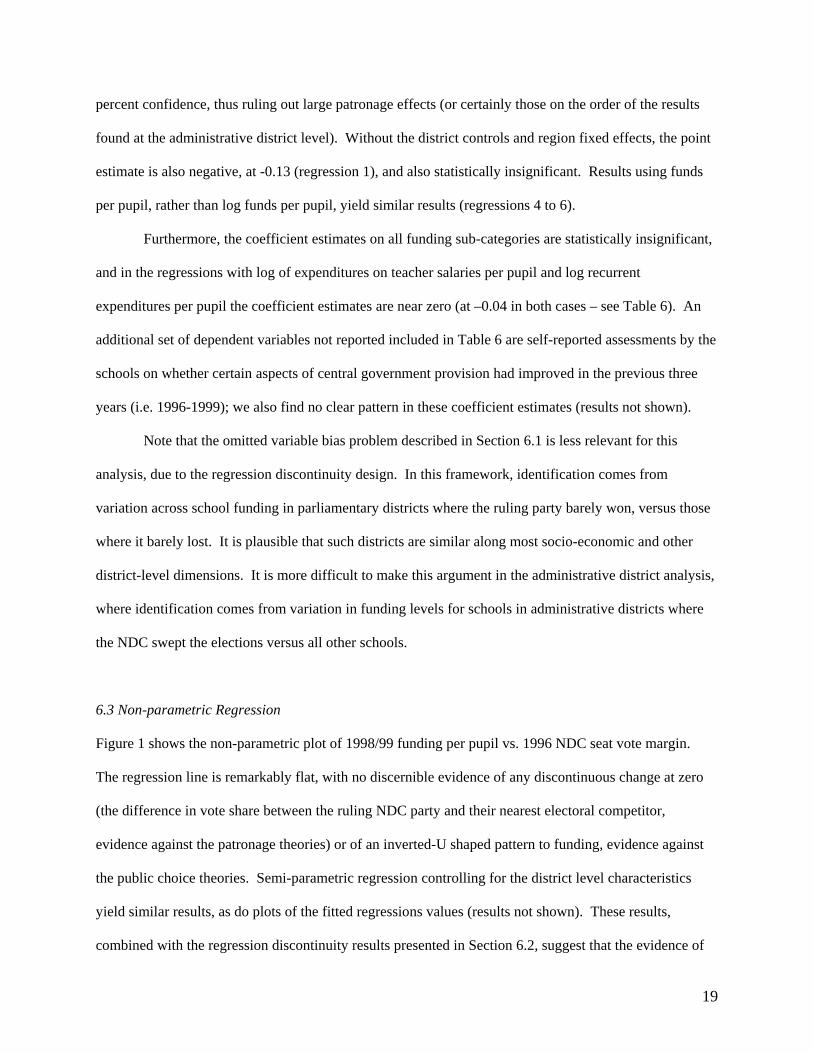
Figure 1 shows the non-parametric plot of 1998/99 funding per pupil vs. 1996 NDC seat vote margin.
The regression line is remarkably flat, with no discernible evidence of any discontinuous change at zero
(the difference in vote share between the ruling NDC party and their nearest electoral competitor,
evidence against the patronage theories) or of an inverted-U shaped pattern to funding, evidence against
the public choice theories. Semi-parametric regression controlling for the district level characteristics
yield similar results, as do plots of the fitted regressions values (results not shown). These results,
combined with the regression discontinuity results presented in Section 6.2, suggest that the evidence of

20
patronage and public choice effects at the administrative district level do not extend to the parliamentary
seat level.
6.4. Incumbency Advantage Estimates
The coefficient on winning the district in 1996 is small, negative and insignificant, suggesting that ruling
party members of parliament did not have an edge in 2000 (Table 7). An incumbency advantage of 5
percentage points (3 percentage points) can be ruled out at 95 percent confidence (90 percent confidence),
either with or without including the GLSS and regional controls. Figure 2 shows the non-parametric
regression of the 2000 NDC vote differential on the 1996 NDC vote differential. The lack of any
discontinuity through zero is further evidence against a significant incumbency effect. This contrasts
recent estimates of the U.S. House of Representatives incumbency advantage, which Lee (2001) finds to
be roughly 8 percent – yielding a much stronger incumbency advantage result in the U.S. than in Ghana.
Restricting attention to the 55 parliamentary seats found in the PETS data yield similar coefficient
estimates near zero (-1.5 percentage points), although the loss of nearly three quarters of the sample leads
to much larger standard errors, and thus we focus the analysis on the full sample. We obtain similarly
small and statistically insignificant incumbency advantage estimates when we use an indicator for NDC
winning the parliamentary seat in 2000 as the dependent variable (results not shown). These results are
consistent with the lack of patronage effects at the parliamentary seat level.

21
7. Conclusion
The Ghanaian administrative district institution was originally created in 1988 as Rawlings’ response to
mounting pressure from pro-democracy forces domestically and internationally to move the country
towards political liberalization. The District Assembly and complementary local governing authorities
were initially formed simply to provide a space for the political participation of the general citizenry, but
have grown in scope and importance with the onset of democratization. Our analysis suggests that the
administrative district structure – through which the national budget, including education expenditures, is
allocated and distributed – provides an important safeguard against the manipulation of public funds
appropriations by ruling parties for political gain. The administrative district structure has effectively
provided a vehicle for the decentralization of public fund allocation decisions, and this decentralized
decision-making has limited the ability of central authorities to target funds with the necessary precision
to achieve political gains – specifically, down to the parliamentary seat level.
Furthermore, the estimated incumbency advantage in the 2000 elections is near zero and
insignificant. This is consistent with our finding that the NDC was unable to target funds down to the
parliamentary seat level, which may have enabled the party to systematically influence voter sentiments
and maximize the party’s future electoral success. It is possible that the incumbency advantage was
present, but was overwhelmed by the declining popularity of the NDC and a backlash against the
presiding government due to opposition-led charges of corruption. However, a more likely scenario is
that the NDC, in the 1996-2000 term, was simply unable to exploit its incumbency to retain control of the
Ghanaian parliament. In this sense, the failure to target funding to parliamentary districts that the NDC
had won in 1996 and the lack of an incumbency advantage go hand in hand.
On the other hand, there is evidence of public funds manipulation – both the patronage and public
choice effects – at the administrative district level, and there are reasons to believe that our point
estimates may represent a lower bound on these effects. First, it is possible that the systematic
manipulation of public funds for political gain occurs at an even larger scale in other recently
democratized African countries. Ghana – the continent’s showcase for structural adjustment in the 1980’s

22
– was also something of a showcase for democratization in the 1990’s. The opposition grew stronger,
international observers deemed the 1996 and 2000 elections fair, and new institutional safeguards – such
as the high level of decentralization in education, and a more vibrant independent media – may have
limited the manipulation of public funds by political leaders. The collection of the PETS data itself –
with its monitoring of central government resource flows – is an example of this greater accountability.
Furthermore, it is also possible that the manipulation of public funds was greater during the early
years of Ghanaian democratization, but had been substantially curtailed by the time of this analysis.
Many of the NPP’s allegations of abuse occurred prior to the 1992 and 1996 elections, while few such
accusations arose during the 2000 campaign (recall, we use school funding data from 1998/99). It may be
that the NPP’s strong minority presence in parliament after the 1996 elections provided a check against
large-scale NDC manipulation. As suggested above, perhaps increasingly mature democratic institutions,
a more active media or sophisticated electorate, discouraged the NDC from exploiting this strategy and
lowered our point-estimate.
Another possibility is that public funds targeting occurred in greater magnitudes for sectors other
than education. Much of the anecdotal evidence of public funds manipulation by the NDC involved the
funneling of either large utility (e.g., water or electricity) or infrastructure (e.g., roads) projects to the
areas of greatest political need or support. Such large projects provide much greater visibility than
discrepancies in education funding levels, which may not be particularly tangible or salient, if at all
noticeable, to the general population. Unfortunately, our dataset does not allow us to explore these issues.
Finally, it may be that public funds manipulation is more prolific in election years. Just as
political business cycle theory suggests that it is most politically beneficial to increase public expenditures
just prior to elections, the same may be true for altering the distribution of public funds.13 Indeed, much
of the anecdotal evidence presented earlier occurred in election years.
13 However, this suggests that the 1999 data should produce more pronounced patterns of public funds manipulationthan the 1998 data, but we found no such distinction between the two years, casting doubt on this claim.

23
Our results, then, contain elements of good and bad news. The good news is that institutional
arrangements such as decentralization may provide safeguards against the manipulation of public funds
by ruling parties for political gain. The bad news is that there is evidence of such manipulation occurring
in Ghana, although at a higher level of government, beyond the scope of these safeguards. While this
targeting appears ineffective in influencing future parliamentary seat election outcomes, the disparities it
generates certainly have welfare costs. Thus, even in cases where centralized fundraising and planning is
more efficient than fiscal decentralization, the political economy “costs” of patronage must be considered.
We recognize that our results are derived in a very particular setting, and that the limited sample
size and potential measurement error may limit the strength of our results even within this specific case.
As such, we believe there is a need for further study of this issue, to determine the generalizability of our
findings within the larger context of African democratization. As the World Bank continues to expand its
portfolio of PETS projects, an increasing amount of micro-level data will become available to replicate
this study in other settings. Further confirmation of these findings would provide additional impetus for
evaluating the conventional wisdom on patronage politics and the strength of new democratic institutions
in Africa.
8. References
Akyeampong, Kwame, Dominic Furlong, and Keith W. Lewin. (2000). “Cost and Financing of TeacherEducation in Ghana”, MUSTER Discussion Paper #18, University of Sussex Institute of Education.
Alesina, Alberto and Jeffrey Sachs. “Political Parties and the Business Cycle in the United States, 1948-1984.” Journal of Money, Credit and Banking 20 (February 1988): 63-82.
Angrist, Joshua, and Victor Lavy. (1998). “Using Maimonides’ Rule to Estimate the Effect of Class Sizeon Scholastic Achievement”, Quarterly Journal of Economics, 114, 533-575.
Ayee, Joseph R.A. “The 1996 General Elections: An Overview,” in The 1996 General Elections andDemocratic Consolidation in Ghana, ed. Joseph R. A. Ayee. Ghana: University of Ghana, Legon, 1998.
Block, Steven. “Political Business Cycles, Democratization, and Economic Reform: The Case of Africa.Journal of Development Economics 67 (February 2002): 205-228.
Bratton, Michael and Nicolas van de Walle. Democratic Experiments in Africa: Regime Transitions inComparative Perspective. New York: Cambridge University Press, 1997.

24
Browning, Clyde E. “The Geography of Federal Outlays.” Studies in Geography No. 4. Chapel Hill:University of North Carolina Department of Geography, 1973.
Budge, Ian and Hans Keman. Parties and Democracy. Oxford: Oxford University Press, 1990.
Canagarajah, Sudharshan, and Xiao Ye. Public Health and Education Spending in Ghana in 1992-98:Issues of Equity and Efficiency. Policy Research Working Paper 2579. Washington DC: World Bank,2001.
Canagarajah, Sudharshan, and Xiao Ye. Efficiency of Public Expenditure Distribution and Beyond: AReport on Ghana’s 20000 Public Expenditure Tracking Survey in the Sectors of Primary Health andEducation. Africa Region Working Paper Series No. 31. Washington DC: World Bank, 2002.
Castles, Francis G. “The Impact of Parties on Public Expenditures,” in The Impact of Parties, ed. FrancisG. Castles. London: Sage Publications, 1982.
Chazan, Naomi. “The Anomalies of Continuity: Perspectives on Ghanaian Elections SinceIndependence,” in Elections in Independent Africa, ed. Fred M. Hayward. Boulder, Colorado: Westview,1987.
Colantoni, Claude S., Terrence J. Levesque, and Peter C. Ordeshook. Campaign Resource AllocationsUnder the Electoral College. The American Political Science Review 69 (March 1975): 141-154.
Deaton, Angus. The Analysis of Household Surveys: a Microeconometric Approach to DevelopmentPolicy. Baltimore, MD: Johns Hopkins University Press, 1997.
Feldman, Paul, and James Jondrow. “Congressional Elections and Local Federal Spending.” AmericanJournal of Political Science 28 (February 1984): 147-64.
Jacobsen, Gary. “The Effects of Campaign Spending in Congressional Elections.” American PoliticalScience Review 72 (June 1978): 469-491.
Jebuni, Charles and Abena Oduro. “Structural Adjustment Programme and the Transition to Democracy,”in Ghana Transition to Democracy, ed. Kwame A. Ninsin. Great Britain: CODESRIA, 1998. 21-48.
Lee, David. (2001). “The Electoral Advantage to Incumbency and Voters’ Valuation of PoliticiansExperience: A Regression Discontinuity Analysis of Elections to the U.S. House.” NBER Working Paper8441.
Levitt, Steven D. and James M. Snyder. “Political Parties and the Distribution of Federal Outlays.”American Journal of Political Science 39 (November 1995): 958-980.
Levitt, Steven D. and James M. Snyder. “The Impact of Federal Spending on House Election Outcomes.”Journal of Political Economy 105 (February 1997): 30-53.
Lyons, Terrence. “Ghana’s Elections: A Major Step Forward,” in Democratization in Africa, eds. LarryDiamond and Marc Plattner. Baltimore: Johns Hopkins University Press, 1999.
Nordhaus, William D. “The Political Business Cycle.” Review of Economic Studies 42 (April 1975): 169-190.

25
Oquaye, Mike. “Human Rights and the 1996 Elections in Ghana,” in The 1996 General Elections andDemocratic Consolidation in Ghana, ed. Joseph R. A. Ayee. Ghana: University of Ghana, Legon, 1998.
Owens, John R. and Larry L. Wade. “Federal Spending in Congressional Districts.” Western PoliticalQuarterly 37 (1984): 404-23.
Rallings, Colin. “The Influence of Election Programmes: Britain and Canada 1945-1979,” in Ideology,Strategy, and Party Change, ed. Ian Budge, David Robertson, and Derek Hearl. Cambridge: CambridgeUniversity Press, 1987.
Remmer, Karen. “The Political Economy of Elections in Latin America, 1980-1991.” The AmericanPolitical Science Review 87 (June 1993): 393-407.
Ritt, Leonard. “Committee Position, Seniority, and the Distribution of Government Expenditures.” PublicPolicy 24 (1976): 469-497.
Rosen, Sherwin. “Prizes and Incentives in Elimination Tournaments.” The American Economic Review 76(September 1986): 701-715.
Sandbrook, Richard. Closing the Circle: Democratization and Development in Africa. New York: ZedBooks Ltd., 2000.
Snyder, James M. “Election Goals and the Allocation of Campaign Resources.” Econometrica 57 (May1989): 637-660.
Weber, Max. Economy and Society: An Outline of Interpretive Sociology, ed. Guenther Roth and ClausWittich. New York: Bedminster Press, 1968.
Weingast, Barry R. “A Rational Choice Perspective on Congressional Norms.” American Journal ofPolitical Science 23 (May 1979): 245-262.

26
9. Figures and Tables
Figure 1: Lowess Non-Parametric Regression, Total Central Government Funding per Pupil in 1998/1999(1998 USD) versus the 1996 Parliamentary Seat Vote Margin for the Ruling Party (NDC)
Figure 2: Non-Parametric Regression, 2000 Parliamentary Seat Vote Margin for the Ruling Party (NDC)versus the 1996 Parliamentary Seat Vote Margin for the Ruling Party
Lowess smoother, bandwidth = .8
20
00
ND
CV
ote
Diff
ere
ntia
l
1996 NDC Vote Differential-100 -50 0 50 100
-100
-50
0
50
100
Lowess smoother, bandwidth = .8
19
98
-19
99
To
talF
un
din
gP
er
Pu
pil
1996 NDC Vote Differential-50 0 50 100
-20
0
20
40
60

27
Table 1: Descriptive Statistics, Parliamentary District-level Data
Variable Mean Std. dev.Observations
(schools)Panel A: 1996 Parliamentary Election outcomes(Source: Ghana Electoral Commission)Ruling party (NDC) won seat 0.79 0.41 192Ruling party (NDC) vote share 0.58 0.17 192Ruling party (NDC) vote differential 0.26 0.33 192
Panel B: Educational expenditure data(Source: 1998/1999 PETS)Total government funding per pupil (in 1998 USD) 23.3 11.9 192Government funding on teacher salaries per pupil (in 1998 USD) 20.2 10.5 192Government funding on recurrent expenditures per pupil (in 1998 USD) 3.0 3.3 192Government funding on infrastructure per pupil (in 1998 USD) 0.08 0.41 192Locally collected school funding 1.13 1.27 192School funding from non-governmental organizations (NGOs) 0.63 2.12 192Pupils per school 243 151 192Primary school indicator variable 0.59 0.49 192
Panel C: District characteristics(Source: 1991/1992 GLSS)Household expenditure per capita (in 1991 USD) 242.5 89.5 192Proportion urban 0.26 0.33 192Years of education, household head 4.6 2.7 192Proportion school-aged (age 5-15) children who have attended school in last year 0.94 0.08 192Household educational expenditures per school-aged child (in 1991 USD) 11.2 10.4 192Proportion individuals who have received vaccinations 0.81 0.14 192Religion fractionalization index 0.61 0.16 192Ethno-linguistic fractionalization index 0.31 0.25 192
Table 1 notes: Measured at parliamentary district level. Averages weighted by number of schools in PETS sample.In the few cases where district-level data was unavailable, the geographic region average was used. Thefractionalization index is equivalent to the likelihood that two randomly drawn people will be from same ethno-linguistic or religious group.

Table 2: Impact of Ruling Party 1996 Administrative District Sweepon School Funding per Pupil in 1998/99
Dependent variable:Log total government funding
per pupil (in 1998 USD)Total government funding per
pupil (in 1998 USD)OLS OLS OLS OLS OLS OLS
Explanatory variable (1) (2) (3) (4) (5) (6)
Ruling party (NDC) swept all parliamentaryseats in the administrative district, 1996
0.15(0.12)
0.30**
(0.14)0.27***
(0.09)4.0
(2.8)7.7**
(3.6)7.9***
(2.7)
Ruling party (NDC) average administrativedistrict vote differential (x 10)
-0.03(0.02)
-0.07**
(0.03)-0.05***
(0.02)-0.66(0.59)
-1.7**
(0.7)-1.5**
(0.6)
Ruling party (NDC) average administrativedistrict vote differential squared (x 103)
-0.07*
(0.04)-0.06(0.05)
-0.10***
(0.03)-1.3(1.0)
-1.0(1.4)
-2.4***
(0.9)
Ruling party (NDC) average administrativedistrict vote differential cubed (x 105)
0.09(0.06)
0.12**
(0.06)0.17***
(0.04)1.6
(1.1)2.6
(1.6)4.6***
(1.2)
Log household expenditure per capita (1991/2, in1991 USD)
0.07(0.11)
-0.01(0.09)
2.1(2.9)
2.1(2.8)
Proportion urban (1991/2) -0.27*
(0.14)-0.26**
(0.12)-5.8*
(3.3)-6.3**
(3.2)
Years of education, household head (1991/2) -0.02(0.02)
-0.05**
(0.02)-0.69(0.54)
-1.2**
(0.5)
Proportion school-aged (age 5-15) children whohave attended school in last year (1991/2)
-0.41**
(0.19)-0.26(0.20)
-8.6*
(4.9)-4.2(5.6)
Log household educational expenditures perschool-aged child (1991/2, in 1991 USD)
-0.01(0.05)
0.03(0.04)
-0.03(1.32)
0.6(1.0)
Proportion individuals who have receivedvaccinations (1991/2)
0.98***
(0.20)1.26***
(0.14)25.0**
(6.6)31.8***
(4.6)
Religion fractionalization index -0.14(0.16)
-0.44***
(0.10)-3.7(3.8)
-8.6***
(3.2)
Ethno-linguistic fractionalization index 0.39***
(0.15)0.25**
(0.13)9.5**
(4.0)7.2**
(3.6)
Primary school indicator variable -0.59***
(0.04)-0.59***
(0.04)-0.59***
(0.04)-14.7***
(1.3)-14.8***
(1.3)-14.8***
(1.4)
Region fixed effects No No Yes No No Yes
Observations (schools) 192 192 192 192 192 192R2 0.44 0.53 0.60 0.38 0.45 0.51Mean (s.d.) dependent variable 3.0
(0.4)3.0
(0.4)3.0
(0.4)23.3
(11.9)23.3
(11.9)23.3
(11.9)95 Percent confidence intervalon Ruling party (NDC) swept all parliamentaryseats in the administrative district, 1996
[-0.08,0.38]
[0.02,0.57]
[0.09,0.46]
[-1.7,9.7]
[0.4,14.9]
[2.0,13.7]
Notes for Table 2: Data from the Ghana Electoral Commission, the 1998/9 Public Expenditure Tracking Survey(PETS), and the 1991/2 Ghana Living Standards Survey (GLSS). Robust standard errors in parentheses.Disturbance terms are clustered within administrative districts, and there are 40 such districts in the sample.Significantly different than zero at 99 (***), 95 (**), and 90 (*) percent confidence. The region fixed effects are forAshanti, Brong-Ahafo, Central, Eastern, Northern, Upper East, Upper West, Volta, and Western regions.

29
Table 3: Impact of Ruling Party 1996 Administrative District Sweepon Various School Funding Outcomes in 1998/99
Dependent variable
Coefficient estimate onRuling party (NDC)swept administrative
district, 1996
Log total government funding per pupil(in 1998 USD)
0.27***
(0.09)
Log government funding on teachersalaries per pupil (in 1998 USD)
0.30***
(0.08)
Log government funding on recurrentexpenditures per pupil (in 1998 USD)
0.27(0.30)
Government funding on infrastructureper pupil (in 1998 USD)
0.26(0.23)
School funding from non-governmentalorganizations (in 1998 USD)
1.40(0.90)
Notes for Table 3: Data from the Ghana Electoral Commission, the 1998/9 Public Expenditure Tracking Survey(PETS), and the 1991/2 Ghana Living Standards Survey (GLSS). Robust standard errors in parentheses.Disturbance terms are clustered within administrative districts, and there are 40 such districts in the sample.Significantly different than zero at 99 (***), 95 (**), and 90 (*) percent confidence. Each entry is the result of aseparate regression. Average administrative vote differentials, district controls and regional fixed effects areincluded in all specifications in this table (analogous to Table 2, regressions 3 and 6). The vote differentialpolynomials include linear, squared, and cubic terms. District controls include Log household expenditure percapita (1991/2, in 1991 USD); Proportion urban (1991/2); Years of education, household head (1991/2); Proportionschool-aged (age 5-15) children who have attended school in last year (1991/2); Log household educationalexpenditures per school-aged child (1991/2, in 1991 USD); Proportion individuals who have received vaccinations(1991/2); Religion fractionalization index; and Ethno-linguistic fractionalization index. The region fixed effects arefor Ashanti, Brong-Ahafo, Central, Eastern, Northern, Upper East, Upper West, Volta, and Western regions.

30
Table 4: Impact of Ruling Party 1996 Administrative District Sweepon District-Level Funding Outcomes in 1998/99
Dependent variable:
Log of governmentfunding per pupil at theadministrative districtlevel, reported by theGHS (in 1998 USD)
Government fundingper pupil at theadministrativedistrict level,
reported by the GHS(in 1998 USD)
OLS OLS OLS OLSExplanatory variable (1) (2) (3) (4)
Ruling party (NDC) swept allparliamentary seats in theadministrative district, 1996
1.5**
(0.7)1.4*
(0.8)8.8
(6.2)15.0**
(7.1)
Proportion of parliamentary seats withless than 20 percent vote differentialfor ruling party, 1996
0.3(0.7)
1.1**
(0.6)9.1
(6.0)22.5***
(5.8)
Admin district vote differentialpolynomials
Yes Yes Yes Yes
District controls No Yes No YesRegion fixed effects No No No No
Observations (schools) 35 35 35 35R2 0.24 0.65 0.29 0.61Mean (s.d.) dependent variable 2.3
(1.0)2.3
(1.0)13.2(8.0)
13.2(8.0)
Notes: Data from the Ghana Electoral Commission, the 1991/2 Ghana Living Standards Survey (GLSS), and 1998/9Public Expenditure Tracking Survey (PETS) Administrative District Education Office budget sheets. Robuststandard errors in parentheses. Significantly different than zero at 99 (***), 95 (**), and 90 (*) percent confidence.District controls include Log household expenditure per capita (1991/2, in 1991 USD); Proportion urban (1991/2);Years of education, household head (1991/2); Proportion school-aged (age 5-15) children who have attended schoolin last year (1991/2); Log household educational expenditures per school-aged child (1991/2, in 1991 USD);Proportion individuals who have received vaccinations (1991/2); Religion fractionalization index; and Ethno-linguistic fractionalization index.

31
Table 5: Impact of Ruling Party 1996 Parliamentary Seat Victoryon School Funding per Pupil in 1998/99
Dependent variable:Log total government funding
per pupil (in 1998 USD)Total government funding per
pupil (in 1998 USD)OLS OLS OLS OLS OLS OLS
Explanatory variable (1) (2) (3) (4) (5) (6)
Ruling party (NDC) won seat, 1996 -0.13(0.11)
-0.09(0.11)
-0.06(0.08)
-3.5(2.6)
-3.5(2.8)
-2.8(2.3)
Ruling party (NDC) vote differential (x 10) 0.02(0.02)
0.00(0.03)
-0.01(0.02)
0.72(0.56)
0.09(0.69)
0.00(0.63)
Ruling party (NDC) vote differential squared(x 103)
0.03(0.04)
0.03(0.04)
-0.01(0.03)
1.2(0.9)
1.1(1.1)
0.0(1.0)
Ruling party (NDC) vote differential cubed(x 105)
-0.09(0.06)
-0.03(0.06)
0.04(0.04)
-2.7**
(1.4)-1.4(1.4)
0.3(1.2)
Log household expenditure per capita (1991/2, in1991 USD)
0.02(0.12)
-0.12(0.12)
0.00(0.02)
-0.02(0.02)
Proportion urban (1991/2) -0.28*
(0.16)-0.25(0.15)
-5.2(4.2)
-4.2(4.2)
Years of education, household head (1991/2) -0.01(0.02)
-0.04**
(0.02)-0.53(0.64)
-1.18**
(0.59)
Proportion school-aged (age 5-15) children whohave attended school in last year (1991/2)
-0.48*
(0.27)-0.24(0.26)
-8.4(5.9)
-2.1(6.8)
Log household educational expenditures perschool-aged child (1991/2, in 1991 USD)
-0.02(0.06)
0.02(0.06)
-0.03(0.08)
0.03(0.09)
Proportion individuals who have receivedvaccinations (1991/2)
0.79***
(0.23)1.11***
(0.21)18.9**
(7.9)26.2***
(6.5)
Religion fractionalization index -0.10(0.17)
-0.45***
(0.12)-3.0(3.9)
-8.7**
(3.3)
Ethno-linguistic fractionalization index 0.50***
(0.16)0.36**
(0.13)12.2**
(4.6)9.7**
(4.3)
Primary school indicator variable -0.59***
(0.04)-0.59***
(0.04)-0.59***
(0.04)-14.7***
(1.3)-14.8***
(1.3)-14.7***
(1.4)
Region fixed effects No No Yes No No Yes
Observations (schools) 192 192 192 192 192 192R2 0.44 0.52 0.59 0.38 0.44 0.50Mean (s.d.) dependent variable 3.0
(0.4)3.0
(0.4)3.0
(0.4)23.3
(11.9)23.3
(11.9)23.3
(11.9)95 Percent confidence intervalon Ruling party (NDC) won seat, 1996 term
[-0.35,0.09]
[-0.31,0.13]
[-0.22,0.10]
[-8.7,1.7]
[-9.1,2.1]
[-7.4,1.8]
Notes for Table 5: Data from the Ghana Electoral Commission, the 1998/9 Public Expenditure Tracking Survey(PETS), and the 1991/2 Ghana Living Standards Survey (GLSS). Robust standard errors in parentheses.Disturbance terms are clustered within parliamentary districts, and there are 55 such districts in the sample.Significantly different than zero at 99 (***), 95 (**), and 90 (*) percent confidence. The region fixed effects are forAshanti, Brong-Ahafo, Central, Eastern, Northern, Upper East, Upper West, Volta, and Western regions.

32
Table 6: Impact of Ruling Party 1996 Parliamentary Victoryon Various School Funding Outcomes in 1998/99
Dependent variable
Coefficient estimate onRuling party (NDC)
won seat, 1996
Log total government funding per pupil(in 1998 USD)
-0.06(0.08)
Log government funding on teachersalaries per pupil (in 1998 USD)
-0.04(0.08)
Log government funding on recurrentexpenditures per pupil (in 1998 USD)
-0.04(0.27)
Government funding on infrastructureper pupil (in 1998 USD)
0.14(0.15)
School funding from non-governmentalorganizations (in 1998 USD)
1.48(0.94)
Notes for Table 6: Data from the Ghana Electoral Commission, the 1998/9 Public Expenditure Tracking Survey(PETS), and the 1991/2 Ghana Living Standards Survey (GLSS). Robust standard errors in parentheses.Disturbance terms are clustered within parliamentary districts, and there are 55 such districts in the sample.Significantly different than zero at 99 (***), 95 (**), and 90 (*) percent confidence. Each entry is the result of aseparate regression. Parliamentary seat vote differentials, district controls and regional fixed effects are included inall specifications in this table (analogous to Table 3, regressions 3 and 6). The vote differential polynomials includelinear, squared, and cubic terms. District controls include Log household expenditure per capita (1991/2, in 1991USD); Proportion urban (1991/2); Years of education, household head (1991/2); Proportion school-aged (age 5-15)children who have attended school in last year (1991/2); Log household educational expenditures per school-agedchild (1991/2, in 1991 USD); Proportion individuals who have received vaccinations (1991/2); Religionfractionalization index; and Ethno-linguistic fractionalization index. The region fixed effects are for Ashanti,Brong-Ahafo, Central, Eastern, Northern, Upper East, Upper West, Volta, and Western regions.

33
Table 7: Impact of Ruling Party 1996 Parliamentary Victoryon Electoral Performance in 2000 (Incumbency Effects)
Dependent variable:Ruling party (NDC) vote
differential, 2000OLS OLS OLS
Explanatory variable (1) (2) (3)
Ruling party (NDC) won seat, 1996 -5.3(4.7)
-8.0*
(4.2)-3.7(3.9)
Ruling party (NDC) vote differential 0.99***
(0.13)0.95***
(0.05)0.83***
(0.07)Ruling party (NDC) won seat, 1996 *Ruling party (NDC) vote differential
-0.19(0.14)
-0.14(0.11)
-0.21*
(0.11)District controls No Yes YesRegion fixed effects No No Yes
Observations (parliamentary districts) 199 199 199R2 0.71 0.74 0.77Mean (s.d.) dependent variable -1.2
(34.2)-1.2
(34.2)-1.2
(34.2)95 Percent confidence intervalon Ruling party (NDC) won seat, 1996 term
[-14.7,4.1]
[-16.4,0.4]
[-11.5,4.1]
Notes for Table 5: Data from the Ghana Electoral Commission, the 1998/9 Public Expenditure Tracking Survey(PETS), and the 1991/2 Ghana Living Standards Survey (GLSS). Robust standard errors in parentheses.Significantly different than zero at 99 (***), 95 (**), and 90 (*) percent confidence. District controls include Loghousehold expenditure per capita (1991/2, in 1991 USD); Proportion urban (1991/2); Years of education, householdhead (1991/2); Proportion school-aged (age 5-15) children who have attended school in last year (1991/2); Loghousehold educational expenditures per school-aged child (1991/2, in 1991 USD); Proportion individuals who havereceived vaccinations (1991/2); Religion fractionalization index; and Ethno-linguistic fractionalization index.


35
10. Appendix
Appendix Table A1: 1996 Parliamentary Election Summary Statistics
All 199 Districts 55 Districts in PETS Sample
Political Party Average vote share Win Average vote share Win
NDC 54.8 133 57.8 43NPP 36.1 60 31.3 10CPP 5.1 5 16.5 2PNC 6.5 1 6.2 0
Notes: Data from Ghana Electoral Commission. Vote shares of 0 are used in districts where a party did not havecandidate.
Appendix Table A2: 2000 Parliamentary Election Summary Statistics
All 199 Districts 55 Districts in PETS Sample
Political Party Average vote share Win Average vote share Win
NDC 43.9 91 47.3 31NPP 40.6 99 37.0 22CPP 4.7 1 5.6 0PNC 4.1 3 4.2 1Independent 3.7 5 2.6 1
Notes: Data from Ghana Electoral Commission. Vote shares of 0 are used in districts where a party did not havecandidate.