Do Labor Intensive Industries Generate Employment? · PDF fileWorking Paper No. 237 Do Labor...
33
Working Paper No. 237 Do Labor Intensive Industries Generate Employment? Evidence from firm level survey in India Deb Kusum Das Gunajit Kalita June 2009 INDIAN COUNCIL FOR RESEARCH ON INTERNATIONAL ECONOMIC RELATIONS
Transcript of Do Labor Intensive Industries Generate Employment? · PDF fileWorking Paper No. 237 Do Labor...

Working Paper No. 237
Do Labor Intensive Industries
Generate Employment? Evidence from firm level survey in India
Deb Kusum Das Gunajit Kalita
June 2009
INDIAN COUNCIL FOR RESEARCH ON INTERNATIONAL ECONOMIC RELATIONS

Table of Contents
Foreword ........................................................................................................................ i
Abstract ......................................................................................................................... ii
I. Introduction ............................................................................................................. 1
II. Labor Intensive Industries and Indian Manufacturing: Employment, Wages
and Labor Productivity ................................................................................... 3
III. Firm Level Survey: Research Focus, Questionnaire, Sectors and Sampling
Framework ....................................................................................................... 7
IV. Findings of the Survey........................................................................................ 11
IV.1 Employment Issues .......................................................................................... 11
IV.2 Machinery Usage ............................................................................................. 16
IV.3 Trade orientation .............................................................................................. 17
IV.4 Labour Issues ................................................................................................... 19
V. Policies to Address the Shortcomings................................................................. 22
Conclusions ................................................................................................................. 25
References ................................................................................................................... 26
List of Tables
Table 1: Labor Intensive Industries in Organized Manufacturing: 1990-91 to 2003-04
............................................................................................................................ 4
Table 2: Changes in Labor Productivity, Employment and Real Wages: Labor
Intensive Industries ............................................................................................ 7
Table 3: The Labor Intensive Industries: Firms and Turnover ................................... 11
Table 4: Employment growth (%) by categories of employment: 2003-05 ............... 12
Table 5: Average Wage by worker category per shifts: Labor Intensive sectors ....... 15
Table 6: Export Orientation of Labor Intensive Industries- The core Industries ........ 18
Table 7: Trade Union, Labor Conflicts and Skilled Labor Shortages ........................ 21
List of Charts & Box
Chart 1: Labor Intensity (L/K) of All Labor Intensive Industries: 1990-91 to 2003-04
............................................................................................................................ 5
Chart 2: Male-Female Ratio in Total Workers in Labor Intensive Industries ............ 13
Chart 3: Employment by educational categories- Labor Intensive Industries ............ 14
Chart 4: Change in Worker-Machine ratio during 2003-04 & 2005-06 ..................... 16
Chart 5: Firms complying with Compliance code & providing Social security benefits
.......................................................................................................................... 20
Box 1: The five core labor intensive sectors- A snapshot ............................................. 9

i
Foreword
One of the policy puzzles faced during the past two decades in India has been its
inability to translate output growth into employment growth. India’s trade
liberalization was expected to lead to a shift in its industrial structure towards more
labor intensive industries and provide greater encouragement to the application of
labor intensive methods of production. Against this background, an appraisal of the
labor intensive sectors in Indian organized manufacturing assumes importance.
ICRIER was commissioned a research project on “Labor Intensity and Employment
Potential of Indian Manufacturing” by the National Manufacturing Competitiveness
Council, Government of India. The study was structured in two parts. In the first part,
the focus was on identification of the labor intensive industries within organized
manufacturing sector. In the second part, a firm level survey was carried out, of the
selected labor intensive industries to identify the constraints in expanding
employment opportunities in labour intensive industries in India. It is hoped that the
findings will be of interest to both policy makers and researchers.
(Rajiv Kumar)
Director & Chief Executive
June 17, 2009

ii
Abstract
This study attempts to address the issue of declining labour intensity in India’s
organized manufacturing in order to understand the constraints on employment
generation in the labour intensive sectors. Using primary survey data covering 252
labour intensive manufacturing-exporting firms across five sectors—apparel, leather,
gems and jewellery, sports goods, and bicycles for 2005-06 an attempt is made to find
out the factors which constrain employment generation in labour intensive firms. The
study shows several constraints in the path of employment generation in labour
intensive sectors—non-availability of trained skilled workers, infrastructure
bottlenecks, low levels of investment, labour rules and regulations, and a non-
competitive export orientation. The study suggests a set of policy initiatives to
improve the employment potential of these sectors.
________________________
Key words: Indian Organized Manufacturing, Labor Intensity, Employment Growth,
Skilled workforce, Wage structure, Export status, Machinery Usage, Labor laws,
South Asia
JEL classification: E24; J24; J31 and D24

1
Do Labor Intensive Industries Generate Employment? Evidence from firm level survey in India
Deb Kusum Das∗∗∗∗
Gunajit Kalita**
I. Introduction
An important objective of India’s economic liberalization has been providing
employment opportunities not only to meet the backlog of unemployed people but
also for new additions to the labour force. Even today, agriculture accounts for a bulk
of the total employment in the economy. Industry is still the least important employer,
accounting for just 16 per cent of the total employment. Further, despite its impressive
growth rates in the 1980s and 1990s, organized manufacturing in India has not
undergone a structural transformation away from agriculture to industry as far as
expanding employment opportunities with higher productivity and rising wages are
concerned. This raises concerns given that the 11th Plan objective was of achieving
‘inclusive growth’.
The partial liberalization of the economy in the mid-1980s, as well as the economic
reforms of the 1990s resulted in modest changes in the performance of the industrial
sector, especially with organized employment registering a 2 per cent growth per
annum over the period 1980–95 (employment growth in unorganized manufacturing
during the same period declined to around 1.7 per cent per annum). Indian
manufacturing recorded respectable growth following economic reforms of the 1980s
and 1990s. The value added in manufacturing had a growth of around 7.5 per cent per
annum over the decades of the 1980s and 1990s. However, with regard to the
contribution of manufacturing as a whole to the Gross Domestic Product (GDP) of the
country, it still had a low share of around 16 per cent (2006-07); this contribution is
below that of other East Asian countries. If the manufacturing sector is to perform
along the lines of China and other East Asian countries, its share both in GDP and in
employment will have to increase substantially. A look at India’s manufacturing
performance over the two decades of 1980s and 1990s suggests that it has been a
period of growth without employment creation or ‘jobless growth’. The share of
employment in manufacturing in India was only 13 per cent (2004–05), whereas in
China it was 31 per cent and in Malaysia, it was 50 per cent respectively.
The 1980s are often called the decade of ‘jobless growth’ in Indian manufacturing,
because the revival in output growth during this decade was not accompanied by
∗ ∗ Consultant ICRIER and Reader, Department of Economics, Ramjas College, University of Delhi
and ∗∗ Researcher, ICRIER . This paper is from the project, “Labor Intensity and Employment
Potential of Indian Manufacturing” undertaken at ICRIER under a research grant from National
Manufacturing Competitivenss Council, Government of India. The authors would like to
acknowledge the comments received at various stage of the study by Dr Rajiv Kumar, Shri V
Krishnamurthy, Shri Govindrajan, Professor Arup Mitra and Professor Nisha Taneja. We would
also like to express our thanks to Dr Meenu Tewari and Professor Pushpa Trivedi for their
comments on the project report. The first author would like to acknowledge the comments received
from the seminar participants on some aspects of the research project at the University of Dundee,
Scotland. The usual disclaimers apply. For comments and feedback [email protected],

2
adequate generation of employment. Only 484,000 new jobs were generated in India's
registered factory sector between 1979-80 and 1990-91 (Thomas 2002). One of the
explanations put forward for this is that of difficulty in labour retrenchment after the
introduction of job security regulations in the late 1970s, as this forced employers to
adopt capital-intensive production techniques (Fallon and Lucas 1993 cited in Goldar
2000). According to another view, the slowdown in employment growth resulted from
a strategy of capital deepening pursued by firms, an important reason for which was
the increase in real cost of labour in the 1980s (Ghose 1994). A study undertaken by
the World Bank (1989) also asserted that the sharp deceleration in employment
growth in the factory sector in the 1980s could be explained by acceleration in
product wages, which the study attributed to union-push. Several authors like,
Bhalotra (1998), Nagaraj (1994) and Papola (1994), have highlighted other reasons
for the stagnation in employment generation in the organized manufacturing sector.
Both Nagaraj and Papola point out that during the 1980s there was faster growth of
industries with low labour intensity and a slower growth of industries with high
labour intensity. Also, Nagaraj and Bhalotra note a significant increase in actual hours
worked per labour (or man-day per worker) indicating a more intensive use of the
workforce in the 1980s, resulting in the slowdown in employment growth. According
to Nagaraj (1994), the ‘overhang’ of employment that existed in the 1970s was
intensively used in the 1980s, thus generating only a few additional employment
opportunities in the later decade.
The decade of the 1990s witnessed the process of economic reforms in India, which
included a significant liberalization of both industrial activities and trade. Many
expected this process of economic reforms to boost employment in the manufacturing
sector, as there was increased outward orientation because trade and the industrial
sector were deregulated. However a 13 per cent share in employment generation by
organized manufacturing portrays the untapped potential of this sector despite more
than a decade of economic liberalization. As a result of this we find that a vast
majority of India’s work force is still absorbed in low productive agricultural
employment. Nagaraj (2000) points out that the faster employment generation in the
organized manufacturing sector during 1990-91 to 1997-98 as highlighted by Goldar
(2000) and Thomas (2002) was due to the investment boom in that decade. In his later
study, Nagaraj (2004) points out that faster employment generation in organized
manufacturing was restricted mainly to the first half of the 1990s. As the boom went
bust, there was a steep fall in employment in the second half of the 1990s. Relative
cost of labour did not seem to matter in employment decisions, as the wage-rental
ratio declined secularly. According to Nagaraj, about 1.1 million workers, or 15 per
cent of the workers in the organized manufacturing sector in the country, lost their
jobs between 1995-96 and 2000-01.
The immediate point that comes up is the role of labour intensive sectors in enhancing
the employment potential in organized manufacturing. Further, the impressive growth
performance of some of the leading labour intensive sectors makes it important to ask
why despite such a good growth performance, labour intensive firms are still unable
to generate significant employment growth. A recent study (Das et al 2009) attempts
to investigate the issue of the employment potential in organized manufacturing and
comes up with the observation that labour intensity has decreased across all the labour
intensive sectors in registered manufacturing in the country, thereby questioning the
ability of firms with more labour per unit of capital to enhance employment

3
generation. If this is true, then this holds immense significance for manufacturing
industries’ role vis-à-vis employment generation. Further, if manufacturing in India is
to perform along the lines of China and East Asia, then its share in employment
generation has to increase sharply and this calls for more focused policy initiatives for
improving export performances, and consequently employment generation.
In the light of this argument, this study seeks to undertake an in-depth examination of
the factors that constrain employment generation in labour intensive sectors in
organized manufacturing. This holds significance for the policy initiative at a time
when the government is thinking of ways to address the manufacturing slowdown in
India. In particular, this study seeks to examine the sources and constraints of the
employment potential in labour intensive sectors by looking at five selected sectors—
apparels, leather, gems and jewellery, bicycles, and sports goods. An in-depth survey
of firms in these sectors was undertaken across cities and towns that constitute their
hubs. The empirical findings cover a number of aspects of the business environment
that the labour intensive sector is facing.
The paper is structured as follows: Section II outlines certain aspects of labour
intensive firms within organized manufacturing with focus on employment, wages,
and labour productivity. The research focus, sampling technique, and sectoral
coverage in the context of the firm level survey are discussed in Section III. The
findings from the survey are analyzed in Section IV. Policy recommendations are
outlined in Section V and the final section provides a conclusion to the paper.
II. Labor Intensive Industries and Indian Manufacturing: Employment, Wages
and Labor Productivity
Despite the importance of labour intensive industries in generating employment,
quantifying crucial issues like employment, productivity, and wages have not been
well researched. While issues of employment generation and wages for India’s
organized as well as unorganized industries have been the subject of much research,
very few studies have paid attention to the issues of changing factor intensity,
particularly with reference to labour in India’s post-reform era. There is also very
little research on India’s labour intensive sectors and their employment generation
potential.
Studies by Chaudhuri (2002) and by Rani and Unni (2004) are amongst the few that
have analyzed the issue of labour intensive sectors in India’s manufacturing. Both
these studies have reported a decline in labour intensity across organized and
unorganized manufacturing and its sub-branches. There is no study that attempts to
understand the determinants of low labour intensity in Indian manufacturing.1
Employment potential in labour intensive sectors in Indian manufacturing has been
recently researched by Das et al (2009).The research indentified labour intensive
sectors in Indian manufacturing for the period 1990-2004.2. It found that in the
1Goldar (2000, 2002), Nagraj (2000), and Tendulkar (2000) have analyzed the issue of employment
growth for Indian industries; however these studies do not specifically consider the labor intensive
sectors within manufacturing and their employment generating abilities. 2Using Annual Survey of Industries (ASI) data for the period 1990-91 till 2003-04, the labor intensity
defined as number of labor per unit real gross fixed capital (L/K ratio) for 97 (at the four-digit level)
4
identified sectors labour intensity was declining constantly over the period of the
study (see Table 1). The yearly average labour intensity3 (L/K) for the 31 labour
intensive industries4 from 1990-91 to 2003-04, saw a continuous fall from 0.72 in
1990-91 to 0.30 in 2003-04. During 1990-91 and 2003-04 the average combined
Gross Value Added (GVA) share (as percentage of total manufacturing value added)
of these 31 industries was 13.77 per cent.
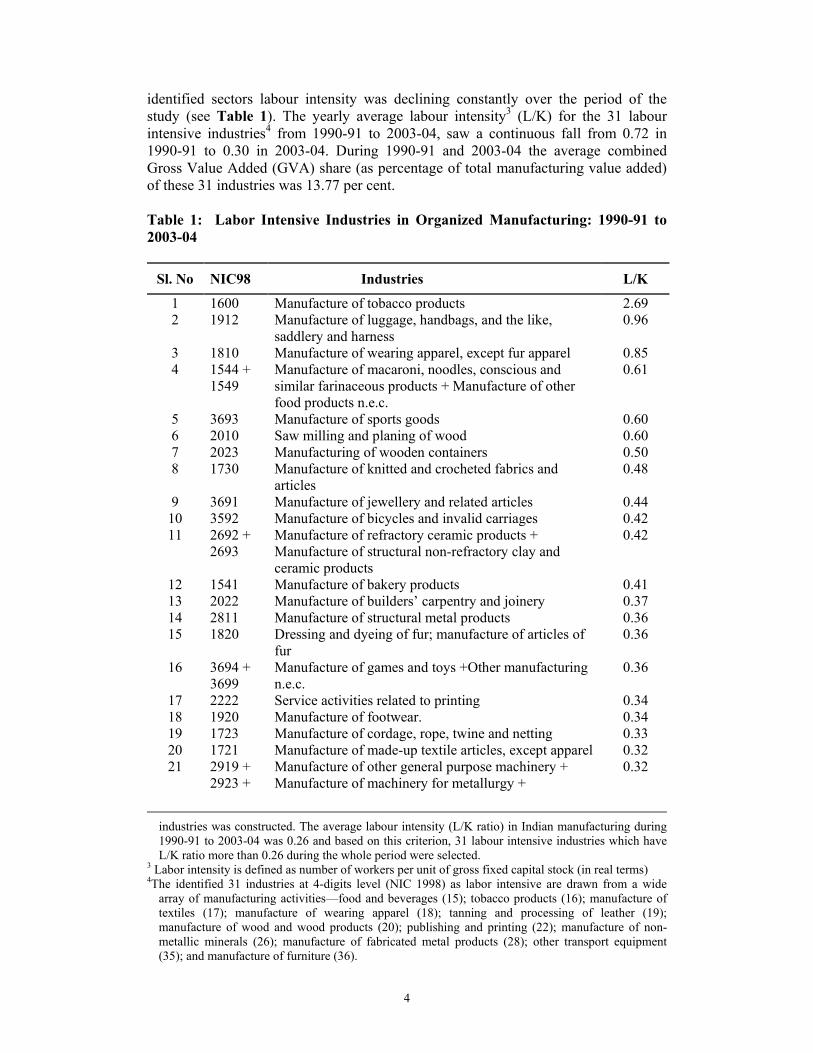
Table 1: Labor Intensive Industries in Organized Manufacturing: 1990-91 to
2003-04
Sl. No NIC98 Industries L/K
1 1600 Manufacture of tobacco products 2.69
2 1912 Manufacture of luggage, handbags, and the like,
saddlery and harness
0.96
3 1810 Manufacture of wearing apparel, except fur apparel 0.85
4 1544 +
1549
Manufacture of macaroni, noodles, conscious and
similar farinaceous products + Manufacture of other
food products n.e.c.
0.61
5 3693 Manufacture of sports goods 0.60
6 2010 Saw milling and planing of wood 0.60
7 2023 Manufacturing of wooden containers 0.50
8 1730 Manufacture of knitted and crocheted fabrics and
articles
0.48
9 3691 Manufacture of jewellery and related articles 0.44
10 3592 Manufacture of bicycles and invalid carriages 0.42
11 2692 +
2693
Manufacture of refractory ceramic products +
Manufacture of structural non-refractory clay and
ceramic products
0.42
12 1541 Manufacture of bakery products 0.41
13 2022 Manufacture of builders’ carpentry and joinery 0.37
14 2811 Manufacture of structural metal products 0.36
15 1820 Dressing and dyeing of fur; manufacture of articles of
fur
0.36
16 3694 +
3699
Manufacture of games and toys +Other manufacturing
n.e.c.
0.36
17 2222 Service activities related to printing 0.34
18 1920 Manufacture of footwear. 0.34
19 1723 Manufacture of cordage, rope, twine and netting 0.33
20 1721 Manufacture of made-up textile articles, except apparel 0.32
21 2919 +
2923 +
Manufacture of other general purpose machinery +
Manufacture of machinery for metallurgy +
0.32
industries was constructed. The average labour intensity (L/K ratio) in Indian manufacturing during
1990-91 to 2003-04 was 0.26 and based on this criterion, 31 labour intensive industries which have
L/K ratio more than 0.26 during the whole period were selected. 3 Labor intensity is defined as number of workers per unit of gross fixed capital stock (in real terms) 4The identified 31 industries at 4-digits level (NIC 1998) as labor intensive are drawn from a wide
array of manufacturing activities—food and beverages (15); tobacco products (16); manufacture of
textiles (17); manufacture of wearing apparel (18); tanning and processing of leather (19);
manufacture of wood and wood products (20); publishing and printing (22); manufacture of non-
metallic minerals (26); manufacture of fabricated metal products (28); other transport equipment
(35); and manufacture of furniture (36).

5
Sl. No NIC98 Industries L/K
2927 +
2929
Manufacture of weapons and ammunition +
Manufacture of other special purpose machinery
22 2899 Manufacture of other fabricated metal products n.e.c. 0.32
23 2021 Manufacture of veneer sheets; manufacture of
plywood, laming board, particle board and other panels
and boards
0.31
24 2211 +
2219
Publishing of books, brochures, musical books and
other publications + Other publishing
0.31
25 2696 Cutting, shaping and finishing of stone 0.30
26 2102 Manufacture of corrugated paper and paperboard and
of containers of paper and paperboard
0.30
27 1533 Manufacture of prepared animal feeds 0.29
28 3610 Manufacture of furniture 0.29
29 1712 Finishing of textile excluding khadi/handloom 0.28
30 2109 Manufacture of other articles of paper and paperboard 0.27
31 2519 Manufacture of other rubber products 0.26
Value Added Share (13.77 percent)
Source: Das et. al (2009)
Chart 1: Labor Intensity (L/K) of All Labor Intensive Industries: 1990-91 to
2003-04
Source: Das et. al (2009)
The decline in labour intensity in the case of these labour intensive sectors seemed
inevitable due to the inclusion of new and sophisticated technologies in production
processes which are more capital intensity. The manufacturers to ensure scale and
price competitiveness engage with more capital intensity; however we find that there
is a decline in capital productivity. This has serious implications for employment- in a
country like India with limited resources, spending more on capital which yields
declining productivity not only limits employment but also lower labour

6
productivity5. Chart 1 summarizes the state of labour intensive industries in India’s
organized manufacturing for the period 1990-91 to 2003-04.
The performance of labour intensive industries in terms of indicators like employment
growth (including elasticity), labour productivity growth, and growth in real product
wages6 were computed. The 31 labour intensive sectors witnessed an employment
growth of 4.1 per cent per annum for the period 1990-91 to 2003-04. If this period is
sub-divided into three periods—1990-91 to 1995-96, 1996-97 to 1999-00, and 2000-
01 to 2003-04—we observe employment growth declining from around 6 per cent to
around 2 per cent per annum by the end of the 1990s and again gaining to around 5
per cent in 2003-04. The low employment growth recorded in the second sub-period
is mainly due to a decline in employment generation by industries7 which have a large
employment share. The period 2000-04 again shows an increase in employment
growth in industries with a large share.
The study by Das et al. (2009) makes an attempt to compute the employment
elasticity of the labour intensive sectors for the period and its sub-periods to find out
some plausible reasons behind the observed pattern of employment growth. The
employment elasticity for the 31 sectors shows a decline from period one to period
two, while it shows a jump from period two to period three. Comparing the growth in
value added and employment (12 and 5.24 per cent per annum respectively) in period
three with that in period two (2.36 and 1.88 per cent per annum respectively), they see
that employment growth and elasticity improved in the 2000s. After 2000-01 there
was a substantial improvement because both employment and real gross value added
(GVA) growth jumped after 2001-02. In the second phase of the reforms, in spite of
real GVA growth remaining high, the output growth did not translate into
employment growth. The employment elasticity also allows Das et al (2009) to
identify the industries with potential for employment generation for the period 2000-
20048. However, when the entire period is looked at, it can be seen that several
industries do not present a very encouraging picture.
This raises an important question as to whether this reflects an enhancement of labour
productivity or a rise in real wages or both. Further, in a reforming economy, it is
argued that via competition from trade exposure, efficiency will improve and if output
also expands given a dynamic business environment in an open economy, we expect
demand for labour to push real wages up. In this context, Das et al. (2009) computed
the productivity and real product wages for the 31 labour intensive sectors (Table 2).
5 Our argument is based on the following identity: Rate of growth of labour productivity = Rate of growth of capital productivity + Rate of growth of capital intensity. Das et al (2009) highlights this
argument. 6 While analyzing trends in real wages, one may consider either the real product wage (nominal wages
deflated by output price index) or real wage in the sense of real income of the workers (nominal
wages deflated by consumer price index). The analysis presented here focuses on the real product
wage because that has implications for growth in employment. Thus, ‘real wages’ is used throughout
in the sense of real product wages. 7The industries with a large share in employment generation include tobacco, wearing apparels,
footwear, clay and ceramic products, refractory and non-refractory industries, and cutting and
polishing industries. 8Knitted and crocheted fabrics, jewellery, refractory as well as non-refractory items, footwear, made up
textiles, and publishing are some of the labor intensive sectors with high employment elasticity.

7
Table 2: Changes in Labor Productivity, Employment and Real Wages: Labor
Intensive Industries (% per annum)
Performance Indicators
1990-91 to
1995-96
1996-97 to
1999-00
2000-01 to
2003-04
1990-91 to
2003-04
Labor productivity growth
5.39 4.55 11.78 -0.72
Real wages growth
2.73 1.79 4.68 1.97
Employment growth
4.10 5.49 1.88 5.24
Note: The figures represent the weighted average of 31identified labor intensive industries at
four digit NIC 98 level of industrial classification.
Source: Das et. al (2009)
III. Firm Level Survey: Research Focus, Questionnaire, Sectors and Sampling
Framework
In this section we provide an appraisal of the survey of firms focusing on the
underlying methodology for addressing the research agenda. Three aspects of the firm
level survey are discussed—the research agenda on which the survey was carried out,
the design of the questionnaire, and the selection of firms.
Research focus
The need for increasing employment opportunities in the manufacturing sector in the
post-reform period constitutes an important challenge for policy makers in India. The
potential for employment generation of the labour intensive sectors thus becomes an
important research focus. Given that the dynamics of the manufacturing sector in
India since the 1990s has undergone changes through liberalization as well as
relaxation of rules and regulations that govern trade procedures (both export and
import), and industrial deregulations, labour intensive sectors, particularly those with
an export orientation, are expected to expand their output to cater to international
markets, and in turn generate more employment. Against this background our
research shows that almost one-third of the manufacturing industries (4-digit National
Industrial Classification [NIC] 1998) despite being labour intensive show a declining
L/K ratio. Further, these industries encompass important items of export like leather,
textiles, food processing, sports goods, and metal based products. We find that the
labour intensive sectors recorded a low employment growth of 4 per cent per annum
and from a policy point of view, it is important to examine the employment
generation potential of these sectors by undertaking a study of their employment
pattern. Our study aims to assess if with the expansion of production activities in a
liberalized industrial and trading regime, there is an automatic expansion of the
workforce or are there still serious impediments to employment generation. The focus
of the survey, therefore, is two-fold: first, to assess if labour intensive firms are
generating employment, and second understanding and analyzing the impediments in
employment generation at the level of labour intensive firms.
The design of the questionnaire
The questionnaire was structured to seek both quantitative as well as qualitative
answers from the firms. Accordingly, it focused on the following aspects: section one

8
covered general information about the business enterprise (age, size, major items of
production, inputs); section two focused on sales and employment data
(value/volume, total persons engaged—managerial, workers, permanent, temporary
and outsourced— gender, wage rate by category, hours worked, educational
background, social security benefits, machines used, domestic versus imported
machines, machines to workers); section three, asked questions about export items
including volumes, export destinations, competitors, tariff status of imported inputs,
export assistances availed, and infrastructural bottlenecks and; the final section dealt
with qualitative questions on technology, labour laws, exporting, and government
initiatives.
The questionnaire aimed to address issues that are crucial for understanding the
employment potential of labour intensive firms. Apart from recording the numbers for
different categories of workers (including gender segregation), an attempt was also
made to track the educational background of the workers in order to get an idea of the
total persons engaged as skilled and unskilled persons. Further, wages and shift
operation data of the workers was also compiled. An important aspect of the survey
was to ascertain if the firms were substituting workers by machines. Hence,
quantification in terms of man-machine ratio was also attempted. Information on
aspects of social security arrangements was also tracked. Appropriate weightage was
also given to understanding export profiles of labour intensive firms, including issues
of competition in an open trading environment and measures available to stay
competitive in global markets.
The qualitative questions were generated to help the investigators understand several
crucial aspects that the firms used when deciding to hire more people and in turn
enhancing employment potentials. Attention was given to the twin issues crucial to
any examination of employment generation in developing countries: the technology-
employment nexus, and the labour laws-employment nexus. The role of the
government vis-à-vis employment generation was also addressed keeping in mind
possible policy formulations. As with any firm level survey in a developing country,
the budget and time constraints were major considerations in the design of the
questionnaire.9
The Sectors and coverage
The sectors chosen for the study were guided by two considerations. Firstly, the five
sectors selected were among the major labour intensive sectors among the 31 sectors
identified by Das et al. (2009). They comprised 9 per cent of the total employment in
organized manufacturing. Secondly, the chosen sectors were important foreign
exchange earners for India. Also based on the computed yardsticks of industrial
performance—employment growth, real wage growth, and labour productivity—these
sectors had been impressive performers and thus important for a study on the labour
intensive sector (Box 1 gives the reasons for selecting these five sectors).
9Considerations were given to the fact that labor intensive firms in India belong mostly to unorganized
as well as small scale family based business initiative and thus questions on financial aspects of
business would not be welcome. Due attention was also given to the fact that executives/owners do
not give appointments for survey related queries on businesses and hence the number/range of
questions was kept small and simple.
9
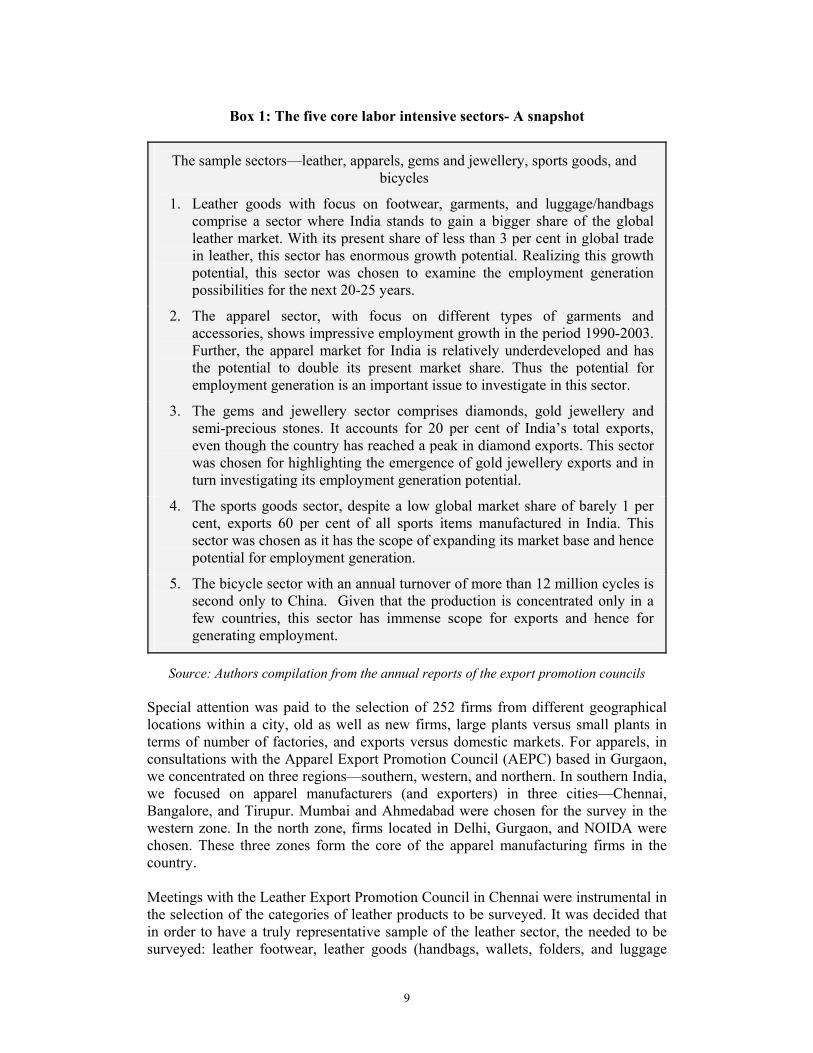
Box 1: The five core labor intensive sectors- A snapshot
The sample sectors—leather, apparels, gems and jewellery, sports goods, and
bicycles
1. Leather goods with focus on footwear, garments, and luggage/handbags
comprise a sector where India stands to gain a bigger share of the global
leather market. With its present share of less than 3 per cent in global trade
in leather, this sector has enormous growth potential. Realizing this growth
potential, this sector was chosen to examine the employment generation
possibilities for the next 20-25 years.
2. The apparel sector, with focus on different types of garments and
accessories, shows impressive employment growth in the period 1990-2003.
Further, the apparel market for India is relatively underdeveloped and has
the potential to double its present market share. Thus the potential for
employment generation is an important issue to investigate in this sector.
3. The gems and jewellery sector comprises diamonds, gold jewellery and
semi-precious stones. It accounts for 20 per cent of India’s total exports,
even though the country has reached a peak in diamond exports. This sector
was chosen for highlighting the emergence of gold jewellery exports and in
turn investigating its employment generation potential.
4. The sports goods sector, despite a low global market share of barely 1 per
cent, exports 60 per cent of all sports items manufactured in India. This
sector was chosen as it has the scope of expanding its market base and hence
potential for employment generation.
5. The bicycle sector with an annual turnover of more than 12 million cycles is
second only to China. Given that the production is concentrated only in a
few countries, this sector has immense scope for exports and hence for
generating employment.
Source: Authors compilation from the annual reports of the export promotion councils
Special attention was paid to the selection of 252 firms from different geographical
locations within a city, old as well as new firms, large plants versus small plants in
terms of number of factories, and exports versus domestic markets. For apparels, in
consultations with the Apparel Export Promotion Council (AEPC) based in Gurgaon,
we concentrated on three regions—southern, western, and northern. In southern India,
we focused on apparel manufacturers (and exporters) in three cities—Chennai,
Bangalore, and Tirupur. Mumbai and Ahmedabad were chosen for the survey in the
western zone. In the north zone, firms located in Delhi, Gurgaon, and NOIDA were
chosen. These three zones form the core of the apparel manufacturing firms in the
country.
Meetings with the Leather Export Promotion Council in Chennai were instrumental in
the selection of the categories of leather products to be surveyed. It was decided that
in order to have a truly representative sample of the leather sector, the needed to be
surveyed: leather footwear, leather goods (handbags, wallets, folders, and luggage

10
etc.), and leather garments, which constitute a bulk of the leather exports from India.
Further, Kanpur, Agra, and Chennai were identified for leather footwear; Chennai and
Kolkata for leather goods; and Chennai and Delhi for leather garments as these cities
had a bulk of the manufacturing centers for these products.
Gems and jewellery is one sector where a bulk of the manufacturers is located in the
unorganized sector, with no compilation of a member directory either at the all-India
level or even at the city level in cities like Chennai, Delhi, and Kolkata. Therefore, the
sample included only those firms information about which was available with the
Gems and Jewellery Export Promotion Council in Mumbai. We focused on firms in
Mumbai and Surat for diamonds while for gold jewellery some information was
obtained from Chennai, Bangalore, Coimbatore, Delhi, and Kolkata.
The sports goods sector in India is mainly located in Jalandhar and Meerut with some
manufacturing activity also taking place in the National Capital Region (NCR) of
Delhi. For bicycles we surveyed the manufacturing as well as manufacturing-
exporting units in Ludhiana, as a bulk of the manufacturers-exporters are concentrated
in this city.
Sampling framework
The sampling technique chosen to create the sample size was based on a combination
of convenience and judgment sampling. We were not able to carry out random
sampling due to very large numbers in each of the sectors. Further, we found that in
each sector the firms can belong to either the organized or the unorganized
manufacturing sector. Then there is no database available from any source for these
segments.10 When it was not possible to identify every member of the population, the
pool of available subjects became biased and hence random sampling was not
considered appropriate for the survey. Given this situation we explored some other
probable sampling techniques like systematic sampling. But we faced a problem that
every Nth firm selected from the list of available population was not in operation
though it was listed in the available records of the population. Similarly, other options
like stratified sampling too were not feasible, given the availability of population data.
Further, it was a perquisite that appointments were taken before the investigating team
visited each firm and thus firms selected at random or any other sampling method
may not have been a very plausible outcome as there was no surety that selected firms
would figure in the sample. We thus followed the method of judgment sampling
where the sample was selected based on our judgment of the profile of the firms in the
labour intensive sectors and also because of the respondent firms’ readiness to take
part in the survey. In this connection, we involved the export promotion councils for
apparel, leather, gems and jewellery, and sports goods. For bicycles, we undertook a
survey of bicycle manufacturers and exporters on the internet.
Keeping in mind budget and time constraints a certain number of respondents from
each zone was fixed. Special attentions were paid to selecting firms from different
10Annual Survey of Industries has a database of all firms belonging to the registered manufacturing
sector; however, the secrecy clause under which data is gathered from the firms does not allow
disclosure of names of the firms listed with it under each NIC industrial sector.

11
geographical locations, old as well as new firms, large versus small plants in terms of
number of factories, exports versus domestic markets.
IV. Findings of the Survey
An analysis of the survey findings has been attempted across all the five labour
intensive sectors in terms of three size classes—small turnover firms, medium
turnover firms, and large turnover firms. Table 3 lists the number of firms as well as
the definitions of each category under the five selected labour intensive sectors. The
findings are sector specific and are centered on several issues that impact the
employment generation potential of these firms.
Table 3: The Labor Intensive Industries: Firms and Turnover
Sectors High
Turnover
Medium
Turnover
Low
Turnover
Turnover Definition
Apparel (74) 21 31 22 High (> 30 Rs. Crore),
Medium (6-30 Rs. Crore),
Low (< 6 Rs. Crore)
Leather (74) 14 36 24 High (> 30 Rs. Crore),
Medium (10-30 Rs. Crore),
Low (< 10 Rs. Crore)
Gems &
Jewellery (36)
10 14 12 High(> 100 Rs. Crore),
Medium (21-100 Rs. Crore),
Low (<20 Rs. Crore)
Sports (33) 5 15 13 High (> 30 Rs. Crore),
Medium (5-30 Rs. Crore),
Low (< 5 Rs. Crore)
Bicycle (35) 14 9 12 High (> 5Rs. Crore),
Medium (1.5-5 Rs. Crore),
Low (< 1.5Rs. Crore)
Source: Authors compilation from survey questionnaires.
During the survey we tried to focus our attention on: employment, the status of
machinery used, the nature of export emphasis that these firms’ exhibit, and labour
related issues that deter firms from hiring more workers.
IV.1 Employment Issues
Since the employment generation potential of labour intensive firms forms the core of
this paper, it is important to understand the number as well as the nature of the
workforce that these firms employ. Our survey focused on various aspects of
employment like permanent, temporary, outsourced, gender segregation of the
workforce, education profiles of the workers, and wages earned per shift, including
whether the firms had a gender based wage differential. Given that the survey was
cross- sectional in nature, we were only able to observe for any changes at a point in
time, rather than over time. Thus, our analysis picks up inter-firm, inter-region
differences in the employment status of labour intensive firms (wherever applicable).

12
This is also important for any kind of policy inferences that we attempt. Table 4
shows the employment growth of several categories of workers computed over the
period 2003-05.
Table 4: Employment growth (%) by categories of employment: 2003-05
Sector Total
Employed
Total
Workers
Male
Workers
Female
Worker
Apparel
High 7.92 6.85 6.77 7.01
Medium 11.16 11.06 12.04 8.47
Low 14.46 11.07 12.88 10.63
Leather
High 5.22 5.01 4.13 6.57
Medium 9.19 8.29 8.71 14.33
Low 9.59 9.57 9.67 *
Sports
High 15.46 17.18 12.2 31.66
Medium 12.21 10.49 11.05 15.91
Low 7.19 6.99 6.26 2.56
Bicycle
High 2.7 2.1 * *
Medium 5.0 2.8 * *
Low 3.2 5.2 * *
Gems & Jewellery
High * * * *
Medium * * * *
Low * * * *
Note: (1) *represents information not available (2) Total employed is inclusive of managerial
staff (3) Total workers includes those employed on a permanent basis.
Source: Authors compilation from survey questionnaires.
As can be seen from Table 4, there are sharp variations across different sectors in
terms of employment categories—total employed, total workers and male as well as
female workers. Further, for each category, we also find variations within each
division—low, medium, and high sales turnovers. For the apparel, leather, and sports
goods sectors our computed growth rates are over 5 per cent per annum across
different turnover sizes. For bicycle firms, we were only able to provide employment
growth in terms of the total employed and total workers. For the gems and jewellery
sector, firms were reluctant to provide any number on workforce as most of the firms
were outsourcing the actual production of jewellery and thus had no worker based
information. Overall, Table 4 provides evidence of growth in employment in the
selected labour intensive firms.
Since we found evidence of employment generation in the surveyed labour intensive
firms, the important question was to figure out the ratio of male to female workers in
the surveyed firms so as to get an idea of employment growth by gender. Further, it
was also important to find out whether there was a regional pattern for employment
generation by gender. Our survey came up with some interesting facts regarding

13
male-female worker ratios and regions. Chart 2 shows the male-female breakup in
employment in three labour intensive sectors—apparel, leather, and sports goods.11
For apparel, we find that the male-female worker ratio in the western and southern
regions is close to 50 per cent. For leather, female workers outnumber their male
counterparts in the southern region. For sports, where manufacturing is located mostly
in the northern region, we find the dominance of male workers. Chart 2 shows that
when it comes to employability of workers by gender, there seems to be a preference
for and availability of female workers relative to male workers in the western and
southern regions. In the northern and eastern regions, the employability is more in
favor of male workers perhaps because of the customs and social practices prevalent
in these regions.12 Further, our data for the period 2005 over 2003 also indicates that
the percentage of female workers relative to male workers has gone up in the apparel
and leather sectors. Our survey findings also indicate that this trend towards the
absorption of more female workers found favor with prospective employers as they
considered female workers to be more productive in terms of their fixed work
schedule and also because they were not involved in any trade union activity beyond
their work schedule.
Chart 2: Male-Female Ratio in Total Workers in Labor Intensive Industries
Source: Authors compilation from the survey questionnaires
11Unlike other labor intensive sectors, for the bicycle firms we were unable to get data on male-female
workers. Further, given that most of the firms surveyed were in Ludhiana in Punjab, our interviewers
felt that perhaps women job seekers were not seeking employment in bicycle manufacturing. 12Our survey findings for the leather and apparel sectors in the southern region show a relatively large
number of female workers as compared to male workers. In addition, we find that in hubs like Tirupur,
Chennai, and Bangalore, the absorption rate for the female workforce is much greater than that for the
male workforce.

14
A third dimension within employment issues in labour intensive firms concerns the
question of skilled versus unskilled worker requirements. Given that the firms are
moving towards more capital intensive techniques of production to meet the price
competitiveness and economies of scale of production, there is a gap between the
available workforce and requirement of skills. The selected sectors and consequently
the products manufactured require the workers to be trained in handling sophisticated
machines. So it was imperative to have the employment profile of workers by their
educational background. Chart 3 provides information in terms of percentage of
workers from different educational backgrounds across the selected labour intensive
sectors.
Chart 3: Employment by educational categories- Labor Intensive Industries
Source: Authors compilation from the survey questionnaires
In all the sectors,13 we find that a majority of the employed workers were educated
below the school level (<10th class). Qualifications like a graduate degree and industry
specific degrees are mostly applicable for managerial or supervisory level staff. This
holds across the three different turnover sizes. For apparel, leather, and sports goods
firms, we see that more than 65 per cent of the workforce has attained education less
than school level (< 10th class) whereas for bicycle firms, this figure is almost 100 per
cent. This shows that for products in the leather and apparel sectors those with higher
levels of qualification are engaged in supervisory roles in assembly line production.
13We do not have information for two sectors—bicycle manufacturing and gems and jewellery. For
bicycle manufacturing, we were not able to gather employment data by gender. In the case of the gems
and jewellery sector, particularly for gold jewellery, the firms did not have production worker
information since the production system is based on outsourcing to artisans. . The only information
available was of people employed in retail showrooms.

15
The survey results also point out that in all the sectors it is those workers who have
not passed school who form the core of the production process. It is important to point
out here that the firms call this category of workers unskilled workers. According to
the employers, skilled workers are those who have been trained to engage with
machinery which is being increasingly put to use in labour intensive firms to increase
the efficiency of the production process.
Employers in the firms surveyed were of the view that the bulk of the workforce
employed were dominated by those who have not passed school, it is the lack of a
trained workforce that acts as a deterrant to employment generation The training
required to handle specific machines being used in most firms be it apparel, leather,
sports goods, or bicycles sectors is ‘on the job’ training which requires time and
resources both of which are scarce for labour intensive sectors. Therefore, the non-
availability of trained workers emerges as an important issue in the employment
generation potential of the firms.
The final issue concerns the examination of wage rates in labour intensive sectors. For
all the firms surveyed, wages reflect payment for an 8-hour shift. The information that
we were able to collect is for wage payment for permanent workers, including both
permanent male and female workers. We were unable to get information of any wage
for temporary workers or even outsourced workers.14 We did not come across any
differential wage rates for male and female workers. We do, however, observe wage
differentials between skilled and unskilled workers for both male and female workers
(Table 5). Further, there are variations in wages across different labour intensive
sectors and our sample also reflects some regional variations in wages. In some of the
sectors, particularly sports good, we were unable to get any information on wages as
we did not find the workers divided into skilled and unskilled categories. In the
bicycle sector, we could not gather information about female workers.
Table 5: Average Wage by worker category per shifts: Labor Intensive sectors
Sectors Male Female
Skilled Unskilled Skilled Unskilled
Apparel 180 100 180 100
Leather 210 130 200 100
Sports 140 N.A. 140 N.A.
Bicycle 150 80 N.A. N.A.
Gems & Jewellery 220 150 200 150
Note:
1. The average wage figure corresponds to the information provided by the firms
2. Shift corresponds to 8 hours of work
3. N.A.= Information not available
Source: Authors compilation from survey questionnaires.
14It seems from the survey that labor intensive firms do outsource a significant amount of their
production work, particularly in textile, leather, and sports items. The nature of outsourcing and the
period of work often determine wages, which are in the form of piece rates and vary across firms,
sectors, and the nature of the job.
16
IV.2 Machinery Usage
Against the finding of declining labour intensity across all labour intensive industries
(Das et al 2009), it was imperative for us to check if capital was being substituted in
place of labour in India’s labour intensive firms? Towards this end, the survey set out
to collect information on the number and nature of machines in use; and more
precisely how many workers were working on single machine. With information on
workforce and machines for three continuous years, we were able to compute a
worker-machine ratio (Chart 4). This was important for our understanding of the
employment generation potential in the surveyed firms.
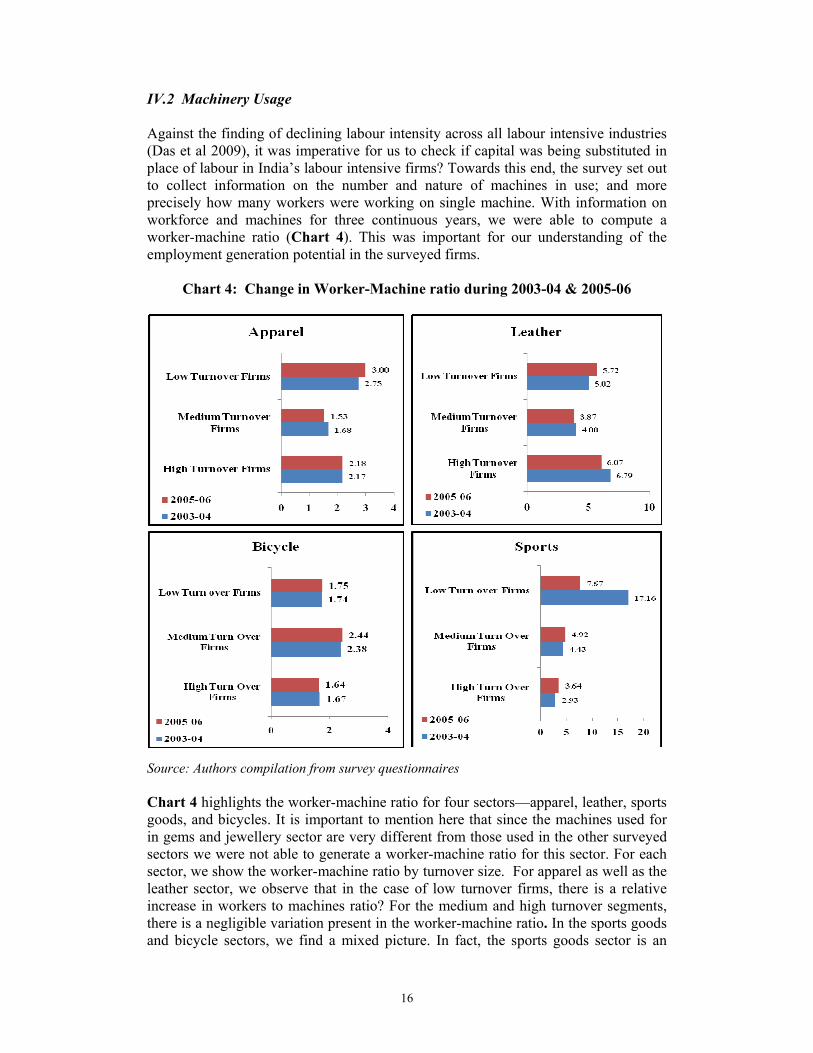
Chart 4: Change in Worker-Machine ratio during 2003-04 & 2005-06
Source: Authors compilation from survey questionnaires
Chart 4 highlights the worker-machine ratio for four sectors—apparel, leather, sports
goods, and bicycles. It is important to mention here that since the machines used for
in gems and jewellery sector are very different from those used in the other surveyed
sectors we were not able to generate a worker-machine ratio for this sector. For each
sector, we show the worker-machine ratio by turnover size. For apparel as well as the
leather sector, we observe that in the case of low turnover firms, there is a relative
increase in workers to machines ratio? For the medium and high turnover segments,
there is a negligible variation present in the worker-machine ratio. In the sports goods
and bicycle sectors, we find a mixed picture. In fact, the sports goods sector is an

17
exception, where firms that have a low turnover show a decline in the worker-
machine ratio. The statistical bars convey an important aspect of labour intensive
establishments—with every extra machine that the firm invests in and puts into
operation, there is an increase in the workforce to operate the machine. By and large
our observation across firms in all turnover sizes is that an increasing use of
machinery to bring in technological advancements is not necessarily labour
displacing.
In today’s world of global markets, firms must invest in machinery which embodies
advanced technology so that production efficiency is enhanced and they can compete
with lower unit costs in order to remain competitive. Towards this end, we find from
our survey that the firms realize the advantages of being at par with world technology.
This in turn ensures a greater potential for employment generation at the firm level as
new machines need workers to operate them. Machines at the level of these labour
intensive firms are mostly related to designing, cutting, and stitching be it for leather,
apparel or even sports items. These are either computer driven or electronically set or
manually operated thereby emphasizing the need for the involvement of workers.
IV.3 Trade orientation
Trade liberalisation in India was expected to lead to a shift in her industrial structure
towards more labor intensive industries by encouraging more labor intensive methods
of production in which India was expected to have a comparative advantage. The
abundance of cheap labour was expected to help Indian manufacturing exporters to
become price competitive. The available export demand for the labour intensive
industries creates a further potential for employment generation in these sectors. Thus
our aim in the survey was also to find out how trade orientation of the firms
influencing the employment generating potentials of these sectors. It is important to
point out here is that many of our surveyed firms were 100 per cent export oriented
units. We gathered information on major products and information on volume and
quantity to the extent possible was also sought. Additional information was sought on
export competition, markets, and the kind of assistance provided by the Government
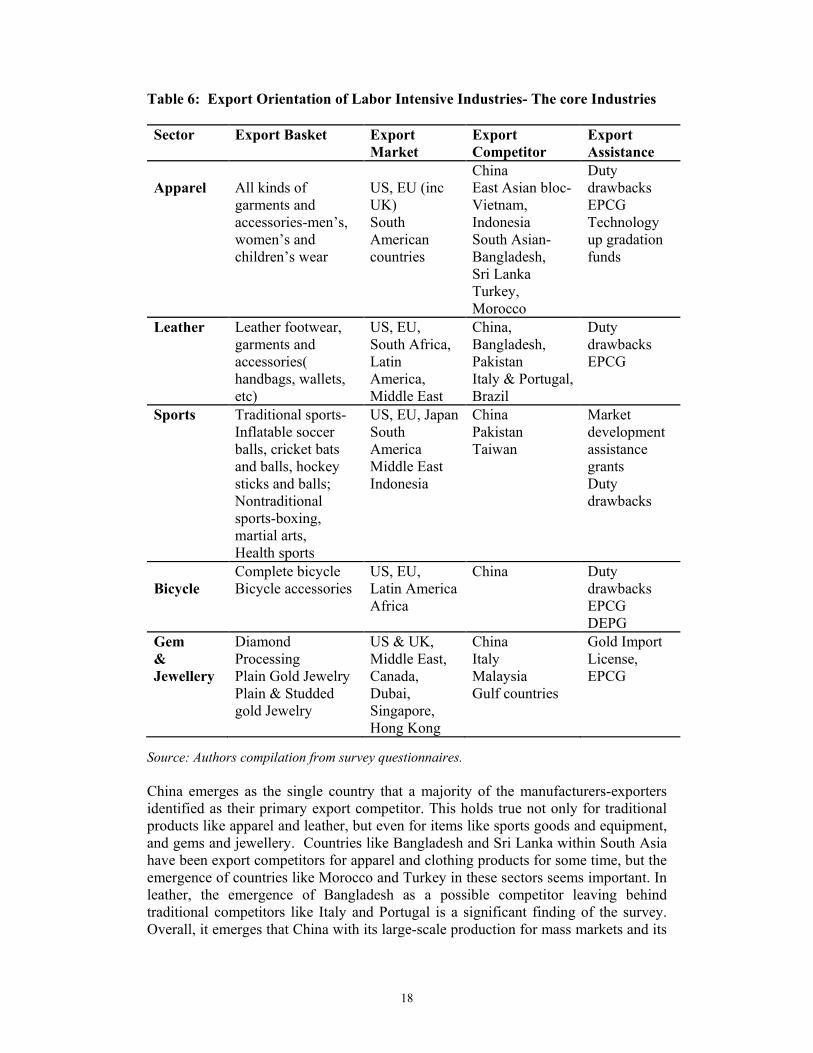
of India. Table 6 summarizes the export orientations of the five labour intensive
sectors.
Table 6 shows that the export baskets of each of the five labour intensive sectors were
diversified. The range of items produced for the export markets contains both high
value as well as mass market products covering both traditional as well as newer
products. Our survey indicates that both the US and the European Union (EU) form
the core of India’s export destinations, though for certain sectors —sports goods and
bicycles—South American nations show promise and potential of being India’s export
destinations. In the case of diamond exports from India, all major global markets
continue to be export destinations. However, in the case of gold jewellery, which the
Export Promotion Council of Gems and Jewellery targets as its high growth product,
most of the important markets remain in areas where people of Indian origin reside in
large numbers who invest in gold jewellery.
18
Table 6: Export Orientation of Labor Intensive Industries- The core Industries
Sector Export Basket Export
Market
Export
Competitor
Export
Assistance
Apparel
All kinds of
garments and
accessories-men’s,
women’s and
children’s wear
US, EU (inc
UK)
South
American
countries
China
East Asian bloc-
Vietnam,
Indonesia
South Asian-
Bangladesh,
Sri Lanka
Turkey,
Morocco
Duty
drawbacks
EPCG
Technology
up gradation
funds
Leather
Leather footwear,
garments and
accessories(
handbags, wallets,
etc)
US, EU,
South Africa,
Latin
America,
Middle East
China,
Bangladesh,
Pakistan
Italy & Portugal,
Brazil
Duty
drawbacks
EPCG
Sports
Traditional sports-
Inflatable soccer
balls, cricket bats
and balls, hockey
sticks and balls;
Nontraditional
sports-boxing,
martial arts,
Health sports
US, EU, Japan
South
America
Middle East
Indonesia
China
Pakistan
Taiwan
Market
development
assistance
grants
Duty
drawbacks
Bicycle
Complete bicycle
Bicycle accessories
US, EU,
Latin America
Africa
China Duty
drawbacks
EPCG
DEPG
Gem
&
Jewellery
Diamond
Processing
Plain Gold Jewelry
Plain & Studded
gold Jewelry
US & UK,
Middle East,
Canada,
Dubai,
Singapore,
Hong Kong
China
Italy
Malaysia
Gulf countries
Gold Import
License,
EPCG
Source: Authors compilation from survey questionnaires.
China emerges as the single country that a majority of the manufacturers-exporters
identified as their primary export competitor. This holds true not only for traditional
products like apparel and leather, but even for items like sports goods and equipment,
and gems and jewellery. Countries like Bangladesh and Sri Lanka within South Asia
have been export competitors for apparel and clothing products for some time, but the
emergence of countries like Morocco and Turkey in these sectors seems important. In
leather, the emergence of Bangladesh as a possible competitor leaving behind
traditional competitors like Italy and Portugal is a significant finding of the survey.
Overall, it emerges that China with its large-scale production for mass markets and its

19
on time delivery schedule finds favor with most buying agents, who procure orders
from the region for leading sellers and large retain changes in EU and the US.
Our final assertion is with respect to the role played by the government in boosting
exports of labour intensive firms. Following the 1991-92 trade reforms, the
government continues to support exporters, small and large, in various ways to
enhance their exports. The survey found that for most sectors, duty drawbacks and the
export promotion capital goods scheme (EPCG) was some of the assistance that the
firms availed of. In addition, in the apparel sector, we found some firms using
technology up-gradation schemes, whereas in sectors like sports goods, market
development assistance featured as the most utilized export promotion scheme. What
should also be mentioned here is that most labour intensive firms felt that the export
promotion councils set up by the Ministry of Commerce and Industry in each of the
five sectors needed to play a more proactive role in terms of bringing more buyers and
exporters into contact with each other. Further, the inadequacies of the infrastructural
support available, particularly internet and telecommunications, ports, and roads make
it difficult for exporters to sustain contact with buyers over a long period of time.
IV.4 Labour Issues
A crucial issue pertaining to the employment generation potential of labour intensive
firms has to do with existing labour laws. Our survey gathered information on
employee strength (in numbers), division of workforce into permanent and temporary,
workforce by gender, and outsourcing of jobs. In addition, questions were also asked
about trade unions and their abilities to negotiate wages, number of shifts and even
product profiles, and about labour conflicts in the last three years.
The following findings came up from our survey: First, outsourcing of jobs was a
prevalent practice in firms from all the three turnover categories. Our discussions with
employers across different sectors indicate that given the nature of export demands,
particularly for firms manufacturing apparel and leather products, and also the nature
of product-seasonal items, it was not feasible for them to employ people on a
permanent basis as the pattern of work along with demand indicate lay-offs for some
period of the year. Given the stipulations concerning rules and regulations for full
time employment as provided by the office of the labour commissioner, outsourcing
seemed to be a rational strategy, as well as a way of circumventing labour laws.
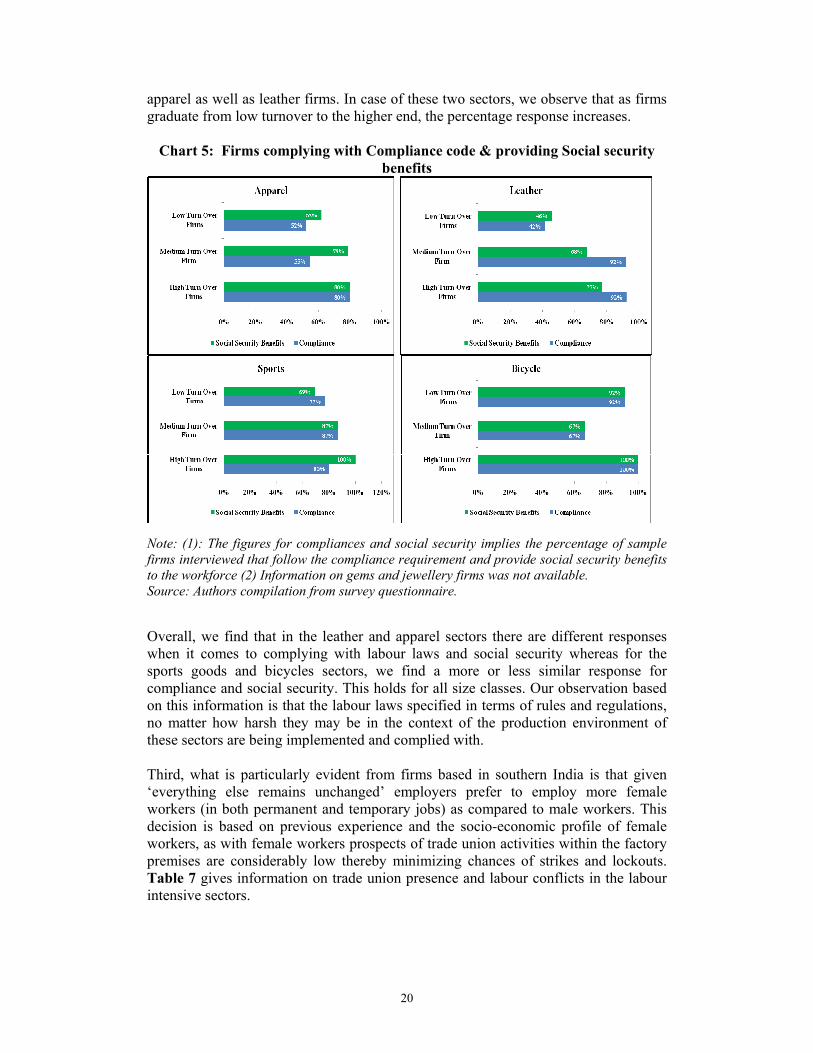
Second, our survey also gathered information about implementing labour laws like
compliance with various labour issues including child labour, and providing social
security benefits to workers who are employed on a permanent basis.15 From our
findings it is clear that almost all the firms surveyed complied with labour laws and
also with social security considerations (see Chart 5). As can be seen from Chart 5,
over 75 per cent of the surveyed firms in the high sales turnover category in apparel,
leather, bicycles, and sports goods sectors met the different compliance requirements.
Similar is the case for social security obligations. If we compare across firm sizes
(turnover), we find different levels of compliance and social security obligations for
15By compliances, we refer to labor law compliances in India (Minimum Wages Act, child labor,
payment of bonus, gratuity, ESI Act, and Factory Act); and by social security considerations, we refer
to life insurance, health insurance, and accident insurance etc.
20
apparel as well as leather firms. In case of these two sectors, we observe that as firms
graduate from low turnover to the higher end, the percentage response increases.
Chart 5: Firms complying with Compliance code & providing Social security
benefits
Note: (1): The figures for compliances and social security implies the percentage of sample
firms interviewed that follow the compliance requirement and provide social security benefits
to the workforce (2) Information on gems and jewellery firms was not available.
Source: Authors compilation from survey questionnaire.
Overall, we find that in the leather and apparel sectors there are different responses
when it comes to complying with labour laws and social security whereas for the
sports goods and bicycles sectors, we find a more or less similar response for
compliance and social security. This holds for all size classes. Our observation based
on this information is that the labour laws specified in terms of rules and regulations,
no matter how harsh they may be in the context of the production environment of
these sectors are being implemented and complied with.
Third, what is particularly evident from firms based in southern India is that given
‘everything else remains unchanged’ employers prefer to employ more female
workers (in both permanent and temporary jobs) as compared to male workers. This
decision is based on previous experience and the socio-economic profile of female
workers, as with female workers prospects of trade union activities within the factory
premises are considerably low thereby minimizing chances of strikes and lockouts.
Table 7 gives information on trade union presence and labour conflicts in the labour
intensive sectors.

21
Table 7: Trade Union, Labor Conflicts and Skilled Labor Shortages
Labor Intensive
Industries
Trade Union
Presence
Experienced
Labor Conflict
issues
Shortage of
Workforce
Apparel 16 24 76
Leather 19 18 66
Sports 4 16 62
Bicycle 8 14 42
Gems & Jewellery 11 13 59
Note: (1) The figures signify the percentage of total firms interviewed (2) Trade Union
Presence: Trade Unions having influence on the firm or workers are part of the trade union
group (3) Experienced Labor Conflict issues: Firm experienced closure or production
disruption due to labor conflict with management.
Source: Authors compilation from survey questionnaire.
Table 7 shows that trade unions were present in less than 20 per cent of the firms
interviewed. Our survey also shows that in the apparel and leather sectors, around 16
and 19 per cent surveyed firms had the presence of trade unions. In the other sectors,
the reported number was less. The fact that a small percentage of firms from our
survey show the existence of trade union activities is significant as these firms are all
labour intensive firms, and furthermost them are engaged in manufacturing-exporting
with some firms having 100 per cent export obligations. Therefore, labour
requirements of these firms are potentially larger as compared to other firms. In
addition, information was also collated on labour conflicts so as to draw possible
correlations between trade union presence and labour conflicts. Our findings show
that only a small percentage of firms reported labour conflicts. It would be a good
idea to ascertain if labour conflicts happened in those firms which have trade unions.
In particular, it would be interesting to find out how many firms in the sample had
both labour conflicts and the presence of trade unions. This would give us an idea if
trade union presence has any bearing on labour conflicts particularly in India where
labour laws are still very archaic. The deterrents when it comes to dealing with labour
issues had to do with firms’ inability to have flexible hiring practices like laying-off
workers during times of sluggish export demand. We observed that firms took
recourse to outsourcing of work to avoid prevalent hiring practices. It would be
important to point that whenever full time employment was adhered to, most of the
labour laws were complied with and social security obligations too were fulfilled.
Our findings from the survey point to two crucial issues within broad employment
patterns. The first is that there is a shortage of skilled workers. ‘Skill’ here refers to
the ability of a worker to handle the machinery that is being used in the factories.
Most firms surveyed were of the view that centers to provide ‘training’ to the workers
should be set up so that the firms can draw upon a steady pool of skilled workforce as
and when required. The second finding indicates that there is a trend towards hiring
female workers because of their efficiency and work ethics. This was clearly reflected
by employers in southern India. When it comes to technology, our survey clearly
shows that the emphasis was on using the latest available technology. Further the
worker-machine ratio indicated that workers were not being substituted by machines.
Labour intensive firms are expected to take part in global trade because of factor input
22
advantage. We, however, saw that these firms are far from achieving competitiveness
in exports. Several reasons were cited by the firms for this state, including inadequate
infrastructure, lack of export demand, and seasonality of export items. When it comes
to labour rules and regulations, it was seen that the firms preferred large scale
outsourcing to overcome difficulties of hiring and firing workers. In addition, it was
interesting to note that in most of the surveyed firms which were also 100 per cent
exporters, the presence of trade unions and labour conflicts did not figure as possible
deterrents to employment generation.
V. Policies to Address the Shortcomings
After finding out the shortcomings in the labour intensive sectors that act as deterrents
to employment generation we devised a set of policies to address these. Our
discussions on the basis of the survey centered around four aspects—the present
employment scenario, the status of machinery used, trade orientation, and labour
issues—all of which are significant in understanding the potential of employment
generation in these sectors. The following emerged as crucial policy issues in these
sectors:
Setting up of training centers to generate skilled workers
We observed that there is a shortage of a skilled workforce in all the sectors surveyed.
‘Skill’ here reflects the ability of the workers to handle modern machines which are
being increasingly put to use to increase efficiency (output per unit of input). We
found that in only one sector—apparel—there were training and designing centers
functioning under AEPC and the National Institute of Fashion Technology (NIFT). In
the case of leather and sports goods sectors we did not come across any such centers.
Hence, we recommend the setting up of training centers in rural areas, especially in
villages with private initiative or through private-government partnerships. This
would have a double benefit as it would train workers and ensure that industries come
up closer to the villages so that overheads like transportation costs for workers are
reduced.
Encouraging female workers
Our survey indicated that the number of women workers employed in the units
situated in the southern part of India far exceeds the number employed in the other
parts. Our interviews with the management of manufacturing-exporting units indicate
that these workers are preferred over their male counterparts on grounds of higher
efficiency and discipline. In apparel, leather, and sports goods sectors women workers
were more skilled at working with different kinds of machines like cutting, sewing,
and stitching. In the case of gold jewellery, retail units around the country are
employing more women given the nature of the product. In addition, with women
workers there were lesser chances of trade unions being formed. In order to encourage
more female workers to join labour intensive industries the government should
provide incentives to these industries to outsource more work to female workers and
also encourage the setting up of units in villages, where female workers could be
encouraged to take up both full and part time employment, depending on their
domestic requirements and needs. To spread this message, government-run voluntary
organizations and other women’s organizations could be asked to participate in

23
campaigns to educate women, particularly rural women about employment prospects
in labour intensive manufacturing industries.
Setting up ‘Parks’ in rural areas
The Apparel Park in Tirupur is fully functional and is assisting manufacturers-
exporters in meeting the burgeoning demand for apparels. We observed that large
exporters are outsourcing orders to small manufacturers who operate out of this park.
The large firms can work closely with units located in the park in terms of product
specifications and quality. We recommend that the government should explore the
possibility of setting up such parks in those districts of the states which are ‘hubs’ of
labour intensive exports in leather, textiles, sports goods, bicycles, and gems and
jewellery sectors with private initiative (from non-resident Indians and multinational
corporations). In the case of sports goods, districts near Jalandhar and Meerut should
be looked at for setting up of sports goods parks and; for gems and jewellery, districts
near Chennai and Kolkata could be looked at for setting up gold jewellery parks.
Similarly, districts bordering Ludhiana and leather goods production hubs like
Chennai, Agra, Kanpur, Kolkata, and NCR too could be looked at. This would not
only provide employment to workers near their homes thereby doing away with
potential migration for employment opportunities but it would also generate revenue
at the district level.
Reorienting the role of the export promotion councils
Export promotion councils set up by the Government of India to facilitate exports
should cater to the entire industry and not only to a handful of registered
manufacturers-exporters. The role of these councils should be redefined to help small
and medium enterprises who because of their low turnover bases are struggling to
make a dent in the export market. . Further, with the rupee becoming stronger against
the dollar, it would be advisable for export councils to help small and medium firms
to reach out to other non-dollar markets like EU, Africa, the Middle East, Australia,
and the Far East. In addition, because of a weak foreign market many exporters would
like to explore the domestic market and this is where the export promotion councils
can give them meaningful guidance to showcase their products in the rapidly
expanding domestic economy.
Small units and value chains
The emergence of India as a major economic competitor to China in export markets
across all products has put tremendous pressure on scales of production for Indian
manufacturers. China is sustaining its competitiveness (low price level) because of
large scales of production. Thus, when the scales of production become a significant
factor in deciding the prices for Indian products, it would pay to give an opportunity
to the small firms in the value chain through outsourcing from bigger players. This
would also eliminate the threat of their getting wiped out of the market because of
their low scales of production. The government should identify these small firms in
terms of specific products, maintain a database of these firms and see that the big and
small players play complementary roles on a common platform. This can be done
both for the export market as well as for the domestic sector. As has been mentioned
earlier the presence of numerous indigenous family based small units in the sports

24
goods and gems and jewellery sectors need an organized platform so that the bigger
players can outsource work to them. Government agencies can help these identified
small units with machines and also technical knowhow to create induced demand. The
government needs to play the role of a moderator between the organized big firms and
the unorganized small units.
Removing infrastructure bottlenecks
The global environment today requires well-functioning infrastructure, including
electric power, road and rail connectivity, telecommunications, air transport, and
efficient ports.16 India lags behind East and South East Asia in most of these crucial
areas. Availability of adequate infrastructural facilities, i.e., power, road connectivity,
transport facilities, energy, water, ports and airports are important for the robust
performance of the small and medium sized manufacturing units. Poor quality of
power and interruptions in supply often damage the plant and machinery/equipment
of the units. The interruption of power has been highlighted as a major problem for
the bicycle sector. In the case of the apparel sector, inadequate warehouse facilities in
ports have been a major concern, as after the removal of multi fiber agreement
(MFA), standards for exported products in the developed countries have become
really stringent. Strikes in ports and inefficient transport facilities add to the cost of
production. As the RBI (2005) report says facilitating public-private partnerships,
attracting foreign direct investment (FDI) into basic infrastructure and establishing
industrial parks for the small sector are options already under consideration by
relevant authorities. These need to be expedited. One solution to the infrastructure
problem lies in an increased emphasis on cluster development, which will factor in the
development of required infrastructural facilities in an organized manner for the
cluster as a whole. Therefore, there is a need to strengthen the National Cluster
Development Programme and for setting up functional industrial parks.
Availability of credit
Without adequate finance, manufacturing units cannot acquire or absorb new
technologies nor can they expand to compete in global markets or even strike business
linkages with larger firms. However, the small manufacturing units face significant
barriers in getting institutional and financial resources to meet their fixed and working
capital needs. This lack of finance has an impact on capacity expansion as well as on
technological up-gradation, which determine the competitiveness of a firm in terms of
both the price and the quality of products that it is manufacturing. The impediments in
output growth eventually lead to a reduction in employment. As mentioned by the
RBI report (2005) because of asymmetric information and high-risk perceptions about
the small and medium enterprises (SME), banks prefer collateral-based lending rather
than going in for a cash-flow analysis while working with small borrowers. This is
where the role of the export promotion council can be pivotal as an agent which can
facilitate the easy flow of finance from the banking sector to the manufacturers.
16The survey did not address infrastructure as a specific issue in labor intensive firms; however,
information regarding infrastructural availability were gathered in the context of export deterrents.

25
Conclusions
The aim of the study was to determine the factors that constrain employment
generation in five chosen labour intensive sectors—apparel, leather, sports goods,
bicycles, and gems and jewellery. To this end, an in-depth firm level survey
comprising of more than 250 manufacturing as well as manufacturing- exporting units
was undertaken across all major towns and cities that constitute hubs of these sectors.
As per the findings of the survey some factors were common to all the five sectors
while there were also diverse issues that confront the business environment in these
industries17.
The study points out that several factors inhibit employment generation. In particular,
lack of a skilled workforce, low levels of machinery used because of low levels of
investment, and a non-competitive export orientation because of infrastructural
bottlenecks, and rigid labour rules regarding hiring and firing act as possible
deterrents to employment generation in labour intensive firms. To overcome these, the
study suggests a set of policy initiatives that can address barriers to employment
generation in these sectors.
The study and its recommendations encompass some limitations of the survey. These
could be listed as: presence of more export oriented units in each of the samples,
inability to offer workers’ perspective on employment generation potential as the
qualitative part of the survey addressed only managerial viewpoints. This holds
particular significance in sector like gems and jewellery where the artisans and job
contractors form the actual workforce of the sector. Finally, given that many of the
chosen firms had a sizeable presence of unorganized workers we were unable to
differentiate between firms belonging to the organized manufacturing sector and those
from the unorganized segment of overall manufacturing.
17 Refer to the National Manufacturing Competitiveness Council report on “A Study of Labor Intensity
and Potential of Indian Manufacturing” 2008 for detailed sector specific policy recommendations.

26
References
Annual Survey of Industries, Summary Results for Factory Sector, Central Statistical
Organization, Government of India, various issues.
Bhalotra, Sonia R. (1998). ‘The Puzzle of Jobless Growth in Indian Manufacturing’,
Oxford Bulletin of Economics and Statistics, 60(1):5–32.
Chaudhuri, Sudip. (2002). ‘Economic Reforms and Industrial Structure in India’,
Economic and Political Weekly, (12 January):Vol. 37 No. 02.
Das, D. K., Deepika Wadhwa and Gunajit Kalita (2009). ‘The Employment Potential
of Labor Intensive Industries: An Appraisal of India’s Organized
Manufacturing’,Working Paper # 236 , ICRIER, New Delhi.
Ghose, A. K. (1994): ‘Employment in Organised Manufacturing in India’, Indian
Journal of Labour Economics, 37 (2): 141–162.
Goldar, Bishwanath. (2000). ‘Employment Growth in Organised Manufacturing in
India’, Economic and Political Weekly, Vol. 35 No. 14.
(2002). ‘Trade Liberalization and Manufacturing Employment—The Case of
India, Employment Paper No. 2002/34’. International Labour Office, Geneva.
NMCC (2008). ‘A Study of Labor Intensity and Employment Potential of Indian
Manufacturing’, National Manufacturing Competitiveness Council,
Government of India, New Delhi.
Nagaraj, R. (1994). ‘Employment and Wages in Manufacturing Industries: Trends,
Hypothesis and Evidence’, Economic and Political Weekly, Vol. 29 No.04.
(2000). ‘Organised Manufacturing Employment’, Economic and Political
Weekly, (16 September): Vol. 35 No. 38.
(2004). ‘Fall in Organised Manufacturing Employment—A Brief Note’,
Economic and Political Weekly, (24 July): Vol. 39 No. 30.
Papola, T. S. (1994). ‘Structural Adjustment, Labour Market Flexibility and
Employment’, Indian Journal of Labour Economics, 37(1): 3–16.
Reserve Bank of India (RBI). (2005). Report of the Internal Group to Review
Guidelines on Credit Flow to SME Sector, Rural Planning and Credit
Department, RBI, New Delhi.
Tendulkar, S. D. (2000). ‘Employment Growth in Factory Manufacturing Sector
during pre and post Reform periods’, paper presented at a conference to
honour Professor K. L. Krishna on the theme ‘Industrialisation in a Reforming

27
Economy: A Quantitative Assessment’, Delhi School of Economics, Delhi,
(20–22 December).
Thomas, J. J. (2002). ‘A Review of Indian Manufacturing’, India Development Report
2002. Oxford University Press, New Delhi.
U. Rani and J. Unni (2004). ‘Unorganised and Organised manufacturing in India:
potential for employment generating growth’, Economic and Political Weekly,
39 (41): 4,568–4,580.
World Bank. (1989). India: Poverty, Employment and Social Service: A World Bank
Country Study. World Bank, Washington, D.C.

28
LATEST ICRIER’S WORKING PAPERS
NO. TITLE
AUTHOR YEAR
236 EMPLOYMENT POTENTIAL OF
INDIA’S LABOUR INTENSIVE
INDUSTRIES
DEB KUSUM DAS
DEEPIKA WADHWA
GUNAJIT KALITA
JUNE 2009
235
THE TWO WAVES OF SERVICE-
SECTOR GROWTH
BARRY EICHENGREEN
POONAM GUPTA
MAY 2009
234 INDIAN ECONOMIC OUTLOOK
2008-09 AND 2009-10
RAJIV KUMAR
MATHEW JOSEPH
DONY ALEX
PANKAJ VASHISHT
DEBOSREE BANERJEE
MARCH
2009
233 ADVERSE SELECTION AND PRIVATE
HEALTH INSURANCE COVERAGE IN
INDIA:A RATIONAL BEHAVIOUR
MODEL OF INSURANCE AGENTS
UNDER ASYMMETRIC INFORMATION
SUKUMAR VELLAKKAL
FEBRUARY
2009
232
INDIA IN THE GLOBAL AND
REGIONAL TRADE: DETERMINANTS
OF AGGREGATE AND BILATERAL
TRADE FLOWS AND FIRMS’
DECISION TO EXPORT
T.N. SRINIVASAN
VANI ARCHANA
FEBRUARY
2009
231
TRADE IN ENERGY SERVICES: GATS
AND INDIA
ARPITA MUKHERJEE
RAMNEET GOSWAMI
FEBRUARY
2009
230
THE MISSING MIDDLE
ANNE O. KRUEGER
JANUARY
2009
229 WHAT CAN BE LEARNED ABOUT
THE ECONOMIES OF CHINA AND
INDIA FROM PURCHASING POWER
COMPARISONS?
ALAN HESTON DECEMBER
2008
228 THE COST COMPETITIVENESS OF
MANUFACTURING IN CHINA AND
INDIA: AN INDUSTRY AND
REGIONAL PERSPECTIVE
BART VAN ARK
ABDUL AZEEZ
ERUMBAN
VIVIAN CHEN
UTSAV KUMAR
DECEMBER
2008
227
EMERGING THROUGH
TECHNOLOGICAL CAPABILITY: AN
OVERVIEW OF INDIA’S
TECHNOLOGICAL TRAJECTORY
AMIT SHOVON RAY
NOVEMBER
2008
29
About ICRIER
ICRIER – established in August 1981 – is an autonomous, policy-oriented, not-for-
profit economic policy think tank. ICRIER’s main focus is to enhance the knowledge
content of policy making by undertaking analytical research that is targeted at
improving India’s interface with the global economy. We have nurtured our autonomy
by establishing an endowment fund, income from which enables us pursue our
priority research agenda. ICRIER’s office is located in the prime institutional complex
of India Habitat Centre, New Delhi.
ICRIER’s founding Chairman was Dr. K.B. Lall who led the organization since its
inception till 1992 when he handed over the Chairmanship to Mr. R.N. Malhotra
(1992-1996). He was followed by Dr. I.G. Patel who remained Chairman from 1997
to 2005 until his demise in July 2005. ICRIER’s current Chairperson is Dr. Isher
Judge Ahluwalia. Amongst ICRIER’s founding members are: Dr. Manmohan Singh,
Dr. C. Rangarajan, Dr. M.S. Swaminathan, Dr. Jagdish Bhagwati, Dr. R. J. Chelliah,
Mr. Muchkund Dubey, Prof. Deepak Nayyar etc.
To effectively disseminate the research findings, ICRIER organises workshops/
seminars/ conferences to bring together policy makers, academicians, Union Cabinet
Ministers, Members of Parliament, senior industry representatives and media persons
to try and create a more informed understanding on issues of major policy interest.
ICRIER invites distinguished scholars and policy makers from around the world to
deliver public lectures on economic themes of interest to contemporary India.
ICRIER’s highly qualified in-house team of about 50 researchers includes several
Ph.Ds from reputed Indian and foreign universities. In addition, we have 23 External
Consultants working on specific projects. The team is led by Dr. Rajiv Kumar,
D.Phil in Economics from Oxford University and Ph.D from Lucknow University.