Do IPO Firms Misclassify Expenses? Implications for IPO ... · Do IPO Firms Misclassify Expenses?...
53
Do IPO Firms Misclassify Expenses? Implications for IPO Price Formation and Post-IPO Stock Performance Xiaotao (Kelvin) Liu D’Amore-McKim School of Business Northeastern University [email protected] Biyu Wu School of Accountancy College of Business University of Nebraska-Lincoln [email protected] July 2018 Acknowledgments: We received very helpful comments from Jaehan Ahn, Scott Bauguess, Yun Fan, Andrew Trotman, Michael Willenborg, and Summer Xia. We also thank participants at the workshop at Division of Economic Risk and Analysis, Securities and Exchange Commission, Peking University, and Renmin University of China.
Transcript of Do IPO Firms Misclassify Expenses? Implications for IPO ... · Do IPO Firms Misclassify Expenses?...
Do IPO Firms Misclassify Expenses?
Implications for IPO Price Formation and Post-IPO Stock Performance
Xiaotao (Kelvin) Liu
D’Amore-McKim School of Business
Northeastern University
Biyu Wu
School of Accountancy
College of Business
University of Nebraska-Lincoln
July 2018
Acknowledgments: We received very helpful comments from Jaehan Ahn, Scott Bauguess, Yun Fan,
Andrew Trotman, Michael Willenborg, and Summer Xia. We also thank participants at the workshop at
Division of Economic Risk and Analysis, Securities and Exchange Commission, Peking University, and
Renmin University of China.
Do IPO Firms Misclassify Expenses?
Implications for IPO Price Formation and Post-IPO Stock Performance
Abstract
This study investigates whether IPO firms inflate “core” earnings through classification shifting (i.e.,
misclassifying core expenses as income-decreasing special items) immediately prior to IPOs. We provide
initial evidence that IPO firms engage in classification shifting in the pre-IPO period. Using hand-collect
price and share information from prospectuses, we find that pre-IPO classification shifting is positively
associated with the price revision from the mid-point of initial price range to the final offer price, suggesting
that pre-IPO classification shifting influences IPO price formation. Furthermore, we find that pre-IPO
classification shifting is followed by negative post-IPO stock returns, indicating that classification shifting
contributes to post-IPO underperformance. In addition, we find that IPO firms classification shift to a
greater degree when accruals management is constrained. Overall, our findings caution investors, auditors,
and regulators that classification shifting, a seemingly innocuous accounting maneuver, can mislead
investors in their IPO valuation and contribute to post-IPO underperformance.
Keywords: initial public offerings; classification shifting; special items; price formation; post-IPO stock
performance
1
Do IPO Firms Classification Shift?
Implications for IPO Price Formation and Post-IPO Stock Performance
1. Introduction
Initial public offering (IPO) firms often highlight in their prospectuses such “core” earnings
measures as earnings before interest, taxes, depreciation, and amortization (EBITDA) and adjusted
EBITDA. These earnings measures exclude transitory items (e.g., special items), and thus are often
considered to constitute “core” earnings. For example, SeaWorld Entertainment, Inc., in its prospectus,
asserts that “investors, lenders, financial analysts and rating agencies have historically used EBITDA
related measures … to estimate the value of a company and to make informed investment decisions.”1
Extant accounting studies have demonstrated that core earnings are more persistent than special items and
have a stronger association with market reactions (Lipe 1986, Francis et al. 1996, Barton et al. 2010). IPO
literature suggests that these “core” earnings measures are often used in valuing IPOs (e.g., Kim and Ritter
1999, Purnanandam and Swaminathan 2004).
To report higher “core” earnings, managers can misclassify persistent core expenses such as cost
of goods sold (COGS) and selling, general, and administrative expenses (SG&A) as part of income-
decreasing special items such as restructuring expenses, and merger and acquisitions (M&A), which are
typically considered to be transitory and non-recurring. This accounting manipulation is referred to as
classification shifting or expense misclassification (McVay 2006). Classification shifting allows firms to
report higher core earnings, where core earnings are defined as sales less core expenses, without altering
the bottom-line earnings (i.e., net income). Classification shifting research has attracted growing interest in
recent years. This research stream has thus far focused primarily on already-public companies and
concluded that they misclassify core expenses to achieve various earnings benchmarks (e.g., Fan and Liu
2017). We investigate in this study whether IPO firms engage in classification shifting prior to the IPO and,
if so, whether classification shifting is associated with IPO price formation and lower post-IPO returns.
1 See https://www.sec.gov/Archives/edgar/data/1564902/000119312513161702/d448022d424b4.htm.
2
These research questions are important for the following reasons. First, IPO price formation is
comprised of the price revision from the mid-point of initial price range to the final offer price and the
initial return from the final offer price to the first-trading-day closing price (i.e., underpricing). Accounting
information plays an important role in the book-building process (Brau and Fawcett 2006, Willenborg et al.
2015). Inflated “core earnings” through classification shifting will likely influence investor valuation, while
this association remains untapped. Second, prior IPO research shows that issuers experience relatively
lower returns in the post-IPO period (e.g., Teoh et al. 1998 a, b). If the implications of pre-IPO classification
shifting are unraveled (i.e., misclassified core expenses recur) in the post-IPO period, then post-IPO
underperformance is likely associated with pre-IPO classification shifting. This is consequential and we
investigate this possibility. Third, prior IPO literature has focused primarily on accruals management (e.g.,
Teoh et al. 1998 a, b, DuCharme et al. 2001, Ball and Shivakumar 2008, Venkataraman et al. 2008,
Armstrong et al. 2016). Little is known about classification shifting of IPO firms. The IPO context is
characterized by both heightened incentives and opportunities for earnings management, which provides a
unique setting to investigate classification shifting. Classification shifting differs from accrual manipulation
as it does not change either current or future net income. Hence, empirical evidence on accruals
management does not readily apply to classification shifting.
IPO firms’ valuation often involves the use of an issuer’s core earnings and comparable firms’
earnings-to-price ratios (e.g., Kim and Ritter 1999, Purnanandam and Swaminathan 2004). The use of “core”
earnings in pricing and valuing IPOs provides IPO firms significant incentives to misclassify core expenses
as special items. Countering this incentive, IPO firms are subject to heightened litigation risk and
monitoring scrutiny from the Securities and Exchange Commission (SEC), auditors, and other stakeholders
(Lowry and Shu 2002, DuCharme et al. 2004, Venkataraman et al. 2008). For example, Section 11 of the
Securities Act of 1933 holds an IPO firm and its managers liable for an untrue statement or an omission of
a material fact in the registration statement, whereas plaintiffs do not need to prove the issuer’s fraudulent
intent. For another example, Venkataraman et al. (2008) find that pre-IPO accruals are less than post-IPO
3
accruals and audit fees for IPO engagements are greater than those for post-IPO engagements. This
evidence is also consistent with higher litigation exposure for IPO firms mitigating their opportunistic
earnings management. Given the increased monitoring scrutiny in the pre-IPO period, issuers may refrain
from pursuing opportunistic classification shifting. In summary, it remains an empirical question whether
IPO firms will engage in classification shifting.
We argue that IPO firms are likely to engage in classification shifting despite heightened scrutiny
around IPOs. This is because external monitors (e.g., auditors) are more concerned with income-increasing
than non-income-increasing earnings management (Nelson et al. 2002, Pittman and Zhao 2017).
Classification shifting does not affect either current or future net income, and thus likely attracts less
monitoring scrutiny and is subject to lower litigation exposure. On balance, we hypothesize that IPO firms
will misclassify core expenses as income-decreasing special items prior to going public, which inflates their
pre-IPO core earnings.
During the book-building period, an issuer and its underwriters conduct road shows to receive
indications of investor interest before finalizing the offer price. If road-show investors are impressed by
“core” earnings, they will signal stronger interest in the issuer’s stock. This leads to a positive price revision
from the initial price range to the final offer price. Thus, we hypothesize that the degree of pre-IPO
classification shifting is positively associated with price revisions. Since the positive IPO price adjustment
is often incomplete (e.g., Hanley 1993), we predict that pre-IPO classification shifting is also positively
associated with initial returns. However, it is conceivable that issuers will negotiate aggressively over the
final offer price such that it compounds fully the implications of classification shifting. This possibility
would lead to a lack of association between pre-IPO classification shifting and initial returns. When
misclassified core expenses reappear following IPOs, it will become at last clear to investors that pre-IPO
core earnings have been overstated and investors will downward adjust the issuer’s valuation. Therefore,
we hypothesize that pre-IPO classification shifting is associated with lower post-IPO stock returns.
4
Using a sample of 805 firm-commitment U.S. IPOs from 2001 to 2016, we find that IPO firms’
pre-IPO unexpected core earnings increase with income-decreasing special items (coded as positive values),
which supports our hypothesis that IPO firms engage in classification shifting prior to their offerings. To
test the effect of classification shifting on price revisions, we hand-collect price and share information from
both the preliminary prospectus that first disclose the IPO offer price range and the final IPO prospectus.
Our findings also show that pre-IPO classification shifting is positively associated with the price revision
from the initial price range to the final offer price, suggesting that classification shifting activities influence
investor valuation. We do not find an association between pre-IPO classification shifting and IPO initial
returns. This result suggests that issuers manage to negotiate a final offer price that fully absorbs the investor
interest arising from inflated core earnings due to classification shifting, leaving little money on the table
on the issuing day. Finally, we find that pre-IPO classification shifting is negatively associated with post-
IPO stock returns. Taken together, our findings indicate that pre-IPO classification shifting inflates core
earnings and the final offering price but decreases stock returns in the subsequent year. Using three different
abnormal accruals proxies, we further find that pre-IPO classification shifting is negatively associated with
levels of abnormal accruals. These findings suggest that IPO firms utilize classification shifting to a greater
degree when accruals management is more constrained.2
Our study makes the following contributions to the accounting literature. First, this study
contributes to the IPO price formation literature by showing that issuers’ pre-IPO classification shifting is
associated with IPO price revisions in the book-building process. Our findings corroborate recent IPO
literature suggesting that “core earnings,” albeit not bottom-line earnings, constitute important signals that
issuers convey regarding their value (Brau and Fawcett 2006, Willenborg et al. 2015). By showing that the
final offer price capitalizes inflation of core earnings, this study enriches the IPO overvaluation literature
2 IPO firms can also use real activities manipulation (i.e., actions managers take that deviate from normal business
practices) to influence market valuation (e.g., Roychowdhury 2006, Cohen and Zarowin 2010, Wongsunwai 2013).
Unlike real activities manipulation, both accruals management and classification shifting rely only upon accounting
manipulation. A comprehensive investigation of trade-offs among classification shifting, accruals manipulation, real
activities manipulation in the IPO context is beyond the scope of this study.

5
(e.g., Teoh et al. 1998 a, b, Purnanandam and Swaminathan 2004). Second, our results add to the post-IPO
underperformance literature by offering an alternative cause (e.g., Teoh et al. 1998a, Ritter 1991). That is,
pre-IPO classification shifting is associated with lower post-IPO stock performance. Third, we provide
initial evidence that IPO firms engage in classification shifting, suggesting that IPO firms are not
necessarily fixated on bottom-line earnings. We also find that IPO firms classification shift to a greater
degree when they are constrained to manage accruals. Overall, our findings caution investors, auditors, and
regulators that the seemingly innocuous classification shifting, which does not alter current or future net
income, can mislead investors and contribute to post-IPO underperformance.
The remainder of this paper is organized as follows. In the next section, we review the relevant
literature and develop our hypotheses. In section 3, we present sample selection procedure and descriptive
statistics, followed by a description of the methodology used to measure classification shifting in section 4.
Section 5 discusses the research design and results. Finally, we conclude with a discussion of our results
and implications in section 6.
2. Literature and Hypotheses Development
Classification Shifting
Investors attach different values to different line items in the income statement. A line item closer
to sales is more persistent (Lipe 1986, Elliott and Hanna 1996, Francis et al. 1996). Using a broad cross-
country sample, Barton et al. (2010, p. 786) find that performance measures toward the middle of the
income statement “generally tend to be more value relevant when they include core operating expenses and
exclude more transitory items like extraordinary items, gains and losses, and other comprehensive income.”
Managers are, therefore, incentivized to misclassify persistent core expenses (i.e., COGS and SG&A) as
transitory income-decreasing special items (e.g., merger and acquisition costs, and restructuring
expenditures), such that companies can report higher “core” earnings. This form of earnings management
(i.e., classification shifting), does not affect current or future bottom-line earnings (i.e., net income).
6
Classification shifting has received increasing attention in recent literature. McVay (2006) first
documents that unexpected core earnings increase with income-decreasing special items, concluding that
firms engage in classification shifting. Using quarterly data, Fan et al. (2010) provide results indicating that
firms employ classification shifting to achieve various earnings benchmarks. Collectively, these studies
suggest that firms engage in classification shifting to influence investor valuation. However, it remains an
empirical question whether IPO firms will engage in opportunistic classification shifting to window dress
“core” earnings.
Classification Shifting by IPO Firms
The IPO setting provides an excellent context to investigate classification shifting as it presents
both heightened incentives and constraints for opportunistic classification shifting. On one hand, prior IPO
studies have documented that accounting information will influence IPO valuations (Brau and Fawcett 2006,
Willenborg et al. 2015). As such, managers of IPO firms have strong financial incentives to manipulate
earnings to increase IPO valuations (Friedlan 1994, DuCharme et al. 2001). On the other hand, IPO firms
encounter heightened litigation risk (e.g., Billing and Lewis 2016). 3 Lawsuits and regulatory actions
following the detection of pre-IPO earnings manipulation impose significant costs on IPO firms and their
executives (Ball and Shivakumar 2008, Venkataraman et al. 2008, Wongsunwai 2013). For example,
DuCharme et al. (2004) find that the incidences of IPO lawsuits and settlement amounts are positively
related to the extent of discretionary accruals around IPOs. In addition, issuers’ registration statements,
which include financial statements, are also subject to scrutiny from auditors, regulators and other
stakeholders (Morsfield and Tan 2006, Ball and Shivakumar 2008).
3 While all public firms are subject to Rule 10b-5 of the Securities Exchange Act of 1934 for material misstatements,
IPO firms face additional litigation risks under Section 11 of the Securities Act of 1933. Compared to Rule 10b-5,
Section 11 does not require plaintiffs (e.g., investors) to prove that defendants (e.g., IPO firms’ managers) acted with
intent or reckless disregard (scienter) and thus relaxes the pleading requirements of plaintiffs.

7
IPO firms often highlight “core” earnings that exclude “unusual” or “non-recurring” items in their
prospectuses. They claim that these “core” earnings are more value relevant.4 Classification shifting allows
an IPO firm to misclassify recurring expenses as “unusual” or “non-recurring” expenses (i.e., income-
decreasing special items), and therefore, to inflate the “core” earnings. In addition, IPO firms often
experience special item events such as acquisitions or divestitures (e.g., Teoh et al. 1998a), providing
abundant opportunities for classification shifting. However, IPO firms are also subject to heightened
litigation risk and scrutiny (e.g., Ball and Shivakumar 2008, Morsfield and Tan 2006, Venkataraman et al.
2008). On one hand, the salient litigation risk and monitoring scrutiny may inhibit issuers from engaging
in classification shifting. On the other hand, auditors and other stakeholders likely focus primarily on
income-increasing as opposed to non-income-increasing attempts (e.g., Becker et al. 1998, Nelson et al.
2002, Pittman and Zhao 2017). Since classification shifting does not alter either current or future net income,
external monitors may acquiesce to classification shifting even if they can detect it.
On balance, we conjecture that IPO firms will classification shift core expenses as income-
decreasing special items to inflate their core earnings.
H1: IPO firms engage in classification shifting prior to the IPO.
Classification Shifting and Price Formation
An IPO firm must provide an initial price range within which it plans to sell its stocks when it files
to go public in its initial prospectus or an amended prospectus. Following this disclosure, the issuer’s senior
management and its underwriters conduct road shows and meet with select investors. Through these
meetings, the underwriters receive indications of interest from these investors and discuss the final offer
price with the issuer. This is commonly referred to as the book-building process, during which regular (or
roadshow) investors obtain access to an issuer’s financial statements and non-financial disclosures. The
4 For example, Axalta Coating Systems Ltd. reports in its prospectus adjusted EBITDA, and suggests that EBITDA
provides a clearer indicator for “core earnings.” For details, please see
https://www.sec.gov/Archives/edgar/data/1616862/000119312514411385/d764723d424b1.htm.
8
final offer price is determined the evening before the first day of trading, and then the shares begin to trade.
The initial return or underpricing (i.e., the difference between the first-day closing price and the offer price)
is on average positive (e.g., Benveniste and Spindt 1989, Hanley 1993).5 Although the positive initial
returns (i.e., “underpricing”) have been the primary focus in extant IPO pricing literature, recent accounting
studies are increasingly interested in the price revision from the midpoint of initial price range to the final
offer price (e.g., Willenborg et al. 2015, Bochkay et al. 2018). As Ritter and Welch (2002, p. 1803) point
out, price revision is key to understand initial returns and that “the solution to the underpricing puzzle has
to lie in focusing on the setting of the offer price.”
During roadshows, issuing companies present and discuss financial (e.g., core earnings) and non-
financial information contained in their prospectus. These disclosures inform investors of an issuer’s
prospect and risks and help to shape investor valuation and IPO pricing. In their survey of chief financial
officers (CFOs) (Brau and Fawcett 2006, p. 399), CFOs consider that the “most important positive signal
is the historical earnings” in the IPO valuation process. If pre-IPO classification shifting inflates core
earnings, it likely influences IPO price formation in the book-building process during which roadshow
investors express their interest in the issuer’s shares. Willenborg et al. (2015) find that financial
performance reported in the prospectus is positively associated with price revisions. Bochkay et al. (2018)
demonstrate that management’s voluntary disclosures of going-concerns are associated with downward
offer price revisions. When an issuer’s core earnings are inflated by classification shifting, investors will
likely consider its performance favorably and express stronger interest in the issuer’s stock. The positive
investor interest will likely lead to a positive price update from the initial range to the final price. Therefore,
we predict that the IPO price revision is positively associated with pre-IPO classification shifting.
H2a: IPO price revisions are positively associated with pre-IPO classification shifting.
5 For example, Kayak Software Corp. determined an initial offer price range of $22-$25. Following its road shows,
Kayak Corp. finalized its offer price at $26 and closed its first trading day at $33.18.
9
The effect of pre-IPO classification shifting on initial returns (“underpricing”) is likely contingent
on the completeness of the final offer price incorporating implications of pre-IPO classification shifting.
According to the book-building theory (Benveniste and Spindt 1989), the final offer price partially adjusts
to positive information during roadshows, but fully adjusts to negative information. This “partial”
adjustment of offer price allows issuing companies to compensate investors for truthfully revealing their
interest in the issuer’s stock. Hanley (1993) provides initial evidence that first-day returns are significantly
and positively associated with price revisions, which lends support to the “partial adjustment” theory. As
discussed above, pre-IPO classification shifting inflates core earnings, leading to positive price revisions.
Consistent with the “partial” adjustment literature, it is likely that the positive investor interest induced by
pre-IPO classification shifting is only partially incorporated in the final offer price. Consequently, initial
returns are likely to be positively associated with pre-IPO classification shifting.
On the other hand, an issuer experiences urgency of cashing out the benefits of pre-IPO
classification shifting. When an IPO firm inflates core earnings via classification shifting, road-show
investors are unlikely to be aware of this window-dressing maneuver. Nevertheless, investors will
ultimately unravel the implications of pre-IPO classification shifting in the following year, if not sooner,
when misclassified core expenses reappear. Understanding that they have one year or less to realize the pre-
IPO window-dressing benefits, issuers likely request the final offer price to completely capitalize the
inflated core earnings. Otherwise, they run the risk of forfeiting the financial benefits of classification
shifting. Hence, the issuer will negotiate aggressively with the underwriter for an increase of the final offer
price from the initial price range to the extent that it fully absorbs investor interest in the issuer’s stock
arising from pre-IPO classification shifting. If this is the case, then price revisions are complete and issuers
leave little money on the table on the issuing day. As a result, initial returns will not be associated with pre-
IPO classification shifting.
In summary, the relation between pre-IPO classification shifting and initial returns is an empirical
question. We provide a hypothesis in its alternative form as follows.
10
H2b: IPO initial returns are positively associated with pre-IPO classification shifting.
Classification Shifting and Post-IPO Stock Performance
Core expenses that were misclassified as income-decreasing special items in the pre-IPO period
will most likely reappear in the fiscal period following the IPO (McVay 2006). As discussed before,
investors will eventually realize that offering firms that are involved in pre-IPO classification shifting have
been previously overvalued, and thus downward adjust their valuations. This realization will likely occur
around the disclosure of the first annual income statement in the post-IPO period, if not sooner. Therefore,
we hypothesize that IPO firms, which misclassify core expenses as income-decreasing special items before
the IPOs, will likely experience lower stock returns in the following year when core expenses reappear.
H3: Post-IPO stock returns are negatively associated with pre-IPO classification shifting.
3. Sample and Descriptive Statistics
Sample
We obtain two samples: the full sample and the IPO sample. We use the full sample to estimate
expectation models for both levels and changes in core earnings, and we use the IPO sample to test our
hypotheses. For the full sample, we obtain all firm-years from Compustat from 1999 to 2015. 6 7 Consistent
with the classification shifting literature (e.g., McVay 2006, Barua et al. 2010), we use sales as scalar and
drop firm-years that have annual sales missing or less than $1 million,8 or have negative net operating assets.
To ensure that our data are comparable across years, we exclude firm-years that change fiscal-year-end
from t-1 to t or from t to t+1. We further eliminate firm-years that do not have sufficient data to estimate
the core earnings (both levels and changes) expectation models. We define industries based on Fama and
6 The sample period of the full sample is consistent with that of the IPO sample, which we discuss later. We require
one year of lagged data and one year of future data in our hypotheses tests. Therefore, to construct variables for
hypotheses testing during 1999-2015, we start with all firm-years from Compustat during 1998–2016. 7 Consistent with the classification shifting literature (e.g., McVay 2006, Fan et al. 2010), we replace missing values
of special items (SPI) and extraordinary items and discontinued operations (XIDOC) with zeroes. 8 To test the sensitivity of our results to this sampling requirement, we construct alternative testing samples with at
least $0.5 million annual sales. Results are inferentially the same.
11
French’s (1997) 48 industries and require a minimum of 15 observations per industry year to estimate
expected core earnings. Our final full sample consists of 84,630 firm-years.
From Thomson Financials’ Securities Data Company (SDC) database, we obtain the IPO sample
by identifying firm-commitment domestic IPOs by nonfinancial registrants from January 1, 2001 to
December 31, 2016. Following prior IPO studies (e.g., Lowry and Shu 2002), we drop unit offerings (i.e.,
bundles of stocks and warrants) and American Depository Receipts (ADRs). We also exclude issuers whose
most current pre-IPO fiscal year financial data is not available on Compustat. Similar to the sampling
procedure of the full sample, we eliminate IPO firms that do not have the necessary data for classification
shifting analyses.9 Our final IPO sample for IPO firms’ classification shifting tests (H1) consist of 805 IPOs
with the most-recent pre-IPO fiscal years from 1999 to 2015. For our tests of IPO price formation (H2) and
post-IPO stock returns (H3), we also drop IPOs with the midpoint of initial price range less than five dollars
(e.g., Ljungqvist and Wilhelm 2003, Lowry and Schwert 2004), or missing required data. Our final IPO
sample for the analyses of price revision (H2) and post-IPO returns (H3) include 789 IPOs.
Descriptive Statistics
Panel A of Table 1 provides descriptive statistics for both the full sample and the IPO sample. For
the full sample, the mean (median) CEt (core earnings scaled by sales) is 0.100 (0.127). The mean (median)
ΔCEt (change in core earnings from fiscal year t-1 to t) is 0.013 (0.001). Following McVay (2006), we
replace income-increasing special items with zeroes and code income-decreasing special items as positive.10
Mean (median) %SIt (income-decreasing special items scaled by sales) is 0.028 (0.000). The mean (median)
UE_CEt (unexpected core earnings in year t) is 0.001 (0.002). The mean (median) UE_ΔCEt+1 (unexpected
9 The IPO sample comprises 39 of the 48 Fama-French industries with necessary data, and 21 of these industries
each constitutes more than one percent of the IPO sample, indicating a wide selection of industries (untabulated).
There is a concentration of IPOs (22.48%) in the business service industry, which is similar to that reported by
recent IPO studies (e.g., Venkataraman et al. 2008, Cecchini, et al. 2012). 10 We focus on income-decreasing (versus income-increasing) special items, which allows firms to absorb core
expenses to report higher core earnings. Nevertheless, our inferences and conclusions are unaffected when we do not
code income-increasing special items as zeros.
12
change in core earnings from year t to t+1) approximates zero. We discuss the computations of the
unexpected level of and change in core earnings in the following section.
[Insert Table 1 here.]
We test our hypotheses using the IPO sample and define year t as the fiscal year immediately prior
to the IPO. IPO prospectuses include financial statements for year t, which are provided to investors prior
to issuers’ road shows in the book-building process. Year t+1 is the year in which the IPO firm goes public
(i.e., the IPO year). The last three columns of Table 1, Panel A, provide the descriptive statistics of the IPO
sample. Whereas the mean (median) CEt is 0.073 (0.117), which is lower than 0.100 (0.127) of the full
sample, the mean (median) ΔCEt is 0.074 (0.013), which is much higher than 0.013 (0.001) of the full
sample. These comparisons are consistent with prior IPO literature suggesting that IPO firms, compared to
already-public firms, are less profitable and have high growth (e.g., Fama and French 2004). As a ratio of
sales, the average income-decreasing special items is 0.018 for IPO firms, which is lower than that of the
full sample (0.028). The relatively lower amount of income-decreasing special items will likely work
against us finding IPO firms using special items to misclassify core expenses.
Panels B and C of Table 1 present Pearson correlations of the main variables for the full sample
and the IPO sample used for testing H1, respectively. For both the full sample and the IPO sample, %SIt is
positively correlated with UE_CEt (0.032 and 0.141, respectively) and negatively correlated with
UE_ΔCEt+1 (-0.009 and -0.103, respectively). These preliminary statistics are largely consistent with the
classification shifting hypothesis for both the full sample and IPO sample. That is, IPO and non-IPO
companies misclassify core expenses as income-decreasing special items, leading to a positive correlation
between unexpected core earnings and income-decreasing special items; whereas core expenses recur in
the following year, resulting in a negative correlation between unexpected change in core earnings and
income-decreasing special items. Furthermore, the correlation between %SIt and UE_CEt or UE_ΔCEt+1
are notably larger in magnitude for the IPO sample than those for the full sample. These correlations suggest
that IPO firms’ expense misclassification is likely to be greater than those of non-IPO firms.
13
Panel D of Table 1 provides descriptive statistics for the IPO sample for testing both H2 and H3.
Given the data requirement for classification shifting analyses, our IPO sample will likely differ from those
used in previous IPO studies. We discuss descriptive statistics of the IPO sample in this study in comparison
to those from several prior IPO studies. We focus to a greater extent on a comparison with Willenborg et
al.’s (2015) sample because they focus on price formation and their sample period ranges from 2001 to
2013, which overlaps to a large degree with our sample period from 2001 to 2016.
Panel D shows that the mean (median) PRC_REV (percentage change from the midpoint of initial
price range to the offer price) is -3.5% (0.0%). The average PRC_REV is less negative than the -4.5% of
Willenborg et al.’s (2015) sample, and more negative than the -1.4% of Lowry and Schwert’s (2004) pre-
bubble period sample. The mean (median) INI_RET (percentage change from offer price to the first-day
closing price) is 14.2% (8.5%). This average value is similar in magnitude to Lowry and Schwert’s (2004)
12.3% and Willenborg et al.’s (2015) 14.7%. The average one-year post-IPO buy-hold-returns adjusted by
Fama-French 25 portfolio returns (PAR), CRSP value-weighted market portfolio returns (MAR_VW), and
CRSP equally-weighted market portfolio returns (MAR_EW) are 1.1%, 0.0%, and -3.8%, respectively.11 In
summary, the descriptive statistics of these key dependent variables are comparable to prior IPO studies.
Following prior studies, we include macro-economic, firm-level and deal-specific control variables
for testing IPO price formation (H2). We control for marketwide public information (i.e., IND_RET and
IPO_RET) during the book-building phase (Ljungqvist and Wilhelm 2003). IND_RET is the average return
on all firms in CRSP in the issuer’s Fama-French 48 industry, and IPO_RET is the average initial return for
all IPOs. We also include IND_RET_POS to allow for the differential effect of positive and negative market
news on IPO price formation (e.g., Loughran and Ritter 2002, Lowry and Schwert 2004). The average
IND_RET (1.3%) and IPO_RET (12.1%) are both comparable to Willenborg et al.’s (2015) 1.57% and
12.82%, respectively.
11 The average raw one-year post-IPO buy-and-hold-return of the IPO sample is 7.2% (untabulated), which is close
to that of Jay Ritter’s sample of IPOs during 1980-2015, 7.4% (see Table 20-1 of Initial Public Offerings: Updated
Statistics, available on Jay Ritter’s IPO Data website.)
14
The mean (median) ROA of our IPO sample is -2.1% (1.7%), which is much higher than Willenborg
et al.’s (2015) -22.24% (0.16%) and lower than Fedyk et al.’s (2017) 3.86% (2.04%). The mean (median)
ASSETS of 957.61 (219.40) for our IPO sample is greater than Willenborg et al.’s (2015) 701.77 (100.00).
Our IPO firms are older on average than Willenborg et al.’s (2015) sample firms (the average of AGE:
24.77 versus 19.94). The percentage of IPO firms from high-technology industries (25%) approximates
Willenborg et al.’s (2015) 28%, whereas biotechnology firms account for a smaller percentage of our
sample (4.4% versus 15.25%). Combined, these differences indicate that our sample firms are larger, older,
more profitable, and less likely from biotechnology industries than Willenborg et al.’s (2015) sample
firms.12
In terms of IPO characteristics, management equity retainment (RETAIN_INI) and the number of
shares to be sold by current shareholders (SECOND_INI) have an average of 71.3% and 19.2%, respectively.
They are comparable to Willenborg et al.’s (2015) 72.24% and 16.17%. The percentage of IPO firms backed
by venture capitalists in our IPO sample (35.1%) is close to Lowry and Schwert’s (2004) 35.50% and lower
than Willenborg et al.’s (2015) 53%. IPO issuers with Big N auditors account for an average of 84.2% of
our sample, which is close to the 87% of Willenborg et al.’s (2015) sample. Compared to Willenborg et
al.’s (2015) sample, our IPO firms on average raise more offering proceeds (PRO_INI: 239.20 versus
201.66) and are more likely to be listed on NYSE or AMEX (the average of NYSE/AMEX = 43.2% versus
32%). The carve-out IPOs account for a greater percentage of our sample firms (20.7%) than those of Lowry
and Schwert’s (2004) sample (12.3%). Given these differences in descriptive statistics, caution must be
taken when generalizing our inferences of our results to the entire IPO population.
4. Measuring Classification Shifting
12 As we focus on expense misclassification, we require IPO firms to have revenue (greater than one million dollars)
such that a sample firm can have economically meaningful core expenses for classification shifting purposes. Some
issuers, especially biotechnology companies, may have negligible revenue and core expenses (e.g., COGS and selling
expenses) in the pre-IPO period and, therefore, are excluded from our IPO sample. For example, Aegerion
Pharmaceuticals, Inc., a biotechnology company, went public in 2010 and did not recognize revenue until 2013. It is
not meaningful for this issuer to engage in expense misclassification and thus it is excluded from our IPO sample.
15
Following the classification shifting literature, we model expected level of and changes in core
earnings using all Compustat firm-years with available data.13 We predict that unexpected core earnings are
positively associated with the amount of income-decreasing special items. However, this positive
association can also result from the enhanced operating efficiency (i.e., “efficiency improvement”
hypothesis). That is, firms can increase efficiency and in turn “core” earnings by removing unproductive
assets or restructuring unprofitable business lines. To distinguish classification shifting hypothesis from
efficiency improvement hypothesis, we follow McVay (2006) and employ “reversal” analyses. Specifically,
we model expected changes in core earnings and examine the association between unexpected change in
core earnings from year t to t+1 and income-decreasing special items in year t. If this association is positive,
indicating that firms are able to sustain higher levels of core earnings following special item events, then
the efficiency improvement hypothesis is likely to hold. Otherwise, if unexpected changes in core earnings
from year t to year t+1 are negatively associated with special items in year t, then it suggests that at least a
portion of previously misclassified core expenses reappears a year later. This scenario would be consistent
with the classification shifting hypothesis.
Models of expected core earnings and expected change in core earnings
Following McVay (2006), we use the following expectation models for the level of (Model 1) and
change in (Model 2) core earnings, respectively:
CEt = α0 + α1CEt-1 + α2ATOt + α3ACCR t−1 + α4ACCRt + α5ΔSALEt + α6NEG_ΔSALEt + μt, (1)
ΔCEt = α0’ + α1’CEt-1 + α2’ΔCEt-1 + α3’ΔATOt + α4’ACCRt-1 + α5’ACCRt + α6’ΔSALEt +
α7’NEG_ΔSALEt + μt’, (2)
Appendix A provides variable definitions. We calculate core earnings (CEt) as sales less COGS
and SG&A, scaled by sales. As core earnings tend to be persistent over time, we include lagged core
earnings (CEt-1) in Model (1). We control for average asset turnover as it is inversely correlated with profit
13 We use annual data instead of quarterly observations because some quarterly data (e.g., data items ATQ, RECTQ,
OANCFY, etc.) required to estimate classification shifting are missing in Compustat for significant number of pre-
IPO firm-quarters, thus limiting our ability to examine pre-IPO quarterly classification shifting.

16
margin (Nissim and Penman 2001). Since extreme performance is highly correlated with changes in
accruals (DeAngelo et al. 1994), we control for current accruals (ACCRt) and expect it to increase with core
earnings. Accruals have lower persistence than do the cash flow component of earnings, and current
accruals are negatively related to future earnings (Sloan 1996). Thus, we include accruals in year t-1
(ACCRt−1) in Model (1) and expect it to be negatively related to current core earnings. Core earnings as a
ratio of sales (CEt) is unlikely to be constant since fixed costs do not change when sales change; we hence
include sales growth (∆SALEt). We also include sales decrease (NEG_∆SALESt) because expenses increase
more when activity rises than they decrease when activity falls by an equivalent amount (Anderson et al.
2003). We then calculate unexpected core earnings (UE_CEt) as the residual from Model (1).14
Equation (2) models expected changes in core earnings. We include both core earnings one year
ago (CEt−1) and the change in core earnings from year t-2 to t-1 (∆CEt−1) to control for mean reversion.
Other variables are also similarly defined as in McVay (2006). We obtain the unexpected change in core
earnings (UE_∆CEt) by taking the difference between reported and predicted change in core earnings
estimated from Model (2).
Results of Estimating Expected Levels of and Changes in Core Earnings
We estimate Models (1) and (2) by industry and year to control for macroeconomic and industry
shocks. Panels A and B of Table 2 provide the mean and median estimation results for Models (1) and (2),
respectively. Consistent with prior classification shifting studies (e.g., McVay 2006), the mean and median
adjusted R2s for these models are relatively high. The mean (median) R2 for the levels model (Model 1) is
14 We obtain unexpected core earnings for both IPO firms and already-public firms. This approach is consistent with
accruals estimation in prior IPO literature (e.g., Teoh et al. 1998 a, b, Armstrong et al. 2016) and classification shifting
studies (McVay 2006, Fan et al. 2010). However, IPO firms differ from already-public firms along various economic
dimensions such as size and growth, and therefore, it is important to control for these economic determinants. Our
expectation models explicitly control for size by scaling non-accruals variables by sales and include a control variable
of sales growth (∆SALEt), which helps to more accurately identify unexpected component of core earnings. Moreover,
classification shifting is not measured by unexpected core earnings per se; instead, it is captured by the association
between unexpected core earnings and special items. To the extent that unexpected levels of core earnings are
measured with errors for IPO firms, it likely works against us detecting classification shifting.
17
80.9 (83.3) percent, and that for the changes model (Model 2) is 53.6 (54.3) percent. Furthermore, the mean
and median coefficients of the levels and changes models reported in Table 2 are as predicted.
[Insert Table 2 here.]
5. Research Design and Test Results
The Relation between Unexpected Core Expenses and Income-Decreasing Special Items
We adopt the following regression model to test the classification shifting hypothesis:
UE_CEt (UE_∆CEt+1) = β0 + β1%SIt + εt, (3)
The dependent variable is either unexpected core earnings (UE_CEt) or unexpected change in core
earnings one year later (UE_ΔCEt+1). %SIt is income-decreasing special items multiplied by −1 and scaled
by sales in year t. According to the classification shifting hypothesis, we expect %SIt to be positively
associated with UE_CEt and negatively associated with UE_∆CEt+1.
Table 3 shows the regression results for Model (3). Columns (1) and (2) present results for the full
sample, whereas columns (3) and (4) provide results for IPO firms. Column (1) of Table 3 indicates
that %SIt is positively associated with UE_CEt (β1 = 0.040; t = 9.39) for the full sample. Economically, a
one standard deviation increase in income-decreasing special items is expected to increase unexpected core
earnings (scaled by sales) by 41.6 basis points, calculated as 0.040 (β1, the coefficient on %SIt from column
(1) of Table 3) multiplied by 0.104 (the standard deviation of %SIt for the full sample from Table 1, Panel
A). Results in column (2) show that %SIt is negatively associated with UE_∆CEt+1 (β1 = -0.010; t = -2.62),
suggesting that understated core expenses in year t reappear in the following year. Overall, these results
support the classification shifting hypothesis that, on average, already-public firms misclassify core expense
as income-decreasing special items but are inconsistent with the efficiency improvement argument.
[Insert Table 3 here.]
H1 predicts that IPO firms engage in classification shifting. To test this hypothesis, we estimate
Model (3) for the IPO sample. Table 3 columns (3) and (4) present the results. Column (3) shows that, for
18
the IPO sample, %SIt is positively associated with UE_CEt (β1 = 0.370; t = 3.53). A one standard deviation
increase in income-decreasing special items for IPOs increases unexpected core earnings (scaled by sales)
by 225.7 basis points (0.370 × 0.061) in the most-recent pre-IPO fiscal year. Column (4) reports that %SIt
is negatively associated with UE_∆CEt+1 (β1 = -0.177; t = -2.18), suggesting that understated core expenses
in the most recent pre-IPO year (year t) reappear in the IPO year (year t+1).15 This result is inconsistent
with the efficiency improvement hypothesis. Combined, these results suggest that issuers misclassify core
expenses as income-decreasing special items immediately prior to the IPO, thus supporting H1.
The coefficient estimates on %SIt for the full sample (columns 1 and 2) are comparable to those
from McVay (2006, Table 6). Notably, the corresponding coefficients for the IPO sample (columns 3 and
4) are much larger in magnitude. Hence, we explore whether IPO firms misclassify core expenses as special
to a greater degree than already-public firms. Specifically, we include IPOt and an interaction term
(%SIt×IPOt) in Model (3), where IPOt equals one for the most recent pre-IPO fiscal year of an IPO firm,
and zero otherwise. Table 3 columns (5) and (6) provide results. The coefficient on %SIt×IPOt for the
unexpected core earnings regression is positive (0.264; t = 3.55) and for the unexpected change in core
earnings regression is negative (-0.169; t = -2.63). These results suggest that IPO firms, compared to
average already-public firms, misclassify an even greater proportion of core expenses as special items to
inflate core earnings.
The greater degree of classification shifting of IPO firms is likely due to different special items
events experienced by IPO firms in comparison to already-public firms. To investigate this possibility, we
provide descriptive statistics for sub-categories of special items for IPO firms and already-public firms in
Appendix C Panel A. We focus on shiftable special items: restructuring, acquisition/merger, and other
special items (McVay 2006). As shown, IPO firms have lower restructuring frequency (14.91% versus
15 IPO firms may experience special items events in the post-IPO years, which enables them to sustain an inflated core
earnings through repeated classification shifting. If this is the case, it would be less likely to find a negative association
between %SIt and UE_∆CEt+1. To the extent that we find a negative coefficient (β1 < 0), we infer that offering firms
have most likely engaged in pre-IPO classification shifting.
19
21.59%) and amounts (0.014 versus 0.018) than already-public firms. This is understandable since IPO
firms tend to be younger firms and less likely in need of restructuring than already-public firms. As to
merger and acquisitions (M&A), although its occurrence is similar between IPO firms and already-public
firms (12.80% versus 11.31%), IPO firms incur on average twice the amount of M&A expenses incurred
by already-public firms (0.014 versus 0.007). As to “Other Shiftable Special Items,” we find that both its
occurrence (42.73% versus 45.26%) and magnitude (0.038 versus 0.041) are similar between IPO and
already-public firms. When we sum up the three categories of shiftable special items, we find that IPO and
already-public firms have similar frequency (39.75% versus 40.74%) and magnitude (0.031 versus 0.035)
of shiftable special items. For non-shiftable special items, the frequency (14.16% versus 20.17%) and
magnitude (0.041 versus 0.089) are both lower for IPO firms than non-IPO firms.
Appendix C Panel B presents regression analyses for IPO firms by decomposing special items into
shiftable and non-shiftable types. Consistent with McVay (2006), we find that only shiftable special items
allow issuers to classification shift and improve core earnings (0.463; t = 3.14), whereas non-shiftable
special items do not (0.426; t = 1.35). Our results tabulated in Table 3 for IPO firms are thus attributable to
shiftable as opposed to non-shiftable special items.
Combined, Appendix C results provide more details about IPO special items relative to already-
public companies. Although the total shiftable amounts are similar between IPO firms and non-IPO firms,
we find the composition of special items are structurally different. That is, IPO firms have lower frequency
of restructuring events, but higher magnitude of M&A expenses. The different composition of special items
offers a plausible account for the greater degree of classification shifting for IPO firms than already-public
firms.
Classification Shifting and Price Formation
We conjecture that the primary motivation for IPO firms to pursue pre-IPO classification shifting
is to influence investors’ valuation. We, therefore, investigate whether IPO price formation is associated
with pre-IPO classification shifting (H2). We use two empirical proxies that capture IPO price formation.

20
The first proxy is the percentage change in offer price (PRC_REV) from the midpoint of initial price range
in the preliminary prospectus to the final offer price in the final prospectus (e.g., Ljungqvist and Wilhelm
2003). The second empirical measure is the initial IPO return (INI_RET) (e.g., Lowry and Schwert 2004).
Using these two proxies, we test whether pre-IPO classification shifting is associated with price revisions
(H2a) and initial returns (H2b). In addition to price revisions, IPO issuers may change the number of shares
offered from the initial prospectus to the final prospectus, which affects the IPO proceeds. Thus, we
complement the test of price revisions (i.e., H2a) using an alternative measure, value revisions (VAL_REV).
We define VAL_REV as the percentage change of offering value from the initial value, which is determined
by the price and share information in the preliminary prospectus, to a comparable measure that is
determined by the price and share information in the final prospectus. To test H2, we adapt Willenborg et
al. (2015)’s models as below.
PRC_REV (or VAL_REV) = γ0 + γ1 UE_CEt + γ2 %SIt + γ3 UE_CEt×%SIt + γ4 ROA + γ5 IND_RET
+ γ6 IND_RET_POS + γ7 IPO_RET + γ8 RETAIN_INI + γ9 SECOND_INI + γ10 TOP_UW +
γ11 VC + γ12 BIGN + γ13 ln(PRO_INI) + γ14 NYSE/AMEX + γ15 CARVE + γ16 ln(AGE) + γ17
HIGHTECH + γ18 BIOTECH + γ19 ln(ASSETS) + YEAR_DUMMY + νt, (4)
INI_RET = γ0 + γ1 UE_CEt + γ2 %SIt + γ3 UE_CEt×%SIt + γ4 ROA + γ5 IND_RET + γ6
IND_RET_POS + γ7 IPO_RET + γ8 RETAIN + γ9 SECOND + γ10 TOP_UW + γ11 VC + γ12
BIGN + γ13 ln(PRO) + γ14 NYSE/AMEX + γ15 CARVE + γ16 ln(AGE) + γ17 HIGHTECH +
γ18 BIOTECH + γ19 ln(ASSETS) + γ20 PRC_REV + γ21 PRC_REV_POS +
YEAR_DUMMY + νt, (5)
Consistent with McVay (2006, p. 523), we focus on UE_CE×%SI as our proxy for the extent of
pre-IPO classification shifting. This measure of the extent of classification shifting increases with both
levels of unexpected core earnings and special items. If classification shifting influences price revisions
(H2a) and initial returns (H2b), then we would expect that coefficient for UE_CE×%SI to be positive
(γ3 >0).16 The estimation results are provided in Table 4. Column (1) reports the results for price revision
16 When %SIt is zero, it is not feasible for a firm to misclassify core expenses as special items. Similarly, if the
interaction term is negative (UE_CEt×%SIt < 0), a firm is less likely to engage in classification shifting. However, the
likelihood of classification shifting for a firm with negative value of UE_CEt×%SIt may not be lower than a firm
21
(PRC_REV). As shown, the coefficient estimate on UE_CE×%SI is positive and significant (1.314; t =
2.65). This finding suggests that inflated core earnings through classification shifting induce strong investor
interest in an IPO firm’s share. It supports that IPO price revisions increase with the degree of pre-IPO
classification shifting, and therefore, lends support to H2a. The coefficient on %SI is negative (-0.347; t =
-2.54), indicating that investors consider income-decreasing special items events per se unfavorably and,
as a response, issuers revise their offer price downward in the absence of classification shifting.
[Insert Table 4 here.]
Results on the covariates are generally consistent with prior studies. PRC_REV is positively
associated with ROA, suggesting that accounting earnings influence investors’ valuation of IPO firms
(Willenborg et al. 2015). The price revision is also positively related to secondary-market industry returns
(IND_RET) and contemporary IPO returns (IPO_RET), indicating that the final offer price reflects public
information revealed during the book-building phase (Ljungqvist and Wilhelm 2003). A negative
coefficient on IND_RET_POS suggests that price revisions to favorable market news are less complete than
they are to negative news (Lowry and Schwert 2004). Price revisions are positively associated with
management equity retainment (RETAIN_INI), higher values of which are positive signals of an IPO firm’s
value (Leland and Pyle 1977). Consistent with Ljungqvist and Wilhelm (2003), top-ranked underwriters
(TOP_UW) are better able to extract information during the book-building phase and incorporate it into the
final offer price. Firms in the biotech industry (BIOTECH) and larger firms (ln(ASSETS)) have more
negative price revisions (Willenborg et al. 2015).
Column (2) tabulates estimation results for VAL_REV. The untabulated correlation between
PRC_REV and VAL_REV is quite high (Pearson correlation is 0.968). Like PRC_REV, VAL_REV is
positively and significantly associated with UE_CE×%SI (γ3 = 1.346; t = 2.66), suggesting that offering
value revision in the book-building process is increasing with the extent of pre-IPO classification shifting.
without special items (UE_CEt×%SIt = 0). Therefore, we conduct a robustness test by setting the UE_CEt×%SIt as
zero when it is negative. Our results remain inferentially the same.

22
This result again supports H2a. Other estimation results are generally consistent with those reported for
PRC_REV in column (1).
Column (3) provides estimation results for initial returns (INI_RET). We do not find a significant
coefficient on UE_CE×%SI (γ3 = 1.232; t = 1.29), and thus do not find support for H2b. This result is
consistent with IPO firms, under time pressure to cash out benefits rendered by pre-IPO classification
shifting, insisting that the final offer price fully capitalize the favorable signals, which allows IPO firms to
achieve greater proceeds. Combined with the results from columns (1) and (2), this finding suggests that
although underwriters tend to underprice all issues (Benveniste and Spindt 1989), issuers involved in pre-
IPO classification shifting negotiate harder to maximize the final offer price than those that have not
engaged in expense misclassification. This is conceivable because when misclassified core expenses
reappear in the post-IPO period, which decreases core earnings, pre-IPO inflation of core earnings will
become apparent. Therefore, issuers will run the risk of forfeiting their entire economic benefit from
engaging in this pre-IPO accounting manipulation if they acquiesce to underwriters’ lowballing the final
offer price.17
Estimation results for other control variables are generally consistent with prior studies (Lungqvist
and Wilhelm 2003, Willenborg et al. 2015). The coefficient estimates on PRC_REV and PRC_REV_POS
are both positive and significant, with the latter being larger than the former, which supports the “partial”
adjustment theory (Benveniste and Spindt 1989). A positive coefficient on VC indicates that an IPO backed
by venture capitalists experiences higher first-day returns (Lee and Wahal 2004). The coefficient on
17 Misclassified core expenses will reappear in the fiscal year following the classification shifting. This reversal feature
of classification shifting suggests that not all issuers have identical incentives to engage in pre-IPO classification
shifting. Issuers that sell more shares through the initial offering (i.e., less equity retention) will benefit more from
inflated core earnings through pre-IPO classification shifting as they are likely to obtain greater offering proceeds.
IPO firms that sell less shares during the initial offering (i.e., retain more shares) are less likely to engage in pre-IPO
classification shifting because the reversal of misclassified core expenses will undercut long-term proceeds from
selling additional shares following the IPO. Therefore, we conjecture that IPO firms with lower (higher) equity
retention are more (less) likely to engage in pre-IPO classification shifting. To test this conjecture, we partition IPO
sample into two subsamples based on the median equity retention (RETAIN) and estimate Model (3) for both
subsamples. Untabulated results show that IPO firms engage in opportunistic pre-IPO classification shifting only when
equity retention is low (β1 = 0.468; t = 3.59) but not when equity retention is high (β1 = 0.236; t = 1.39).
23
RETAIN_INI is positive and significant. This result is analogous to the corresponding result of price
revisions (PRC_REV), suggesting that management equity retainment conveys positive signals about an
IPO firm’s value.
Pre-IPO Classification Shifting, Initial Value and Price Revision
We predict and find that pre-IPO classification shifting increases investor valuation and thus the
price revision (H2a). However, this result is also consistent with an alternative explanation – IPO firms
that are (not) involved in classification shifting negotiate less (more) aggressively in their initial price range.
Underwriters and issuers jointly determine the initial price range in the initial prospectus without the
significant involvement of investors. It is conceivable that issuers involved in classification shifting are
aware of their accounting manipulation and are willing to concede to a greater degree over the initial price
range. During the book-building process, investors are road showed an issuer’s initial prospectus including
core earnings and initial price range. Road show investors tend to have greater interest in issuers with
stronger core earnings (Willenborg et al. 2015), whereas they have little knowledge whether the strong core
earnings are inflated by classification shifting. With inflated core earnings attracting greater interest from
roadshow investors, issuers involved in classification shifting are more likely to enjoy a greater increase in
the price revision. This argument based on the initial bargaining position of issuers also suggests a positive
association between the price revision and pre-IPO classification shifting.
The above conjecture suggests analyzing the initial offer price range in relation to pre-IPO
classification shifting. An analysis focusing on the initial price range is likely to be problematic because
IPO firms often target a standard price range and adjust their issuing shares accordingly to arrive at their
initial valuations. As a result, the initial price range does not vary greatly across IPOs (Willenborg et al.
2015). The standard deviation of the midpoint of initial price range for our sample is $6, which is
approximately 38% of its average of $16. These descriptive statistics are comparable to those of Willenborg
et al.’s (2015). Therefore, we use the initial value (INI_VAL) to test the relationship between pre-IPO
classification shifting and IPO firms’ initial valuation. Following Willenborg et al. (2015), we define

24
INI_VAL as the midpoint of initial price range multiplied by post-IPO shares outstanding from the
prospectus disclosing the initial price range divided by total assets. We specify the following model:
INI_VAL = γ0 + γ1 UE_CEt + γ2 %SIt + γ3 UE_CEt×%SIt + γ4 ROA + γ5 RETAIN_INI + γ6
SECOND_INI + γ7 TOP_UW + γ8 BIGN + γ9 VC + γ10 ln(PRO_INI) + γ11 NYSE/AMEX +
γ12 CARVE + γ13 ln(AGE) + γ14 HIGHTECH + γ15 BIOTECH + γ16 SALES_AT+ γ17
ΔSALES + YEAR_DUMMY + νt, (6)
Appendix E column (1) provides the estimation results for Model (6). As shown, the coefficient
estimate on UE_CEt×%SIt is significantly negative (-31.979; t = -3.45). It suggests that issuing firms
involved in pre-IPO classification shifting concede more over their initial price range. This result indicates
that the previously documented relation between pre-IPO classification shifting and price revisions (H2a)
is likely to be explained by the association between pre-IPO classification shifting and IPO firms’ initial
negotiation position. To test this possibility, we adapt Model (4) by including INI_VAL as an additional
explanatory variable as below:
PRC_REV (or VAL_REV) = γ0 + γ1 UE_CEt + γ2 %SIt + γ3 UE_CEt×%SIt + γ’ INI_VAL + γ4 ROA +
γ5 IND_RET + γ6 IND_RET_POS + γ7 IPO_RET + γ8 RETAIN_INI + γ9 SECOND_INI + γ10
TOP_UW + γ11 VC + γ12 BIGN + γ13 ln(PRO_INI) + γ14 NYSE/AMEX + γ15 CARVE + γ16
ln(AGE) + γ17 HIGHTECH + γ18 BIOTECH + γ19 ln(ASSETS) + YEAR_DUMMY + νt,
(4’)
Columns (2) and (3) of Appendix E provide the estimation results for price revisions and value
revisions, respectively. As shown in column (2), the coefficient estimate on UE_CEt×%SIt is positive and
significant (1.409; t = 2.67) even after including the IPO firms’ initial negotiation position (INI_VAL).
Similarly, column (3) shows that the value revision (VAL_REV) is positively associated with pre-IPO
classification shifting (1.435; t = 2.69). The results of columns (2) and (3) together suggest that pre-IPO
classification shifting is associated with price revisions even after controlling for IPO firms’ initial
negotiation position. These results provide consistent support to H2a. In summary, our results demonstrate
that while issuers involved in classification shifting concede more on their initial price ranges, they are
more aggressive in negotiating the final offer price by leveraging roadshow investors’ interest in their shares.
25
Classification Shifting and Post-IPO Stock Performance
Our findings above suggest that pre-IPO classification shifting is indeed associated with investor
valuation around IPOs. We next examine the relationship between pre-IPO classification shifting and post-
IPO underperformance (H3). When the misclassified core expenses reappear in the subsequent year,
investors are likely to unravel the implications of pre-IPO classification shifting. H3 predicts that pre-IPO
expense misclassification is associated with lower post-IPO returns. Building on Ritter (1991) and Carter
et al. (1998), we specify the following model.
POST_RET = γ0 + γ1 UE_CEt + γ2 %SIt + γ3 UE_CEt×%SIt + γ4 ROA + γ5 TOP_UW + γ6 VC + γ7
ln(AGE) + γ8 HIGHTECH + γ9 BIOTECH + γ10 ln(ASSETS) + γ11 ln(PRO) + γ12 STD_RET
+ γ13 SECOND + γ14 INI_RET + YEAR_DUMMY + νt, (7)
where POST_RET is one of the three post-IPO annual stock return measures as discussed below. The first
proxy for post-IPO stock return measure is Fama-French 25 portfolio-adjusted returns (PAR). Following
Lowry et al. (2017), we calculate PAR as an IPO firm’s raw buy-and-hold return less the size and book-to-
market matched Fama-French 25 portfolio return, where the holding period is from the offer date plus six
trading days through the earlier of offer date plus 253 trading days or the delisting date. Size is measured
as the market value of equity at the end of the first December after the IPO. Book-to-market is calculated
as the ratio of book value of equity to the market value, where book value of equity is measured at the first
fiscal year end after the IPO. Next, we match an IPO firm to a Fama-French 25 portfolio based on size and
book-to-market. We obtain the value-weighted returns for portfolios formed on size and book-to-market
from Kenneth French’s website. The second empirical proxy that we use to measure the post-IPO stock
performance is market-adjusted returns (MAR_VW). We calculate MAR_VW as an IPO firm’s one-year raw
buy-and-hold return less the CRSP value-weighted market portfolio return (e.g., Carter et al. 1998). We
define the third proxy, market-adjusted returns (MAR_EW), similarly to MAR_VW except that the
benchmark is the CRSP equally-weighted market portfolio return.
Following prior IPO literature focusing on annual stock performance (Ritter 1991, Carter et al.
1998), we include additional control variables. Specifically, we control for IPO gross proceeds (ln(PRO)),
26
firm age (ln(AGE)), post-IPO stock volatility (STD_RET), underwriter quality (TOP_UW), venture capital-
backing (VC), percentage of secondary shares sold (SECOND), and initial returns (INI_RET). We also
include year fixed effects. As previously, our variable of interest is UE_CEt×%SIt. H3 predicts a negative
coefficient on γ3, indicating that post-IPO stock return is decreasing with pre-IPO classification shifting.
Table 5 presents H3 testing results. Column (1) shows a negative coefficient on UE_CEt ×%SIt (γ3
= -2.505; t = -2.30) from the regression of Fama-French 25 portfolio-adjusted one-year returns. Column (2)
uses post-IPO returns adjusted by market value-weighted returns and reports a negative coefficient on
UE_CEt ×%SIt (γ3 = -2.116; t = -1.81). Column (3) provides results using market equally-weighted index
adjusted one-year post-IPO returns. Again, we find the coefficient significantly negative (γ3 = -2.379, t = -
2.03). Combined, these findings provide consistent support for H3 that pre-IPO classification shifting is
negatively associated with post-IPO stock returns.
[Insert Table 5 here.]
The coefficient estimates on the control variables are consistent with prior literature (Brav and
Gompers 1997, Carter et al. 1998, Krishnan et al. 2011). For example, post-IPO stock returns are positively
associated with investors’ pre-offer demand of an IPO, which is reflected in the fraction of shares offered
by current shareholders (SECOND), and firm size (ln(ASSETS)), and negatively associated with the
uncertainty of firm value around an IPO (STD_RET) and offer size (ln(PRO)). The positive coefficient on
VC is consistent with VC-backed IPOs perform better than non-VC-backed IPOs (e.g., Krishnan et al. 2011).
Classification Shifting and Non-IPO Firms’ Meeting or Beating Earnings Benchmarks
Consistent with McVay (2006, p. 523), we use UE_CEt ×%SIt to proxy for the degree of
classification shifting to test H2 and H3. However, this measure has received little validation from the
classification shifting research regarding its predictive validity. We conduct additional validity checks to
test whether this measure captures opportunistic expense misclassification as it is intended. Specifically,
we investigate whether classification shifting, as proxied by UE_CEt ×%SIt, allows public firms to better
27
able to achieve various earnings benchmarks. For this validation test, we use all public firm-years from
1999 to 2015 with necessary data. Following extant benchmark research (e.g., McVay et al. 2006, Shon
and Veliotis 2013), we specify the following logistic model:
MBE = θ0 + θ1UE_CEt + θ2%SIt + θ3 UE_CEt×%SIt + θ4 ln(ASSETSt) + θ5 BTMt + θ6 LEVERAGEt
+ θ7 ROAt + θ8 LOSSt + θ9 ΔSALES t + ηt, (8)
We measure MBE using three different measures and use each in separate tests. First, MBE = MBZ,
where MBZ equals one when core earnings (CEt) scaled by total assets (AT) at the beginning of the year
falls in between 0 and 0.02, and zero otherwise. Second, MBE = MBP, where MBP equals one when the
difference in core earnings (CEt - CEt-1) scaled by total assets at the beginning of the year is between 0 and
0.01, and zero otherwise. Third, MBE = MBF, where MBF is an indicator variable that equals one if the
difference between I/B/E/S actual earnings and the most recent consensus analyst forecasts is between $0.00
and $0.01, and zero otherwise. The definitions of explanatory variables are included in Appendix A.
Consistent with previous classification shifting studies (e.g., Fan and Liu 2017), we expect that
opportunistic classification shifting will allow public firms to better able to achieve various earnings
benchmarks (θ3 > 0).
Appendix D columns (1) – (3) present the estimation results when reported core earnings just meet
or beat the zero, prior year, and analyst forecast benchmarks, respectively. For the first two benchmarks,
the sample is comprised of 77,364 firm-years from 1999 to 2015. The sample for analyst forecast
benchmark is reduced to 30,944 observations because of missing I/B/E/S data for analyst earnings forecasts.
Column (1) reports a positive coefficient estimate on UE_CEt×%SIt (0.737; t = 2.05), suggesting that firms
misclassify core earnings as special items to meet zero core earnings expectation (MBZ). Column (2) shows
that the likelihood of achieving positive core earnings change (MBP) increases with UE_CEt×%SIt (0.900;
t = 2.77). This result indicates that firms misclassify core expenses as income-decreasing special items to
beat prior period core earnings benchmark. As shown in column (3), for firm-years that just meet or beat
the consensus analyst forecasts of earnings (MBF), managers misclassify a greater amount of core expenses

28
as income-decreasing special items (2.442; t = 2.78). Combined, these results support the validity of our
empirical proxy used in H2 and H3 tests for classification shifting (UE_CEt×%SIt).
IPO Classification Shifting versus Accruals Manipulation
IPO firms can employ a portfolio of earnings management tools such as classification shifting and
accruals management. Existing IPO literature has focused almost exclusively on accruals management (e.g.,
DuCharme et al. 2001, Venkataraman et al. 2008). Classification shifting may complement or supplement
accruals management for IPO issuers. On one hand, IPO firms may use both classification shifting and
accruals management to influence investor valuation. In such case, classification shifting will be positively
related to accruals management.
On the other hand, classification shifting may also be negatively associated with accruals
management. When managers’ discretion is more constrained for one earnings management tool, they often
make more use of the other tools (Zang 2012). Consistent with this argument, Fan et al. (2010) find that
when accruals management is constrained, classification shifting becomes more prevalent. In the pre-IPO
context, accruals management is likely to be more limited due to heightened litigation risk and monitoring
scrutiny around IPOs (Ball and Shivakumar 2008). Aggressive accruals on the IPO prospectuses are likely
to attract attention from disgruntled investors, who are looking to file offer-related lawsuits against the
issuers to recover their damage, and also from auditors who are required to exercise due diligence in the
IPO process (DuCharme et al. 2004, Venkataraman et al. 2008).18 Venkataraman et al. (2008) find that pre-
IPO audited accruals are negative, and that auditors charge higher fees for IPO engagements than post-IPO
engagements. To the extent that pre-IPO accruals management is more scrutinized, issuers are more likely
to engage in classification shifting instead. If this is the case, accruals management will be negatively
associated with classification shifting in the pre-IPO period.
18 Indeed, prior studies document that pre-IPO abnormal accruals is associated with increased litigation risk and
subsequent settlement amount (e.g., DuCharme et al. 2004, Billings and Lewis 2016).

29
To examine whether classification shifting is positively or negatively associated with accruals
management, we employ the following model:
UE_CEt (UE_∆CEt+1) = λ0 + λ1%SIt + λ2ACCRUALSt + λ3%SIt×ACCRUALSt + ηt, (9)
where ACCRUALSt is one of the following three accruals measures – total accruals (TACC), abnormal
accruals estimated from the modified Jones model (ABACC_MJ) (Jones 1991, Dechow et al. 1995), and
abnormal accruals estimated based on Armstrong et al. (2016)’s size-age-growth-matched model
(ABACC_SAG). The definitions of the three accruals measures are provided in Appendix B. Our variable
of interest is the interaction between %SIt and the accruals proxy. A positive (negative) coefficient on λ3
suggests that classification shifting is increasing (decreasing) with accruals management. Table 6 columns
(1), (2), and (3) present the unexpected core earnings regression results with TACCt, ABACC_MJt, and
ABACC_SAGt as the accrual proxy, respectively. In each of the three models, the coefficient
on %SIt×ACCRUALSt is both negative and significant. In summary, these findings show that pre-IPO
classification shifting is negatively associated with pre-IPO accruals manipulation and suggest that IPO
firms misclassify more core expenses as income-decreasing special items when accruals manipulation is
constrained.
[Insert Table 6 here.]
6. Conclusion
Do IPO firms classification shift to influence IPO pricing? We address this question in this study.
We provide initial evidence that IPO firms engage in expense misclassification to inflate core earnings prior
to the IPO. In addition, we find that IPO firms classification shift to a greater degree than already-public
firms. More importantly, we find that pre-IPO classification shifting is positively associated with IPO price
revision from the initial price range to the final offer price, even though it is not associated with the first-
day market return. Furthermore, when misclassified core expenses reappear following IPOs, issuers
30
experience lower stock returns. Finally, we find that pre-IPO classification shifting is more prevalent when
accruals management is more limited.
This study contributes to the IPO literature in several important ways. First, this study extends the
growing literature of IPO price formation by demonstrating that pre-IPO classification shifting is positively
associated with an issuer’s price revision. We provide initial evidence that pre-IPO classification shifting,
through inflated core earnings, influences price formation. Our findings also suggest that the final offer
price capitalizes the core earnings inflation, adding to the IPO overvaluation literature (e.g., Purnanandam
and Swaminathan 2004). By documenting lower post-IPO stock returns following pre-IPO classification
shifting, this study offers an additional account for the post-IPO underperformance anomaly (Teoh et al.
1998a, Armstrong et al. 2016). Combined, our findings indicate that issuers can benefit from pre-IPO
classification shifting. Therefore, we caution investors, auditors, and regulators that classification shifting,
a seemingly innocuous accounting manipulation, can mislead investors and lead to post-IPO
underperformance.
Second, this study extends the classification shifting literature to an important setting (i.e., initial
public offering). While prior classification shifting studies focus on already-public firms, this study fills the
void of investigating incentives and market consequences of classification shifting in the private-to-public
transformation process. We also add to the broader earnings management literature by showing that IPO
firms’ pre-IPO classification shifting increases when accruals manipulation is more constrained. Our results
thus shed light on the tradeoffs of different earnings management tools in the IPO context. Though we do
not directly investigate IPO firms’ accruals management, our results provide indirect evidence that issuers
may not necessarily need to manage accruals prior to the IPO when they have other tools at their disposal.
This study is subject to the following caveats that provide opportunities for future research. First,
we follow prior literature and employ the interaction term UE_CEt×%SIt as our measure of classification
shifting in our tests of price formation. Our inferences are robust to the alternative definition of this
interaction variable (i.e., setting the interaction term as zero when negative). Using an independent sample

31
of already-public firms, we find that this empirical measure is positively associated with the likelihood of
meeting or beating earnings benchmarks, supporting its predictive validity. Despite so, we cannot
completely rule out the possibility of measurement errors as an alternative explanation for our findings.
Future research may explore alternative measures so that regulators, investors, and auditors can more
readily identify settings or firms that are susceptible to expense misclassification. Second, our testing
sample comprises IPO firms with pre-IPO sales over one million (or half a million) dollars, which limits
the generalizability of our inferences to IPO firms with negligible sales. Firms with insignificant pre-IPO
sales may pursue different forms of classification shifting. For example, future research can investigate
whether biotech firms misclassify special items as R&D expenses that are likely to be highly valued by
investors. Third, we use annual IPO data in this study that is commensurate to investigation of issuers’
incentive to increase offering proceeds. We do not employ quarterly data due to the limited availability of
pre-IPO quarterly data (e.g., total assets and receivables, and year-to-date operating cash flows) for many
IPO firms. Future research can use a longer sample window to accumulate sufficient quarterly data points
to more accurately identify the timing in which expense misclassification occurs.

32
Appendix A: Variable Definitions
Variable Definition Source
Classification shifting test variables:
CEt
Core earnings (before special items and depreciation), calculated as (Sales - Cost of
Goods Sold - Selling, General, and Administrative Expenses) (OIBDP) / Sales
(SALE).
Compustat
ΔCEt+1 Change in core earnings, calculated as CEt+1 - CEt. Compustat
UE_CEt
Unexpected core earnings, calculated as the reported core earnings (CEt) minus the
expected core earnings estimated by fiscal year and industry: CEt = α0 + α1CEt-1 +
α2ATOt + α3ACCRt-1 + α4ACCRt + α5ΔSALESt + α6NEG_ΔSALESt + μt.
Compustat
UE_ΔCEt
Unexpected Change in Core Earnings, calculated as the reported change in core
earnings (ΔCEt) minus the expected change in core earnings estimated by fiscal year
and industry: ΔCEt = α0' + α1'CEt-1 + α2'ΔCEt-1 + α3'ΔATOt + α4'ACCRt-1 + α5'ACCRt +
α6'ΔSALESt + α7'NEG_ΔSALESt + μt'.
Compustat
SIt Income-decreasing special items, calculated as special items (SPI) multiplied by -1
when special items are income-decreasing, zero otherwise. Compustat
%SIt Income-decreasing special items as a percentage of sales, calculated as SIt/SALESt. Compustat
SALESt Sales revenue (SALE). Compustat
ΔSALESt Percentage change in sales, calculated as (SALESt - SALESt-1) / SALESt-1. Compustat
NEG_ΔSALESt Percentage change in sales (ΔSALESt) if ΔSALESt is negative, zero otherwise. Compustat
ACCRt Accruals, calculated as (Income before Extraordinary Items (IBC) - Cash Flow from
Continuing Operations (OANCF - XIDOC)) / Sales (SALE). Compustat
ATOt
Asset turnover ratio, calculated as Salest / ((NOAt + NOAt-1) / 2), where NOA, or net
operating assets, is operating assets minus operating liabilities. Operating Assets is
calculated as Total Assets (AT) - Cash (CHE) - Short-Term Investments (IVAO).
Operating liabilities is calculated as Total Assets (AT) - Total Debt (DLTT + DLC) -
Book Value of Common and Preferred Equity (CEQ + PSTK) - Minority Interests
(MIB). Average net operating assets is required to be positive.
Compustat
ΔATOt+1 Change in asset turnover, calculated as ATOt+1 - ATOt. Compustat
Other variables:
PRC_REV Price revision, calculated as (IPO Offer Price – the midpoint of Initial Price Range) /
the midpoint of Initial Price Range. EDGAR
PRC_REV_POS Equals PRC_REV when PRC_REV is positive, zero otherwise. EDGAR
VAL_REV
Value revision, calculated as (FINAL_VALUE - INI_VALUE) / INI_VALUE, where
FINAL_VALUE is the IPO offer price multiplied by post-IPO shares outstanding from
the IPO final prospectus, and INI_VALUE is the midpoint of initial price range
multiplied by post-IPO shares outstanding from the prospectus disclosing the initial
price range.
EDGAR
INI_RET Initial return, calculated as (Closing Price on the First Day of Trading - IPO Offer
Price) / IPO Offer Price.
EDGAR and
CRSP
PAR
1-year Fama-French 25 portfolio-adjusted buy-and-hold returns, calculated as (Raw
Buy-and-Hold Return - Size and Book-to-Market-Matched Fama-French 25 Portfolio
Return), where the holding period is from offer date plus six trading days through the
earlier of offer date plus 253 trading days or the delisting date. Size is the market
value of equity at the end of the first December after the IPO. Book-to-market is the
ratio of book value of equity to market value of equity, where book value of equity is
measure at the first fiscal year end after the IPO. Each IPO firm is matched to a Fama-
French 25 portfolio based on size and book-to-market at year end.
CRSP,
Compustat,
and French’s
website
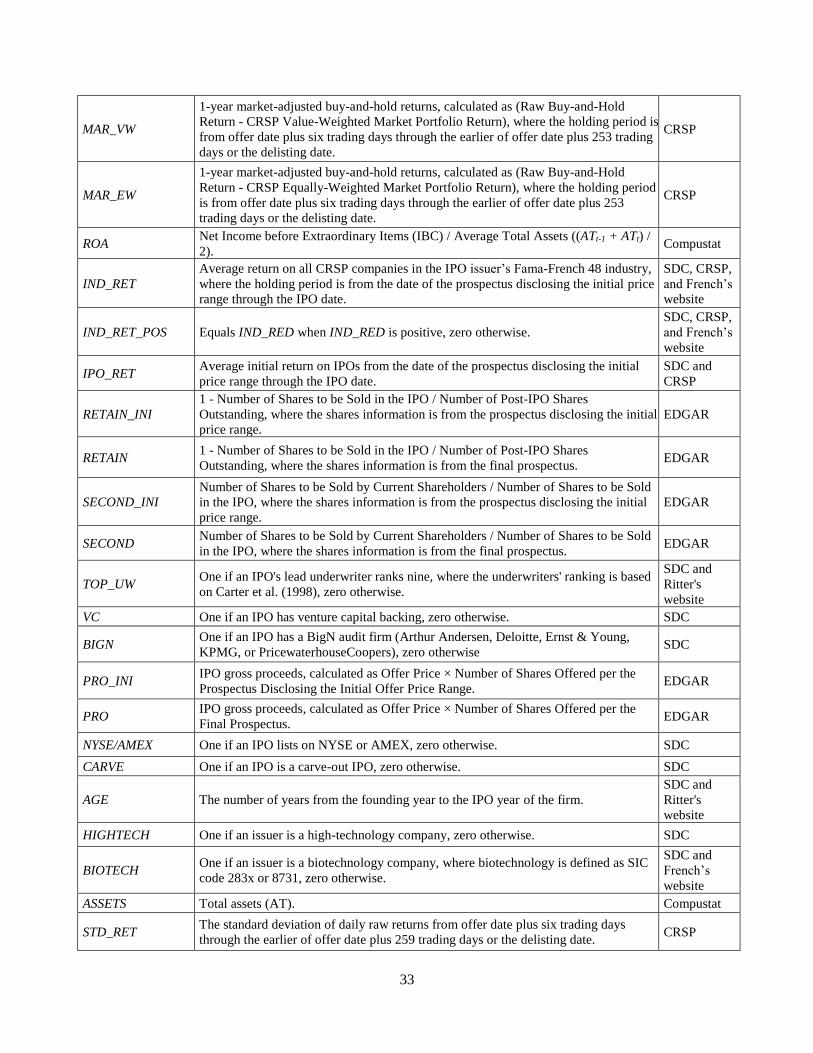
33
MAR_VW
1-year market-adjusted buy-and-hold returns, calculated as (Raw Buy-and-Hold
Return - CRSP Value-Weighted Market Portfolio Return), where the holding period is
from offer date plus six trading days through the earlier of offer date plus 253 trading
days or the delisting date.
CRSP
MAR_EW
1-year market-adjusted buy-and-hold returns, calculated as (Raw Buy-and-Hold
Return - CRSP Equally-Weighted Market Portfolio Return), where the holding period
is from offer date plus six trading days through the earlier of offer date plus 253
trading days or the delisting date.
CRSP
ROA Net Income before Extraordinary Items (IBC) / Average Total Assets ((ATt-1 + ATt) /
2). Compustat
IND_RET
Average return on all CRSP companies in the IPO issuer’s Fama-French 48 industry,
where the holding period is from the date of the prospectus disclosing the initial price
range through the IPO date.
SDC, CRSP,
and French’s
website
IND_RET_POS Equals IND_RED when IND_RED is positive, zero otherwise.
SDC, CRSP,
and French’s
website
IPO_RET Average initial return on IPOs from the date of the prospectus disclosing the initial
price range through the IPO date.
SDC and
CRSP
RETAIN_INI
1 - Number of Shares to be Sold in the IPO / Number of Post-IPO Shares
Outstanding, where the shares information is from the prospectus disclosing the initial
price range.
EDGAR
RETAIN 1 - Number of Shares to be Sold in the IPO / Number of Post-IPO Shares
Outstanding, where the shares information is from the final prospectus. EDGAR
SECOND_INI
Number of Shares to be Sold by Current Shareholders / Number of Shares to be Sold
in the IPO, where the shares information is from the prospectus disclosing the initial
price range.
EDGAR
SECOND Number of Shares to be Sold by Current Shareholders / Number of Shares to be Sold
in the IPO, where the shares information is from the final prospectus. EDGAR
TOP_UW One if an IPO's lead underwriter ranks nine, where the underwriters' ranking is based
on Carter et al. (1998), zero otherwise.
SDC and
Ritter's
website
VC One if an IPO has venture capital backing, zero otherwise. SDC
BIGN One if an IPO has a BigN audit firm (Arthur Andersen, Deloitte, Ernst & Young,
KPMG, or PricewaterhouseCoopers), zero otherwise SDC
PRO_INI IPO gross proceeds, calculated as Offer Price × Number of Shares Offered per the
Prospectus Disclosing the Initial Offer Price Range. EDGAR
PRO IPO gross proceeds, calculated as Offer Price × Number of Shares Offered per the
Final Prospectus. EDGAR
NYSE/AMEX One if an IPO lists on NYSE or AMEX, zero otherwise. SDC
CARVE One if an IPO is a carve-out IPO, zero otherwise. SDC
AGE The number of years from the founding year to the IPO year of the firm.
SDC and
Ritter's
website
HIGHTECH One if an issuer is a high-technology company, zero otherwise. SDC
BIOTECH One if an issuer is a biotechnology company, where biotechnology is defined as SIC
code 283x or 8731, zero otherwise.
SDC and
French’s
website
ASSETS Total assets (AT). Compustat
STD_RET The standard deviation of daily raw returns from offer date plus six trading days
through the earlier of offer date plus 259 trading days or the delisting date. CRSP

34
TACCt Total accruals, measured as (Net Income before Extraordinary Items (IBC) - Cash
Flow from Continuing Operations (OANCF - XIDOC)) / Average Total Assets. Compustat
ABACC_MJt
Abnormal accruals, calculated as the reported accruals minus the expected accruals
according to the modified cross-sectional Jones (1991) model. Expected accruals are
estimated by fiscal year and Fama-French's (1997) 48-industry using all firm-years
excluding firm-years that have an IPO in the previous year three years, the current
year and the next four years: TACCt = α0 + α1/AVGATt + α2ΔSALES_AVGATt +
α3PPE_AVGATt + §t, where ΔSALES_AVGAT is change in sales (SALESt - SALESt-1).
PPE_AVGAT is gross property, plant, and equipment (PPEGT). The estimated
coefficients are used to estimate normal accruals of IPO firms using the following
model: TACCt = α0 + α1/AVGATt + α2(ΔSALES_AVGATt - ΔREC_AVGATt) +
α3PPE_AVGATt, where ΔREC_AVGAT is change in net receivables (RECT). All
variables are scaled by average total assets.
Compustat
ABACC_SAGt
Size-age-growth-matched abnormal accruals, calculated as ABACC_MJt of an IPO
firm minus ABACC_MJt of a corresponding matched non-IPO firm according to the
size-age-growth-matched model of Armstrong et al. (2015). The matching is based on
year, Fama-French's (1997) 48-industry, and propensity score. Propensity scores are
the predicted likelihoods of being an IPO-year from the regression of the incidence of
being an IPO-year on firm size (natural logarithm of one plus average total assets),
age (the observation year minus the founding year plus one), and growth (sales
growth divided by average total assets) for the firm that year. Each IPO firm is
matched with a non-IPO public firm in the same industry and fiscal year that has the
smallest squared difference in propensity score between the IPO firm and the non-IPO
firm.
Compustat
Non-Shiftable
Non-shiftable income-decreasing special items, calculated as (Gain/Loss Pretax
(GLP) + Impairments of Goodwill Pretax (GDWLIP) + Write-downs Pretax (WDP))
× (-1) / Sales (SALE) when special items are income-decreasing.
Compustat
Shiftable Shiftable income-decreasing special items, calculated as (Special Items (SPI) - Non-
Shiftable) × (-1) / Sales (SALE) when special items are income-decreasing. Compustat
Restructuring Restructuring costs pretax (RCP) × (-1) / Sales (SALE). Compustat
Acquisition/Merger Acquisition/merger pretax (AQP) × (-1) / Sales (SALE). Compustat
Other Shiftable
Special Items Shiftable - Restructuring - Acquisition/Merger Compustat
TotalSPI Total income-decreasing special items, equals to %SIt when %SIt is not zero. Compustat
SIt_Shiftable Shiftable income-decreasing special items, equals to Shiftable when Shiftable is not
missing, zero otherwise. Compustat
SIt_NonShiftable Non-shiftable income-decreasing special items, equals to Non-Shiftable when Non-
Shiftable is not missing, zero otherwise. Compustat
MBZ Just met or beat zero, calculated as one if CEt / ATt-1 is between zero and 0.02, zero
otherwise. Compustat
MBP Just met or beat prior year core earnings, calculated as one if (CEt - CEt-1) / ATt-1 is
between zero and 0.01, zero otherwise. Compustat
MBF
Just met or beat analyst forecast, calculated as one if the difference between I/B/E/S
actual earnings and consensus analyst forecast is between zero and 0.01, zero
otherwise.
Compustat,
I/B/E/S
BTM Book Value of Equity (CEQ) / Market Value of Equity (PRCC_F × CSHO). Compustat
LEVERAGE Long-Term Debt (DLTT) / Total Assets. Compustat
LOSS One if income before extraordinary items (IBC) is negative, zero otherwise. Compustat
INI_VAL Initial value, calculated as (Midpoint of Initial Price Range × Post-IPO Shares
Outstanding from the Prospectus Disclosing the Initial Price Range) / Total Assets.
EDGAR,
Compustat
SALES_AT Sales / Total Assets. Compustat
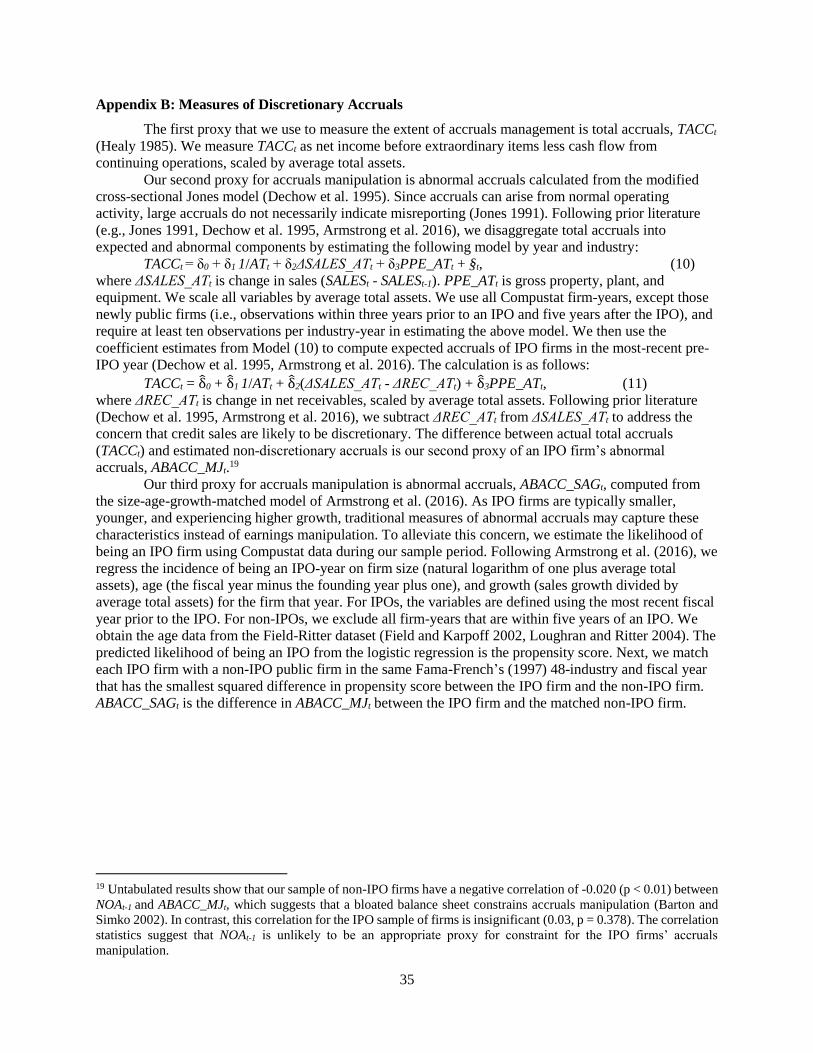
35
Appendix B: Measures of Discretionary Accruals
The first proxy that we use to measure the extent of accruals management is total accruals, TACCt
(Healy 1985). We measure TACCt as net income before extraordinary items less cash flow from
continuing operations, scaled by average total assets.
Our second proxy for accruals manipulation is abnormal accruals calculated from the modified
cross-sectional Jones model (Dechow et al. 1995). Since accruals can arise from normal operating
activity, large accruals do not necessarily indicate misreporting (Jones 1991). Following prior literature
(e.g., Jones 1991, Dechow et al. 1995, Armstrong et al. 2016), we disaggregate total accruals into
expected and abnormal components by estimating the following model by year and industry:
TACCt = δ0 + δ1 1/ATt + δ2ΔSALES_ATt + δ3PPE_ATt + §t, (10)
where ΔSALES_ATt is change in sales (SALESt - SALESt-1). PPE_ATt is gross property, plant, and
equipment. We scale all variables by average total assets. We use all Compustat firm-years, except those
newly public firms (i.e., observations within three years prior to an IPO and five years after the IPO), and
require at least ten observations per industry-year in estimating the above model. We then use the
coefficient estimates from Model (10) to compute expected accruals of IPO firms in the most-recent pre-
IPO year (Dechow et al. 1995, Armstrong et al. 2016). The calculation is as follows:
TACCt = δ̂0 + δ̂1 1/ATt + δ̂2(ΔSALES_ATt - ΔREC_ATt) + δ̂3PPE_ATt, (11)
where ΔREC_ATt is change in net receivables, scaled by average total assets. Following prior literature
(Dechow et al. 1995, Armstrong et al. 2016), we subtract ΔREC_ATt from ΔSALES_ATt to address the
concern that credit sales are likely to be discretionary. The difference between actual total accruals
(TACCt) and estimated non-discretionary accruals is our second proxy of an IPO firm’s abnormal
accruals, ABACC_MJt.19
Our third proxy for accruals manipulation is abnormal accruals, ABACC_SAGt, computed from
the size-age-growth-matched model of Armstrong et al. (2016). As IPO firms are typically smaller,
younger, and experiencing higher growth, traditional measures of abnormal accruals may capture these
characteristics instead of earnings manipulation. To alleviate this concern, we estimate the likelihood of
being an IPO firm using Compustat data during our sample period. Following Armstrong et al. (2016), we
regress the incidence of being an IPO-year on firm size (natural logarithm of one plus average total
assets), age (the fiscal year minus the founding year plus one), and growth (sales growth divided by
average total assets) for the firm that year. For IPOs, the variables are defined using the most recent fiscal
year prior to the IPO. For non-IPOs, we exclude all firm-years that are within five years of an IPO. We
obtain the age data from the Field-Ritter dataset (Field and Karpoff 2002, Loughran and Ritter 2004). The
predicted likelihood of being an IPO from the logistic regression is the propensity score. Next, we match
each IPO firm with a non-IPO public firm in the same Fama-French’s (1997) 48-industry and fiscal year
that has the smallest squared difference in propensity score between the IPO firm and the non-IPO firm.
ABACC_SAGt is the difference in ABACC_MJt between the IPO firm and the matched non-IPO firm.
19 Untabulated results show that our sample of non-IPO firms have a negative correlation of -0.020 (p < 0.01) between
NOAt-1 and ABACC_MJt, which suggests that a bloated balance sheet constrains accruals manipulation (Barton and
Simko 2002). In contrast, this correlation for the IPO sample of firms is insignificant (0.03, p = 0.378). The correlation
statistics suggest that NOAt-1 is unlikely to be an appropriate proxy for constraint for the IPO firms’ accruals
manipulation.
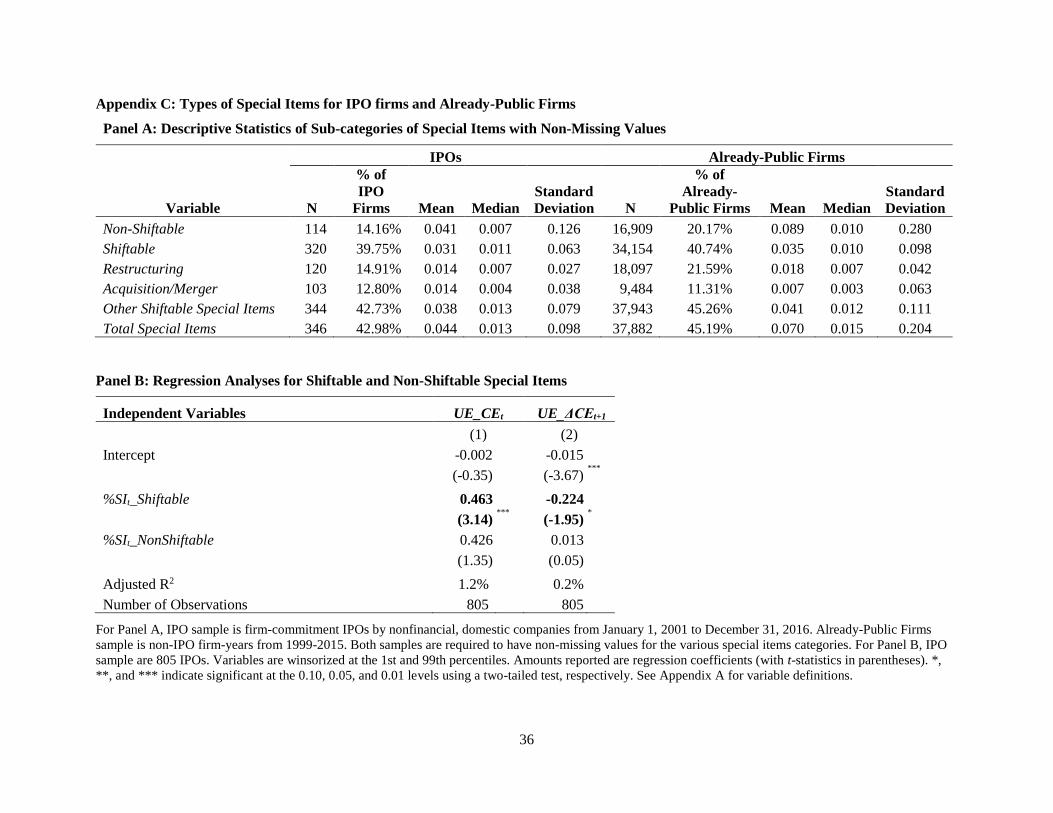
36
Appendix C: Types of Special Items for IPO firms and Already-Public Firms
Panel A: Descriptive Statistics of Sub-categories of Special Items with Non-Missing Values
IPOs Already-Public Firms
Variable N
% of
IPO
Firms Mean Median
Standard
Deviation N
% of
Already-
Public Firms Mean Median
Standard
Deviation
Non-Shiftable 114 14.16% 0.041 0.007 0.126 16,909 20.17% 0.089 0.010 0.280
Shiftable 320 39.75% 0.031 0.011 0.063 34,154 40.74% 0.035 0.010 0.098
Restructuring 120 14.91% 0.014 0.007 0.027 18,097 21.59% 0.018 0.007 0.042
Acquisition/Merger 103 12.80% 0.014 0.004 0.038 9,484 11.31% 0.007 0.003 0.063
Other Shiftable Special Items 344 42.73% 0.038 0.013 0.079 37,943 45.26% 0.041 0.012 0.111
Total Special Items 346 42.98% 0.044 0.013 0.098 37,882 45.19% 0.070 0.015 0.204
Panel B: Regression Analyses for Shiftable and Non-Shiftable Special Items
Independent Variables UE_CEt UE_ΔCEt+1
(1) (2)
Intercept -0.002 -0.015
(-0.35) (-3.67) ***
%SIt_Shiftable 0.463
-0.224
(3.14) ***
(-1.95) *
%SIt_NonShiftable 0.426
0.013
(1.35)
(0.05)
Adjusted R2 1.2%
0.2%
Number of Observations 805 805
For Panel A, IPO sample is firm-commitment IPOs by nonfinancial, domestic companies from January 1, 2001 to December 31, 2016. Already-Public Firms
sample is non-IPO firm-years from 1999-2015. Both samples are required to have non-missing values for the various special items categories. For Panel B, IPO
sample are 805 IPOs. Variables are winsorized at the 1st and 99th percentiles. Amounts reported are regression coefficients (with t-statistics in parentheses). *,
**, and *** indicate significant at the 0.10, 0.05, and 0.01 levels using a two-tailed test, respectively. See Appendix A for variable definitions.
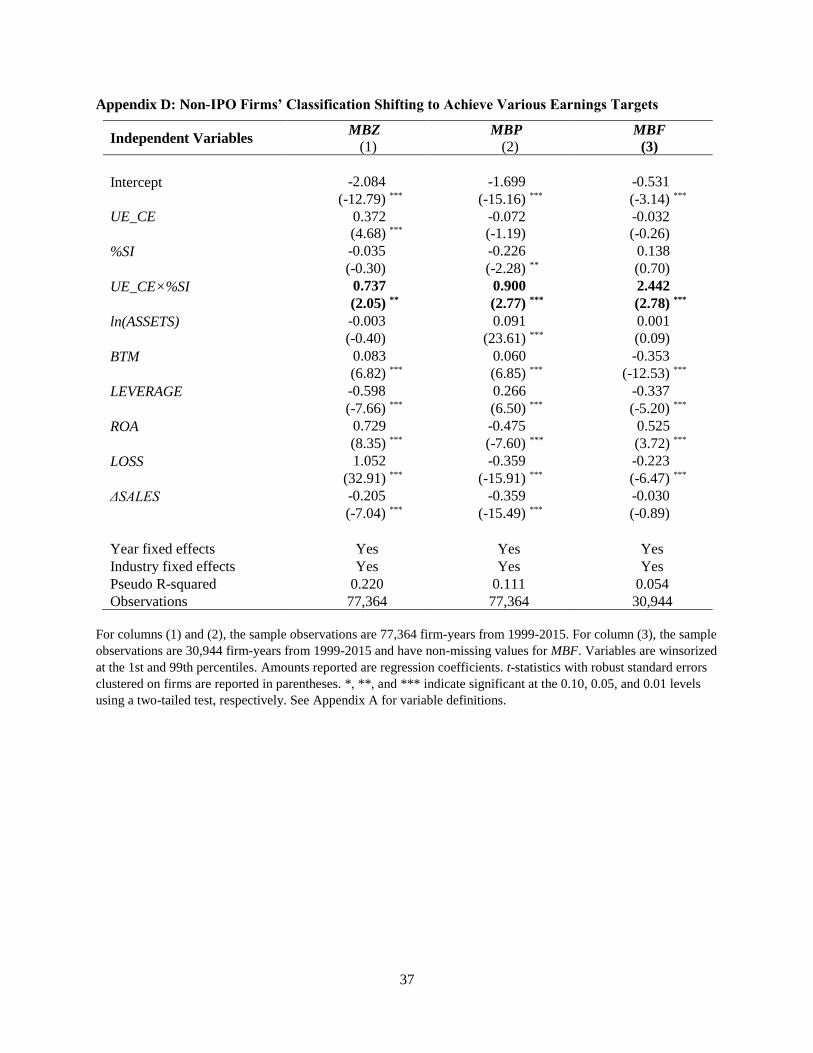
37
Appendix D: Non-IPO Firms’ Classification Shifting to Achieve Various Earnings Targets
Independent Variables MBZ MBP MBF
(1) (2) (3)
Intercept -2.084 -1.699 -0.531
(-12.79) *** (-15.16) *** (-3.14) ***
UE_CE 0.372 -0.072 -0.032
(4.68) *** (-1.19) (-0.26)
%SI -0.035 -0.226 0.138
(-0.30) (-2.28) ** (0.70)
UE_CE×%SI 0.737 0.900 2.442
(2.05) ** (2.77) *** (2.78) ***
ln(ASSETS) -0.003 0.091 0.001
(-0.40) (23.61) *** (0.09)
BTM 0.083 0.060 -0.353
(6.82) *** (6.85) *** (-12.53) ***
LEVERAGE -0.598 0.266 -0.337
(-7.66) *** (6.50) *** (-5.20) ***
ROA 0.729 -0.475 0.525
(8.35) *** (-7.60) *** (3.72) ***
LOSS 1.052 -0.359 -0.223
(32.91) *** (-15.91) *** (-6.47) ***
ΔSALES -0.205 -0.359 -0.030
(-7.04) *** (-15.49) *** (-0.89)
Year fixed effects Yes Yes Yes
Industry fixed effects Yes Yes Yes
Pseudo R-squared 0.220 0.111 0.054
Observations 77,364 77,364 30,944
For columns (1) and (2), the sample observations are 77,364 firm-years from 1999-2015. For column (3), the sample
observations are 30,944 firm-years from 1999-2015 and have non-missing values for MBF. Variables are winsorized
at the 1st and 99th percentiles. Amounts reported are regression coefficients. t-statistics with robust standard errors
clustered on firms are reported in parentheses. *, **, and *** indicate significant at the 0.10, 0.05, and 0.01 levels
using a two-tailed test, respectively. See Appendix A for variable definitions.
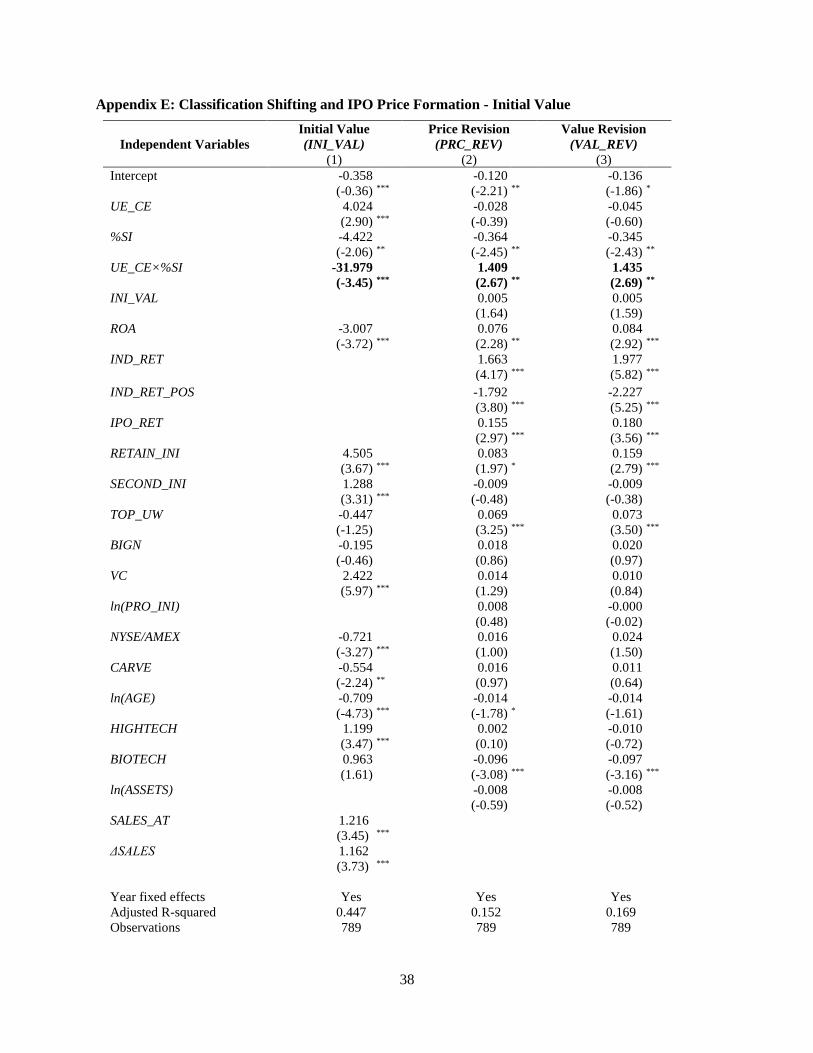
38
Appendix E: Classification Shifting and IPO Price Formation - Initial Value
Initial Value Price Revision Value Revision
Independent Variables (INI_VAL) (PRC_REV) (VAL_REV)
(1) (2) (3)
Intercept -0.358 -0.120 -0.136
(-0.36) *** (-2.21) ** (-1.86) *
UE_CE 4.024 -0.028 -0.045
(2.90) *** (-0.39) (-0.60)
%SI -4.422 -0.364 -0.345
(-2.06) ** (-2.45) ** (-2.43) **
UE_CE×%SI -31.979 1.409 1.435
(-3.45) *** (2.67) ** (2.69) **
INI_VAL 0.005 0.005
(1.64) (1.59)
ROA -3.007 0.076 0.084
(-3.72) *** (2.28) ** (2.92) ***
IND_RET 1.663 1.977
(4.17) *** (5.82) ***
IND_RET_POS
-1.792
-2.227
(3.80) *** (5.25) ***
IPO_RET 0.155 0.180
(2.97) *** (3.56) ***
RETAIN_INI 4.505 0.083 0.159
(3.67) *** (1.97) * (2.79) ***
SECOND_INI 1.288 -0.009 -0.009
(3.31) *** (-0.48) (-0.38)
TOP_UW -0.447 0.069 0.073
(-1.25) (3.25) *** (3.50) ***
BIGN -0.195 0.018 0.020
(-0.46) (0.86) (0.97)
VC 2.422 0.014 0.010
(5.97) *** (1.29) (0.84)
ln(PRO_INI) 0.008 -0.000
(0.48) (-0.02)
NYSE/AMEX -0.721 0.016 0.024
(-3.27) *** (1.00) (1.50)
CARVE -0.554 0.016 0.011
(-2.24) ** (0.97) (0.64)
ln(AGE) -0.709 -0.014 -0.014
(-4.73) *** (-1.78) * (-1.61)
HIGHTECH 1.199 0.002 -0.010
(3.47) *** (0.10) (-0.72)
BIOTECH 0.963 -0.096 -0.097
(1.61) (-3.08) *** (-3.16) ***
ln(ASSETS) -0.008 -0.008
(-0.59) (-0.52)
SALES_AT 1.216
(3.45) ***
ΔSALES 1.162
(3.73) ***
Year fixed effects Yes Yes Yes
Adjusted R-squared 0.447 0.152 0.169
Observations 789 789 789

39
IPO sample is 789 firm-commitment IPOs by nonfinancial, domestic companies from January 1, 2001 to December
31, 2016. Variables are winsorized at the 1st and 99th percentiles. Amounts reported are regression coefficients. t-
statistics with robust standard errors clustered on Fama-French 48 industries are reported in parentheses. *, **, and
*** indicate significant at the 0.10, 0.05, and 0.01 levels using a two-tailed test, respectively. See Appendix A for
variable definitions.

40
Reference:
Anderson MC, Banker RD, Janakiraman SN (2003) Are selling, general, and administrative costs “sticky”?
J. Accounting Res. 41(1):47–63.
Armstrong C, Foster G, Taylor D (2016) Abnormal accruals in newly public companies: opportunistic
misreporting or economic activity? Management Sci. 62:1316–38.
Ball R, Shivakumar L (2008) Earnings quality at initial public offerings. J. Accounting Econom. 45:324–
49.
Barua A, Lin S, Sbaraglia AM (2010) Earnings management using discontinued operations. Accounting
Rev. 85(5):1485–1509.
Barton J, Hansen T, Pownall G (2010) Which performance measures do investors around the world value
the most--and why? Accounting Rev. 85(3):753–89.
Barton J, Simko PJ (2002) The balance sheet as an earnings management constraint. Accounting Rev. 77(s-
1):1–27.
Becker CL, DeFond ML, Jiambalvo J, Subramanyam KR (1998) The effect of audit quality on earnings
management. Contemporary Accounting Res. 15:1–24.
Benveniste L, Spindt P (1989) How investment bankers determine the offer price and allocation of new
issues. J. Financial Econom. 24(2):343–61.
Billings MB, Lewis-Western MF (2016) When does pre-IPO financial reporting trigger post-IPO legal
consequences? Contemporary Accounting Res. 33:378–411.
Bochkay K, Chychyla R, Sankaraguruswamy S, Willenborg M (2018) Management Disclosures of Going-
Concern Uncertainties: The Case of Initial Public Offerings. Accounting Rev. Forthcoming.
Brav A, Gompers PA (1997) Myth or reality? The long-run underperformance of initial public offerings:
Evidence from venture and nonventure capital-backed companies. J. Finance 52:1791–822.
Brau JC, Fawcett SE (2006) Initial public offerings: An analysis of theory and practice. J. Finance
61(1):399–436.
Carter RB, Dark FH, Singh AK (1998) Underwriter reputation, initial returns, and the long-run performance
of IPO stocks. J. Finance 53(1):285–311.
Cecchini M, Jackson S, Liu XT (2012) Do initial public offering firms manage accruals? Evidence from
individual accounts. Rev. Accounting Stud. 17:22–40.
Cohen DA, Zarowin P (2010) Accrual-based and real earnings management activities around seasoned
equity offerings. J. Accounting Econom. 50(1):2–19.
DeAngelo H, DeAngelo L, Skinner D (1994) Accounting choice in troubled companies. J. Accounting
Econom. 17(1–2):113–43.
Dechow PM, Sloan RG, Sweeney AP (1995) Detecting earnings management. Accounting Rev. 70(2):193–
225.
DuCharme LL, Malatesta PH, Sefcik SE (2001) Earnings management: IPO valuation and subsequent
performance. J. Accounting, Auditing, and Finance 16(4):369–396.
DuCharme LL, Malatesta PH, Sefcik SE (2004) Earnings management, stock issues, and shareholder
lawsuits. J. Financial Econom. 71(1):27–50.
Elliott J, Hanna JD (1996) Repeated accounting write-offs and the information content of earnings. J.
Accounting Res. 34(Supplement):135–55.

41
Fama EF, French KR (1997) Industry costs of equity. J. Financial Econom. 43(2):153–193.
Fama EF, French KR (2004) New lists: Fundamentals and survival rates. J. Financial Econom. 73(2):229–
269.
Fan Y, Barua A, Cready W, Thomas W (2010) Managing earnings using classification shifting: Evidence
from quarterly special items. Accounting Rev. 85(4):1303–23.
Fan Y, Liu X (2017) Misclassifying core expenses as special items: Cost of goods sold or selling, general,
and administrative expenses? Contemporary Accounting Res. 34:400–26.
Fedyk T, Singer Z, Soliman M (2017) The sharpest tool in the shed: An examination of financial statement
management tools during IPOs. Rev. Accounting Stud. 22 (4):1541–81.
Field L, Karpoff J (2002) Takeover defenses in IPO firms. J. Finance 57:1857–89.
Francis J, Hanna J, Vincent L (1996) Causes and effects of discretionary asset write-offs. J. Accounting
Res. 34 (Supplement):117–34.
Friedlan J (1994) Accounting choices of issuers of initial public offerings. Contemporary Accounting Res.
11:1–31.
Hanley K (1993) The underpricing of initial public offerings and the partial adjustment phenomenon. J.
Financial Econom. 34(2):231–50.
Healy PM (1985) The effect of bonus schemes on accounting decisions. J. Accounting Econom. 7(1-3):85–
107.
Jones JJ (1991) Earnings management during import relief investigations. J. Accounting Res. 29 (2): 193–
228.
Kim M, Ritter J (1999) Valuing IPOs. J. Financial Econom. 53:409–37.
Krishnan CN, Ivanov VI, Masulis RW, Singh AK (2011) Venture capital reputation, post-IPO performance,
and corporate governance. J. Financial and Quantitative Analysis 46(5):1295–33.
Lee P, Wahal S (2004) Grandstanding, certification and the underpricing of venture capital backed IPOs. J.
Financial Econom. 73(2):375–407.
Leland H, Pyle D (1977) Informational asymmetries, financial structure, and financial intermediation. J.
Finance 32:371–87.
Lipe R (1986) The information contained in the components of earnings. J. Accounting Res.
24(Supplement):37–64.
Ljungqvist AP, Wilhelm WJ (2003) IPO pricing in the Dot-Com bubble. J. Finance 58:723–52.
Loughran T, Ritter JR (2002) Why don’t issuers get upset about leaving money on the table in IPOs?. Rev.
Financial Stud. 15(2):413–444.
Loughran T, Ritter JR (2004) Why has IPO underpricing changed overtime? Financial Management 33:5–
37.
Lowry M, Michaely R, Volkov E (2017) Initial public offering: A synthesis of the literature and directions
for future research. Forthcoming Foundations and Trends® in Finance 11(3-4):154–320.
Lowry M, Schwert W (2004) Is the IPO pricing process efficient? J. Financial Econom. 71:3–26.
Lowry M, Shu S (2002) Litigation risk and IPO underpricing. J. Financial Econom. 65(3):309–335.
McVay S (2006) Earnings management using classification shifting: An examination of core earnings and
special items. Accounting Rev. 81(3):501–31.

42
McVay S, Nagar V, Tang VW (2006) Trading incentives to meet the analyst forecast. Rev. Accounting Stud.
11(4):575–598.
Morsfield S, Tan C (2006) Do venture capitalists influence the decision to manage earnings in Initial Public
Offerings? J. Accounting Res. 81(5):1119–50.
Nelson M, Elliott J, Tarpley R (2002) Evidence from auditors about managers’ and auditors’ earnings
management decisions. Accounting Rev. 77 (Supplement):175–202.
Nissim D, Penman S (2001) Ratio analysis and equity valuation: From research to practice. Rev. Accounting
Stud. 6 (1):109–54.
Pittman J, Zhao Y (2017) The impact of financial statement audits on non-income-increasing misreporting:
Evidence from restatements. Working paper, Memorial University of Newfoundland, St. John's,
Newfoundland, Canada.
Purnanandam AK, Swaminathan B (2004) Are IPOs really underpriced? Rev. Financial Stud. 17(3):811–
48.
Ritter JR (1991) The long-run performance of initial public offerings. J. Finance 46:3–27.
Ritter JR, Welch I (2002) A review of IPO activity, pricing, and allocations. J. Finance 57(4):1795–1828.
Roychowdhury S (2006) Management of earnings through the manipulation of real activities that affect
cash flow from operations. J. Accounting Econom. 42 (3):335–70.
Shon J, Veliotis S (2013) Insiders' Sales Under Rule 10b5-1 Plans and Meeting or Beating Earnings
Expectations. Management Sci. 59(9):1988–2002.
Sloan R (1996) Do stock prices fully reflect information in accruals and cash flows about future earnings?
Accounting Rev. 71 (3):289–315.
Teoh SH, Welch I, Wong TJ (1998a). Earnings management and the long-run market performance of initial
public offerings. J. Finance 53:1935–74.
Teoh SH, Wong TJ, Rao G (1998b) Are accruals during initial public offerings opportunistic? Rev.
Accounting Stud. 3:175–208.
Venkataraman R, Weber JP, Willenborg W (2008) Litigation risk, audit quality, and audit fees: Evidence
from initial public offerings. Accounting Rev. 83:1315–45.
Willenborg M, Wu B, Yang YS (2015) Issuer operating performance and IPO price formation. J.
Accounting Res. 53(5):1109–49.
Wongsunwai W (2013) The effect of external monitoring on accruals-based and real earnings management:
Evidence from venture-backed initial public offerings. Contemporary Accounting Res. 30:296–324.
Zang A (2012) Evidence on the trade-off between real manipulation and accrual manipulation. Accounting
Rev. 87(2):675–703.
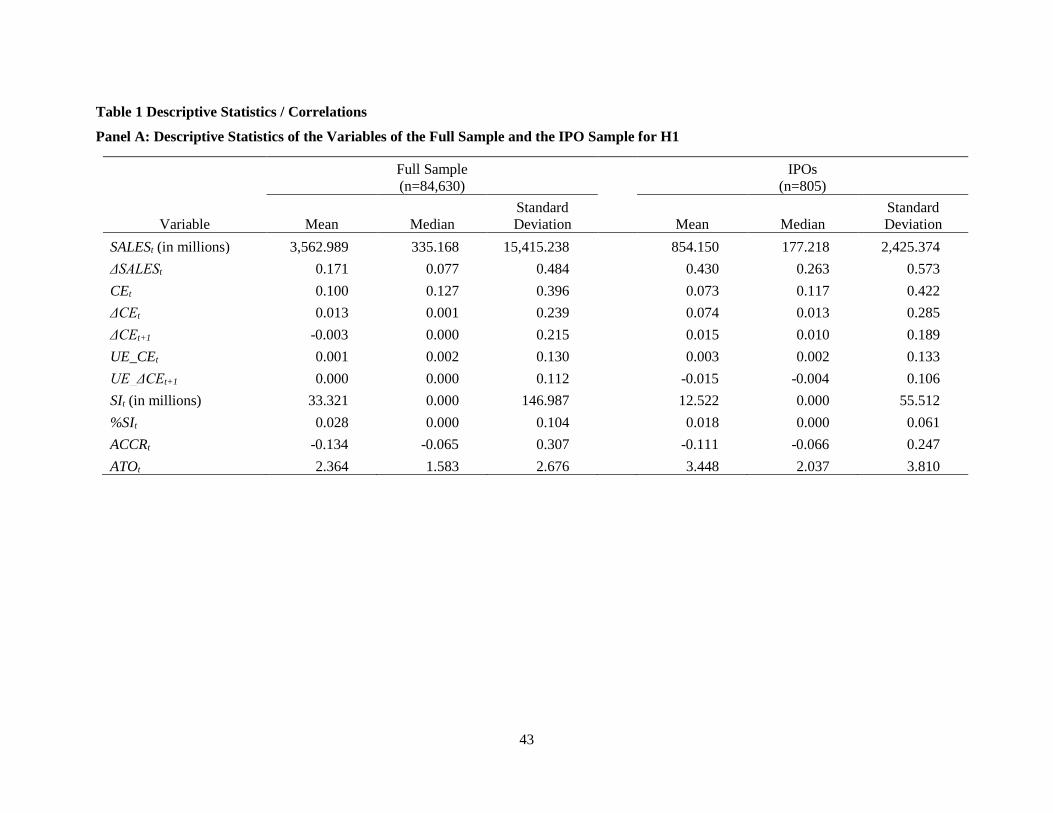
43
Table 1 Descriptive Statistics / Correlations
Panel A: Descriptive Statistics of the Variables of the Full Sample and the IPO Sample for H1
Full Sample
(n=84,630)
IPOs
(n=805)
Variable Mean Median
Standard
Deviation Mean Median
Standard
Deviation
SALESt (in millions) 3,562.989 335.168 15,415.238 854.150 177.218 2,425.374
ΔSALESt 0.171 0.077 0.484 0.430 0.263 0.573
CEt 0.100 0.127 0.396 0.073 0.117 0.422
ΔCEt 0.013 0.001 0.239 0.074 0.013 0.285
ΔCEt+1 -0.003 0.000 0.215 0.015 0.010 0.189
UE_CEt 0.001 0.002 0.130 0.003 0.002 0.133
UE_ΔCEt+1 0.000 0.000 0.112 -0.015 -0.004 0.106
SIt (in millions) 33.321 0.000 146.987 12.522 0.000 55.512
%SIt 0.028 0.000 0.104 0.018 0.000 0.061
ACCRt -0.134 -0.065 0.307 -0.111 -0.066 0.247
ATOt 2.364 1.583 2.676 3.448 2.037 3.810
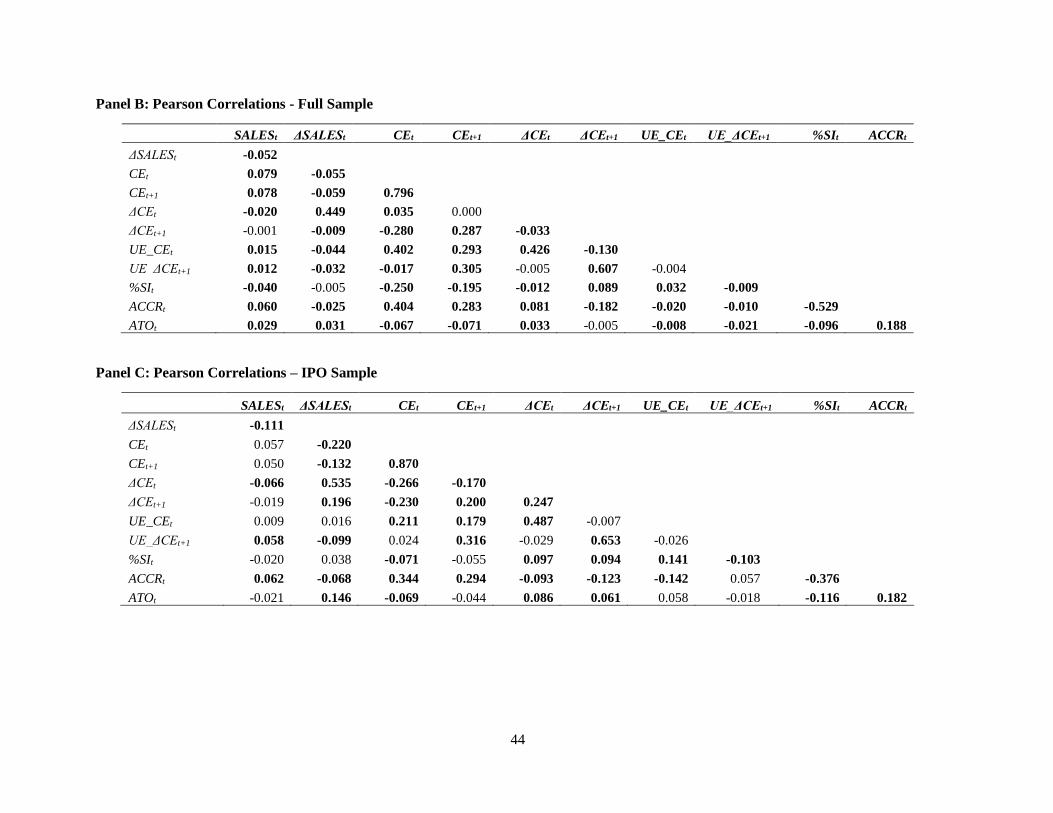
44
Panel B: Pearson Correlations - Full Sample
SALESt ΔSALESt CEt CEt+1 ΔCEt ΔCEt+1 UE_CEt UE_ΔCEt+1 %SIt ACCRt
ΔSALESt -0.052
CEt 0.079 -0.055
CEt+1 0.078 -0.059 0.796
ΔCEt -0.020 0.449 0.035 0.000
ΔCEt+1 -0.001 -0.009 -0.280 0.287 -0.033
UE_CEt 0.015 -0.044 0.402 0.293 0.426 -0.130
UE_ΔCEt+1 0.012 -0.032 -0.017 0.305 -0.005 0.607 -0.004
%SIt -0.040 -0.005 -0.250 -0.195 -0.012 0.089 0.032 -0.009
ACCRt 0.060 -0.025 0.404 0.283 0.081 -0.182 -0.020 -0.010 -0.529
ATOt 0.029 0.031 -0.067 -0.071 0.033 -0.005 -0.008 -0.021 -0.096 0.188
Panel C: Pearson Correlations – IPO Sample
SALESt ΔSALESt CEt CEt+1 ΔCEt ΔCEt+1 UE_CEt UE_ΔCEt+1 %SIt ACCRt
ΔSALESt -0.111
CEt 0.057 -0.220
CEt+1 0.050 -0.132 0.870
ΔCEt -0.066 0.535 -0.266 -0.170
ΔCEt+1 -0.019 0.196 -0.230 0.200 0.247
UE_CEt 0.009 0.016 0.211 0.179 0.487 -0.007
UE_ΔCEt+1 0.058 -0.099 0.024 0.316 -0.029 0.653 -0.026
%SIt -0.020 0.038 -0.071 -0.055 0.097 0.094 0.141 -0.103
ACCRt 0.062 -0.068 0.344 0.294 -0.093 -0.123 -0.142 0.057 -0.376
ATOt -0.021 0.146 -0.069 -0.044 0.086 0.061 0.058 -0.018 -0.116 0.182
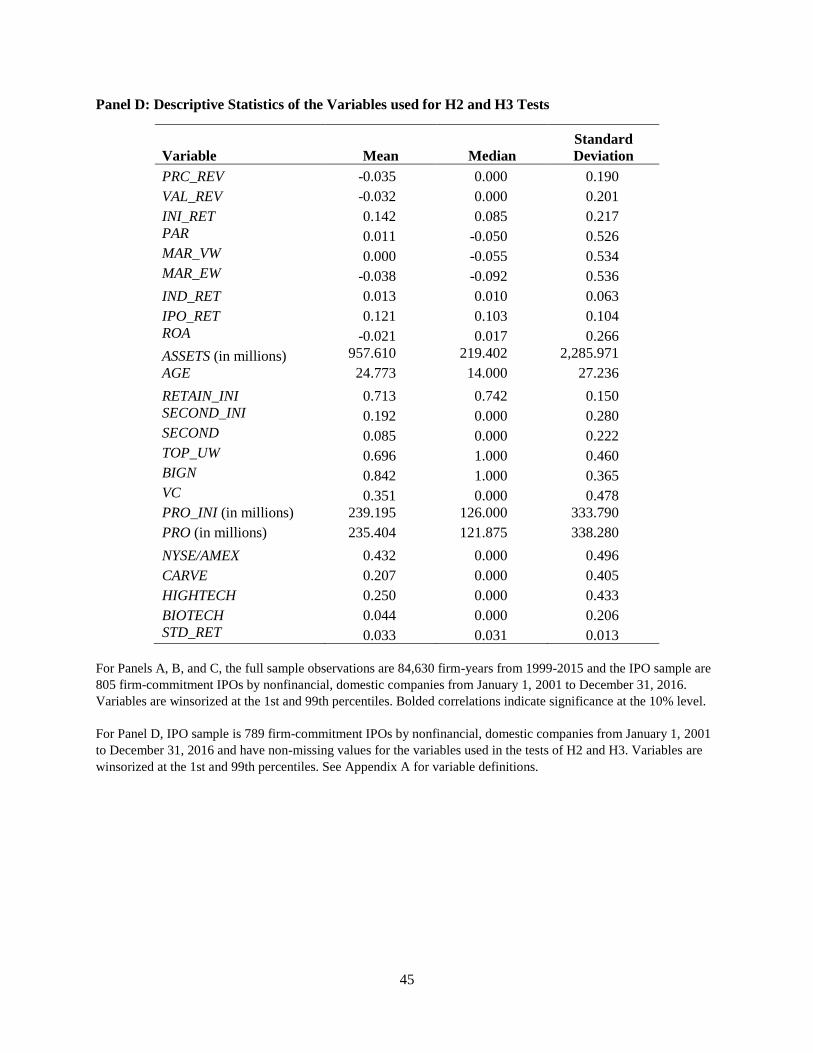
45
Panel D: Descriptive Statistics of the Variables used for H2 and H3 Tests
Variable Mean Median
Standard
Deviation
PRC_REV -0.035 0.000 0.190
VAL_REV -0.032 0.000 0.201
INI_RET 0.142 0.085 0.217
PAR 0.011 -0.050 0.526
MAR_VW 0.000 -0.055 0.534
MAR_EW -0.038 -0.092 0.536
IND_RET 0.013 0.010 0.063
IPO_RET 0.121 0.103 0.104
ROA -0.021 0.017 0.266
ASSETS (in millions) 957.610 219.402 2,285.971
AGE 24.773 14.000 27.236
RETAIN_INI 0.713 0.742 0.150
SECOND_INI 0.192 0.000 0.280
SECOND 0.085 0.000 0.222
TOP_UW 0.696 1.000 0.460
BIGN 0.842 1.000 0.365
VC 0.351 0.000 0.478
PRO_INI (in millions) 239.195 126.000 333.790
PRO (in millions) 235.404 121.875 338.280
NYSE/AMEX 0.432 0.000 0.496
CARVE 0.207 0.000 0.405
HIGHTECH 0.250 0.000 0.433
BIOTECH 0.044 0.000 0.206
STD_RET 0.033 0.031 0.013
For Panels A, B, and C, the full sample observations are 84,630 firm-years from 1999-2015 and the IPO sample are
805 firm-commitment IPOs by nonfinancial, domestic companies from January 1, 2001 to December 31, 2016.
Variables are winsorized at the 1st and 99th percentiles. Bolded correlations indicate significance at the 10% level.
For Panel D, IPO sample is 789 firm-commitment IPOs by nonfinancial, domestic companies from January 1, 2001
to December 31, 2016 and have non-missing values for the variables used in the tests of H2 and H3. Variables are
winsorized at the 1st and 99th percentiles. See Appendix A for variable definitions.
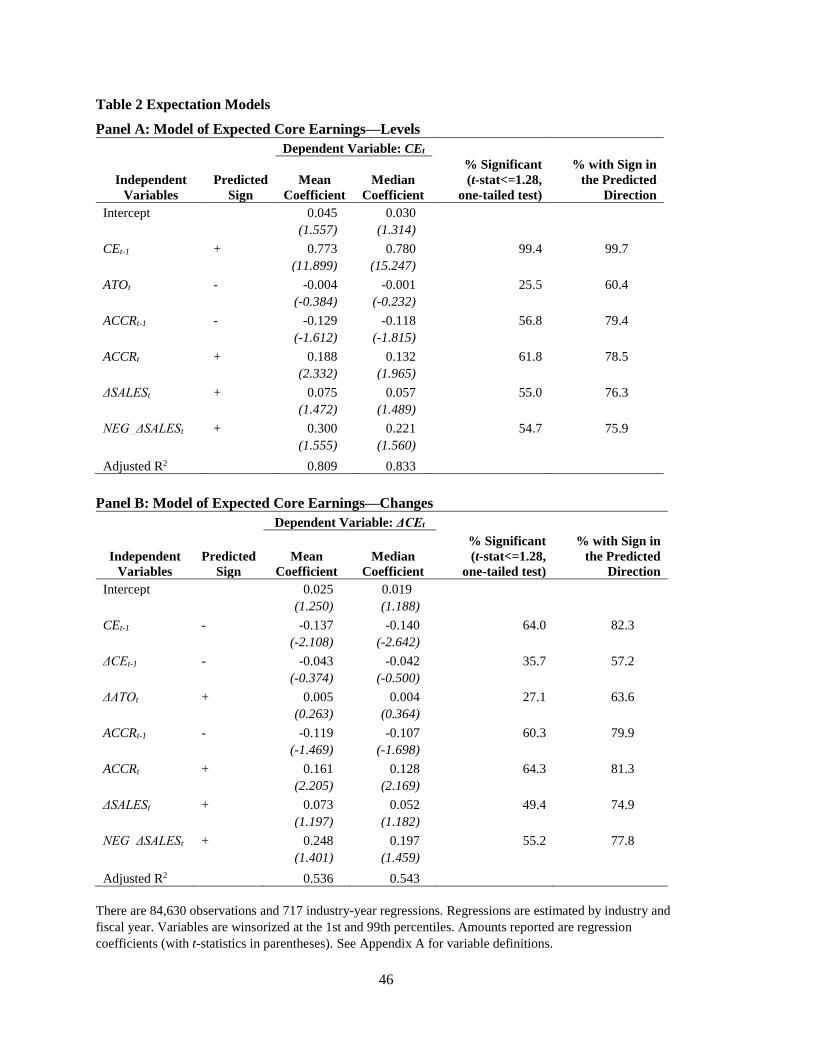
46
Table 2 Expectation Models
Panel A: Model of Expected Core Earnings—Levels
Dependent Variable: CEt
Independent
Variables
Predicted
Sign
Mean
Coefficient
Median
Coefficient
% Significant
(t-stat<=1.28,
one-tailed test)
% with Sign in
the Predicted
Direction
Intercept 0.045 0.030
(1.557) (1.314)
CEt-1 + 0.773 0.780 99.4 99.7
(11.899) (15.247)
ATOt - -0.004 -0.001 25.5 60.4
(-0.384) (-0.232)
ACCRt-1 - -0.129 -0.118 56.8 79.4
(-1.612) (-1.815)
ACCRt + 0.188 0.132 61.8 78.5
(2.332) (1.965)
ΔSALESt + 0.075 0.057 55.0 76.3
(1.472) (1.489)
NEG_ΔSALESt + 0.300 0.221 54.7 75.9
(1.555) (1.560)
Adjusted R2 0.809 0.833
Panel B: Model of Expected Core Earnings—Changes
Dependent Variable: ΔCEt
Independent
Variables
Predicted
Sign
Mean
Coefficient
Median
Coefficient
% Significant
(t-stat<=1.28,
one-tailed test)
% with Sign in
the Predicted
Direction
Intercept 0.025 0.019
(1.250) (1.188)
CEt-1 - -0.137 -0.140 64.0 82.3
(-2.108) (-2.642)
ΔCEt-1 - -0.043 -0.042 35.7 57.2
(-0.374) (-0.500)
ΔATOt + 0.005 0.004 27.1 63.6
(0.263) (0.364)
ACCRt-1 - -0.119 -0.107 60.3 79.9
(-1.469) (-1.698)
ACCRt + 0.161 0.128 64.3 81.3
(2.205) (2.169)
ΔSALESt + 0.073 0.052 49.4 74.9
(1.197) (1.182)
NEG_ΔSALESt + 0.248 0.197 55.2 77.8
(1.401) (1.459)
Adjusted R2 0.536 0.543
There are 84,630 observations and 717 industry-year regressions. Regressions are estimated by industry and
fiscal year. Variables are winsorized at the 1st and 99th percentiles. Amounts reported are regression
coefficients (with t-statistics in parentheses). See Appendix A for variable definitions.
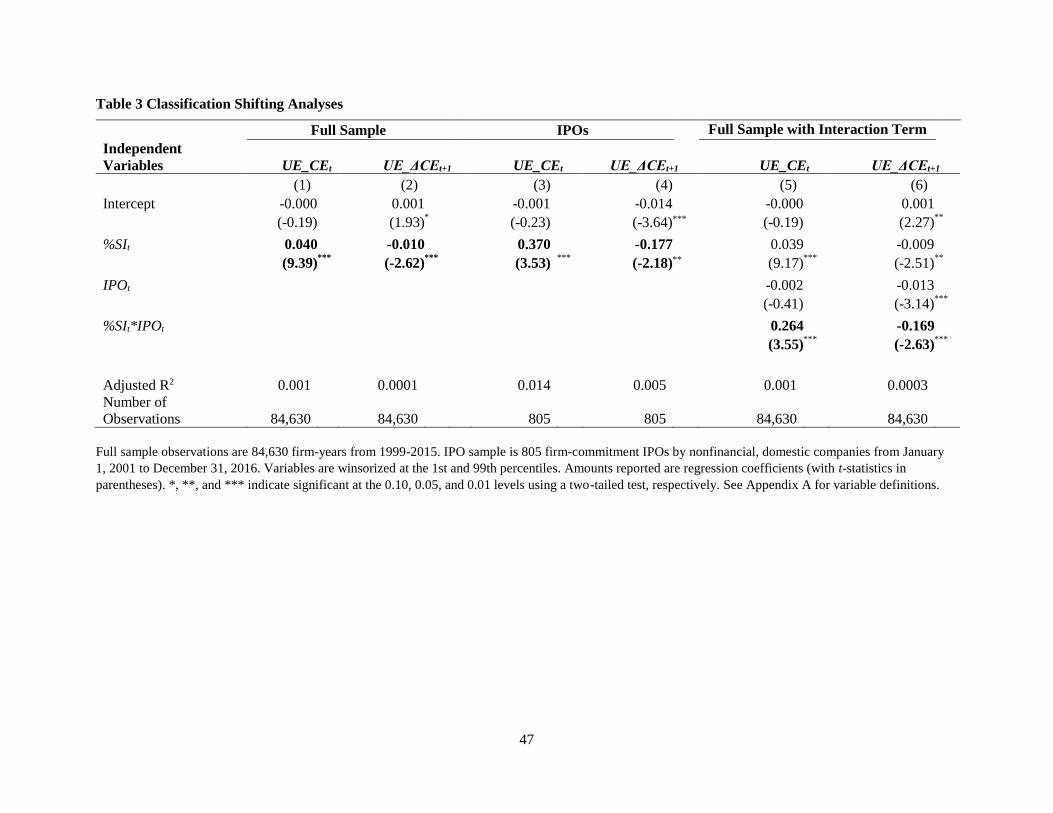
47
Table 3 Classification Shifting Analyses
Full Sample IPOs Full Sample with Interaction Term
Independent
Variables UE_CEt UE_ΔCEt+1 UE_CEt UE_ΔCEt+1 UE_CEt UE_ΔCEt+1
(1) (2) (3)
(4) (5)
(6)
Intercept -0.000 0.001 -0.001
-0.014 -0.000
0.001
(-0.19) (1.93) *
(-0.23)
(-3.64) *** (-0.19)
(2.27) **
%SIt 0.040 -0.010
0.370
-0.177 0.039
-0.009
(9.39) ***
(-2.62) ***
(3.53) ***
(-2.18) ** (9.17) ***
(-2.51) **
IPOt
-0.002
-0.013
(-0.41)
(-3.14) ***
%SIt*IPOt
0.264
-0.169
(3.55) ***
(-2.63) ***
Adjusted R2 0.001 0.0001 0.014 0.005 0.001 0.0003
Number of
Observations 84,630
84,630
805
805 84,630
84,630
Full sample observations are 84,630 firm-years from 1999-2015. IPO sample is 805 firm-commitment IPOs by nonfinancial, domestic companies from January
1, 2001 to December 31, 2016. Variables are winsorized at the 1st and 99th percentiles. Amounts reported are regression coefficients (with t-statistics in
parentheses). *, **, and *** indicate significant at the 0.10, 0.05, and 0.01 levels using a two-tailed test, respectively. See Appendix A for variable definitions.
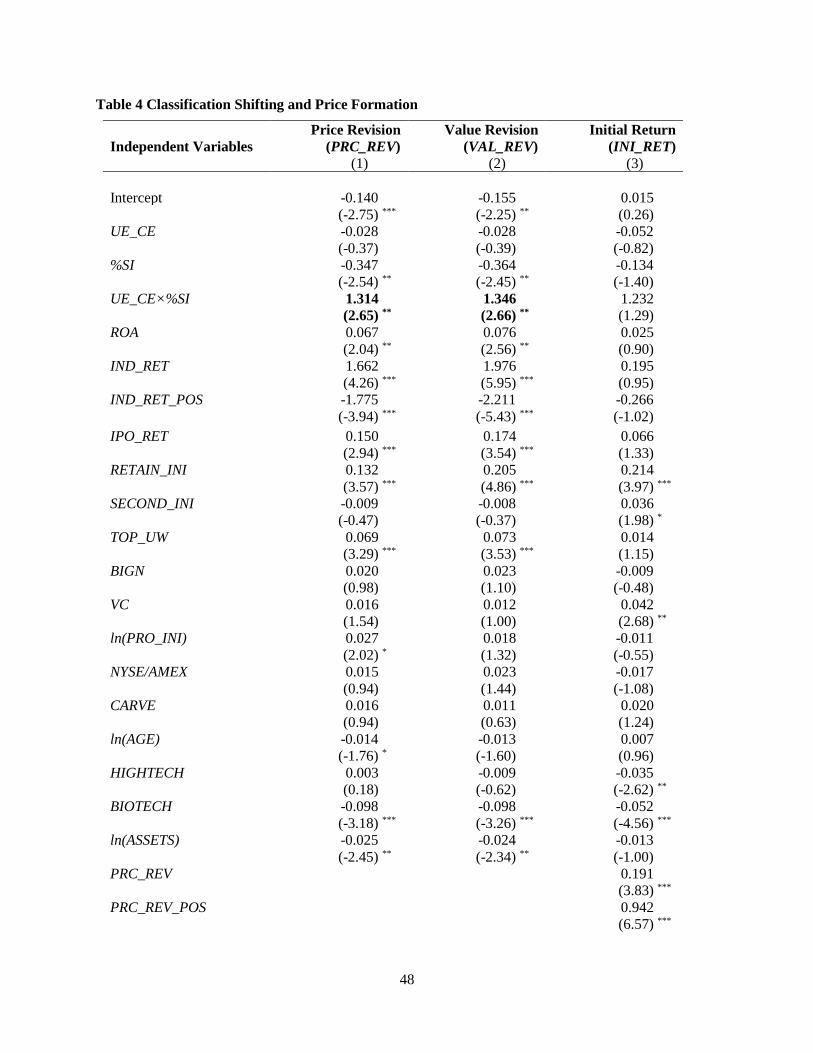
48
Table 4 Classification Shifting and Price Formation
Independent Variables
Price Revision
(PRC_REV)
Value Revision
(VAL_REV)
Initial Return
(INI_RET)
(1) (2) (3)
Intercept -0.140 -0.155 0.015
(-2.75) *** (-2.25) ** (0.26)
UE_CE -0.028 -0.028 -0.052
(-0.37) (-0.39) (-0.82)
%SI -0.347 -0.364 -0.134
(-2.54) ** (-2.45) ** (-1.40)
UE_CE×%SI 1.314 1.346 1.232
(2.65) ** (2.66) ** (1.29)
ROA 0.067 0.076 0.025
(2.04) ** (2.56) ** (0.90)
IND_RET 1.662 1.976 0.195
(4.26) *** (5.95) *** (0.95)
IND_RET_POS -1.775 -2.211 -0.266
(-3.94) *** (-5.43) *** (-1.02)
IPO_RET 0.150
0.174
0.066
(2.94) *** (3.54) *** (1.33)
RETAIN_INI 0.132 0.205 0.214
(3.57) *** (4.86) *** (3.97) ***
SECOND_INI -0.009 -0.008 0.036
(-0.47) (-0.37) (1.98) *
TOP_UW 0.069 0.073 0.014
(3.29) *** (3.53) *** (1.15)
BIGN 0.020 0.023 -0.009
(0.98) (1.10) (-0.48)
VC 0.016 0.012 0.042
(1.54) (1.00) (2.68) **
ln(PRO_INI) 0.027 0.018 -0.011
(2.02) * (1.32) (-0.55)
NYSE/AMEX 0.015 0.023 -0.017
(0.94) (1.44) (-1.08)
CARVE 0.016 0.011 0.020
(0.94) (0.63) (1.24)
ln(AGE) -0.014 -0.013 0.007
(-1.76) * (-1.60) (0.96)
HIGHTECH 0.003 -0.009 -0.035
(0.18) (-0.62) (-2.62) **
BIOTECH -0.098 -0.098 -0.052
(-3.18) *** (-3.26) *** (-4.56) ***
ln(ASSETS) -0.025 -0.024 -0.013
(-2.45) ** (-2.34) ** (-1.00)
PRC_REV
0.191
(3.83) ***
PRC_REV_POS
0.942
(6.57) ***

49
Year fixed effects Yes Yes Yes
Adjusted R-squared 0.149 0.167 0.432
Observations 789 789 789
IPO sample observations are 789 firm-commitment IPOs by nonfinancial, domestic companies from January 1, 2001
to December 31, 2016. Variables are winsorized at the 1st and 99th percentiles. Amounts reported are regression
coefficients. t-statistics with robust standard errors clustered on Fama-French 48 industries are reported in
parentheses. *, **, and *** indicate significant at the 0.10, 0.05, and 0.01 levels using a two-tailed test, respectively.
See Appendix A for variable definitions.
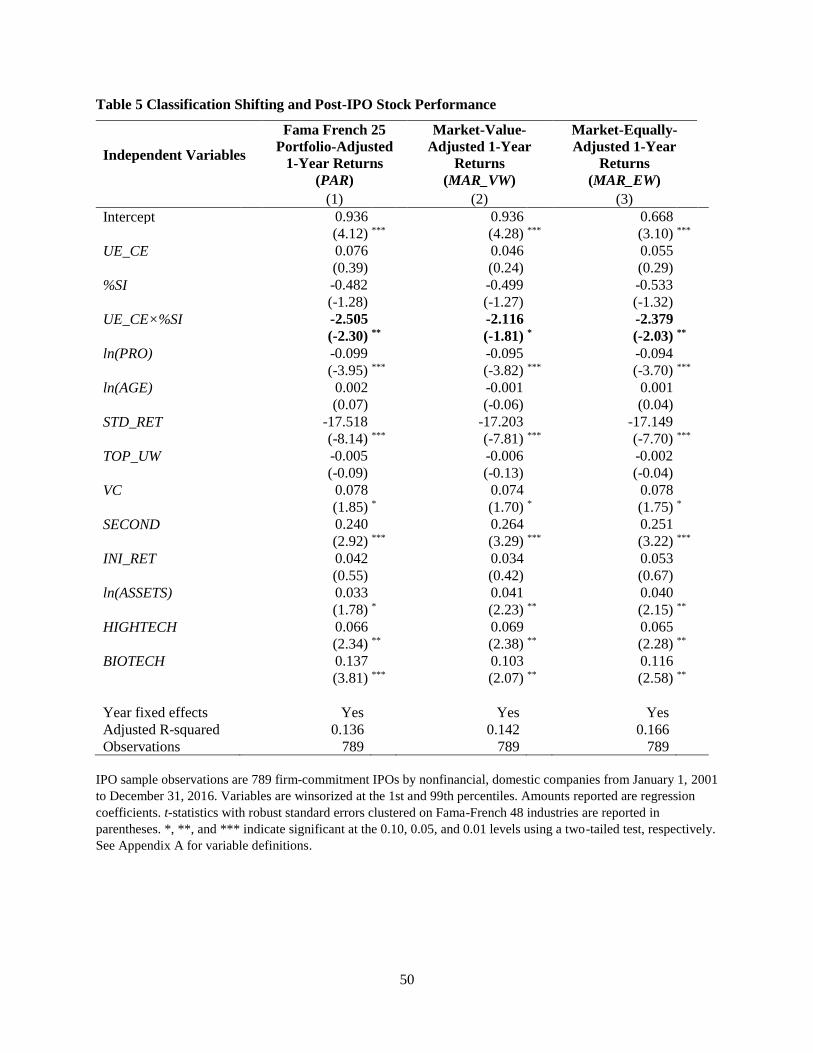
50
Table 5 Classification Shifting and Post-IPO Stock Performance
Independent Variables
Fama French 25
Portfolio-Adjusted
1-Year Returns
(PAR)
Market-Value-
Adjusted 1-Year
Returns
(MAR_VW)
Market-Equally-
Adjusted 1-Year
Returns
(MAR_EW)
(1) (2) (3)
Intercept 0.936 0.936 0.668
(4.12) *** (4.28) *** (3.10) ***
UE_CE 0.076 0.046 0.055
(0.39) (0.24) (0.29)
%SI -0.482 -0.499 -0.533
(-1.28) (-1.27) (-1.32)
UE_CE×%SI -2.505 -2.116 -2.379
(-2.30) ** (-1.81) * (-2.03) **
ln(PRO) -0.099 -0.095 -0.094
(-3.95) *** (-3.82) *** (-3.70) ***
ln(AGE) 0.002 -0.001 0.001
(0.07) (-0.06) (0.04)
STD_RET -17.518 -17.203 -17.149
(-8.14) *** (-7.81) *** (-7.70) ***
TOP_UW -0.005 -0.006 -0.002
(-0.09) (-0.13) (-0.04)
VC 0.078 0.074 0.078
(1.85) * (1.70) * (1.75) *
SECOND 0.240 0.264 0.251
(2.92) *** (3.29) *** (3.22) ***
INI_RET 0.042 0.034 0.053
(0.55) (0.42) (0.67)
ln(ASSETS) 0.033 0.041 0.040
(1.78) * (2.23) ** (2.15) **
HIGHTECH 0.066 0.069 0.065
(2.34) ** (2.38) ** (2.28) **
BIOTECH 0.137 0.103 0.116
(3.81) *** (2.07) ** (2.58) **
Year fixed effects Yes Yes Yes
Adjusted R-squared 0.136 0.142 0.166
Observations 789 789 789
IPO sample observations are 789 firm-commitment IPOs by nonfinancial, domestic companies from January 1, 2001
to December 31, 2016. Variables are winsorized at the 1st and 99th percentiles. Amounts reported are regression
coefficients. t-statistics with robust standard errors clustered on Fama-French 48 industries are reported in
parentheses. *, **, and *** indicate significant at the 0.10, 0.05, and 0.01 levels using a two-tailed test, respectively.
See Appendix A for variable definitions.
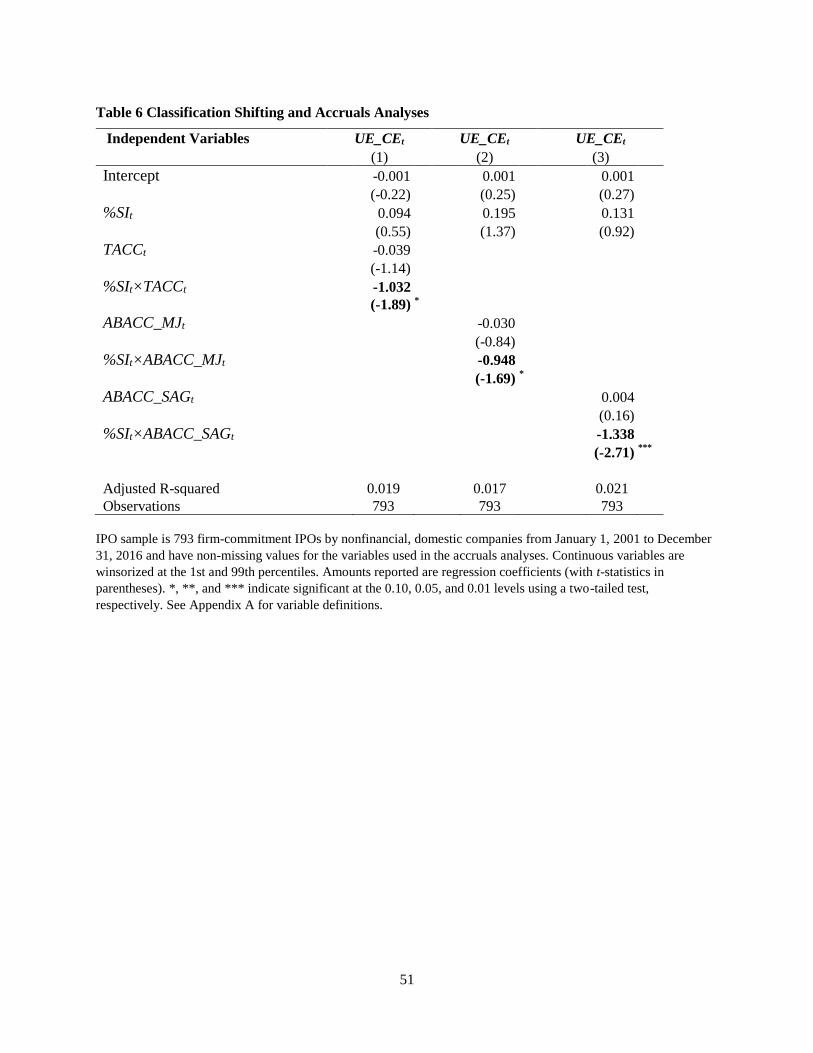
51
Table 6 Classification Shifting and Accruals Analyses
Independent Variables UE_CEt UE_CEt UE_CEt
(1) (2) (3)
Intercept -0.001 0.001
0.001
(-0.22) (0.25)
(0.27)
%SIt 0.094 0.195
0.131
(0.55) (1.37)
(0.92)
TACCt -0.039
(-1.14)
%SIt×TACCt -1.032
(-1.89) *
ABACC_MJt -0.030
(-0.84)
%SIt×ABACC_MJt -0.948
(-1.69) *
ABACC_SAGt 0.004
(0.16)
%SIt×ABACC_SAGt -1.338
(-2.71) ***
Adjusted R-squared 0.019 0.017 0.021
Observations 793 793 793
IPO sample is 793 firm-commitment IPOs by nonfinancial, domestic companies from January 1, 2001 to December
31, 2016 and have non-missing values for the variables used in the accruals analyses. Continuous variables are
winsorized at the 1st and 99th percentiles. Amounts reported are regression coefficients (with t-statistics in
parentheses). *, **, and *** indicate significant at the 0.10, 0.05, and 0.01 levels using a two-tailed test,
respectively. See Appendix A for variable definitions.