Do investors care about the Quality of Sustainability ...
36
Do investors care about the Quality of Sustainability reports? - The Relationship between Sustainability Reporting Quality and Firm Value and the Role of Analysts Guus Reintjes Radboud University Master: Economics Track: Accounting & Control Nijmegen, the Netherlands Supervisor: dr. G.J.M. Braam RA 30 th of June 2017 Abstract This thesis investigates the relationship between the quality of sustainability reporting and firm value and the role of analysts in this relationship. A panel dataset of listed companies during the period 2012-2016, comprising 300 observations is used. The results show that having a higher level of sustainability reporting quality is negatively associated with firm value. However, most of the results regarding this relationship are insignificant and have to be interpreted with care. In addition, the results show that a higher level of analyst coverage has a strengthening effect on the relationship between sustainability reporting quality and firm value. These findings extend the literature on sustainability reporting quality and firm value by integrating the role of analysts in this relationship. This thesis has implications for management and investors as they can use the findings of this thesis in their decision making process. Keywords Firm value – sustainability reporting quality – analyst coverage – panel study
Transcript of Do investors care about the Quality of Sustainability ...

Do investors care about the Quality of Sustainability
reports? - The Relationship between Sustainability
Reporting Quality and Firm Value and the Role of
Analysts
Guus Reintjes
Radboud University
Master: Economics
Track: Accounting & Control
Nijmegen, the Netherlands
Supervisor: dr. G.J.M. Braam RA
30th of June 2017
Abstract
This thesis investigates the relationship between the quality of sustainability reporting and firm value and
the role of analysts in this relationship. A panel dataset of listed companies during the period 2012-2016,
comprising 300 observations is used. The results show that having a higher level of sustainability reporting
quality is negatively associated with firm value. However, most of the results regarding this relationship
are insignificant and have to be interpreted with care. In addition, the results show that a higher level of
analyst coverage has a strengthening effect on the relationship between sustainability reporting quality and
firm value. These findings extend the literature on sustainability reporting quality and firm value by
integrating the role of analysts in this relationship. This thesis has implications for management and
investors as they can use the findings of this thesis in their decision making process.
Keywords Firm value – sustainability reporting quality – analyst coverage – panel study

2
Table of contents
1 Introduction ...................................................................................................................................................... 3
2 Literature review and hypotheses development ............................................................................................ 6
2.1 Disclosure theories ..................................................................................................................................... 6
2.2 The value relevance of sustainability disclosure quality ............................................................................ 7
2.3 Analyst coverage ......................................................................................................................................... 9
2.4 Conceptual model ..................................................................................................................................... 10
3 Research method ............................................................................................................................................ 11
3.1 Data collection .......................................................................................................................................... 11
3.2 Variable measurement .............................................................................................................................. 12
3.2.1 Dependent Variable: Firm value ....................................................................................................... 12
3.2.2 Independent variable: Quality of sustainability reporting ................................................................. 12
3.2.3 Independent variable: Interaction effects .......................................................................................... 17
3.2.4 Control variables ............................................................................................................................... 17
3.3 The research model ................................................................................................................................... 18
4 Results ............................................................................................................................................................. 22
5 Conclusion and discussion ............................................................................................................................. 29
Bibliography ...................................................................................................................................................... 32

3
1 Introduction
Nowadays the world is threatened by substantial damage to or losses of many natural resources. Such as
fisheries, lakes, forests and water resources, as well as significant reductions in biodiversity and the threat
of climate change (Ostrom, 2009). For this reason, customers, employees, suppliers, governments and
shareholders have emphasized the importance of corporate social responsibility (CSR) (McWilliams,
2000). Since businesses are involved in social and environmental issues, they have to be held accountable
for their decisions (Montiel, 2008). Worldwide, consumers and investors make increasingly clear demands
on how and to which extend companies have to deal with ecological and social problems (McWilliams &
Siegel, 2006). Nine out of ten people are even be willing to boycott an organization that does not take its
responsibilities seriously (Cone Communications, 2015). These factors show CSR becomes more important
for businesses, consumers and investors.
In an attempt to maintain or restore trust in their performance on sustainability issues, firms disclose
sustainability information to provide consumers and investors with information about their corporate
sustainability performance (CSP) (Hummel & Schlick, 2016). Sustainability has become a concept that
overlaps everything that has to do with social responsibility, environment, ecology and future oriented
thinking (Ostrom, 2009). In previous literature two theories explain why to report about sustainability. On
the one hand, there is voluntary disclosure theory which argues that a companies with good CSP disclose
information to increase their market value (Deegan, 2002). On the other hand, legitimacy theory argues that
companies with low a low level of CSP engage in sustainability disclosure to improve the public view of
their sustainability performance (Deegan, 2002). In both cases, the goal of the disclosure is to improve the
perception of consumers and investors about the firm. This is where a problem arises. When both low
performing as high performing firms publish sustainability reports, how is this information perceived by
investors and how is this information reflected in firm value? In other words, how can investors make a
distinction between low and bad performing firms on the topic of sustainability, when both type of firms
provide sustainability reports?
Instead of looking at the quantity of sustainability disclosures, this paper focuses on the quality of
sustainability disclosures based on the papers of Hummel and Schlick (2016), Clarkson, Richardson and
Vasvari (2008) and Dhaliwal, Radhakrishnan, Tsang and Yang (2012). Firms with a higher level of CSP
tend to disclose sustainability reports that are of higher quality. Moreover, firms with a lower level of CSP
tend to disclose sustainability reports that are of lower quality (Hummel & Schlick, 2016). Investors do
want to punish large profitable firms with a low level of CSP ( Lourenço, Branco, Curto & Eugénio, 2012).
When we know that better performing firms provide higher quality sustainability reports, and investors do
want to punish low performing firms, we should be able to find a relationship between the quality of CSR
reporting and firm value. However, former studies never found an association between sustainability

4
disclosure quality and firm value (Clarkson, Fang, Li, & Richardson, 2013; Dhaliwal et al, 2012).
Despite the presence of information about CSR and the availability of corporate sustainability
disclosures of organizations, such information comes in significant amounts and is complex to be
understood by general investors (Luo et al., 2015). General investors are not certified as industry experts
and are most often constrained by time and resources (Fombrun, Gardberg, & Barnett, 2000; Surroca, Tribo,
& Waddock, 2010). This means that not all information that is available for general investors can be
incorporated into firm value automatically (Godfrey, Merill, & Hansen, 2009). Security analyst, on the
other hand, are experts skilled at obtaining information that is not readily accessible to general investors
and are better to evaluate the value relevance of sustainability information (Ivkovic & Jegadeesh, 2004).
Analysts do pay a great deal of attention to sustainability performance and factor it into stock
recommendations (Luo et al, 2015). Suggesting that general investors are not capable enough to interpret
the quality of sustainability disclosures, this study examines the role of analysts in the relationship between
CSR and sustainability disclosure quality. To find an association between firm value and the quality of
sustainability accounting and to investigate the role of analysts in this association the following research
question is formulated: ‘To what extent does the quality of sustainability reporting influence firm value and
what is the role of analysts in this relationship?’
To answer the research question 60 Dutch firms are examined during a five year period (2012-
2016) leading to 300 company year observations. Data from the Transparency Benchmark and the
Sustainability Disclosure Database of the Global Reporting Initiative are used as a measure for the quality
of CSR reports. Through a panel data regression, the association between sustainability reporting quality
and firm value is examined. In addition the effect of analysts on this relationship is tested. Results of the
analysis show significant negative results regarding the association between sustainability reporting quality
and firm value. This is inconsistent with the prediction that a higher level of sustainability reporting quality
would lead to a higher level of frim value. However, in two out of five analyses it appears that analyst
coverage does influence the relationship between the quality of sustainability reporting and firm value.
Mixed and insignificant results are found for the association between other proxies of firm value and the
quality of sustainability reporting. In addition, insignificant results are found for the effect of analyst
coverage on the relationship.
This study contributes to the existing literature in three different ways. First, it fills a gap in the
existing literature by investigating the relationship between sustainability reporting quality and firm value.
The focus is on firm value as a dependent variable, because this thesis expects that general investors do
want to punish firms that do have a low quality of sustainability reporting. Second, this study adds a new
dimension to the literature by investigating the role of analysts in this before mentioned relationship. The
addition of analyst coverage in this relationship could provide the solution for the mixed and insignificant

5
results in the previous literature that have been found when testing this particular relationship. Third, this
study can provide information for managers, audit committees and shareholders. They can use the
information provided in this study for decision making regarding sustainability reporting. This study is also
useful for general investors. These investors can base their investment decisions on the information
provided about the quality of sustainability reporting and the effect on firm value. They could also obtain
advantage from information about the moderating role of analyst leading to better investment decisions.
The remainder of this paper is structured as follows. Section II reviews the related literature and
develops the hypotheses. Section III explains the methodology and will focus on the measurement variables
of the quality of sustainability disclosure and firm value. Section IV provides results and findings from the
regression analyses and robustness checks. Section V concludes the paper.
6
2 Literature review and hypotheses development
2.1 Disclosure theories
When reviewing the previous empirical studies on the relationship between sustainability performance and
sustainability disclosure, the conclusion can be drawn that nearly all of these studies are based on either
voluntary disclosure theory or legitimacy theory (Al-Tuwaijri, Christensen & Hughes, 2004; Bewley & Li,
2000; Cho et al., 2012; Cho and Patten, 2007; Clarkson et al., 2008, 2011; De Villiers & van Staden, 2006;
Patten, 2002). The voluntary disclosure theory originally referred to the voluntary disclosure of financial
information. However, researchers have also applied it to clarify the voluntary disclosure of non-financial
information (Bewley & Li, 2000; Clarkson et al., 2008; Li, Richardson, & Thornton, 1997). They argue
that a company with superior sustainability performance voluntarily discloses non-financial information to
expose the nature of its factual performance and to increase its market value (Clarkson et al., 2008).
Legitimacy theory offers a different theoretical explanation for the voluntary disclosure of non-
financial information. Legitimacy is defined as a generalized perception or assumption that the actions of
an entity are desirable, proper, or appropriate within some socially constructed system of norms, values,
beliefs, and definitions (Suchman, 1995). A firm’s legitimacy can be endangered because its performance
can be perceived as non-sustainable by stakeholders. When this happens the long-term survival of the firm
is at risk (Davis, 1973). This could be due to poor image, customer dissatisfaction, hiring issues, litigation,
and stricter regulation, among other factors (Ameer and Othman, 2012; Wood, 1991). The legitimacy theory
argues that predominantly poorly performing firms use sustainability disclosure as a legitimation tactic to
influence public perceptions regarding their sustainability performance (Deegan 2002; O’Donnovan, 2002;
Sethi, 1978).
The voluntary disclosure theory and the legitimacy theory generate partly opposing predictions
regarding the relationship between sustainability performance and sustainability disclosure. These opposing
predictions are also supported by mixed empirical results from former studies investigating this
relationship. Prior literature found a positive (Al-Tuwaijri et al., 2004; Clarkson et al., 2008), a negative
(Cho & Patten, 2007; De Villiers & van Staden, 2006) and even a U-shaped non-linear relationship (Li,
Zhao, Sun, & Yin, 2016; Trumpp & Guenther, 2015) between sustainability performance and sustainability
disclosure.
Recent research questions whether these two theories are complementary (Clarkson et al., 2008;
Hummel & Schlick 2016). A positive relationship between environmental performance and environmental
disclosure is found by Clarkson et al. (2008), which implies evidence for the voluntary disclosure theory.
However, they refer to the legitimacy theory to explain ‘interesting patterns in the data’. Focusing on the
reporting quality of 14 disclosure items in the environmental and social dimensions of sustainability
Hummel & Schlick (2016) found, in accordance with voluntary disclosure theory, that higher sustainability

7
performance leads to higher quality sustainability disclosure. In addition, Hummel and Slick (2016) also
build on legitimacy theory suggesting a negative relationship between sustainability disclosure and low-
quality sustainability disclosure. Thus, the paper suggests that the two theories are two sides of the same
coin by shifting the focus towards the quality of sustainability disclosure.
2.2 The value relevance of sustainability disclosure quality
Many research has been done on the relationship between sustainability performance and the value
relevance of this performance. Hassel, Nilsson & Nyquist (2005) were among the first to investigate the
relationship between market value and overall firm performance on sustainability. They found a negative
relationship between sustainability performance and firm value. They argue that investors observe that
sustainable performance is used for window dressing of book values and financial performance, that
investors perceive that sustainable responsible activities are made at the expense of increased profits, and
that the market is short-term oriented. This implies that investors do not contemplate long-term
sustainability information when making investment decisions (Hassel, Nilsson & Nyquist, 2005). However,
Hassel et al. (2005) were not the only researchers to investigate this relationship. Montabon, Sroufe &
Narasimhan (2006), for example, found completely different results investigating this relationship. Their
findings suggest a significant and positive relationship between sustainability performance and firm
performance (Montabon, Sroufe & Narasimhan, 2006). The argumentation they use to explain the positive
relationship is based on the ‘win-win argument’ by Porter (1991). Porter argues that government
environmental standards are harmful to the competitiveness of the firm. He concludes that the benefits of
environmental management are larger than the costs and tighter regulatory standards will in fact lead to
innovation (Porter, 1991). In addition, Jacobs, Singhal & Subramanian (2010), found that although the
market does not react significantly to environmental performance in general, for certain sub categories of
environmental performance the market does react significantly (Jacobs, Singhal & Subramanian, 2010).
These findings could provide an explanation for the contradicting results of Hassel et al. (2005) and
Montabon et al. (2006).
The study of Lourenço et al. (2012) provides empirical evidence on how CSP is reflected in the
market value of a company. The results show that CSP has significant explanatory power for stock prices.
Their findings suggest that what investors really do is punish large profitable firms with a low level of CSP
(Lourenço et al., 2012). However, the studies mentioned before in this paragraph do have contradicting
outcomes and do only focus on CSP and not so much on sustainability disclosure.
Not taking sustainability disclosure into account could provide an explanation for the contradicting
results of the before mentioned studies. As mentioned before, firms disclose information about their
performance to influence the perception about their performance. This means that information about CSP
is obtained by investors through the sustainability disclosures of those firms (Clarkson et al., 2013). This
8
would imply that that the investment choices of investors more likely to be based on sustainability
disclosures than on real CSP. Therefore, this study focuses on sustainability disclosures rather than on CSP.
It is important for practitioners of sustainability reporting that the usefulness of sustainability
disclosures and the source of this usefulness is recognized. Their task is to convince top management that
such transparency is worthwhile in terms of increasing firm value (Clarkson et al., 2013). Support for this
statement is provided by a quote from a report of the World Business Council for Sustainable Development
and UNEP FI: ‘Corporate sustainability managers can provide valuable expertise on the materiality of
environmental, social and governance (ESG) factors to support the corporate communication processes
involving the investment community. The risk of doing nothing could result in long-term value destruction
for companies that do not manage material ESG factors responsibly and are consequently unable to reap
the rewards of new market opportunities that directly address global sustainability issues’ (UNEP FI, 2010,
p.10).
The effect of voluntary sustainability disclosures on firm value can arise either from facilitating
future financial performance prediction and/or cost of capital reduction. First they can facilitate future
financial performance prediction because such disclosures are interpreted as credible by investors and
convey information on top of what investors already know about the firms sustainability performance.
Second such disclosures can lower the firm’s cost of capital by reducing information asymmetry about
sustainability performance. This effect can only arise when sustainability disclosures are viewed as credible
and transmit incremental information. (Clarkson et al., 2013).
Studying the effect of sustainability disclosures on firm value, instead of the effect of sustainability
performance on firm value, would only be relevant if such disclosures are incremental informative over
current sustainability performance measures that are available to the public (Clarkson et al., 2013). There
are several reasons why sustainability performance may provide incremental information over
sustainability performance measures. First, where performance measures cannot reflect a firm’s
sustainability strategy, sustainability disclosure can provide insights in a firm’s sustainability strategy and
commitment for future sustainability protection. Second, performance measures are limited in scope,
because they do not capture all dimensions of sustainability performance. Third, sustainability disclosures
can provide information about a firm’s participation in all kind of sustainability initiatives, all of which
may lead to future competitive advantages (Clarkson et al., 2013).
Clarkson et al. (2013) and Dhaliwal et al. (2012) have conducted research on the value relevance
of sustainability disclosure. Clarkson et al. (2013) found that a proactive sustainability strategy and the
signaling of such a strategy to investors can enhance a firm’s stock price. Dhaliwal et al. (2012) found that
sustainability disclosures are significantly negatively associated with analysts’ earnings forecast errors.
These findings do imply that sustainability disclosure is value relevant, however, these studies do not

9
provide evidence for the relationship between sustainability disclosure and firm value which this paper will
address.
In short, previous literature did try to find an association between sustainability disclosures and
firm value, however, none of the former studies found such an association to exist. This paper tries to find
this relationship by adding a new perspective to the debate. This thesis assumes that; (1) a higher quality of
sustainability reporting provides more relevant information; (2) a higher level of sustainability reporting
quality is positively associated with the level of sustainability performance; (3) Investors do want to punish
firms with a low level of sustainability performance. Based on these assumptions this paper expects that
an increase in sustainability disclosure quality leads to an increase in firm value, leading to the following
hypothesis:
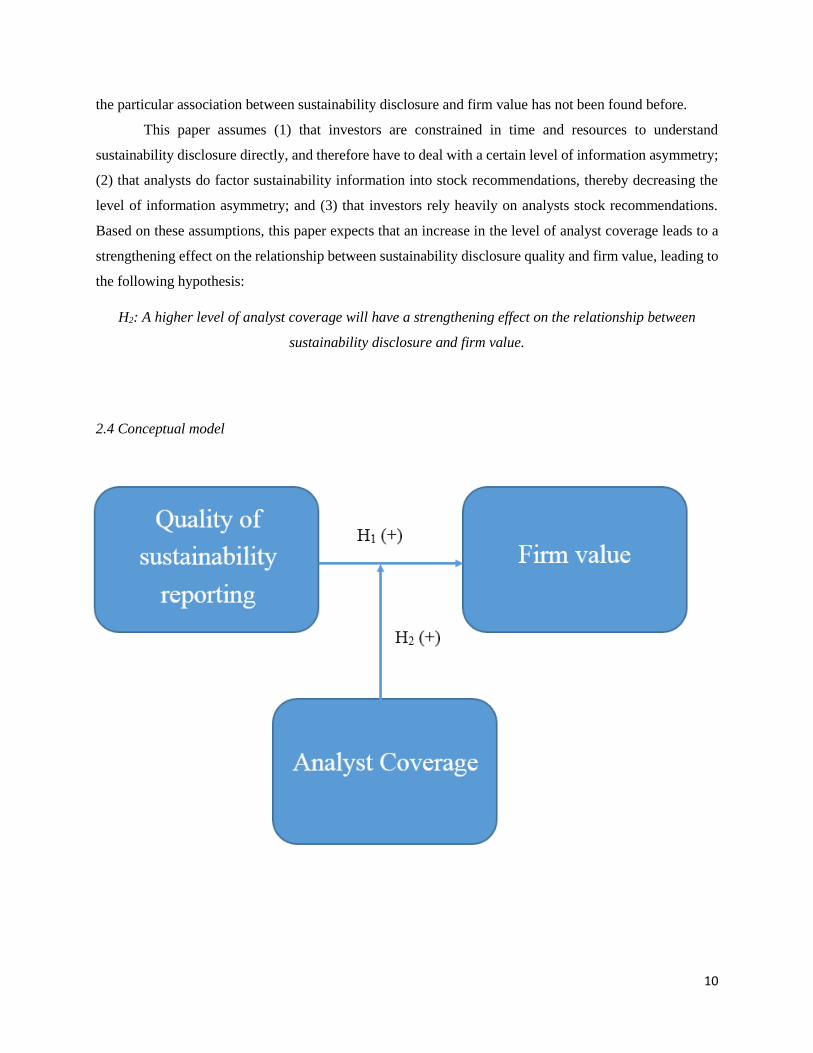
H1: A higher quality of sustainability disclosure is positively associated with firm value.
2.3 Analyst coverage
As mentioned before, previous research found that sustainability disclosure is relevant in terms of value
(Clarkson et al, 2013; Dhaliwal et al., 2012). However, these studies did not find the particular association
between sustainability disclosure and firm value. A reason for this lack of association in their findings could
be that these studies do not take the role of analysts in this relationship into account.
Despite the presence of information about sustainability performance and the availability of
corporate sustainability disclosures of many organizations, such information comes in enormous amounts
and is too complex to be directly understood by general investors (Luo et al., 2015). This is due to the fact
that most general investors are not certified as industry experts and are regularly constrained by time and
resources (Fombrun et al., 2000). This means that not all information that is available for general investors
can be incorporated into firm value automatically (Godfrey et al., 2009).
Certified security experts, such as security analysts, are skilled at obtaining information that is not
freely available for general investors. This makes them better able to assess the value relevance of
sustainability disclosures and the quality thereof (Ivkovic & Jegadeesh, 2004). In addition, analysts invest
a great deal of their time to corporate sustainability performance and disclosure, and they do factor this
information into stock recommendations (Luo et al., 2015). In this way analyst can reduce the information
asymmetry that is existent in the relationship between sustainability disclosures and general investors.
Because investors rely heavily on analyst recommendations (Barber et al., 2001; Womack, 1996),
this paper suggests that the relationship between the quality of sustainability disclosure and firm value will
be moderated by analyst coverage. This paper suggests that because general investors base their investment
decisions on the recommendations of analysts, analysts have to viewed as a moderator in the relationship
between sustainability disclosure and firm value. This insight, could provide a potential explanation why
10
the particular association between sustainability disclosure and firm value has not been found before.
This paper assumes (1) that investors are constrained in time and resources to understand
sustainability disclosure directly, and therefore have to deal with a certain level of information asymmetry;
(2) that analysts do factor sustainability information into stock recommendations, thereby decreasing the
level of information asymmetry; and (3) that investors rely heavily on analysts stock recommendations.
Based on these assumptions, this paper expects that an increase in the level of analyst coverage leads to a
strengthening effect on the relationship between sustainability disclosure quality and firm value, leading to
the following hypothesis:
H2: A higher level of analyst coverage will have a strengthening effect on the relationship between
sustainability disclosure and firm value.
2.4 Conceptual model
11
3 Research method
3.1 Data collection
In order to test the hypotheses, data is gathered from 60 Dutch listed firms, of which information is given
in the Sustainability Disclosure Database (SSD) of the Global Reporting Initiative (GRI) or in the
Transparency Benchmark (TB). By gathering data that covers a period of 5 years (2012-2016), the dataset
contains 300 observations. The choice for Dutch firms is made because the Netherlands is one of the most
progressive countries concerned with sustainability issues. This makes the Netherlands a well suited
country to measure the influence of sustainability disclosure quality on firm value. The headquarters of
both the GRI as the TB are located in the Netherlands (Global Reporting Initiative, 2004; Transparency
Benchmark, 2016). The GRI settled in the Netherlands, because it would be the best environment for
engaging the network and executing the work plan (Global Reporting Initiative, 2004). In addition, the rank
of the Netherlands on the Country Sustainability Ranking is 6th out of 62 companies worldwide in 2016
(RobecoSam AG, 2016). These factors combined make the Netherlands a suitable country for the data
collection (RobecoSam AG, 2016). To measure the quality of the sustainability disclosures, data from both
the TB as the SSD are used.
This thesis investigated CSR reports from 2012 as starting year to 2016 as final year. This
timeframe is chosen because this is the most recent data available. The CSR reports do have an assessment
in the TB or the SSD database. To measure firm value this thesis used five different measures, because it is
unlikely that all influence of the quality of sustainability disclosure could be captured in one single measure
(Braam & Poutsma, 2015). The five measures that are obtained through the databases of Orbis and Thomson
One are earnings per share (EPS), Tobin’s Q, dividend yield, return on assets (ROA), and price/equity ratio
(P/E Ratio), and are based on former literature (Braam & Poutsma, 2015; Villalonga & Amit, 2006; Chong
2007). To measure analyst coverage the i/b/e/s database is used. For every year the average number of
analyst recommendations are calculated manually. Further, control variables are obtained through Orbis
and Thomson One, and are based on prior literature (Hummel & Schlick 2016; Luo et al., 2015; Dhaliwal
et al., 2012)
Table 1 shows the number of company-year observations for every sector. The largest industry
group is manufacturing with 115 company-year observations. The second largest industry is Finance,
insurance & Real estate including 70 company year observation. The smallest industries are mining and
construction with 15 company-year observations. The sector categories are based on Standard Industrial
Classification (SIC) codes, which are assigned by the U.S. government to identify the primary business of
a company (SIC, n.d).

12
Number of company-year observations
Sector Total year
2012 2013 2014 2015 2016
Mining 15 3 3 3 3 3
Construction 15 3 3 3 3 3
Manufacturing 115 23 23 23 23 23
Transportation & public utilities 30 6 6 6 6 6
Trade 20 4 4 4 4 4
Finance, insurance & real estate 70 14 14 14 14 14
Services 35 7 7 7 7 7
300 60 60 60 60 60
Table 1: Summary statistics – Sector (2012-2016)
3.2 Variable measurement
3.2.1 Dependent Variable: Firm value
To measure firm value this thesis used five different measures, because it is unlikely that all influence of
the quality of sustainability disclosure could be captured in one single measure (Braam & Poutsma, 2015).
The five measures that are obtained through the databases of Orbis and Thomson One are earnings per share
(EPS), Tobin’s Q, dividend yield, return on assets (ROA), and price/equity ratio (P/E Ratio), and are based
on former literature (Braam & Poutsma, 2015; Villalonga & Amit, 2006; Chong 2007). The five measures
of firm value can be classified into two groups, which are accounting and market-based performance
indicators and market based indicators. The accounting and market-based performance indicators are EPS,
Tobin’s Q, ROA and PE ratio. The market based indicator that is used is dividend yield. The difference in
these measures is that with accounting and market-based performance indicators accounting measures can
be more directly influenced by top management and employees, where on the other hand market-based
measures are commonly affected by factors outside the direct control of top management and employees
(Braam & Poutsma, 2015; Van der Laan et al. 2010).
The first measure earnings per share is calculated as earnings divided by total number of shares
outstanding. The second measure is Tobin’s Q which is calculated by dividing market capitalization by
total assets. The third measure dividend yield is defined as annual dividends per year per share divided by
price per share times 100%. The fourth measure ROA is calculated as net income divided by total assets
times 100%. The final measure P/E ratio is defined as market value per share divided by earnings per share.
3.2.2 Independent variable: Quality of sustainability reporting
To determine the quality of firms’ CSR reports two different measures are used. First, thesis used the score
on the TB as an indicator for the quality of CSR reports. The calculation and definition of this score will be
elaborated below. Additionally, the quality of CSR reports is measured by the applicability of several

13
guidelines. These guidelines combined are more extensive as a measure of quality of CSR reporting,
involving more social, environmental, and economical aspects, than when only one of these guidelines was
used. Dummy variables are developed to indicate whether the guidelines are applicable to the respective
CSR report, which is given a score of zero when not applicable, and a score of one when the guidelines are
applicable. A compound measure is created that measures the quality of CSR reporting on a more elaborate
level.
3.2.2.1 Transparency Benchmark
The TB is performed each year and provides the Ministry of Economic Affairs in the Netherlands insight
into the way in which Dutch companies report about their CSR activities. This research is performed on
qualitative and quantitative development of corporate social reporting among the largest companies in the
Netherlands. To qualify for participation in the Transparency Benchmark, a company has to be AEX or
AMX-listed and/or has to be among the 500 largest Dutch companies that are obliged to follow Directive
400 of the Dutch Accounting Standards Board (DASB). Businesses that are not obliged to follow Directive
400 of the DASB can participate on voluntary base (Transparency Benchmark, 2016).
Companies that are part of the regular research group and have an annual report that is publicly
accessible are requested to submit a self-assessment. Based on the questionnaire that is included within the
self-assessment tool developed by the Ministry of Economic Affairs, the participating companies are able
to evaluate themselves on their CSR performance. After the draft scores have been set, companies can
comment on the score by using a tool, named e-tool. After this round of commentary, the external audit
company will handle the comments and final scores will be determined by the ministry of Economic Affairs.
This means that the final score of a company on the TB is the result of the self-assessment, the external
auditor’s analysis of the response on the questionnaire, and the final scores by the Ministry of Economic
Affairs (Transparency Benchmark, 2016).
The final score consists out of 2 parts, the Content-oriented framework of standards and the quality-
oriented framework of standards. For both parts a score of 100 can be obtained, which makes the maximum
achievable score 200. These parts are divided in eight topics and these topics are under divided in subtopics.
The eight topics are for the content-oriented framework of standards: (1) Company and Business model,
(2) Policy and Results, and (3) Management approach, and for the quality-oriented framework of standards:
(4) Relevance, (5) Clearness, (6) Reliability, (7) Responsiveness, and (8) Coherence. These criteria for the
final score on the TB will be illustrated by figure 1.
The TB database consists partly of firms that are being part of the research group, but do have a
score of zero on the TB. This score of zero can be due to several reasons. Firstly, reports that are not free
of charge and not publicly available get a score of zero. Secondly, the report should be released timely.
When the report is not released in time the report will get a score of zero on the TB. This also applies for

14
firms that have participated on voluntary base in the year before. Lastly, when a Dutch firm is part of a
group that reports on group level, but did not mention this in the report of the Dutch entity this firm is
rewarded with a score of zero (Ministerie van Economische Zaken, 2016). Because it cannot be known for
what reason a firm is rewarded with a score of zero on the TB, firms with a score of zero are left out of the
database.
Figure 1: Criteria for the final score on the Transparency Benchmark (Ministerie van Economische Zaken, 2017)
3.2.2.2 Sustainability Disclosure Database of the Global Reporting Initiative
GRI is an international independent organization that helps businesses, governments and other
organizations understand and communicate the impact of business on critical sustainability issues such as
climate change, human rights, corruption and many others. Their vision is to create a future where
sustainability is integral to every organization’s decision making process. Their mission is to empower

15
decision makers everywhere, through their sustainability standards and multi-stakeholder network, to take
action towards a more sustainable economy and world (Global Reporting Initiative, 2016).
One of the activities of the GRI is managing a large sustainability disclosure database (SSD). This
advanced online application is the outcome of years of data collection by GRI. Database profiles give an
overview of organizations and their reports, making sustainability information easily and freely accessible
to everyone. The SSD also provides information about the quality of CSR reports, giving information about
the applicability of general and assurance guidelines (Global Reporting Initiative, 2016). These measures
of quality will be elaborated below. All the guidelines together create a more extensive measure of quality
CSR disclosure. For every quality measure or guideline a dummy variable is created. CSR reports that are
applicable to the guideline will be rewarded with a score of 1, and CSR reports that are not applicable to
the guideline will be rewarded with a score of 0. In addition, this thesis will create a combined measure of
all guidelines to provide an overall score on the quality of CSR for every CSR report. The guidelines are
developed by significant global institutions such as the United Nations, International Organization for
Standardization and the International Finance Corporation. In addition, these corporations cooperated to
harmonize the international guidelines and the comparability between the different guidelines (Jarvie-
Eggart, 2015). The five different CSR reporting guidelines will be elaborated below.
Carbon Disclosure Project (CDP)
The CDP is a reporting system that focuses on environmental issues. The climate Disclosure Standards
Board (CDSB) wanted to develop a reporting system that helps to measure and to disclose about
Greenhouse Gas Emissions, climate change risk and water strategies. The main focus of this reporting
system is on how firms use natural resources and what the impact of this use is on the environment. In
addition it helps organizations in decision making and strategy on CSR. In short, the main focus of the CDP
is mostly protecting the environment and reducing climate change. In addition, the CDP emphasizes the
importance of transparency regarding environmental impact and performance (CDP Worldwide, 2016).
International Finance Corporation (IFC) Performance Standards
The IFC is a member of the World Bank Group and is the largest global development institution that is
focused exclusively on the private sector in developing countries. The IFC evaluates their clients’
environmental, social and governance practices. The IFC evaluates those responsibilities according to their
sustainability framework, which includes the Performance Standards (IFC, 2016)
OECD Guidelines
The OECD Guidelines for Multinational Enterprises are recommendations that are addressed by
governments to multinational firms operating in adhering countries. These guidelines provide non-binding

16
principles and standards for responsible business conduct in a global context consistent with applicable
laws and internationally recognized standards. The Guidelines aim to encourage positive contributions by
firms to economic, environmental and social progress worldwide (OECD, 2011).
United Nations Global Compact (UNGC)
The UNGC aims to mobilize a global movement of sustainable firms and stakeholders to create a more
sustainable world. To make this happen the UNGC supports companies to do business responsibly by
aligning their strategies and operations with ten principles on human rights, labor, environment and anti-
corruption. In addition they support firms to take strategic action to improve broader societal goals, such as
the UNGC goals, with an accent on collaboration and innovation. Companies can join the UNGC and once
they are member of the UNGC they have to act according to their principles. In addition, firms need to
describe through their strategy and vision how they will implement the principles in their business, but also
how they support other UN goals (UNGC, 2017).
International Organization for Standardization (ISO)
The ISO 26000 is an international guideline for the implementation of sustainable entrepreneurship in an
organization. It provides firms with a normative framework to determine their own social responsibilities
and comes with advices regarding the structural implementation of CSR policy. The ISO 26000 provides
guidance on how businesses and organizations can operate in a socially responsible way. This includes
acting in an ethical and transparent way that contributes to the health and welfare of society. The basic idea
of the ISO 26000 is that an organization from a basic attitude, together with its environment, decides to
work on certain social and environmental topics. The aim is that firms will translate the principles into
effective actions for society (ISO, 2010).
Composite measure of CSR reporting guidelines
An additional measure is created to reflect the applicability of all of the before mentioned guidelines. Every
company is rewarded with 1 point for every guideline the company is applicable to in a certain year. This
means that the score on the composite measure for every company can range from 0 to 5 in a certain year.
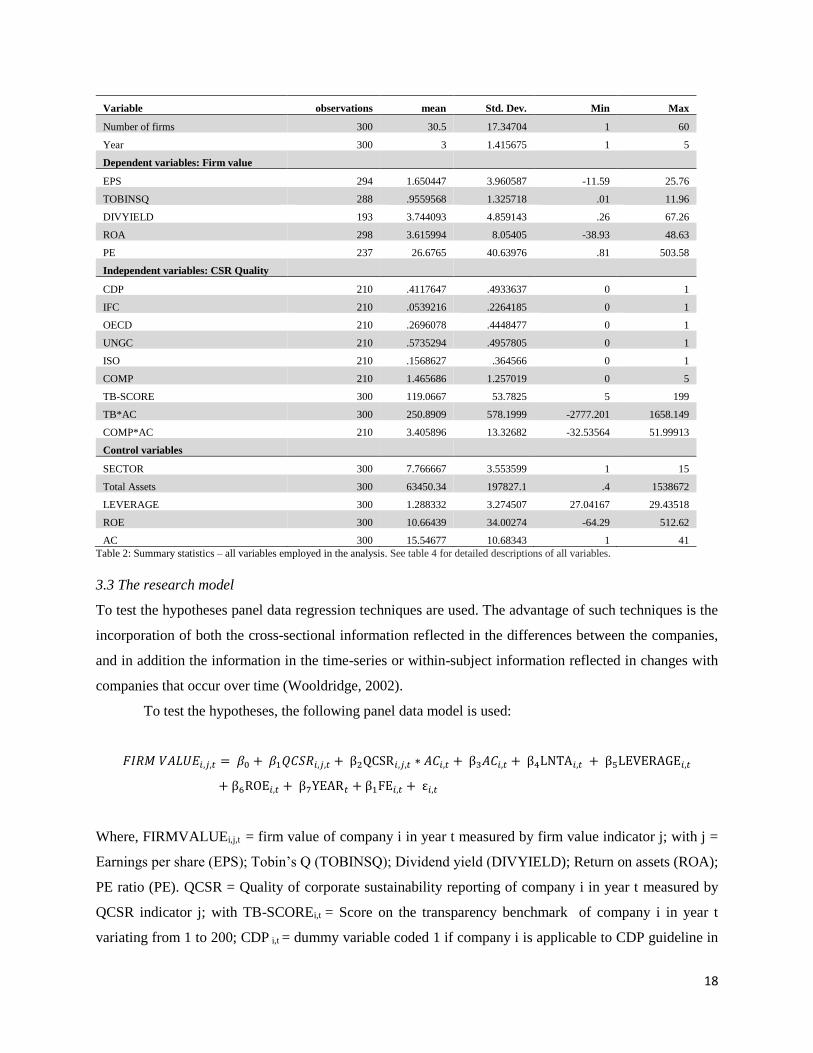
Table 2 shows the summary statistics of all variables used in the analysis. In this table it can be seen that
UNGC is with 57% the most applicable guideline in the sustainability reports used in the analysis. The
other largely applied guideline is CDP with 41%. The least applicable guideline with 5% is IFC.

17
3.2.3 Independent variable: Interaction effects
To measure analyst coverage the i/b/e/s database is used. For every year the average number of analyst
recommendations are calculated manually. The variables in the interaction effects TB*AC and COMP*AC
are centered before creating the interaction effect. This results in shifting the scale over, but the units are
retained. The effect of this centering is that the interaction effect and the dependent variable will remain the
same. However, the interpretation of the incept does change. The intercept will now define the pure
intercept for the interaction effect when all predictors do have the value of zero.
3.2.4 Control variables
Based on former literature, five control variables which are associated with firm value are included in the
model. (Braam & Poutsma, 2015; Hummel & Schlick, 2016; Dhaliwal et al., 2012; Luo et al., 2015; Chong
2007). The model contains five control variables, which are sector, a natural logarithm of total assets,
leverage, return on equity and analyst coverage. The sector dummy variable is added to control for sector
effects. Organizations are categorized based on the categories that are given by the TB. A natural logarithm
for assets is used as a proxy for the size of the organization (Braam & Poutsma, 2015). We also include the
financial leverage of a company as a proxy for the needs of a company’s creditors. Financial leverage is
measured as a firm’s average total assets divided by the firm’s average total equity (Hummel & Schlick).
It is rational to assume that the monitoring demand for information by creditors of an organization increases
with leverage (Branco & Rodrigues, 2008; Clarkson et al. 2011). In addition, capital structure is claimed to
have an effect on firm value. Therefore, it is needed to be controlled for leverage in the model (Masulis,
1983). Because an interaction effect with analyst coverage is included in the model, analyst coverage as a
single variable has to be included in the model too. It is reasonable to assume that analyst coverage will
have an effect on firm value, because investors will have relatively more access to information about a
certain organization (Luo et al., 2015). Summary statistics for all variables can be found in table 2.
18
Variable observations mean Std. Dev. Min Max
Number of firms 300 30.5 17.34704 1 60
Year 300 3 1.415675 1 5
Dependent variables: Firm value
EPS 294 1.650447 3.960587 -11.59 25.76
TOBINSQ 288 .9559568 1.325718 .01 11.96
DIVYIELD 193 3.744093 4.859143 .26 67.26
ROA 298 3.615994 8.05405 -38.93 48.63
PE 237 26.6765 40.63976 .81 503.58
Independent variables: CSR Quality
CDP 210 .4117647 .4933637 0 1
IFC 210 .0539216 .2264185 0 1
OECD 210 .2696078 .4448477 0 1
UNGC 210 .5735294 .4957805 0 1
ISO 210 .1568627 .364566 0 1
COMP 210 1.465686 1.257019 0 5
TB-SCORE 300 119.0667 53.7825 5 199
TB*AC 300 250.8909 578.1999 -2777.201 1658.149
COMP*AC 210 3.405896 13.32682 -32.53564 51.99913
Control variables
SECTOR 300 7.766667 3.553599 1 15
Total Assets 300 63450.34 197827.1 .4 1538672
LEVERAGE 300 1.288332 3.274507 27.04167 29.43518
ROE 300 10.66439 34.00274 -64.29 512.62
AC 300 15.54677 10.68343 1 41
Table 2: Summary statistics – all variables employed in the analysis. See table 4 for detailed descriptions of all variables.
3.3 The research model
To test the hypotheses panel data regression techniques are used. The advantage of such techniques is the
incorporation of both the cross-sectional information reflected in the differences between the companies,
and in addition the information in the time-series or within-subject information reflected in changes with
companies that occur over time (Wooldridge, 2002).
To test the hypotheses, the following panel data model is used:
𝐹𝐼𝑅𝑀 𝑉𝐴𝐿𝑈𝐸𝑖,𝑗,𝑡 = 𝛽0 + 𝛽1𝑄𝐶𝑆𝑅𝑖,𝑗,𝑡 + β2QCSR𝑖,𝑗,𝑡 ∗ 𝐴𝐶𝑖,𝑡 + β3𝐴𝐶𝑖,𝑡 + β4LNTA𝑖,𝑡 + β5LEVERAGE𝑖,𝑡
+ β6ROE𝑖,𝑡 + β7YEAR𝑡 + β1FE𝑖,𝑡 + ε𝑖,𝑡
Where, FIRMVALUEi,j,t = firm value of company i in year t measured by firm value indicator j; with j =
Earnings per share (EPS); Tobin’s Q (TOBINSQ); Dividend yield (DIVYIELD); Return on assets (ROA);
PE ratio (PE). QCSR = Quality of corporate sustainability reporting of company i in year t measured by
QCSR indicator j; with TB-SCOREi,t = Score on the transparency benchmark of company i in year t
variating from 1 to 200; CDP i,t = dummy variable coded 1 if company i is applicable to CDP guideline in
19
year t; IFC i,t = dummy variable coded 1 if company i is applicable to IFC guideline in year t; OECD i,t =
dummy variable coded 1 if company i is applicable to OECD guideline in year t; UNGC i,t = dummy variable
coded 1 if company i is applicable to UNGC guideline in year t; ISO i,t = dummy variable coded 1 if company
i is applicable to ISO guideline in year t; COMP i,t = combined measure of five guidelines resulting in a
score from 1-5, awarded 1 point for every guideline the company i is applicable to in year t; AC i,t = average
analyst coverage for company i in year t; LNTA i,t = company size measured by its natural logarithm of
total assets of company i in year t; LEVERAGE i,t = leverage of company i in year t; ROE i,t = return on
assets of company i in year t; YEAR i,t = a vector of year dummies; FE i,t = fixed effect of company i in year
t with a fixed component that is a function of the firm fixed effect and time, making the model a fixed slope
model.
To test the hypotheses we estimate models including both the direct effects of sustainability
reporting quality and a different regression including the interaction effects. For every five measures of
firm value two regressions have to be performed. One including the only direct effects and one with the
interaction effects included. This means 10 different regression analyses will be performed. To compute
the interaction terms a centered version of the variables is created. Therefore, the main effect can be
interpreted as the average effect. All continuous variables are winsorized at the 1% and 99% percentiles of
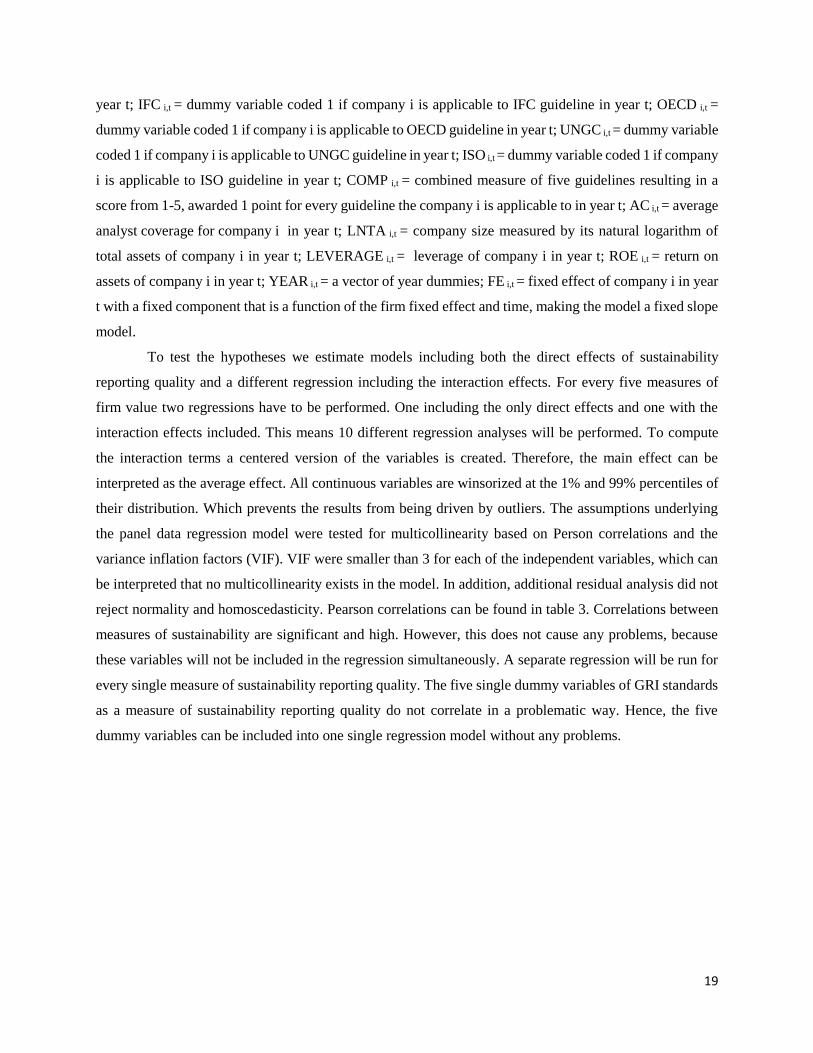
their distribution. Which prevents the results from being driven by outliers. The assumptions underlying
the panel data regression model were tested for multicollinearity based on Person correlations and the
variance inflation factors (VIF). VIF were smaller than 3 for each of the independent variables, which can
be interpreted that no multicollinearity exists in the model. In addition, additional residual analysis did not
reject normality and homoscedasticity. Pearson correlations can be found in table 3. Correlations between
measures of sustainability are significant and high. However, this does not cause any problems, because
these variables will not be included in the regression simultaneously. A separate regression will be run for
every single measure of sustainability reporting quality. The five single dummy variables of GRI standards
as a measure of sustainability reporting quality do not correlate in a problematic way. Hence, the five
dummy variables can be included into one single regression model without any problems.

20
Table 3: Pearson correlations. *** and ** indicate statistical significance at the 1% and 5% level. Significant values above 0.5 are bold in type. See table 4 for detailed descriptions of all variables.

21
Variable name Proxy Measurement
Dependent variables
EPS . Firm value Earnings divided by total number of shares outstanding
TOBINSQ Firm value Market capitalization divided by total assets.
DIVYIELD Firm value
Annual dividends per year per share divided by price per
share times 100%
ROA Firm value Net income divided by total assets times 100%
PE Firm value Market value per share divided by earnings per share
Independent variable
TB-SCORE
Sustainability
reporting quality. Score on Transparency benchmark ranging from 1-200.
CDP
Sustainability
reporting quality
Dummy variable rewarded with a score of 1 when applicable
to CDP guideline.
IFC
Sustainability
reporting quality
Dummy variable rewarded with a score of 1 when applicable
to IFC guideline.
OECD
Sustainability
reporting quality
Dummy variable rewarded with a score of 1 when applicable
to OECD guideline.
UNGC
Sustainability
reporting quality
Dummy variable rewarded with a score of 1 when applicable
to UNGC guideline.
ISO
Sustainability
reporting quality
Dummy variable rewarded with a score of 1 when applicable
to ISO guideline.
COMPOSITE
Sustainability
reporting quality
Compound measure generated by adding up the scores of the
dummy variables for Sustainability reporting quality.
Control variables
SECTOR Sector Sector dummy.
LNTA Firm size Natural logarithm of total assets
LEVERAGE Leverage
Firm’s average total assets divided by the firm’s average
total equity.
ROE Profitability Net income divided by total assets x 100%.
AC Analyst coverage Average Analyst coverage
Table 4. Description and overview of variables

22
4 Results
The results of the regression analyses for the hypothesized relationships between firm value and
sustainability reporting quality, analyst coverage, firm size, year and fixed controls are reported in table 5.
Panel A of table 5 shows significant associations for several measures of sustainability reporting
quality on firm value. H1 predicted a positive association between sustainability disclosure and firm value.
However, the associations that are found in panel A of table 5 indicate a negative association between
sustainability disclosure and firm value. This finding indicates that companies with a higher level of
sustainability disclosure quality are more likely to have a lower level of firm value. In all other panels in
table 5 no significant associations between the quality of sustainability reporting and firm value are found.
A possible explanation for the negative significant results in panel A could be that investors observe that
sustainable reporting and performance is used for window dressing of book values and financial
performance. In addition investors could perceive that sustainable responsible activities are being made at
the expense of increased profits. And overall the stock market could be more short-term oriented than this
thesis expected it to be (Hassel et. al., 2005). The insignificant results for H1 In panel B-E are in line with
the findings of Clarkson et al. (2013), Dhaliwal et al. (2012) and Jacobs et al. (2010). The results indicate
that H1 is not supported. The results indicate that a company with a higher level of sustainability disclosure
quality is more likely to have a lower firm value.
H2 predicts a higher level of analyst coverage will have a strengthening effect on the relationship
between sustainability disclosure and firm value. Panel B and D show significant and negative associations
for the interaction effect TB*AC and firm value. The score on the transparency benchmark had no
significant association with firm value in both panel B and D in the regression model 1 without interaction
effect. When testing for the interaction effect in regression model 2 with interaction effect, the interaction
effect indicates that there is an association with firm value. This could imply that analysts do have a
strengthening effect on the relationship between sustainability reporting quality and firm value. For panel
A, C and E such a significant strengthening effect on the relationship cannot be found. This means that H2
is partially supported.
Analyst coverage has a negative but insignificant association in four out of five regression panels.
However, the association between analyst coverage and Tobin’s Q in panel B is positive and significant.
That would imply that a company with a higher level of analyst coverage is more likely to have a higher
level of firm value. Since four out of five regression panels show an insignificant association between
analyst coverage and firm value and point in the opposite direction, it does not seem reasonable to assume
that a general association can be found. Control variable ROE is positively and significantly associated with
EPS and ROA. This makes sense because they are expected to move in the same direction. Other control
variables do not have a significant association with firm value.

23
Panel A: Dependent variable Earnings per share
𝐹𝐼𝑅𝑀 𝑉𝐴𝐿𝑈𝐸𝑖,𝑗,𝑡 = 𝛽0 + 𝛽1𝑄𝐶𝑆𝑅𝑖,𝑗,𝑡 + β2QCSR𝑖,𝑗,𝑡 ∗ 𝐴𝐶𝑖,𝑡 + β3𝐴𝐶𝑖,𝑡 + β4LNTA𝑖,𝑡 +
β5LEVERAGE𝑖,𝑡 + β6ROE𝑖,𝑡 + β7YEAR𝑡 + β1FE𝑖,𝑡 + ε𝑖,𝑡
QCSR Indicators
TB-SCORE Composite measure of GRI Standard
Single measure of GRI standards
A1 A2 B1 B2 C1
N 292 292 203 203 203
Firm indicatorsa Included Included Included Included Included
Sector Indicators Excluded Excluded Excluded Excluded Excluded
Year indicatorsa Included Included Included Included Included
TB-SCORE -.0027539 -.0031701
(-0.37) (-0.42)
CDP -1.066176**
(-2.22)
IFC -.0334015
(-0.03)
OECD .0059202
(0.01)
UNGC -1.09062**
(-2.20)
ISO -.1705574
(-0.30)
COMPOSITE MEASURE -.5706376*** -.4717431**
(-2.89) (-2.04)
ANALYST COVERAGE .0394794 .0267512
(0.51) (0.32)
TB*AC -.0003406
(-0.56)
COMP*AC -.0165691
(-0.81)
LNTA .1728166 .1934806 .043354 (.072123) .0135853
(0.75) (0.84) (0.15) (0.25) (0.05)
LEVERAGE -.1584871 -.165856 -.1330555 -.1398627 -.1469021
(-1.42) (-1.47) (-1.14) (-1.18) (-1.24)
ROE .0198865*** .0196214*** .0191248*** .0193785*** .0185351***
(4.72) (4.63) (4.44) (4.44) (4.27)
INTERCEPT -.3279287 -.39484 1.01544 .546583 1.5571
(-0.15) (-0.18) (0.38) (0.20) (0.57
*,** and *** indicate statistical significance at the 10%, 5% and 1% level. 1 = regression model without interaction effects. 2 = regression
model with interaction effects. See table 4 for detailed descriptions of all variables. Significant coefficients are in bold type. a Results on firm effects, year effects and fixed effects are not reported for parsimony

24
Panel B: Dependent variable Tobin’s Q
𝐹𝐼𝑅𝑀 𝑉𝐴𝐿𝑈𝐸𝑖,𝑗,𝑡 = 𝛽0 + 𝛽1𝑄𝐶𝑆𝑅𝑖,𝑗,𝑡 + β2QCSR𝑖,𝑗,𝑡 ∗ 𝐴𝐶𝑖,𝑡 + β3𝐴𝐶𝑖,𝑡 + β4LNTA𝑖,𝑡 +
β5LEVERAGE𝑖,𝑡 + β6ROE𝑖,𝑡 + β7YEAR𝑡 + β1FE𝑖,𝑡 + ε𝑖,𝑡
QCSR Indicators
TB-SCORE Composite measure of GRI Standard
Single measure of GRI standards
A1 A2 B1 B2 C1
N 292 292 203 203 203
Firm indicatorsa Included Included Included Included Included
Sector Indicators Excluded Excluded Excluded Excluded Excluded
Year indicatorsa Included Included Included Included Included
TB-SCORE -.007575 -.0009885
(-0.66) (-0.88)
CDP -.0524527
(-0.63)
IFC .0684913
(0.44)
OECD -.0556608
(-0.55)
UNGC .1261081
(1.47)
ISO -.0022165
(-0.02)
COMPOSITE MEASURE .006765 .021911
(0.20) (0.56)
ANALYST COVERAGE .0292213** .0336277**
(2.48) (2.36)
TB*AC -.0002037**
(-2.21)
COMP*AC -.0016753
(-0.48)
LNTA -.0154414 -.0016441 -.0045261 .0068064 -.0007674
(-0.43) (-0.05) (-0.09) (0.14) (-0.02)
LEVERAGE -.0175834 -.0229842 -.015456 -.02311513 -.0119488
(-1.02) (-1.35) (-0.77) (-1.15) (-0.58)
ROE .0011833* 0.001009 .0010995 .0009913 .0011457
(1.81) (1.56) (1.48) (1.34) (1.53)
INTERCEPT .9485043*** .8872385*** .7159733 .4231367 .6452723
(2.81) (2.66) (1.55) (0.89) (1.38)
*,** and *** indicate statistical significance at the 10%, 5% and 1% level. 1 = regression model without interaction effects. 2 = regression
model with interaction effects. See table 4 for detailed descriptions of all variables. Significant coefficients are in bold type. a Results on firm effects, year effects and fixed effects are not reported for parsimony

25
Panel C: Dependent variable Dividend Yield
𝐹𝐼𝑅𝑀 𝑉𝐴𝐿𝑈𝐸𝑖,𝑗,𝑡 = 𝛽0 + 𝛽1𝑄𝐶𝑆𝑅𝑖,𝑗,𝑡 + β2QCSR𝑖,𝑗,𝑡 ∗ 𝐴𝐶𝑖,𝑡 + β3𝐴𝐶𝑖,𝑡 + β4LNTA𝑖,𝑡 +
β5LEVERAGE𝑖,𝑡 + β6ROE𝑖,𝑡 + β7YEAR𝑡 + β1FE𝑖,𝑡 + ε𝑖,𝑡
QCSR Indicators
TB-SCORE Composite measure of GRI Standard
Single measure of GRI standards
A1 A2 B1 B2 C1
N 292 292 203 203 203
Firm indicatorsa Included Included Included Included Included
Sector Indicators Excluded Excluded Excluded Excluded Excluded
Year indicatorsa Included Included Included Included Included
TB-SCORE -.0036948 -.0064109
(-0.27) (-0.47)
CDP -.7823241
(-0.76)
IFC -2.032103
(-0.87)
OECD .4049028
(0.32)
UNGC -.4589275
(-0.43)
ISO .1955559
(0.16)
COMPOSITE MEASURE -.3148242 -.3347797
(-0.75) (-0.68)
ANALYST COVERAGE -.1038586 -.1373745
(-0.73) (-0.77)
TB*AC -.0015029
(-1.36)
COMP*AC -.0005105
(-0.01)
LNTA .0495619 .0693499 -.017007 -.0537674 .001238
(0.12) (0.16) (-0.03) (-0.09) (0.01)
LEVERAGE .0108002 .0275425 .0044107 .0355165 .0093978
(0.05) (0.13) (0.02) (0.14) (0.04)
ROE -.0020966 -.0020831 -.0015229 -.0009166 -.0020112
(-0.27) (-0.27) (-0.17) (-0.10) (-0.22)
INTERCEPT 2.863064 3.620425 3.268448 4.350866 3.290898
(0.72) (0.90) (0.57) (0.73) (0.56)
*,** and *** indicate statistical significance at the 10%, 5% and 1% level. 1 = regression model without interaction effects. 2 = regression
model with interaction effects. See table 4 for detailed descriptions of all variables. Significant coefficients are in bold type. a Results on firm effects, year effects and fixed effects are not reported for parsimony

26
Panel D: Dependent variable Return on Assets
𝐹𝐼𝑅𝑀 𝑉𝐴𝐿𝑈𝐸𝑖,𝑗,𝑡 = 𝛽0 + 𝛽1𝑄𝐶𝑆𝑅𝑖,𝑗,𝑡 + β2QCSR𝑖,𝑗,𝑡 ∗ 𝐴𝐶𝑖,𝑡 + β3𝐴𝐶𝑖,𝑡 + β4LNTA𝑖,𝑡 +
β5LEVERAGE𝑖,𝑡 + β6ROE𝑖,𝑡 + β7YEAR𝑡 + β1FE𝑖,𝑡 + ε𝑖,𝑡
QCSR Indicators
TB-SCORE Composite measure of GRI Standard
Single measure of GRI standards
A1 A2 B1 B2 C1
N 292 292 203 203 203
Firm indicatorsa Included Included Included Included Included
Sector Indicators Excluded Excluded Excluded Excluded Excluded
Year indicatorsa Included Included Included Included Included
TB-SCORE -.0247317 -.0299738
(-1.26) (-1.52)
CDP -.001564
(-0.01)
IFC 1.108413
(0.35)
OECD .5867237
(0.34)
UNGC -1.926821
(-1.32)
ISO -1.46286
(-0.86)
COMPOSITE MEASURE -.535636 -.6660934
(-0.93) (-0.99)
ANALYST COVERAGE -.0147432 -.0830887
(-0.07) (-0.34)
TB*AC -.0032707**
(-2.02)
COMP*AC .0204615
(0.34)
LNTA .3424803 .4397896 .3791073 .329945 .2654485
(0.56) (0.72) (0.46) (0.40) (0.32)
LEVERAGE -.2146319 -.2156237 -.1070858 -.0873376 -.1607033
(-0.72) (-0.72) (-0.31) (-0.25) (-0.46)
ROE .0403812*** .0395116*** .0380835*** .037987*** .0382077***
(3.59) (3.51) (3.02) (2.97) (2.99)
INTERCEPT 2.623753 3.472158 -.8664812 .1097833 .4763922
(0.45) (0.59) (-0.11) (0.01) (0.06)
*,** and *** indicate statistical significance at the 10%, 5% and 1% level. 1 = regression model without interaction effects. 2 = regression
model with interaction effects. See table 4 for detailed descriptions of all variables. Significant coefficients are in bold type. a Results on firm effects, year effects and fixed effects are not reported for parsimony

27
Panel E: Dependent variable Price Equity Ratio
𝐹𝐼𝑅𝑀 𝑉𝐴𝐿𝑈𝐸𝑖,𝑗,𝑡 = 𝛽0 + 𝛽1𝑄𝐶𝑆𝑅𝑖,𝑗,𝑡 + β2QCSR𝑖,𝑗,𝑡 ∗ 𝐴𝐶𝑖,𝑡 + β3𝐴𝐶𝑖,𝑡 + β4LNTA𝑖,𝑡 +
β5LEVERAGE𝑖,𝑡 + β6ROE𝑖,𝑡 + β7YEAR𝑡 + β1FE𝑖,𝑡 + ε𝑖,𝑡
QCSR Indicators
TB-SCORE Composite measure of GRI Standard
Single measure of GRI standards
A1 A2 B1 B2 C1
N 292 292 203 203 203
Firm indicatorsa Included Included Included Included Included
Sector Indicators Excluded Excluded Excluded Excluded Excluded
Year indicatorsa Included Included Included Included Included
TB-SCORE -.0273736 -.0287547
(-0.21) (-0.22)
CDP 2.113478
(0.22)
IFC -1.110457
(-0.05)
OECD -6.633491
(-0.56)
UNGC -11.15754
(-1.12)
ISO -.2242977
(-0.02)
COMPOSITE MEASURE -3.717587 -7.525826
(-0.94) (-1.65)
ANALYST COVERAGE -2.258934 -2.613077
(-1.67) (-1.57)
TB*AC .0036306
(0.34)
COMP*AC .591822
(1.46)
LNTA -5.926637 -6.618833* -7.142256 -8.621375 -7.267871
(-1.49) (-1.66) (-1.28) (-1.54) (-1.28)
LEVERAGE 1.499204 1.903367 1.842409 2.461153 1.615233
(0.77) (0.97) (0.79) (1.05) (0.68)
ROE .0084986 .0191453 .0357365 .0338527 .0312338
(0.12) (0.26) (0.42) (0.39) (0.36)
INTERCEPT 79.89047*** 87.56189*** 99.20186* 129.1046** 102.48*
(2.11) (2.29) (1.85) (2.34) (1.88)
*,** and *** indicate statistical significance at the 10%, 5% and 1% level. 1 = regression model without interaction effects. 2 = regression
model with interaction effects. See table 4 for detailed descriptions of all variables. Significant coefficients are in bold type. a Results on firm effects, year effects and fixed effects are not reported for parsimony
FIRMVALUEi,j,t = firm value of company i in year t measured by firm value indicator j;
with j = Earnings per share (EPS); Tobin’s Q (TOBINSQ); Dividend yield (DIV_Yield);

28
Return on assets (ROA); PE ratio (PE).
QCSRi,j,t = Quality of corporate sustainability reporting of company i in year t measured by QCSR
indicator j;
With j = TB-SCOREi,t = Score on the transparency benchmark of company i in year t variating from 1
to 200;
CDP i,t = dummy variable coded 1 if company i is applicable to CDP guideline in year t;
IFC i,t = dummy variable coded 1 if company i is applicable to IFC guideline in year t;
OECD i,t = dummy variable coded 1 if company i is applicable to OECD guideline in year t;
UNGC i,t = dummy variable coded 1 if company i is applicable to UNGC guideline in year t;
ISO i,t = dummy variable coded 1 if company i is applicable to ISO guideline in year t;
COMP i,t = combined measure of five guidelines resulting in a score from 1-5, awarded 1 point for
every guideline the company i is applicable to in year t;
AC i,t = average analyst coverage for company i in year t;
LNTA i,t = company size measured by its natural logarithm of total assets of company i in year t;
LEVERAGE i,t = leverage of company i in year t;
ROE i,t = return on assets of company i in year t;
YEAR i,t = a vector of year dummies;
FE i,t = fixed effect of company i in year t with a fixed component that is a function of the firm fixed
effect and time. Table 5: Regression models: panel data regression of firm value on the quality of sustainability reports, analyst coverage, firm size, year and fixed
controls

29
5 Conclusion and discussion
This thesis investigates the relationship between sustainability reporting and firm value and the moderating
effect of analysts coverage on this relationship for the period of 2012-2016, comprising 300 observations.
Based on the papers of Hummel and Schlick (2016), Clarkson, Richardson and Vasvari (2008) and
Dhaliwal, Radhakrishnan, Tsang and Yang (2012), this thesis focuses on the quality of sustainability
disclosure. Based on Luo et al. (2015), this study integrates the role of analyst in the relationship. The two
insights combined could lead to a solution for the mixed and insignificant results in previous research
investigating the relationship between sustainability reporting and firm value.
The results show mostly insignificant relationships between the quality of sustainability reporting
and firm value and the moderating effect of analyst coverage on this relationship. The significant results
regarding the relationship between the quality of sustainability reporting and firm value show a negative
and significant relationship. This results indicate that companies with a higher level of sustainability
disclosure quality are more likely to have a lower level of firm value. The relationship that has been found
is contradictory with H1 and it could be due to several reasons.
First, investors could observe that sustainable performance is used for window dressing of book
values and financial performance. Investors could also perceive that sustainable responsible activities are
made at the expense of increased profits, and because the market is short-term oriented, investors do not
take in mind the long-term sustainable information when making investment decisions (Hassel et al., 2005).
This would imply that sustainable information would lead to a lower firm value for firms that report about
sustainability issues.
Second, the insignificant results could be due to the modest sample size of this study. Because this
thesis only focused on Dutch listed companies and because some cases had to be deleted because they were
influential, the sample size is modest. Further research could investigate this particular relationship by
gathering a larger data sample and testing data from different countries.
Third, all companies in the data sample were covered by at least one analyst. This means that all
observations in the data sample are covered by analyst. It could be that the effect of analyst coverage is not
so much in the number of analysts, but rather in being covered or not. Further research could investigate
the effect of analyst coverage by including companies without analyst coverage in their data sample. This
would imply that a dummy variable is made for analyst coverage with a 1 for when at least one analyst is
covering the company, and a 0 for when no analyst are covering the company.
H2 is supported by the results in panel B and D. The results indicate that having a higher level of
analyst coverage leads to a strengthening effect on the relationship between sustainability disclosure quality
and firm value. This is in line with what this thesis expected based on the papers of Hummel & Schlick
(2016) and Luo et al. (2015). The mixed and insignificant results that the results show for most of the

30
variables are also found in other studies (Clarkson et al., 2013; Dhaliwal et al., 2012; Jacobs et al. 2010).
The main theoretical contribution of this thesis is that the results indicate that analyst coverage does
have an effect on the relationship between the quality of sustainability reporting and firm value. This thesis
is the first that analyses the role of analysts in the relationship between sustainability reporting quality and
firm value. In addition, this thesis could not support previous literature on the relationship between
sustainability reporting quality and firm value that expects a positive relationship (Hummel & Schlick,
2016; Clarkson et al., 2013). The results of this thesis suggest that there is a significant negative relationship
between sustainability reporting quality and firm value. However, this relationship becomes more clear and
significant when the level of analyst coverage is higher for a company that provides sustainability reports.
This is in line with the theoretical explanation of Luo et al. (2015) that states that investors are constrained
in time and resources to understand sustainability disclosure directly, and therefore have to deal with a
certain level of information asymmetry. This explains the mostly insignificant results that we find for H1
which indicates that an association between sustainability reporting quality and firm value cannot be found.
However, analysts do factor this sustainability information into stock recommendations, thereby decreasing
the level of information asymmetry for investors, while investors rely heavily on this analysts stock
recommendations (Luo et al., 2015). This could provide the theoretical explanation for the significant
results of the interaction effect in Panel B and D in table 5. Analysts will decrease the information
asymmetry for investors, which makes investors be able to value the quality of sustainability information
better and make investment decisions based on this information.
A limitation of this study is the small sample size as mentioned before. Due to the small sample
size results can be insignificant whereas they would be significant if a larger sample size had been used.
Further research should gather a larger sample size to increase the explanatory power of the model. In
addition, follow up research could focus on different countries to decrease the influence of one single
country in the regression analysis. Further research could also take actual sustainability performance into
account. A distinction can be made between high and low performing firms on sustainability issues, as well
as a distinction can be made between high and low quality of sustainability disclosures. The effect of the
quality of sustainability disclosure could become more clear when an interaction is made between actual
performance and disclosure quality.
Implications of this study are twofold. For top management, this study suggests that disclosing high
quality sustainability reports could be more harmful to the company as one might think. At the same time
it suggests that for firms with low analyst coverage the impact of sustainability disclosure is lower than for
firms with high analyst coverage. For investors, this study suggests that firms with a higher level of
sustainability disclosure quality and a higher level of analyst coverage do have a lower level of firm value.
Investors could make their investment decisions based on this information. Despite the growing attention

31
on sustainability issues and clear demands on this issues by consumers and investors, it cannot be concluded
that investors actually will punish firms with a lower level of sustainability disclosure quality. The question
that we can ask ourselves is: Do we really care about our future or do we consider short-term profits more
important?
32
Bibliography
Al-Tuwaijri, S. A., Christensen, T. E., & Hughes, K. E. (2004). The relations among environmental
disclosure, environmental performance, and economic performance: a simultaneous equations approach.
Accounting, organizations and society, 29(5), 447-471.
Ameer, R., & Othman, R. (2012). Sustainability practices and corporate financial performance: A study
based on the top global corporations. Journal of Business Ethics, 108(1), 61-79.
Barber, B., Lehavy, R., McNichols, M., & Trueman, B. (2001). Can investors profit from the prophets?
Security analyst recommendations and stock returns. The Journal of Finance, 56(2), 531-563.
Bewley, K., & Li, Y. (2000). Disclosure of environmental information by Canadian manufacturing
companies: a voluntary disclosure perspective. In Advances in Environmental Accounting & Management
(pp. 201-226). Emerald Group Publishing Limited.
Braam, G., & Poutsma, E. (2015). Broad-Based Financial Participation Plans and Their Impact on Financial
Performance: Evidence from a Dutch Longitudinal Panel. De Economist, 163(2), 177-202.
Branco, M. C., & Rodrigues, L. L. (2008). Factors influencing social responsibility disclosure by
Portuguese companies. Journal of Business Ethics, 83(4), 685-701.
CDP Worldwide. (2016). Catalyzing business and government action. Retrieved from cdp about us:
https://www.cdp.net/Documents/CDP-strategic-plan-2014-2016.pdf
Cho, C. H., Guidry, R. P., Hageman, A. M., & Patten, D. M. (2012). Do actions speak louder than words?
An empirical investigation of corporate environmental reputation. Accounting, Organizations and Society,
37(1), 14-25.
Cho, C. H., & Patten, D. M. (2007). The role of environmental disclosures as tools of legitimacy: A research
note. Accounting, organizations and society, 32(7), 639-647.
Chong, A. (2007). Investor protection and corporate governance: Firm-level evidence across Latin
America. Stanford University Press.
Clarkson, P. M., Li, Y., Richardson, G. D., & Vasvari, F. P. (2008). Revisiting the relation between
environmental performance and environmental disclosure: An empirical analysis. Accounting,
organizations and society, 33(4), 303-327.
Clarkson, P. M., Fang, X., Li, Y., & Richardson, G. (2013). The relevance of environmental disclosures:
Are such disclosures incrementally informative?. Journal of Accounting and Public Policy, 32(5), 410-431.

33
Clarkson, P. M., Overell, M. B., & Chapple, L. (2011). Environmental reporting and its relation to corporate
environmental performance. Abacus, 47(1), 27-60.
Cone Organizations. (2015). 2015 Communications/ebiquity global CSR study. Retrieved from
http://www.conecomm.com/2015-cone-communications-ebiquity-global-csr-study-pdf
Davis, K. (1973). The case for and against business assumption of social responsibilities. Academy of
Management journal, 16(2), 312-322.
Dhaliwal, D. S., Radhakrishnan, S., Tsang, A., & Yang, Y. G. (2012). Nonfinancial disclosure and analyst
forecast accuracy: International evidence on corporate social responsibility disclosure. The Accounting
Review, 87(3), 723-759.
Deegan, C. (2002). Introduction: The legitimising effect of social and environmental disclosures–a
theoretical foundation. Accounting, Auditing & Accountability Journal, 15(3), 282-311.
De Villiers, C., & Van Staden, C. J. (2006). Can less environmental disclosure have a legitimising effect?
Evidence from Africa. Accounting, Organizations and Society, 31(8), 763-781.
EY. (2016). A closer look at reporting criteria. Retrieved from:
https://www.transparantiebenchmark.nl/sites/transparantiebenchmark.nl/files/afbeeldingen/a_closer_look
_at_reporting_criteria.pdf
Fombrun, C. J., Gardberg, N. A., & Barnett, M. L. (2000). Opportunity platforms and safety nets: Corporate
citizenship and reputational risk. Business and society review, 105(1), 85-106.
Global Reporting Initiative. (2004). Building sustainability into the fabric of the Global Reporting Initiative
Global Reporting Initiative first sustainability report. Geraadpleegd van
https://www.globalreporting.org/resourcelibrary/GRI-Sustainability-Report-2003-2004.pdf
Godfrey, P. C., Merrill, C. B., & Hansen, J. M. (2009). The relationship between corporate social
responsibility and shareholder value: An empirical test of the risk management hypothesis. Strategic
management journal, 30(4), 425-445.
Hassel, L., Nilsson, H., & Nyquist, S. (2005). The value relevance of environmental performance. European
Accounting Review, 14(1), 41-61.
Hummel, K., & Schlick, C. (2016). The relationship between sustainability performance and sustainability
disclosure–Reconciling voluntary disclosure theory and legitimacy theory. Journal of Accounting and
Public Policy, 35(5), 455-476.

34
International Finance Corporation. (2016.). Performance Standards. Geraadpleegd van
http://www.ifc.org/wps/wcm/connect/Topics_Ext_Content/IFC_External_Corporate_Site/Sustainability-
At-IFC/Policies-Standards/Performance-Standards
ISO. (2010). ISO 26000 : 2010. Geraadpleegd van https://www.iso.org/obp/ui/#iso:std:iso:26000:ed-
1:v1:en
Ivković, Z., & Jegadeesh, N. (2004). The timing and value of forecast and recommendation revisions.
Journal of Financial Economics, 73(3), 433-463.
Jacobs, B. W., Singhal, V. R., & Subramanian, R. (2010). An empirical investigation of environmental
performance and the market value of the firm. Journal of Operations Management, 28(5), 430-441.
Jarvie-Eggart, M. E. (2015). The Global Reporting Initiative: Sustainability reporting for the mining and
metals sector. In M. E. Jarvie-Eggart (Ed.), Responsible Mining: Case
Leuz, C., & Wysocki, P. D. (2008). Economic consequences of financial reporting and disclosure
regulation: A review and suggestions for future research.
Li, Y., Richardson, G. D., & Thornton, D. B. (1997). Corporate disclosure of environmental liability
information: Theory and evidence. Contemporary Accounting Research, 14(3), 435-474.
Li, D., Zhao, Y., Sun, Y., & Yin, D. (2016). Corporate Environment Performance, Environmental
Information Disclosure and Financial Performance: Evidence from China. Human and Ecological Risk
Assessment: An International Journal.
Lourenço, I. C., Branco, M. C., Curto, J. D., & Eugénio, T. (2012). How does the market value corporate
sustainability performance?. Journal of business ethics, 108(4), 417-428.
Luo, X., Wang, H., Raithel, S., & Zheng, Q. (2015). Corporate social performance, analyst stock
recommendations, and firm future returns. Strategic Management Journal, 36(1), 123-136.
Masulis, R. W. (1983). The impact of capital structure change on firm value: Some estimates. The Journal
of Finance, 38(1), 107-126.
McWilliams, A. (2000). Corporate social responsibility. Wiley Encyclopedia of Management.
McWilliams, A., Siegel, D. S., & Wright, P. M. (2006). Corporate social responsibility: Strategic
implications. Journal of management studies, 43(1), 1-18.
Michelon, G. (2011). Sustainability disclosure and reputation: a comparative study. Corporate Reputation
Review, 14(2), 79-96.

35
Ministerie van Economische Zaken. (2017). Criteria Transparency Benchmark 2017. Geraadpleegd van
https://www.transparantiebenchmark.nl/sites/transparantiebenchmark.nl/files/afbeeldingen/transparency_
benchmark-_criteria_2017_english.pdf
Ministerie van Economische Zaken. (2016). Transparency Benchmark 2016. Geraadpleegd van
https://www.transparantiebenchmark.nl/sites/transparantiebenchmark.nl/files/afbeeldingen/rapport_transp
arantiebenchmark.pdf
Montabon, F., Sroufe, R., & Narasimhan, R. (2007). An examination of corporate reporting, environmental
management practices and firm performance. Journal of operations management, 25(5), 998-1014.
Montiel, I. (2008). Corporate social responsibility and corporate sustainability separate pasts, common
futures. Organization & Environment, 21(3), 245-269.
O’Donovan, G. (2002). Environmental disclosures in the annual report: Extending the applicability and
predictive power of legitimacy theory. Accounting, Auditing & Accountability Journal, 15(3), 344-371.
OECD. (2011). OECD Guidelines for Multinational Enterprises 2011 Edition. Geraadpleegd van
http://www.oecd.org/daf/inv/mne/48004323.pdf
Ostrom, E. (2009). A general framework for analyzing sustainability of social-ecological systems. Science,
325(5939), 419-422.
Patten, D. M. (2002). The relation between environmental performance and environmental disclosure: a
research note. Accounting, organizations and Society, 27(8), 763-773.
Porter, M. (1996). America’s green strategy. Business and the environment: a reader, 33.
RobecoSam AG. (2016). Country Sustainability Ranking. Geraadpleegd van
http://www.robecosam.com/en/sustainability-insights/about-sustainability/country-sustainability-
ranking/index.jsp#
Sethi, S. P. (1978). Advocacy advertising—the American experience. California Management Review,
21(1), 55-68.
SIC. (n.d.). What is a SIC code? Retrieved from http://siccode.com/en/pages/what-is-a-sic-code
Sobhani, F. A., Amran, A., & Zainuddin, Y. (2012). Sustainability disclosure in annual reports and
websites: a study of the banking industry in Bangladesh. Journal of Cleaner Production, 23(1), 75-85.
36
Suchman, M. C. (1995). Managing legitimacy: Strategic and institutional approaches. Academy of
management review, 20(3), 571-610.
Surroca, J., Tribó, J. A., & Waddock, S. (2010). Corporate responsibility and financial performance: The
role of intangible resources. Strategic management journal, 31(5), 463-490.
Transparency Benchmark. (2016). Transparency Benchmark 2016. Geraadpleegd van
https://www.transparantiebenchmark.nl/sites/transparantiebenchmark.nl/files/afbeeldingen/transparantieb
enchmark_eng.pdf
Trumpp, C., & Guenther, T. (2015). Too Little or too much? Exploring U‐shaped Relationships between
Corporate Environmental Performance and Corporate Financial Performance. Business Strategy and the
Environment.
UNEP, F. (2010). Translating ESG into Sustainable Business Value—Key Insights for Companies and
Investors.
UNGC. (2017). Our mission. Geraadpleegd van https://www.unglobalcompact.org/what-is-gc/mission
van der Laan, G., Van Ees, H., & Van Witteloostuijn, A. (2010). Is pay related to performance in The
Netherlands? An analysis of Dutch executive compensation, 2002–2006. De Economist, 158(2), 123-149.
Villalonga, B., & Amit, R. (2006). How do family ownership, control and management affect firm value?.
Journal of financial Economics, 80(2), 385-417.
Womack, K. L. (1996). Do brokerage analysts' recommendations have investment value?. The journal of
finance, 51(1), 137-167.
Wood, D. J. (1991). Corporate social performance revisited. Academy of management review, 16(4), 691-
718.
Wooldridge, J. M. (2010). Econometric analysis of cross section and panel data. MIT press.