
Do Investment Banks’ Relationships With Investors...
33
Electronic copy available at: http://ssrn.com/abstract=1546671 Do Investment Banks’ Relationships With Investors Impact Pricing? The Case of Convertible Bond Issues * Brian J. Henderson † The George Washington University Heather Tookes ‡ Yale University June 15, 2011 Abstract This paper examines the role of repeat interactions between placement agents (investment banks) and investors in the initial pricing of convertible bonds. Under the assumption that attracting repeat investors can reduce search frictions in primary issue markets, we test the hypothesis that banks’ relationships with investors actually allow more favorable pricing for issuing firms (in contrast to the “favoritism” hypothesis, under which banks use underpricing to reward favored clients). In the empirical analysis we also allow for a potentially important alternative channel through which search frictions might impact initial pricing: expected aftermarket liquidity. Using a sample of 601 Rule 144A issues for the years 1997-2007, we document robust negative relationships between at-issue discounts and both types of frictions. Our findings suggest that search frictions play a meaningful role in initial convertible bond pricing and, specifically, that intermediaries can add substantial value through repeated interactions with investors. Our results indicate that, with all other variables at their mean values, a deal with only 25% repeat investors will be priced at a 10.7% discount relative to fundamental value, while a deal with 75% repeat investors will be priced at a 7.1% discount. Given the mean deal size of $278 million, this translates to a potential savings of $10.2 million for the issuer. * We thank Steve Dimmock, Paul Gao, Gerard Hoberg, Jon Ingersoll, Andrew Karolyi, Neil Pearson, Geert Rouwen- horst, Hongjun Yan, and seminar participants at the Securities and Exchange Commission, American University, Cornell, University of Illinois, University of Maryland, University of Notre Dame, and Temple University for helpful comments. All errors are our own. † E-mail: [email protected]. The George Washington University, Department of Finance, Funger Hall #502, 2201 G Street NW, Washington DC 20052. Phone: (202) 994-3669. ‡ E-mail: [email protected]. Yale School of Management, P.O. Box 208000, New Haven, Connecticut 06520. Phone: (203) 436-0785.
Transcript of Do Investment Banks’ Relationships With Investors...

Electronic copy available at: http://ssrn.com/abstract=1546671
Do Investment Banks’ Relationships With Investors
Impact Pricing? The Case of Convertible Bond Issues∗
Brian J. Henderson†
The George Washington UniversityHeather Tookes‡
Yale University
June 15, 2011
Abstract
This paper examines the role of repeat interactions between placement agents (investment banks)and investors in the initial pricing of convertible bonds. Under the assumption that attractingrepeat investors can reduce search frictions in primary issue markets, we test the hypothesis thatbanks’ relationships with investors actually allow more favorable pricing for issuing firms (incontrast to the “favoritism” hypothesis, under which banks use underpricing to reward favoredclients). In the empirical analysis we also allow for a potentially important alternative channelthrough which search frictions might impact initial pricing: expected aftermarket liquidity.Using a sample of 601 Rule 144A issues for the years 1997-2007, we document robust negativerelationships between at-issue discounts and both types of frictions. Our findings suggest thatsearch frictions play a meaningful role in initial convertible bond pricing and, specifically, thatintermediaries can add substantial value through repeated interactions with investors. Ourresults indicate that, with all other variables at their mean values, a deal with only 25% repeatinvestors will be priced at a 10.7% discount relative to fundamental value, while a deal with 75%repeat investors will be priced at a 7.1% discount. Given the mean deal size of $278 million,this translates to a potential savings of $10.2 million for the issuer.
∗We thank Steve Dimmock, Paul Gao, Gerard Hoberg, Jon Ingersoll, Andrew Karolyi, Neil Pearson, Geert Rouwen-horst, Hongjun Yan, and seminar participants at the Securities and Exchange Commission, American University,Cornell, University of Illinois, University of Maryland, University of Notre Dame, and Temple University for helpfulcomments. All errors are our own.
†E-mail: [email protected]. The George Washington University, Department of Finance, Funger Hall #502,2201 G Street NW, Washington DC 20052. Phone: (202) 994-3669.
‡E-mail: [email protected]. Yale School of Management, P.O. Box 208000, New Haven, Connecticut 06520.Phone: (203) 436-0785.

Electronic copy available at: http://ssrn.com/abstract=1546671
1 Introduction
Why do firms issue convertible bonds at discounts relative to their fundamental values? De-
spite a vast literature on initial offering discounts, important questions about the initial pricing
of intermediated securities remain.1 This paper examines the role of repeat interactions between
placement agents (investment banks) and investors in the initial pricing of convertible bonds. We
analyze an extensive sample of Rule 144A convertible bond issues, in which we observe investor-
level data across a large number of convertible bond issues. Observing the repeated interactions
between placement agents and investors allows us to test the hypothesis that prior relationships
reduce search and contracting frictions in primary issue markets. Our primary findings reveal a
robust, negative relationship between at-issue convertible bond discounts and banks’ prior interac-
tions with investors. Our results indicate that, with all other variables at their mean values, a deal
with only 25% repeat investors will be priced at a 10.7% discount relative to fundamental value,
while a deal with 75% repeat investors will be priced at a 7.1% discount. Given the mean deal size
of $278 million, this translates to a potential savings of $10.2 million for the issuer.
The market for Rule 144A convertible bonds provides a particularly useful laboratory for ex-
amining the underpricing of intermediated securities. Many of the explanations for underpricing
proposed for equity securities (both initial public offerings (IPOs) and seasoned equity offerings
(SEOs)) are less relevant in this market, yet convertible bonds are considerably underpriced. In
fact, our estimates indicate that the bonds in our sample are priced at a 7.6% discount relative
to fundamental value. The issuers in our sample already have publicly traded stock, implying a
marginal role for asymmetric information and uncertainty about fundamental value relative to the
case of equity IPOs. The reduced role of information asymmetry means that traditional book-
building theories, such as Benveniste and Spindt (1989), in which underwriters compensate repeat
investors for revealing their private information, become less important (although we control for
information asymmetry in all empirical analysis). In addition, convertible bonds are less informa-
tionally sensitive than both seasoned and initial equity due to their hybrid structures and seniority
to equity claims. Since convertible bonds have downside protection and many investors hedge the
equity risk, the possibility that offering discounts are compensation for monitoring incentives is also
less likely relative to the case of straight equity.2 Finally, individual investors do not participate
in the 144A convertible bond market since regulation restricts participation to Qualified Institu-1Ritter and Welch (2002), Ljungqvist (2007) and Eckbo et al. (2007) provide excellent surveys.2Choi et al. (2010) and Mitchell et al. (2007) discuss convertible bond arbitrage strategies. Meidan (2006) examines
the role of monitoring in the private issue of public equity (PIPE) setting.
1

tional Buyers (QIBs).3 The absence of individual investors in both the primary and secondary
144A markets reduces the potential impact of biases that individuals might exhibit and may also
reduce information asymmetries among investors. These factors all improve our ability to isolate
empirically the potential role of search frictions in initial pricing.
The model of Duffie et al. (2007) relates search-and-bargaining frictions to prices in over-the-
counter markets and suggests greater liquidity discounts when counterparties are harder to find,
sellers have less bargaining power, and there exist fewer qualified owners. In the context of the
convertible bond market, we propose that repeat investors, defined as those who have participated in
prior Rule 144A issues by the same placement agent, may reduce bargaining complexities, resulting
in higher prices and lower offering discounts for issuing firms. We expect repeat investors to reduce
bargaining complexities through their familiarity and experience contracting with the placement
agent, compared to unknown investors. A second channel through which search frictions likely
influence the offering discount is the ability to find buyers in the secondary market should an
investor wish to trade the bond. Given the recent findings of Ellul and Pagano (2006) and Gupta
et al. (2008) that expected secondary market liquidity improves initial pricing, we also examine the
potential role of secondary market liquidity in all regressions.
In contrast to the search frictions hypothesis, according to the “conflict of interest” or “fa-
voritism” hypothesis, placement agents use their discretion to direct larger allocations of under-
priced securities to their relationship investors. Under the “bookbuilding” hypothesis, at-issue
discounts provide fair compensation to repeat investors for revealing their private value-relevant
information during the offering process. Both the “bookbuilding” and “favoritism” hypotheses pre-
dict a positive association between repeat investors and underpricing, opposite to the prediction of
the “search cost” hypothesis.
To our knowledge, there are only two large-sample studies in the extant literature relating
investor-placement agent relationships to allocations and pricing of security offerings. Both of those
studies focus on the equity IPO market and use mutual fund holding reports (SEC form 13-F) in the
quarter following the IPO to measure institutional allocations in equity IPOs. Reuter (2006) relates
these holdings to fees and commissions paid by funds to the IPO underwriters. He reports that
business relationships with underwriters lead to greater and more favorable IPO allocations. Reuter
(2006) presents a test of the importance of interactions across multiple business segments, whereas
our study examines the importance of interactions within a single market. Binay et al. (2007) study
the determinants of relationships and link them to IPO underpricing, measuring relationships as3Qualified Institutional Buyers must have at least $100 million in assets.
2

repeat interactions between investors and placement agents. Consistent with the “favoritism”
hypothesis, Binay et al. (2007) find greater participation in underpriced IPOs for regular investors,
and that this result is strongest during 1999-2000. Our analysis is complementary to both of these
studies. Because we measure relationships within the Rule 144A convertible bond market, we can
isolate the role of search frictions since other determinants of underpricing are less pronounced.
Moreover, our study circumvents the reliance on quarterly mutual fund holding reports, arguably
leading to more direct observation of initial allocations.4 Additionally, both papers include 1999-
2000, a period marked by highly unusual growth in IPOs, whereas the convertible bond market
remained more stable, implying that this study characterizes more normal times.
We provide new results to the literature on the initial pricing of intermediated securities and of
convertible bonds in particular. Our main finding is that investment banks can add value through
their relationships with investors. This effect is economically and statistically significant and is
robust to alternative approaches to calculating the discount. This finding is in contrast to the
“favoritism” hypothesis, under which bankers use underpricing to reward repeat investors. Second,
we find that at-issue convertible bond discounts are related negatively to proxies for aftermarket
liquidity, consistent with prior findings in the literature. The third key finding is that fees paid
by the issuer are lower when search costs and contracting frictions are reduced via repeat interac-
tions. Taken together, these findings suggest that the benefits (to the issuer) of investment bank
and investor relationships can outweigh potential conflict of interest costs associated with investor
favoritism.
The balance of the paper is organized as follows: Section 2 provides a brief description of
the 144A new issue market for convertible bonds; Section 3 presents the data and framework for
empirical analysis; Section 4 discusses the empirical results; Section 5 concludes.
2 The Rule 144A Convertible Bond Market
Although less widely studied than equity, convertible bonds are an important source of financing
for firms. Gomes and Phillips (2007) report that during the period 1995-2003, convertible debt
accounted for 9.0% of the dollar value of all new issuance while equity (both SEOs and IPOs)
accounted for 6.5%. The 144A market has become an important source of convertible bond financing
(see Gomes and Phillips (2007)). A benefit to issuers of SEC Rule 144A is the increased speed at4Since the stock market is liquid and trading volumes are high following IPOs, quarterly filings may be noisy
proxies for initial allocations.
3

which issuers may raise capital. This flexibility allows firms to take advantage of favorable market
conditions or respond quickly to investment opportunities. A cost to issuers of Rule 144A offerings
is the restricted investor base since Rule 144A restricts participation and trading to Qualified
Institutional Buyers (QIBs). All else equal, the market for Rule 144A bonds is less liquid than
public markets since participation is restricted to QIBs and transactions take place over-the-counter.
Rule 144A bonds sometimes have registration rights stipulating penalties should the issuer fail to
exchange the 144A bonds for otherwise identical registered bonds (which trade without restriction)
within an agreed upon time frame, which suggests registration provides some value to investors.
However, even when bonds do not include registration rights, most issuers register the bonds. In
fact, Huang and Ramirez (2010) report that 88% of Rule 144A convertible issuers register the
bonds, with 80% registering within 3 months of issuance.5
The process for placing 144A convertible bonds is similar to public equity placements, but it
occurs at a vastly accelerated pace, often spanning just a couple of days. The placement process
is similar to bookbuilding in that banks’ sales forces approach investors with potential offerings
and solicit indications of interest (however, as noted in the introduction, the role of information
asymmetry is much less pronounced). Simultaneously, the bank’s debt capital desk provides pricing
recommendations for the bonds based on current market conditions. Finally, the bank’s syndicate
desk merges the indications of interest collected from the sales force and the price recommendations
from the debt capital desk.
The specifics of the process may vary based on the characteristics of the issuing firm. Our
discussions with practitioners reveal that, for small firms (market capitalization of less than $500
million), investment banks may engage in a practice called “wall crossing,” in which they approach
a small group of investors with a potential offering and solicit feedback on whether the deal looks
attractive. The investors listen to the firm’s story, run deal terms through their pricing models6
and submit indications of interest.7 The mean market capitalization of the firms that we study is
$3.01 billion and the 25th percentile capitalization is $626 million. For very large firms like these,
the information revelation that occurs via the wall crossing process is likely to be less relevant. It is
more likely that the issuer approaches multiple banks and gathers information regarding what type
of pricing each convertible bond desk anticipates it can obtain. Since there is significant variation
across banks in their distribution abilities and expertise, pricing varies across banks.5Fenn (2000) reports that issuers register over 97% of high-yield 144A bonds. Livingston and Zhou (2002) report
that 98% of high-yield bonds include registration rights.6During our sample period, practitioners used binomial pricing models, similar to the ones used in this paper.7In order to participate in these negotiations, the investor has to agree to halt trading in the equity of the issuing
firm.
4

3 Empirical Framework
3.1 Convertible Bond Pricing
The first step in the analysis involves calculating at-issue discounts. In contrast to the secondary
market for equity IPOs and SEOs, trading of newly issued Rule 144A convertible bonds takes place
infrequently and in the over-the-counter market. Given this market structure, measuring offering
discounts based on post-issuance returns is not possible. To quantify pricing in the new issues
market, we compute the discount of the offering price relative to the theoretical bond value. This
measure is defined as: Discounti = 1− P issuei
P modeli
, where Pmodeli is the theoretical bond price (described
below) and P issuei denotes the issue price of the ith bond in the sample. When 1− P issue
i
P modeli
is greater
than zero, the interpretation is that the bond is underpriced.
Convertible bonds are hybrid instruments since they have both bond-like features (coupon
payments and return of par value if the bond reaches maturity) and equity-like features (the option
to convert the bonds into a specified number of shares of the issuer’s stock). A suitable valuation
model must incorporate the underlying stock price dynamics, as well as interest rates and default
likelihood. The model must be sufficiently stylized to allow for implementation across the full
sample, but also produce sufficient precision to avoid large estimation error. Convertible bonds
have numerous embedded American-style option features, and discrete-time binomial models are
a natural choice for valuation.8 We consider two convertible bond pricing models to estimate
the theoretical bond price. Each model includes an equity binomial tree with default risk.9 The
first model, which we refer to as the “Base Model,” is used in Choi et al. (2010) and Henderson
(2006). The Base Model assumes the default likelihood is constant over time and across all stock
prices. Additionally, the Base Model assumes the term structure of risk-free rates is flat. The
second model, referred to as the “Generalized Model,” is a version of the model developed by
Das and Sundaram (2007). The Generalized Model allows for time-varying default rates and the
default term structure is calibrated to current market prices. Additionally, the Generalized Model
incorporates the full term structure of risk-free interest rates where the forward rates are implied
by Treasury bond prices. The key distinctions between the models come from the assumptions
about the term structures of default probabilities and interest rates. Although the Base Model8Typical options embedded in convertible bonds include the issuer’s right to call the bonds at specified prices prior
to maturity, the bondholders’ right to force the issuer to repurchase the bond at specified prices prior to maturity,and the bondholders’ right to convert the bonds to a specified number of shares of the issuer’s stock.
9Ingersoll (1977) uses a contingent claims approach to valuing convertibles in which the bond represents contingentclaims on the firm as a whole. The benefit of this approach is that it endogenously accounts for default risk. Thechallenge in our setting is that we would need to model the value of the entire firm, including all liabilities that aresenior to the convertible. We therefore choose to value the bond based on the stock price tree.
5

makes more restrictive assumptions by assuming a constant default probability through time and
across all stock prices, and by assuming a flat term structure of interest rates, it has the advantage
of requiring the estimation of fewer parameters.
3.1.1 Base Pricing Model
The first step in the pricing procedure involves construction of the stock price tree. The model
assumes that the issuer’s stock price follows a geometric Brownian motion process with constant
drift and volatility, a constant hazard rate of default, λ, and recovery rate R. The binomial trees
consist of 50 time steps per year (dt = 150). At each time-step, the stock price S may move up (to
u × S) or down (to d × S), where the size of the stock price change is a function of the stock’s
return volatility: u = exp√
(σ2 − λ)dt, d = 1u .
The return volatility for each issuer’s stock, σ, is the standard deviation of daily historical stock
returns during trading days -160 through -20 days prior to issuance.10 The default intensity, λ, is
inferred from credit spreads at the time of the offering. Specifically, the implied default intensity
is: λ = rc−rf
1−R , where: rc is the yield on straight bonds with the same credit rating as the issue; rf
is the risk-free yield; and R is the fraction of par expected to be recovered in the event of default.11
The probability of the up- and down-steps, pu and pd, respectively, are computed as: pu =e(r−c)dt−de−λdt
u−d , pd = ue−λdt−de(r−c)dt
u−d , where the parameter c is the continuously compounded divi-
dend rate, estimated as the trailing 12-month dividend rate on the issuer’s stock converted from
discrete distributions to a continuous rate.
Construction of the convertible bond tree follows from the stock tree. Starting at the terminal
node, corresponding to the final maturity date of the bond, the price of the bond is set equal to
the maximum of the conversion value or the par value of the bond. Specifically, the expiration date
T value of the ith convertible bond in the sample is: Pi,t = MAX[PAR,CRi × Si,T ], where CRi
is the conversion ratio representing the number of shares of the issuer’s stock into which the bond
converts, and Si,T designates the issuer’s stock price at terminal node T .
The prior nodes on the tree are populated by working backwards through the tree. Starting
with the time-step immediately prior to expiration and working backwards, the value of the bond10We use historical volatility rather than option-implied volatility for three reasons. First, many issuers do not have
exchange-traded options, which would lead to a significant reduction in the sample size. Second, most traded optionshave short maturities, whereas the average convertible bond in our sample has 13.8 years to maturity when issued.Third, selecting the appropriate option from the available strike prices and times-to-expiration is not straightforward,given the complex features of convertible bonds’ embedded option features. As a robustness check, we recalculate theDiscount based on the implied volatility and find that it is highly correlated with the Discount using the historicalvolatility input for the sub-sample of firms with traded options.
11Constant recovery rates is a standard assumption over our sample period. See Bandreddi et al. (2007) and Dasand Hanouna (2009) for discussions of recovery rates.
6

at each time t and node j is the maximum of the discounted expected payoff and the conversion
value. Specifically,
Pj,t = MAX[e−rf dt(pu × P ut+1 + pd × P d
t+1 + (1− pu − pd)×R× PAR), CRi × Sj,t]. (1)
To account for the call and put features of each convertible bond, we collect call and put
schedules from Securities Data Corporation (SDC) and Bloomberg and assume that these options
are exercised optimally.
3.1.2 Generalized Pricing Model
In addition to the Base Model, we estimate a second, more generalized pricing model. The Gener-
alized Model is an adaptation of the Das and Sundaram (2007) model for pricing hybrid securities
and, compared to the Base Model, it incorporates the full term structures of interest rates and de-
fault likelihoods. The model specifies the default process as endogenous to the equity price process,
which follows a jump-to-default process.
The pricing procedure begins by building the stock tree. Similar to the Base Model, each year
consists of 50 time steps. The stock price at time t is St and at each time step, it may take one of
three possible values:
St+h =
uSt with probability q(t− λt)dSt with probability (1− q)(t− λt)0 with probability λt,
(2)
where the magnitude of an up-step is u = eσ√
dt and the magnitude of a down-step is d = 1u . The
stock price process is an extension of the Cox et al. (1979) model and allows the stock price to
jump to default, where it is absorbed. Denote f as the risk free rate of interest during each period.
The probability of an up-step, conditional on no-default, is q =1
(1−λ)e(f−c)×dt−d
u−d . The model allows
the default probability (λ) to change over time and across stock prices. This makes intuitive sense,
since default seems more likely at low stock prices compared to higher stock prices, all else equal.
The model assumes a specific default function in time, where λi,t is the probability of default at
stock price i and time t and ηi,j is the corresponding default intensity:
λi,j = 1− e−ηi,j×dt (3)
ηi,j = eα+γ×dtS−βt (4)
Implementing the model requires, in addition to the stock price volatility σ, estimation of the
parameters α and γ, which modulate the default intensity through time, and β which modulates
7

the intensity across stock prices. To calibrate these parameters, we use the yields on indices for
bonds of the same credit rating as sample bond i. Specifically, we use the yields on 1-, 5-, 10-, and 30-
year corporate debt indexes (published by Moody’s and collected from Bloomberg) to calibrate the
market-implied expected default compared to the yields on Treasury bonds of identical maturities.
To calibrate the default function, the procedure selects the parameters {α, γ, β} to minimize mean-
squared errors between prices on a par bond obtained using the corporate debt index yield and the
yield on a risk-free Treasury bond.
After calibrating the default function, construction of the stock price tree is identical to the
procedure in the Base Model. From the stock price tree, the convertible bond price tree is also
identical to the Base Model, with one exception. The discount rate, f , in the Generalized Model is
the periodic forward rate implied by Treasury bond prices (instead of a flat term structure, as in
the Base Model).
3.2 Data and Summary Statistics
The initial sample of 144A convertible bond offerings comes from Sagient’s Placement Tracker
database for the years 1997 through 2007.12 The data include placement agent and investor name,
the name and holdings amount of each investor, and a description of the investor type (e.g., mutual
fund, hedge fund, pension fund, etc.). To reduce potential double-counting of investors, when the
investor and advisor have common names, we replace the investor name with the advisor’s name.13
There are 1,176 unique 144A convertible bond issues in the database.
To obtain issue characteristics, we match the Sagient bonds with convertible bond offerings
in the SDC New Issues database based on ticker, name, and closing date. When we are unable
to obtain a match in the SDC database, we match with bond issue data from Bloomberg. We
exclude from the sample: all exchangeable and mandatory issues; issues with floating conversion
prices or coupon rates; and any issues that are missing important terms, such as the coupon rate or
conversion ratio.14 After filtering, we obtain discount estimates for 848 bonds. We further require
data on all explanatory variables of interest, including the prior relationship measures, leaving a12The Placement Tracker data begin in 1995. We begin the sample in 1997 since one of the variables of interest
requires measurement of repeat interactions between investors and placement agents during the preceding last 24months, requiring a 2-year observation window prior to the earliest cross-sectional observation.
13When a given investor is part of a family of investment funds, we aggregate up to the family level. We repeatall analysis using two additional definitions (1) keep all investors separate and (2) aggregate all investors based ontheir advisors and define relationships with placement agents based on their advisors. All of the main results carrythrough.
14We excluded 2 bonds with “floating” coupon rates, 9 bonds with “reset” coupon rates and 34 bonds with thecoupon data field blank.
8

final sample of 601 issues from a broad cross-section of industries.15 There are 43 unique placement
agents and 3,529 unique investor names in the final sample.
The Placement Tracker data have been used in recent studies of private issues of public equity
(PIPES). These papers have examined the impact of investor type on future equity price perfor-
mance (Brophy et al., 2009) and the pricing of PIPES (Meidan, 2006), but do not include convertible
bonds, mainly due to the unobservable nature of the “fundamental prices.” We circumvent this
problem by estimating a theoretical at-issue price. Huang et al. (2008) also use the Sagient data
and, like this paper, measure repeat interactions. They investigate whether banks with large net-
works help issuers attract investors in PIPE offerings, but do not examine the relationship between
networks and pricing.
Table 1 presents summary statistics for the variables used in the analysis. The first and most
important observation from the table is that convertible bonds are issued at substantial discounts.
The mean (median) discount relative to fundamental value is 7.6% (5.9%) under the Base Model
and 9.7% (8.4%) under the Generalized Model. These magnitudes are similar to those reported
in prior studies of convertible bond discounts (e.g., Henderson (2006) and Chan and Chen (2007))
and, as might be expected, less than the magnitudes of the discounts reported in private placements
of equity (e.g., 20%, reported in Hertzel and Smith (1993); 14% in Brophy et al. (2009) and Huson
et al. (2009)). While our evidence suggests that convertible bonds are substantially underpriced on
average, the variable exhibits significant variation, with an interquartile range of -1.1% to 14.4%
for the Base Model and -1.4% to 18.6% for the Generalized Model. Similar variation is seen in the
first day returns of IPOs (Ritter, 2010).
Referring to Table 1, gross proceeds (issue size) tend to be substantial, with a sample mean
(median) of $278.9 million ($175 million). The mean (median) fee paid to the placement agent is
2.9% (3.0%) of the issue, with an interquartile range of 2.5% to 3.2%. Unlike IPOs, in which there
is very little variation in gross spreads (see Chen and Ritter (2000)), we observe substantial fee
variation in our sample. This provides an opportunity to analyze the question of what drives fees.
In choosing a relationship measure, we take a very simple approach: we define RepeatInvestors
as the fraction of investors in a particular issue that have purchased a new 144A issue by the same
placement agent in the past 24 months, relative to all investors in the issue. With the exception
of a handful of studies that use proprietary IPO data over short time horizons (e.g., Cornelli15There are a number of deals with missing fee information in Sagient. When fee data are missing, we use hand-
collected data and define fees as 1 minus the ratio of net proceeds (as reported in the statement of cash flows) togross proceeds. If we rely on the Sagient data alone, the final sample falls to 533 observations; however, the mainresults are qualitatively similar.
9

and Goldreich (2001); Aggarwal et al. (2002); and Aggarwal (2003)), the lack of information on
investor allocation has posed a major empirical challenge to answering the questions posed in this
paper, even in the voluminous IPO literature. The investor identity data disclosed in the 144A
convertible bond filings provides an opportunity, using a large sample, to examine the importance
of relationships and investor allocation. We use RepeatInvestors and NumInvestors (the number of
investors in the issue) as proxies for the ease of search for initial investors in the issue and after-
market liquidity in the bond markets, respectively. The average issue has 56.6 investors and 67.5
percent are related to the placement agent in that they have participated in at least one of the
placement agent’s issues in the last 24 months.16
InvestorExperience measures the fraction of all convertible bond deal flow over the past 24
months purchased by issue i’s investors, excluding deals placed by issue i’s placement agent. Distinct
from the prior interactions with deal i’s placement agent, InvestorExperience provides a general
measure of the sophistication of the investors in a given bond issue and is included in the empirical
analysis to distinguish the role of relationships versus experience in pricing. On average, investors
have purchased 16.4% of all of the prior deal flow of other placement agents.
The median bond in our sample is unrated. Of the rated bonds, the average rating is just
below investment grade. The mean rating of 5.36 corresponds to a bond with S&P rating BB,
which is expected since convertible bonds are a popular source of financing for firms of lower credit
worthiness. In fact, the highest rated bond in our sample has an S&P rating of A. CCC is the
lowest rating of the rated bonds in the sample. In regression analysis, we control for bond rating by
including five dummy variables: RateBBB, which corresponds to an S&P Rating of BBB; RateBB ;
RateB ; RateCCC ; and Unrated, a dummy equal to 1 for unrated bonds.
We observe substantial variation across the types of investors. Of the investors identified by type
in the sample, 51.8% of the proceeds are purchased by hedge funds.17 The second and third largest
purchasers are broker-dealers (22.8% of the proceeds) and mutual funds (18.6% of the proceeds),
respectively. The remaining identified investors are insurance/pension funds, corporations, banks,
venture capital and private equity funds, charitable/educational investors and family trusts.
The variable MarketShare measures the placement agent’s market share of prior 144A convert-
ible bond issues over the twenty four months preceding the bond offering. The mean (median)16We expect that the marginal investor is an unrelated investor (in all bond issues with less than 100% repeat
investors) and that this investor is the one that impacts pricing. In robustness analysis, we introduce an alternativerelationship measure intended to capture the intensity of the prior relationships (Strength) which has a mean of 0.183,median of 0.182 and interquartile range of 0.143 to 0.217. See the discussion of Table 4.
17This is somewhat lower than values reported in previous papers (Mitchell et al. (2007); Choi et al. (2009) andChoi et al. (2010)). The difference may be due to the fact that 28% of the bonds are purchased by investors withmissing investor type information in the Sagient database (these are labeled “Unknown” in the database).
10

MarketShare is 11.3% (7.6%) with a standard deviation of 10.4%, indicating the sample includes
rich variation in the placement agents’ deal flow prior to an offering.
It is important to note that we observe only those investors in 144A issues who choose to be
named. They must do so if they plan to sell the bond to public investors at some point in the
future. The mean (median) fraction of issues bought by unnamed investors is 28.8% (25.0%) in our
sample. We exclude unnamed investors when counting the number of investors to facilitate clearer
interpretation of the after-market liquidity proxy, since the objective is to construct a measure of
investors that plausibly intend to trade the bond. We do not expect the unnamed investor group to
create bias in the estimated relationship between the repeated interaction measure and discounts
since we do not have reason to believe that named investors are more or less likely to be related to
the placement agent than unidentified ones; however, we include the fraction of unnamed investors
as a control variable in all extended regression specifications.
We control for asymmetric information in all regressions by including an analyst following
measure, NumAnalysts, as a proxy for (low) asymmetric information. We measure analyst following
as the natural logarithm of the number of analysts submitting annual earnings per share forecasts
in IBES. The firms in the sample tend to have high analyst coverage, with a mean analyst following
of 14.9; however, there is substantial variation, as NumAnalysts has a standard deviation of 10.7.
Figure 1 shows the time series of total proceeds and at-issue discounts for both the Base and
Generalized Pricing Models for each year of the sample. The two discount measures are highly
correlated over time; however, there are times during which their relative levels cross, which suggests
there is not a directional bias in the estimated discounts from either model. Issuance increases
sharply through 2003 and then decreases during the last years of the sample period. Average
at-issue discounts have fluctuated over time, ranging between 5% and 15% for most years in the
sample. Given these patterns, we estimate all regressions with year fixed effects.
3.3 Empirical Specification
The main empirical specification is as follows:
Discounti,t = α + β1RepeatInvestorsi,t + β2NumInvestorsi,t + β3Xi,t + εi,t. (5)
Discount measures the issue price relative to fundamental value as discussed in Section 3.1. Recall
that when this variable is positive, the interpretation is that the bond is underpriced. RepeatIn-
vestors, defined as the fraction of investors that have purchased a new 144A issue from issue i’s
placement agent during the past two years, is the proxy for the ease of locating and contracting with
11

initial investors. If attracting familiar investors reduces search costs and contracting frictions, then
issuers may avoid relying upon aggressive bond pricing, in which case we expect to observe higher
bond prices relative to fundamental value (β1 < 0).18 Alternatively, if investor favoritism and
conflict of interest dominate, then this variable will be related positively to the discount (β1 > 0).
The coefficient on RepeatInvestors allows us to distinguish the dominant effect of favoritism versus
contracting frictions.
The (log) number of investors in the issue, NumInvestors, is the main proxy for after-market
liquidity. We assume NumInvestors is proportional to the number of potential investors in the
secondary market.19 The expected relationship between liquidity risk and asset prices has been
an important focus of the microstructure and asset pricing literature since Amihud and Mendelson
(1986). However, only recently have after-market liquidity and liquidity risk received attention in
the literature examining the prices of new-issues of securities (i.e., primary market pricing). Ellul
and Pagano (2006) are the first to develop and test a model in which after-market liquidity and
liquidity risk reduce IPO underpricing. They find evidence consistent with improved pricing when
after-market liquidity is expected to be high. Similarly, Gupta et al. (2008) find that expected sec-
ondary market liquidity impacts the pricing of syndicated loans such that higher expected liquidity
reduces spreads paid by firms.20 Given the findings in Ellul and Pagano (2006) and Gupta et al.
(2008), we expect β2, the estimated coefficient for NumInvestors, to be negative. This hypothesis
is also consistent with the model of Duffie et al. (2007) where more potential investors lead to higher
prices. There is some evidence in the literature that liquidity is an important determinant of pricing
in the 144A market for already-issued securities (Chaplinsky and Ramchand, 2004). Although this
evidence is based on seasoned securities and also includes straight bonds, it highlights the potential
importance of after-market liquidity in 144A bond markets.
We include the control vector X in the baseline empirical model. The variables comprising X
are: (natural log) issue size (GrossProceeds); bond rating dummies; underwriter fees (Fee); under-
writer market share (MarketShare); number of equity analysts covering the firm (NumAnalysts);
and market capitalization of the issuer (MarketCap). These control variables are based on the
substantial empirical literature documenting that firms issue equity securities (IPOs, SEOs, and18We expect the marginal investor, regardless of size, to impact pricing. The RepeatInvestors measure is based on
the number of repeat investors relative to all investors in the deal. In untabulated analysis, we instead define thisvariable as the fraction of proceeds purchased by repeat investors. The main results are qualitatively similar.
19Prior to registration, Rule 144A restricts trading of the bonds to QIBs. Additionally, since the bonds tradeover-the-counter and contain complex features, the number of potential investors is reasonably linked to the numberof investors already owning the bonds and familiar with the deal-specific terms.
20Wittenberg-Moerman (2008) also examines the syndicated loan market, but focuses on the determinants ofsecondary market liquidity (bid-ask spreads) rather than primary market pricing.
12

private placements) at prices below their fundamental values.
GrossProceeds and NumAnalysts control for information asymmetry at the issue and firm level,
respectively. These are based on theoretical models of asymmetric information (e.g., asymmetrically
informed investors in Rock (1986) or compensating informed investors in the bookbuilding process
in Benveniste and Spindt (1989)). As noted in the introduction, we expect these to be less relevant
in the case of convertible bond issues; however, it is still important to control for information
asymmetry so that the interpretation of the search frictions variables is clear. We include bond
ratings controls given findings in Chan and Chen (2007) that ratings explain at-issue discounts.21
Relative to A-rated bonds (the intercept), if bond ratings capture renegotiation risk and this risk
is reflected in bond discounts as argued by Chan and Chen (2007), we expect all coefficients on the
ratings dummies to be positive. We also expect the magnitudes of the coefficients to increase as
credit rating decreases. We include Fee to examine the hypothesis that investment banking fees
reflect bankers’ efforts to decrease bond discounts. If this is the case, then we would expect lower
fees in bonds that have higher discounts. We include MarketShare, the placement agent’s share of
all 144A convertible bond proceeds over the past 24 months, to capture the potential underwriter
certification effect (as in Carter and Manaster (1990) and Megginson and Weiss (1991)). Investors
may perceive a placement agent with a larger market share (and better reputation) as certification
of the quality of the issue. Finally, we include MarketCap as a proxy for issuer bargaining power. We
expect that firms with substantial market capitalization will have significant future financing needs
and their issues will receive more attention from placement agents, resulting in lower discounts.
4 Results
4.1 What Factors Drive Convertible Bond Discounts?
Table 2 presents results of regressions in which Discount, calculated using the Base Model, is the de-
pendent variable. All regressions contain year fixed effects and standard errors are double-clustered
by placement agent and issuer. Model 1 of Table 2 shows the benchmark regression from Equation
5, in which the search frictions variables, issue controls and firm controls are the explanatory vari-
ables. The most important observation from the table is that both of the proposed search friction
proxies matter. That is, we observe negative and significant coefficients on RepeatInvestors (the
proxy for the ease with which the placement agent attracts investors) and NumInvestors (the proxy21Cai et al. (2007) report statistically significant straight bond underpricing, especially in issues for which rating
is low and information asymmetry is high.
13

for after market liquidity). Recall that the mean convertible bond discount relative to fundamental
value is 7.6%. All else equal, the results suggest that a one standard deviation increase in the frac-
tion of repeat investors results in a decrease in the at-issue discount relative to fundamental value
of 1.9% (i.e., at its mean, a reduction from 7.6% to 5.7%). For the average issue ($278 million),
this translates to a savings of $5.3 million for the issuer. A one standard deviation increase in
the number of investors from its mean results in a decrease in the at-issue discount of 1.2% (i.e.,
reduction from 7.6% to 6.4%). These findings suggest that search frictions play a meaningful role in
bond pricing and that intermediaries add value through their repeated interactions with investors.
This result is in contrast to the “favoritism” hypothesis, in which banks use at-issue discounts to
reward favored clients.22
The only control variables that are significant in Model 1 are MarketCap and MarketShare. The
estimated coefficient on MarketCap is negative and significant, suggesting that larger, more visible
firms are able to issue convertible debt at more favorable pricing. The positive and significant
estimated coefficient on MarketShare is somewhat more surprising, given prior findings in the IPO
literature (e.g., Ljungqvist and Wilhelm (2002) that placement agent market shares are negatively
associated with underpricing. At face value, the coefficient on MarketShare in Model 1 suggests
that even though firms will receive more favorable pricing if they hire investment banks with larger
networks, the effect of the bank’s market share partially mitigates this positive effect. This would
be expected if high market share banks exercise market power. However, as will be discussed later,
the result is not robust.
Table 2, Model 2 extends the benchmark empirical model to include three additional controls
for investor characteristics.23 We include UnclassifiedInvestors, the fraction of proceeds bought by
investors who are not identified in the Sagient data. These investors may be long-term investors
who do not intend to sell their positions right away, since only named investors can sell their
holdings in the aftermarket. Ex ante, we expect that more long term investors will make the
bond more attractive, decreasing the discount. Similarly, based on the idea that hedge funds
tend to have shorter investment horizons, we also include NonHedgeFunds, the fraction of total
proceeds bought by investors who are not classified as hedge funds, to control for differences between
short-term and long-term named investors. Finally, we include InvestorExperience, defined as the22A positive relationship between RepeatInvestors and Discount would also be consistent with traditional book-
building theories and the evidence of partial adjustment in IPO price revisions documented in Hanley (1993) andLjungqvist and Wilhelm (2002); however, as noted in the introduction, such theories are less relevant in the case ofconvertible bond issues by already public firms. Much of the otherwise private information that investors would haveabout demand is likely to be reflected in the equity market.
23We thank an anonymous referee for encouraging this line of analysis.
14

fraction of all convertible bond deal flow over the past 24 months, excluding that placed by issue i ’s
placement agent, purchased by issue i ’s investors. InvestorExperience captures the importance
of experienced investors within bond issue i and is included because an alternative interpretation
of the negative relation between RepeatInvestors and deal pricing is that RepeatInvestors captures
investor sophistication rather than prior relationships between investors and placement agents.
The expected sign on InvestorExperience is ambiguous. On one hand, issuing convertible bonds
to investors who already have experience purchasing these securities (from any placement agent)
may reduce the contracting complexities that would exist for investors who are new to the 144-A
convertible bond market. On the other hand, sophisticated investors may be more successful in
their demands for favorable pricing. While not statistically significant, the estimated coefficient
on this variable, as shown in Table 2, Model 2 is consistent with the latter interpretation. The
results shown in Table 2 also suggest the proxies for investor horizon do not influence pricing.
The estimated coefficient on NonHedgeFunds is negative, as expected, but it is not statistically
significant. The estimated coefficient on UnclassifiedInvestors is positive and also insignificant.
Importantly, the magnitudes and significance of the estimated coefficients on the search frictions
variables remain after including these additional control variables.
Outside the IPO and SEO settings, there is evidence of substantial discounts in PIPES, begin-
ning with Hertzel and Smith (1993). In recent work, Huson et al. (2009), document an important
role for capital market conditions in the initial pricing of PIPES. Following the PIPE literature,
Table 2, Model 3 further extends the benchmark model to include variables that capture market
conditions and the extent to which firms are financially constrained. Huson et al. (2009) find that
discounts are higher when: recent market returns have been high; recent IPO underpricing has
been high; recent IPO dollar volume is low; 10-year Treasury rates are high; and when BAA-AAA
spreads are high. We include all five of these market conditions variables in the Model 3 speci-
fication. We also include the KZIndex, a proxy for firms’ financial constraints, given evidence in
Huson et al. (2009) of higher discounts for financially constrained firms. Of these variables, the
10-year Treasury rate is the only one that is significant and suggests that at-issue discounts are
greater when long-term Treasury yields are high. In addition to the tight credit market conditions
interpretation of this positive relationship in Huson et al. (2009), it also is possible that in the
case of convertible bonds, cash constrained firms are more willing to issue convertibles when the
coupons that they expect to pay on a straight debt issue are high. This is consistent with the
debt-sweetener hypothesis of Billingsley and Smith (1996).
An alternative interpretation for the negative and significant coefficient on the number of in-
15

vestors measure (NumInvestors) in Models 1 through 3 is that this variable proxies for investor
interest in the deal, rather than secondary market liquidity. In extended regressions, we add Matu-
rity, the years-to-maturity of the bond issue, as an additional proxy for after-market liquidity. The
basic idea is that, as the maturity of the issue becomes longer, short-horizon investors will become
concerned about their ability to sell the bond in the after-market and will require higher discounts.
For example, Amihud and Mendelson (1991) find that the yields on shorter maturity treasuries
are substantially smaller than on less liquid long-maturity treasuries. The results are in Table 2,
Model 4. We find that debt maturity is positively and significantly related to Discount. That is,
longer maturity bonds are priced lower relative to fundamental value. The significant coefficient
on NumInvestors remains and suggests that Maturity captures a different dimension of expected
secondary market liquidity. The Maturity results provide additional support for a strong positive
role for after-market liquidity in bond pricing.24
In addition to adding the Maturity measure to the analysis presented Model 4, we also include
investor buyer power, HHI, and we control for firm leverage with DebtRatio. The HHI measure
captures the concentration of investor allocation within an issue. If buyer power influences pric-
ing, we expect that issues in which buyer power is high (high HHI ) will have higher discounts.
We include DebtRatio since issuers that already have large amounts of debt outstanding may be
forced to issue convertible bonds at less favorable terms. We find that both of these measures are
insignificant after controlling for prior relationships and the number of investors in the deal.
The signs and significance of the other variables in Model 4 are the same as in Models 1 through
3, with the exception of RateBBB, Fee and IPOUnderpricing, which all become significant after
adding the additional covariates. The positive and significant coefficient on RateBB is striking since
it is larger than those on the other ratings dummies, suggesting that investors require the highest
discounts for BBB bonds. This result is consistent with market segmentation in which investors,
such as pension funds and insurance companies, are restricted to holding investment grade bonds.
For these investors, purchasing a BBB-rated bond, which is only one notch above high-yield, means
that they may have to dispose of the bond if the rating drops. It is plausible that these investors
demand compensation for taking ratings-downgrade risk. The coefficient on Fee is positive and
significant, which is contrary to the hypothesis that banking fees reflect bankers’ efforts to decrease24As noted in Section 2, registration rights might impact expected aftermarket liquidity. In untabulated analysis,
under the assumption that actual registration is a good proxy for expected registration, we create a new variableequal to the (log) number of days between closing and filing date as well as a dummy equal to 1 if we do not observea filing for the issue. We rerun the regressions in Model 4 and find positive (as we would expect) but insignificantcoefficients on both variables.
16

bond discounts, but is consistent with the idea that fees are higher for harder-to-place issues.25
The negative and significant estimated coefficient on IPOUnderpricing suggests substitutability
between equity and convertible debt, in which firms move to convertible debt markets when equity
investors demand substantial discounts. As noted above, the positive, significant coefficient on
MarketShare observed in Models 1-3 is not robust. The estimated coefficient on placement agent
MarketShare becomes insignificant in the extended specification. Importantly, the significant and
negative coefficients on both RepeatInvestor and NumInvestors remain.
Taken together, the results in Models 1 through 4 show robust relationships between at-issue
discounts and search frictions. The estimated coefficients on both RepeatInvestors and NumIn-
vestors are similar both in magnitude and statistical significance across all four models. Since
the analysis relies heavily on the model-based prices, we repeat the Table 2 analysis, but instead
measure the Discount using the prices from the Generalized Model. Because of the added data
requirements and calibration procedure of the Generalized Model, the sample size is reduced from
601 to 575.
Table 3 presents regression results repeating the analysis in Table 2, but where the discount
measure is based on prices from the Generalized Model. The results are qualitatively similar to those
in Table 2 and provide strong evidence that the main results are not driven by model choice.26 The
most important observation from the table is that high values of RepeatInvestors and NumInvestors
are associated with significantly lower at-issue discounts. For example, the results from Model 4
imply that a one standard deviation increase in RepeatInvestors results in a decrease in the at-issue
discount of 2.3% (relative to its mean of 9.7%). A one standard deviation increase in NumInvestors
from its mean results in a decrease in the discount of 0.46%.27 Given the consistency of the main
results across all four models in both Tables 2 and 3, all subsequent analysis will focus on the
extended specification (Model 4).25This assumes that fees are exogenous, an assumption that we will relax in later analysis, given potential concerns
that fees and prices are set simultaneously.26As an additional check of the Discount proxies, for all issues in which we were able to obtain quote data in
Datastream within one week of 365 calendar days post issuance, we calculated abnormal bond returns. We thencalculated the correlations between after-market returns and the Discount to test whether bonds that are pricedlower relative to fundamental value actually experience higher subsequent returns (i.e., price convergence towardsfundamental value). The correlations over the one year horizon are 0.198 under the Base Model and 0.180 underthe Generalized Model and are statistically significant. This provides market-based validation for the model basedpricing measures and should provide additional confidence in the interpretation of the main analysis.
27The standard deviations of NumInvesors and RepeatInvestors for the 575 observations in the Generalized Modelsubsample are 39.39 and 0.252, respectively.
17

4.2 Strength of Placement Agent- Investor Relationships
The baseline analyses in Tables 2 and 3 use a very simple, intuitive measure to define placement
agent-investor relationships. In order to capture the intensity of the relationship between placement
agents and their investors, we examine an alternative definition of past interactions.
We introduce Strength, which captures the average participation of investors in issue i in all
144-A convertible bond issues by i ’s placement agent during the past 24 months.28 We compute
Strength as:
Strength =1N
N∑i=1
NumberOfPriorIssuesByP lacementAgentInWhichInvestorParticipated
TotalPriorDealsByP lacementAgent
(6)
where N is the number of investors in the bond issue. Strength has a mean of 0.186, median of 0.183
and inter-quartile range of 0.15 to 0.22. In Table 4 we repeat the main analysis using both the Base
and Generalized pricing models, but replace RepeatInvestors with the Strength measure. We find
that stronger relationships are associated with higher bond prices (lower Discount). The estimated
coefficients on Strength range from 0.174 to 0.196, with economic magnitudes that are similar to
the coefficients on RepeatInvestors in Tables 2 and 3. For example, the results in Table 4 using the
Base Model imply that a one standard deviation increase in the average strength of the relationship
between investors and the placement agent decreases the at-issue discount by 1.15%. Similar to the
main results, Table 4 suggests that when a placement agent attracts her most important investors
from her “rolodex,” aggressive discounting becomes less critical for successful placement of the
offering.
4.3 Further Interpretation: The Roles of Affiliated Investors and InvestorEx-perience at the Sector Level
4.3.1 Affiliated Investors
Affiliated investors allow for further examination of the role of contracting frictions in pricing. As in
the case with RepeatInvestors, there are competing hypothesis regarding the behavior of placement
agents’ allocations to their affiliated investors. According to the “favoritism” hypothesis, place-
ment agents allocate favorably priced issues to affiliated investors to increase their performance.
In the case of IPOs, Ritter and Zhang (2007) find evidence consistent with the “favoritism” hy-
pothesis. Alternatively, under the search frictions hypothesis, banks may encourage their affiliated
investors to purchase issues that are difficult to place. Consistent with this hypothesis (and also28While in a very different setting from ours, Davis and Kim (2007) also study relationship intensity measures.
18

with bookbuilding, which is less relevant in our setting), Reuter (2006) finds very little evidence of
differences between IPO allocations to affiliated and non-affiliated investors, but affiliated investors
earn slightly lower first day returns, which is inconsistent with “favoritism.”
To examine the role of investor affiliation, we introduce AffilatedInvestors, defined as the fraction
of proceeds purchased by investors who are affiliated with the investment bank. Because Sagient
does not contain information on investor affiliation, we rely on common name matching. As an
example, in 2004, Morgan Stanley Dean Witter placed a convertible bond issued by ImClone with
Morgan Stanley Dean Witter Convertible Securities Trust. The mean (median) fraction of proceeds
sold to affiliated investors in our sample of 601 bond issues is 2.49% (0.00%).
Table 5 presents regression results where the main regression analysis is extended to include
AffilatedInvestors. The table includes Discount measured under both the Base and Generalized
pricing models. While only marginally significant, the negative signs on the AffilatedInvestors
coefficients in both of the regressions suggest that affiliated investors, like repeat investors, help
reduce contracting costs. This is consistent with the search frictions hypothesis and inconsistent
with the favoritism hypothesis. The coefficients on the other variables of interest remain stable.
4.3.2 Investor Experience and Contracting Complexity
The InvestorExperience measure also provides insight into the role of relationships. Beginning
with Model 3 in Table 2, all regressions control for InvestorExperience to ensure that any ob-
served relationship between RepeatInvestors and the Discount is due to prior interactions between
the placement agent and the investor, as opposed to proxying for placing bonds in the hands of
sophisticated investors. In most specifications, the estimated coefficients on this variable are pos-
itive, suggesting that sophisticated investors demand higher discounts. However, the coefficients
are marginally significant at best. In order to clarify the role of sophisticated investors, we adopt a
narrower definition of experience. Rather than measure the fraction of all other deal flow by other
placement agents, we focus only on same sector deal flow. The basic idea is that investors who
have recently bought a convertible bond by an issuer in the same sector will be very well-informed,
which can either reduce contracting complexity or increase investor bargaining power.29
Results of the analysis using the alternative InvestorExperience definition, based on sector, are
in Table 5. The estimated coefficient on InvestorExperience becomes larger in magnitude and is
statistically significant in both specifications. The finer definition of InvestorExperience confirms
the interpretation that investor sophistication and relationships between investors and placement29We thank a referee for suggesting the potential importance of same sector experience.
19

agents play very different roles in the initial pricing of convertible bonds.
4.4 Potential Endogeneity of Fees
The estimated coefficients on Fee in Tables 2 through 5 are positive and statistically significant
under the Base pricing model, and positive but often insignificant under the Generalized Model.
Under the Base Model, the estimated coefficient on Fee of approximately 2.1 implies that, all else
equal, a one standard deviation increase in fees increases the Discount by 1.7%. While econom-
ically significant, the analysis assumes that fees are exogenous. If obtaining favorable pricing for
issuers requires effort, it is possible that investment banks set fees and determine bond pricing
simultaneously. To account for the potential endogeneity of fees, we use the two-stage-least squares
procedure to estimate the following system of equations:
Discounti,t = α + β1Feei,t + β2NumInvestorsi,t + β3RepeatInvestorsi,t (7)
+β4Maturityi,t + β5Xi,t + εi,t
Feei,t = µ + γ1Discounti,t + γ2SEOSpreadi,t + γ3NoSEOi,t (8)
+γ3RepeatInvestorsi,t + γ3Xi,t + υi,t.
We introduce two new variables, SEOSpread and NoSEO in the Fee equation as the identifying
variables for fees. SEOSpread is the mean gross spread charged by the same placement agent in
seasoned equity offerings during the issue year. We expect that cross-sectionally, placement agent
fees in the convertible bond market will exhibit similar variation to the variation in fees charged by
the same placement agents in the SEO market. To account for the fact that some placement agents
do not participate in the SEO market, we also include a dummy variable equal to 1 if the placement
agent’s firm did not place an SEO during the issue year.30 We expect that placement agents who
do not participate in multiple issue markets will have higher fixed costs in the convertible bond
market (e.g., no potential for sharing costs with activities in SEOs). Importantly, we also expect the
exclusion restriction to be satisfied. That is, we do not expect a given placement agent’s activities
in the separate SEO market to have a direct effect on convertible bond pricing.
The specification for the Discount equation is identical to the regressions in Tables 2 to 5. The
identifying variables in the Discount equation are the secondary market liquidity proxies. These
variables are excluded from the Fee equation because the ability to trade the bond in secondary
markets should not be of direct concern to placement agents, except through the impact on the
Discount. The variables in the X vector are identical in both the Fee and Discount equations.30Placement agents were hand-matched by firm name and year with the SDC New Issues database.
20

The exogeneity assumption for the variables in X is less of a concern because these variables reflect
lagged firm characteristics, issue characteristics, and overall market conditions which are all unlikely
to be negotiated along with bond pricing.
Table 6 presents results of the simultaneous equation model. The Discount results in Panel A are
similar to the main findings in the Table 2 extended regressions. The most important observation
from Table 6, Panel A is that in all four specifications, all search frictions proxies (NumInvestors,
RepeatInvestors, Strength, and Maturity) remain significantly related, both economically and sta-
tistically, to the Discount. Also important is the fact that Fee loses significance in the Discount
equation once we control for endogeneity. MarketShare remains insignificant. These results suggest
that issue, firm, and market conditions are more important determinants of the initial pricing of
convertible bonds than the fees charged by placement agents. All signs of the other coefficients are
consistent with the main analysis in Table 2.
Table 6, Panel B presents the Fee equation results. The estimated coefficients on both SEO
Spread and No SEO are positive (as expected) and significant, suggesting that the system is well-
identified. We observe higher fees for placement agents who also charge higher fees in the SEO
market or who are not currently participating in the SEO market. We also observe that Repeat-
Investors negatively impact fees, but Strength does not. This is consistent with the interpretation
that it is easier to contract with prior investors, but that the benefit of past relationships on re-
ducing fees does not depend on the intensity/frequency of prior interactions. The finding that
relationships (RepeatInvestors) decrease fees is consistent with a reduction of search costs through
having a large rolodex that is, at least in part, transferred to firms. Finally, we find a significant
negative relationship between at-issue discounts and fees. That is, we observe higher percentage
fees when bonds are priced favorably for issuers. This finding is consistent with banks charging
higher fees as compensation for obtaining higher prices for the bonds.
Overall, the results in Tables 2 through 6 provide strong evidence that reducing search frictions
improves pricing and reduces fees paid to placement agents in the market for privately placed
convertible bonds. The finding that RepeatInvestors are associated with higher bond prices is
contrary to the investor favoritism hypothesis but consistent with models of search costs.
5 Conclusions
Our primary findings demonstrate the previously undocumented and important role of search fric-
tions in the initial pricing of convertible bonds. We find that repeat interactions between placement
21
agents and investors can reduce discounts. We document robust, negative relationships between
at-issue discounts of convertible bonds and both investors’ prior participation in bond issues by
the investment bank and proxies for after-market liquidity. These effects are economically and
statistically significant and are robust to alternative approaches to calculating the at-issue discount
and to the inclusion of a large variety of control variables. We do not find evidence in support
of the “favoritism hypothesis,” in which bankers reward favored investors with larger allocations
of more underpriced issues. The results are consistent with the hypothesis that the reduction in
contracting frictions that, in the Rule 144A convertible bond market, occurs via repeated interac-
tions between investors and placement agents dominates any impact that favoritism might have on
prices. In addition to the direct impact of repeated interactions on pricing, we also find evidence of
a second channel through which search frictions impact pricing: expected secondary market liquid-
ity. Allowing for endogenously determined fees, we find lower investment banking fees when bonds
are placed with repeat investors. Taken together, these findings suggest that search frictions play
a meaningful role in convertible bond pricing and that intermediaries can add substantial value
through their repeated interactions with investors.
References
Aggarwal, R., 2003. Allocation of initial public offerings and flipping activity. Journal of FinancialEconomics 68, 111–135.
Aggarwal, R., Prabhala, N., Puri, M., 2002. Institutional allocation in initial public offerings:Empirical evidence. Journal of Finance 57, 1421–1442.
Almeida, H., Campello, M., Weisbach, M., 2004. The cash flow sensitivity of cash. Journal ofFinance 59, 1777–1804.
Amihud, Y., Mendelson, H., 1986. Asset pricing and the bid-ask spread. Journal of FinancialEconomics 17, 223–249.
Amihud, Y., Mendelson, H., 1991. Liquidity, maturity, and the yields on U.S. treasury securities.Journal of Finance 46, 1411–1425.
Bandreddi, S., Das, S.R., Fan, R., 2007. Correlated default modeling with a forest of binomialtrees. Journal of Fixed Income 17(3), 38–56.
Benveniste, L.M., Spindt, P.A., 1989. How investment bankers determine the offer price andallocation of new issues. Journal of Financial Economics 24, 343–361.
Billingsley, R., Smith, D., 1996. Why do firms issue convertible debt? Financial Management 25,93–99.
Binay, M.M., Gatchev, V.A., Pirinsky, C.A., 2007. The role of underwriter-investor relationshipsin the IPO process. Journal of Financial and Quantitative Analysis 42(3), 785–810.
22

Brophy, D.J., Ouimet, P.P., Sialm, C., 2009. Hedge funds as investors of last resort? Review ofFinancial Studies 22, 541–574.
Cai, N., Helwege, J., Warga, A., 2007. Underpricing in the corporate bond market. Review ofFinancial Studies 20, 2021–2046.
Carter, R., Manaster, S., 1990. Initial public offerings and underwriter reputation. Journal ofFinance 45, 1045–1067.
Chan, A.W., Chen, N., 2007. Convertible bond underpricing: Renegotiable covenants, seasoning,and convergence. Management Science 53, 1793–1814.
Chaplinsky, S., Ramchand, L., 2004. The borrowing costs of international issuers: SEC Rule 144-A.Journal of Business 77, 1073–1097.
Chen, H.C., Ritter, J., 2000. The seven percent solution. Journal of Finance 55, 1105–1131.
Choi, D., Getmansky, M., Henderson, B., Tookes, H., 2010. Convertible bond arbitrageurs assuppliers of capital. Review of Financial Studies 26(3), 2492–2522.
Choi, D., Getmansky, M., Tookes, H., 2009. Convertible bond arbitrage, liquidity externalities, andstock prices. Journal of Financial Economics 91(2), 227–251.
Cornelli, F., Goldreich, D., 2001. Bookbuilding and strategic allocation. Journal of Finance 56,2337–2369.
Cox, J., Ross, S.A., Rubenstein, M., 1979. Option pricing: A simplified approach. Journal ofFinancial Economics 7, 229–263.
Das, S.R., Hanouna, P., 2009. Implied recovery. Journal of Economic Dynamics and Control 33(11),1837–1857.
Das, S.R., Sundaram, R.K., 2007. An integrated model for hybrid securities. Management Science53(9), 1439–1451.
Davis, G.F., Kim, E.H., 2007. Business ties and proxy voting by mutual funds. Journal of FinancialEconomics 85, 552–570.
Duffie, D., Garleanu, N., Pedersen, L., 2007. Valuation in over-the-counter markets. Review ofFinancial Studies 20, 1865–1900.
Eckbo, E.B., Masulis, R.W., Norli, O., 2007. Security offerings, in: Eckbo, B.E. (Ed.), Handbookin Corporate Finance: Empirical Corporate Finance. North Holland, pp. 233–361.
Ellul, A., Pagano, M., 2006. IPO underpricing and after-market liquidity. Review of FinancialStudies 19, 381–421.
Fenn, G.W., 2000. Speed of issuance and the adequacy of disclosure in the 144a high-yield debtmarket. Journal of Financial Economics 56(3), 383–405.
Gomes, A., Phillips, G., 2007. Private and public security issuance by public firms: The role ofasymmetric information. Working Paper.
Gupta, A., Singh, A., Zebedee, A., 2008. Liquidity in the pricing of syndicated loans. Journal ofFutures Markets 11, 339–376.
23

Hanley, K., 1993. The underpricing of initial public offerings and the partial adjustment phe-nomenon. Journal of Financial Economics 34, 231–250.
Henderson, B.J., 2006. Convertible bond arbitrage: New issue performance and arbitrage oppor-tunities. Working Paper.
Hertzel, M., Smith, R.L., 1993. Market discounts and shareholder gains for placing equity privately.Journal of Finance 48, 459–485.
Huang, R., Ramirez, G.G., 2010. The rise of the rule 144a market for convertible debt offerings.Working Paper.
Huang, R., Shangguan, Z., Zhang, D., 2008. The networking function of investment banks: Evidencefrom private investments in public equity. Journal of Corporate Finance 14, 738–752.
Huson, M.R., Malatesta, P.H., Parrino, R., 2009. Capital market conditions and the pricing ofprivate equity sales by public firms. Working Paper.
Ingersoll, J., 1977. A contingent-claims valuation of convertible securities. Journal of FinancialEconomics 4, 289–321.
Livingston, M., Zhou, L., 2002. The impact of rule 144a debt offerings upon bond yields andunderwriter fees. Financial Management 31, 5–27.
Ljungqvist, A., 2007. IPO underpricing: A survey, in: Eckbo, B.E. (Ed.), Handbook in CorporateFinance: Empirical Corporate Finance. North Holland, pp. 375–418.
Ljungqvist, A., Wilhelm, W., 2002. IPO allocations: discriminatory or discretionary? Journal ofFinancial Economics 65, 167–201.
Megginson, W.L., Weiss, K.A., 1991. Venture capitalist certification in initial public offerings.Journal of Finance 46, 879–903.
Meidan, D., 2006. The informativeness of offer characteristics versus investor identity in PIPEtransactions. Working Paper.
Mitchell, M., Pedersen, L.H., Pulvino, T., 2007. Slow moving capital. American Economic Review97(2), 215–220.
Reuter, J., 2006. Are IPO allocations for sale? Journal of Finance 61, 2289–2324.
Ritter, J.R., 2010. Some factoids about the 2009 IPO market. Working Paper.
Ritter, J.R., Welch, I., 2002. A review of IPO activity, pricing, and allocations. Journal of Finance57, 1795–1828.
Ritter, J.R., Zhang, D., 2007. Affiliated mutual funds and the allocation of initial public offerings.Journal of Financial Economics 86(2), 337–368.
Rock, K., 1986. Why new issues are underpriced. Journal of Financial Economics 15, 187–212.
Wittenberg-Moerman, R., 2008. The role of information asymmetry and financial reporting qualityin debt trading: Evidence from the secondary loan market. Journal of Accounting and Economics46, 240–260.
24

Table 1: Sample StatisticsThis table presents summary statistics for the sample of convertible bonds. The initial sample comprises allconvertible bond issues under Rule 144A as identified by Sagient Research’s Placement Tracker Database. Thesample period begins in 1997 and ends in 2007. There are 601 observations. Panel A presents descriptive statistics.Panel B reports industries of the issuers in the sample. Discount, Base Model and Discount, Generalized Modelare the percentage discounts of the offering price below the fundamental value from the pricing models. Thefollowing variables are from Placement Tracker: GrossProceeds are the issue proceeds, inclusive of fees; Fee isthe fee paid to the placement agent as a fraction of proceeds; NumInvestors are the number of investors in eachdeal; RepeatInvestors is defined as the fraction of investors that purchased another convertible bond from the sameplacement agent in the preceding 24 months; InvestorExperience measures the fraction of previous 144A convertiblebond deal flow, excluding any deals by bond i’s placement agent, purchased by investors in issue i over the past 24months; Strength is defined as the average participation of investors in issue i in all 144A convertible bond issuesby bond i’s placement agent during the past 24 months; HHI measures buyer power and is defined as the sum ofsquared fractions of the total proceeds purchased by each investor; MarketShare is the placement agent’s marketshare in the 144A convertible bond market over the previous 24 months. BondRating is based on S&P ratingsand takes numeric values from 1 (AAA) to 9 (C). Bond ratings are from Mergent FISD. UnclassifiedInvestors isdefined as the fraction of proceeds in issue i purchased by investors who are unidentified in the Sagient database.NonHedgeFund is defined as the fraction of proceeds purchased by investors not classified as hedge funds by Sagient.Maturity is the time-to-maturity (in years) of bond i at the time of its issue. NumAnalysts are the number of stockanalysts in IBES producing annual earnings forecasts for the convertible bond issuer. DebtRatio is the COMPUSTATbook value of debt from the year preceding the offering divided by MarketCap. MarketCap comes from CRSP andis the product of shares outstanding and share price. Panel B presents the number of observations per industry sector.
Panel A: Descriptive Statistics
StandardVariable Name Mean Median Minimum Maximum
Deviation
Discount, Base Model 0.076 0.059 -0.243 0.690 0.144Discount, Generalized Model 0.097 0.084 -0.245 0.691 0.153GrossProceeds (millions $) 278.866 175.000 30.000 2,821.209 282.398Fee 0.029 0.030 0.004 0.083 0.008NumInvestors 56.556 45.000 1.000 272.000 39.617RepeatInvestors 0.675 0.746 0.000 1.000 0.252InvestorExperience 0.164 0.160 0.000 0.524 0.073Strength 0.183 0.182 0.000 0.455 0.066HHI 0.126 0.083 0.016 1.000 0.126MarketShare 0.113 0.076 0.001 0.585 0.104BondRating 5.356 6.000 3.000 7.000 1.067Unrated 0.636 1.000 0.000 1.000 0.482UnclassifiedInvestors 0.282 0.250 0.000 1.000 0.182NonHedgeFund 0.634 0.640 0.000 1.000 0.167Maturity 13.837 9.997 1.644 30.425 8.468NumAnalysts 14.865 12.000 0.000 65.000 10.734DebtRatio 0.256 0.218 0.000 1.353 0.245MarketCap (billions $) 3.014 1.176 0.006 160.854 8.009
Panel B: Sample Firms’ Industry Representation
Sector Sample Observations
Basic Materials 10Communications 100Consumer Cyclical 67Consumer Non-Cyclical 167Diversified 5Energy 34Financial 43Industrial 63Technology 109Utilities 3
25
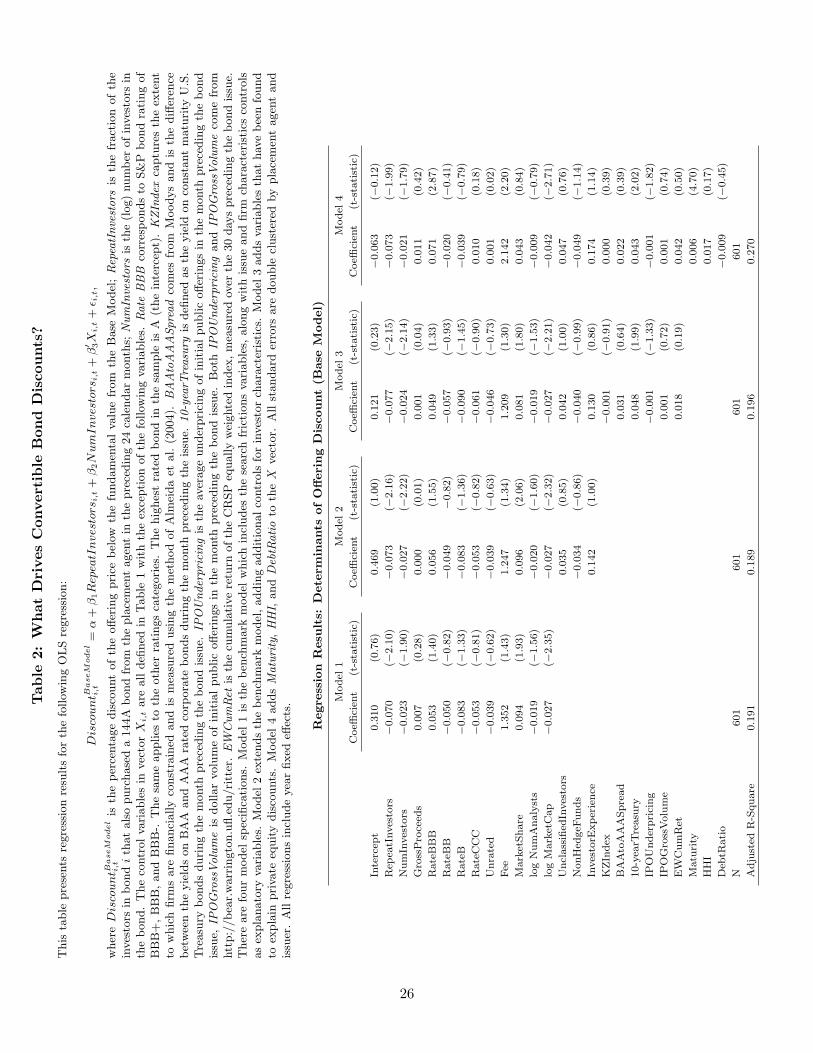
Tab
le2:
What
Dri
ves
Con
vert
ible
Bon
dD
isco
unts
?
This
table
pre
sents
regre
ssio
nre
sult
sfo
rth
efo
llow
ing
OLS
regre
ssio
n:
Dis
countB
aseM
odel
i,t
=α
+β
1R
epea
tInves
tors
i,t+
β2N
um
Inves
tors
i,t+
β′ 3X
i,t+
ε i,t,
wher
eD
isco
untB
aseM
odel
i,t
isth
eper
centa
ge
dis
count
of
the
offer
ing
pri
cebel
owth
efu
ndam
enta
lva
lue
from
the
Base
Model
;Rep
eatI
nve
stors
isth
efr
act
ion
of
the
inves
tors
inbond
ith
at
als
opurc
hase
da
144A
bond
from
the
pla
cem
ent
agen
tin
the
pre
cedin
g24
cale
ndar
month
s;N
um
Inve
stors
isth
e(l
og)
num
ber
ofin
ves
tors
inth
ebond.
The
contr
olva
riable
sin
vec
tor
Xi,
tare
all
defi
ned
inTable
1w
ith
the
exce
pti
on
ofth
efo
llow
ing
vari
able
s.Rate
BBB
corr
esponds
toS&
Pbond
rati
ng
of
BB
B+
,B
BB
,and
BB
B-.
The
sam
eapplies
toth
eoth
erra
tings
cate
gori
es.
The
hig
hes
tra
ted
bond
inth
esa
mple
isA
(the
inte
rcep
t).
KZIn
dex
captu
res
the
exte
nt
tow
hic
hfirm
sare
financi
ally
const
rain
edand
ism
easu
red
usi
ng
the
met
hod
of
Alm
eida
etal.
(2004).
BA
Ato
AA
ASpre
ad
com
esfr
om
Moodys
and
isth
ediff
eren
cebet
wee
nth
eyie
lds
on
BA
Aand
AA
Ara
ted
corp
ora
tebonds
duri
ng
the
month
pre
cedin
gth
eis
sue.
10-y
earT
reasu
ryis
defi
ned
as
the
yie
ldon
const
ant
matu
rity
U.S
.Tre
asu
rybonds
duri
ng
the
month
pre
cedin
gth
ebond
issu
e.IP
OU
nder
pri
cing
isth
eav
erage
under
pri
cing
ofin
itia
lpublic
offer
ings
inth
em
onth
pre
cedin
gth
ebond
issu
e,IP
OG
ross
Volu
me
isdollar
volu
me
of
init
ialpublic
offer
ings
inth
em
onth
pre
cedin
gth
ebond
issu
e.B
oth
IPO
Under
pri
cing
and
IPO
Gro
ssVolu
me
com
efr
om
htt
p:/
/bea
r.w
arr
ingto
n.u
fl.e
du/ri
tter
.EW
Cum
Ret
isth
ecu
mula
tive
retu
rnofth
eC
RSP
equally
wei
ghte
din
dex
,m
easu
red
over
the
30
day
spre
cedin
gth
ebond
issu
e.T
her
eare
four
model
spec
ifica
tions.
Model
1is
the
ben
chm
ark
model
whic
hin
cludes
the
searc
hfr
icti
ons
vari
able
s,alo
ng
wit
his
sue
and
firm
chara
cter
isti
csco
ntr
ols
as
expla
nato
ryva
riable
s.M
odel
2ex
tends
the
ben
chm
ark
model
,addin
gaddit
ionalco
ntr
ols
for
inves
tor
chara
cter
isti
cs.
Model
3adds
vari
able
sth
at
hav
ebee
nfo
und
toex
pla
inpri
vate
equity
dis
counts
.M
odel
4adds
Matu
rity
,H
HI,
and
Deb
tRatio
toth
eX
vec
tor.
All
standard
erro
rsare
double
clust
ered
by
pla
cem
ent
agen
tand
issu
er.
All
regre
ssio
ns
incl
ude
yea
rfixed
effec
ts.
Regre
ssio
nR
esu
lts:
Dete
rmin
ants
ofO
fferi
ng
Dis
count
(Base
Model)
Model
1M
odel
2M
odel
3M
odel
4
Coeffi
cien
t(t
-sta
tist
ic)
Coeffi
cien
t(t
-sta
tist
ic)
Coeffi
cien
t(t
-sta
tist
ic)
Coeffi
cien
t(t
-sta
tist
ic)
Inte
rcep
t0.3
10
(0.7
6)
0.4
69
(1.0
0)
0.1
21
(0.2
3)
−0.0
63
(−0.1
2)
Rep
eatI
nves
tors
−0.0
70
(−2.1
0)
−0.0
73
(−2.1
6)
−0.0
77
(−2.1
5)
−0.0
73
(−1.9
9)
Num
Inves
tors
−0.0
23
(−1.9
0)
−0.0
27
(−2.2
2)
−0.0
24
(−2.1
4)
−0.0
21
(−1.7
9)
Gro
ssP
roce
eds
0.0
07
(0.2
8)
0.0
00
(0.0
1)
0.0
01
(0.0
4)
0.0
11
(0.4
2)
Rate
BB
B0.0
53
(1.4
0)
0.0
56
(1.5
5)
0.0
49
(1.3
3)
0.0
71
(2.8
7)
Rate
BB
−0.0
50
(−0.8
2)
−0.0
49
−0.8
2)
−0.0
57
(−0.9
3)
−0.0
20
(−0.4
1)
Rate
B−
0.0
83
(−1.3
3)
−0.0
83
(−1.3
6)
−0.0
90
(−1.4
5)
−0.0
39
(−0.7
9)
Rate
CC
C−
0.0
53
(−0.8
1)
−0.0
53
(−0.8
2)
−0.0
61
(−0.9
0)
0.0
10
(0.1
8)
Unra
ted
−0.0
39
(−0.6
2)
−0.0
39
(−0.6
3)
−0.0
46
(−0.7
3)
0.0
01
(0.0
2)
Fee
1.3
52
(1.4
3)
1.2
47
(1.3
4)
1.2
09
(1.3
0)
2.1
42
(2.2
0)
Mark
etShare
0.0
94
(1.9
3)
0.0
96
(2.0
6)
0.0
81
(1.8
0)
0.0
43
(0.8
4)
log
Num
Analy
sts
−0.0
19
(−1.5
6)
−0.0
20
(−1.6
0)
−0.0
19
(−1.5
3)
−0.0
09
(−0.7
9)
log
Mark
etC
ap
−0.0
27
(−2.3
5)
−0.0
27
(−2.3
2)
−0.0
27
(−2.2
1)
−0.0
42
(−2.7
1)
Uncl
ass
ified
Inves
tors
0.0
35
(0.8
5)
0.0
42
(1.0
0)
0.0
47
(0.7
6)
NonH
edgeF
unds
−0.0
34
(−0.8
6)
−0.0
40
(−0.9
9)
−0.0
49
(−1.1
4)
Inves
torE
xper
ience
0.1
42
(1.0
0)
0.1
30
(0.8
6)
0.1
74
(1.1
4)
KZIn
dex
−0.0
01
(−0.9
1)
0.0
00
(0.3
9)
BA
Ato
AA
ASpre
ad
0.0
31
(0.6
4)
0.0
22
(0.3
9)
10-y
earT
reasu
ry0.0
48
(1.9
9)
0.0
43
(2.0
2)
IPO
Under
pri
cing
−0.0
01
(−1.3
3)
−0.0
01
(−1.8
2)
IPO
Gro
ssVolu
me
0.0
01
(0.7
2)
0.0
01
(0.7
4)
EW
Cum
Ret
0.0
18
(0.1
9)
0.0
42
(0.5
0)
Matu
rity
0.0
06
(4.7
0)
HH
I0.0
17
(0.1
7)
Deb
tRatio
−0.0
09
(−0.4
5)
N601
601
601
601
Adju
sted
R-S
quare
0.1
91
0.1
89
0.1
96
0.2
70
26
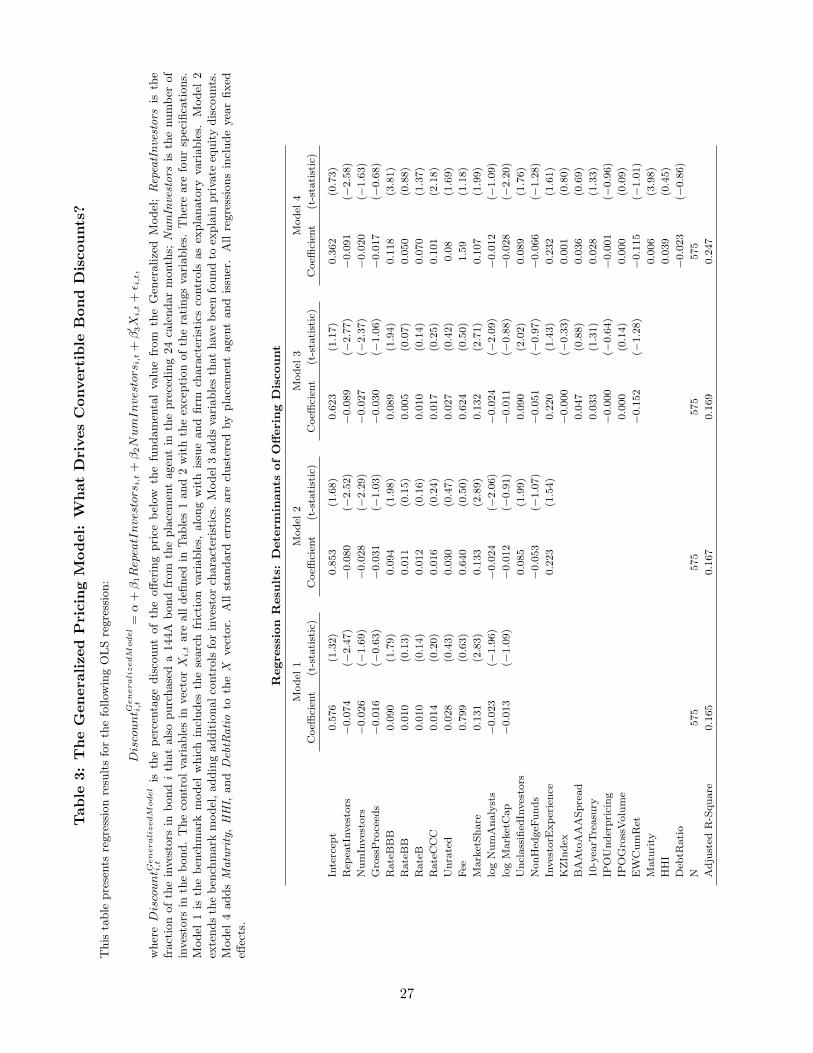
Tab
le3:
The
Gen
eral
ized
Pri
cing
Model
:W
hat
Dri
ves
Con
vert
ible
Bon
dD
isco
unts
?
This
table
pre
sents
regre
ssio
nre
sult
sfo
rth
efo
llow
ing
OLS
regre
ssio
n:
Dis
countG
en
era
lizedM
odel
i,t
=α
+β
1R
epea
tInves
tors
i,t+
β2N
um
Inves
tors
i,t+
β′ 3X
i,t+
ε i,t,
wher
eD
isco
untG
en
era
lizedM
odel
i,t
isth
eper
centa
ge
dis
count
of
the
offer
ing
pri
cebel
owth
efu
ndam
enta
lva
lue
from
the
Gen
eralize
dM
odel
;Rep
eatI
nve
stors
isth
efr
act
ion
ofth
ein
ves
tors
inbond
ith
at
als
opurc
hase
da
144A
bond
from
the
pla
cem
ent
agen
tin
the
pre
cedin
g24
cale
ndar
month
s;N
um
Inve
stors
isth
enum
ber
of
inves
tors
inth
ebond.
The
contr
olva
riable
sin
vec
tor
Xi,
tare
all
defi
ned
inTable
s1
and
2w
ith
the
exce
pti
on
ofth
era
tings
vari
able
s.T
her
eare
four
spec
ifica
tions.
Model
1is
the
ben
chm
ark
model
whic
hin
cludes
the
searc
hfr
icti
on
vari
able
s,alo
ng
wit
his
sue
and
firm
chara
cter
isti
csco
ntr
ols
as
expla
nato
ryva
riable
s.M
odel
2ex
tends
the
ben
chm
ark
model
,addin
gaddit
ionalco
ntr
ols
for
inves
tor
chara
cter
isti
cs.
Model
3adds
vari
able
sth
at
hav
ebee
nfo
und
toex
pla
inpri
vate
equity
dis
counts
.M
odel
4adds
Matu
rity
,H
HI,
and
Deb
tRatio
toth
eX
vec
tor.
All
standard
erro
rsare
clust
ered
by
pla
cem
ent
agen
tand
issu
er.
All
regre
ssio
ns
incl
ude
yea
rfixed
effec
ts.
Regre
ssio
nR
esu
lts:
Dete
rmin
ants
ofO
fferi
ng
Dis
count
Model
1M
odel
2M
odel
3M
odel
4
Coeffi
cien
t(t
-sta
tist
ic)
Coeffi
cien
t(t
-sta
tist
ic)
Coeffi
cien
t(t
-sta
tist
ic)
Coeffi
cien
t(t
-sta
tist
ic)
Inte
rcep
t0.5
76
(1.3
2)
0.8
53
(1.6
8)
0.6
23
(1.1
7)
0.3
62
(0.7
3)
Rep
eatI
nves
tors
−0.0
74
(−2.4
7)
−0.0
80
(−2.5
2)
−0.0
89
(−2.7
7)
−0.0
91
(−2.5
8)
Num
Inves
tors
−0.0
26
(−1.6
9)
−0.0
28
(−2.2
9)
−0.0
27
(−2.3
7)
−0.0
20
(−1.6
3)
Gro
ssP
roce
eds
−0.0
16
(−0.6
3)
−0.0
31
(−1.0
3)
−0.0
30
(−1.0
6)
−0.0
17
(−0.6
8)
Rate
BB
B0.0
90
(1.7
9)
0.0
94
(1.9
8)
0.0
89
(1.9
4)
0.1
18
(3.8
1)
Rate
BB
0.0
10
(0.1
3)
0.0
11
(0.1
5)
0.0
05
(0.0
7)
0.0
50
(0.8
8)
Rate
B0.0
10
(0.1
4)
0.0
12
(0.1
6)
0.0
10
(0.1
4)
0.0
70
(1.3
7)
Rate
CC
C0.0
14
(0.2
0)
0.0
16
(0.2
4)
0.0
17
(0.2
5)
0.1
01
(2.1
8)
Unra
ted
0.0
28
(0.4
3)
0.0
30
(0.4
7)
0.0
27
(0.4
2)
0.0
8(1
.69)
Fee
0.7
99
(0.6
3)
0.6
40
(0.5
0)
0.6
24
(0.5
0)
1.5
9(1
.18)
Mark
etShare
0.1
31
(2.8
3)
0.1
33
(2.8
9)
0.1
32
(2.7
1)
0.1
07
(1.9
9)
log
Num
Analy
sts
−0.0
23
(−1.9
6)
−0.0
24
(−2.0
6)
−0.0
24
(−2.0
9)
−0.0
12
(−1.0
9)
log
Mark
etC
ap
−0.0
13
(−1.0
9)
−0.0
12
(−0.9
1)
−0.0
11
(−0.8
8)
−0.0
28
(−2.2
0)
Uncl
ass
ified
Inves
tors
0.0
85
(1.9
9)
0.0
90
(2.0
2)
0.0
89
(1.7
6)
NonH
edgeF
unds
−0.0
53
(−1.0
7)
−0.0
51
(−0.9
7)
−0.0
66
(−1.2
8)
Inves
torE
xper
ience
0.2
23
(1.5
4)
0.2
20
(1.4
3)
0.2
32
(1.6
1)
KZIn
dex
−0.0
00
(−0.3
3)
0.0
01
(0.8
0)
BA
Ato
AA
ASpre
ad
0.0
47
(0.8
8)
0.0
36
(0.6
9)
10-y
earT
reasu
ry0.0
33
(1.3
1)
0.0
28
(1.3
3)
IPO
Under
pri
cing
−0.0
00
(−0.6
4)
−0.0
01
(−0.9
6)
IPO
Gro
ssVolu
me
0.0
00
(0.1
4)
0.0
00
(0.0
9)
EW
Cum
Ret
−0.1
52
(−1.2
8)
−0.1
15
(−1.0
1)
Matu
rity
0.0
06
(3.9
8)
HH
I0.0
39
(0.4
5)
Deb
tRatio
−0.0
23
(−0.8
6)
N575
575
575
575
Adju
sted
R-S
quare
0.1
65
0.1
67
0.1
69
0.2
47
27

Table 4: The Role of Relationship Strength in Offering Discounts
This table presents regression results for the following OLS regressions:
Discounti,t = α + β1NumInvestorsi,t + β2Strengthi,t + β′3Xi,t + εi,t,
where Discounti,t is the percentage discount of the offering price to the fundamental value from the pricing modeland Strength is defined as the average participation of investors in issue i in all 144A convertible bond issues bybond i’s placement agent during the past twenty four months. All other variables are defined in Tables 1 and 2and are based on the extended regressions (Model 4) shown in Tables 2 and 3. The table presents results of tworegressions. In the first regression, the Discount measure comes from the Base Model and in the second regressionfrom the Generalized Model. All standard errors are double clustered by placement agent and issuer. All regressionsinclude year fixed effects.
Determinants of Discount with Relationship Strength
Base Model Prices Generalized Model Prices
Coefficient (t-statistic) Coefficient (t-statistic)
Intercept −0.055 (−0.11) 0.368 (0.74)
NumInvestors −0.027 (−2.50) −0.026 (−1.85)
Strength −0.174 (−1.90) −0.196 (−2.16)
GrossProceeds 0.013 (0.50) −0.015 (−0.57)
RateBBB 0.074 (3.14) 0.121 (3.84)
RateBB −0.013 (−0.27) 0.058 (1.01)
RateB −0.034 (−0.67) 0.075 (1.42)
RateCCC 0.013 (0.24) 0.105 (2.19)
Unrated 0.006 (0.12) 0.090 (1.77)
Fee 2.267 (2.37) 1.734 (1.31)
MarketShare −0.050 (−1.31) −0.011 (−0.28)
log NumAnalysts −0.010 (−0.94) −0.014 (−1.27)
log MarketCap −0.043 (−2.92) −0.029 (−2.26)
UnclassifiedInvestors 0.048 (0.74) 0.088 (1.61)
NonHedgeFunds −0.043 (−1.05) −0.058 (−1.18)
InvestorExperience 0.189 (1.24) 0.242 (1.64)
KZIndex 0.000 (0.65) 0.001 (1.05)
BAAtoAAASpread 0.024 (0.43) 0.039 (0.74)
10-yearTreasury 0.040 (1.79) 0.025 (1.12)
IPOUnderpricing −0.001 (−1.71) −0.001 (−0.84)
IPOGrossVolume 0.001 (0.93) 0.000 (0.33)
EWCumRet 0.033 (0.39) −0.125 (−1.11)
Maturity 0.006 (4.76) 0.006 (4.05)
HHI 0.002 (0.02) 0.022 (0.24)
DebtRatio −0.006 (−0.28) −0.020 (−0.72)
N 601 575
Adjusted R-Square 0.266 0.243
28

Tab
le5:
Addit
ional
Mea
sure
sof
Con
trac
ting
Fri
ctio
ns
and
Exper
ience
This
table
pre
sents
regre
ssio
nre
sult
sfo
rth
efo
llow
ing
OLS
regre
ssio
n:
Dis
count i
,t=
α+
β1R
epea
tInves
tors
i,t+
β2N
um
Inves
tors
i,t+
β3A
ffiliate
dIn
vest
ors
+β′ 4X
i,t+
ε i,t,
wher
eD
isco
unt i
,tis
the
per
centa
ge
dis
count
ofth
eoffer
ing
pri
cebel
owth
efu
ndam
enta
lva
lue
from
the
pri
cing
model
;Rep
eatI
nve
stors
isth
efr
act
ion
ofth
ein
ves
tors
inbond
ith
at
als
opurc
hase
da
144A
bond
from
the
pla
cem
ent
agen
tin
the
pre
cedin
g24
cale
ndar
month
s;N
um
Inve
stors
isth
enum
ber
of
inves
tors
inth
ebond.
Affi
liate
dIn
vest
ors
isth
efr
act
ion
ofbond
ipla
ced
wit
han
inves
tor
affi
liate
dw
ith
the
dea
l’s
pla
cem
ent
agen
t.R
egre
ssio
nre
sult
sla
bel
ed“Sec
tor
Exper
ience
”in
clude
an
alt
ernati
ve
defi
nit
ion
ofIn
vest
orE
xper
ience
:T
he
fract
ion
ofsa
me
sect
or
dea
lflow
over
the
pre
vio
us
twen
tyfo
ur
month
spurc
hase
dby
inves
tors
inth
eth
eit
hdea
l.T
he
contr
olva
riable
sin
vec
tor
Xi,
tare
defi
ned
inTable
s1
and
2and
are
base
don
the
exte
nded
regre
ssio
ns
(Model
4)
show
nin
Table
s2
and
3.
The
table
pre
sents
resu
lts
wher
eD
isco
unt
isbase
don
pri
ces
from
both
the
Base
Model
and
the
Gen
eralize
dM
odel
.A
llst
andard
erro
rsare
double
clust
ered
by
pla
cem
ent
agen
tand
issu
er.
All
regre
ssio
ns
incl
ude
yea
rfixed
effec
ts.
Regre
ssio
nR
esu
lts:
Dete
rmin
ants
ofO
fferi
ng
Dis
count
Wit
hA
ffiliate
dIn
vest
ors
Base
Pri
cing
Model
Gen
eralize
dP
rici
ng
Model
Affi
liate
dIn
ves
tors
Sec
tor
Exper
ience
Affi
liate
dIn
ves
tors
Sec
tor
Exper
ience
Coeffi
cien
t(t
-sta
tist
ic)
Coeffi
cien
t(t
-sta
tist
ic)
Coeffi
cien
t(t
-sta
tist
ic)
Coeffi
cien
t(t
-sta
tist
ic)
Inte
rcep
t−
0.1
91
(−0.3
7)
−0.0
32
(−0.0
7)
0.2
43
(0.5
0)
0.3
93
(0.8
1)
Rep
eatI
nves
tors
−0.0
65
(−1.7
8)
−0.0
72
(−1.9
7)
−0.0
83
(−2.2
6)
−0.0
90
(−2.5
6)
Num
ber
Inves
tors
−0.0
25
(−2.2
2)
−0.0
22
(−1.8
5)
−0.0
23
(−1.9
3)
−0.0
20
(−1.5
6)
Affi
liate
dIn
ves
tors
−0.1
12
(−1.3
9)
−0.0
38
(−0.3
9)
Gro
ssP
roce
eds
0.0
19
(0.7
4)
0.0
09
(0.3
7)
−0.0
09
(−0.3
6)
−0.0
19
(−0.7
7)
Rate
BB
B0.0
70
(2.9
2)
0.0
71
(2.7
0)
0.1
18
(3.7
6)
0.1
17
(3.6
5)
Rate
BB
−0.0
21
(−0.4
3)
−0.0
19
(−0.3
9)
0.0
49
(0.8
6)
0.0
51
(0.9
0)
Rate
B−
0.0
39
(−0.7
9)
−0.0
38
(−0.7
8)
0.0
69
(1.3
3)
0.0
71
(1.4
0)
Rate
CC
C0.0
07
(0.1
3)
0.0
11
(0.2
1)
0.0
98
(2.0
7)
0.1
03
(2.1
9)
Unra
ted
0.0
01
(0.0
2)
0.0
02
(0.0
4)
0.0
83
(1.6
4)
0.0
85
(1.7
2)
Fee
2.1
41
(2.3
1)
2.1
32
(2.2
1)
1.5
15
(1.1
4)
1.5
65
(1.1
9)
Mark
etShare
0.0
34
(0.6
4)
0.0
44
(0.8
5)
0.0
99
(1.7
8)
0.1
07
(1.9
8)
log
Num
Analy
sts
−0.0
08
(−0.7
6)
−0.0
09
(−0.7
5)
−0.0
12
(−1.0
8)
−0.0
12
(−1.0
3)
log
Mark
etC
ap
−0.0
45
(−3.0
0)
−0.0
42
(−2.7
1)
−0.0
31
(−2.4
7)
−0.0
28
(−2.1
6)
Uncl
ass
ified
Inves
tors
0.0
48
(0.7
6)
0.0
50
(0.8
0)
0.0
95
(1.8
1)
0.0
91
(1.7
6)
NonH
edgeF
unds
−0.0
49
(−1.1
2)
−0.0
47
(−1.1
2)
−0.0
71
(−1.3
5)
−0.0
64
(−1.2
9)
Inves
torE
xper
ience
0.1
33
(0.8
9)
0.1
97
(2.1
1)
0.1
90
(1.3
2)
0.2
46
(1.8
7)
KZIn
dex
0.0
00
(0.1
1)
0.0
00
(0.4
3)
0.0
01
(0.6
8)
0.0
01
(0.8
2)
BA
Ato
AA
ASpre
ad
0.0
23
(0.4
0)
0.0
22
(0.3
8)
0.0
35
(0.7
0)
0.0
34
(0.6
8)
10-y
earT
reasu
ry0.0
45
(2.1
1)
0.0
44
(2.0
5)
0.0
30
(1.4
1)
0.0
29
(1.3
7)
IPO
Under
pri
cing
−0.0
01
(-1.8
0)
−0.0
01
(−1.8
8)
−0.0
01
(−0.9
7)
−0.0
01
(−1.0
2)
IPO
Gro
ssVolu
me
0.0
01
(0.7
4)
0.0
01
(0.7
1)
0.0
00
(0.0
2)
0.0
00
(0.0
3)
EW
Cum
Ret
0.0
44
(0.5
3)
0.0
42
(0.5
0)
−0.1
12
(−0.9
9)
−0.1
13
(−0.9
9)
Matu
rity
0.0
06
(4.6
5)
0.0
06
(4.6
8)
0.0
06
(3.9
6)
0.0
06
(3.9
5)
HH
I−
0.0
30
(−0.2
8)
0.0
19
(0.1
9)
−0.0
08
(−0.1
0)
−0.0
42
(−0.5
0)
Deb
tRatio
−0.0
05
(−0.2
5)
−0.0
10
(−0.5
2)
−0.0
21
(−0.7
6)
−0.0
25
(−0.9
2)
N601
601
575
575
Adju
sted
RSquare
0.2
66
0.2
71
0.2
37
0.2
49
29

Tab
le6:
Sim
ult
aneo
us
Equat
ions
Model
:Fee
and
Dis
count
This
table
pre
sents
two
stage
least
square
ses
tim
ati
on
resu
lts
for
the
follow
ing
sim
ult
aneo
usl
ydet
erm
ined
syst
emofeq
uati
ons:
Dis
count i
,t=
α+
β0F
eei,
t+
β1R
epea
tInves
tors
+β
2N
um
Inves
tors
i,t+
β′ 3X
i,t+
ε i,t,
Fee
i,t
=α
+γ0D
isco
unt i
,t+
γ1S
EO
Spre
ad
i,t+
γ2N
oSE
O+
γ3R
epea
tInves
tors
i,t+
γ′ 5X
i,t+
υi,
t.
Both
Dis
count
and
Fee
are
trea
ted
as
endogen
ous
vari
able
s.A
llva
riable
sare
defi
ned
inTable
s1
and
2,w
ith
the
exce
pti
on
ofSEO
Spre
ad
and
NoSEO
.SEO
Spre
ad
isth
eav
erage
gro
sssp
read
charg
edby
pla
cem
ent
agen
ti
inse
aso
ned
equity
issu
es(a
sre
port
edin
Thom
son’s
SD
Cdata
base
)duri
ng
the
issu
eyea
rt.
NoSEO
isa
dum
my
vari
able
equalto
1if
the
pla
cem
ent
agen
tdid
not
pla
cese
aso
ned
equity
duri
ng
the
yea
rofis
sue.
All
standard
erro
rsare
double
clust
ered
by
pla
cem
ent
agen
tand
issu
er.
All
regre
ssio
ns
incl
ude
yea
rfixed
effec
ts.
PanelA
:D
ependent
Vari
able
:O
ffer
Dis
count
Base
Pri
cing
Model
Gen
eralize
dP
rici
ng
Model
Rep
eat
Inves
tors
Inves
tor
Str
ength
Rep
eat
Inves
tors
Inves
tor
Str
ength
Coeffi
cien
t(t
-sta
tist
ic)
Coeffi
cien
t(t
-sta
tist
ic)
Coeffi
cien
t(t
-sta
tist
ic)
Coeffi
cien
t(t
-sta
tist
ic)
Inte
rcep
t−
0.3
08
(−0.4
8)
−0.4
71
(−0.8
3)
0.1
77
(0.2
6)
0.0
20
(0.0
3)
Fee
4.7
86
(0.6
1)
6.8
50
(0.9
0)
3.4
84
(0.5
2)
5.3
56
(0.8
1)
Rep
eatI
nves
tors
−0.0
67
(−1.9
0)
−0.0
87
(−2.3
8)
Num
Inves
tors
−0.0
21
(−1.8
4)
−0.0
27
(−2.5
0)
−0.0
20
(−1.6
3)
−0.0
27
(−1.8
6)
Str
ength
−0.1
715
(−1.8
1)
−0.1
93
(−2.1
2)
Gro
ssP
roce
eds
0.0
17
(0.7
2)
0.0
23
(1.0
7)
−0.0
12
(−0.4
4)
−0.0
05
(−0.2
0)
Rate
BB
B0.0
74
(3.3
1)
0.0
78
(3.6
2)
0.1
20
(4.0
5)
0.1
24
(4.2
1)
Rate
BB
−0.0
22
(−0.4
2)
−0.0
18
(−0.3
3)
0.0
48
(0.8
4)
0.0
55
(0.9
3)
Rate
B−
0.0
41
(−0.7
8)
−0.0
38
(−0.7
0)
0.0
68
(1.3
3)
0.0
72
(1.3
6)
Rate
CC
C0.0
11
(0.2
1)
0.0
15
(0.2
7)
0.1
02
(2.1
4)
0.1
07
(2.1
8)
Unra
ted
−0.0
01
(−0.0
2)
0.0
02
(0.0
4)
0.0
83
(1.6
2)
0.0
87
(1.6
6)
Mark
etShare
0.0
51
(0.7
9)
−0.0
22
(−0.3
8)
0.1
12
(1.9
4)
0.0
11
(0.2
1)
log
Num
Analy
sts
−0.0
07
(−0.6
6)
−0.0
07
(−0.6
8)
−0.0
11
(−0.9
6)
−0.0
12
(−1.0
1)
log
Mark
etC
ap
−0.0
35
(−1.0
8)
−0.0
31
(−0.9
7)
−0.0
23
(−0.9
4)
−0.0
19
(−0.8
2)
Uncl
ass
ified
Inves
tors
0.0
52
(0.8
1)
0.0
58
(0.8
7)
0.0
94
(1.9
6)
0.0
99
(1.8
9)
NonH
edgeF
unds
−0.0
44
(−0.8
6)
−0.0
34
(−0.7
1)
−0.0
64
(−1.1
4)
−0.0
55
(−1.0
1)
Inves
torE
xper
ience
0.1
44
(0.9
3)
0.1
39
(0.9
1)
0.2
10
(1.4
9)
0.2
01
(1.4
5)
KZIn
dex
0.0
00
(0.2
7)
0.0
00
(0.3
9)
0.0
01
(0.7
0)
0.0
01
(0.8
5)
BA
Ato
AA
ASpre
ad
0.0
32
(0.6
1)
0.0
41
(0.7
5)
0.0
42
(0.6
7)
0.0
51
(0.8
1)
10-y
earT
reasu
ry0.0
42
(1.9
1)
0.0
39
(1.7
1)
0.0
28
(1.2
7)
0.0
25
(1.0
8)
IPO
Under
pri
cing
−0.0
01
(−1.8
3)
−0.0
01
(−1.6
6)
−0.0
01
(−0.8
5)
−0.0
01
(−0.7
0)
IPO
Gro
ssVolu
me
0.0
01
(0.6
1)
0.0
01
(0.7
1)
0.0
00
(0.0
1)
0.0
00
(0.1
4)
EW
Cum
Ret
0.0
42
(0.5
0)
0.0
32
(0.3
7)
−0.1
13
(−1.0
3)
−0.1
23
(−1.1
4)
Matu
rity
0.0
06
(7.6
0)
0.0
06
(6.9
8)
0.0
07
(4.6
9)
0.0
07
(4.6
2)
HH
I−
0.0
11
(−0.0
8)
−0.0
49
(−0.3
7)
0.0
16
(0.1
4)
−0.0
24
(−0.1
8)
Deb
tRatio
−0.0
12
(−0.5
8)
−0.0
12
(−0.6
0)
−0.0
26
(−0.9
6)
−0.0
25
(−0.9
5)
N601
601
575
575
Adju
sted
R-S
quare
0.2
62
0.2
60
0.2
44
0.2
40
30

Tab
le6
Con
tinued
:Sim
ult
aneo
us
Equat
ions
Model
:Fee
and
Dis
count
PanelB
:D
ependent
Varia
ble
:P
lacem
ent
Agent
Fee
Base
Pri
cing
Model
Gen
eralize
dP
rici
ng
Model
Rep
eat
Inves
tors
Inves
tor
Str
ength
Rep
eat
Inves
tors
Inves
tor
Str
ength
Coeffi
cien
t(t
-sta
tist
ic)
Coeffi
cien
t(t
-sta
tist
ic)
Coeffi
cien
t(t
-sta
tist
ic)
Coeffi
cien
t(t
-sta
tist
ic)
Inte
rcep
t0.0
83
(5.2
2)
0.0
81
(4.5
5)
0.0
94
(4.1
2)
0.0
92
(4.2
0)
Dis
count
−0.0
20
(−2.4
0)
−0.0
20
(−2.3
7)
−0.0
18
(−2.1
3)
−0.0
18
(−2.1
3)
Rep
eatI
nves
tors
−0.0
03
(−2.0
4)
−0.0
03
(−2.1
3)
Str
ength
−0.0
02
(−0.5
3)
−0.0
03
(−0.7
1)
SE
OSpre
ad
0.1
15
(2.3
5)
0.1
21
(2.3
7)
0.1
22
(2.3
8)
0.1
29
(2.4
0)
NoSE
O0.0
06
(2.5
9)
0.0
07
(2.7
1)
0.0
07
(2.5
0)
0.0
07
(2.6
1)
Gro
ssP
roce
eds
−0.0
02
(−2.3
3)
−0.0
02
(−2.0
1)
−0.0
03
(−2.4
0)
−0.0
03
(−2.2
1)
Rate
BB
B0.0
01
(0.3
1)
0.0
01
(0.4
0)
0.0
01
(0.6
2)
0.0
01
(0.7
0)
Rate
BB
0.0
00
(0.3
0)
0.0
01
(0.4
9)
0.0
02
(1.0
3)
0.0
02
(1.1
9)
Rate
B0.0
01
(0.3
7)
0.0
01
(0.5
2)
0.0
02
(1.8
6)
0.0
02
(2.0
1)
Rate
CC
C0.0
00
(0.1
5)
0.0
00
(0.2
1)
0.0
02
(1.1
7)
0.0
02
(1.2
1)
Unra
ted
0.0
01
(0.9
2)
0.0
01
(1.1
1)
0.0
02
(1.7
9)
0.0
03
(1.9
2)
Mark
etShare
−0.0
03
(−0.6
7)
−0.0
07
(−1.8
4)
−0.0
01
(−0.3
7)
−0.0
06
(−1.7
0)
log
Num
Analy
sts
−0.0
01
(−1.2
7)
−0.0
01
(−1.3
4)
−0.0
01
(−1.0
3)
−0.0
01
(−1.1
0)
log
Mark
etC
ap
−0.0
04
(−7.4
7)
−0.0
04
(−7.3
6)
−0.0
03
(−7.3
4)
−0.0
03
(−7.2
4)
Uncl
ass
ified
Inves
tors
−0.0
01
(−0.4
9)
−0.0
02
(−0.6
5)
−0.0
01
(−0.4
5)
−0.0
02
(−0.5
9)
NonH
edgeF
unds
−0.0
03
(−1.2
6)
−0.0
03
(−1.2
1)
−0.0
02
(−0.9
0)
−0.0
02
(−0.8
5)
Inves
torE
xper
ience
0.0
15
(2.5
4)
0.0
14
(2.4
4)
0.0
17
(2.3
7)
0.0
16
(2.2
9)
KZIn
dex
0.0
00
(0.5
6)
0.0
00
(0.7
4)
0.0
00
(0.5
7)
0.0
00
(0.7
5)
BA
Ato
AA
ASpre
ad
−0.0
03
(−0.9
8)
−0.0
03
(−0.9
2)
−0.0
02
(−0.7
5)
−0.0
02
(−0.6
8)
10-y
earT
reasu
ry0.0
02
(1.9
9)
0.0
01
(1.8
5)
0.0
01
(1.3
9)
0.0
01
(1.2
9)
IPO
Under
pri
cing
−0.0
00
(−1.3
2)
−0.0
00
(−1.2
5)
−0.0
00
(−1.1
7)
−0.0
00
(−1.0
6)
IPO
Gro
ssVolu
me
0.0
00
(1.3
4)
0.0
00
(1.5
7)
0.0
00
(1.0
5)
0.0
00
(1.2
5)
EW
Cum
Ret
0.0
01
(0.3
5)
0.0
01
(0.4
0)
−0.0
03
(−0.7
7)
−0.0
03
(−0.7
6)
HH
I0.0
14
(2.2
5)
0.0
14
(2.2
7)
0.0
14
(2.4
4)
0.0
15
(2.4
5)
Deb
tRatio
0.0
01
(0.7
9)
0.0
01
(0.8
8)
0.0
01
(0.6
6)
0.0
01
(0.7
5)
N601
601
575
575
Adju
sted
R-S
quare
0.4
29
0.4
28
0.4
34
0.4
33
31

Figure 1: Annual Proceeds and Convertible Bond Issue Discounts
This figure presents the annual total values for Gross Proceeds from convertible bond issues (left vertical axis) andaverage annual values for convertible bond Discount (right vertical axis) over the sample period. The table presentstwo discount measures; Discount, Base Model measures the offering discount relative to theoretical bond pricesusing the Base Model, and Discount, Generalized Model measures the offering discount relative to prices from theGeneralized Model. The sample consists of 601 convertible bonds issued under Rule 144A from 1997 through 2007and the sample comes from Sagient Research’s Placement Tracker database.
15%
20%
25%
30%
20,000
25,000
30,000
35,000
ons (
$)
TotalProceeds
0%
5%
10%
0
5,000
10,000
15,000
1997 2002 2007
Mill
io
Year
Discount, Base Model
Discount, GeneralizedModel
32


