DO-GOODERS AND GO-GETTERS: CAREER …...We study how career incentives aect who selects into public...
68
DO-GOODERS AND GO-GETTERS: CAREER INCENTIVES, SELECTION, AND PERFORMANCE IN PUBLIC SERVICE DELIVERY Nava Ashraf ú Oriana Bandiera Scott S. Lee July 27, 2014 Abstract We study how career incentives affect who selects into public health jobs and, through se- lection, their performance while in service. We collaborate with the Government of Zambia to experimentally vary the salience of career vs. social benefits of a newly created health worker position when recruiting agents nationally. We follow the entire first cohort from application to performance in the field and measure impacts at every stage. We find that making career incentives salient attracts more qualified applicants with stronger career ambitions without dis- placing pro-social preferences, which are high in both treatments. Health workers attracted by career incentives are more effective at delivering health services and are equally likely to remain in their posts over the course of 18 months. Career incentives, far from selecting the "wrong" types, attract talented workers who deliver health services effectively. JEL classification: J24, 015, M54, D82. Keywords: Public services delivery, incentives, selec- tion, pro-social preferences, public sector personnel, occupational choice, salience. Word count: 14,959 ú Corresponding author:Ashraf: HBS and NBER, [email protected]. Bandiera: Department of Economics and STICERD, LSE, [email protected]; Lee: Harvard Medical School and Harvard Business School, [email protected]. We thank the Ministry of Health of Zambia and especially Mrs. Mutinta Musonda for part- nership on this project. We thank the IGC, JPAL Governance Initiative and HBS DFRD for financial support. Adam Grant, Amy Wrzesniewski, and Patricia Satterstrom kindly provided guidance on psychometric scales. We also thank Philippe Aghion, Charles Angelucci, Tim Besley, Pedro Bordalo, Gharad Bryan, Robin Burgess, Greg Fischer, Matt Gentzkow, Maitreesh Ghatak, Brian Hall, Kelsey Jack, Gerard Padro, Imran Rasul, Jesse Shapiro, Bryce Millet Steinberg, Andrei Shleifer, Dmitry Taubinsky and Jean Tirole for helpful comments, as well as seminar participants at University of Tokyo, IZA, IGC Growth Week, London School of Economics, International Food Policy Research Institute, University of Colorado at Boulder, Georgetown University, Toulouse School of Economics, Paris School of Economics, Université de Namur, Stockholm University, Pombeu Fabra University, Yale University, Tufts University, Cornell University, University of Michigan, University of Warwick, Aarhus, Geneva and the World Bank DIME Initiative. We are grateful for the excellent field research assistance of Kristin Johnson, Conceptor Chilopa, Mardieh Dennis, Madeleen Husselman, Alister Kandyata, Mashekwa Maboshe, Elena Moroz, Shotaro Nakamura, Sara Lowes, and Sandy Tsai, and the collaboration of the Clinton Health Access Initiative in Zambia. 1
Transcript of DO-GOODERS AND GO-GETTERS: CAREER …...We study how career incentives aect who selects into public...

DO-GOODERS AND GO-GETTERS: CAREERINCENTIVES, SELECTION, AND PERFORMANCE
IN PUBLIC SERVICE DELIVERY
Nava Ashraf ú
Oriana BandieraScott S. Lee
July 27, 2014
AbstractWe study how career incentives a�ect who selects into public health jobs and, through se-
lection, their performance while in service. We collaborate with the Government of Zambia toexperimentally vary the salience of career vs. social benefits of a newly created health workerposition when recruiting agents nationally. We follow the entire first cohort from applicationto performance in the field and measure impacts at every stage. We find that making careerincentives salient attracts more qualified applicants with stronger career ambitions without dis-placing pro-social preferences, which are high in both treatments. Health workers attracted bycareer incentives are more e�ective at delivering health services and are equally likely to remainin their posts over the course of 18 months. Career incentives, far from selecting the "wrong"types, attract talented workers who deliver health services e�ectively.JEL classification: J24, 015, M54, D82. Keywords: Public services delivery, incentives, selec-tion, pro-social preferences, public sector personnel, occupational choice, salience. Word count:14,959
úCorresponding author:Ashraf: HBS and NBER, [email protected]. Bandiera: Department of Economicsand STICERD, LSE, [email protected]; Lee: Harvard Medical School and Harvard Business School,[email protected]. We thank the Ministry of Health of Zambia and especially Mrs. Mutinta Musonda for part-nership on this project. We thank the IGC, JPAL Governance Initiative and HBS DFRD for financial support.Adam Grant, Amy Wrzesniewski, and Patricia Satterstrom kindly provided guidance on psychometric scales. Wealso thank Philippe Aghion, Charles Angelucci, Tim Besley, Pedro Bordalo, Gharad Bryan, Robin Burgess, GregFischer, Matt Gentzkow, Maitreesh Ghatak, Brian Hall, Kelsey Jack, Gerard Padro, Imran Rasul, Jesse Shapiro,Bryce Millet Steinberg, Andrei Shleifer, Dmitry Taubinsky and Jean Tirole for helpful comments, as well as seminarparticipants at University of Tokyo, IZA, IGC Growth Week, London School of Economics, International Food PolicyResearch Institute, University of Colorado at Boulder, Georgetown University, Toulouse School of Economics, ParisSchool of Economics, Université de Namur, Stockholm University, Pombeu Fabra University, Yale University, TuftsUniversity, Cornell University, University of Michigan, University of Warwick, Aarhus, Geneva and the World BankDIME Initiative. We are grateful for the excellent field research assistance of Kristin Johnson, Conceptor Chilopa,Mardieh Dennis, Madeleen Husselman, Alister Kandyata, Mashekwa Maboshe, Elena Moroz, Shotaro Nakamura,Sara Lowes, and Sandy Tsai, and the collaboration of the Clinton Health Access Initiative in Zambia.
1

1 Introduction
The study of how individuals sort into jobs according to their preferences, skills, and the jobs’own attributes has a long tradition in economics (Roy, 1951). Recent theoretical contributionshighlight that di�erences in pro-social preferences explain how individuals sort into mission-drivencompared to profit-driven organizations (Akerlof and Kranton, 2005; Besley and Ghatak, 2005). Inline with this, a large empirical literature in both economics and psychology finds that survey andexperimental measures of pro-social preferences are correlated with the choice to work in publicservice delivery.1,2
Pro-social preferences align the interests of the agents with those of the organization and thuscan interact with other sources of motivation, such as the attainment of material benefits throughfinancial gain or career advancement. Understanding the nature of this interaction is crucial toidentifying how best to attract and motivate agents engaged in pro-social tasks. The observationthat material incentives are less common in mission-driven organizations is consistent with the factthat pro-social preferences can be an alternative source of motivation to material incentives, butit does not provide information on how the two interact to determine selection and performance.3
Do material benefits leverage pro-social preferences and attract qualified agents who deliver publicservices e�ectively? Or do they crowd out pro-social preferences and attract agents who use theirskills mostly to pursue their private interests at the expense of service quality?
In this paper, we test whether material incentives, in the form of promotion prospects andcareer advancement, a�ect the pro-social preferences and skills of the applicants who self-select intoa public health care job and, through selection, their performance while in service. We collaboratewith the Government of Zambia to create district-level exogenous variation in whether career orsocial incentives were o�ered to applicants for a new health worker position, the Community HealthAssistant (CHA). We follow the entire first cohort of applicants to the CHA position and measure
1The study of public employees’ motivation is the topic of extensive research in public administration and socialpolicy; see, e.g., Perry et al. (2010); Le Grand (2003). Recent empirical contributions in economics include Lagardeand Blaauw (2013), who find that, in an adapted dictator game, giving to patients predicts student nurses’ subsequentdecisions to take rural, hardship posts in South Africa; Smith and Cowley (2011), who find a correlation betweenintrinsic motivation and public sector employment in World Value Surveys; and Dohmen and Falk (2010), who findthat German teachers trust more and are less negatively reciprocal than other employees.
2We use the term “public service delivery” to denote jobs that have a positive externality or pro-social component.Whether the government is the employer is neither necessary nor su�cient, as other types of organizations deliverpublic services, and the government also employs people for jobs that have no pro-social component, such as customso�cers. To the extent that these o�er opportunities for rent-seeking, they might attract agents who are more proneto corruption (Gorodnichenko and Peter, 2007; Hanna and Wang, 2013).
3Reinikka and Svensson (2010) show that wages and a religion-driven mission are negatively correlated amonghealth care facilities in Uganda. Delfgaauw et al. (2011) show that management practices that reward performance areless common in non-profit vs. for-profit nursing homes. A large theoretical literature suggests reasons why materialincentives might reduce performance on pro-social tasks; see, e.g., Benabou and Tirole (2006),Francois (2007), andDelfgaauw and Dur (2008).
2

impacts on their skills and pro-social preferences, and, crucially, on their performance over thecourse of their first 18 months of service.
The key challenge in identifying the selection e�ect of incentives on performance is that anyincentive scheme that a�ects selection at the application stage also a�ects e�ort once agents arehired (Lazear, 2000). Our identification strategy relies on the fact that, since the CHA positionis new, the potential for career advancement is unknown to potential applicants.4 This allowsus to experimentally vary the salience of career and social incentives at the recruitment stage,while providing the same actual incentives to all agents once hired. The di�erence in performancebetween agents recruited through the career incentives treatment and those recruited through thesocial incentives treatment identifies the e�ect of career incentives on performance through selection.
To guide the empirical analysis, we develop a simple framework that illustrates how makingcareer incentives salient can attract applicants with di�erent traits, and how this selection cana�ect the production of the social good. In the model, agents have di�erent ability, and di�erentpreferences for social and career benefits. The distribution of ability and preferences are uncorre-lated. If hired, agents choose how to allocate e�ort between the production of the social good andinfluence activities that solely promote their career.
The model yields predictions on the e�ect of salience policy on the social preferences and abilityof applicants and on the production of the social good. We show that career incentives mightattract higher-ability applicants, and that they attract applicants who, on average, give a lowerweight to social benefits and/or a higher weight to career benefits. The e�ect on social output isthus ambiguous because, other things equal, high ability leads to high output, while a low relativeratio of social to career preferences leads to low output.
The first stage of the empirical analysis shows that, indeed, making career incentives salientattracts applicants who are more qualified (as measured by high-school test scores) and have astronger scientific background (as measured by the number of natural science courses taken andpassed). The distribution of test scores shows that the average di�erences are driven by the factthat career incentives attract more qualified applicants, as opposed to discouraging less qualifiedapplicants. This has important implications for the skill level of those who are eventually selectedfor the job, as qualified candidates can be chosen only if they apply.
The analysis also shows that the share of applicants who display pro-social preferences is highin both treatments, suggesting that career incentives do not displace pro-social motivation. Never-theless, applicants under career incentives give a higher weight to career benefits.5 Taken together,
4The new cadre formalizes and professionalizes lay health worker positions (e.g., village health workers, traditionalbirth attendants, barefoot doctors) and is placed at the lowest rung of the hierarchy in the Ministry of Health. Byvirtue of this, successful applicants will have access to a career path in the civil service, leading to higher-rankedpositions such as nurse, clinical o�cer, and doctor.
5To measure preferences, we draw on the literature in organizational behavior that correlates individual psycho-metric traits with job attributes and performance (Amabile et al., 1994; Wrzesniewski et al., 1997; Barrick et al.,2001; Wageman, 2001; Barrick et al., 2002; Grant, 2008; Gebauer and Lowman, 2008; Duckworth et al., 2007).
3

the findings on ability and preferences indicate that the e�ect on performance in service delivery isa priori ambiguous.
The second stage of the analysis follows the CHAs in the field over the course of 18 months tomeasure their performance in delivering health services. At this stage, CHAs in both treatmentsare similarly aware of career and social benefits, and thus performance di�erences, if any exist,cannot be driven by di�erences in incentives on the job.
The CHAs’ main task is to visit households to conduct environmental inspections, counsel onwomen’s and child health, and refer sick cases to the health post. Our core performance measureis the number of household visits, which is akin to an attendance measure for teachers or nurses:CHAs are supposed to work in people’s houses, and we measure how often they are there. Inaddition to visits, CHAs are supposed to devote one day per week to work at the health post andto organize community meetings. We measure the numbers of patients seen and meetings organized.
We find that CHAs recruited with career incentives conduct 29% more household visits andorganize over twice as many community meetings, while the di�erence in the number of patientsseen at the health post is also positive but not precisely estimated. Supplementary evidence suggeststhat the di�erence is not due to measurement error and is not compensated by improvements onother dimensions, such as the duration of visits, targeting of women and children, or visiting hard-to-reach households. Quantile treatment e�ects reveal that the di�erence between CHAs in thetwo treatment groups is driven by a group of strong performers in the career incentives group, inline with the earlier finding that career incentives attract agents from the right tail of the abilitydistribution.
Our findings provide the first integrated evidence of the e�ect of material incentives on thecharacteristics of agents who apply for a public service delivery job and, crucially, how di�erencesin selection translate into di�erences in performance. We contribute to a small literature thatanalyzes the e�ect of material incentives on the selection of workers in the public sector. Ourfindings on the e�ect of career incentives on applicant traits are in line with Dal Bó et al. (2013),who exploit two randomized wage o�ers for a civil servant job in Mexico and show that higherwages attract more qualified applicants without displacing pro-social preferences.6Importantly, weshow that, while the e�ect of this selection pattern on output is theoretically ambiguous, in oursetting, material incentives lead to higher performance. The performance findings are in line withPropper and Van Reenen (2010), who exploit centralized wage setting for medical sta� in the UKto demonstrate that high wages increase hospital productivity and reduce mortality rates.
6The finding that material incentives, via career benefits, attract more qualified applicants echoes findings thatpay-for-performance attracts more productive and more skilled employees in the private sector (Bandiera et al., 2013;Lazear, 2000). That higher wages attract better-quality applicants is also found in a related literature on wages andjob queues in the private sector (Holzer et al., 1991; Marinescu and Woltho�, 2013) and on the e�ect of wages on theselection and performance of politicians (Ferraz and Finan, 2011; Gagliarducci and Nannicini, 2011).
4

Our analysis complements the literature that evaluates the e�ect of introducing material incen-tives for existing public-sector employees in developing countries, especially for teachers (Muralid-haran and Sundararaman, 2011; Duflo et al., 2012; Miller et al., 2012), by showing the e�ect ofmaterial incentives on the traits of the agents who sort into these jobs in the first place, and howthis selection a�ects performance.
The paper is organized as follows: Section 2 presents the theoretical framework; Section 3describes the context and research design; Sections 4, 5, and 6 evaluate the e�ect of career incentiveson the applicant pool, selected pool, and performance, respectively. Section 7 concludes.
2 Framework
2.1 Set up
This section develops a simple theoretical framework to illustrate how di�erent job attributes attractapplicants with di�erent skills and preferences, and how this selection can a�ect the production ofthe social good. The model also makes precise the assumptions under which di�erences in saliencepolicy can be used to identify the e�ect of career incentives on performance through selection.
The model is explicitly tailored to our context, where the Government (the principal) hiresagents for the newly created Community Health Assistant (CHA) position to produce a socialgood—i.e., to deliver health services to people in rural areas. In addition to a fixed monthly wage,the CHA position has two main attributes that determine the benefits agents can draw from it.First, CHAs are a new cadre of civil servants and therefore a new entry point in the civil service.CHAs are eligible for promotions into higher-ranked cadres, who receive higher pay. We referto this as the “career benefits” of the job. Second, CHAs are hired to deliver health services incommunities with severe shortages of health sta�, and, as such, their impact on community welfareis potentially very large. We refer to this as the “social benefits” of the job.
Principal’s Choice
Denote by C (S) the true magnitude of career (social) benefits, with no assumption about whichbenefit of the job is larger. At an earlier stage, the principal chooses the monthly wage and themagnitude of career benefits C -i.e., by choosing how easily CHAs can access higher positions. Wedo not model these choices, as they are made prior to the experimental phase. At the recruitmentstage, the principal chooses salience policy j œ {fi, ‡}, which determines the agents’ perceived career(social) benefits Cj (Sj) prior to applying for the job. While salience can a�ect agents’ choices evenin settings where agents are informed or can easily access information from other sources (Chettyet al., 2009; Bordalo et al., 2013), in our context, the salience policy entirely determines the agents’
5

perception of job attributes when applying. This is because CHA positions are newly created andadvertised for the first time; hence, agents have no information and cannot access information otherthan through the Government.
If career benefits are made salient, agents perceive benefits (Cfi, Sfi), whereas if social benefitsare made salient, agents perceive (C‡, S‡) where C‡ Æ Cfi, S‡ > Sfi. For simplicity, we assumeCfi = C, Sfi = 0 and C‡ = 0, S‡ = S. The agents’ application decision will depend on theiranticipated optimal e�ort choice given these perceived benefits. If hired, agents find out all detailsof the job and perceive benefits correctly, that is, (C, S).
Agents’ Choice
Agents di�er on two dimensions: ability and mission. These are independently drawn acrossindividuals. Agent i has ability ai distributed uniformly on [0, 1] and reservation utility vai (agenti’s payo� when not applying or not obtaining the position), v > 0. The higher the agent’s abilitythe higher his/her reservation utility. Agent i’s mission determines (ci,si), the weight agent i putson career and social benefits.
For simplicity, we restrict the analysis to three missions types. We assume that there are ns Ø 0“social mission” agents, who only value social benefits (ci= 0,si = 1); nc Ø 0 “career mission”agents, who only value career benefits (ci= 1,si = 0); and nh Ø 0 “hybrid mission” agents, whovalue both social and career benefits (ci= 1,si = 1). We thus assume that the weights agents put oncareer and social benefits are independent of the level of the benefits themselves or their interaction.We focus on the more interesting case where agents’ mission preferences are heterogeneous, that iswhere at least two of (ns, nc, nh) are strictly positive.
We assume that both career and social benefits have a fixed component, which we normalize to1, and a variable component that depends on the e�ort agents devote to pursue career and socialgoals.7 We assume that agents have one unit of e�ort that they must allocate between a task thatfurthers their careers, such as influence activities that increase the expected utility of the agentand take time away from productive activities (Milgrom, 1988), and a task that contributes to thesocial good. For sharper focus, we assume that allocating e�ort to the social good does not fosterthe agents’ career; relaxing this assumption leaves the results qualitatively unchanged as long asthere is scope for influence activities to attain career benefits.
The output of either task is increasing in e�ort (at a decreasing rate) and ability. Denote by ei
the e�ort that agent i devotes to the social task. Then, the output of the social task is equal toai
Ôei, and the output of the career task is ai
Ô1 ≠ ei. E�ort is non-contractible.
7The fixed component is meant to capture the benefits that accrue to all agents regardless of their e�ort—e.g., thewarm glow from having a socially useful job or the value of being eligible for promotions into higher-ranked cadres.The variable component captures benefits that depend on the e�ort the agents devote to tasks that can promote theircareer and those that produce social output—e.g., the probability that patients heal.
6

Agents use ex-ante utility, based on perceived benefits, to decide whether to apply. The ex-anteutility of agent i under salience policy j is given by:
Uij = w + ciCj(1 + aiÔ
1 ≠ ei) + siSj(1 + aiÔ
ei)
where w is the wage, the second term represents career benefits, and the third term social benefits.Note that the second and third terms are positive if and only if agent i’s mission is congruentwith salience policy j—that is, if agent i puts positive weight on the attribute made salient bypolicy j. The salience policy determines who applies because it determines expected payo�s at theapplication stage.
We assume that agents face application cost k, which captures the cost of both collectingdocuments and forsaking one year’s earnings by attending unpaid training. Finally, we assumethat agents are selected with a fixed exogenous probability, which we normalize to 1.8
2.2 Solution
Agent i under salience policy j applies if and only if:
Uij ≠ k Ø vai (2.1)
For simplicity, we assume that w ≠ k < 0 such that agents whose mission is not congruent withthe salience policy do not apply for the job. In other words, the wage by itself is not high enoughto make it worthwhile for agents to bear the application cost, and thus a necessary condition foragents to apply is that the job fits their mission. All implications are qualitatively una�ected ifwe relax this assumption as long as the wage is not high enough such that it is worthwhile for allapplicants to apply regardless of their mission preferences and the attributes of the job, i.e. as longas w ≠ k < v. We also assume that w + min(C, S) ≠ k > 0, which guarantees a positive number ofapplications under either policy. Finally, we assume that v ≠ max(C, S) > 0, namely the returnsto ability are higher in the outside option than they are in the CHA job.
To decide whether to apply, agents compare the utility on the job under the optimal e�ortlevel to the outside option. Under the career salience policy, Ui = w ≠ k < 0 < vai for allagents for whom ci = 0, so these do not apply. Agents for whom ci > 0 choose ei to maximizeUifi = w + ciC(1 + ai
Ô1 ≠ ei) subject to e œ [0, 1] and are therefore in a corner solution at ei = 0.
If hired, their utility is w + C(1 + ai) ≠ k which is higher than their outside option if and only8In practice, the number of successful candidates is fixed, and thus the probability of being selected depends on
the number of applicants and the agent’s ability relative to the other applicants. However, individual applicants areunaware of the number of applications for a given post and of the ability distribution of their fellow applicants, hencethey take the probability of being recruited as exogenous.
7

if ai Æ afi = minË
w+C≠kv≠C , 1
È. Symmetrically, under the social salience policy, social-mission and
hybrid-mission agents expect to choose ei = 1 and apply if and only if ai Æ a‡ =minË
w+S≠kv≠S , 1
È
while career-mission agents do not apply.
2.3 The E�ect of Career Incentives on the Applicant Pool
The framework yields three results on the number of applicants, their ability and mission prefer-ences.
Result 1: Numbers. Making career benefits salient increases the number of applicants if it in-creases the ability threshold ( afi>a‡) and the number of agents with career preferences is su�cientlylarge relative to agents without.
When career benefits are made salient, a fraction afi of agents with a career or hybrid missionapply, and the total number of applicants is afi(nc + nh); when social benefits are made salient,a fraction a‡ of agents with a social or hybrid mission apply and the total number of applicantsis a‡(ns + nh). If the ability threshold is higher under career incentives ( afi>a‡) the number ofapplicants will be higher if and only if afinc + (afi ≠ a‡)nh >a‡ns, that is if the number of agentswho value career benefits (nc +nh) is su�ciently large relative to those who do not ns. Thus careerincentives might attract more qualified applicants but fewer of them.
Result 2: Ability. Making career benefits salient weakly increases the ability of the averageapplicant if and only if career benefits are larger than social benefits (C > S).
Intuitively, the value of career and social benefits determines the agents’ expected utility onthe job, and hence the ability threshold, that is the threshold beneath which all applicants apply:the larger the benefit, the higher the threshold, and hence the higher the ability of the averageapplicant. Under salience policy j, Uij ≠ k Ø vai if and only if ai Æ min[w+z≠k
v≠z , 1] for z œ {C, S}.
Average ability is aj=12
1w+z≠k
v≠z
22if min
Ëw+z≠k
v≠z , 1È
= w+z≠kv≠z , and otherwise aj = 1
2 . Thus, ifw+S≠k
v≠S < 1 and w+C≠kv≠C < 1 then afi > a‡ if and only if C > S.
Result 3: Mission Preferences. Making career benefits salient decreases the average weightput on social benefits and/or it increases the average weight put on career benefits but not necessarilyboth.
When career benefits are made salient, candidates only apply if they value career benefits;among these, only applicants with a hybrid mission value social benefits, so the average weightput on social benefits is nh
(nh+nc) Æ 1. When social benefits are made salient, all agents who applyvalue social benefits so the average weight put on social benefits is 1. Symmetrically, when careerbenefits are made salient all agents who apply value career benefits so the average weight put on
8
career benefits is 1; when social benefits are made salient only those with a hybrid mission valuecareer benefits, so the average weight put on career benefits is nh
(nh+ns) Æ 1.Note that if nc = 0 the average weight put on social benefits is equal to 1 under both salience
policies but the assumption that agents’ mission preferences are heterogeneous implies that whennc = 0 , both nh > 0 and ns > 0. Hence, the average weight put on career benefits is necessarilyhigher under the career salience policy. Symmetrically, if ns = 0 the average weight put on careerbenefits is equal to 1 under both salience policies but the assumption that agents’ mission preferencesare heterogeneous implies that when ns = 0 , both nh > 0 and nc > 0. Therefore, the averageweight put on social benefits is necessarily lower under the career salience policy.
Note that selection can create a correlation between mission types and ability among the ap-plicants, even though mission types and ability are uncorrelated in the population. In particular,when career benefits are made salient and C > S, the average applicant will value career benefitsmore and their ability will also be higher.9
2.4 The E�ect of Career Incentives on Social Output
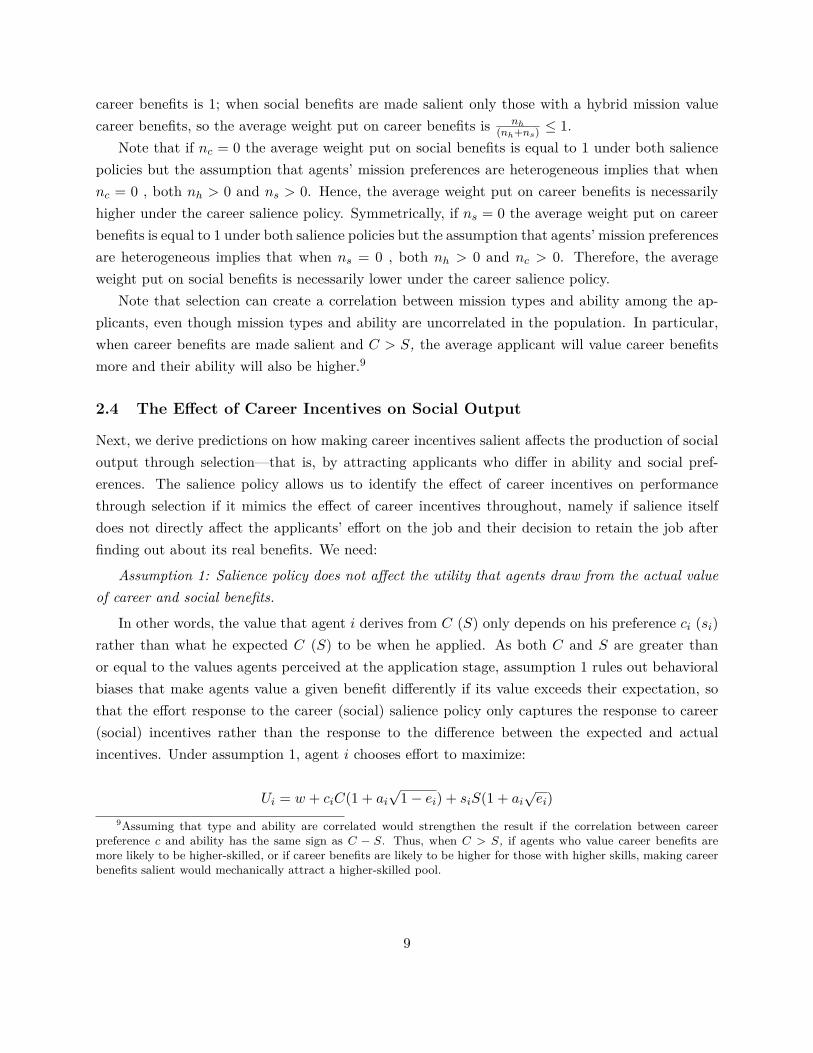
Next, we derive predictions on how making career incentives salient a�ects the production of socialoutput through selection—that is, by attracting applicants who di�er in ability and social pref-erences. The salience policy allows us to identify the e�ect of career incentives on performancethrough selection if it mimics the e�ect of career incentives throughout, namely if salience itselfdoes not directly a�ect the applicants’ e�ort on the job and their decision to retain the job afterfinding out about its real benefits. We need:
Assumption 1: Salience policy does not a�ect the utility that agents draw from the actual valueof career and social benefits.
In other words, the value that agent i derives from C (S) only depends on his preference ci (si)rather than what he expected C (S) to be when he applied. As both C and S are greater thanor equal to the values agents perceived at the application stage, assumption 1 rules out behavioralbiases that make agents value a given benefit di�erently if its value exceeds their expectation, sothat the e�ort response to the career (social) salience policy only captures the response to career(social) incentives rather than the response to the di�erence between the expected and actualincentives. Under assumption 1, agent i chooses e�ort to maximize:
Ui = w + ciC(1 + aiÔ
1 ≠ ei) + siS(1 + aiÔ
ei)9Assuming that type and ability are correlated would strengthen the result if the correlation between career
preference c and ability has the same sign as C ≠ S. Thus, when C > S, if agents who value career benefits aremore likely to be higher-skilled, or if career benefits are likely to be higher for those with higher skills, making careerbenefits salient would mechanically attract a higher-skilled pool.
9
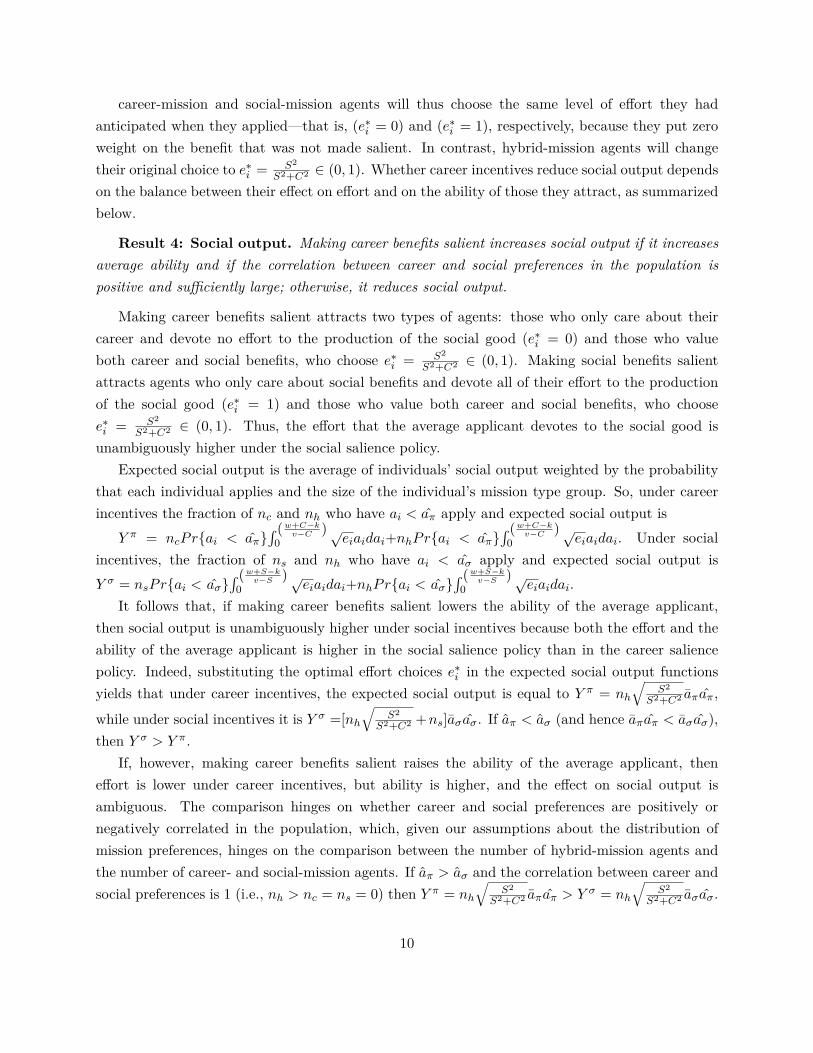
career-mission and social-mission agents will thus choose the same level of e�ort they hadanticipated when they applied—that is, (eú
i = 0) and (eúi = 1), respectively, because they put zero
weight on the benefit that was not made salient. In contrast, hybrid-mission agents will changetheir original choice to e
úi = S2
S2+C2 œ (0, 1). Whether career incentives reduce social output dependson the balance between their e�ect on e�ort and on the ability of those they attract, as summarizedbelow.
Result 4: Social output. Making career benefits salient increases social output if it increasesaverage ability and if the correlation between career and social preferences in the population ispositive and su�ciently large; otherwise, it reduces social output.
Making career benefits salient attracts two types of agents: those who only care about theircareer and devote no e�ort to the production of the social good (eú
i = 0) and those who valueboth career and social benefits, who choose e
úi = S2
S2+C2 œ (0, 1). Making social benefits salientattracts agents who only care about social benefits and devote all of their e�ort to the productionof the social good (eú
i = 1) and those who value both career and social benefits, who choosee
úi = S2
S2+C2 œ (0, 1). Thus, the e�ort that the average applicant devotes to the social good isunambiguously higher under the social salience policy.
Expected social output is the average of individuals’ social output weighted by the probabilitythat each individual applies and the size of the individual’s mission type group. So, under careerincentives the fraction of nc and nh who have ai < afi apply and expected social output is
Y
fi = ncPr{ai < afi}´ ( w+C≠k
v≠C )0
Ôeiaidai+nhPr{ai < afi}
´ ( w+C≠kv≠C )
0Ô
eiaidai. Under socialincentives, the fraction of ns and nh who have ai < a‡ apply and expected social output isY
‡ = nsPr{ai < a‡}´ ( w+S≠k
v≠S )0
Ôeiaidai+nhPr{ai < a‡}
´ ( w+S≠kv≠S )
0Ô
eiaidai.It follows that, if making career benefits salient lowers the ability of the average applicant,
then social output is unambiguously higher under social incentives because both the e�ort and theability of the average applicant is higher in the social salience policy than in the career saliencepolicy. Indeed, substituting the optimal e�ort choices e
úi in the expected social output functions
yields that under career incentives, the expected social output is equal to Y
fi = nh
ÒS2
S2+C2 afiafi,
while under social incentives it is Y
‡ =[nh
ÒS2
S2+C2 +ns]a‡a‡. If afi < a‡ (and hence afiafi < a‡a‡),then Y
‡> Y
fi.If, however, making career benefits salient raises the ability of the average applicant, then
e�ort is lower under career incentives, but ability is higher, and the e�ect on social output isambiguous. The comparison hinges on whether career and social preferences are positively ornegatively correlated in the population, which, given our assumptions about the distribution ofmission preferences, hinges on the comparison between the number of hybrid-mission agents andthe number of career- and social-mission agents. If afi > a‡ and the correlation between career andsocial preferences is 1 (i.e., nh > nc = ns = 0) then Y
fi = nh
ÒS2
S2+C2 afiafi > Y
‡ = nh
ÒS2
S2+C2 a‡a‡.
10

If afi > a‡ and the correlation between career and social preferences is ≠1 (i.e., nh = 0, nc >
0, ns > 0) then Y
fi = 0 < Y
‡ = nsa‡a‡. Generally, ˆ(Y fi≠Y ‡)ˆnc
< 0, ˆ(Y fi≠Y ‡)ˆns
< 0, ˆ(Y fi≠Y ‡)ˆnh
> 0. Insummary, the framework illustrates that making career benefits salient can attract higher-abilityapplicants, but the e�ect that this has on social output is ambiguous and it depends on the socialpreferences of these higher-ability agents.
3 Context and Research Design
3.1 Context and Data
In 2010, the Government of Zambia (GOZ) launched a program to create a new civil servicecadre called the Community Health Assistant (CHA). The goal of this program was to createan “adequately trained and motivated community-based health workforce, contributing towardsimproved service delivery [and] the attainment of the Millennium Development Goals (MDGs)and national health priorities” (Government of Zambia, 2010). GOZ sought to formalize andprofessionalize a position similar to other lay health worker positions (e.g., village health workers,traditional birth attendants, barefoot doctors) in which work is done primarily in the community.CHAs are supposed to devote 80% of their time (4 out of 5 working days per week) to householdvisits. In the remaining time, CHAs are expected to assist sta� at the health post (the first-levelhealth facility in rural Zambia) by seeing patients, assisting with antenatal care, and maintainingthe facility. They are also supposed to organize community meetings such as health education talksat the health post and in schools. Mapping back to the theoretical framework, household visits,patients and community meetings constitute “social output” that (i) depends on the CHAs’ e�ort;(ii) brings benefits to the community and directly to the CHAs who put a positive weight on thesebenefits.
In addition to social benefits, the CHA position confers career benefits because it is an entrypoint into the civil service from which agents can advance to higher-ranked and better paid cadres.Promotion into higher-ranked cadres within the Ministry of Health from the position of CHArequires additional training (for example, nursing or medical school). Being part of the civil service,CHAs are eligible for “in-service training”, meaning that they attend school as a serving o�cer andthe government pays their tuition for all of their training. In order to be eligible, they need toensure that they are included in the in-training plan for the district for the upcoming year and thatthey are accepted into the school. CHAs can devote time and e�ort to learning about how to getinto the in-training plan for the district and into the school and to influence those that make thesedecisions. In terms of the model this is the e�ort devoted to the career task that takes time awayfrom the social output.
11

In the program’s first year, GOZ sought to recruit, train, and deploy roughly 330 CommunityHealth Assistants across seven of Zambia’s nine provinces.10 Within these seven provinces, basedon population density, GOZ chose the 48 most rural of the 58 constituent districts. Finally, acrossthese 48 districts, GOZ identified 165 health posts that were deemed to be facing the most severehealth worker shortages.11 From each community that surrounded each health post, the intentionwas to recruit two CHAs. We collaborated with GOZ at each stage of the recruitment process inall 48 districts as described below.
Stage 1: Job Ads and Application Requirements
The recruitment and selection process occurred at the community (health post) level, with on-the-ground implementation coordinated by district health o�cials. In each community, paperadvertisements for the job were posted in local public spaces, such as schools, churches, and thehealth post itself. District health o�cials were responsible for ensuring that the recruitment posterswere posted. To ensure that the recruitment process was carried out in a uniform manner acrossthe 165 communities, GOZ included detailed written instructions in the packets containing therecruitment materials (posters, applications, etc.) that were distributed to district health o�cials(see Appendix D).
The recruitment poster provided information on the position – varied experimentally as de-scribed below – and the application requirements and process. The posters specified that applicantshad to be Zambian nationals, aged 18-45 years, with a high school diploma and two passing “O-levels.”12 The posters instructed eligible applicants to retrieve application forms from the healthcenter associated with the health post.13 The application form included questions covering ba-sic demographics (gender, date of birth, village of residence, educational qualifications), previoushealth experience, and the means by which the applicant first learned of the CHA job opportunity.In keeping with the principle that CHAs should be members of the communities that they serve,the application form also required applicants to obtain two signatures before submission: the signed
10The two other provinces, Lusaka and Copperbelt, were excluded by GOZ on grounds that they are the mosturbanized of Zambia’s provinces.
11Health facilities in Zambia are structured according to a population-based hierarchy. Health posts are the first-level health facility for most rural communities and provide basic medical care (no inpatient or surgical services).Health centers, which typically serve a population encompassing four to five health posts, provide both outpatient andinpatient services, including labor and delivery and minor surgical procedures. District hospitals in turn encompassseveral health center catchment areas and are primarily focused on inpatient care.
12Ordinary levels, or O-levels, are written subject exams administered to Zambian students in their final year ofsecondary school. They are the primary entry qualification into tertiary education. The Examinations Council ofZambia requires candidates to take a minimum of six O-level exams, including English and mathematics as compulsorysubjects that have to be passed. There are currently 33 O-level subjects, such as biology, chemistry, civic education,woodworking, and accounting. Exam performance is rated on a nine-point scale, ranging from “distinction” to“unsatisfactory;” all but the lowest point-score are considered passing. The cost of taking O-level exams comprises aregistration fee of roughly USD 16 and an exam fee of USD 10 per subject.
13This decision was made because the former was consistently sta�ed, whereas the latter was not. The mediandistance between health centers and health posts in our sample is 24 kilometers.
12

endorsement of a representative of the applicant’s “neighborhood health committee” (NHC), fol-lowed by the signed verification of the application by the health worker in charge of the associatedhealth center.14 Applicants were to hand in their application forms, along with photocopies oftheir national registration cards and high school transcripts, to the health center within two weeksof the posters being posted. All recruitment in the seven provinces occurred between August andOctober 2010.
In total across the full sample, 2,457 applications were received. After the recruitment pro-cess was complete, we collected and entered all application forms and recorded whether the twosignatures were obtained and whether the photocopies were attached.
Stage 2: Interviews and Selection by Panels
Once the application window closed, all completed application forms were taken to the districtMinistry of Health o�ce. There, district health o�cials screened applications to ensure that eligi-bility requirements were met. No discretion was given at this stage; applicants who did not meetthe objective criteria were rejected, and those who did were invited for interviews. Overall, 1,804(73.4%) applicants passed the initial screening and were invited for interviews.
District o�cials were in charge of organizing interview panels at the health post level, suchthat a district with multiple participating health posts would have multiple interview panels. Eachselection panel had five members: the district health o�cial, a representative from the health post’sassociated health center, and three members of the local neighborhood health committee.15 Afterinterviews were complete, panels were asked to nominate and rank the top two candidates and upto three reserves. GOZ explicitly stated a preference for women and for those who had previouslyworked as community health workers, but the ultimate choice was left to the panels.16
At the interviews, all candidates were asked to complete a brief questionnaire that collectedfurther information on demographic background, community health experience, social capital, andwork preferences and motivations.
Of the 1,804 eligible applicants, 1,585 (87.9%) reported on their interview day and were inter-viewed. After the recruitment process was complete, we collected and entered the selection panelnomination forms as well as the ranking sheets containing each panelist’s rankings of his or her topfive candidates.
14The neighborhood health committee is a para-statal institution at the community level in rural Zambia. TheNHC is comprised of elected, volunteer community representatives whose collective responsibility is to coordinatecommunity health e�orts, such as immunization campaigns and village meetings about common health issues.
15Neighborhood health committees vary in size, but they typically have more than 10 members.16In addition to submitting panel-wide nominations, individual panel members were instructed to rank their
top five preferred candidates independently and, to this end, were given ranking sheets to be completed privately.Specifically, the ranking sheet instructions stated: “This ranking exercise should occur BEFORE panel membersformally deliberate and discuss the candidates. Note that the ranking sheets are private and individual. Each panelmember should fill out the ranking sheet confidentially so as to encourage the most honest responses. This step mustbe completed before the panel discussion.”
13

Stage 3: Final Selection, Training and Deployment
Out of the 1,585 interviewees, for the 165 health posts, the panels nominated 334 applicants as“top 2” candidates and 413 as reserves. The nominations were reviewed centrally by GOZ, and 334final candidates were invited to join a yearlong CHA training. Of these, 314 applicants acceptedthe invitation and, in June 2011, moved to the newly built training school in Ndola, Zambia’ssecond-most populated city.17
Upon arrival at the training school, we administered a detailed questionnaire to all trainees inorder to collect standard psychometric scales to measure pro-social preferences and career orienta-tion. We also implemented a modified dictator game that has been shown to predict performanceon pro-social tasks (Ashraf et al., 2013) and choices by public-sector nurses to locate to rural areas(Lagarde and Blaauw, 2013).
Of the 314 applicants who joined the program, 307 graduated and started working as CHAs inAugust 2012. All CHAs were deployed to their communities of origin, and we collected performancemeasures on household visits and other tasks over the course of eighteen months. At this stage,applicants from the two treatments had the same information about job attributes, including careerand social benefits. Thus, any di�erence in behavior observed after this stage can only be due todi�erences in the selection procedure.
3.2 Experimental Design
The experiment aims to identify the e�ect of career vs. social incentives on selection and throughthis, the performance of CHAs. We use the recruitment posters described above to experimentallyvary the salience of the two incentives at the recruitment stage so as to engineer an exogenous changein selection. Once recruited, all CHAs face the same incentives; thus performance di�erences, ifany, are due to selection. The posters, shown in Figures I.A and I.B, are identical except for thelist of benefits and the main recruitment message.
To make career incentives salient, the career poster lists, as the main benefit, the opportunityto ascend the civil-service career ladder to higher and better-paid positions—e.g., environmentalhealth technician, nurse, clinical o�cer. This incentive is summarized in a caption stating, “Becomea community health worker to gain skills and boost your career!”18 In this setting, the pay gradientassociated with career advancement is steep, as the starting monthly wage is USD 290 for CHAs,USD 530 for entry-level nurses, USD 615 for environmental health technicians, and USD 1,625 for
17The final 314 CHA trainees di�ered from the 334 “top 2” nominees in two ways: (i) to obtain gender balance,GOZ replaced all male nominees (i.e., men ranked 1 or 2 by the interview panels) with female reserves (i.e., womenranked 3 to 5) when available, resulting in 68 changes, and (ii) some of the applicants who were ranked “top 2”declined and were replaced by reserves. By the time training commenced, sixteen spots remained empty despitee�orts to fill them with reserves.
18When the recruitment process was launched, the position was called “Community Health Worker” or “CHW.”It was later renamed “Community Health Assistant.”
14

resident doctors.19 Importantly, since there are shortages of health sta� at every level, advancingto higher cadres does not require leaving the community.
To make social incentives salient, the community poster lists, as the main benefit, the opportu-nity to contribute to one’s community, such as “[gaining] the skills you need to prevent illness andpromote health for your family and neighbors” and “[being] a respected leader in your community.”This incentive is summarized in a caption stating, “Want to serve your community? Become acommunity health worker!”
Since recruitment for the CHA position was organized by district o�cials, we randomized treat-ment at the district level in order to maximize compliance with the experimental assignment, evenlysplitting the 48 districts into two treatment groups. This implies that each district o�cial is onlyexposed to one treatment and is unaware of the other. As district o�cials are the main sourceof information for aspiring CHAs, randomization at the district level minimizes the risk of con-tamination. Randomization at the district level also mitigates the risk of informational spilloversbetween communities, as the distance between health posts in di�erent districts is considerablylarger. Random assignment of the 48 districts is stratified by province and average district-leveleducational attainment.20
To ensure compliance with the randomization protocol, we worked closely with GOZ to stan-dardize the information given to the district o�cials to organize the recruitment process.21 Toreinforce the treatment, we also include a basic written script that the district o�cials are invitedto use to orient health centers and neighborhood health committees on the CHA program andrecruitment process. In the career incentives treatment, the script describes the new program asfollows: “This is an opportunity for qualified Zambians to obtain employment and to advance theirhealth careers. Opportunities for training to advance to positions such as Nurse and Clinical O�cer
19At the time of the launch of the recruitment process in September 2010, GOZ had not yet determined howmuch the CHAs would be formally remunerated. Accordingly, the posters did not display any information aboutcompensation. Although the CHA wage was unknown to applicants at the time of application (indeed, unknown evento GOZ), applicants would likely have been able to infer an approximate wage, or at least an ordinal wage ranking,based on the “community health” job description and the relatively minimal educational qualifications required, bothof which would intuitively place the job below facility-based positions in compensation. In Section 5.2, we presentevidence against the hypothesis that wage perceptions may have di�ered by treatment.
20We stratify by the proportion of adults in the district who have a high school diploma, as reported in the mostrecent World Bank Living Conditions Measurement Survey, conducted four years prior in 2006. We sort districtsby province and, within each province, by high school graduation rate. Within each sorted, province-specific list ofdistricts, we take each successive pair of districts and randomly assign one district in the pair to the career incentivestreatment and the other to the social incentives treatment. For provinces with an odd number of districts, we poolthe final unpaired districts across provinces, sort by educational attainment, and randomize these districts in thesame pair-wise manner.
21District o�cials are given a packet containing 10 recruitment posters and 40 application forms for each healthpost and are asked to physically distribute each packet to the respective health center and, from there, to ensurethat recruitment posters are posted, application forms are made available, and so forth. The packets are sealed andlabeled according to the health post and health center for which it should be used. GOZ provides fuel allowances tothe district o�cials to enable the districts to follow through on the protocol. We conduct a series of follow-up callsover several weeks to the district point-persons to ensure that the recruitment process is conducted as planned.
15

may be available in the future.” In contrast, in the social incentives treatment, the script states,“This is an opportunity for local community members to become trained and serve the health needsof their community.”
Table I illustrates that the randomization yielded a balanced sample on all observable health-post and area characteristics that might a�ect the work conditions of the CHAs. Four points are ofnote. First, health posts are poorly sta�ed in both treatment arms. Second, in line with these beingin rural areas, population density and the extent to which households live on their farms instead ofvillages is similar in both treatments. This is relevant as travel times between households dependon population density and are higher when they are scattered over a large area, as opposed to beingconcentrated in a village. Third, take-up of basic health products and practices (insecticide-treatednets and latrines) is low, but again balanced across treatments. Finally, over 90% of the catchmentareas in both treatment groups have at least some cell network coverage, which is relevant for ouranalysis, as some performance measures are collected via SMS text message.
4 The E�ect of Career Incentives on the Applicant Pool
4.1 Number of Applications and Samples
The recruitment drive yielded 2,457 applications, an average of 7.4 applicants for each position.Both the total number of applicants and their distribution across health posts is similar in thetwo treatment groups: career incentives attract 1,232 applicants in total and an average of 7.2per position, while social incentives attract 1,225 applicants in total and an average of 8.0 perposition.The theoretical framework makes precise that the e�ect of career incentives on the numberof applicants is ambiguous, as it depends on the number of individuals who value career benefits inthe population and on the ability threshold below which these apply.
All the applications received were pre-screened by district o�cials, and all applicants whomet eligibility criteria were invited to be interviewed by selection panels. District o�cials hadno discretion at this stage, and screening was based purely on objective requirements. Overall,1,585 candidates met the requirements and were interviewed, 48% of whom came from the careerincentives treatment and 52% from the social incentives treatment. These 1,585 candidates formour main sample for the analysis below, as data on applicants’ traits other than basic demographicsand education measures were collected at the interview stage. All results reported below are robustto using the entire sample of applicants for measures that are available for both samples.
The rest of this section estimates the e�ect of career incentives on the applicants’ skills, missionpreferences and other traits. Throughout, we report mean values in the two treatment groups andthe p-value of the di�erence from a regression of the outcome of interest on the career treatmentand the stratification variables, with errors clustered at the level of randomization, the district.Whenever we have more than one measure for the same outcome we report average standarized
16

treatment e�ects by outcome family to account for multiple inference. To probe the robustnessof the statistical inference we also report p-values based on randomization inference. To computethese we simulate 1,000 placebo random assignments of districts to treatment, estimate the careertreatment e�ect in each of these 1,000 placebo assignments for each variable and report the shareof placebo coe�cients that are larger or equal to the actual treatment e�ects.
4.2 Ability
Part I of Table II provides evidence on whether the ability threshold for applicants di�ers in thetwo treatment groups. Part II presents the same information for selected candidates and will bediscussed in the next section once we review the selection process.
To measure ability we collected detailed information on all applicants’ high school results, basedon the extensive literature that finds test scores strongly correlate with cognitive ability and earnings(Murnane et al., 1995; Neal and Johnson, 1996). As noted above, applicants were required to havefinished grade 12 with two passed O-levels. The Examinations Council of Zambia requires thatcandidates take a minimum of six O-level exams, with English and mathematics being compulsory.In addition, students choose among subjects in the natural sciences, arts and humanities, andbusiness studies. Admission to university requires passing five O-levels with at least two “credits”(grades 1-6 on a 1-9 scale).
Table II, Panel A shows that applicants in both treatments exceed the required two O-levelthreshold as over 70% of applicants have passed at least five and qualify for university admission.Table II, Panel A also shows that making career incentives salient attracts more qualified candidates.Applicants in the career treatment are 6 percentage points more likely to qualify for universityadmission (p=.013), which is relevant if they plan to move up to positions that require a universitydegree, have a higher total score (p=.019), and have a stronger scientific background (p=.006),which is directly relevant to medical practice. The average standarized treatment e�ect is positiveand precisely estimated. To investigate whether the average di�erences are indeed driven by the factthat career incentives attract more qualified applicants, as opposed to discouraging less qualifiedapplicants, Figure II plots kernel density estimates of the total O-level score by treatment andreports quantile treatment e�ect estimates. These graphs illustrate that, in line with the abilitythreshold being higher, the average di�erence is mostly driven by applicants on the right tail,which is thicker and longer in the career treatment. The fact that career incentives attract a poolof qualified applicants who would not apply otherwise has important implications for the skill levelof those who are eventually selected for the job, as qualified candidates can be chosen only if theyapply.
Panel B reports applicants’ occupations at the time of application. The omitted categoryis unemployed/housewives. Over two-thirds of applicants in both treatments are farmers, as isexpected in rural areas. Estimating individual earnings from farming is notoriously di�cult and
17

beyond the scope of our questionnaire; we are thus unable to assess di�erences in earnings. The twoother occupations listed by respondents are “trader” and “teacher,” both of which are likely to havea higher return to skills than farming and both are more prevalent in the career treatment (p=.088,and p=.030). The average standarized treatment e�ect is positive and precisely estimated. Whileour proxies for the applicants’ outside opportunities are coarse, the evidence is broadly consistentwith the interpretation that the career treatment attracts more qualified applicants with betteroutside options.
4.3 Mission Preferences
Part I of Table III.A provides evidence on the mission preferences of the applicants. As above,Part II presents the same information for selected candidates and will be discussed in the nextsection. Panel A shows that the share of applicants who display preferences for social benefitsand attachment to the community is high and similar in the two treatments. Our main measureof social preferences is based on the adapted “Inclusion of Others in Self (IOS) scale” (Aron etal., 2004), which measures the extent to which individuals perceive community and self-interest asoverlapping. IOS has been validated across a wide variety of contexts, and adapted versions arefound to be strongly correlated with environmental behavior (Schultz, 2002) and connectednessto the community (Mashek et al., 2007). The measure is coded as 0-1, where 1 implies highestoverlap.22 Panel A shows that 84% of the applicants in both treatments perceive their intereststo be aligned with the community’s, suggesting that career incentives do not displace this typeof pro-social preference. We complement this measure with a standard measure of social capital(participation in groups) and with a proxy for the agents’ attachment to the community. Panel Ashows that about half of the applicants belong to social groups and aim to remain in the communityin 5-10 years, and career incentives do not a�ect either margin. Keeping qualified health sta� inrural areas is a major challenge, as illustrated by the fact that just under half of all applicants inboth treatments aspire to leave. That applicants attracted by career incentives are not di�erentiallylikely to want to leave their communities is consistent with the fact that there are shortages at everylevel, so that promotion to a higher cadre does not require leaving the community. The averagestandarized treatment e�ect on the three measures is small and not significantly di�erent from zeroat conventional levels.
As the findings in Panel A indicate that the share of applicants with social preferences issimilarly high in both treatments, our framework makes precise that the share of applicants whovalue career benefits must be larger under career incentives. In line with this, Table III.B, PanelB shows that the share of applicants who aspire to be in a highly-ranked position (environmental
22Applicants are asked to choose between four pictures, each showing two circles (labeled “self” and “community”)with varying degrees of overlap, from non-overlapping to almost completely overlapping. This variable equals 1 if therespondent chooses the almost completely overlapping picture, 0 otherwise.
18

health technician, clinical o�cer, or doctor) within the Government in 5-10 years’ time is higher inthe career treatment. The di�erence between treatment groups is 6 percentage points (32% of thecontrol group mean) and precisely estimated (p=.026). Taken together, the findings in Tables III.Aand III.B suggest that making career incentives salient attracts agents who—in absolute terms—display a similar level of pro-social preferences, but care relatively more about career advancement.23
Note that the findings on applicant numbers, ability and mission preferences are jointly consis-tent with Results 1-3 of the model. In particular, the fact that the number of applicants per post isslightly lower in the career treatment despite the ability threshold being higher is consistent withthe fact that applicants to both treatments have the same social preferences, i.e. that the numberof applicants who solely care about career benefits is zero. Using the notation of the model, thenumber of applicants in the career treatment is thus afinh, while the number of applicants in thesocial treatment is a‡(ns + nh), therefore afinh can be smaller than a‡(ns + nh) even if afi > a‡
provided that the number of social mission agents is su�ciently large (ns >
(afi≠a‡)a‡
nh).To conclude, Table A.I tests whether applicants in the two treatment groups di�er on other
dimensions that might have unintentionally been made salient by the two posters. Most notably,the career poster might have conveyed di�erent expectations about tenure or gender. We find thatthis is not the case.24
5 The E�ect of Career Incentives on the Selected Pool
Career incentives can a�ect the selected candidate pool both because they a�ect the applicant poolas we have demonstrated above and because they might a�ect the way selection panels choosecandidates. If panel choices are orthogonal to the salience policy, our research design identifiesthe e�ect of career incentives on performance solely through their e�ect on the applicant pool(“self-selection”). The first sub-section shows that this is indeed the case. The second sub-sectiondescribes how di�erences in the applicant pool translate into di�erences among selected candidates.
23In Appendix A, we assess whether there is a tradeo� between skills and mission preferences. A.II providesevidence on the correlation between ability and mission preferences among the applicants, and, most importantly,whether this di�ers by treatment group. We find that career preferences are correlated with ability in the applicantpool, while social preferences are not. Selection panels thus face no trade-o� between selecting high-skill candidatesand candidates with social preferences but selecting high-skill candidates will bring in applicants with stronger careerambitions. Reassuringly these correlations are the same across treatments so panels face similar choices.
24First, over 90% of applicants in both treatment groups expect to be working for the Government in 5-10 years’time. Second, the share of women is 29% in both treatments, suggesting that, in this setting, women do not shy awayfrom career-oriented occupations and do not display stronger preferences for community-oriented jobs. Third, tothe extent that career jobs are perceived to be more lucrative, they might have attracted more politically connectedapplicants; the evidence in Table A.I does not support this hypothesis.
19
5.1 Selection panels
Selection panels have five members: the district health o�cial, a representative from the healthpost’s associated health center, and three members of the local neighborhood health committee.Selection panels are exposed to the salience policy as they see the same posters as the candidates.This notwithstanding, they know much more about the actual job attributes and who would besuitable for the positions. Indeed, contrary to the applicants whose only source of informationwas the recruitment poster, the two more senior panel members—the district health o�cial andthe health center representative—are employees of the Ministry of Health and hence familiar withcareer progression rules regardless of salience policy. The salience policy treatment is likely not aspowerful, or perhaps entirely moot, for them.
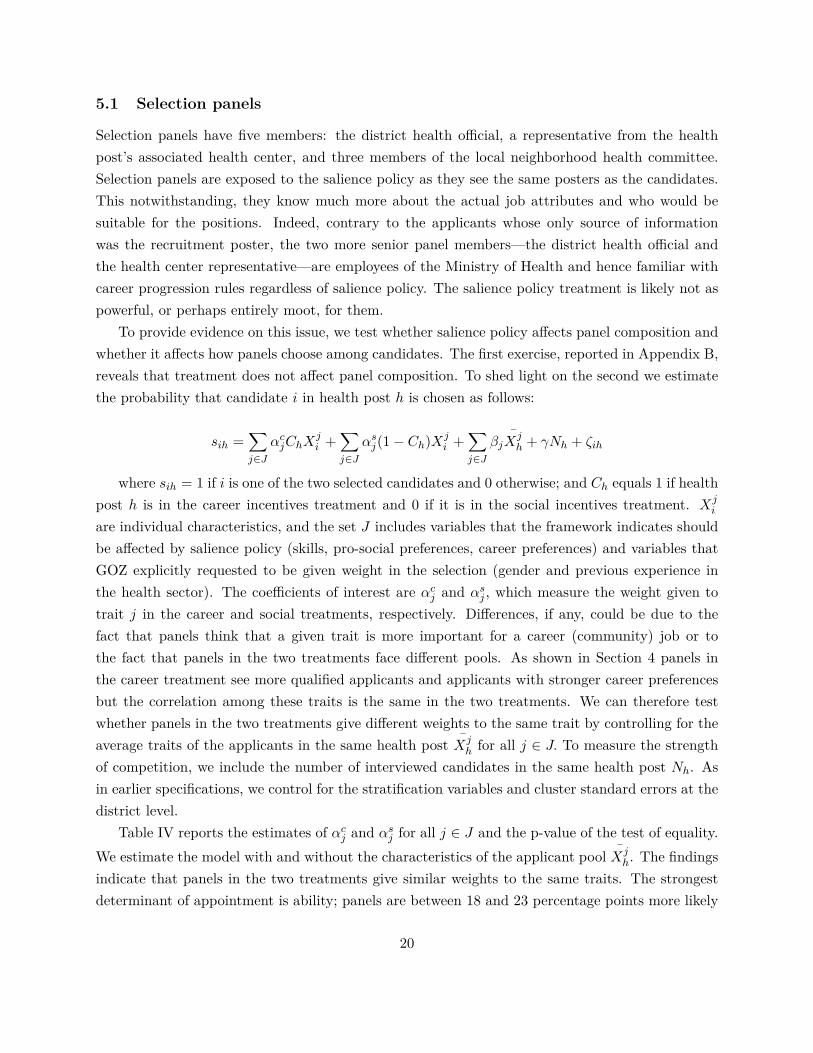
To provide evidence on this issue, we test whether salience policy a�ects panel composition andwhether it a�ects how panels choose among candidates. The first exercise, reported in Appendix B,reveals that treatment does not a�ect panel composition. To shed light on the second we estimatethe probability that candidate i in health post h is chosen as follows:
sih =ÿ
jœJ
–
cjChX
ji +
ÿ
jœJ
–
sj(1 ≠ Ch)Xj
i +ÿ
jœJ
—jX
jh + “Nh + ’ih
where sih = 1 if i is one of the two selected candidates and 0 otherwise; and Ch equals 1 if healthpost h is in the career incentives treatment and 0 if it is in the social incentives treatment. X
ji
are individual characteristics, and the set J includes variables that the framework indicates shouldbe a�ected by salience policy (skills, pro-social preferences, career preferences) and variables thatGOZ explicitly requested to be given weight in the selection (gender and previous experience inthe health sector). The coe�cients of interest are –
cj and –
sj , which measure the weight given to
trait j in the career and social treatments, respectively. Di�erences, if any, could be due to thefact that panels think that a given trait is more important for a career (community) job or tothe fact that panels in the two treatments face di�erent pools. As shown in Section 4 panels inthe career treatment see more qualified applicants and applicants with stronger career preferencesbut the correlation among these traits is the same in the two treatments. We can therefore testwhether panels in the two treatments give di�erent weights to the same trait by controlling for theaverage traits of the applicants in the same health post X
jh for all j œ J. To measure the strength
of competition, we include the number of interviewed candidates in the same health post Nh. Asin earlier specifications, we control for the stratification variables and cluster standard errors at thedistrict level.
Table IV reports the estimates of –
cj and –
sj for all j œ J and the p-value of the test of equality.
We estimate the model with and without the characteristics of the applicant pool X
jh. The findings
indicate that panels in the two treatments give similar weights to the same traits. The strongestdeterminant of appointment is ability; panels are between 18 and 23 percentage points more likely
20

to appoint candidates at the top of the O-level exam score distribution within their health post.As in the average health post, 21% of candidates are appointed, and being at the top of the O-levelexam score distribution doubles the probability of being selected. This validates the use of O-levelscores as a measure of ability as the panels have access to the O-levels scores, but plausibly theyalso have other information that is not available to the econometrician.
We note that, other things equal, panels are between 8 and 11 percentage points more likelyto select candidates that aim for higher positions in the Ministry of Health and between 3 and10 percentage points more likely to appoint applicants with strong social preferences. This is thelargest di�erence between treatments, but it is not significantly di�erent from zero at conventionallevels (p=.241). Finally, in line with GOZ’s directives, panels are more likely to choose women andcandidates with work experience in the health sector. Both traits are given equal weight in thetwo treatments. Taken together, the evidence suggests that the salience policy does not a�ect howselection panels make their choices, but their choices determine how selected candidates di�er fromthe applicants. We provide evidence on this next.
5.2 The ability and mission preferences of selected candidates
Ability
In line with the finding that panels are more likely to appoint candidates with high O-level examscores in both treatments, Part II of Table II shows that selected candidates have higher qual-ifications than the average applicant on all three measures of academic achievement. This alsoreduces the gap in O-level score and science background among selected candidates in the twotreatments. In line with the earlier finding that candidates with very high scores only apply in thecareer treatment, Part II of Table II shows that selected candidates in the career treatment havehigher O-level scores and more science O-levels but the di�erence is not precisely estimated. Panelsare thus able to reduce skills di�erentials on the measures that are observable to them. To assesswhether panel selection eliminates medical skills di�erentials we use the candidates’ performanceon an exam that was administered at the beginning of the training program to test their level ofbasic medical knowledge. This was a three hour exam with 100 questions that covered all aspectsof the CHAs’ job description. Part II of Table II shows that candidates in the career treatmentperform considerably better in this test: their average score is 26% of a standard deviation higherand the di�erence is significant at conventional levels (p=.005). This indicates that the selectionprocess does not eliminate skills di�erences between the two groups and that CHAs recruited bycareer incentives display higher skills on dimensions that are directly relevant for their jobs.
Part II of Table II also shows that di�erences in outside options between selected candidatesmirror the di�erences among applicants, but treatment e�ects are not precisely estimated in thissmaller sample.
21

Social Preferences
Moving on to the mission preferences of the selected candidates, Part II of Table III.A, Panel A,shows that career incentives do not crowd out pro-social preferences. This is consistent with thefact that applicants to both treatments have similar levels of pro-social preferences (Part I, TableIII.A) and there is no trade-o� between ability and social preferences (Table A.II).
The second part of Panel A reports measures of pro-social preferences collected at training.As this was held in a central location for all selected candidates (as opposed to interviews heldlocally in the districts), we were able to implement a contextualized dictator game and a batteryof psychometric tests to measure the strength of pro-social preferences. Contrary to applicants,trainees have no incentive to modify their answers to a�ect the probability of selection, and themeasures we collect are harder to game.
In the dictator game, we gave trainees 25,000 Kwacha (approximately USD 5, half of a CHA’sdaily earnings) and invited each to donate any portion (including nothing) to the local hospital tosupport needy patients. This donation decision occurred privately and confidentially in concealeddonation booths. Previous work has found dictator games adapted for specific beneficiary groupsto be predictive of performance on pro-social tasks (Ashraf et al., 2013) and choices of public sectornurses to locate to rural areas (Lagarde and Blaauw, 2013). Panel A shows that the average traineedonates 16% of their endowment and this is equal across treatments.25 The psychometric measuresdraw from validated scales used in employment surveys on pro-social preferences and career orien-tation. Full descriptions of these variables can be found in Appendix C.3. The comparison of allfour measures across treatment groups reveals that trainees in both groups exhibit a high level ofpro-social preferences.
Career preferences
Part II of Table III.B, Panel B, shows that di�erences in career preferences among applicants aremaintained among selected candidates. In addition to the self-assessed career goals, applicants inthe career incentive treatment have a significantly higher score on the career psychometric scale(p=0.018) and the average standarized treatment e�ect of this and our earlier measure of careerpreferences is positive and significantly di�erent from zero at conventional levels.
Part II of Table III.B, Panel C, provides evidence on the relative importance of career vs. socialbenefits among trainees. We measure this in two ways. First, we asked trainees to choose whethertheir main goal as CHAs is community service or career advancement. In line with the earlierfindings on social preferences, the vast majority of trainees chooses community service but traineesin the career treatment are significantly less likely to do so (86.3% vs. 94.1%, p=.020). Second, to
25Meta-analysis of dictator games run around the world show a mean donation amount of 28.3%. This maskssignificant heterogeneity across studies; large stakes combined with low subject wealth, as in our study, lowers thismean amount (Engel, 2011).
22

measure the relative weight given to di�erent benefits, trainees were given a bag of 50 beans andasked to allocate them to di�erent cards describing potential benefits of the job in proportion tothe weight they gave to each benefit when deciding whether to apply. In line with the evidencein Panels A and B, “service to the community” is a strong motivator but relatively less so forapplicants in the career treatment. The average share of beans allocated by trainees in the careertreatment is 39.6% while it is 43.2% in the community treatment (p=.050). The weight given to“obtain respect from the community”, a proxy for reputation-based pro-social preferences, is smallin both treatments but lower in the career treatment (3.7% vs. 5.7%, p=.048). In contrast, theweight on career benefits is significantly higher in the career treatment (16.5% vs. 12%, p=.002).
Other motivators
While the two posters contained the same information about pay, expected lifetime earnings arelikely to be higher in the career treatment, and this might have played a role in the applicationdecision. Using the same “beans” questions, Table A.I shows that wage earnings play a limited rolein the application decision; both “good wages” and “stable earnings” are given about 3% of theweight or less in both groups. Importantly, over three-quarters of applicants think CHAs shouldbe paid, and the di�erence between treatment groups is small and not significant (p=.247).
6 The E�ect of Career Incentives on Performance
Taken together, the e�ect of career incentives on the applicant pool is such that the e�ect of careerincentives on performance through selection is ambiguous. While career incentives attract higher-ability applicants, the fact that their relative ratio of career-to-social preferences is higher impliesthey will devote less e�ort to the social good. To interpret the e�ect of the career salience policyon performance as the e�ect of career incentives through self-selection, however, we need to assumethat salience policy itself does not directly a�ect the applicants’ utility once the real career andsocial benefits are known. The next subsection provides evidence in support of this assumption,while the following sections report treatment e�ects and evidence on the mechanisms underlyingthese.
6.1 Identifying assumption
The theoretical framework makes precise that to identify the e�ect of career incentives on perfor-mance through selection, we need to assume that salience policy itself does not directly a�ect theapplicants’ utility once the real career and social benefits are known. This assumption might failfor two reasons. First, if agents are made worse o� by discovering that the actual value of a givenbenefit is larger than the value advertised by the salience policy, agents for whom the participation
23
constraint is met ex-ante but not ex-post would drop out once hired, and di�erences in performanceamong stayers would not be interpretable as the e�ect that career incentives have on performancethrough their e�ect on the applicant pool. Reassuringly, the drop-out rate at the relevant stageis minimal. Namely, 314 agents join training informed by the salience policy. They then are toldabout the actual benefits of the job at the start of the training program. Contrary to the implicationthat some are made worse o� by discovering that the actual value of a given benefit is larger thanthe value advertised by the salience policy, 98% of selected candidates stay on after discovering theactual benefits and complete the training program.
Second, if agents are made better o� by discovering that the actual value of a given benefitis larger than the value advertised by the salience policy, and react to the positive surprise byworking harder. This would imply, for instance, that the e�ect of career incentives on e�ort wouldbe stronger in the social salience treatment than in the career salience treatment. We presentevidence on the relevance of this issue in Section 6.3.
6.2 Treatment E�ect on Performance and Retention
The CHAs’ main task is to visit households, and our performance analysis focuses on these visits.The visits’ main goals are to inspect the household and provide advice on health-related prac-tices such as: safe water practices, household waste management, sanitation, hygiene, ventilation,women’s health (including family planning, pregnancy, and postpartum care), and child health(including nutrition and immunizations). During visits, CHAs are also tasked with providing basiccare to any sick persons and referring them to the health post as needed.
The number of household visits is akin to an attendance measure for teachers or nurses: CHAsare supposed to work in people’s houses, and we measure how often they are there. Naturally,di�erences in the number of visits can be compensated by behavior on other dimensions; we discussthis possibility after establishing the main results in Section 6.3.
CHAs are supposed to devote 80% of their time (4 out of 5 working days per week) to householdvisits. In the remaining time, CHAs are expected to assist sta� at the health post by seeing patients,assisting with antenatal care, and maintaining the facility. They are also supposed to organizecommunity meetings such as health education talks at the health post and in schools. We measureCHAs’ activities in the field over the course of 18 months, from August 2012 (when CHAs startedwork) until January 2014.
Main Task: Household Visits
Our primary measure of household visits is built by aggregating information on each visit fromindividual receipts. All CHAs are required to carry receipt books and issue each household areceipt for each visit, which the households are asked to sign. CHAs are required to keep the book
24
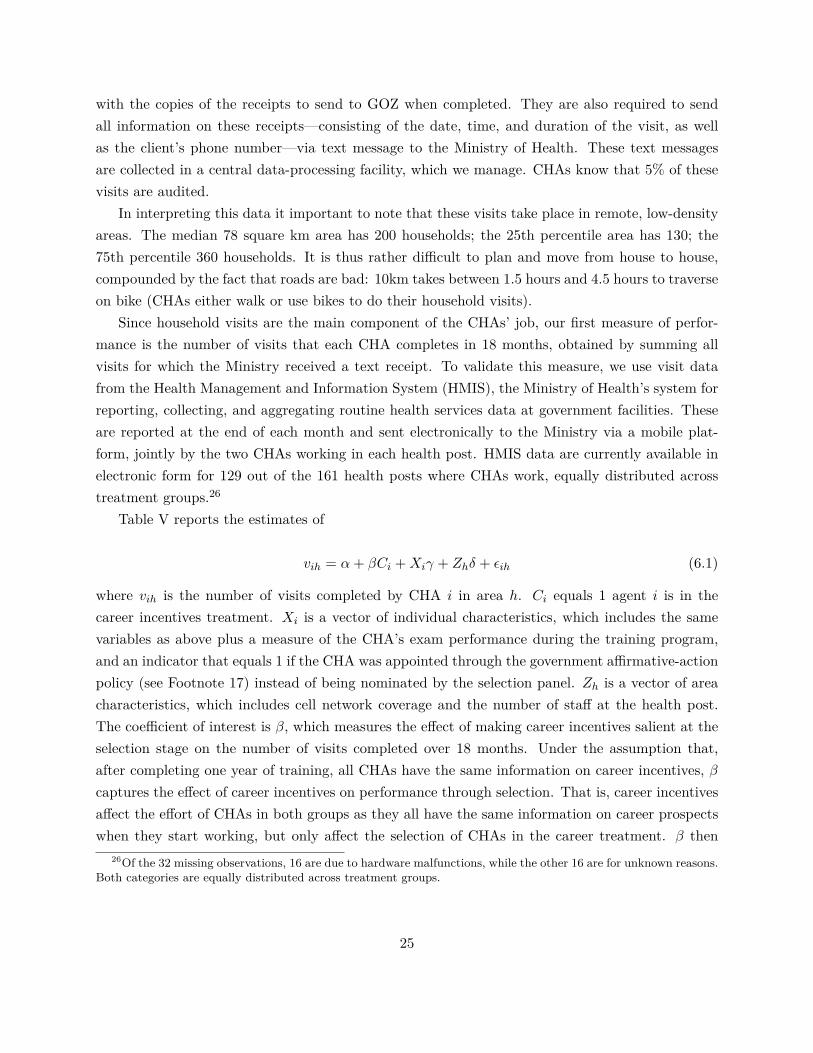
with the copies of the receipts to send to GOZ when completed. They are also required to sendall information on these receipts—consisting of the date, time, and duration of the visit, as wellas the client’s phone number—via text message to the Ministry of Health. These text messagesare collected in a central data-processing facility, which we manage. CHAs know that 5% of thesevisits are audited.
In interpreting this data it important to note that these visits take place in remote, low-densityareas. The median 78 square km area has 200 households; the 25th percentile area has 130; the75th percentile 360 households. It is thus rather di�cult to plan and move from house to house,compounded by the fact that roads are bad: 10km takes between 1.5 hours and 4.5 hours to traverseon bike (CHAs either walk or use bikes to do their household visits).
Since household visits are the main component of the CHAs’ job, our first measure of perfor-mance is the number of visits that each CHA completes in 18 months, obtained by summing allvisits for which the Ministry received a text receipt. To validate this measure, we use visit datafrom the Health Management and Information System (HMIS), the Ministry of Health’s system forreporting, collecting, and aggregating routine health services data at government facilities. Theseare reported at the end of each month and sent electronically to the Ministry via a mobile plat-form, jointly by the two CHAs working in each health post. HMIS data are currently available inelectronic form for 129 out of the 161 health posts where CHAs work, equally distributed acrosstreatment groups.26
Table V reports the estimates of
vih = – + —Ci + Xi“ + Zh” + ‘ih (6.1)
where vih is the number of visits completed by CHA i in area h. Ci equals 1 agent i is in thecareer incentives treatment. Xi is a vector of individual characteristics, which includes the samevariables as above plus a measure of the CHA’s exam performance during the training program,and an indicator that equals 1 if the CHA was appointed through the government a�rmative-actionpolicy (see Footnote 17) instead of being nominated by the selection panel. Zh is a vector of areacharacteristics, which includes cell network coverage and the number of sta� at the health post.The coe�cient of interest is —, which measures the e�ect of making career incentives salient at theselection stage on the number of visits completed over 18 months. Under the assumption that,after completing one year of training, all CHAs have the same information on career incentives, —
captures the e�ect of career incentives on performance through selection. That is, career incentivesa�ect the e�ort of CHAs in both groups as they all have the same information on career prospectswhen they start working, but only a�ect the selection of CHAs in the career treatment. — then
26Of the 32 missing observations, 16 are due to hardware malfunctions, while the other 16 are for unknown reasons.Both categories are equally distributed across treatment groups.
25

measures the e�ect that unobservable CHA traits (including unobservable variation in ability) haveon performance through selection, both directly and through the response to career incentives.
The causal e�ect of career incentives on performance can be identified under the assumptionsthat Ci is orthogonal to ‘ih and that there are no spillovers between the two groups. Orthogonalityis obtained via random assignment. Spillovers are minimized by design, as recruitment messageswere randomized at the district level, which, given the travel distance between rural communitiesin di�erent districts, makes it very unlikely that applicants in one group might have seen the posterassigned to the other group.
Columns 1 and 2 estimate (6.1) with and without controls. Both columns reveal a large andprecisely estimated e�ect of career incentives on household visits: CHAs recruited by making careerincentives salient do 29% more visits over the course of 18 months (column 1); after controlling forindividual characteristics that we know di�er by treatment (e.g., qualifications, career orientation)and by area characteristics that might a�ect the cost of doing visits, the coe�cient implies a 28%di�erence. This suggests that besides di�erences in observables, CHAs recruited by making careerincentives salient also di�er on unobservables that drive performance on the field. The magnitudeof the di�erence is economically meaningful: if each of the 147 CHAs in the social treatment haddone as many visits as their counterparts in the career treatment, 13,818 more households wouldhave been visited over the 18 months period. Given that for most of these households CHAs arethe only providers of health services, the di�erence between treatments is likely to have substantialwelfare implications.
Figure III provides evidence of treatment e�ects on the distribution of household visits. Boththe comparison of kernel density estimates and quantile treatment e�ect estimates reveal that thedi�erence between the two treatments is driven by a group of strong performers in the careerincentive treatment. The e�ect of career incentives is smaller than the average e�ect up to themedian and then increases rapidly thereafter. The di�erence at the 70th, 80th and 90th percentileis 144, 145, and 217 visits, that is 45%, 46% and 68% of the control group mean, respectively. Thequantile estimates indicate that career incentives lead to better performance, not by making eachCHA in the performance distribution work homogeneously harder, but by attracting a group ofindividuals who perform much better than the average CHA and who do not apply when socialincentives are made salient.
Since visits are measured by aggregating text messages sent by the CHAs themselves, identi-fication can be compromised by the presence of measurement error in vih that is correlated withCi. For instance, CHAs in the career treatment might put more e�ort in reporting visits via textmessages, leading to a positive bias in —. To allay this concern, columns 3 and 4 estimate (6.1)using visit data from the Health Management and Information System (HMIS). While these arealso collected by the CHAs themselves, the e�ort required is considerably lower, since HMIS reportsare compiled monthly rather than on every visit. As HMIS data are aggregated at the health post
26

level, the estimates in columns 3 and 4 measure the e�ect of career incentives on both CHAs andinclude the area characteristics Zh but not individual controls Xi . The estimated — coe�cients areconsistent across measures: HMIS data show that on average, a CHA in the career treatment does189 more visits, 36% more than the average CHA in the social treatment. While this is reassuring,the HMIS data are more prone to measurement error deriving from recall bias, which might becorrelated with treatment. We provide more evidence on this issue in Section 6.3 below.
Secondary Tasks: Community Meetings and Health Post Visits
Columns 5-8 of Table V investigate whether di�erences in household visits are compensated bydi�erences in secondary tasks using data on community meetings and patient visits at the healthpost from the HMIS. We find no evidence to support this hypothesis. On the contrary, CHAsrecruited by making career incentives salient organize more than twice as many meetings over 18months (39 vs. 17), and the di�erence is precisely estimated. The e�ect of career incentives onthe number of patients seen at the health post is positive and large (53% of the control groupmean) but is not precisely estimated. Taken together, the evidence in Table V suggests that CHAsrecruited by making career incentives salient perform better on the two tasks—household visitsand community meetings—which depend almost exclusively on the their own initiative, and do atleast equally well on the third task—number of patients seen at the health post—which dependson demand as well as the CHAs’ own e�ort. The outstanding question is whether the number ofhousehold visits and community meetings are valid measures of performance. This is the topic ofSection 6.3.
Retention
Columns 9 and 10 of Table V test whether career incentives improve performance at the expenseof retention—e.g., whether they attract individuals who leave with their newly acquired skills assoon as it is feasible to do so. In our context, the CHAs are bonded to their position for one year.27
Thus, we measure retention by the number of CHAs who make at least one visit after the one-yearcommitment has elapsed. We find that, by this measure, 20% of CHAs drop out, though some ofthis may be due to a combination of malfunctioning phones and the rainy season (falling betweenmonths 15-18 in our analysis window) making travel to cell network-accessible areas di�cult. Mostinterestingly, this is balanced across treatments, and the di�erence is very small and preciselyestimated.
It is important to note that according to the Ministry’s rule, CHAs have to wait two yearsbefore applying for higher-ranked positions, such that none of those who left their positions did so
27The CHAs were told that, if they quit before one year of service, they would be required to pay monthly wagesfor any months not worked (rather than simply relinquishing pay) to compensate the government for the free one-yeartraining that they received.
27

for career progression. It is possible that career incentives will a�ect retention rates at the two-yearmark. As we discuss in the Conclusion, the welfare implications of this e�ect (were it to materialize)are ambiguous.
6.3 Interpretation
Responses to Salience vs. Responses to Actual Incentives
The theoretical framework makes clear that our design identifies the e�ect of career incentives onperformance through selection if the salience policy itself does not a�ect the utility that agentsdraw from the actual value of career and social benefits. Since both career and social benefits aregreater than or equal to the values agents knew at the application stage, e�ectively we need to ruleout behavioral biases that make agents value a given benefit di�erently if its value exceeds theirexpectation. For instance, this requires that the value that social-mission agents put on careerbenefits be the same regardless of their knowledge of these benefits when they applied or afterhaving been selected.
To be precise, our estimates overstate the e�ect of career incentives if this “surprise” e�ect ispositive for agents who applied under the career salience policy (i.e., their e�ort response to findingout about social benefits is positive and larger than what it would have been had they known thesocial benefits at the outset) and/or negative for agents who applied under the social salience policy(i.e., their e�ort response to finding out about career benefits is negative and larger (in absolutevalue) than what it would have been had they known the career benefits at the outset).
While we cannot measure the surprise e�ect directly, we can exploit the long time series ofperformance data to test whether the treatment e�ect changes with time in a manner that is con-sistent with there being a “surprise” e�ect. Specifically, if estimated di�erences between treatmentsare overstated due to the “surprise” e�ect, we expect treatment e�ects to shrink with time as thesurprise wanes.
To test this implication, in Table VI, columns 1-3, we divide the 18-month period into threesemesters. We find that the estimated treatment e�ect is identical in the three sub-periods: ineach semester, the average CHA recruited under the career salience policy does between 29 and 32more visits. Since the number of visits falls over time due to the drop-outs discussed above, thepercentage e�ect increases with time from 19% to 49%. This casts doubt on the interpretationthat CHAs’ behavioral responses to di�erences between salience policy and actual incentives leadus to overstate the e�ect of career incentives on performance through selection.
Measurement Error
Measurement error can lead us to overestimate the e�ect of career incentives on the number ofhousehold visits if CHAs in the career treatment group are more likely to fabricate visits or to put
28
more e�ort in reporting them. Outright cheating is made di�cult by the fact that 5% of reportedvisits are audited and that CHAs would need to falsify the household signature on the o�cial receiptto report a visit that did not happen. While the SMS submissions carry no signature, CHAs arerequired to send their household visit receipt books containing carbon copies of the receipts to theMinistry of Health for cross-checking. Fabricating receipts thus entails a potentially high cost. Inaddition, the estimated di�erence is the same regardless of whether we use SMS data—which aresent privately by individual CHAs—or HMIS reports, which are visible to all sta� at the healthpost. To the extent that the two CHAs and the other health post sta� cannot perfectly collude tofabricate visits, this evidence casts doubt on the practical relevance of cheating.
Di�erences in reporting e�ort might also lead to a positive bias if CHAs in the career treatmentgroup devote more time or e�ort to compile accurate reports. That estimates obtained with theSMS receipt data, which need to be reported at each visit, match those obtained with the HMISdata—which are only reported monthly and therefore require less e�ort—is a piece of evidenceagainst this form of measurement error. Moreover, we find that the share of SMSs containingerrors, a proxy for the e�ort CHAs put into writing these messages, is 10% in both treatments.
Work Styles and Compensation Mechanisms
Table VI investigates the hypothesis that CHAs in the social treatment take other actions thatcompensate for the lower number of visits. Columns 4 and 5 decompose the number of total visitsinto the number of unique households visited and the average number of visits per household totest whether CHAs in the career treatment do more visits because they cover a smaller numberof easy-to-reach households. Contrary to this, columns 4 and 5 show that CHAs in the careerincentive treatment reach out to more households and make more follow-up visits. The pointestimates indicate that just under one-third (29/94) of the total treatment e�ect is due to careerCHAs visiting more households and two-thirds to them visiting the same household more thanonce. This is consistent with the two groups of CHAs having a similar number of households intheir catchment area and visiting them at least once, but CHAs in the career incentives treatmentdoing more follow-up visits. Note that longitudinal follow-up with households is considered anintegral part of the CHA job, in view of which Ministry of Health guidelines state CHAs shouldattempt to visit each household on a quarterly basis. Column 5 indicates that CHAs in both groupsfall short of this target, suggesting that di�erences in performance are relevant to welfare.
The results in columns 4 and 5 also cast doubt on the hypothesis that observed di�erences aredriven by measurement error, because it is equally costly to send SMSs for first or repeated visits,but di�erences are larger for the latter.
Columns 6 and 7 show that the CHAs in both groups devote the same time to a single visit, onaverage, and are equally likely to target their primary clients—women and children. Therefore, the
29

results do not support the hypothesis that CHAs in the social treatment compensate by spendingmore time with each household or are better at reaching those they are supposed to target.
To provide further evidence on possible compensation mechanisms, we administer a time usesurvey that is meant to capture di�erences in work style. We surveyed CHAs in May 2013, ninemonths after they started working, taking advantage of a refresher course organized by GOZ in theCHA School in Ndola. Of the 307 CHAs, 298 (97%, equally split by treatment groups) came totraining and took part in the survey. Column 8 shows that there is no di�erence in reported workinghours, which provides further assurance that CHAs in the career treatment do not have di�erentialincentives to overstate their contribution and suggests that CHAs in the social treatment do notcompensate for visiting fewer households by devoting more hours to other, possibly informal, tasks.The average CHA reports working 42 hours per week in the typical week.
In addition to hours worked, the survey asked CHAs to report the frequency of emergency visitstypically done outside of working hours. The median CHA does one emergency call per week, andcolumn 9 shows that this holds true for CHAs in both groups.
The time use survey is designed to collect detailed information on the time devoted to di�erentactivities while doing visits or working at the health post. To do so, CHAs were given 50 beansand asked to allocate the beans in proportion to the time devoted to each activity within each task.For each task, we calculate the share of time devoted to each activity by dividing the number ofbeans allocated to that activity by the total number of beans allocated to di�erent activities withina task. We then estimate a system of equations for each task, omitting the least frequent category.Table VII reports our findings.
Panel A shows that, in line with the CHA job description, counseling and inspections are themain activities, each taking 20% of the time in a given visit. Filling in forms and receipts andsubmitting SMSs comes third, taking 15% of the time. In this context, accurate reports are a keyelement of the CHA job, as CHAs are the primary source of information on rural health data forGOZ.
Panel A also shows that CHAs in the career incentives treatment devote more time to counseling,inspections, and visiting sick members, but, taken one-by-one, these di�erences are small and notprecisely estimated. In contrast, CHAs in the career incentives treatment devote 11 to 14% lesstime to filling in forms and receipts and submitting SMSs—a di�erence that is precisely estimatedat conventional levels. Because the quality of reports is the same, this implies that career CHAsare more productive at this task.
Panel B shows a similar pattern for time allocation during work at the health post: collectingdata and filling in reports is an important component of the job, which takes 23% of the CHAs’time in the social treatment, but only 18% in the career treatment. As for household visits, thereis no evidence that CHAs in the career treatment collect fewer data at the health post level or thatthese data are of worse quality. CHAs in the two groups are equally likely to submit HMIS reports
30

in a given month, and these are equally accurate. Thus, the evidence suggests that CHAs in thecareer treatment are more productive, and this frees time for other tasks.
7 Conclusion
The successful delivery of public services depends critically on the skills and motivation of the agentsengaged in it. We have shown that career incentives play an important role in attracting applicantswho are highly qualified, pro-socially motivated, and e�ective at delivering health services. Thetwo main sources of motivation that attract applicants to these jobs—material benefits in the formof career prospects and intrinsic utility due to helping the community—do not clash.
Two features of our setting are relevant to inform the external validity of the findings. First,the type of material benefit o�ered, a career in the Ministry of Health, was unlikely to attractpurely selfish types, since government service implies some pro-social benefit. The findings do notrule out the possibility that there exists a level of financial compensation that attracts calloustypes, but rather they suggest that the material benefits that can be reasonably associated withthese jobs have no drawbacks in terms of pro-social motivation and performance. The findingsthus cast doubt on the concern that o�ering material rewards displaces applicants with desirablesocial preferences and ultimately worsens the quality of services provided (Benabou and Tirole,2006; Georgellis et al., 2011). The findings have implications for policy strategies based on thisconcern, such as maintaining the volunteer status of community-based work or low salaries and lackof career incentives in teaching and health professions (World Health Organization, 2006; Lehmannand Sanders, 2007).
Second, the application process was designed to screen out applicants not known to the com-munity. This requirement was put in place to ensure that successful candidates would be willing tostay in the community, and as such, can a�ect retention rates. Without this requirement, CHAs inthe career treatment might have left earlier, but the welfare implications of attrition are ambiguous,as discussed below.
Our research provides evidence on factors that inform the welfare analysis of providing careerincentives, but is not designed to conduct a full welfare analysis for two reasons. First, due topolitical constraints, all agents had to be paid the same amount. This implies that we cannot judgewhether agents attracted by career incentives have a higher reservation wage, such that their higherperformance comes at a price; in other words, the government could get the agents in the socialtreatment to work for a lower wage. A priori, the di�erence in reservation wages between applicantsin the two treatments is di�cult to sign: that applicants to the career incentives treatment are moreskilled suggests that it might be positive, whereas the fact that they expect to move on to better-paid positions suggests that it might be negative (in the manner that interns are typically willingto forego compensation for the sake of career opportunities).
31

Regardless, our results suggest that higher wages and career incentives can be substitutes fordrawing candidates with better outside options and consequently higher skills. However, careerincentives may be cheaper for the organization if the organization requires higher-level positionsfilled, too, and has trouble filling them. If we relax the assumption made throughout the paperthat attraction to career benefits is uncorrelated with skill, career benefits could also be more likelyto attract individuals with latent skill—those who believe their skill will be manifest and rewardedin this job—than higher wages would.
Second, while retention rates after 18 months are the same in the two groups, agents in thecareer incentives treatment might still leave their posts for higher-ranked positions sooner thanthose in the social incentives treatment. Whether this entails a welfare cost depends on whetherthey can be easily replaced and whether their government can use their skills in other jobs. Inour context, replacement is straightforward; the number of applicants per post was above seven,and the government faces scarcity of health sta� at all levels, such that promoting high-performingCHAs to nursing and other higher-level cadres is likely to be welfare-improving. In contexts whereretention in the original post is more important, the welfare cost of attracting agents who expectto move on will be higher.
Ashraf: Harvard Business School and NBERBandiera: London School of EconomicsLee: Harvard Business School
32

Tabl
eA
.I:Tr
eatm
ent
e�ec
tson
appl
ican
ts’t
raits
:de
mog
raph
ican
dot
her
mot
ivat
ions
recr
uitm
ent p
oste
r mak
es sa
lient
career
social
p-va
lue,
bas
ed o
n SE
clu
ster
ed a
t the
di
stric
t lev
el
p-va
lue,
bas
ed o
n ra
ndom
izat
ion
infe
renc
e
surv
ey st
age
(obs
)
(1)
(2)
(3)
(4)
(5)
Expe
cts t
o be
em
ploy
ed in
MoH
in 5
-10
year
s.9
09.9
25.2
93.2
28in
terv
iew
(158
4)(.2
87)
(.263
)G
ende
r (=1
if fe
mal
e).2
92.2
94.4
86.3
25in
terv
iew
(158
4)(.4
55)
(.456
)A
ge26
.026
.3.4
46.3
68in
terv
iew
(158
4)(5
.53)
(5.8
3)B
orn
in th
e co
mm
unity
.544
.519
.515
.289
inte
rvie
w (1
584)
(.499
)(.5
00)
Has
rela
tive
who
is a
pol
itica
l lea
der o
r vill
age
elde
r.4
41.4
44.5
73.3
44in
terv
iew
(158
4)(.4
97)
(.497
)R
elat
ive
wei
ght g
iven
to "
good
wag
es"
whe
n ap
plyi
ng.0
31.0
25.4
42.2
73tra
inin
g (3
14)
(.092
)(.0
57)
Rel
ativ
e w
eigh
t giv
en to
"st
able
inco
me"
whe
n ap
plyi
ng.0
27.0
24.4
69.2
75tra
inin
g (3
14)
(.057
)(.0
54)
Rel
ativ
e w
eigh
t giv
en to
"in
tere
stin
g jo
b" w
hen
appl
ying
.150
.152
.784
.430
train
ing
(314
)(.1
62)
(.140
)R
elat
ive
wei
ght g
iven
to "
gain
use
ful s
kills
" w
hen
appl
ying
.181
.160
.214
.197
train
ing
(314
)(.1
68)
(.136
)B
elie
ves C
HA
s sho
uld
be p
aid
.826
.783
.247
.181
train
ing
(314
)(.3
80)
(.414
)Note:
Col
umns
1an
d2
show
mea
nsan
dst
anda
rdde
viat
ions
inpa
rent
hese
s.C
olum
n3
repo
rtsth
ep-
valu
eof
the
null
hypo
thes
isth
atth
eca
reer
treat
men
teff
ecte
qual
sze
roco
nditi
onal
onst
ratif
icat
ion
varia
bles
and
with
stan
dard
erro
rscl
uste
red
atth
edi
stric
tlev
el.C
olum
n4
repo
rtsra
ndom
izat
ion
infe
renc
ep-
valu
esob
tain
edby
sim
ulat
ing
1000
plac
ebo
treat
men
tass
ignm
ents
,est
imat
ing
plac
ebo
treat
men
teff
ects
inea
chus
ing
the
spec
ifica
tion
abov
e,an
dco
mpu
ting
the
prob
abili
tyth
atth
epl
aceb
otre
atm
ente
ffec
tsar
ela
rger
than
the
actu
altre
atm
ente
ffec
t.Ex
pect
sto
beem
ploy
edin
MoH
in5-
10ye
ars
equa
ls1
ifth
eap
plic
antc
hoos
esan
yM
OH
posi
tion
(CH
A,n
urse
,EH
T,cl
inic
alof
ficer
,doc
tor)
inre
spon
seto
the
ques
tion,
"Whe
nyo
uen
visi
onyo
urse
lfin
5-10
year
s'tim
e,w
hatd
oyo
uen
visi
onyo
urse
lfdo
ing?
"Re
lativ
ew
eigh
tgiv
ento
...va
riabl
esar
ede
rived
from
asu
rvey
ques
tion
that
asks
the
train
ees
toal
loca
te50
bean
sbe
twee
ndi
ffer
entp
oten
tialm
otiv
atio
nsfo
rap
plyi
ngto
the
CH
Apo
sitio
n:"g
ood
futu
reca
reer
,""a
llow
sm
eto
serv
eth
eco
mm
unity
,""e
arns
resp
ecta
ndhi
ghst
atus
inth
eco
mm
unity
,""p
ays
wel
l,""i
nter
estin
gjo
b,"
"allo
ws
me
toac
quire
usef
ulsk
ills,"
and
"off
ers
stab
lein
com
e."
Belie
ves C
HAs
shou
ld b
e pa
id e
qual
s 1 if
the
appl
ican
t ans
wer
s "ye
s" to
the
ques
tion
"Do
you
feel
that
com
mun
ity h
ealth
wor
kers
in Z
ambi
a sh
ould
be
paid
?"
33

A Bivariate Distribution: ability by mission preferences
To assess whether there is a trade-o� between skills and mission preferences, Table A.II providesevidence on the correlation between ability and mission preferences among the applicants, and,most importantly, whether this di�ers by treatment group. Part I reports data on the applicantsand Part II on the selected trainees.
Panel A, Part I reports the three measures of ability presented in Table II separately for the twotreatments and for applicants who display social preferences (IOS scale=1) and for those who donot (IOS scale=0).28 The table also reports the p-value of the di�erence in di�erence between thetwo applicant types in the two treatments. We find that applicants who display social preferencesscore somewhat higher on all three measures of ability and the di�erence is not significant acrosstreatments.
Panel B, Part I shows that career preferences are correlated with ability as applicants withcareer ambitions (measured as in Table III.B) score substantially higher on all ability measures.Importantly, however, this di�erence is the same in the two treatments.
Taken together, the findings in Part I, Table A.II suggest that career preferences go hand in handwith ability while social preferences do not. Selection panels thus face no trade-o� between selectinghigh-skill candidates and candidates with social preferences, but selecting high-skill candidates willbring in applicants with stronger career ambitions. Reassuringly, these correlations are the sameacross treatments so panels face similar choices.
28Results are unchanged if we use the other two measures of social preferences, namely social capital and attachmentto community.
34

Tabl
eA
.II:T
reat
men
te�
ects
ontr
aits
ofap
plic
ants
and
trai
nees
:sk
ills
bym
issio
npr
efer
ence
s
recr
uitm
ent p
oste
r m
akes
sal
ient
care
erso
cial
p-va
lue
care
erso
cial
p-va
lue
(1)
(2)
(3)
(1)
(2)
(3)
Pane
l A: S
kills
by
soci
al p
refe
renc
es
App
lican
t qua
lifie
s for
uni
vers
ity a
dmis
sion
& so
cial
pre
fere
nces
=0.7
02.6
63.8
64.7
50(.4
60)
(.475
)(.3
51)
(.444
)A
pplic
ant q
ualif
ies f
or u
nive
rsity
adm
issi
on &
soci
al p
refe
renc
es=1
.770
.720
.772
.784
(.421
)(.4
50)
(.421
)(.4
13)
O-le
vels
tota
l exa
m sc
ore
& so
cial
pre
fere
nces
=024
.622
.526
.925
.0(1
0.83
)(8
.83)
(8.8
9)(9
.43)
O-le
vels
tota
l exa
m sc
ore&
soci
al p
refe
renc
es=1
24.5
23.6
24.8
24.3
(9.5
9)(9
.69)
(9.9
7)(8
.86)
O-le
vels
pas
sed
in b
iolo
gy a
nd o
ther
nat
ural
scie
nces
& so
cial
pre
fere
nces
=01.
341.
161.
771.
45(.8
99)
(.923
)(.9
22)
(.826
)O
-leve
ls p
asse
d in
bio
logy
and
oth
er n
atur
al sc
ienc
es &
soci
al p
refe
renc
es=1
1.43
1.25
1.39
1.34
(.874
)(.8
86)
(.874
)(.8
56)
Pane
l B: S
kills
by
care
er p
refe
renc
es
App
lican
t qua
lifie
s for
uni
vers
ity a
dmis
sion
& c
aree
r pre
fere
nces
=0.7
41.6
94.7
67.7
97(.4
38)
(.461
)(.4
25)
(.404
)A
pplic
ant q
ualif
ies f
or u
nive
rsity
adm
issi
on &
car
eer p
refe
renc
es=1
.842
.769
.878
.793
(.366
)(.4
23)
(.331
)(.4
12)
O-le
vels
tota
l exa
m sc
ore
& c
aree
r pre
fere
nces
=023
.822
.724
.324
.7(.9
.23)
(8.8
9)(9
.79)
(8.8
2)O
-leve
ls to
tal e
xam
scor
e &
car
eer p
refe
renc
es=1
27.7
25.8
28.2
23.5
(10.
4)(1
0.8)
(9.7
7)(8
.82)
O-le
vels
pas
sed
in b
iolo
gy a
nd o
ther
nat
ural
scie
nces
& c
aree
r pre
fere
nces
=01.
381.
201.
381.
41(8
.61)
(.891
)(.8
42)
(.809
)O
-leve
ls p
asse
d in
bio
logy
and
oth
er n
atur
al sc
ienc
es &
car
eer p
refe
renc
es=1
1.63
1.43
1.71
1.31
(8.2
4)(.8
52)
(.901
)(.8
91)
Part
I: A
pplic
ants
(N=1
585)
.815
.530
.057
.106
Part
II:
Sel
ecte
d T
rain
ees
(N=3
14)
.434
.782
.520
.266
Not
es:C
olum
ns1
and
2sh
owm
eans
and
stan
dard
devi
atio
nsin
pare
nthe
ses.
Col
umn
3re
ports
the
p-va
lues
ofth
enu
llhy
poth
esis
that
the
inte
ract
ion
coef
ficie
ntbe
twee
ntre
atm
ent
and
soci
al(c
aree
r)pr
efer
ence
seq
uals
zero
.Thi
sis
estim
ated
ina
regr
essi
onof
skill
son
treat
men
t,pr
efer
ence
s,th
eiri
nter
actio
nan
dth
est
ratif
icat
ion
varia
bles
with
stan
dard
erro
rscl
uste
red
atth
edi
stric
tlev
el.O
rdin
ary
leve
lsor
O-le
vels
are
adm
inis
tere
dby
the
Exam
inat
ions
Cou
ncil
ofZa
mbi
a(E
CZ)
to12
th-g
rade
stud
ents
,the
high
estg
rade
inth
eZa
mbi
anse
cond
ary
educ
atio
nsy
stem
.O-le
vels
are
the
prim
ary
entry
qual
ifica
tion
into
form
alte
rtiar
y,co
llege
orun
iver
sity
educ
atio
n.A
pplic
antq
ualif
ies
for
univ
ersi
tyad
mis
sion
toth
eU
nive
rsity
ofZa
mbi
aif
they
pass
5O
-leve
lsw
ithat
leas
ttw
ocr
edits
(gra
des1
-6in
a1-
9sc
ale)
.The
ECZ
requ
irest
hatc
andi
date
sw
rite
am
inim
umof
6O
-leve
lexa
ms
and
Engl
ish
and
mat
hem
atic
sare
com
puls
ory
inm
osts
choo
ls.I
nad
ditio
n,st
uden
tsca
nch
oose
optio
nsin
the
natu
rals
cien
ces,
arts
and
hum
aniti
esan
dbu
sine
ssst
udie
s.O
-leve
lsto
tale
xam
scor
eis
cons
truct
edas
the
sum
ofin
verte
dO
-leve
lssc
ores
(1=9
,2=8
,and
soon
)fr
omal
lsub
ject
sin
whi
chth
eap
plic
antw
rote
the
exam
,so
that
larg
erva
lues
corr
espo
ndto
bette
rpe
rfor
man
ce. O
-leve
ls p
asse
d in
bio
logy
and
oth
er n
atur
al sc
ienc
es, e
qual
s the
num
ber o
f O-le
vels
pas
sed
in b
iolo
gy, c
hem
istry
, phy
sics
, sci
ence
and
agr
icul
tura
l sci
ence
.
.864
.906
.868
.950
35

B The E�ect of Career Incentives on Panel Composition
Table A.A.III estimates the e�ect of career incentives on panel composition. The first row showsthat most panels comprise five individuals as expected; a handful have four members, and theseare equally distributed by treatment. The district o�cial and the health center representative arecivil servants and are therefore required to participate; the members of the local neighborhoodhealth committee are volunteers and might choose not to. The second row shows that makingcareer incentives salient does not change their incentives to take part in the CHA selection. For75% of the panels, we have information on the gender of each panelist. The third row shows thatmost panelists are men; the share of women is 22% in the career treatment and 17% in the socialtreatment, and the di�erence is not significantly di�erent from zero. Rows 4 and 5 test whethermaking career benefits salient a�ects the degree to which di�erent panel members have di�erentopinions about the same candidate. Recall that after interviews were completed, individual panelmembers were supposed to complete individual ranking sheets in private. To the extent thatcommittee members complied with these instructions, we can measure the extent to which theirpreferences are aligned. For each interviewed candidate, we compute all possible pairwise rankdi�erences across pairs of panel members. We then compute the mean and the maximum of thesedi�erences for each candidate and aggregate these statistics at the panel (health post) level bytaking the average across candidates in the same panel. The statistics, reported in rows 4 and 5,show that panel members are mostly in agreement. The average mean di�erence is less than 1 andthe average maximum di�erence is around 1.5. Neither statistics di�er by treatment, indicatingthat treatments did not di�erentially attract committee members with di�erent preferences.
36

Tabl
eA
.III:
E�ec
tof
care
erin
cent
ives
onth
eco
mpo
sitio
nof
sele
ctio
npa
nels
recr
uitm
ent p
oste
r m
akes
sal
ient
career
social
p-va
lue
of th
e nu
ll th
at
diff
eren
ce o
f mea
ns e
qual
s ze
ro (S
E cl
uste
red
at th
e di
stric
t lev
el)
(1)
(2)
(3)
Pane
l siz
e4.
894.
85.6
50(.3
45)
(.533
)N
umbe
r of N
HC
mem
bers
2.91
2.85
.555
(.293
)(.5
33)
Shar
e of
wom
en.2
24.1
67.1
67(.2
13)
(.215
)M
ean-
mea
n ra
nk d
iffer
ence
acr
oss m
embe
rs p
airs
.825
.948
.436
(.724
)(.6
08)
Mea
n-m
ax ra
nk d
iffer
ence
acr
oss m
embe
rs p
airs
1.58
1.66
.782
(1.3
9)(1
.02)
Note:
Col
umns
1an
d2
show
mea
nsan
dst
anda
rdde
viat
ions
inpa
rent
hese
s.D
ata
isat
the
pane
llev
el.T
here
ison
epa
nelp
erhe
alth
post
and
165
heal
thpo
sts,
85in
the
care
ertre
atm
ent
and
80in
the
com
mun
itytre
atm
ent.
Pane
lsi
zeeq
uals
the
num
bero
fpan
elm
embe
rs.P
anel
sw
ere
supp
osed
toha
vefiv
em
embe
rs.N
HC
stan
dsfo
rN
eigh
borh
ood
Hea
lthC
omm
ittee
.Pa
nels
wer
esu
ppos
edto
have
3N
HC
mem
bers
.Sha
reof
wom
eneq
uals
the
num
ber
ofw
omen
divi
ded
byth
enu
mbe
rof
mem
bers
.For
each
inte
rvie
wed
cand
idat
ew
eco
mpu
teal
lpos
sibl
epa
irwis
era
nkdi
ffer
ence
sac
ross
pairs
ofpa
nelm
embe
rs.
We
then
com
pute
the
mea
nan
dth
em
axof
thes
edi
ffer
ence
sfo
rea
chca
ndid
ate
and
aggr
egat
eth
ese
stat
istic
sat
the
pane
l(h
ealth
pos
t) le
vel b
y ta
king
the
mea
n ac
ross
can
dida
tes i
n th
e sa
me
pane
l.
37

C Data Appendix
In this section, we describe each of the variables used in our analysis, including its source, unit ofmeasurement, and data source. Because we used a number of di�erent data sources, we describeeach of them below. We collect data at each stage of the program: application, selection, training,and performance in the field. Each variable indicates which data source it is generated from. Adescription of each source, including the sample, can be found in Section C.7.
C.1 Demographic Characteristics
Health Post Level
• Number of sta� in health post (source: phone survey) - Total number of nurses, environmentalhealth technicians, and clinical o�cers assigned to the health post, as reported by districthealth o�cials we surveyed by phone.
• Geographical distribution of households in catchment area (source: Ndola Survey) - CHAs wereshown stylized maps accompanied by the description above and asked to choose the one thatmost closely resembled the catchment area of their health post. Questions were asked toeach CHA individually so that two CHAs from the same health post could give di�erentanswers. For the 5 out of 161 cases in which the two CHAs gave di�erent answers, we usedthe information provided by supervisors to break the tie.
• Share of households using ITNs (source: catchment area survey) - We asked CHAs to chooseamong four intervals (0-25, 25-50, 50-75, 75-100) and then took the midpoint of the intervalto compute the mean. In cases of disagreement (20/162), we took the average across the twoCHAs. When answers did not match, the two CHAs typically chose contiguous intervals, andthe supervisor generally agreed with one of the two.
• Share of households using their own pit latrine (source: catchment area survey) - We askedCHAs to choose among four intervals (0-25, 25-50, 50-75, 75-100) and then took the midpointof the interval to compute the mean. In cases of disagreement (22/162), we took the average
38

across the two CHAs. When answers did not match, the two CHAs typically chose contiguousintervals, and the supervisor generally agreed with one of the two.
• Poor cell network coverage (source: attempted phone calls) - We attempted to call all CHAsafter deployment. We made daily calls for 118 consecutive days. The health post was classifiedas having poor coverage if we did not manage to reach either of its two CHAs during thisperiod.
CHA Level
• Expects to be employed in MoH in 5-10 years (source: candidate questionnaire) - Circledany combination of being a “Community Health Worker,” “nurse,” “environmental healthtechnician,” “clinical o�cer,” or “doctor” in response to the question, “When you envisionyourself in 5-10 years’ time, what do you envision yourself doing?”
• Born in the community (source: candidate questionnaire) - After being asked “For how manyyears have you lived in the community where you currently live?” candidates were asked“Were you born in this community?” Variable equals 1 if they responded “Yes.”
• Has relative who is a political leader or village elder (source: candidate questionnaire) - Equals1 if the candidate indicated that they have a relative or member of their household that iseither a “Political Leader” or “Village Committee Member.”
• Gender (=1 if female) (source: application)
• Age (source: application)
CHA Level (skills)
Ordinary levels, or O-levels, are administered by the Examinations Council of Zambia (ECZ) to12th-grade students, the highest grade in the Zambian secondary education system. O-levels arethe primary entry qualification into formal tertiary, college, or university education. The ECZrequires that candidates write a minimum of six O-level exams, and English and mathematics arecompulsory in most schools. In addition, students can choose options in the natural sciences, artsand humanities and business studies. CHW applicants were required to have passed grade 12 withtwo O-levels. Dependent variables are normalized by the mean and standard deviation of the careertreatment group.
• Applicant qualifies for university admission (source: application) - Admission to the Universityof Zambia requires passing 5 O-levels with at least two credits (grades 1-6 in a 1-9 scale).
39

• O-levels total exam score (source: application) - This variable is constructed as the sum ofinverted O-levels scores (1=9, 2=8, and so on) from all subjects in which the applicant wrotethe exam, so that larger values correspond to better performance.
• O-levels passed in biology and other natural sciences (source: application) - Includes biology,chemistry, physics, science and agricultural science.
• O-levels passed in arts and humanities (source: application) - Includes English literature, foreignand local languages, religious studies, civic education, history, art, music, and fashion.
• O-levels passed in business studies (source: application) - Includes commerce, accounting andhousehold management.
CHA Level (occupation at time of application)
• Farmer (source: application)
• Trader (source: application)
• Teacher (source: application)
• Housewife (source: application)
C.2 Applicants’ Preferences and Motivations
• Perceives community interests and self-interest as overlapping (source: candidate questionnaire)- Based on the “Adapted Inclusion of Others in Self (IOS) scale” (Aron et al., 2004) whichmeasures the extent to which individuals perceive community- and self-interest as overlap-ping. The Inclusion of Other in the Self scale was originally designed by Dr. Art Aron andcolleagues (Aron et al., 1992) as a measure of self-other inclusion and relationship closeness.The Continuous IOS makes use of the basic design of the original IOS, but allows for (a)the measure to be embedded within a web-based questionnaire, (b) the output values to becontinuously scaled, and (c) modifications in the appearance and behavior of the measure.IOS has been validated across a wide variety of contexts, and adapted versions are found tobe strongly correlated with environmental behavior (Inclusion of Nature in the Self, Schmuckand Schultz, eds 2002) and connectedness to the community (Inclusion of Community in Self,Mashek et al. 2007). The measure is coded as 0-1, where 1 implies highest overlap. Appli-cants are asked to choose between sets of pictures, each showing two circles (labeled “self”and “community”) with varying degrees of overlap, from non-overlapping to almost com-pletely overlapping. This variable equals 1 if the respondent chooses the almost completelyoverlapping picture (D), 0 otherwise.
40

• Aims to remain in the same community in 5-10 years (source: candidate questionnaire) - Whenasked “When you envision yourself in 5-10 years’ time, where do you most see yourself?”answered “same community where I am now” as opposed to “working at district level,”“working at province level,” or “working in Lusaka.”
• Belongs to village committee or self-help group (source: candidate questionnaire) - When asked“How many village committees or self-help groups do you belong to?” answered greater than0.
• Donation to local hospital (dictator game) (source: baseline survey) - In the modified dictatorgame, trainees were given 25,000 Kwacha (approximately USD 5, half of a CHA’s daily earn-ings) and invited to donate any portion (including nothing) to the local hospital to supportneedy patients. This donation decision occurred privately and confidentially in concealeddonation booths. Previous work has found dictator games adapted for specific beneficiarygroups predictive of performance on pro-social tasks (Ashraf et al., 2013) and choices of publicsector nurses to locate to rural areas (Lagarde and Blaauw, 2013).
I am happy to inform you that we have recently received a small donation from an outside donor to supportthe Community Health Assistants. In a moment, you will each receive an equal portion of this outside donation.
While the money is yours to keep, the donor has also requested that we provide you with an opportunity foryou to share this gift with the community. This is an opportunity to support people in this community who aresick but are unable to a�ord the health care that they need. As you know, there are many such people in thecommunities from where you come from and also here in Ndola. They get sick, but because they are very poor,they are not able to get the health care that they need.
Because we want to protect your privacy, we have set up a donation booth in the next room. There you willsee a collection box where you can deposit your donation, if you choose to donate. You do not have to giveanything if you don’t want to. No one here will know if you decide not to give anything. Your donation will berecorded, but we will not have access to this information. Once everyone has had an opportunity to give, IPAwill collect any donations made to this cause, and we will donate the total amount to Ndola Central Hospital todirectly support patients who are unable to pay for their medicines and treatment.
In a moment, we will give you the money, and you will come to this desk where you will be able to donate tohelp needy patients if you wish.
I am happy to announce now that the donor is able to provide each of you with 25,000 Kwacha.In a moment, I will ask each of you to come to the registration table one-by-one. When you come to the
table, that is when I will give you the money. I will also give you an envelope in case you want to support thepatients at Ndola Central Hospital.
If you want to give any amount of money to help needy patients in the community, place the money in theenvelope. Then seal the envelope, and place that envelope in the “Help Needy Patients in the Community” box.Please be sure to place the money INSIDE the envelopes before placing it in the cash box. Do not put any loosebills into the cash box. Whatever money you have remaining, you can keep in your main envelope.
41

• Aims to be a higher-rank health professional in 5-10 years (source: candidate questionnaire) -Circled any combination of being an “environmental health technician,” “clinical o�cer,” or“doctor” in response to the question, “When you envision yourself in 5-10 years’ time, whatdo you envision yourself doing?”
• Believes CHAs should be paid (source: baseline survey) - Trainees were asked directly if theyfelt that community health workers in Zambia should be paid.
• Main goal is “service to community” vs. “career advancement” (source: baseline survey) - Askedof all trainees: “In terms of your new CHA position, which is more important to you?” withtwo possible responses: “serving community” and “promoting career.”
Relative weight variables are derived from a survey question (source: candidate questionnaire) thatasked the trainees to allocate 50 beans between di�erent potential motivations for applying to theCHA position: “good future career,” “allows me to serve the community,” “earns respect and highstatus in the community,” “pays well,” “interesting job,” “allows me to acquire useful skills,” and“o�ers stable income.”
• Relative weight given to “career prospect” when applying
• Relative weight given to “service to community” when applying
• Relative weight given to “respect from community” when applying
• Relative weight given to “good wages” when applying
• Relative weight given to “stable income” when applying
• Relative weight given to “interesting job” when applying
• Relative weight given to “gain useful skills” when applying
C.3 Psychometric Scales
Each measure (source: baseline survey) takes on a value between 1 and 5 and represents, among thestatements listed below, the extent to which the applicant agreed, on average. Levels of agreementare 1 (strongly disagree), 2 (disagree), 3 (neither agree nor disagree), 4 (agree), 5 (strongly agree).The psychometric scales came from validated scales used in employment surveys on pro-socialmotivation and career orientation. Each variable is the average of the item scores within eachpsychometric scale. For instance, in a scale with three items, the variable value equals the sum oflevels of agreement for all items divided by three. It represents the average level of agreement withthe included items.
42

• Career orientation - Adapted from Wrzesniewski et al. (1997). In contrast to Calling below,individuals with high career orientation tend to have a deeper personal investment in theirwork and mark their achievements not only through monetary gain, but through advancementwithin the occupational structure. This advancement often brings higher social standing,increased power within the scope of one’s occupation, and higher self-esteem for the worker(Bellah et al., 1988). This scale consists of the following items: “I expect to be in a higher-level job in five years,” “I view my job as a stepping stone to other jobs,” and “I expect tobe doing the same work as a CHA in five years” (reverse-scored).
• Calling - Adapted from Wrzesniewski et al. (1997). Individuals with high “calling” find thattheir work is inseparable from their life. They do not work for financial gain or careeradvancement, but instead for the fulfillment that doing the work brings to the individual.The scale consists of the following items: “I am eager to retire in the next few years (reverse-scored),” “Community health work makes the world a better place,” “I would choose to applyfor this position again if I had the opportunity,” “I enjoy talking about community healthwork to others,” “My primary reason for working is financial—to support my family andlifestyle (reverse-scored),” “If I was financially secure, I would continue with my current lineof work even if I was no longer paid,” and “My work is one of the most important things inmy life.”
• Desire for positive pro-social impact - Adapted from Grant (2008). This measure providesan index of the degree to which an individual desires and benefits psychologically from thepositive impact of her work on others. The scale consists of the following items: “It isimportant to me to do good for others through my work,” “I care about benefiting othersthrough my work,” “I want to help others through my work,” “I want to have positive impacton others through my work,” “I get motivated by working on tasks that have the potential tobenefit others,” “I like to work on tasks that have the potential to benefit others,” “I preferto work on tasks that allow me to have a positive impact on others,” “I do my best whenI’m working on a task that contributes to the well-being of others,” “It is important to me tohave the opportunity to use my abilities to benefit others,” “It is important to me to make apositive di�erence in people’s lives through my work,” “At work, I care about improving thelives of other people,” and “One of my objectives at work is to make a positive di�erence inother people’s lives.”
• Sees self as pro-social - Adapted from Grant (2008) and consists of the following items: “I seemyself as caring,” “I see myself as someone who shares with others,” and “I regularly go outof my way to help others.”
43

• A�ective commitment to beneficiaries - Adapted from Grant (2008) and answers the followingquestion: “How much do I care about/committed to the beneficiaries of my work?” The scaleconsists of the following items: “The people who benefit from my work are very important tome,” and “The people who benefit from my work matter a great deal to me.”
• Pro-social motivation (pleasure-based) - Adapted from Grant (2008) and consists of the follow-ing items: “Supporting other people makes me very happy,” “I do not have a great feelingof happiness when I have acted unselfishly” (reverse-scored), “When I was able to help otherpeople, I always felt good afterwards,” and “Helping people who are not doing well does notraise my own mood” (reverse-scored).
• Pro-social motivation (pressure-based) - Adapted from Grant (2008) and consists of the follow-ing items: “I do not feel that I have to perform selfless acts towards others” (reverse-scored),“I feel I must stand up for other people,” “I do not regard it as my duty to act selflessly”(reverse-scored), “I feel a strong duty to help other people in every situation where it ispossible for me.”
– Concept: Both pleasure- and pressure- based pro-social motivations (PSM) are positivelyrelated to helping behavior (correlated with Rushton Altruism Scale, 20 listed behaviorsrelated to helpfulness). Pleasure-based PSM (intrinsic; pleasure-seeking through self-actualization/innate psychological needs) is related to self-actualization, self-esteem, lifesatisfaction, while pressure-based PSM (extrinsic; pain-avoiding) is positively related tonegative a�ect.
• Intrinsic motivation - Adapted from Amabile et al. (1994) and consists of the following items:“I enjoy trying to solve di�cult problems,” “I enjoy simple, straightforward tasks” (reverse-scored), “I enjoy tackling problems that are completely new to me,” “What matters most tome is enjoying what I do,” “It is important for me to be able to do what I most enjoy,” “Themore di�cult the problem, the more I enjoy trying to solve it,” “I want my work to provideme with opportunities for increasing my knowledge and skills,” “I like to figure things outfor myself,” “No matter what the outcome of a project, I am satisfied if I feel I gained a newexperience,” “Wanting to know more is the driving force behind much of what I do,” “I preferwork I know I can do well over work that goes beyond what I can manage” (reverse-scored),“I’m more comfortable when I can set my own goals,” “I enjoy doing work that is so involvingthat I forget about everything else,” “It is important for me to have space to express myself,”and “I want to find out how good I really can be at my work.”
• Extrinsic motivation - Adapted from Amabile et al. (1994) and consists of the following items:“I am not that concerned about what other people think of my work” (reverse-scored), “I
44

prefer having someone set clear goals for me in my work, “I am very much aware of the incomegoals I have for myself,” “To me, success means doing better than other people,” “I am verymuch aware of the career promotion goals I have for myself,” “I’m less concerned with whatwork I do than what I get for it,” “I’m concerned about how other people are going to reactto my ideas,” “I rarely think about salary and promotions” (reverse-scored), “I believe thatthere is no point in doing a good job if nobody else knows about it,” “I am strongly motivatedby the money I can earn,” “I prefer working on projects with clearly specified procedures,”“As long as I can do what I enjoy, I’m not that concerned about exactly what I’m paid”(reverse-scored), “I am strongly motivated by the recognition I can earn from other people,”“I have to feel that I’m earning something for what I do,” and “I want other people to findout how good I really can be at my work.”
– Concept: The Work Preference Inventory (WPI) assesses individual di�erences in in-trinsic and extrinsic motivational orientations. This includes major elements of intrinsicmotivation (self-determination, competence, task involvement, curiosity, enjoyment, andinterest; “challenge and enjoyment”) and extrinsic motivation (concerns with competi-tion, evaluation, recognition, money or other tangible incentives, and constraint by oth-ers; “compensation and outward orientation”). The instrument is scored on two primaryscales (intrinsic versus extrinsic), each subdivided into two secondary scales: challenge& enjoyment (for intrinsic) and compensation and orientation towards recognition anddictates of others (for extrinsic). The intrinsic and extrinsic scales have been found tobe orthogonal in adult US samples. The WPI has meaningful factor structures, ade-quate internal consistency, good short-term test-retest reliability, and good longer-termstability. WPI scores are predictive of other questionnaire and behavioral measures ofmotivation, as well as personality characteristics, attitudes, and behaviors.
• Proactive personality - Adapted from Claes et al. (2005) and consists of the following items:“If I see something I don’t like, I work on it,” “No matter what the situation, if I believein something I will make it happen,” “I love being a champion for my ideas, even whenothers disagree,” “I am good at identifying opportunities,” “I am always looking for betterways to do things,” “If I believe in an idea, nothing will prevent me from making it happen.”This six-item Proactive Personality Score (PPS) measures a proactive personality type in aninternally consistent manner, across di�erent cultures, and through a single factor.
• Accomplishment-seeking - Adapted from Barrick et al. (2002) and consists of the followingitems: “I often think about getting my work done,” “I focus my attention on completingwork assignments,” “I set personal goals to get a lot of work accomplished,” “I spend a lotof time thinking about finishing my work tasks,” “I often consider how I can get more work
45

done,” “I try hard to get things done in my job,” “I put a lot of e�ort into completing mywork tasks,” “I never give up trying to finish my work,” “I spend a lot of e�ort completingwork assignments,” “I feel encouraged when I think about finishing my work tasks,” and “Itis very important to me that I complete a lot of work.”
• Status-seeking - Adapted from Barrick et al. (2002) and consists of the following items: “Ifrequently think about ways to advance and obtain better pay or working conditions,” “Ifocus my attention on being the best sales representative in the o�ce,” “I set personal goalsfor obtaining more sales than anyone else,”,“I spend a lot of time thinking of ways to getahead of my coworkers,” “I often compare my work accomplishments against coworkers’ ac-complishments,” “I never give up trying to perform at a level higher than others,” “I alwaystry to be the highest performer,” “I get excited about the idea of being the most successfulCHW,” “I feel happy when I think about getting a higher-status position at work,” “I wantto perform my job better than my coworkers,” and “I get worked up thinking about ways tobecome the highest performing CHW.”
• Communion-seeking - Adapted from Barrick et al. (2002) and consists of the following items:“I focus my attention on getting along with others at work,” “I spend a lot of time thinkingabout whether my coworkers like me,” “I never give up trying to be liked by my coworkersand supervisors,” “I work hard to be seen as someone who is easy to get along with,” “I getexcited about the prospect of having coworkers who are good friends,” “I enjoy thinking aboutworking together with my coworkers and supervisors,” “I care a lot about having coworkersand supervisors who are like me,” “I am challenged by a desire to be a team player,” and “Iworry thinking about ways to make sure others like me.”
• Internal motivation - Adapted from Edmondson (1999) and consists of the following items:“My opinion of myself goes up when I do my job well” and “I feel bad and unhappy when Idiscover that I have performed less well than I should have in my job.”
C.4 Selection Panel Variables
• =1 if selected (top 2) (source: ranking sheet984264091
• =1 if ranked top 5 (source: ranking sheet)
C.5 Household Visits
Once CHAs returned to their community, their performance on a series of tasks is tracked. Formalhousehold visits are the central part of the CHA job. Each CHA would be assigned a caseload ofroughly 350 households, each of which he or she was supposed to visit on a quarterly basis. During
46

household visits, the CHA is to provide health education and counseling, basic care to any sickpersons, and referrals to nearby health facilities as needed. CHAs are also expected to inspectthe use of mosquito nets and standards of hygiene in food preparation, water use, ventilation, andlatrines. We measure the number and duration of these visits through two complementary metricsover the course of eighteen months from September 2012 (when CHAs started work) until August2013.
Source: SMS Receipts
• Unique households visited
• Number of visits per household
• Average visit duration, in minutes
Source: HMIS (monthly reports)
Each reported variable is the sum of each indicator’s monthly values from September 2012 to August2013.
• Number of households visited
• Number of children visited
• Number of women visited
• Number of women and children visited per household visit
• Number of patients seen at HP
• Number of community mobilization meetings
47

C.6 Time Use
(Source: Ndola survey)
• Number of hours worked in a typical week - CHAs were asked “In a typical week, how manytotal hours do you spend doing CHA work? Please count work that you do at the health postand in the village, including moving from household to household.”
• Frequency of out-of-hours calls in a typical week - CHAs were asked “In a typical week, howoften do you have to leave your house at night and do CHW work due to emergencies like apregnancies or accidents?” Possible responses were “5-7 days per week,” “3-4 days per week,”“1-2 days per week,” “2-3 times per month,” “Once per month,” “Sometimes, but less thanonce per month,” and “Never.”
• Share of time allocated to - To obtain time allocations, CHAs were asked to allocate 50 beansbetween di�erent activities. The instructions were as follows:
Please use the beans to show how much time you spend doing each activity. If you spend moretime in an activity, you should place more beans on the card. If you never do an activity, youshould place no beans on the card. Place the beans any way you would like. For instance, youcan place all beans on one card, or 0 beans on any card.
Household visits - Now I would like you to think about household visits specifically. Here aresome cards that list di�erent activities you may do during household visits.
– greeting household members
– assessing and referring sick household members
– reviewing and discussing the household’s health profile and goals
– asking questions about household health behaviors and knowledge
– providing health counseling
– doing household inspections (waste disposal, latrines, etc.)
– documentation (filling registers/books and sending visit receipts via SMS)
Health Post - Now here are some cards that list di�erent activities you may do at the HEALTHPOST OR RURAL HEALTH center.
– seeing sick patients at the OPD
– dispensing medications from the pharmacy
– helping with ANC visits
– cleaning and maintaining the facility
48

– assisting with deliveries and other procedures when needed
– documentation (filling registers/books and sending monthly reports through HMIS)
In the Community - Now here are some cards that list di�erent activities you may do as aCHA.
– campaigns for polio, measles, child health, and other health issues
– health talks and other community mobilization activities
– school health talks and other school activities
– meeting with NHC and volunteer CHWs for planning
C.7 Data Sources
• Source: Application (sample: all applicants) - Applications were submitted from August-September 2010. The initial application stage comprised the initial application form, whichincludes fields for gender, date of birth, village of residence, educational qualifications, andprevious health experience (position, organization, start and end years). The applicationform also included a question asking through what means the applicant first learned of theCHA job opportunity: recruitment poster, facility health worker, community health worker,government o�cial, word-of-mouth, or “other.”
• Source: Candidate Questionnaire (sample: subset of applicants called for an interview)- Ranking questionnaires were filled and collected from September to October 2010. If ap-plicants met the basic criteria noted above, they were invited for interviews, and asked tocomplete a questionnaire on the interview day. The questionnaire (written in English) in-cluded a series of questions about the interviewee’s demographic background, communityhealth experience, social capital, and work preferences and motivations. Notably, we in-cluded a measure employed by social psychologists, “Inclusion of Others in Self” from Aronet al. (2004) to measure connection with the community. The questionnaire stated that theanswers would not be used for selection purposes but rather are part of a research project,although we cannot rule out that panelists could have seen the questionnaire or referred to itwhen making their decisions.
• Source: Ranking Sheet (sample: members of interview panels) - Ranking sheets were filledand collected from September to October 2010. Each panel consisted of five members: thedistrict health o�cer, a representative from the health center, and three neighborhood healthcommittee members. Once all interviews were completed, every member of the selection panelcompleted a private and individual ranking sheet by ranking their top ten candidates. This
49

ranking exercise occurred before panel members formally deliberated and discussed the can-didates. After interviewing all candidates and deliberating, interview panels were requestedto complete and submit a consensus-based “Selection Panel Report” that included fields forthe two nominated candidates as well as three alternates.
• Source: Baseline Survey (sample: all trainees) - The baseline survey was conducted inJune 2011 and consisted of five components:
1. Questionnaire- Conducted one-on-one by a surveyor and collected information on thetrainees’ socio-economic background and livelihoods, previous experience with healthwork, motivations to apply, and expectations of the program.
2. Psychometric scales- A self-administered written exercise which gathered alternative in-formation on motivations to apply, determinants of job satisfaction, and other charactertraits.
3. Modified donation game- An experimental game whereby students received a small do-nation and were given the opportunity to give some of it back for a good cause. Itexplored the altruistic nature of the students.
4. Coin game- An experimental game that explored the risk-taking behavior of the students.
5. Self-assessment- A three-hour exam with multiple choice questions to determine theknowledge on health matters that each student had prior to the training.
• Source: Catchment Area Survey (sample: all deployed CHWs and supervisors) - Justprior to graduation in July 2012, all CHWs and supervisors were given a short survey thatasked about characteristics of their health posts, including population density, rainy-seasoninformation, and general community health measures.
• Source: Ndola Survey (sample: all deployed CHWs) - This survey was conducted inApril/May 2013 in Ndola, Zambia. The respondents were pilot CHAs who reported to Ndolafor a supplemental in-service training to introduce new tasks as part of a revised CHA scopeof work. The survey was administered by Innovations for Poverty Action, in partnership withthe Ministry of Health, the CHA Training School, and the Clinton Health Access Initiative.
• Source: SMSs (sample: all deployed CHWs) - All CHAs carry with them receipt booksfor each visit, which require the signature of the client visited. The information on thesereceipts–consisting of the data, time, and duration of the visit, as well as the client’s phonenumber–is then SMS’ed in real time to the MoH and our central data-processing facility. 5%of these visits are audited.
50
• Source: HMIS (sample: all deployed CHWs) - CHAs are required to submit monthly reportsthat summarize their activities at the health post/community level. These reports becomepart of the Health Management and Information System (HMIS), the Zambian Ministry ofHealth’s system for reporting, collecting, and aggregating routine health services data atgovernment facilities.
D District Instruction Appendix
The CHA program was introduced di�erently to health centers depending on the treatment group.In each district, the district health o�cial was given a package that contained a script, a memofrom the Permanent Secretary, and detailed instructions about the CHA recruitment process. Inaddition, district health o�cials received “health center packages” for each participating healthcenter in the district, which contained a set of posters and application forms and instructionsfor the health center representative on how to post posters and collect applications. The districthealth o�cials were to visit each health center and meet with the sta� and neighborhood healthcommittee members to introduce the program and distribute the health center packages, usingthe script provided to them in their packages. The script was only provided to the district healtho�cials, and was addressed directly to them. It is unlikely that the applicants or health center sta�were able to read this script themselves.
The following script was given to district health o�cials in the career-incentives treatmentgroup:
To Health center and Neighborhood Health Committee: I would like to you let you knowabout a new government program to strengthen the country’s health workforce. Applica-tions are currently being accepted for a new Community Health Worker position. Thisis an opportunity for qualified Zambians to obtain employment and to advance theirhealth careers. Opportunities for training to advance to positions such as Nurse andClinical O�cer may be available in the future. Successful applicants will receive 1 yearof training, both theoretical and practical. All training costs, including transportation,meals and accommodation during the one-year training program, will be covered by theMinistry of Health. Please encourage all qualified persons to apply so that they canbenefit from this promising career opportunity.
The district health o�cials in the social incentives treatment group received the following script:
To Health center and Neighborhood Health Committee: I would like to you let you knowabout a new government program to improve health care services in your community.Applications are currently being accepted for a new Community Health Worker position.This is an opportunity for local community members to become trained and serve the
51
health needs of their community. The new CHWs will work at the Health Post andcommunity level in coordination with an a�liated Health center. Successful applicantswill receive 1 year of training, both theoretical and practical. All training costs, includingtransportation, meals and accommodation during the one-year training program, will becovered by the Ministry of Health. Please encourage all qualified persons to apply sothat they can benefit from this promising community service opportunity.
52

References
Akerlof, George A. and Rachel E. Kranton, “Identity and the Economics of Organizations,”The Journal of Economic Perspectives, 2005, 19 (1), 9–32.
Amabile, Teresa M. et al., “The Work Preference Inventory: Assessing Intrinsic and ExtrinsicMotivational Orientations,” Journal of Personality and Social Psychology, 1994, 66 (5), 950–967.
Aron, Arthur, Elaine N. Aron, and Danny Smollan, “Inclusion of Other in the Self Scale andthe Structure of Interpersonal Closeness,” Journal of Personality and Social Psychology, 1992,63 (4), 596.et al., “Including Others in the Self,” European Review of Social Psychology, 2004, 15 (1),
101–132.Ashraf, Nava, Oriana Bandiera, and Kelsey Jack, “No Margin, No Mission? A Field Exper-
iment on Incentives for Public Service Delivery,” May 2013. Manuscript.Bandiera, Oriana, Iwan Barankay, and Imran Rasul, “Team incentives: Evidence from a
firm level experiment,” Journal of the European Economic Association, 2013, 11 (5), 1079–1114.Barrick, Murray R., Greg L. Stewart, and Mike Piotrowski, “Personality and Job Perfor-
mance: Test of the Mediating E�ects of Motivation Among Sales Representatives,” Journal ofApplied Psychology, 2002, 87 (1), 43–51., Michael K. Mount, and Timothy A. Judge, “Personality and Performance at the Begin-ning of the New Millennium: What Do We Know and Where Do We Go Next?,” InternationalJournal of Selection and Assessment, 2001, 9 (1-2), 9–30.
Bellah, Robert N. et al., Habits of the Heart: Individualism and Commitment in AmericanLife., University of California Press, Berkeley, CA, 1988.
Benabou, Roland and Jean Tirole, “Incentives and Prosocial Behavior,” The American Eco-nomic Review, 2006, 96 (5), 1652–1678.
Besley, Timothy and Maitreesh Ghatak, “Competition and Incentives with MotivatedAgents,” American Economic Review, 2005, 95 (3), 616–636.
Bordalo, Pedro, Nicola Gennaioli, and Andrei Shleifer, “Salience and Asset Prices,” Amer-ican Economic Review, 2013, (3), 623–628.
Chetty, Raj, Adam Looney, and Kory Kroft, “Salience and Taxation: Theory and Evidence,”American Economic Review, 2009, 99 (4), 1145–1177.
Claes, Rita, Colin Beheydt, and Björn Lemmens, “Unidimensionality of Abbreviated Proac-tive Personality Scales Across Cultures,” Applied Psychology, 2005, 54 (4), 476–489.
Dal Bó, Ernesto, Frederico Finan, and Martin A. Rossi, “Strengthening State Capabili-ties: The Role of Financial Incentives in the Call to Public Service,” The Quarterly Journal ofEconomics, 2013, 128 (3), 1169–1218.
Delfgaauw, Josse and Robert Dur, “Incentives and Workers’ Motivation in the Public Sector,”
53

The Economic Journal, 2008, 118 (525), 171–191., , Carol Propper, and Sarah Smith, “Management Practices: Are Not-for-profits Di�er-ent?,” CEPR Discussion Paper 8498, 2011.
Dohmen, Thomas and Armin Falk, “You Get What You Pay For: Incentives and Selection inthe Education System,” The Economic Journal, 2010, 120 (546), F256–F271.
Duckworth, Angela L. et al., “Grit: Perseverance and Passion for Long-term Goals.,” Journalof Personality and Social Psychology, 2007, 92 (6), 1087–1101.
Duflo, Esther, Rema Hanna, and Stephen P. Ryan, “Incentives Work: Getting Teachers toCome to School,” The American Economic Review, 2012, 102 (4), 1241–1278.
Edmondson, Amy, “Psychological Safety and Learning Behavior in Work Teams,” AdministrativeScience Quarterly, 1999, 44 (2), 350–383.
Engel, Christoph, “Dictator games: a meta study,” Experimental Economics, 2011, 14 (4), 583–610.
Ferraz, Claudio and Frederico Finan, “Motivating Politicians: The Impacts of MonetaryIncentives on Quality and Performance,” 2011.
Francois, Patrick, “Making a Di�erence,” The RAND Journal of Economics, Autumn 2007, 38(3), 714–732.
Gagliarducci, Stefano and Tommaso Nannicini, “Do Better Paid Politicians Perform Better?Disentangling Incentives from Selection,” Journal of the European Economic Association, 2011.
Gebauer, Julie and Don Lowman, Closing the Engagement Gap: How Great Companies UnlockEmployee Potential for Superior Results, Towers, Perrin, Forster & Crosby, Inc, 2008.
Georgellis, Yannis, Elisabetta Lossa, and Vurain Tabvuma, “Crowding out Intrinsic Mo-tivation in the Public Sector,” Journal of Public Administration Research and Theory, 2011, 21(3), 473–493.
Gorodnichenko, Yuriy and Klara Sabirianova Peter, “Public Sector Pay and Corruption:Measuring Bribery from Micro Data,” Journal of Public Economics, 2007, 91 (5), 963–991.
Government of Zambia, “National Community Health Worker Strategy in Zambia,” TechnicalReport, Ministry of Health 2010.
Grant, Adam M., “Does Intrinsic Motivation Fuel the Prosocial Fire? Motivational Synergy inPredicting Persistence, Performance, and Productivity.,” Journal of Applied Psychology, 2008,93 (1), 48–58.
Hanna, Rema and Shing-Yi Wang, “Dishonesty and Selection into Public Service,” 2013.Holzer, Harry, Lawrence F. Katz, and Alan B. Krueger, “Job Queues and Wages,” The
Quarterly Journal of Economics, 1991, 106 (3), 739–768.Lagarde, Mylène and Duane Blaauw, “Pro-social Preferences and Self-selection into Rural
Jobs: Evidence from South African Nurses,” 2013. Working Paper.Lazear, Edward P., “Performance Pay And Productivity,” American Economic Review, 2000, 90
54

(2), 1346–1361.Le Grand, Julian, Motivation, Agency and Public Policy: Of Knights and Knaves, Pawns and
Queens, New York: Oxford University Press, 2003.Lehmann, Uta and David Sanders, “Community health workers: What do we know about
them? The state of the evidence on programmes, activities, costs and impact on health outcomesof using community health workers,” World Health Organization, 2007, 2, 1–42.
Marinescu, Ioana and Ronald Woltho�, “Wages, Applications, and Skills,” 2013.Mashek, Debra, Lisa Cannaday, and June Tangney, “Inclusion of Community in Self Scale:
A Single-item Pictoral Measure of Community Connectedness,” Journal of Community Psychol-ogy, 2007, 35, 257–275.
Milgrom, Paul R, “Employment contracts, influence activities, and e�cient organization design,”The Journal of Political Economy, 1988, pp. 42–60.
Miller, Grant et al., “E�ectiveness of Provider Incentives for Anaemia Reduction in Rural China:a Cluster Randomised Trial,” BMJ: British Medical Journal, 2012, 345.
Muralidharan, Karthik and Venkatesh Sundararaman, “Teacher Performance Pay: Exper-imental Evidence from India,” Journal of Political Economy, February 2011, 119 (1), 39–77.
Murnane, Richard J, John B Willett, and Frank Levy, “The growing importance of cognitiveskills in wage determination,” Review of Economics and Statistics, 1995, 77 (2), 251–266.
Neal, Derek A and William R Johnson, “The Role of Premarket Factors in Black-White WageDi�erences,” The Journal of Political Economy, 1996, 104 (5), 869–895.
Perry, James L., Annie Hondeghem, and Lois Recascino Wise, “Revisiting the Motiva-tional Bases of Public Service: Twenty Years of Research and an Agenda for the Future,” PublicAdministration Review, 2010, 7 (5), 681–690.
Propper, Carol and John Van Reenen, “Can Pay Regulation Kill? Panel Data Evidence onthe E�ect of Labor Markets on Hospital Performance,” Journal of Political Economy, 2010.
Reinikka, Ritva and Jakob Svensson, “Working for God? Evidence form a Change in Fi-nancing of Not-for-profit Health Care Providers in Uganda,” Journal of the European EconomicAssociation, 2010, 8 (6), 1159–1178.
Roy, A. D., “Some Thoughts on the Distribution of Earnings,” Oxford Economic Papers, 1951, 3(2), 136–146.
Schmuck, Peter and Wesley Schultz, eds, Psychology of Sustainable Development, KluwerAcademic,
Schultz, P. Wesley, “Inclusion with Nature: The Psychology Of Human-nature Relations,” Psy-chology of Sustainable Development, 2002, pp. 61–78.
Smith, Sarah and Edd Cowley, “Who Works in the Public Sector? Evidence from the WorldValues Survey,” The Centre for Market and Public Organisation, August 2011, Working Paper11/268. Working Paper No. 11/268.
55
Wageman, Ruth, “How Leaders Foster Self-managing Team E�ectiveness: Design Choices VersusHands-on Coaching,” Organization Science, 2001, 12 (5).
World Health Organization, “The world health report 2006: working together for health.Geneva: World Health Organization,” 2006.
Wrzesniewski, Amy et al., “Jobs, Careers, and Callings: People’s Relations to Their Work,”Journal of Research in Personality, 1997, 31, 21–33.
56

Figure I.A: Recruitment poster: Career incentives treatment
REPUBLIC OF ZAMBIA MINISTRY OF HEALTH
ONE-YEAR COURSE IN COMMUNITY HEALTH The Ministry of Health of the Republic of Zambia is launching a new national Community Health Worker (CHW) strategy and invites applicants to participate in the inaugural training of community health workers. The training will begin on 30th August 2010 and will be held at the Provincial level for selected applicants. All participation costs, including transportation, meals and accommodation will be covered by the Ministry of Health.
BENEFITS:
x Become a highly trained member of Zambia’s health care system
x Interact with experts in medical fields x Access future career opportunities including:
o Clinical Officer o Nurse o Environmental Health Technologist
QUALIFICATIONS:
x Zambian National x Grade 12 completed with two “O” levels x Age 18-45 years x Endorsed by Neighborhood Health Committee
within place of residence x Preference will be given to women and those
with previous experience as a CHW
APPLICATION METHOD: Submit to the DESIGNATED HEALTH CENTRE indicated above:
x Completed application form with necessary endorsements. If no blank forms are attached to this notice, kindly obtain a blank one at the nearest health centre.
x Photocopy of school certificate documenting completion of Grade 12 and two “O” levels.
x Photocopy of Zambian national registration card.
For more information: Contact the designated health centre indicated above.
CLOSING DATE: 30th JULY 2010. Only shortlisted candidates will be contacted for interview.
TRAINING OPPORTUNITY
DESIGNATED HEALTH CENTRE: FOR POSTING AT:
57

Figure I.B: Recruitment poster: Social incentives treatment
REPUBLIC OF ZAMBIA MINISTRY OF HEALTH
ONE-YEAR COURSE IN COMMUNITY HEALTH The Ministry of Health of the Republic of Zambia is launching a new national Community Health Worker (CHW) strategy and invites applicants to participate in the inaugural training of community health workers. The training will begin on 30th August 2010 and will be held at the Provincial level for selected applicants. All participation costs, including transportation, meals and accommodation will be covered by the Ministry of Health.
BENEFITS:
x Learn about the most important health issues in your community
x Gain the skills you need to prevent illness and promote health for your family and neighbors
x Work closely with your local health post and health centre
x Be a respected leader in your community QUALIFICATIONS:
x Zambian National x Grade 12 completed with two “O” levels x Age 18-45 years x Endorsed by Neighborhood Health Committee
within place of residence x Preference will be given to women and those
with previous experience as a CHW
APPLICATION METHOD: Submit to the DESIGNATED HEALTH CENTRE indicated above:
x Completed application form with necessary endorsements. If no blank forms are attached to this notice, kindly obtain a blank one at the nearest health centre.
x Photocopy of school certificate documenting completion of Grade 12 and two “O” levels.
x Photocopy of Zambian national registration card. For more information: Contact the designated health centre indicated above.
CLOSING DATE: 30th JULY 2010. Only shortlisted candidates will be contacted for interview.
TRAINING OPPORTUNITY
DESIGNATED HEALTH CENTRE: FOR POSTING AT:
58

Figure II: Average treatment e�ects on exam score
Quantile treatment effects on O-levels exam score at selected percentiles
Percentile 5th 10th 25th 50th 75th 90th 95th
Quantile treatment effect of career incentives 1.02 0.751 0.98 0.858 1 2.87** 2.68Bootstrapped SE (clustered at the district level) (.756) (.731) (.743) (.615) (.863) (1.22) (1.81)
0.0
1.0
2.0
3.0
4.0
5de
nsity
0 20 40 60O-Levels total exam score
career�incentives
social�incentives
59

Figure III: Average treatment e�ects on job performancePanel A: Kernel density estimates of visits by treatment
Panel B: Quantile treatment effect estimates
Notes: Total number of household visited, aggregated from individual SMS receipts sent by individual CHAs to MOH. Panel A plots kernel density estimates. Panel B reports quantile treatment effects using the same covariates as in Column 2, Table 6. Each point represents the treatment effect at the decile on the x-axis, each bar represents the 90% confidence interval. Confidence intervals are based on bootstrapped standard errors with 500 replication clustered at the district level.
-100
010
020
030
040
0qe
ff
0 20 40 60 80 100Month
0.0
005
.001
.001
5.0
02K
erne
l den
sity
0 250 500 750 1000 1250Number of visits (September 12-January 14)
career�incentives
social�incentives
quantile
60

Tabl
eI:
Are
ach
arac
teris
tics
bytr
eatm
ent
(ran
dom
izat
ion
bala
nce)
recr
uitm
ent p
oste
r mak
es sa
lient
career
social
p-va
lue
of th
e di
ffer
ence
(1)
(2)
(3)
Num
ber o
f hea
lth p
osts
85
77-
Num
ber o
f sta
ff in
hea
lth p
ost
1.49
1.36
(1.0
9)(1
.17)
Dis
trict
-leve
l pop
ulat
ion
dens
ity (p
erso
ns/k
m2 )
13.5
814
.08
(8.8
8)(9
.92)
Geo
grap
hica
l dis
tribu
tion
of h
ouse
hold
s in
catc
hmen
t are
a:
Mos
t peo
ple
live
in th
eir f
arm
s, no
ne in
vill
ages
.082
.091
(.276
)(.2
89)
Som
e pe
ople
live
in fa
rms,
som
e in
smal
l vill
ages
(5-1
0hh)
.529
.532
(.502
)(.5
02)
Mos
t peo
ple
live
in m
ediu
m/la
rge
villa
ges (
mor
e th
an 1
0hh)
, a fe
w o
n th
eir f
arm
s.3
88.3
64(.4
90)
(.484
)Sh
are
of h
ouse
hold
s usi
ng IT
Ns
.319
.331
(.187
)(.2
06)
Shar
e of
hou
seho
lds u
sing
thei
r ow
n pi
t lat
rine
.343
.328
(.227
)(.2
14)
Poor
cel
l net
wor
k co
vera
ge.0
82.0
65(.2
77)
(.248
)
Notes:
Col
umns
1an
d2
show
mea
nsan
dst
anda
rdde
viat
ions
inpa
rent
hese
s.N
umbe
rof
staf
fin
heal
thpo
stis
the
tota
lnum
ber
ofnu
rses
,env
ironm
enta
lhea
lthte
chni
cian
s,an
dcl
inic
alof
ficer
sas
sign
edto
the
heal
thpo
stas
repo
rted
bydi
stric
toff
icia
lssu
rvey
edby
phon
e.D
istr
ict-l
evel
popu
latio
nde
nsity
(per
sons
pers
quar
eki
lom
eter
)is
base
don
data
from
the
2010
natio
nalc
ensu
sfo
rthe
48di
stric
tspa
rtici
patin
gin
the
prog
ram
.Inf
orm
atio
non
the
geog
raph
ical
dist
ribu
tion
ofH
Hs
was
ob
tain
edfr
oma
surv
eyof
the
depl
oyed
CH
As
befo
rede
ploy
men
t.C
HA
sw
ere
show
nst
yliz
edm
aps
acco
mpa
nied
byth
ede
scrip
tion
abov
ean
das
ked
toch
oose
the
one
that
mos
tclo
sely
rese
mbl
edth
eca
tchm
enta
rea
ofth
eirh
ealth
post
.Que
stio
nsw
ere
aske
dto
each
CH
Ain
divi
dual
lyso
that
two
CH
As
from
the
sam
ehe
alth
post
coul
dgi
vedi
ffer
enta
nsw
ers.
Fort
he5
outo
f161
case
sin
whi
chth
etw
oC
HA
sga
vedi
ffer
enta
nsw
ers,
we
use
the
info
rmat
ion
prov
ided
bysu
perv
isor
sto
brea
kth
etie
.To
mea
sure
the
shar
eof
hous
ehol
dsus
ing
ITN
s/pi
tlat
rine
sw
eas
kC
HA
sto
choo
seam
ong
four
inte
rval
s(0-
25,2
5-50
,50-
75,7
5-10
0)an
dth
enta
keth
em
idpo
int
ofth
ein
terv
alto
com
pute
the
mea
n.In
case
ofdi
sagr
eem
ent(
20/1
62fo
rITN
s,22
/162
forp
itla
trine
s)w
eta
keth
eav
erag
eac
ross
the
two
CH
As.
Whe
nan
swer
sdo
not
mat
ch,t
hetw
oC
HA
sty
pica
llych
ose
cont
iguo
usin
terv
als,
and
the
supe
rvis
orge
nera
llyag
rees
with
one
ofth
etw
o.To
mea
sure
cell
netw
ork
cove
rage
we
atte
mpt
toca
llal
lCH
As
afte
rdep
loym
ent.
We
mak
eda
ilyca
llsfo
r118
cons
ecut
ive
days
.The
heal
thpo
stis
clas
sifie
das
havi
ngpo
orco
vera
geif
we
dono
tman
age
to re
ach
eith
er o
f its
two
CH
As d
urin
g th
is p
erio
d.
.559
.848
.855
.749
.738
.627
.675
.854
61

Tabl
eII
:Tre
atm
ent
e�ec
tson
trai
tsof
appl
ican
tsan
dtr
aine
es:
skill
san
dou
tsid
eop
tion
recr
uitm
ent p
oste
r mak
es sa
lient
care
erso
cial
p-va
lues
(s
ee n
otes
)ca
reer
soci
alp-
valu
es
(see
not
es)
(1)
(2)
(3)
(1)
(2)
(3)
Pane
l A: S
kills
App
lican
t qua
lifie
s for
uni
vers
ity a
dmis
sion
.765
.708
.013
(.03
8).7
95.7
960.
998
(.500
)
(.424
)(.4
56)
(.405
)(.4
04)
O-le
vels
tota
l exa
m sc
ore
24.8
23.3
.019
(.04
9)25
.324
.50.
517
(.318
)(9
.81)
(9.3
4)(9
.90)
(8.8
1)
O-le
vels
pas
sed
in b
iolo
gy a
nd o
ther
nat
ural
scie
nces
1.44
1.24
.006
(.03
8)1.
471.
390.
748
(.408
)
(.857
)(.8
88)
(.866
)(.8
23)
Bas
ic m
edic
al k
now
ledg
e te
st sc
ore
61.5
59.2
0.00
5 (.0
16)
(8.7
7)(8
.87)
Aver
age
stan
dard
ized
trea
tmen
t effe
ct
Pane
l B: O
ccup
atio
n at
tim
e of
app
licat
ion
Farm
er.7
14.6
84.4
08 (.
207)
.717
.660
.448
(.25
6)(.4
52)
(.465
)(.4
52)
(.476
)Tr
ader
.077
.051
.088
(.08
8).0
90.0
78.7
83(.4
22)
(.267
)(.2
21)
(.287
)(.2
69)
Teac
her
.064
.043
.030
(.03
9).0
41.0
21.2
25 (.
124)
(.245
)(.2
04)
(.200
)(.1
45)
Aver
age
stan
dard
ized
trea
tmen
t effe
ct
Part
I: A
pplic
ants
(N=1
585)
Part
II:
Sel
ecte
d T
rain
ees
(N=3
14)
Not
es:C
olum
ns1
and
2sh
owm
eans
and
stan
dard
devi
atio
nsin
pare
nthe
ses.
Col
umn
3re
ports
the
p-va
lues
ofth
enu
llhy
poth
esis
that
the
care
ertre
atm
ente
ffec
Appl
ican
tqua
lifie
sfo
run
iver
sity
adm
issi
onto
the
Uni
vers
ityof
Zam
bia
ifth
eypa
ss5
O-le
vels
with
atle
astt
wo
cred
its(g
rade
s1-
6in
a1-
9sc
ale)
.The
ECZ
requ
ires
that
cand
idat
esw
rite
am
inim
umof
6O
-leve
lexa
ms
and
Engl
ish
and
mat
hem
atic
sar
eco
mpu
lsor
yin
mos
tsch
ools
.In
addi
tion,
stud
ents
can
choo
seop
tions
inth
ena
tura
lsci
ence
s,ar
tsan
dhu
man
ities
and
busi
ness
stud
ies.
O-le
vels
tota
lexa
msc
ore
isco
nstru
cted
asth
esu
mof
inve
rted
O-le
vels
scor
es(1
=9,
2=8,
and
soon
)fro
mal
lsub
ject
sin
whi
chth
eap
plic
antw
rote
the
exam
,so
that
larg
erva
lues
corr
espo
ndto
bette
rper
form
ance
.O-le
vels
pass
edin
biol
ogy
and
othe
rna
tura
lsci
ence
s,eq
uals
the
num
ber
ofO
-leve
lspa
ssed
inbi
olog
y,ch
emis
try,p
hysi
cs,s
cien
cean
dag
ricul
tura
lsci
ence
.Bas
icm
edic
alkn
owle
dge
test
scor
eeq
uals
the
num
ber
ofco
rrec
tans
wer
sin
a10
0qu
estio
nte
stad
min
iste
red
atth
est
arto
fth
etra
inin
gpr
ogra
mto
test
the
train
ees
know
ledg
eof
basi
cm
edic
al p
ract
ices
nee
ded
for t
he C
HA
job.
1.29
**(.4
69)
.651
(.553
)
2.21
***
(.847
).8
95(.7
71)
62

Tabl
eII
I.A:T
reat
men
te�
ects
ontr
aits
ofap
plic
ants
and
trai
nees
:pr
o-so
cial
pref
eren
ces
recr
uitm
ent p
oste
r m
akes
sal
ient
care
erso
cial
p-va
lues
(s
ee n
otes
)ca
reer
soci
alp-
valu
es
(see
not
es)
(1)
(2)
(3)
(1)
(2)
(3)
Pane
l A: A
pplic
ants
' pro
-soc
ial m
otiv
atio
n
Perc
eive
s com
mun
ity in
tere
sts a
nd se
lf-in
tere
st a
s ove
rlapp
ing
.839
.842
.975
(.51
4).8
48.8
54.9
43 (.
481)
(.367
)(.3
64)
(.360
)(.3
54)
Aim
s to
rem
ain
in th
e sa
me
com
mun
ity in
5-1
0 ye
ars
.507
.566
.228
(.18
2).5
71.6
08.4
12 (.
274)
(.500
)(.4
96)
(.496
)(.4
90)
Bel
ongs
to v
illag
e co
mm
ittee
or s
elf-
help
gro
up.4
46.4
74.3
31 (.
184)
.586
.383
.000
(.00
2)(0
.497
)(.5
00)
(.494
)(.4
88)
Don
atio
n to
loca
l hos
pita
l (di
ctat
or g
ame)
4047
3944
.842
(.44
0)(4
093)
(389
8)Ps
ycho
met
ric sc
ale:
Des
ire fo
r pos
itive
pro
-soc
ial i
mpa
ct [1
-5]
4.43
4.23
0.8
32 (.
430)
(.445
)(.5
03)
Psyc
hom
etric
scal
e: S
ees s
elf a
s pro
-soc
ial
[1-5
]4.
254.
38.2
51 (.
199)
(.616
)(.6
05)
Psyc
hom
etric
scal
e: A
ffec
tive
com
mitm
ent t
o be
nefic
iarie
s [1
-5]
3.82
3.82
.912
(.45
3)(1
.15)
(1.1
7)Ps
ycho
met
ric sc
ale:
Pro
-soc
ial m
otiv
atio
n (P
leas
ure-
base
d)3.
673.
71.5
95 (.
482)
(.603
)(.6
54)
Psyc
hom
etric
scal
e: P
ro-s
ocia
l mot
ivat
ion
(Pre
ssur
e-ba
sed)
3.57
3.54
.636
(.32
2)(.7
03)
(.677
)Av
erag
e st
anda
rdiz
ed tr
eatm
ent e
ffect
Not
es:
Col
umns
1an
d2
show
mea
nsan
dst
anda
rdde
viat
ions
inpa
rent
hese
s.C
olum
n3
repo
rtsth
ep-
valu
esof
the
null
hypo
thes
isth
atth
eca
reer
treat
men
teff
ecte
qual
sze
roco
nditi
onal
onst
ratif
icat
ion
varia
bles
and
with
stan
dard
erro
rscl
uste
red
atth
edi
stric
tlev
el.C
olum
n3
also
repo
rtsra
ndom
izat
ion
infe
renc
ep-
valu
es(in
pare
nthe
ses)
obta
ined
bysi
mul
atin
g1,
000
plac
ebo
treat
men
tass
ignm
ents
,est
imat
ing
plac
ebo
treat
men
teff
ects
inea
chus
ing
the
spec
ifica
tion
abov
ean
dco
mpu
ting
the
prob
abili
tyth
atth
epl
aceb
otre
atm
ente
ffec
tsar
ela
rger
than
the
actu
altre
atm
ente
ffec
t.Pe
rcei
ves
com
mun
ityan
dse
lf-in
tere
stas
over
lapp
ing
:Ada
pted
Incl
usio
nof
Oth
ers
inSe
lfsc
ale
(Aro
net
al.,
2004
).A
pplic
ants
are
aske
dto
choo
sebe
twee
nse
tsof
pict
ures
,eac
hsh
owin
gtw
oci
rcle
s(la
bele
d"s
elf"
and
"com
mun
ity")
with
vary
ing
degr
ees
ofov
erla
p,fr
omno
n-ov
erla
ppin
gto
alm
ostc
ompl
etel
yov
erla
ppin
g.Th
isva
riabl
eeq
uals
1if
the
resp
onde
ntch
oose
sth
eal
mos
tcom
plet
ely
over
lapp
ing
pict
ure,
0ot
herw
ise.
Belo
ngs
toan
yvi
llage
com
mitt
ees
orse
lf-he
lpgr
oups
:1
ifth
eap
plic
antb
elon
gsto
any.
Don
atio
nto
loca
lhos
pita
l:In
the
mod
ified
dict
ator
gam
e,tra
inee
sar
egi
ven
25,0
00K
wac
ha(a
ppro
xim
atel
y$5
)an
din
vite
dto
dona
tean
ypo
rtion
(incl
udin
gno
thin
g)to
the
loca
lhos
pita
lto
supp
ortn
eedy
patie
nts.
This
dona
tion
deci
sion
occu
rspr
ivat
ely
and
conf
iden
tially
inco
ncea
led
dona
tion
boot
hs.T
heps
ycho
met
ricva
riabl
esar
ead
opte
dfr
omG
rant
(200
8).E
ach
mea
sure
take
son
ava
lue
betw
een
1an
d5
and
repr
esen
ts,a
mon
gth
est
atem
ents
liste
dbe
low
,the
exte
ntto
whi
chth
eap
plic
anta
gree
d,on
aver
age.
Leve
lsof
agre
emen
tare
1(s
trong
lydi
sagr
ee),
2(d
isag
ree)
,3(n
eith
erag
ree
ordi
sagr
ee),
4(a
gree
),5
(stro
ngly
agre
e).S
tate
men
tsfo
rthe
othe
rvar
iabl
esar
eas
follo
ws:
Des
ire
for
posi
tive
pro-
soci
alim
pact
incl
udes
"Iti
sim
porta
ntto
me
todo
good
foro
ther
sth
roug
hm
yw
ork,
""I
care
abou
tben
efiti
ngot
hers
thro
ugh
my
wor
k,"
"Iw
antt
ohe
lpot
hers
thro
ugh
my
wor
k,"
"Iw
antt
oha
vepo
sitiv
eim
pact
onot
hers
thro
ugh
my
wor
k,"
"Ige
tmot
ivat
edby
wor
king
onta
skst
hath
ave
the
pote
ntia
lto
bene
fitot
hers
,""I
like
tow
ork
onta
skst
hath
ave
the
pote
ntia
lto
bene
fitot
hers
,""I
pref
erto
wor
kon
task
stha
tallo
wm
eto
have
apo
sitiv
eim
pact
onot
hers
,""I
dom
ybe
stw
hen
I'mw
orki
ngon
ata
skth
atco
ntrib
utes
toth
ew
ell-b
eing
ofot
hers
,""I
tis
impo
rtant
tom
eto
have
the
oppo
rtuni
tyto
use
my
abili
ties
tobe
nefit
othe
rs,"
"Iti
sim
porta
ntto
me
tom
ake
apo
sitiv
edi
ffer
ence
inpe
ople
'sliv
esth
roug
hm
yw
ork,
""A
twor
k,Ic
are
abou
tim
prov
ing
the
lives
ofot
herp
eopl
e"an
d"O
neof
my
obje
ctiv
esat
wor
kis
tom
ake
apo
sitiv
edi
ffer
ence
inot
herp
eopl
e’sl
ives
."Se
esse
lfas
pro-
soci
al:
"Ise
em
ysel
fas
carin
g,"
"Ise
em
ysel
fas
gene
rous
,"an
d"I
regu
larly
goou
tofm
yw
ayto
help
othe
rs."
Affe
ctiv
eco
mm
itmen
tto
bene
ficia
ries
incl
udes
"The
peop
lew
hobe
nefit
from
my
wor
kar
eve
ryim
porta
ntto
me"
and
"The
peop
lew
hobe
nefit
from
my
wor
km
atte
ragr
eatd
ealt
om
e."
Pres
sure
-bas
edpr
o-so
cial
mot
ivat
ion
incl
udes
“Ife
elth
atIh
ave
tope
rfor
mse
lfles
sact
stow
ards
othe
rs,"
“Ife
elI
mus
tsta
ndup
for
othe
rpe
ople
,”"I
rega
rdit
asm
ydu
tyto
acts
elfle
ssly
,"an
d“I
feel
ast
rong
duty
tohe
lpot
her
peop
lein
ever
ysi
tuat
ion
whe
reit
ispo
ssib
lefo
rm
e.”
Plea
sure
-bas
edpr
o-so
cial
mot
ivat
ion
incl
udes
"Sup
porti
ngot
herp
eopl
em
akes
me
very
happ
y,”
“Ido
have
agr
eatf
eelin
gof
happ
ines
sw
hen
Ihav
eac
ted
unse
lfish
ly,”
“Whe
nIw
asab
leto
help
othe
rpeo
ple,
Ialw
ays
felt
good
afte
rwar
ds,”
and
"Hel
ping
peo
ple
who
are
not
doi
ng w
ell r
aise
s my
own
moo
d."
Part
I: A
pplic
ants
(N=1
585)
Part
II:
Sel
ecte
d T
rain
ees
(N=3
14)
-0.4
99.3
82(0
.601
)(.4
52)
63

Tabl
eII
I.B:T
reat
men
te�
ects
ontr
aits
ofap
plic
ants
and
trai
nees
:ca
reer
pref
eren
ces
recr
uitm
ent p
oste
r m
akes
sal
ient
care
erso
cial
p-va
lues
(s
ee n
otes
)ca
reer
soci
alp-
valu
es (s
ee
note
s)(1
)(2
)(3
)(1
)(2
)(3
)Pa
nel B
: App
lican
ts' c
aree
r m
otiv
atio
n
Aim
s to
be a
hig
her-
rank
hea
lth p
rofe
ssio
nal i
n 5-
10 y
ears
0.24
6.1
87.0
26 (.
029)
.254
.189
.160
(.12
0)(.4
31)
(.391
)(.0
34)
(.032
)Ps
ycho
met
ric sc
ale:
Car
eer o
rient
atio
n [1
-5]
3.31
3.07
.018
(.03
3)(1
.047
)(.9
29)
Aver
age
stan
dard
ized
trea
tmen
t effe
ct
Pane
l C: A
pplic
ants
' rel
ativ
e ca
reer
vs
soci
al m
otiv
atio
n
Rel
ativ
e w
eigh
t giv
en to
"ca
reer
pro
spec
t" w
hen
appl
ying
.165
.120
.002
(.00
7)(.1
57)
(.112
)R
elat
ive
wei
ght g
iven
to "
serv
ice
to c
omm
unity
" w
hen
appl
ying
.396
.432
.050
(.06
1)(.2
26)
(.239
)R
elat
ive
wei
ght g
iven
to "
resp
ect f
rom
com
mun
ity"
whe
n ap
plyi
ng.0
37.0
57.0
48 (.
051)
(.094
)(.1
09)
Mai
n go
al is
"se
rvic
e to
com
mun
ity"
vs "
care
er a
dvan
cem
ent"
.863
.941
.020
(.02
2)(.3
45)
(.237
)
1.66
**(.6
97)
Not
es:C
olum
ns1
and
2sh
owm
eans
and
stan
dard
devi
atio
nsin
pare
nthe
ses.
Col
umn
3re
ports
the
p-va
lues
ofth
enu
llhy
poth
esis
that
the
care
ertre
atm
ente
ffec
tequ
aim
sto
bea
high
er-r
ank
heal
thpr
ofes
sion
alin
5-10
year
s:eq
uals
1if
the
appl
ican
tch
oose
san
yco
mbi
natio
nof
bein
gan
"env
ironm
enta
lhe
alth
tech
nici
an,"
"clin
ical
offic
er,"
or"d
octo
r"in
resp
onse
toth
equ
estio
n,"W
hen
you
envi
sion
your
self
in5-
10ye
ars'
time,
wha
tdo
you
envi
sion
your
self
doin
g?"
Car
eer
orie
ntat
ion
:fr
omW
rzen
snie
wsk
ieta
l.'s
(199
7)C
aree
r-C
allin
gO
rient
atio
nsc
ale,
whi
chco
nsis
tsof
thre
eite
ms:
"Iex
pect
tobe
ina
high
er-le
velj
obin
five
year
s,""I
view
my
job
asa
step
ping
ston
eto
othe
rjob
s,"an
d"I
expe
ctto
bedo
ing
the
sam
ew
ork
asa
CH
Ain
five
year
s,"ea
chsc
ored
ona
five-
poin
tsca
lefr
om"s
trong
lydi
sagr
ee"
to"s
trong
lyag
ree.
"Re
lativ
eW
eigh
tva
riabl
es:C
HA
sw
ere
aske
dto
allo
cate
50be
ans
betw
een
pote
ntia
lmot
ivat
ions
for
appl
ying
toth
eC
HA
posi
tion:
"goo
dfu
ture
care
er,"
"allo
wsm
eto
serv
eth
eco
mm
unity
,""e
arns
resp
ecta
ndhi
ghst
atus
inth
eco
mm
unity
,""p
aysw
ell,"
"int
eres
ting
job,
""a
llow
sme
toac
quire
usef
ulsk
ills,"
and
"off
ers
stab
lein
com
e."
Mai
nG
oal:
equa
ls1
ifap
plic
antc
hoos
es"s
ervi
ceto
com
mun
ity"
inst
ead
of"c
aree
radv
ance
men
t"in
answ
erto
the
ques
tion
"In
term
sof
your
new
CH
A p
ositi
on, w
hich
is m
ore
impo
rtant
to y
ou?"
Part
I: A
pplic
ants
(N=1
585)
Part
II:
Sel
ecte
d T
rain
ees
(N=3
14)
64
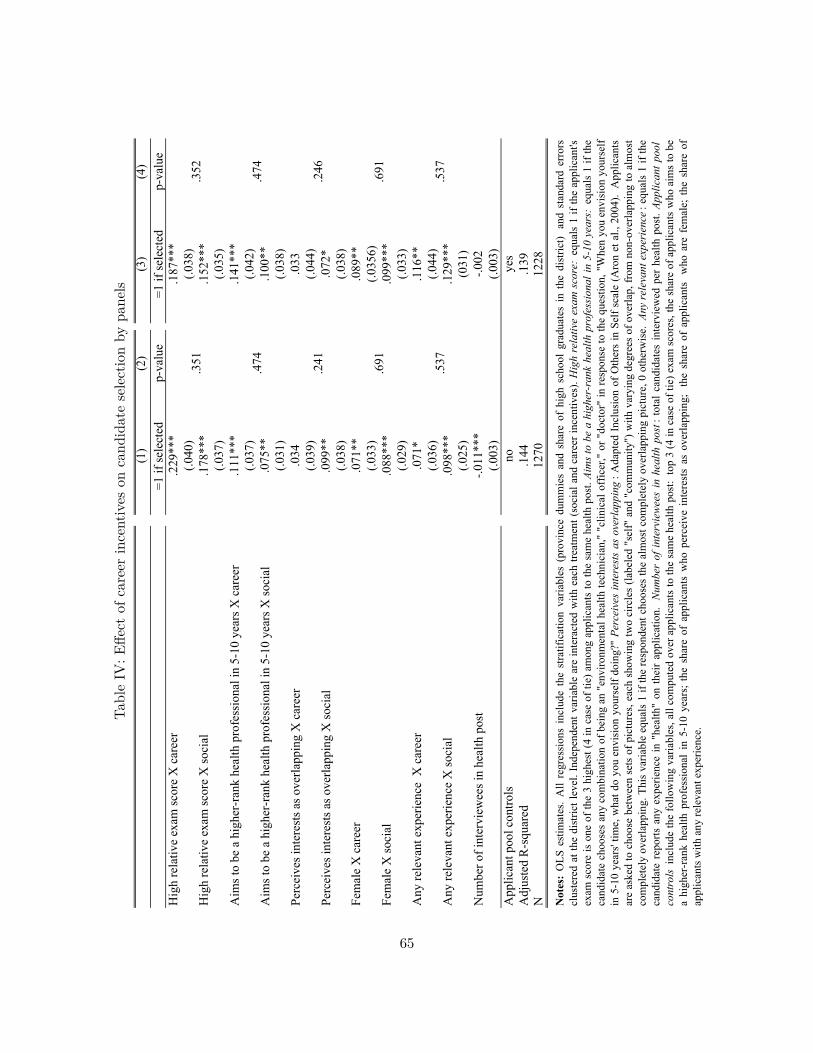
Tabl
eIV
:E�e
ctof
care
erin
cent
ives
onca
ndid
ate
sele
ctio
nby
pane
ls(1
)(2
)(3
)(4
)=1
if se
lect
ed
p-va
lue
=1 if
sele
cted
p-va
lue
Hig
h re
lativ
e ex
am sc
ore
X c
aree
r.2
29**
*.1
87**
*(.0
40)
(.038
)H
igh
rela
tive
exam
scor
e X
soci
al.1
78**
*.1
52**
*(.0
37)
(.035
)A
ims t
o be
a h
ighe
r-ra
nk h
ealth
pro
fess
iona
l in
5-10
yea
rs X
car
eer
.111
***
.141
***
(.037
)(.0
42)
Aim
s to
be a
hig
her-
rank
hea
lth p
rofe
ssio
nal i
n 5-
10 y
ears
X so
cial
.075
**.1
00**
(.031
)(.0
38)
Perc
eive
s int
eres
ts a
s ove
rlapp
ing
X c
aree
r.0
34.0
33(.0
39)
(.044
)Pe
rcei
ves i
nter
ests
as o
verla
ppin
g X
soci
al.0
99**
.072
*(.0
38)
(.038
)Fe
mal
e X
car
eer
.071
**.0
89**
(.033
)(.0
356)
Fem
ale
X so
cial
.088
***
.099
***
(.029
)(.0
33)
Any
rele
vant
exp
erie
nce
X c
aree
r.0
71*
.116
**(.0
36)
(.044
)A
ny re
leva
nt e
xper
ienc
e X
soci
al.0
98**
*.1
29**
*(.0
25)
(031
)N
umbe
r of i
nter
view
ees i
n he
alth
pos
t-.0
11**
*-.0
02(.0
03)
(.003
)A
pplic
ant p
ool c
ontro
lsno
yes
Adj
uste
d R
-squ
ared
.144
.139
N12
7012
28
.691
.537
.474
Notes:
OLS
estim
ates
.A
llre
gres
sion
sin
clud
eth
est
ratif
icat
ion
varia
bles
(pro
vinc
edu
mm
ies
and
shar
eof
high
scho
olgr
adua
tes
inth
edi
stric
t)an
dst
anda
rder
rors
clus
tere
dat
the
dist
rictl
evel
.Ind
epen
dent
varia
ble
are
inte
ract
edw
ithea
chtre
atm
ent(
soci
alan
dca
reer
ince
ntiv
es).Highrelativeexamscore:
equa
ls1
ifth
eap
plic
ant's
exam
scor
eis
one
ofth
e3
high
est(
4in
case
oftie
)am
ong
appl
ican
tsto
the
sam
ehe
alth
post
.Aimstobeahigher-rankhealthprofessionalin5-10years:
equa
ls1
ifth
eca
ndid
ate
choo
ses
any
com
bina
tion
ofbe
ing
an"e
nviro
nmen
talh
ealth
tech
nici
an,"
"clin
ical
offic
er,"
or"d
octo
r"in
resp
onse
toth
equ
estio
n,"W
hen
you
envi
sion
your
self
in5-
10ye
ars'
time,
wha
tdo
you
envi
sion
your
self
doin
g?"Perceivesinterestsasoverlapping
:Ada
pted
Incl
usio
nof
Oth
ers
inSe
lfsc
ale
(Aro
net
al.,
2004
).A
pplic
ants
are
aske
dto
choo
sebe
twee
nse
tsof
pict
ures
,eac
hsh
owin
gtw
oci
rcle
s(la
bele
d"s
elf"
and
"com
mun
ity")
with
vary
ing
degr
ees
ofov
erla
p,fr
omno
n-ov
erla
ppin
gto
alm
ost
com
plet
ely
over
lapp
ing.
This
varia
ble
equa
ls1
ifth
ere
spon
dent
choo
ses
the
alm
ostc
ompl
etel
yov
erla
ppin
gpi
ctur
e,0
othe
rwis
e.Anyrelevantexperience
:equ
als
1if
the
cand
idat
ere
ports
any
expe
rienc
ein
"hea
lth"
onth
eir
appl
icat
ion.Numberofintervieweesinhealthpost
:tot
alca
ndid
ates
inte
rvie
wed
per
heal
thpo
st.Applicantpool
controls
incl
ude
the
follo
win
gva
riabl
es,a
llco
mpu
ted
over
appl
ican
tsto
the
sam
ehe
alth
post
:to
p3
(4in
case
oftie
)exa
msc
ores
,the
shar
eof
appl
ican
tsw
hoai
ms
tobe
ahi
gher
-ran
khe
alth
prof
essi
onal
in5-
10ye
ars;
the
shar
eof
appl
ican
tsw
hope
rcei
vein
tere
sts
asov
erla
ppin
g;th
esh
are
ofap
plic
ants
who
are
fem
ale;
the
shar
eof
appl
ican
ts w
ith a
ny re
leva
nt e
xper
ienc
e.
.246
.351
.691
.537
.474
.241
.352
65

Tabl
eV
:E�e
ctof
care
erin
cent
ives
onfie
ldpe
rform
ance
and
rete
ntio
n
Tota
l bet
wee
n A
ugus
t 201
2-Ja
nuar
y 20
14
(1)
(2)
(3)
(4)
(5)
(6)
(7)
(8)
(9)
(10)
Car
eer i
ncen
tives
93.9
73**
89.5
75**
188.
733*
*18
3.55
4*22
.375
***
22.7
76**
*43
8.55
943
1.79
60.
008
0.02
3(3
6.16
2)(3
5.80
8)(9
1.54
4)(9
4.86
5)(5
.638
)(5
.665
)(2
70.7
84)
(273
.913
)(0
.050
)(0
.046
)C
HA
cha
ract
eris
tics
noye
sno
nono
nono
nono
noA
rea
char
acte
ristic
sno
yes
noye
sno
yes
noye
sno
yes
Mea
n of
dep
ende
nt v
aria
ble
in so
cial
trea
tmen
t
Adj
uste
d R
-squ
ared
0.10
10.
144
0.08
20.
058
0.08
00.
086
0.00
30.
017
0.04
10.
057
N30
730
4 12
812
712
912
812
912
830
730
4
Ret
entio
n (=
1 if
CH
A is
act
ive
afte
r 1 y
ear)
0.8
Notes:
OLS
Estim
ates
.All
regr
essi
ons
incl
ude
the
stra
tific
atio
nva
riabl
es(p
rovi
nce
dum
mie
san
dsh
are
ofhi
ghsc
hool
grad
uate
sin
the
dist
rict)
and
stan
dard
erro
rscl
uste
red
atth
edi
stric
tlev
el.D
epen
dent
varia
bles
are:
(i)to
taln
umbe
rof
hous
ehol
dvi
site
d,ag
greg
ated
from
indi
vidu
alSM
Sre
ceip
tsse
ntby
indi
vidu
alC
HA
sto
MO
H(c
ols
1an
d2)
;(ii)
tota
lnu
mbe
rofh
ouse
hold
svi
site
d,fr
omH
MIS
data
atth
ehe
alth
post
leve
l(co
ls3
and
4);(
iii)n
umbe
rofp
atie
nts
seen
atth
ehe
alth
post
,fro
mH
MIS
data
atth
ehe
alth
post
leve
l(co
ls5
and
6);(
iv)n
umbe
rofc
omm
unity
mob
iliza
tion
mee
tings
,fro
mH
MIS
data
atth
ehe
alth
post
leve
l(co
ls7
and
8);a
nd(v
)whe
ther
the
CH
Avi
site
dat
leas
tone
hous
ehol
daf
tert
hein
itial
12m
onth
s,fr
omSM
Sre
ceip
tsse
ntby
indi
vidu
alC
HA
sto
MO
H(c
ols
9an
d10
).Th
eH
ealth
Man
agem
enta
ndIn
form
atio
nSy
stem
(HM
IS)
isth
eZa
mbi
anM
inis
tryof
Hea
lth's
syst
emfo
rre
porti
ng,c
olle
ctin
g,an
dag
greg
atin
gro
utin
ehe
alth
serv
ices
data
atgo
vern
men
tfac
ilitie
s.C
HA
sar
ere
quire
dto
subm
itm
onth
lyre
ports
that
sum
mar
ize
thei
rac
tiviti
esat
the
heal
thpo
st/c
omm
unity
leve
l.Ea
chre
porte
dva
riabl
eis
the
sum
ofea
chin
dica
tor's
mon
thly
valu
esfr
omA
ugus
t201
2to
Janu
ary
2014
.CH
Ach
arac
teris
tics
incl
ude:
gend
er,O
-leve
ltot
alsc
ore,
aver
age
train
ing
exam
ssc
ore
and
whe
ther
the
CH
Aha
dpr
evio
usex
perie
nce
inth
ehe
alth
sect
or.A
rea
char
acte
ristic
sin
clud
e:nu
mbe
rof
staf
fin
the
heal
thpo
st,g
eogr
aphi
cal
dist
ribut
ion
ofho
useh
olds
inth
eca
tchm
enta
rea,
perc
enta
geof
HH
usin
gin
sect
icid
e-tre
ated
mos
quito
nets
,and
perc
enta
geof
HH
usin
gth
eir
own
pit
latri
ne.C
olum
ns1,
2,9,
and
10al
soin
clud
ean
indi
cato
rvar
iabl
eth
ateq
uals
1if
the
CH
Are
ports
toha
vego
odce
llne
twor
kco
vera
gem
osto
fthe
time
oral
lthe
time.
The
num
ber
ofob
serv
atio
nsdr
ops
whe
nco
ntro
lsar
ein
clud
edbe
caus
eO
leve
lsco
reis
mis
sing
foro
neob
serv
atio
nan
dpe
rcen
tage
ofH
Hus
ing
inse
ctic
ide-
treat
edm
osqu
itone
tsis
mis
sing
for
two
obse
rvat
ions
.
Patie
nts s
een
at h
ealth
po
st (
HM
IS d
ata,
H
ealth
pos
t lev
el)
829.
7
Com
mun
ity
mob
iliza
tion
mee
tings
(H
MIS
dat
a, H
ealth
pos
t le
vel)
318.
651
8.1
17.1
Hou
seho
ld v
isits
(R
ecei
pt d
ata,
Hea
lth
wor
ker l
evel
)
Hou
seho
ld v
isits
(H
MIS
dat
a, H
ealth
po
st le
vel)
66

Tabl
eV
I:E�
ect
ofca
reer
ince
ntiv
eson
perfo
rman
ce:
Mec
hani
sms
I
Hou
seho
ld
visi
ts,
mon
ths 1
-6
Hou
seho
ld
visi
ts,
mon
ths 7
-12
Hou
seho
ld
visi
ts,
mon
ths 1
3-18
Uni
que
hous
ehol
d vi
site
d
Num
ber o
f vi
sits
per
ho
useh
old
Ave
rage
vis
it du
ratio
n, in
m
inut
es
Num
ber o
f w
omen
and
ch
ildre
n vi
site
d pe
r hou
seho
ld
visi
t
Num
ber o
f ho
urs w
orke
d in
a ty
pica
l w
eek
Freq
uenc
y of
ou
t of h
ours
ca
lls in
a
typi
cal w
eek
sour
ceSM
SSM
SSM
SSM
SSM
SSM
SH
MIS
Tim
e us
e su
rvey
Tim
e us
e su
rvey
(1)
(2)
(3)
(4)
(5)
(6)
(7)
(8)
(9)
Car
eer i
ncen
tives
31.6
14*
28.6
40**
29.3
21**
28.9
19*
0.51
5**
-0.2
01-0
.056
-0.9
080.
051
(15.
820)
(13.
291)
(12.
587)
(15.
420)
(0.2
21)
(1.9
01)
(0.1
00)
(1.0
83)
(0.0
60)
CH
A c
ontro
lsye
sye
sye
sye
sye
sye
sno
yes
yes
Are
a co
ntro
lsye
sye
sye
sye
sye
sye
sye
sye
sye
sM
ean
of d
epen
dent
var
iabl
e in
so
cial
trea
tmen
t16
792
6017
61.
5934
.75
2.21
42.8
10.
457
Adj
uste
d R
-squ
ared
0.13
60.
077
0.14
50.
136
0.09
5-0
.008
0.03
70.
038
0.00
1N
304
304
304
304
304
301
125
296
296
Notes:
OLS
Estim
ates
.All
regr
essi
ons
incl
ude
the
stra
tific
atio
nva
riabl
es(p
rovi
nce
dum
mie
san
dsh
are
ofhi
ghsc
hool
grad
uate
sin
the
dist
rict)
and
stan
dard
erro
rscl
uste
red
atth
edi
stric
tle
vel.
Dep
ende
ntva
riabl
esar
e:(i)
tota
lnum
bero
fhou
seho
ldvi
site
dfo
reac
hse
mes
ter,
aggr
egat
edfr
omin
divi
dual
SMS
rece
ipts
sent
byin
divi
dual
CH
Ast
oM
OH
(col
s1-
3);(
ii)to
taln
umbe
rof
uniq
ueho
useh
olds
visi
ted,
aggr
egat
edfr
omin
divi
dual
SMS
rece
ipts
sent
byin
divi
dual
CH
As
toM
OH
(col
4);(
iii)
aver
age
num
ber
ofvi
sits
per
hous
ehol
d,ag
greg
ated
from
indi
vidu
alSM
Sre
ceip
tsse
ntby
indi
vidu
alC
HA
sto
MO
H(c
ol5)
;(iv
)ave
rage
visi
tdur
atio
n,ag
greg
ated
from
indi
vidu
alSM
Sre
ceip
tsse
ntby
indi
vidu
alC
HA
sto
MO
H(c
ol6)
;(v)
tota
lnum
bero
fw
omen
and
child
ren
visi
ted
over
tota
lho
useh
old
visi
ts,f
rom
HM
ISda
taat
the
heal
thpo
stle
vel(
col
7);
(vi)
num
ber
ofho
urs
wor
ked,
from
CH
Atim
eus
esu
rvey
(col
8);a
nd(v
ii)an
indi
cato
r var
iabl
e=1
if th
e C
HA
take
s at l
east
one
em
erge
ncy
call
per w
eek
in th
e ty
pica
l wee
k, fr
om C
HA
tim
e us
e su
rvey
(col
9).
The
Hea
lth M
anag
emen
t and
Info
rmat
ion
Syst
em (H
MIS
) is
the
Zam
bian
Min
istry
ofH
ealth
'ssy
stem
for
repo
rting
,col
lect
ing,
and
aggr
egat
ing
rout
ine
heal
thse
rvic
esda
taat
gove
rnm
entf
acili
ties.
CH
As
are
requ
ired
tosu
bmit
mon
thly
repo
rtsth
atsu
mm
ariz
eth
eira
ctiv
ities
atth
ehe
alth
post
/com
mun
ityle
vel.
CH
Asw
ere
aske
dho
wm
any
tota
lhou
rsth
eysp
end
doin
gC
HA
wor
kin
aty
pica
lwee
k,an
den
cour
aged
toco
untw
ork
that
they
did
atth
ehe
alth
post
and
inth
evi
llage
,inc
ludi
ngm
ovin
gfr
omho
useh
old
toho
useh
old.
All
tota
lsbe
twee
nSe
ptem
ber
1,20
12an
dJa
nuar
y31
,201
4.C
HA
char
acte
ristic
sin
clud
e:ag
e,ge
nder
,O-le
velt
otal
scor
e,av
erag
etra
inin
gex
ams
scor
ean
dw
heth
erth
eC
HA
had
prev
ious
expe
rienc
ein
the
heal
thse
ctor
.Are
ach
arac
teris
tics
incl
ude:
num
bero
fsta
ffin
the
heal
thpo
st,
geog
raph
ical
dis
tribu
tion
of h
ouse
hold
s in
the
catc
hmen
t are
a, p
erce
ntag
e of
HH
usi
ng in
sect
icid
e-tre
ated
mos
quito
net
s, an
d pe
rcen
tage
of H
H u
sing
thei
r ow
n pi
t lat
rine.
Col
umns
1 to
6 a
lso
incl
ude
an in
dica
tor v
aria
ble
that
equ
als 1
if th
e C
HA
repo
rts to
hav
e go
od c
ell n
etw
ork
cove
rage
mos
t of t
he ti
me
or a
ll th
e tim
e.
67

Tabl
eV
II:E
�ect
ofca
reer
ince
ntiv
eson
perfo
rman
ce:
Mec
hani
sms
IIPa
nel A
: Tim
e al
loca
tion
duri
ng h
ouse
hold
vis
its
shar
e of
tim
e al
loca
ted
to:
(1)
(2)
(3)
(4)
(5)
(6)
(7)
(8)
(9)
(10)
(11)
(12)
Car
eer i
ncen
tives
0.00
70.
004
0.00
7.0
12-0
.016
*-.0
20*
-0.0
12-.0
11-.0
03-.0
02.0
090.
010
(0.0
11)
(0.0
12)
(0.0
15)
(.014
)(0
.009
)(.0
11)
(.008
)(.0
09)
(.012
)(.0
12)
(.009
)(.0
10)
Mea
n of
dep
ende
nt v
aria
ble
in so
cial
trea
tmen
tC
HA
s and
are
a co
ntro
lsno
yes
noye
sno
yes
noye
sno
yes
noye
sR
-squ
ared
.002
.031
.005
.027
.013
.025
.005
.038
.007
.027
.007
.024
N29
228
929
228
929
228
929
228
929
228
929
228
9
Pane
l B: T
ime
allo
catio
n du
ring
wor
k at
the
heal
th p
ost
shar
e of
tim
e al
loca
ted
to:
(1)
(2)
(3)
(4)
(5)
(6)
(7)
(8)
(9)
(10)
Car
eer i
ncen
tives
-0.0
03-0
.001
-0.0
52**
*-0.
052*
**0.
006
0.00
60.
022
0.01
40.
017
0.02
3*(0
.012
)(0
.012
)(0
.018
)(0
.019
)(0
.013
)(0
.013
)(0
.20)
(0.0
21)
(0.1
3)(0
.012
)M
ean
of d
epen
dent
var
iabl
e in
soci
al tr
eatm
ent
CH
As a
nd a
rea
cont
rols
noye
sno
yes
noye
sno
yes
noye
sR
-squ
ared
.000
0.03
7.0
44.1
16.0
00.0
47.0
15.1
13.0
13.1
38N
271
268
271
268
271
268
271
268
271
268
Notes:S
yste
mes
timat
es(S
UR
E),b
oots
trapp
edst
anda
rder
rors
clus
tere
dat
the
dist
rictl
evel
inpa
rent
hesi
s.A
llre
gres
sion
sin
clud
eth
est
ratif
icat
ion
varia
bles
(pro
vinc
edu
mm
iesa
ndsh
are
ofhi
ghsc
hool
grad
uate
sin
the
dist
rict).
All
298
parti
cipa
nts
inth
ere
fres
her
train
ing
prog
ram
wer
egi
ven
50be
ans
and
aske
dto
allo
cate
the
bean
sto
show
how
muc
htim
eth
eysp
ent
doin
gea
chac
tivity
with
inea
chta
sk.
They
wer
ein
stru
cted
topl
ace
mor
ebe
ans
ona
card
ifth
eysp
entm
ore
time
onan
activ
ity,t
opl
ace
nobe
ansi
fthe
yne
verd
oan
activ
ity,a
ndto
plac
eth
ebe
ans
any
way
they
wou
ldlik
e,in
clud
ing
plac
ing
allb
eans
onon
eca
rd,o
r0
bean
son
any
card
.Pan
elA
activ
ities
are:
gree
ting
hous
ehol
dm
embe
rs,a
sses
sing
and
refe
rrin
gsi
ckho
useh
old
mem
bers
,re
view
ing
and
disc
ussi
ngth
eho
useh
old’
she
alth
prof
ilean
dgo
als,
aski
ngqu
estio
nsab
out
heal
thbe
havi
ors
and
know
ledg
e,pr
ovid
ing
heal
thed
ucat
ion
and
coun
selin
g,do
ing
hous
ehol
din
spec
tions
(was
tedi
spos
al,
latri
nes,
etc.
),an
ddo
cum
enta
tion
(fill
ing
regi
ster
s/bo
oks
and
send
ing
SMS
visi
ts).
The
omitt
edca
tego
ryin
Pane
lA
is"g
reet
ings
."Th
esa
mpl
ein
Pane
lAco
vers
the
292
outo
f29
8C
HA
sw
hore
porte
dsp
endi
ngtim
edo
ing
visi
ts.P
anel
Bac
tiviti
esar
e:se
eing
sick
patie
nts
inth
ehe
alth
post
,dis
pens
ing
med
icat
ions
from
the
phar
mac
y,he
lpin
gw
ithA
NC
visi
ts,c
lean
ing
and
mai
ntai
ning
the
faci
lity,
assi
stin
gw
ithde
liver
ies
and
othe
rpr
oced
ures
whe
nne
eded
,and
docu
men
tatio
n(f
illin
gre
gist
ers/
book
san
dse
ndin
gm
onth
lyre
ports
thro
ugh
DH
IS2)
.The
omitt
edca
tego
ryin
Pane
lBis
"ass
istin
gw
ithde
liver
ies."
The
sam
ple
inPa
nelA
cove
rsth
e27
1ou
tof2
98C
HA
swho
repo
rted
spen
ding
time
atth
ehe
alth
post
.CH
Aco
ntro
lsin
clud
e:ag
e,ge
nder
,O-le
velt
otal
scor
e,av
erag
etra
inin
gex
amss
core
and
whe
ther
the
CH
Aha
dpr
evio
usex
perie
nce
inth
ehe
alth
sect
or.A
rea
cont
rols
incl
ude:
num
bero
fsta
ffin
the
heal
thpo
st,g
eogr
aphi
cald
istri
butio
nof
hous
ehol
dsin
the
catc
hmen
tare
a,pe
rcen
tage
ofH
Hus
ing
inse
ctic
ide-
treat
edm
osqu
itone
ts,
and
perc
enta
geof
HH
usin
gth
eiro
wn
pitl
atrin
e.Th
enu
mbe
rofo
bser
vatio
nsdr
ops
whe
nco
ntro
lsar
ein
clud
edbe
caus
eO
-leve
lsco
reis
mis
sing
foro
neob
serv
atio
nan
dpe
rcen
tage
ofH
H u
sing
inse
ctic
ide-
treat
ed m
osqu
ito n
ets i
s mis
sing
for t
wo
obse
rvat
ions
.
coun
selin
g
0.20
7
insp
ectio
ns
0.19
6
fillin
g in
rece
ipts
an
d fo
rms
aski
ng q
uest
ions
ab
out h
ealth
be
havi
ors a
nd
know
ledg
e
disc
ussi
ng h
ealth
pr
ofile
and
goa
ls
seei
ng si
ck
patie
nts
fillin
g in
form
sdi
spen
sing
m
edic
atio
nshe
lpin
g w
ith a
nte
nata
l car
e vi
sits
clea
ning
and
m
aint
aini
ng th
e he
alth
pos
t
0.26
20.
228
0.20
70.
160
0.10
4
visi
ting
sick
ho
useh
old
mem
bers
0.14
60.
137
0.12
20.
100
68