Do Colleges and Universities Have a Role in Local/media/publications/profitwise-news... · Higher...
20
Do Colleges and Universities Have a Role in Local and Regional Economic Development? In this Issue Do Colleges and Universities Have a Role in Local and Regional Economic Development? page 1 Determinants of Federal and State Community Development Spending: 1981-2004 page 5 Around the District page 14 Calendar of Events page 16 Published by the Consumer and Community Affairs Division October 2007
Transcript of Do Colleges and Universities Have a Role in Local/media/publications/profitwise-news... · Higher...

Do Colleges and Universities Have a Role in Local and Regional Economic Development?In this Issue
Do Colleges and Universities Have a Role in Local and Regional Economic Development? page 1
Determinants of Federal and State Community Development Spending: 1981-2004 page 5
Around the District page 14
Calendar of Events page 16
Published by the Consumer and Community Affairs Division October 2007
Profitwise News and Views welcomes article proposals and comments from bankers, community organizations, and other readers. It is mailed (either electronically or via U.S. mail) at no charge to state member banks, financial holding companies, bank holding companies, government agencies, nonprofit organizations, academics, and community economic development professionals.
You may submit comments, proposals, or request a subscription by writing to:
Profitwise News and ViewsConsumer and Community Affairs Division
Federal Reserve Bank of Chicago230 South LaSalle StreetChicago, IL 60604-1413or [email protected]
The material in Profitwise News and Views is not necessarily endorsed by and does not necessarily represent views of the Board of Governors of the Federal Reserve System or the Federal Reserve Bank of Chicago.
© 2007 Federal Reserve Bank of Chicago Profitwise News and Views articles may be reproduced in whole or in part, provided the articles are not reproduced or distributed for commercial gain and provided the source is appropriately credited. Prior written permission must be obtained for any other reproduction, distribution, republication, or creation of derivative works of Profitwise News and Views articles. To request permission, please e-mail or write to the address indicated above.
Advisor Alicia Williams
Managing Editor Michael V. Berry
Assistant Editor/Production Manager Mary Jo Cannistra
Contributing Editor Jeremiah Boyle
Compliance Editor Steven W. Kuehl
Economic Research Editor Robin Newberger
Economic Development Editor Harry Pestine
Graphic Designer Katherine Ricca
Visit the Web site of the Federal Reserve Bank of Chicago at: www.chicagofed.org
CORRECTIONS
Corrections to Profitwise News and Views Special Edition, August 2007
The following sentence appears on page 9:
Therefore, ACCION-NM became adept at using the network of offices of banking institutions around the state (Wells Fargo, First State Bank, a First Community Bank subsidiary, and more recently First National Bank of Santa Fe) to identify borrowers, often would-be bank customers, who do meet bank underwriting criteria.
Clients of ACCION New Mexico often do not meet typical bank underwriting criteria for small business loans. The corrected sentence follows:
Therefore, ACCION-NM became adept at using the network of offices of banking institutions around the state (Wells Fargo, First State Bank, a First Community Bank subsidiary, and more recently First National Bank of Santa Fe) to identify borrowers, often would-be bank customers, who do notmeet bank underwriting criteria.
On page 17, our list of interviews includes:
Saurabh Narain, National Community Investment Fund, February 13, 2007
The correct information follows:
Saurabh Narain, National Community Investment Fund, September 8, 2006
The following were omitted from the list of interviews:
Mark Pinsky, Opportunity Finance Network, June 27, 2006.Lisa Richter, GPS Capital Partners, March 21, 2007.
�Profitwise News and Views October 2007
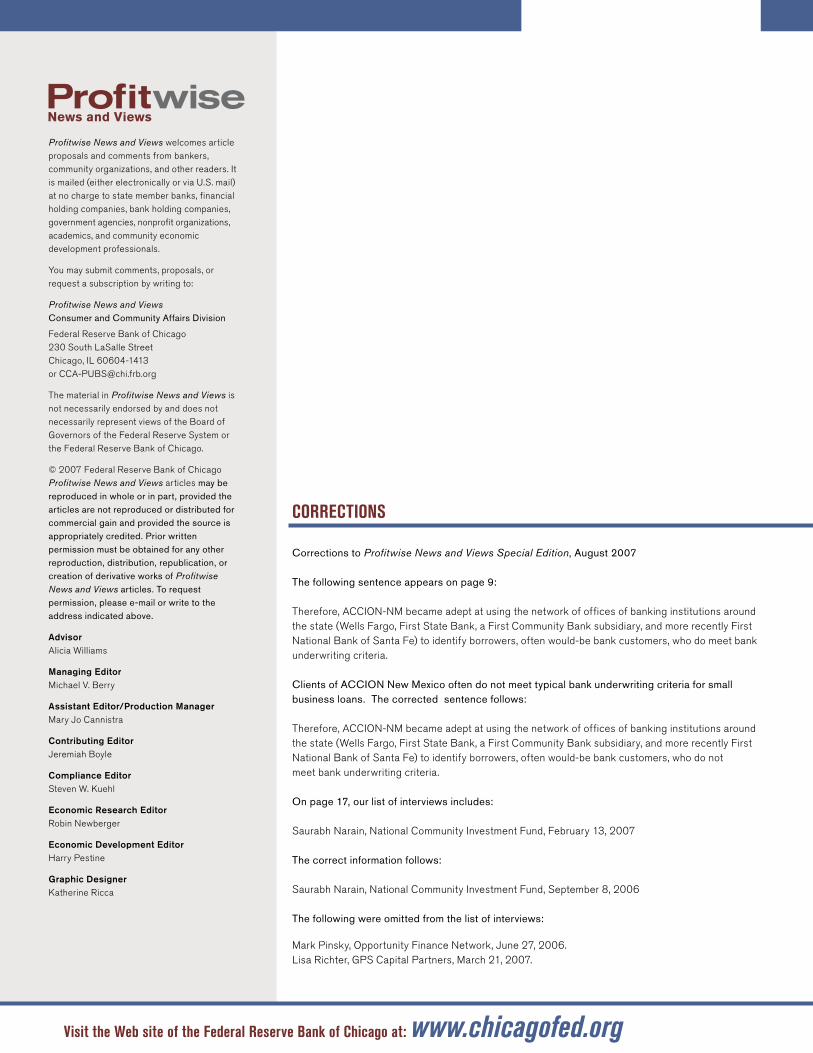
by Rick Mattoon
Do Colleges and Universities Have a Role in Local and Regional Economic Development?
Introduction
It has become almost hackneyed to suggest that we now live in a knowledge-based economy. Firms prosper and die based on their ability to add intellectual value to their products and services. Even in mature industries, such as manufacturing, the application of knowledge to enhance production techniques and increase productivity has been fundamental to competitive success. With the pace of economic change accelerating, economic development strategies that emphasize having the best human capital available to adapt to change continue to gain favor. Noted economist Edward Glaesser has demonstrated that communities with the highest educational attainment continue to adapt and prosper across differing economic eras. Glaesser’s study of the Boston economy found that it was largely due to the significant human capital in the city that Boston has been able to re-invent itself to succeed in differing economic conditions.�
If knowledge and human capital are fundamental building blocks of successful communities and regions, one might ask a basic question about how communities build human capital. An obvious starting
point is local colleges and universities. Clearly, colleges and universities are in the knowledge business, both the creation of knowledge through research, and the dissemination of knowledge through teaching. In addition, most higher education institutions embrace community service as a third critical function, and this increasingly is observed as community outreach, often with a specific economic development focus.
This article will discuss differing models for colleges and universities for supporting economic development in their community and region.
Economic Development

Profitwise News and Views October 2007�
A Structure for Thinking about Higher Education and Its Role in Economic Growth
An ongoing project at the Massachusetts Institute of Technology (MIT),2 under the direction of Richard Lester, has developed a useful, four-part structure for describing the types of economic transformation a community might experience, and the role that higher education can play in aiding that transformation:
Indigenous creation – the case of a new industry emerging that has no antecedent in the region. This is often directly related to a spin-off of a technology from a university. While this sort of development can receive a great deal of attention, it is relatively rare. To many, this is a “big-bang” economic development strategy where a university helps create a Silicon Valley or research “corridor.”
Transplantation – an industry is new to a region, but it primarily develops through the transplanting of an existing industry. The development of the auto industry in southern states is a recent example. The region did not have auto production as part of its industrial heritage, and obviously the industry was not a new creation spun off from universities. Rather, the structure and knowledge of the industry was transplanted, particularly by foreign nameplate automakers.
Diversification into related industries – an existing industry goes into decline, but a related industry emerges that can take advantage of the mature industry’s core technology. An example is the emergence of the polymer engineering and manufacturing industry in Akron, Ohio. As the tire industry flagged, a new industry emerged capitalizing on the value of polymers in synthetic rubber tire production.
Upgrading an existing industry – the application of new production technology that can also lead to the development of new products or services. The MIT study described the revitalization of the industrial machinery business in Tampere, Finland, as an example of integration of electronics, control, and communications technologies into a traditional product that benefited the forestry, paper, and transportation industry.
Each of these types of economic transformations involves different roles for higher education institutions. As Lester suggests, for an institution of higher education to be effective in economic development, it must be highly attuned to its local economy and understand the local economic development strategy. For example, in the first case of “indigenous creation,” a research university with an active commercialization office is essential. The new industry is likely to be the product of a scientific or technological
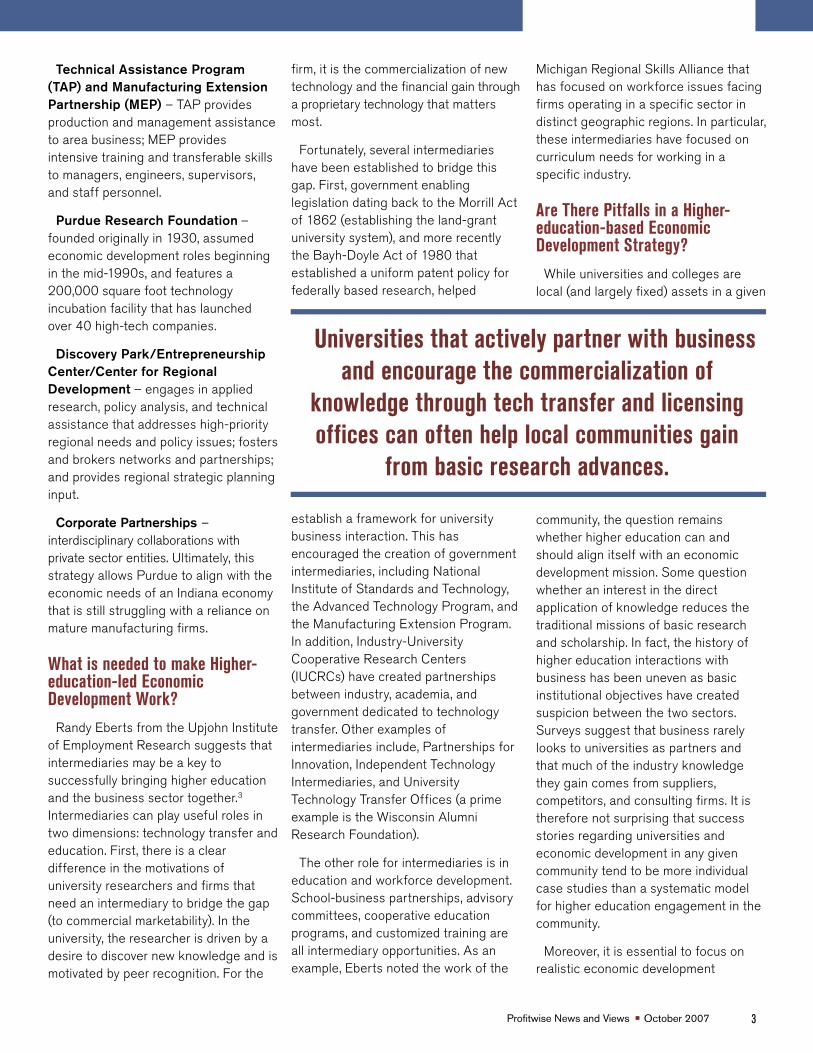
breakthrough at the university. A potential problem is that, since knowledge is easily transmitted, a local community can only benefit from the new technology if it can be commercialized locally. Universities that actively partner with business and encourage the commercialization of knowledge through tech transfer and licensing offices can often help local communities gain from basic research advances.
In the case of transplantation of an industry, providing worker training and developing specialized research
facilities often represent the primary opportunity for colleges and universities. When the auto industry began to have a significant presence in South Carolina, the state’s higher education establishment supported the industry’s growth through several programs. At the university level, Clemson added curriculum support in engineering fields related to automotive manufacture, and helped to create an advanced research facility for German automaker, BMW. The state’s community colleges began providing essential training for auto workers.
Perhaps the most ambitious midwestern effort in university-supported economic development is at Purdue University in Indiana. According to Vice Provost for Engagement, Victor Lechtenberg, Purdue is responding to the economic development needs of Indiana by: 1) aligning itself institutionally to be more responsive in teaching, discovery, and engagement; 2) identifying Indiana-specific targets of development
opportunity; and 3) emphasizing external outreach. This has led to the establishment of university goals in the areas of economic development, K-12 education, service learning (where Purdue students are expected to give back to the community), continuing education, and life-long learning.
To implement its economic development strategy, Purdue created a set of internal institutions with four components:
Noted economist Edward Glaesser has demonstrated that communities wih the highest educational
attainment continue to adapt and prosper across differing economic eras.
�Profitwise News and Views October 2007
Technical Assistance Program (TAP) and Manufacturing Extension Partnership (MEP) – TAP provides production and management assistance to area business; MEP provides intensive training and transferable skills to managers, engineers, supervisors, and staff personnel.
Purdue Research Foundation – founded originally in 1930, assumed economic development roles beginning in the mid-1990s, and features a 200,000 square foot technology incubation facility that has launched over 40 high-tech companies.
Discovery Park/Entrepreneurship Center/Center for Regional Development – engages in applied research, policy analysis, and technical assistance that addresses high-priority regional needs and policy issues; fosters and brokers networks and partnerships; and provides regional strategic planning input.
Corporate Partnerships – interdisciplinary collaborations with private sector entities. Ultimately, this strategy allows Purdue to align with the economic needs of an Indiana economy that is still struggling with a reliance on mature manufacturing firms.
What is needed to make Higher-education-led Economic Development Work?
Randy Eberts from the Upjohn Institute of Employment Research suggests that intermediaries may be a key to successfully bringing higher education and the business sector together.3 Intermediaries can play useful roles in two dimensions: technology transfer and education. First, there is a clear difference in the motivations of university researchers and firms that need an intermediary to bridge the gap (to commercial marketability). In the university, the researcher is driven by a desire to discover new knowledge and is motivated by peer recognition. For the
firm, it is the commercialization of new technology and the financial gain through a proprietary technology that matters most.
Fortunately, several intermediaries have been established to bridge this gap. First, government enabling legislation dating back to the Morrill Act of 1862 (establishing the land-grant university system), and more recently the Bayh-Doyle Act of 1980 that established a uniform patent policy for federally based research, helped
establish a framework for university business interaction. This has encouraged the creation of government intermediaries, including National Institute of Standards and Technology, the Advanced Technology Program, and the Manufacturing Extension Program. In addition, Industry-University Cooperative Research Centers (IUCRCs) have created partnerships between industry, academia, and government dedicated to technology transfer. Other examples of intermediaries include, Partnerships for Innovation, Independent Technology Intermediaries, and University Technology Transfer Offices (a prime example is the Wisconsin Alumni Research Foundation).
The other role for intermediaries is in education and workforce development. School-business partnerships, advisory committees, cooperative education programs, and customized training are all intermediary opportunities. As an example, Eberts noted the work of the
Michigan Regional Skills Alliance that has focused on workforce issues facing firms operating in a specific sector in distinct geographic regions. In particular, these intermediaries have focused on curriculum needs for working in a specific industry.
Are There Pitfalls in a Higher-education-based Economic Development Strategy?
While universities and colleges are local (and largely fixed) assets in a given
community, the question remains whether higher education can and should align itself with an economic development mission. Some question whether an interest in the direct application of knowledge reduces the traditional missions of basic research and scholarship. In fact, the history of higher education interactions with business has been uneven as basic institutional objectives have created suspicion between the two sectors. Surveys suggest that business rarely looks to universities as partners and that much of the industry knowledge they gain comes from suppliers, competitors, and consulting firms. It is therefore not surprising that success stories regarding universities and economic development in any given community tend to be more individual case studies than a systematic model for higher education engagement in the community.
Moreover, it is essential to focus on realistic economic development
Universities that actively partner with business and encourage the commercialization of
knowledge through tech transfer and licensing offices can often help local communities gain
from basic research advances.

Profitwise News and Views October 2007�
strategies. The creation of whole new industries from breakthrough science is only likely to occur at the very best schools. Often, more basic strategies, such as using community colleges to help train workers for key local industries, can produce significant and realistic returns.
Ironically, the U.S. was at the forefront of creating a system of university and industrial engagement. The establishment of the land-grant university system in 1862 was specifically designed to create university-based extension programs in agriculture and manufacturing that were aimed at delivering the best university research to farms and factories. Today, many schools may be going back to their land-grant roots and revitalizing the role for higher education in local and regional economic development.
NOTES
1 Glaesser, Edward L. Reinventing Boston: 1630-2003. Journal of Economic Geography, Oxford University Press, vol. 5(2), pages 119-153, April 2005.
2 MIT project and summary of the findings from the first phase of research, available online at http://web.mit.edu/lis/papers/LIS05-010.pdf.
3 Ebert, Randy. Can Higher Education Foster Economic Growth?, presentation at the Federal Reserve Bank of Chicago, October 30, 2006, available online at www.chicagofed.org/news_and_conferences/conferences_and_events/files/2006_higher_education_eberts.pdf.

�Profitwise News and Views October 2007
by David Cashin, Julie Gerenrot, and Anna Paulson
Determinants of Federal and State Community Development Spending: 1981–2004
Data
The data on state spending on community development come from the U.S. Census Bureau’s Annual Survey of State and Local Government Finances and Census of Governments (1981-2004). These data cover all 50 states and are available from 1981 to 2004.3 The data include federal transfers for housing and community development to each state and its localities, as well as total state and local spending on housing and community development. For the purposes of this article, and in accordance with the data that we analyze, housing and community development is defined as “construction, operation, and support of housing and redevelopment projects and other activities to promote or aid public and
private housing and community development.”4 Note that we do not study nongovernmental expenditures on community development. For convenience, we sometimes use the term “total state spending” as shorthand for total state and local government spending on housing and community development.
Most of the federal transfers to states and localities are transferred from funds allocated to HUD in the federal budget and from selected housing and community development programs under the U.S. Departments of Commerce and Treasury. Big-ticket funds and programs in the HUD budget are the Housing Certificate Fund and the Community Development Block Grant (CDBG) Program. The Department of Commerce administers
the Economic Development Administration and the Minority Business Development Agency, and the Department of Treasury administers the Community Development Financial Institutions Fund (CDFI).5
As a check on the coverage of the state and local government survey data, we compared official direct housing and community development spending by HUD and the Departments of Commerce and Treasury to total housing and community development spending calculated from the state and local government survey data. While we do not expect summing up federal transfers across states to match up one-to-one with total government spending on housing and community development, we do expect substantial overlap.6 The federal portion of the state and local
Introduction
Federal and state community development spending is an important component of the U.S. public welfare system, directly impacting the lives of numerous Americans, including nearly nine million low-income individuals living in housing subsidized by the U.S. Department of Housing and Urban Development (HUD).� Total federal housing and community development spending exceeded $�� billion in �00� – nearly $��� for each person living in the U.S.�
The goal of this article is to describe and analyze community development spending at the state level for the period �98� to �00�. Two components of each state’s housing and community development spending are analyzed: transfers from the federal government that are subsequently spent by states and localities, and expenditures from moneys generated by states and localities. In addition to describing broad trends in public community development spending over time, we also analyze the determinants of both the federal transfers and the state- and local-generated components of total state spending. For example, we consider whether community development spending responds to state-level trends in unemployment and poverty, and whether federal transfers and state- and local-generated expenditures are influenced by the same factors. This exercise helps us understand how we should think about public community development spending; that is, whether it should be regarded as a part of the social safety net that responds to short-term economic fluctuations, like periods of high state unemployment, or as a part of the social safety net that focuses more on alleviating long-term and persistent conditions, like high rates of poverty.

Profitwise News and Views October 2007�
government survey figures for 2004 represent between 79 percent and 93 percent of total federal spending on housing and community development by HUD, the Department of Commerce, and the Department of Treasury in 2004.7
Note that the state and local government survey data specifically exclude the following: HUD administered direct Federal Housing Administration (FHA) loans to individuals, builders, and landlords; building inspection and enforcement of housing codes or standards; and temporary shelters or housing for the homeless and for the military. Additionally, the state and local government survey does not include large tax-incentive programs, such as Low-Income Housing Tax Credits (LIHTC) and New Markets Tax Credits (NMTC).8
The state and local government expenditure data are supplemented by information on population, population
density, unemployment, poverty, and income for each state over the 1981 to 2004 period from the U.S. Census Bureau, the Bureau of Labor Statistics–Local Area Unemployment Statistics, the U.S. Census Historical Poverty Tables, and the Bureau of Economic Analysis–Regional Economic Accounts.
Trends in Housing and Community Development Spending
Figure 1 rrepresents overall trends in community development spending for the 1981 to 2004 period in real per
capita 2000 dollars. There was a gradual upward trend in real expenditure per capita on housing and community development for the contiguous United States as a whole, from $51 in 1981 to $115 in 2004, which corresponds to an average annual
real growth rate of roughly 4 percent.9 This increase is over and above spending adjustments for inflation.
Federal transfers consistently comprise about 70 percent of overall spending, and have been the driving force behind the gradual increase in overall spending – rising from $36 in 1981 to $82 in 2004. State- and local-generated expenditures account for the remaining 30 percent of overall spending. Analogous to the rise in federal transfers, state- and local-generated expenditures have
more than doubled, from $16 in 1981 to $33 in 2004.
State Variation in Housing and Community Development Spending
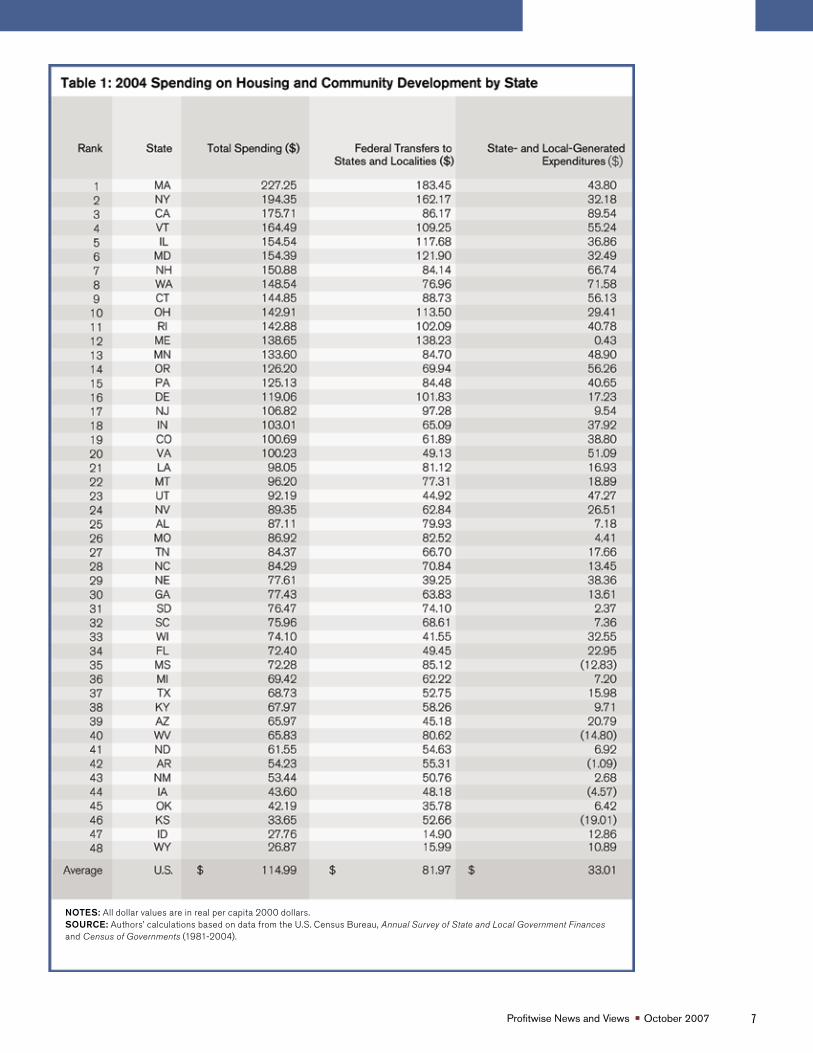
There is a great deal of interstate variation in housing and community development spending. Table 1 displays the contiguous states in order of their total state spending on housing and community development in 2004, with a breakdown of federal transfers and state- and local-generated expenditures for each state. Spending ranges from a high of $227 per person in Massachusetts to a low of $27 per person in Wyoming, and averages $115 per person for the contiguous United States.
In Figures 2 through 5, we examine interstate variation in housing and community development for 2004 for each of the 48 contiguous states in more detail.10 The 2004 total state per capita housing and community development spending figure is written in each state. States that have hatch lines have spending above the average of $115 and states without hatch lines have spending below the average.
Spending ranges from a high of $227 per person in Massachusetts to a low of $27 per person in
Wyoming, and averages $115 per person for the contiguous United States.
�Profitwise News and Views October 2007
NOTES: All dollar values are in real per capita 2000 dollars. SOURCE: Authors’ calculations based on data from the U.S. Census Bureau, Annual Survey of State and Local Government Finances and Census of Governments (1981-2004).

Profitwise News and Views October 20078
States along the West Coast, New England, New York, Pennsylvania, Delaware, Maryland, Minnesota, Illinois, and Ohio all have above average levels of total state housing and community development spending.11 In an effort to better understand what influences spending, we superimpose state-specific characteristics, such as annual personal per capita income, population per square mile, poverty rates, and unemployment rates, on the maps. The shading reflects increasing annual personal income per capita, population per square mile, poverty rates, and unemployment rates for Figures 2 through 5, respectively. Each of these characteristics, alone or in combination with others, can be used to explain what types of states are likely to have above average housing and community development spending.
From Figure 2, it is evident that housing and community development spending is higher in states with higher incomes. States with personal per capita incomes in roughly the top quartile (above $32,000 per year), such as
Washington, California, Minnesota, New Hampshire, Massachusetts, Connecticut, New York, Delaware, and Maryland, spend above average amounts on housing and community
development. Note that Illinois has an annual personal per capita income just below the cut-off of $32,000, as well as above average housing and community development spending.
Figure 3 shows that densely populated states also spend above average amounts on housing and community development. The relationship between spending and population per square mile helps to explain the relatively high spending in Illinois, Ohio, Pennsylvania, Rhode Island, New York, Delaware, Maryland, Massachusetts, Connecticut, and California. Each of these states is in the top quartile for population density, with more than 189 people per square mile. On the other hand, Oregon, Maine, and Vermont do not have particularly high incomes nor are they densely populated, but they do have above average housing and community development spending. In this framework, Florida, Colorado, Virginia, and New Jersey are also anomalies. Florida is densely populated, Colorado and Virginia have high annual personal per capita incomes, and New Jersey is both densely populated and has high annual personal per capita income, yet
Figure 2: 2004 Annual Personal Income and Total State Spending on Housing and Community Development
*Figured in the states are total 2004 state housing and community development (H&CD) spending per capita in 2000 dollars. Cross-hatched states are states with above average (>$115 per capita) total state H&CD spending.
0 to 27,000
27,000 to 32,000
32,000 to 47,000
NOTES: State and local government survey data are not available for 2001 and 2003. Data include 48 contiguous states. All dollar values are in real per capita 2,000 dollars.SOURCE: Authors' calculations based on data from U.S. Census Bureau, Annual Survey of State and Local Government Finances and Census of Governments (1981-2004). U.S. Census Historical Poverty Tables; Bureau of Labor Statistics - Local Area Unemployment Statistics; Bureau of Economic Analysis - Regional Accounts
- -
NOTES: State and local government survey data are not available for 2001 and 2003. Data include 48 contiguous states. All dollar values are in real per capita 2000 dollars. SOURCE: Authors’ calculations based on data from the U.S. Census Bureau, Annual Survey of State and Local Government Finances and Census of Governments (1981-2004), U.S. Census Historical Poverty Tables, Bureau of Labor Statistics - Local Area Unemployment Statistics, Bureau of Economic Analysis - Regional Accounts.

9Profitwise News and Views October 2007
they all have below average housing and community development spending.
Figures 4 and 5 illustrate the relationship between community development spending and poverty and unemployment rates across states. The story here is less clear. States with high poverty rates, such as New York, and low poverty rates, like Vermont and New Hampshire, spend above average amounts on housing and community development. Similarly, states with both high unemployment rates, such as California and Oregon, and with low unemployment rates, such as Vermont and New Hampshire, spend above average amounts on housing and community development. We attempt to resolve these puzzles by looking jointly at several potential determinants of community development spending in a regression framework.
Regression Analysis
Recall that total state spending on housing and community development comprises two components: transfers from the federal government to state and local governments, and state- and local-generated expenditures. We analyze the determinants of these two components separately. We present two regressions with federal transfers as the dependent variable, and two regressions with state-generated expenditures as the dependent variable. Independent variables include the following: population, population per square mile, one-year lagged unemployment rate, one-year lagged poverty rate, and annual personal income per capita. In addition, we examine the relationship between federal transfers to states and localities for housing and community development and state- and local-generated expenditures, and between state- and local-generated expenditures for housing and community development and federal transfers. Table 2 summarizes the dependent and independent variables.
The regression analysis presented in Table 3 (p. 12) is intended as a statistical exercise to examine multiple factors that are correlated with housing and community development spending, rather than as an attempt to model the actual process by which housing and community development is determined. Regression [1] examines the impact of state- and local-generated expenditures on federal transfers, and regression [3] examines the impact of federal transfers on state- and local-generated expenditures to explore the possibility of an automatic relationship between federal transfers and state- and local-generated expenditures. This would be the case if, for example, there were a federal matching program for state spending on housing and community development, as is the case with Medicaid. In regressions [2] and [4], we add state-specific controls, including population, one-year lagged unemployment rates, one-year lagged poverty rates, population per square mile, and annual personal per capita
income. For each regression, we use data for the 48 contiguous states covering the period 1981 to 2004.12 A full set of one-year fixed effects are included in all of the regressions.
Federal Transfers to State and Local Governments
Determinants of federal transfers for community development are analyzed in regressions [1] and [2] of Table 3. We examine the effect that state- and local-generated expenditures alone have on federal transfers in regression [1] and find that, all else equal, states and localities that generate a dollar more for housing and community development than the average state, receive an additional $0.19 of federal funding per capita.
When controlling for state-specific characteristics in regression [2], we find no evidence of an automatic relationship between federal transfers and state- and local-generated expenditures. In fact, states and localities that generate
Figure 3: 2004 Population per Square Mile and Total State Spending on Housing and Community Development
*Figured in the states are total 2004 state housing and community development (H&CD) spending per capita in 2000 dollars. Cross-hatched states are states with above average (>$115 per capita) total state H&CD spending.
0 to 53
53 to 189
189 to 1,171

Profitwise News and Views October 2007�0
a dollar more for housing and community development than the average state receive $0.08 less federal funding per capita. All else equal, population does not appear to be a significant determinant of federal transfers. Population density, on the other hand, is important. A state, such as New York, which has one standard deviation more people per square mile than an average state like Michigan, will receive an additional $9.59 per person from the federal government for housing and community development, according to the estimates presented in regression [2].13
State poverty and unemployment rates also influence federal transfers for housing and community development significantly. Regression [2] predicts that a state, such as Kentucky, which has a one standard deviation higher poverty rate than an average poverty state like Michigan, will receive an additional $3.83 per person from the federal government for housing and community development. Conversely, regression [2]
predicts that Louisiana, which has a one standard deviation higher unemployment rate than an average unemployment state like Arizona, will receive $2.22 less per person from the federal government for housing and community development. Federal transfers for community development appear to respond countercyclically to less persistent economic challenges, like unemployment, which tend to fluctuate, but are increasing in persistent measures of economic stress, like the poverty rate.
Another factor that plays a significant role in the level of federal transfers is annual personal per capita income. Regression [2] predicts that a state, such as Maryland, where annual personal per capita income is a one standard deviation higher than an average income state like Kansas, will receive $10.85 more per person from the federal government for housing and community development.
We also observe that while poverty
rates do positively influence federal transfers, income per capita and population per square mile have a larger impact on the allocation of federal dollars. To be exact, states with poverty rates one standard deviation above the mean receive 8 percent more in federal transfers per person than a state with an average poverty rate. On the other hand, states with population densities one standard deviation above the mean receive 19 percent more in federal transfers than an average state, while states with average annual personal per capita income one standard deviation above the mean receive 22 percent more in federal transfers than a state with average income.14 So in 2004, a state, such as Arkansas, despite its high poverty rate of 15.1 percent, had below average total state spending on housing and community development ($54.34 per person), because it has a low average per capita income ($23,662) and is sparsely populated with only 53 people per square mile.
State-generated Spending on Community Development
Determinants of state- and local-generated community development expenditures are analyzed in regressions [3] and [4] of Table 3. Similar to the analysis of federal transfers, there is a significant negative relationship between federal transfers and state- and local-generated expenditures when other control variables are included in the regression. States that receive one dollar more of federal per capita funding than the average state generate $0.07 less per capita for housing and community development.
Income is positively associated with state and local spending as it is with federal transfers for housing and community development. Regression [4] predicts that a state like Maryland, where annual personal per capita income is one standard deviation higher than an average state like Kansas, will
Figure 4: 2004 Poverty Rates and Total State Spending on Housing and Community Development
*Figured in the states are total 2004 state housing and community development (H&CD) spending per capita in 2000 dollars. Cross-hatched states are states with above average (>$115 per capita) total state H&CD spending.
0 to 9.5
9.5 to 14
14 to 19

��Profitwise News and Views October 2007
Figure 5: 2004 Unemployment Rates and Total State Spending on Housing and Community Development
*Figured in the states are total 2004 state housing and community development (H&CD) spending per capita in 2000 dollars. Cross-hatched states are states with above average (>$115 per capita) total state H&CD spending.
0 to 1.4
1.4 to 5.6
5.6 to 7.5
generate $13.94 more per person for housing and community development. This suggests that states with lower annual personal per capita incomes may find it challenging to generate resources for housing and community development programs.
In contrast to its insignificant effect on federal transfers, population is a significant determinant of state-generated expenditures. Regression [4] implies that a state like Ohio, where the population is one standard deviation higher than an average population state like Missouri, will generate $3.73 more per person for housing and community development. Conversely, population per square mile, lagged unemployment, and lagged poverty do not appear to be significant determinants of state-generated expenditure for housing and community development.
Recall that when we previously used Figures 2 through 5 to examine potential determinants of community development spending, Oregon, Maine, and Vermont
were a bit of a puzzle. Why is their spending so high? The regression analysis helps to answer this question. In 2004, Oregon, Maine, and Vermont had moderately high per capita incomes of $28,014, $27,542, and $29,132, respectively, which is just below the high income state cut-off of $32,000. Since annual personal income is a significant determinant of both federal transfers and state- and local-generated expenditures, relatively high incomes help to explain why these states have above average housing and community development spending. In addition, Vermont has the second lowest unemployment rate of the 48 contiguous states in 2004, and since states with lower unemployment rates tend to receive more federal transfers, this is another potential explanation for its high spending on community development programs. In addition, the regression analysis reinforces the more casual explanations we drew from Figures 2 and 3 regarding the correlation between housing and community development spending, and income and population density.
Conclusion
Housing and community development programs, whose funding accounts for a small portion of the federal budget, directly benefit at least nine million low-income Americans living in publicly subsidized housing. Real state spending per capita for these programs has increased nearly 4 percent each year, rising from $52.23 in 1981 to $116.19 in 2004. Seventy percent of these funds come from federal transfers to states and localities. The remaining 30 percent come from state- and local-generated expenditures. Geographic patterns of spending suggest that states with above average spending on housing and community development tend to be more densely populated and/or have higher annual personal per capita incomes. The regression analysis confirms these observations. In addition, federal transfers tend to be higher to states with higher poverty rates and lower to states with higher unemployment rates, all else equal.
As this exercise was intended to examine the factors that are correlated with housing and community development spending rather than model the process by which those expenditures are determined, we can only draw some very tentative conclusions as to why the relationships we have highlighted exist. First, states with higher population densities tend to receive more federal transfer funds per person than states with lower population densities, all else equal. This relationship seems appropriate considering that most housing and community development programs are targeted toward urban areas, and states with large urban areas are more densely populated than states without large urban areas.
The regression analysis also showed that states with higher annual personal per capita income generate more community development spending and receive more federal transfer funds than lower-income states. While it makes sense that higher-income states are able

Profitwise News and Views October 2007��
to afford more community development spending, at first glance it seems puzzling that these states are also receiving more in federal transfers than lower-income states. Recall, however, that community development programs are generally targeted to low- and moderate-income individuals and neighborhoods. Low and moderate income are defined in terms of relative, not absolute, levels of income. Low income is defined as below 50 percent of MSA median income and moderate-income families have incomes 50 percent to 80 percent of the area median. States with higher incomes are likely to have larger numbers of families who have low- and moderate-income levels. This helps to explain why higher-income states receive larger transfers of federal funds for community development.
Finally, we saw that states with higher poverty rates tend to receive more in federal transfers than states with lower poverty rates, and states with higher unemployment rates tend to receive less than states with lower unemployment rates. This finding suggests that housing and community development spending responds to persistent economic challenges, like poverty, rather than to shorter-term economic fluctuations, like unemployment.
NOTES: State and local government survey data are not available for 2001 and 2003. Data include 48 contiguous states. All dollar values are in real per capita 2000 dollars. *,**,*** indicate significance of a 10%, 5% and 1%, respectively. SOURCE: Authors’ calculations based on data from the U.S. Census Bureau, Annual Survey of State and Local Government Finances and Census of Governments (1981-2004), U.S. Census Historical Poverty Tables, Bureau of Labor Statistics - Local Area Unemployment Statistics, Bureau of Economic Analysis - Regional Accounts.

��Profitwise News and Views October 2007
NOTES
1 Public housing data is available at www.hud.gov/renting/phprog.cfm. Voucher data is available at www.centeronbudget.org/5-15-03hous.htm. We arrived at our approximation of nine million individuals benefiting from housing subsized by HUD using the following formula: 2.6 people per household on average x (1.3 million households living in public housing + 2.1 million households receiving vouchers) = 8.84 million people.
2 This value is in 2004 nominal dollars. The rest of the analysis uses values in real 2000 dollars.
3 Complete data are not available for 2001 and 2003. These years are not included in the analysis.
4 U.S. Census Bureau Federal, State, and Local Governments: Government Finance and Employment Classification Manual. Available online at www.census.gov/govs/www/classfunc50.html.
5 In 2004, the Housing Certificate Fund outlays were $20.5 billion and CDBG outlays were $4.9 billion relative to the total HUD budget of $41 billion (all figures given in real 2000 dollars). The Housing Certificate Fund encompasses rent subsidy programs like Housing Choice Vouchers (also known as the Section 8 program). CDBGs are transferred directly to states, local governments, metropolitan cities, urban counties, and other entitled jurisdictions to help develop viable urban communities in distressed areas. Other programs and funds include Public Housing Capital Fund (used for construction and operation of public housing), HOPE grants (used by Public Housing Authorities to revitalize severely distressed public housing), HOME Investment Partnerships program (formula grants to states and localities to provide direct rental assistance or oversee affordable housing for rent or homeownership), and other programs dealing with “urban renewal and slum clearance, redevelopment and rehabilitation of substandard or deteriorated facilities and areas, rural redevelopment, and revitalization of commercial areas.” The Economic Development Agency works to attract private capital investments and higher-skill , higher-wage jobs to distressed communities. The Minority Business Development Agency works to empower minority business enterprises. The CDFI fund promotes economic revitalization and community development through investment in and assistance to community development financial institutions.
6 They should not match exactly because of administrative expenses, which are not transferred to the state. In addition, different timing of expenditures by the federal government compared to states and localities will cause the figures to differ.
7 Under a variety of assumptions, we summed up all the housing and community development funding allocated to government programs (HUD, Commerce, and Treasury) that would get passed on to states. Totals ranged from $25.9 billion to $31 billion in 2004. We then compared these figures to the total federal transfers summed up over all the states from the state and local government survey, $24.3 billion in 2004. Therefore, the coverage of the state and local government survey data ranges from 79 percent to 93 percent.
8 The LIHTC program, created by HUD, provides states with funding to issue tax credits to investors for the acquisition, rehabilitation, or new construction of rental housing targeted to lower-income households. The NMTC program, funded by the Department of the Treasury’s CDFI fund, is designed to encourage economic development in low-income communities by providing tax breaks to businesses that develop in distressed areas.
9 Alaska and Hawaii were excluded from the analysis. Total per capita state expenditures on housing and community development in Alaska are more than two standard deviations above the mean throughout much of the 1981-2004 period. Similarly, Hawaii’s ratio of total state spending to federal transfers was more than two standard deviations above the mean in the early to mid-1980s.
10 The most recently available data are from 2004. Similar patterns of interstate variation in housing and community development spending are found in other years as well.
11 New England, as defined by the U.S. Census Bureau, comprises Maine, Vermont, New Hampshire, Connecticut , Massachusetts, and Rhode Island.
12 As mentioned earlier, complete data are not available for 2001 and 2003, and are therefore not included in the analysis.
13 To calculate how much more or less a state with one standard deviation more people per square mile than an average state would receive in federal transfers, we multiplied the standard deviation of population per square mile presented in Table 2 by the coefficient for population per square mile in regression [2] of Table 3. In general for similar calculations below, if xi is an independent variable and y the dependent variable, the increase/decrease in y for a state with one standard deviation higher xi than an average state is given by increase/decrease [y] = Standard Deviation [xi] * β[xi] .
14 These percentages are calculated by using the means and standard deviations of the dependent and independent variables from 1981-2004 and the coefficients found in regression [2]. For example, from Table 2 you see that population per square mile has a standard deviation of 239.65. When that is multiplied by 0.040, its regression [2] coefficient, we get 9.59. Dividing that by 49.84, the mean of federal transfers per capita, we get 19 percent.
Profitwise News and Views October 2007��
ILLINOIS
Children’s Savings Accounts highlighted at a recent event hosted by the Federal Reserve Bank of Chicago
An innovative program to help youth build financial skills and accumulate savings – Children’s Savings Accounts (CSA) – was highlighted at a recent event hosted by the Federal Reserve Bank of Chicago and coordinated by the Illinois Asset Building Group (IABG), a statewide coalition invested in building the financial strength of Illinois families and communities through asset ownership and asset protection.
CSA offers children a chance to build a more secure financial future through financial education and savings. Opened at birth with an initial investment, CSAs offer families an incentive to initiate the habit of saving early in life. Once a child reaches 18, the funds can be used for specific purposes, such as education or training, homeownership, or small business development.
Local Chicago youth from Mayo Elementary School discussed savings (goals) achieved by participating in a national CSA demonstration program, the Savings for Education, Entrepreneurship, and Downpayment (SEED) initiative. Illinois State Senator
Jacqueline Collins and State Representative Marlow Colvin spoke about the importance of CSAs and financial education in preparing youth for a successful financial future. Both were sponsors of legislation that created a task force to study the formation of children savings accounts for all Illinois children.
In addition, IABG members presented research that demonstrates the behavioral impact that asset building programs can have on youth and their families.
Highlights of the event and Children’s Savings Account proposals were featured by Chicago Public Radio, the Chicago Sun Times, and American Banker. For more information regarding the Illinois Asset Building Group or Children’s Savings Accounts, please contact Gina Guillemette at [email protected], or (773) 336-6083, or Dory Rand at [email protected], or (312) 368-2007.
INDIANA
IFA awards $7.2M statewide for brownfields redevelopment
According to a press release issued by Lieutenant Governor Becky Skillman’s office, the Indiana Finance Authority (IFA) has approved brownfields funding totaling nearly $7.2 million for Indiana communities to
assess and remediate environmentally impaired properties.
Potential developers are often deterred by abandoned gas stations due to fear of environmental contamination and related clean-up costs. Cris Johnston, Public Finance Director of the State of Indiana, said he hopes this investment will “help curb that fear,” and facilitate property revitalization, while creating jobs and improving the appearance and safety of Indiana cities and towns at minimal cost to taxpayers.
For more information on the Indiana Brownfields Program’s various funding incentives, visit www.in.gov/ifa/brownfields/financial_assistance.htm.
IOWA
Iowa Farm Bureau’s “Renew Rural Iowa” continues to help grow businesses
According to Sandy Ehrig, outreach coordinator for the Iowa Farm Bureau Federation, “Renew Rural Iowa” seminars are designed to assist entrepreneurs and existing businesses trying to grow their company. “By bringing together seasoned business experts and critical resources at each seminar, business owners can hone their knowledge of legal and financial matters, intellectual property, marketing, [and
Around the District

��Profitwise News and Views October 2007
other topic areas] in one location,” Ms. Ehrig explained. More than 300 participants have attended regional seminars in five locations around Iowa. The Iowa Farm Bureau is now welcoming participants for the final seminars this year.
The Iowa Farm Bureau Federation contracted with the Entrepreneurial Development Center, an Iowa business accelerator, to provide customized services and mentoring for promising clients. More than 15 businesses have participated in this special mentoring service. The Iowa Farm Bureau’s goal is to promote rural vitality by assisting the growth of Iowa’s businesses and entrepreneurs.
For more information, visit www.iowafarmbureau.com, or contact Sandy Ehrig at (515) 225-5480, or [email protected].
MICHIGAN
Property improvement program income limits raised
According to the Michigan State Housing Development Authority (MSHDA), income limits to qualify for its Property Improvement Program (PIP), were raised effective April 15, 2007. PIP enables qualifying Michigan property owners to borrow funds at below-market interest to make repairs and improvements to existing homes.
PIP can be used to finance almost any type of permanent improvement, including repair or replacement of mechanical or electrical systems, remodeling or room additions, replacing windows, painting, or siding.
For more information, visit www.michigan.gov/mshda.
WISCONSIN
12 Wisconsin counties get “WIRED”
The U.S. Department of Labor’s Employment and Training Administration recently designated 12 counties in south and southwest Wisconsin as a Workforce Innovation in Regional Economic Development (WIRED) region. The designation will bring $5 million dollars over three years to the multi-jurisdictional effor t to coordinate workforce development effor ts in support of economic development .
In the press release announcing the third round of WIRED regions, Department of Labor Assistant Secretary Emily Stover DeRocco said, “We are already encouraged by the results of t h e WIRED s t rategic par tnerships , demonstrating that talent development can drive economic transformation.” This is Wisconsin’s second WIRED region (the Milwaukee 7 region was designated in 2006).
For more information on WIRED regional initiatives, visit the U.S. Department of Labor’s Web site at www.doleta.gov/wired/regions/#1stgeneration.

Profitwise News and Views October 2007��
Calendar of Events
November
What Will Sustain Rural Development: Is the Answer Blowing in the Wind?
Glencoe, IL November 7, 2007
Sponsored by the Federal Reserve Bank of Chicago, The Land Institute, and the Chicago Botanic Garden, this timely and interactive conference will provide a forum to explore the opportunity for developing affordable, renewable wind power and the potential impact on our Midwestern rural economies. Progress with other renewable sources of alternative energy, such as solar, ethanol, and hydroelectric, will also be assessed. The event will feature nationally recognized practitioners and researchers who are working toward harnessing wind power as a meaningful energy resource, as well as a means to promote rural economic development.
The fee for this event is $80, and registration deadline is November 3, 2007. For more information, or to register online, visit www.chicagofed.org/community_development, or contact Barbara Sims at (312) 322-8232 or [email protected].
Strategies for Improving Economic Mobility of Workers
Chicago, ILNovember 15 and 16, 2007
This conference is hosted by the Federal Reserve Bank of Chicago’s Economic Research and Consumer and Community Affairs departments in partnership with the W.E. Upjohn Institute for Employment Research. The goal of the conference is to bring together researchers and practitioners to discuss some of the key issues regarding policies impacting disadvantaged workers and their communities. Topics to be discussed include trends and future outlook on work, wages, and occupations, spatial mismatch between jobs and workers, job training and education, and other state and federal assistance for low-income workers. There will also be panel discussions by practitioners that will highlight practical experiences with running workforce development programs.
For more information, or to register online, visit www.chicagofed.org/community_development, or contact Barbara Sims at (312) 322-8232 or [email protected].
A Dialogue on Economic Opportunities in the Delta
Jackson, MSNovember 29, 2007
Participants in this interactive forum will discuss issues related to concentrated poverty that are endemic to the Delta. The forum is sponsored by the Community Affairs Offices of the Federal Reserve Banks of Atlanta and St. Louis.
For information, or to register online, visit www.stlouisfed.org/community/conferences, or contact Julie Kerr at (501) 324-8296 or [email protected].
December
An Informed Discussion of Nontraditional Mortgage Products and Escalating Foreclosures
Chicago, IL December 11 and 12, 2007
The Federal Reserve Bank of Chicago in co-sponsorship with the University of Wisconsin Extension and the Wisconsin Housing and Economic Development Authority (WHEDA), will host a conference to discuss “nontraditional” mortgage products, which allow borrowers to exchange lower payments during an initial period for higher payments later. Participants

��Profitwise News and Views October 2007
will gain valuable insights from experts who will explore the risks posed by nontraditional mortgage products as well as issues stemming from Wisconsin’s rising number of foreclosures. A further goal of the conference is to initiate an effective community response to the rising tide of Wisconsin foreclosures.
The registration fee for this event is $60 ($40 for nonprofit organizations). Conference registration and payment deadline is December 3, 2007. For further information or to register online, visit www.chicagofed.org/community_development, or contact Barbara Sims at (312) 322-8232 or [email protected].
2008
2008 National Interagency Community Reinvestment Conference
San Francisco, CAMarch 30–April 2, 2008
Mark your calendars for the 2008 National Interagency Community Reinvestment Conference. This three day event, jointly sponsored by the Federal Deposit Insurance Corporation, Federal Reserve Bank of San Francisco, Office of the Comptroller of the Currency, and Office of Thrift Supervision, will feature CRA examination training, creative strategies for community development, innovations in community development investing, and the National Community Development Lending School.
Registration materials will be available in January. Please visit the Federal Reserve Bank of San Francisco’s www.frbsf.org/community/conference08.html for more information.
National Community Investment Fund Annual Development
Banking Conference 2007
On November 6 and 7, 2007 the National Community Investment Fund, along with the Federal Reserve Bank of Chicago, will host the National Community Investment Fund Annual Development Banking Conference 2007. This conference is for professionals and organizations who are stakeholders in financing the economic development of disadvantaged communities, including:
• Officers, directors and senior managers of banks, thrifts, and credit unions
• Investors, investment bankers, and managers
• Foundation and nonprofit executives
• Regulators
• Consultants and technology suppliers
• Academics and researchers
The conference features keynote speakers: Sheila Bair, chairman, FDIC, and Kim Reed, director, CDFI Fund, plus a full agenda of presentations and panel discussions on a wide range of important community development financing issues.
Visit NCIF’s secure Web site to register online, or to download and print a PDF registration form to fax or mail. The NCIF has secured a block of rooms at the Hilton Chicago, 720 South Michigan Avenue. To make reservations, call the hotel at (877) 865-5320 and mention the National Community Investment Fund room block when making your reservation. If you have any questions or need additional information, please call Joe Schmidt of NCIF at (312) 881-5817.

Attention:
Executive O
fficers B
oard of Directors
C
RA
Officers
Com
munity Lenders
Com
munity R
epresentatives
Profitw
ise New
s and Views is published by the
Consum
er and Com
munity A
ffairs Division of the
Federal Reserve B
ank of Chicago
230 S. LaS
alle Street
Chicago, IL 60604-1413
Consum
er and Com
munity A
ffairs Division
P.O. B
OX
834
CH
ICA
GO
, IL 60690-0834
RE
TUR
N S
ER
VIC
E R
EQ
UE
STE
D
PR
ES
OR
TED
S
TAN
DA
RD
U.S
. PO
STA
GE
PAID
CH
ICA
GO
, ILP
ER
MIT N
O. 1942