Do Bilateral Investment Treaties ... - LSE Research...
45
LSE Research Online Article (refereed) Eric Neumayer and Laura Spess Do bilateral investment treaties increase foreign direct investment to developing countries? Originally published in World development , 33 (10). pp. 1567-1585 © 2005 Elsevier Ltd. You may cite this version as: Neumayer, Eric & Spess, Laura (2005). Do bilateral investment treaties increase foreign direct investment to developing countries? [online] London: LSE Research Online. Available at: http://eprints.lse.ac.uk/archive/00000627 Available online: February 2006 LSE has developed LSE Research Online so that users may access research output of the School. Copyright © and Moral Rights for the papers on this site are retained by the individual authors and/or other copyright owners. Users may download and/or print one copy of any article(s) in LSE Research Online to facilitate their private study or for non-commercial research. You may not engage in further distribution of the material or use it for any profit-making activities or any commercial gain. You may freely distribute the URL (http://eprints.lse.ac.uk ) of the LSE Research Online website. This document is the author’s final manuscript version of the journal article, incorporating any revisions agreed during the peer review process. Some differences between this version and the publisher’s version remain. You are advised to consult the publisher’s version if you wish to cite from it. http://eprints.lse.ac.uk Contact LSE Research Online at: [email protected]
Transcript of Do Bilateral Investment Treaties ... - LSE Research...

LSE Research Online Article (refereed)
Eric Neumayer and Laura Spess
Do bilateral investment treaties increase foreign direct investment to developing countries?
Originally published in World development, 33 (10). pp. 1567-1585 © 2005 Elsevier Ltd. You may cite this version as: Neumayer, Eric & Spess, Laura (2005). Do bilateral investment treaties increase foreign direct investment to developing countries? [online] London: LSE Research Online. Available at: http://eprints.lse.ac.uk/archive/00000627 Available online: February 2006 LSE has developed LSE Research Online so that users may access research output of the School. Copyright © and Moral Rights for the papers on this site are retained by the individual authors and/or other copyright owners. Users may download and/or print one copy of any article(s) in LSE Research Online to facilitate their private study or for non-commercial research. You may not engage in further distribution of the material or use it for any profit-making activities or any commercial gain. You may freely distribute the URL (http://eprints.lse.ac.uk) of the LSE Research Online website. This document is the author’s final manuscript version of the journal article, incorporating any revisions agreed during the peer review process. Some differences between this version and the publisher’s version remain. You are advised to consult the publisher’s version if you wish to cite from it.
http://eprints.lse.ac.uk Contact LSE Research Online at: [email protected]
Do bilateral investment treaties increase foreign direct
investment to developing countries?
REVISED VERSION
MAY 2005
Eric Neumayer* and Laura Spess
Department of Geography and Environment, London School of Economics and Political
Science, Houghton Street, London WC2A 2AE, England, [email protected]
* Corresponding author.

Do bilateral investment treaties increase foreign direct
investment to developing countries?
Summary – Foreign investors are often skeptical toward the quality of the domestic
institutions and the enforceability of the law in developing countries. Bilateral
Investment Treaties (BITs) guarantee certain standards of treatment that can be
enforced via binding investor-to-state dispute settlement outside the domestic juridical
system. Developing countries accept restrictions on their sovereignty in the hope that
the protection from political and other risks leads to an increase in foreign direct
investment (FDI), which is also the stated purpose of BITs. We provide the first
rigorous quantitative evidence that a higher number of BITs raises the FDI that flows
to a developing country. This result is very robust to changes in model specification,
estimation technique and sample size. There is also some limited evidence that BITs
might function as substitutes for good domestic institutional quality, but this result is
not robust to different specifications of institutional quality.
Key words –– Foreign direct investment, bilateral investment treaties, institutional
quality, protection, risk.
1

ACKNOWLEDGEMENT
We thank three anonymous referees as well as Anne van Aaken, Ken Shadlen and
Susan Rose-Ackerman for many helpful comments. Eric Neumayer acknowledges
financial support from the Leverhulme Trust.
2

1. INTRODUCTION
Developing countries sign bilateral investment treaties (BITs) in order to attract more
foreign direct investment (FDI). In recent decades BITs have become ‘the most
important international legal mechanism for the encouragement and governance’ of
FDI (Elkins, Guzman and Simmons 2004, p. 0). The preambles of the thousands of
existing BITs state that the purpose of BITs is to promote the flow of FDI and,
undoubtedly, BITs are so popular because policy makers in developing countries
believe that signing them will increase FDI. But do these treaties fulfill their stated
purpose and attract more FDI to developing countries that submit to the obligations of
a BIT? Despite the large and increasing number of BITs concluded, there exists very
little evidence answering this question. Most existing scholarship, typically written
with a legal perspective, simply restricts itself to an analysis of the BIT practice of
one country or certain similar provisions in a range of BITs (Vandevelde 1996, p.
545). This omission is strange given that the question is of great importance to
developing countries. They invest time and other scarce resources to negotiate,
conclude, sign and ratify BITs. Such treaties represent a non-trivial interference with
the host countries’ sovereignty as they provide protections to foreign investors that are
enforceable via binding investor-to-state dispute settlement. While the motivations
driving developing countries to incur these costs may be varied (see Guzman 1998;
Elkins, Guzman and Simmons 2004; Neumayer 2005), the costs might be justified if
the ultimate outcome is an increase in the inward flow of FDI.1 But is this what
actually occurs?
In the absence of hard, quantitative evidence, some observers have been rather
pessimistic toward the effect of BITs on FDI location. Sornarajah (1986, p. 82), for
example, suggests that ‘in reality attracting foreign investment depends more on the
3

political and economic climate for its existence rather than on the creation of a legal
structure for its protection’. An expert group meeting sponsored by the United
Nations Conference on Trade and Development (UNCTAD) in 1997 reportedly held a
similar position (Raghavan 1997). Supportive of this view is that some major hosts of
FDI like Brazil or Mexico for a long time were reluctant to sign BITs. As UNCTAD
(1998, p. 141) has put it in a review of BITs from almost a decade ago: ‘There are
many examples of countries with large FDI inflows and few, if any, BITs.’ And yet,
most developing countries have signed a great many BITs by now. Is there evidence
that those that have signed more BITs have also managed to attract more FDI?
Two studies analyze this issue over the period 1980 to 2000 (Hallward-Driemeier
2003 and Tobin and Rose-Ackerman 2005) and one over the period 1991 to 2000
(Salacuse and Sullivan 2005). The first study by Hallward-Driemeier (2003) does not
find any statistically significant effect. The second study by Tobin and Rose-
Ackerman (2005) finds a negative effect at high levels of risk and a positive effect
only at low levels of risk, with the majority of developing countries falling into the
high risk category. The third study by Salacuse and Sullivan (2005) finds a positive
effect only for United States BITs, but not for BITs from other countries of the
Organisation of Economic Co-operation and Development (OECD). The existing
evidence goes against expectation and would suggest that the enormous amount of
effort developing countries have spent on BITs has basically been wasted. One of the
problems of existing studies is that they infer results from a rather restricted sample of
countries (31 and 63, respectively) or are based on cross-sectional regressions. In
contrast, we employ a much larger panel over the period 1970 to 2001, covering up to
119 countries. Importantly, we find a positive effect of BITs on FDI inflows that is
consistent and robust across various model specifications. The effect is sometimes
4

conditional on institutional quality, but is always positive and statistically
significantly different from zero at all levels of institutional quality. To our
knowledge, we provide the first hard evidence that there is a payoff to developing
countries’ willingness to incur the costs of negotiating BITs and to succumb to the
restrictions on sovereignty contained therein.
Having demonstrated that BITs successfully increase the flow of FDI coming to a
country, another important question that we address is whether BITs function as
substitutes or complements to good institutional quality. Naturally, one would expect
them to be substitutes, i.e. they provide security and certain standards of treatment to
foreign investors where domestic institutions fail to deliver the same security and
standards. However, some, like Hallward-Driemeier (2003) argue that BITs might
only be seen as credible in an environment of good institutional quality. This would
imply that BITs are most effective in countries where they are least needed. Our
results provide some limited evidence that BITs might function as substitutes to poor
institutional quality, which would suggest that they are most effective where such
quality is low and that they are most successful where they are needed most.
However, this result is not robust to different specifications of institutional quality.
This article is structured as follows. The next section briefly describes the well-
known fact of increasing importance of foreign investment to developing countries,
illustrates the growth of BITs and analyzes the role of their main provisions for the
promotion of FDI. We then review the three existing empirical studies and discuss
their shortcomings, which we aim to overcome in our own analysis. After presenting
our research design, we report results and test the sensitivity of results to important
changes in model specification. The final section concludes.
5

2. BITS AND FDI
The flow of FDI has dramatically increased in the past several decades to become a
major force in the worldwide allocation of funds and technology. Prior to 1970, world
trade generally grew at a greater pace than that of FDI, but in the decades since then
the flow of FDI has grown at more than twice the pace of the growth of worldwide
exports. By the early 1990s, the sales of worldwide exports would be eclipsed by the
sales of foreign affiliates of multi-national firms (Dunning 1998). Not only has the
flow of FDI increased worldwide, but the importance of FDI as a source of funds to
developing countries in particular has also significantly increased. Private
international flows of financial resources have become increasingly important to
developing countries. In the 1980s tight budgets, the debt crisis and an overall
decreased interest in providing traditional development aid lead to a decline in official
development assistance from the developed world. When capital flows to developing
nations began to rise again in the latter part of that decade, the flows would
increasingly be composed of FDI (Zebregs 1998). Only very recently have aid flows
slightly increased again in the wake of the so-called Monterrey Consensus. However,
in 2003 FDI was the largest component of the net resource flows to developing
countries and this is bound to remain the case for some time to come (UNCTAD
2003a). Although the developed countries remain both the dominating source and the
major recipient of FDI, their dominance has decreased over time with developing
countries in 2003 receiving almost 31% of FDI as opposed to only about 20% in the
1980s (UNCTAD 2004). Indeed, FDI inflows per unit of GDP are much higher in
many developing countries than in developed ones (ibid.). It was during this same
period that BITs were introduced and eventually proliferated and in light of the
6

importance of FDI, particularly to developing nations, the extent to which these two
phenomena are causally related warrants careful scrutiny.
The first BITs appeared at the end of the 1950s. Some trace their history back to
the treaties of friendship, commerce, and navigation (FCN) concluded by the United
States over centuries (Salacuse 1990). The FCN treaties had the expansion of
international trade and the improvement of US foreign relations as their prime
purpose, even though some investment provisions were later added (Guzman 1998).
BITs on the other hand are more clearly focused on foreign investment protection.
Germany, having lost almost all of her foreign investment during the Second World
War, signed the very first BIT with Pakistan in 1959. After that, it took almost two
decades before BITs gained momentum. By the end of the 1960s there were 75
treaties, which rose to 167 by the end of the 1970s and to 389 by the end of the 1980s.
The number of BITs worldwide began to grow rapidly in the 1990s and by 2002 there
would be 2,181 BITs worldwide (UNCTAD 2003a). Figure 1 shows the number of
BITs signed per year and the cumulative number of BITs worldwide.
In order to explain the popularity of bilateral investment treaties it is necessary to
understand how they fit into the larger regime of state-foreign investor relations. Prior
to the advent of BITs, the only protection for foreign investors was the customary
international legal rule of minimum standard of treatment and the so-called Hull rule.
The minimum standard of treatment rule provides only very minimal protection, as
the name already suggests, while the Hull rule dealt exclusively with cases of
expropriation and therefore provided no general protection against discriminatory
treatment. It grew out of a dispute between Mexico and the US in the 1930s over
properties expropriated by the government of Mexico. In one of a series of diplomatic
notes to the Mexican Minister of Foreign Affairs, the US Secretary of State Cordell
7
Hull stated that ‘no government is entitled to expropriate private property, for
whatever purpose, without provision for prompt, adequate, and effective payment
therefore’ (Guzman 1998, p. 641). Subsequently, the rule of “prompt, adequate, and
effective” compensation would be the standard known as the Hull rule. However, it is
disputed whether the Hull rule represents customary international law. Developing
countries challenged its validity as part of their demands for a New International
Economic Order with some success: Resolution 1803 of the United Nations General
Assembly merely requires ‘appropriate compensation’ for expropriation (Ginsburg
2004). Guzman (1998, p. 641) suggests that by the mid-1970s ‘the Hull Rule had
ceased to be a rule of customary international law’, if ever it had been one. The fact
that there were several spectacular expropriations in the 1960s and 1970s taking place
without what investors regarded as adequate compensation supports this view.2 This
raises doubt on whether the Hull rule ever represented customary international law,
for which conforming state practice is a requirement.
Surprisingly, even as many developing nations resisted the Hull Rule, many of the
same countries began to sign on to BITs that incorporate similar and indeed more far-
reaching provisions. Guzman (1998) and Elkins, Guzman and Simmons (2004)
suggest that this seemingly contradictory behavior is explained by the increased
competition among developing countries for FDI from developed countries.
Collectively, they would be better off refusing to sign any BIT and retaining as much
control over their assets as possible, which explains their resistance to multilateral
investment treaties at fora such as the United Nations Conference on Trade and
Development (UNCTAD) where they can collectively express and organize their
interests. In a classic example of the prisoner’s dilemma, however, the individual
country benefits from being able to provide credible commitments to investors. In the
8

context of limited multilateral or customary protection for investors, the individual
country gains a competitive advantage as an investment location by submitting to a
BIT. Further, when a less developed country’s neighbor or economic competitor signs
such an agreement, in order to remain competitive they must sign one as well.
Somewhat at odds with this explanation is that the latest trend is for developing
countries to sign BITs among themselves. This has been a rather recent development,
however, and the vast majority of existing BITs are concluded between a developed
and a developing country.
The basic provisions of a bilateral investment treaty (BIT) typically guarantee
certain standards of treatment for the foreign investor (see Dolzer and Stevens 1995;
UNCTAD 1998). By entering into a BIT, signatories agree to grant certain relative
standards treatment such as national treatment (foreign investors may not be treated
any worse than national investors, but may be treated better and, in fact, often are) and
most-favored nation treatment (privileges granted to one foreign investor must be
granted to all foreign investors). They also agree to guarantee certain absolute
standards of treatment such as fair and equitable treatment for foreign investors in
accordance with international standards after the investment has taken place. BITs
typically ban discriminatory treatment against foreign investors and include
guarantees of compensation for expropriated property or funds, and free transfer and
repatriation of capital and profits. Further, the BIT parties agree to submit to binding
dispute settlement should a dispute concerning these provisions arise (UNCTAD
1998). Ostensibly, these provisions should secure some of the basic requirements for
credible protection of property and contract rights that foreign investors look for in
host countries. They should also protect foreign investors against political and other
risks highly prevalent in many developing countries. Far from being neutral, foreign
9

investors are often granted higher security and better treatment than domestic
investors (Vandevelde 1998).
The basic provisions of BITs are all direct answers to the fundamental “hold-up”
or “dynamic inconsistency” problem that faces developing nations attempting to
attract FDI. The dynamic inconsistency problem arises from the fact that although
host countries have an incentive to promise fair and equitable treatment beforehand in
order to attract foreign investment, once that investment is established and investors
have sunk significant costs the host country’s incentive is to exploit or even
expropriate the assets of foreign investors. Even those host countries that are willing
to forego taking advantage in these circumstances will find it very difficult to credibly
commit to their position. Many developing countries have adopted domestic legal
changes over the last decade or so with a view toward encouraging a greater FDI
inflow (UNCTAD 2004). However, these domestic legal rules cannot substitute for
the commitment device offered by entering into a legally binding bilateral treaty.
BITs, and their binding investor-to-state dispute settlement provision in particular, are
meant to overcome the dilemma facing host countries who are willing to denounce
exploiting foreign investors after the investment has already been undertaken.
Interestingly, at the same time as BITs flourished in the 1980s and 1990s, outright
expropriations of foreign investors, which were common during the 1960s and 1970s,
practically ceased to take place (Minor 1994).
The extent of interference with domestic regulatory sovereignty developing
countries succumb to in signing BITs is enormous. In fact, virtually any public policy
regulation can potentially be challenged through the dispute settlement mechanism as
long as it affects foreign investors. Often, foreign investors need not have exhausted
domestic legal remedies and can thus bypass or avoid national legal systems, reaching
10

straight for international arbitration, where they can freely choose one of the three
panelists, their consensus is needed for one other panelist and where they can expect
that the rules laid out in the BITs are fully applied (Peterson 2004). This contrasts
with domestic courts, where investors have no say on the composition of judges and
where domestic rules might trump BIT provisions. BITs have been criticized for not
conforming to a truly liberal economic model by failing to ban distorting government
policies such as protective tariffs or tax incentives for foreign investors (Vandevelde
2000). However, even critics such as Vandevelde (2000, p. 499) admit that ‘BITs
seriously restrict the ability of host states to regulate foreign investment’.3 In
concluding BITs, developing countries are therefore ‘trading sovereignty for
credibility’ (Elkins, Guzman and Simmons 2004, p. 4).
BITs are therefore an important instrument of protection to foreign investors, for
which there is currently not much legal alternative. Only few regional free trade
agreements contain investment protection provisions like the North American Free
Trade Agreement (NAFTA). The World Trade Organization’s (WTO) Agreement on
Trade-Related Investment Measures (TRIMs Agreement) imposes only rudimentary
disciplines on the regulation of foreign investment that are by far not as
comprehensive as and fall much short of provisions contained in BITs.
Of course, not all BITs are identical in their provisions. Some developed country
investors like the United States insist on some limited rights of its investors to
establish investment in host countries in the first place, whereas investor’s rights in
most BITs are restricted to fair and equitable treatment after the investment has
already taken place and provide no right of entrance. United States BITs often
prohibit certain performance requirements such as local content, export and
employment requirements beyond the requirements contained in the WTO’s TRIMs
11

Agreement, whereas BIT programs of other developed countries do not contain such
provisions (Vandevelde 1998). Conversely, some non-developed countries such as
China and Eastern European countries have successfully managed to restrict the
compulsory dispute settlement provisions to disputes concerning expropriation or the
compensation thereof (Peters 1996, p. 107). However, by and large BITs tend to be
rather similar in their provisions.
BITs are also unlikely to be identical in their effect on incoming FDI flows. In
principle, BIT provisions only protect investors from the signatory states to whom
binding commitments are made.4 One would therefore expect that signing a BIT with
a major capital exporter such as Germany or the United States has a larger impact on
FDI inflows than signing a BIT with minor capital exporters such as New Zealand or
Portugal. However, the signing of BITs sends out a signal to potential investors that
the developing country is generally serious about the protection of foreign investment.
The encouragement of FDI flows therefore need not be restricted to investors from
developed countries that are BIT partners of the developing country. Instead, BITs
can have positive spill-over effects. How important is the signaling effect, which
benefits investors from all countries, compared to the commitment effect, which only
relates to investors from BIT partner countries, is difficult to say. Our research design,
described in detail below, does not restrict the effect of BIT signature on FDI to
investment from partner countries and accounts for differences in the size of potential
FDI to which the developing country has made binding commitments by weighting
BITs with the relative importance of the developed country partner as a capital
exporter.
12
3. REVIEW OF OTHER STUDIES
It is most astonishing that despite the rising number of BITs, there are only three other
serious studies examining the effect of such treaties on the location of FDI.5 The first
study has been undertaken by Hallward-Driemeier (2003), looking at the bilateral
flow of FDI from 20 OECD countries to 31 developing countries over the period 1980
to 2000. Her research design is dyadic, consisting of up to 537 country pairs. Using
fixed effects estimations, she finds that the existence of a BIT between two countries
does not increase the flow of FDI from the developed to the developing signatory
country. This is true whether the dependent variable is measured as absolute flows,
flows divided by host country’s GDP or the share of the source countries’ FDI
outflow. Interacting the BIT variable with various measures of institutional quality,
she finds a positive coefficient of the interaction term that is often statistically
significant. This would suggest that, contrary to theoretical expectations, BITs are
complements to good institutional quality and therefore do not perform their original
function, namely to provide guarantees to foreign investors in the absence of good
domestic institutional quality.
In the second study, Tobin and Rose-Ackerman (2005) analyze the impact of BITs
on general non-dyadic FDI inflows, also in a panel from 1980 to 2000, but with data
averaged over five-year periods, covering 63 countries. Whilst both studies draw upon
data provided by International Country Risk Guide (ICRG), Hallward-Driemeier
(2003) uses individual components of institutional quality, whereas Tobin and Rose-
Ackerman (2005) use the aggregate political risk measure, which includes many more
components than institutional quality, including some that are not directly related to
political risk (such as, among others, religious and ethnic tensions, armed conflict and
socio-economic conditions such as unemployment and poverty). In a fixed effects
13
model, Tobin and Rose-Ackerman find that a higher number of BITs either in total or
signed with a high income country lowers the FDI a country receives as a share of
global FDI flows at high levels of risk and raises the FDI only at low levels of risk. In
an additional dyadic analysis of 54 countries, they fail to find any statistically
significant effect of BITs signed with the US on FDI flows from the US to developing
countries, either conditionally on the level of political risk or unconditionally.
The third study provides three cross-sectional analyses of FDI inflows to up to 99
developing countries in the years 1998, 1999 and 2000, respectively, as well as a
fixed effects estimation of the bilateral flow of FDI from the US to 31 developing
countries over the period 1991 to 2000. Salacuse and Sullivan (2005) find the
signature of a BIT with the US to be associated with higher FDI inflows in both types
of estimations, whereas the number of BITs with other OECD countries is always
statistically insignificant.
The three studies suffer from a number of shortcomings that we try to improve on
in our own study. Halward-Driemeier’s (2003) model presumes that a BIT will only
have an effect on the flow of FDI from one developed country, namely the signatory,
to the developing country. However, this presumption neglects the signaling effect of
BITs (Elkins, Guzman and Simmons 2004, p. 21). As pointed out in the preceding
section, in concluding a BIT, the developing country commits to protect foreign
investments, explicitly only the FDI from the signatory developed country, but
implicitly it also signals its willingness to protect all foreign investment. There are
therefore likely to be positive spill-over effects from signing a BIT. Halward-
Driemeier’s modeling cannot capture the potential of BITs to attract more FDI from
other developed non-signatory countries as well, and consequently may underestimate
the effect that signing a BIT has on the inward flow of FDI. In addition to not
14

capturing this potentially important spill-over effect, the dyadic design also has
another major disadvantage. Data on bilateral FDI flows are very sparse, and
consequently the size of her sample is significantly limited by this choice. A sample
of 31 developing countries is everything but representative. Similar arguments apply
to Salacuse and Sullivan’s (2005) fixed effects analysis.6 Our own study draws from a
much larger and more representative sample.
Where Tobin and Rose-Ackerman (2005) do not use a dyadic research design, the
paucity of bilateral FDI flow data does not impose a binding constraint on sample
size. Nevertheless, for no clear reason their sample consists of only 63 countries. In
comparison, our own sample is both deeper and wider. It covers the period 1970, the
first year for which UNCTAD provides FDI data, to 2001, the last year for which we
have available data. It also covers up to 119 developing countries, which amounts to a
much more representative sample. The countries included in our sample are listed in
appendix 1. Salacuse and Sullivan’s (2005) cross-sectional analysis also has the
advantage of a large sample size. However, by definition this type of analysis cannot
control for country-specific unobserved heterogeneity, which is likely to be important,
nor does it exploit the full information available from looking at FDI flows over a
longer time period.
4. RESEARCH DESIGN
(a) Dependent variable
As our main measure of FDI attractiveness, we use the absolute amount of FDI going
to a developing country, converted to constant US$ of 1996 with the help of the US
GDP deflator. The definition of a developing country follows World Bank
classification. We use absolute FDI flows because if one were to use FDI inflow as a
15
percentage of host country’s GDP instead, the measure would capture changes in the
relative importance of foreign investment to the host country, but not changes in
inflows directly. Quite possibly, the worldwide increase in the rate of the conclusion
of BITs is partly responsible for the increase in overall FDI going to developing
countries. However, there is always the danger that one finds a statistically significant
relationship between two upward trending variables that is spurious. We deal with this
potential problem in two ways. First, we employ year dummies to account for any
year-to-year variation in total FDI flows unaccounted for by our explanatory
variables, which should mitigate potential spuriousness of any significant results.
Second, as an alternate dependent variable to the absolute amount of FDI we use the
FDI inflow a country receives relative to the sum of FDI going to developing
countries. Since this variable is not trending over time no year-specific time dummies
are included in these sets of estimations. FDI inflow as a share of developing country
FDI as the dependent variable captures the relative attractiveness of developing
countries as hosts for FDI and explicitly allows for competition amongst them for a
fixed sized cake of FDI to be divided.7 Ideally, one would like to disaggregate FDI
flows according to economic sectors. Unfortunately, no comprehensive information is
available for a large panel of countries.
We take the natural log of the dependent variable to reduce the skewness of its
distribution. This increases the model fit substantially. To do so, we need to recode a
small number of negative FDI flows. Negative FDI flows essentially imply ‘instances
of reverse investment or disinvestment’ (UNCTAD 2001, p. 292). In our analysis we
set negative FDI flows equal to positive FDI flows of one US$. If instead one were to
discard all negative flows then results are hardly affected.
16
(b) Explanatory variables
Our main explanatory variable is the cumulative number of BITs a developing
country has signed with OECD countries, weighted by the share of outward FDI flow
the OECD country accounts for relative to total world outward FDI flow.8 The
weighting is to account for differences in the size of potential FDI a developing
country makes protection commitments for via signing a BIT. We exclude BITs
signed between developing countries since FDI flows between developing countries
are rare. Tobin and Rose-Ackerman (2005) do not weight the cumulative BIT variable
by the share of outward FDI flow of the developed country partner, but our results are
similar if we include the unweighted BIT variable instead.9 They also take the natural
log of the cumulative BIT variable. We keep the variable in its level form, not least
because the log of zero (BITs) is undefined.
Our control variables are very similar to the ones used by Halward-Driemeier
(2003) and Tobin and Rose-Ackerman (2005). They are also among the ones more
consistently found to be determinants of FDI flows (Chakrabarti 2001). We include
the natural log of per capita income, the log of total population size and the economic
growth rate as indicators of market size and market potential (data from World Bank
2003).10 Developing countries, which have concluded a free trade agreement with a
developed country, might receive more FDI as it is easier to export goods back into
the developed or other countries. Such agreements sometimes also contain provisions
on policies that might be beneficial to foreign investors. We account for this with a
dummy variable indicating whether a country is a member of the World Trade
Organization as well as a variable counting the number of bilateral trade agreements a
developing country has concluded with the US, the European Community/European
Union or Japan, based on information contained in WTO (2004) and EU (2004).11
17

The inflation rate is a proxy variable for macroeconomic stability. In sensitivity
analysis we also included trade openness and the secondary enrollment ratio, but these
two variables are not included in the main analysis due to loss of observations
following their inclusion. Data are taken from World Bank (2003a). We employ a
measure of natural resource intensity to control for the fact that, all other things equal,
large natural resources are a major attractor to foreign investors. Our measure is equal
to the sum of rents from mineral resource and fossil fuel energy depletion divided by
gross national income, as reported in World Bank (2003b). Rents are estimated as (P–
AC)*R, that is, as price minus average cost multiplied by the amount of resource
extracted, an amount known as total Hotelling rent in the natural resource economics
literature.
There is a long tradition of studies analyzing the effect of political stability and
institutional quality on FDI inflows (see, for example, Schneider and Frey 1985;
Alesina and Perotti 1996; Wheeler and Mody 2000; Perry 2000; Globerman and
Shapiro 2002). We include five different measures of institutional quality in separate
estimations together with interaction effects with the BIT variable. First, we use the
political constraints (POLCON) index developed by Henisz (2000). Henisz has
designed his index as an indicator of the ability of political institutions to make
credible commitments to an existing policy regime, which he argues is the most
relevant political variable of interest to investors. Building on a simple spatial model
of political interaction, the index makes use of the structure of government in a given
country and the political views represented by the different levels of government (i.e.
the executive and the lower and upper legislative chambers). It measures the extent to
which political actors are constrained in their choice of future policies by the
existence of other political actors with veto power who will have to consent. Using
18

information on party composition of the executive and the legislative branches allows
taking into account how alignment across branches of government and the extent of
preference heterogeneity within each legislative branch impacts the feasibility of
policy change. Scores range from 0, which indicates that the executive has total
political discretion and could change existing policies at any point of time, to 1, which
indicates that a change of existing policies is totally infeasible. Of course, in practice
agreement is always feasible, so the maximum score is less than 1.
The remaining measures of institutional quality are all compiled from the
International Country Risk Guide (ICRG), published by the Political Risk Services
(PRS) Group (www.prsgroup.com). They are the investment profile index, the index
of government stability, an index of law and order as well as ICRG’s composite
political risk index. These data are available from 1984 onwards and have the widest
country coverage of all the sources for country risk ratings. The composite political
risk index incorporates the other indices. The index varies from 0 (high risk) to 100
(low risk). The full composite political index or a comparable measure is more
commonly used in studies investigating the determinants of FDI and BITs than the
individual sub-components (see for example Alesina and Perotti 1996, Wheeler and
Mody 1992, UNCTAD 1998, Tobin and Rose-Ackerman 2005). However, as
mentioned already, it also includes many items that are not strictly speaking relevant
to institutional quality such as indicators of socioeconomic conditions, measures of
conflict and ethnic tensions, and measures of military and religious involvement in the
political process – see appendix 2 for a detailed description of this variable. The
composite index is therefore strictly speaking not purely a measure of institutional
quality. For this reason, we also employ the three sub-components most relevant to
investors and most closely connected to BIT provisions. The investment profile index
19
varies from 0 to 12, 12 representing very low risk and 0 indicating very high risk. The
index is made of ratings on 3 separate elements, each receiving equal weight: contract
viability (risk of expropriation), profit repatriation and payment delays. Similar to the
investment profile index, the government stability index varies from 0 (high risk) to
12 (low risk) and is composed of three elements that receive equal weight:
government unity, legislative strength and popular support. The law and order index
runs from 0 (worst) to 6 (best) and consists of a law component measuring the
strength and impartiality of the legal system and an order component measuring the
extent of popular observance of the law.
(c) Estimation technique
We estimate both random-effects and fixed-effects models, in which case we can
employ robust standard errors. We suspect that there are factors making a country
attractive to foreign investors that are not captured by our explanatory variables and
that are (approximately) time-invariant, such as colonial history, culture, language,
climate, geographical distance to the centers of the Western developed world, legal
restrictions on inward FDI etc. Hausman tests, which test the random-effects
assumption that these time-invariant factors are uncorrelated with the explanatory
variables, by and large reject the assumption. We therefore focus on the fixed-effects
estimation results. To mitigate potential reverse causality problems, we lag all
explanatory variables by one period. Ideally, one would like to tackle this problem
more comprehensively with the help of instrumental variable regression. However,
practically all explanatory variables are potentially subject to reverse causality and it
would be simply impossible to find adequate and valid instruments. Table 1 provides
summary descriptive variable information together with a bivariate correlation matrix.
20

Variance inflation analysis did not suggest reason for concern with multicollinearity
problems. As in any regressions analysis, there is of course always the possibility of
omitted variable bias. For example, we cannot account for over-time changes in
domestic legislation encouraging or discouraging FDI other than what is captured by
BITs as there is no comprehensive information available. However, we see no reason
why this or any other potentially omitted variable should be systematically correlated
with our explanatory variables to an extent that our results would be significantly
biased.
< Insert Table 1 around here >
5. RESULTS
Table 2 presents random-effects estimation results for the logged amount of FDI in
US$ of 1996 flowing to a country as the dependent variable. Column I starts with
POLCON as the measure of institutional quality. Most variables test in accordance
with theoretical expectations. Countries with a higher cumulative number of BITs,
richer countries with fast-growing economies and larger populations receive more
FDI. So do countries that are more intensive in natural resource extraction, that are
members of the WTO and have a higher number of trade agreements with developed
countries. A higher inflation rate deters FDI. The POLCON variable is statistically
insignificant. How to interpret this result? With interaction terms included, one cannot
interpret the coefficients on the individual components in the conventional way.
Instead, the coefficient on POLCON in a model with a significant interaction term
BITs*POLCON is the effect of POLCON on FDI when the BIT variable is zero (see
Braumoeller (2004) for a nice exposition). It follows from our estimations that
institutional quality as measured by POLCON has no effect on FDI in the absence of
21
BITs. The interaction term is marginally significant, however, suggesting that
institutional quality as measured by POLCON and BITs are complements since the
positive effect of cumulative BIT signature is higher when the POLCON index is high
as well.
< Insert Table 2 around here >
In column II we replace Henisz’s (2000) policy constraints variable with the
ICRG’s composite political risk index (where higher values on the index mean lower
risk). Note the significant drop in the number of observations. This is not so much due
to a loss of countries included in the sample, which drops from 120 to 91, but due to
the fact that we lose all observations before 1984, the first year for which this variable
has been coded. Despite the substantial reduction in sample size, the weighted sum of
BITs variable is statistically significant with the expected positive sign. Results on the
other variables are also relatively consistent in terms of sign and statistical
significance of variables, but the trade agreement variables are no longer statistically
significant. There is one further important further exception: The interaction term
between institutional quality and our BIT variable is now statistically significant with
a negative coefficient sign. This would suggest that BITs function as substitutes for
high domestic institutional quality since the positive effect of cumulative BIT
signature is higher when the ICRG composite index is low, that is, in high-risk
environments. Importantly, while the positive effect of BITs on FDI decreases as
political risk is reduced, the effect always remains positive, even at very low levels of
risk.12 In the remaining columns, we replace the ICRG’s composite index with the
selected individual sub-components. In column III, we look at a country’s investment
profile, in column IV at a country’s governmental stability and in column V at its
degree of law and order, respectively. Results are largely consistent with the ones for
22

the ICRG composite index. Importantly, the weighted cumulative number of signed
BITs is always statistically significant with the expected positive sign. However, the
interaction term is not statistically significant for these sub-components of the ICRG
composite index. The Hausman test fails to reject the random effects assumption only
in column I, which underlines the importance of controlling for country fixed effects.
Table 3 therefore reports results from fixed-effects estimation.
< Insert Table 3 about here >
Fixed-effects estimation results are rather similar to the ones from random-effects
estimation with two important exceptions. First, the interaction term between
POLCON and the BIT variable is now insignificant, whereas the interaction term with
governmental stability is significant and negative, suggesting that BITs and
governmental stability function as substitutes. As before, the positive effect of BITs
on FDI becomes smaller the more stable governments are, but never to an extent that
the effect would become negative. Second, the log of population size now switches
signs and is statistically significant with a negative coefficient. Keeping in mind that
the fixed effects estimation is based on the within-variation of the data in each country
only, whereas the random effects estimation is based on both cross-country and
within-variation, this can be interpreted to the effect that countries with larger
populations receive more FDI conditional on the other explanatory variables, but as a
country’s population grows, it receives less rather than more FDI conditional on the
other explanatory variables and the country-specific fixed effects.
Table 4 presents results for the logged country share of developing country FDI as
the dependent variable. The reported results are based on fixed-effects estimation,
since Hausman tests overwhelmingly rejected the random-effects assumption in all
cases. Results are very, very similar to the ones reported above for the other
23

dependent variable. In particular, a higher cumulative number of signed BITs is
associated with a higher share of FDI inflows. So is institutional quality with the
exception of POLCON. As before, there is some limited evidence that BITs and
institutional quality are substitutes for each other, but the interaction term is only
statistically significant with a negative coefficient sign for the composite ICRG index
and its governmental stability sub-component.
< Insert Table 4 around here >
6. SENSITIVITY ANALYSIS
Lagging the explanatory variables by one year mitigates potential simultaneity bias,
but this lag length is somewhat arbitrary. The positive impact of the BIT variable on
FDI inflows is maintained if the lag length is two, three or four years instead.13 Tobin
and Rose-Ackerman (2005) use five-year period averages to avoid the impact of year-
to-year variation. Maintaining a lag of one year, but averaging the data over five-year
periods does not dramatically change our results as the fixed-effects estimation results
reported in table 5 attest to, with the share of developing country FDI inflow as the
dependent variable. With less variation in the data, we are not surprised to find that
some variables lose statistical significance. Importantly, however, the BIT variable
remains statistically significant with the expected positive sign throughout. The
institutional variables and interaction terms also test almost as before in terms of sign
and whether they are statistically significantly different from zero. The exception is
the interaction between the BIT variable and governmental stability, which is only
marginally insignificant, however.
< Insert Table 5 around here >
24

In further non-reported sensitivity analysis, we briefly explored the issue of
whether BITs are all about a signaling effect. Maybe the only thing that matters is that
a developing country has signed one BIT (perhaps with a major capital exporter) and
signing any more BITs has no additional effect. When we added a dummy variable
that is set to one in case a developing country has signed a BIT with any developed
country, then this dummy variable was statistically significant with the expected
positive sign. However, as before, the weighted cumulative sum of BITs remained
positive and statistically significant as well with its magnitude only slightly reduced.
This remains true if we replace the dummy variable with one for BITs signed with
any of the six major capital exporters, namely France, Germany, Japan, the
Netherlands, the UK and the US. We interpret this as further evidence that BITs are
likely to fulfill the dual function of both signaling and commitment.
Next, we checked whether our main results are due to the presence of problematic
countries. In particular, we excluded all Eastern European and former Soviet Union
countries from the sample since, with the exception of Hungary, these countries do
not seem to be included in the analysis by Tobin and Rose-Ackerman (2005).
However, results hardly change. We also excluded countries with a population size of
less than one million from the sample to eliminate the influence of very small
countries, but the results were hardly affected. We even restricted the list of countries
to be exactly the same as in Tobin and Rose-Ackerman (2005) and still found a
positive effect of BITs on FDI throughout, with one exception (investment profile as
measure of institutional quality), in which case the BIT variable is marginally
insignificant with a positive coefficient sign. This holds true both in the annual and in
the five-year period model specification.
25
Next, we wanted to test more formally whether results are driven by a few
influential outliers. Belsley, Kuh and Welsch (1980) suggest that observations that
have both high residuals and a high leverage deserve special attention. We excluded
an observation if its so-called DFITS is greater than twice the square root of (k/n),
where k is the number of independent variables and n the number of observations.
DFITS is defined as the square root of (hi/(1-hi)), where hi is an observation’s
leverage, multiplied by its studentized residual. Applying this criterion leads to the
exclusion of up to 385 observations. Results are remarkably consistent, however.
In further sensitivity analysis, we also included a measure of trade openness,
which has a theoretically ambiguous effect on FDI (Taylor 2000). On one hand,
countries that are more open to trade can be more attractive host countries if the main
purpose of foreign investment is to export the goods or services produced. On the
other hand, high trade barriers could make it in a company’s best interest to locate
production within the host country in order to circumvent the import barriers. Trade
openness tested sometimes insignificant, sometimes (marginally) significant with a
negative coefficient sign in the estimations, hardly affecting the results of the other
variables. Since its inclusion would reduce the sample size by about 20 countries, we
did not include this variable in the reported estimations. Following Noorbakhsh,
Paloni and Youssef (2001), we also included the secondary enrollment ratio to
account for human capital as a determinant of FDI in non-reported analysis. The
number of observations dropped substantially, leaving results for the other variables
mainly unaffected. The enrollment ratio itself is never statistically significant, even
though it is positively signed in line with expectations.
26

7. CONCLUSION
Developing countries that sign more BITs with developed countries receive more FDI
inflows. The effect is robust to various sample sizes, model specifications and
whether or not FDI flows are normalized by the total flow of FDI going to developing
countries. There is some limited evidence that BITs function as substitutes for
institutional quality, as in a few estimations the interaction term between the
accumulated number of BIT variable and institutional quality is negative and
statistically significant. The message to developing countries therefore is that
succumbing to the obligations of BITs does have the desired payoff of higher FDI
inflows. To our knowledge, ours is the first study to provide robust empirical
evidence that BITs fulfill their stated objective. Those with particularly poor domestic
institutional quality possibly stand most to gain from BITs, but there is no robust and
consistent evidence for this.
Why do we come to different conclusions than the three other relevant studies?
Halward-Driemeier’s (2003) study does not allow for a signaling effect and suffers
from a small non-representative sample due to the dyadic research design. Salacuse
and Sullivan’s (2005) analysis is cross-sectional and therefore cannot detect how a
higher number of BITs raises the flow of FDI to signatory developing countries over
time. The difference to the results presented by Tobin and Rose-Ackerman (2005) is
more puzzling. As we noted in the sensitivity analysis, our results uphold if we adopt
their five-year period-averages approach and restrict the list of countries to be exactly
the same as in their analysis. It is therefore difficult to know where the difference
comes from. One possibility is that we do not log the number of BITs, not least
because the log of zero (BITs) is not defined. Whatever the cause, we find Tobin and
Rose-Ackerman’s (2005) result that each additional BIT lowers (rather than raises)
27

the flow of FDI to developing countries with high political risk as extremely difficult
to believe. BITs might not raise FDI flows in contexts of high risk, but there is no
reason whatsoever to expect that they should lower FDI flows.
Statistical significance is not equivalent to substantive importance. We therefore
need to know how strong is the effect of the BIT variable on FDI flows. How much
more FDI can a developing country expect if it aggressively engages in a program to
sign BITs with developed countries? To answer this question, we look at a one
standard deviation increase in the BIT variable (equivalent to an increase of around 27
in the weighted cumulative BIT variable running from 0 to 99). Since in some
regressions the interaction effect between the BIT variable and institutional quality is
statistically significant, the overall effect of signing up to BITs sometimes depends on
the level of institutional quality, in which case for simplicity we fix institutional
quality at its median.14 Based on the estimations in table 3, a country experiencing a
one standard deviation increase in the BIT variable, is predicted to increase its FDI
inflow by between 43.7 and 93.2 per cent. Based on the results from table 4, such a
country is predicted to increase its share of FDI inflow relative to the total inflow to
developing countries by between 42.0 and 104.1 per cent. Clearly, these are non-
negligible increases following a substantial increase in BIT activity. But whether the
demonstrated benefits of signing up to BITs in the form of increased FDI inflows are
higher than the substantial costs developing countries incur in negotiating, signing,
concluding and complying with the obligations typically contained in such treaties is
impossible to tell. What we do know is that BITs fulfill their purpose and those
developing countries that have signed more BITs with major capital exporting
developed countries are likely to have received more FDI in return.
28
NOTES
1 For the purpose of this article, we presume that a higher FDI inflow is beneficial to the host nation.
This presumption can of course be contested (De Soysa and Oneal 1999).
2 Expropriations without prompt, adequate and effective compensation took also place in many
Communist countries after the Second World War.
3 When developed countries tried to extend these restrictions in the context of a multilateral agreement
on investment (MAI) in the mid-1990s to banning pre-investment restrictions, performance
requirements and to extending the measures of expropriation requiring compensation to indirect and de
facto (as opposed to direct) expropriation, most developing countries were rather happy when these
negotiations imploded under the mounting critique of civil society and internal differences among
developed countries (Neumayer 2001). Many developed countries were also not too keen on granting
liberalized access to investors from other developed countries the same way they normally expect
developing countries to grant to investors from their own countries.
4 Depending on the BIT, this can refer to the country of the company’s incorporation, seat, registered
office, or principal place of business or the nationality of the individuals who have control over, or a
substantial interest in, the investing company (Salacuse and Sullivan 2005, p. 82).
5 A fourth study is provided by UNCTAD (1998). However, it is based on a purely cross-sectional
stepwise (!) regression analysis with an unspecified number of observations from 1995. Not
surprisingly, such ‘garbage can’ modelling leads to inconclusive results.
6 Their study also suffers from the absence of year-specific time dummies controlling for aggregate
annual changes in US FDI outflows, which could mean that the results are spurious.
7 If we were to take the share a developing country receives relative to the sum of global FDI instead,
then results are practically identical.
8 In future research we would like to analyze BITs in more detail. Not all BITs are the same and one
would like to know whether it is certain elements in BITs that matter for FDI location more than others.
9 This is unsurprising given the high correlation between the weighted and unweighted cumulative
count of BITs, which follows from the fact that by and large minor capital exporting developed
countries have signed few BITs, whereas the opposite is the case for major capital exporters.
29

10 Note that replacing logged population with the log of total GDP leads to identical result, which
follows from the fact that the two variables plus the log of GDP per capita are not independent of each
other.
11 We do not include the Lomé Conventions or the follow-on Cotonou Agreement between the EU and
77 countries from Africa, the Caribbean and the Pacific (ACP) since it is highly unlikely that these had
a major impact on FDI.
12 Since the coefficient of the BIT variable represents the effect of BITs when the value of institutional
quality is zero, one can re-scale the institutional quality variable such that zero represents the lowest
level of risk. At the lowest observed level of risk in the sample, the positive effect of BITs is reduced
from 0.030 (at the highest observed level of risk in the sample) to 0.011.
13 All results that are not explicitly reported are available on request.
14 Strictly speaking, the coefficient of the BIT variable always represents the effect of BITs at a zero
value of the institutional quality measure, but if the interaction term is not statistically significantly
different from zero, then, as a first approximation, it can be taken as the effect of BITs at any value of
institutional quality.
30

REFERENCES
Alesina, A. & Perotti, R. (1996). Income Distribution, Political Instability, and
Investment. European Economic Review, 40, 1203-1228.
Belsley, D.A., Kuh, E., & Welsch, R.E. (1980). Regression Diagnostics. New York:
John Wiley.
Braumoeller, B.F. (2004). Hypothesis Testing and Multiplicative Interaction Terms.
International Organization, 58, 807-820.
Chakrabarti, A (2001). The Determinants of Foreign Direct Investment: Sensitivity
Analyses of Cross-Country Regressions, Kyklos, 54, 89-114.
De Soysa, I., & Oneal, J.R. (1999). Boon or bane? Reassessing the productivity of
foreign direct investment. American Sociological Review, 64, 766-782.
Dolzer, R. & Stevens, M. (1995). Bilateral Investment Treaties. The Hague: Martinus
Nijhoff Publishers.
Dunning, J.H. (1998). The Changing Geography of Foreign Direct Investment, In N.
Kumar (Ed.): Globalization, Foreign Direct Investment and Technology Transfers:
Impacts on and prospects for developing countries. New York: Routledge.
Elkins, Z., Guzman, A. & Simmons, B. (2004). Competing for Capital: The diffusion
of bilateral investment treaties, 1960-2000. Working paper. University of Illinois,
University of California at Berkeley and Harvard University.
EU (2004). EC Regional Trade Agreements. Brussels: European Union Directorate
General Trade. http://europa.eu.int/comm/trade/index_en.htm
Globerman, S. & Shapiro, D. (2002). Global Foreign Direct Investment Flows: The
Role of Governance Infrastructure. World Development, 30, 1899-1919.
1
Ginsburg, T. (2004). International Substitutes for Domestic Institutions: Bilateral
Investment Treaties and Governance. Working Paper. University of Illinois
College of Law.
Guzman, A (1998). Why LDCs Sign Treaties That Hurt Them: Explaining the
Popularity of Bilateral Investment Treaties Virginia Journal of International Law,
38, 639-688.
Hallward-Driemeier, M (2003). Do Bilateral Investment Treaties Attract FDI? Only a
bit…and they could bite. World Bank Policy Research Paper WPS 3121. World
Bank: Washington DC.
Henisz, W. J. (2000). The institutional environment for economic growth. Economics
and Politics, 12 (1), 1-31.
Minor, M.S. (1994). The Demise of Expropriation as an Instrument of LDC Policy,
1980-1992. Journal of International Business Studies, 25, 177-188.
Neumayer, E. (2001). Greening Trade and Investment. London: Earthscan.
Neumayer, E. (2005). Self-interest, Foreign Need and Good Governance: Are
Bilateral Investment Treaty Programs Similar to Aid Allocation? Mimeo. London
School of Economics and Political Science.
Noorbakhsh, F., Paloni, A. & Youssef, A. (2001). Human Capital and FDI Inflows to
Developing Countries: New Empirical Evidence. World Development, 29, 1593-
1610.
Perry, A. (2000). Effective Legal Systems and Foreign Direct Investment: In Search
of the Evidence. International and Comparative Law Quarterly, 49, 779-799.
Peters, P. (1996). Review of Dolzer and Stevens: Bilateral Investment Treaties
Netherlands International Law Review, 43 (1), 103-108.
2

Peterson, L.E. (2004). Bilateral Investment Treaties and Development Policy-Making.
Winnipeg: International Institute for Sustainable Development.
Raghavan, C. (1997). Bilateral Investment Treaties Play Only a Minor Role in
Attracting FDI. Third World Economics, 162, 1-15 June.
Salacuse, J.W. (1990). BIT by BIT: The Growth of Bilateral Investment Treaties and
Their Impact on Foreign Investment in Developing Countries. The International
Lawyer, 24 (3), 655-675.
Salacuse, J.W. & Sullivan, Nicholas P. (2005). Do BITs Really Work?: An Evaluation
of Bilateral Investment Treaties and Their Grand Bargain. Harvard International
Law Journal, 46, 67-130.
Schneider, F. & Frey, B. (1985). Economic and Political Determinants of Foreign
Direct Investment. World Development, 13, 161-175.
Sornarajah. M. (1986). State Responsibility and Bilateral Investment Treaties. Journal
of World Trade Law, 20, 79-98.
Taylor, C.J. (2000). The Impact of Host Country Government Policy on US
Multinational Investment Decisions. The World Economy, 23, 635-647.
Tobin, J. & Rose-Ackerman, S. (2005). Foreign Direct Investment and the Business
Environment in Developing Countries: the Impact of Bilateral Investment Treaties.
Yale Law School Center for Law, Economics and Public Policy Research Paper
No. 293.
UNCTAD (1998). Bilateral Investment Treaties in the Mid-1990s. New York and
Geneva: United Nations.
UNCTAD (2001). Bilateral Investment Treaties 1959-1999. New York and Geneva:
United Nations.
3

UNCTAD (2003a). World Investment Report 2003: FDI Policies for Development
National and International Perspectives. New York and Geneva: United Nations.
UNCTAD (2003b). World Investment Directory. New York and Geneva: United
Nations.
UNCTAD (2004). World Investment Report 2004: The Shift Toward Services. New
York and Geneva: United Nations.
Vandevelde, K (1996). Review of Dolzer and Stevens: Bilateral Investment Treaties.
American Journal of International Law, 90 (3): 545-547.
Vandevelde, K (1998). The Political Economy of a Bilateral Investment Treaty The
American Journal of International Law, 92 (4), 621-641.
Vandevelde, K (2000). The Economics of Bilateral Investment Treaties. Harvard
International Law Journal, 41 (2), 469-502.
Wheeler, D. & Mody, A. (1992). International investment location decisions: the case
of U.S. Firms. Journal of International Economics, 33, 57-76.
World Bank (2003a). World Development Indicators CD Rom. Washington, DC:
World Bank.
World Bank (2003b). Adjusted Net Savings Data. Washington, DC: World Bank.
http://lnweb18.worldbank.org/ESSD/envext.nsf/44ByDocName/GreenAccounting
AdjustedNetSavings.
WTO (2004). Regional trade agreements. Geneva: World Trade Organization.
www.wto.org
Zebregs, H. (1998). Can the Neoclassical Model Explain the Distribution of Foreign
Direct Investment Across Developing Countries? IMF Working Paper WP/98/139.
Washington DC: International Monetary Fund.
4
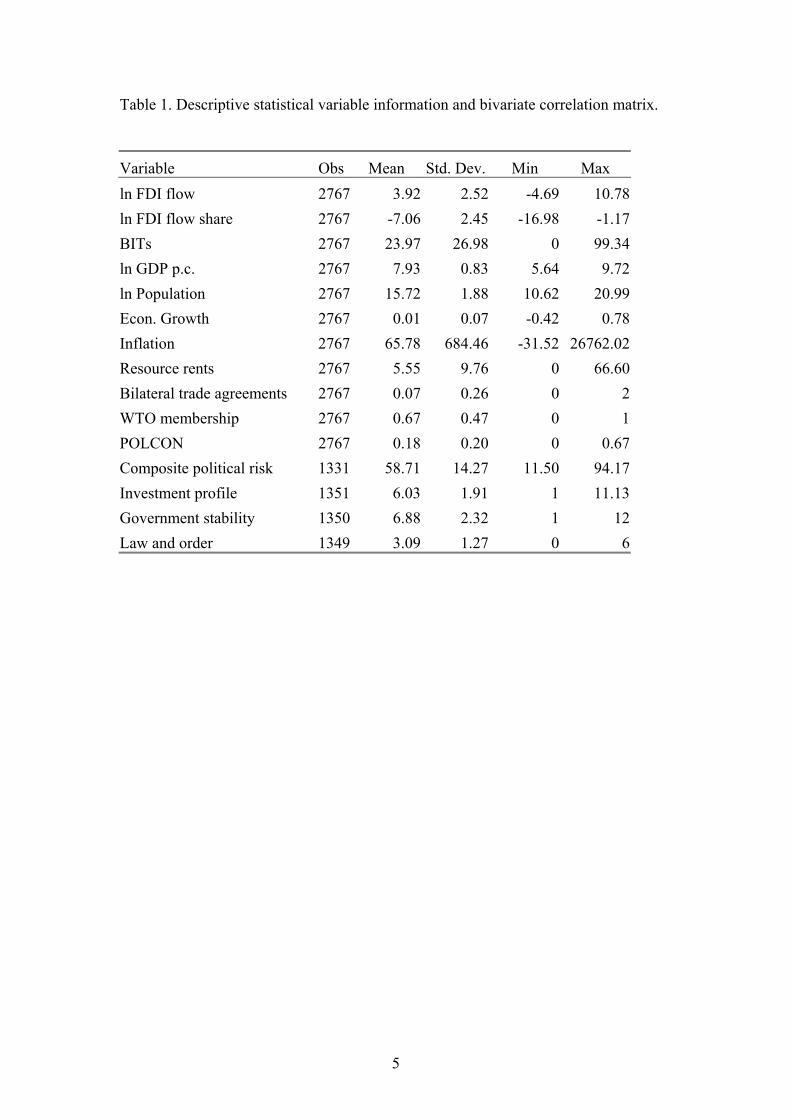
Table 1. Descriptive statistical variable information and bivariate correlation matrix.
Variable Obs Mean Std. Dev. Min Max ln FDI flow 2767 3.92 2.52 -4.69 10.78 ln FDI flow share 2767 -7.06 2.45 -16.98 -1.17 BITs 2767 23.97 26.98 0 99.34 ln GDP p.c. 2767 7.93 0.83 5.64 9.72 ln Population 2767 15.72 1.88 10.62 20.99 Econ. Growth 2767 0.01 0.07 -0.42 0.78 Inflation 2767 65.78 684.46 -31.52 26762.02 Resource rents 2767 5.55 9.76 0 66.60 Bilateral trade agreements 2767 0.07 0.26 0 2 WTO membership 2767 0.67 0.47 0 1 POLCON 2767 0.18 0.20 0 0.67 Composite political risk 1331 58.71 14.27 11.50 94.17 Investment profile 1351 6.03 1.91 1 11.13 Government stability 1350 6.88 2.32 1 12 Law and order 1349 3.09 1.27 0 6
5

I II III IV V VI VI VIII IX X XI XII XIII XIV XV
I: ln FDI flow share 1.00
II: ln FDI flow 0.95 1.00
III: BITs
0.41 0.28 1.00
IV: ln GDP p.c. 0.49 0.48 0.31 1.00
V: ln Population 0.43 0.45 0.21 -0.02 1.00
VI: Econ. Growth 0.16 0.15 0.08 0.13 0.07 1.00
VII: Inflation -0.07 -0.06 -0.05 -0.07 0.02 -0.16 1.00
VIII: Resource rents 0.09 0.14 -0.12 0.13 0.07 -0.04 0.02 1.00
IX: Bilateral trade agreements 0.21 0.15 0.30 0.30 0.05 0.03 -0.03 0.04 1.00
X: WTO membership 0.07 0.02 0.05 -0.03 0.02 -0.02 0.02 -0.21 -0.09 1.00
XI: POLCON 0.36 0.28 0.16 0.41 -0.02 0.08 -0.02 -0.13 0.08 0.19 1.00
XII: Investment profile 0.38 0.23 0.26 0.33 0.04 0.14 -0.12 -0.08 0.22 0.18 0.29 1.00
XIIII: Government stability 0.31 0.19 0.25 0.29 -0.02 0.14 -0.15 -0.09 0.20 0.20 0.24 0.49 1.00
XIV: Law and order 0.35 0.17 0.37 0.28 0.07 0.15 -0.12 0.00 0.23 0.04 0.18 0.58 0.68 1.00
XV: Composite political risk 0.40 0.28 0.28 0.38 0.03 0.15 -0.10 -0.05 0.24 0.03 0.22 0.58 0.35 0.46 1.00
6
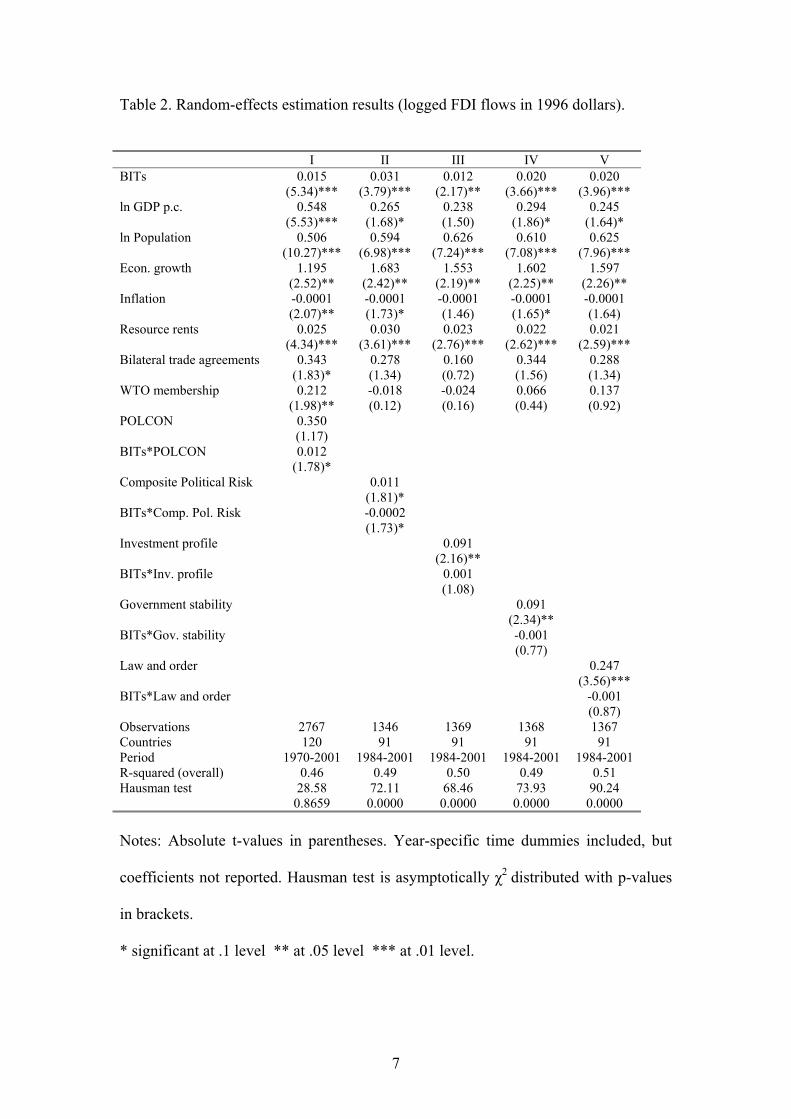
Table 2. Random-effects estimation results (logged FDI flows in 1996 dollars).
I II III IV V BITs 0.015 0.031 0.012 0.020 0.020 (5.34)*** (3.79)*** (2.17)** (3.66)*** (3.96)*** ln GDP p.c. 0.548 0.265 0.238 0.294 0.245 (5.53)*** (1.68)* (1.50) (1.86)* (1.64)* ln Population 0.506 0.594 0.626 0.610 0.625 (10.27)*** (6.98)*** (7.24)*** (7.08)*** (7.96)*** Econ. growth 1.195 1.683 1.553 1.602 1.597 (2.52)** (2.42)** (2.19)** (2.25)** (2.26)** Inflation -0.0001 -0.0001 -0.0001 -0.0001 -0.0001 (2.07)** (1.73)* (1.46) (1.65)* (1.64) Resource rents 0.025 0.030 0.023 0.022 0.021 (4.34)*** (3.61)*** (2.76)*** (2.62)*** (2.59)*** Bilateral trade agreements 0.343 0.278 0.160 0.344 0.288 (1.83)* (1.34) (0.72) (1.56) (1.34) WTO membership 0.212 -0.018 -0.024 0.066 0.137 (1.98)** (0.12) (0.16) (0.44) (0.92) POLCON 0.350 (1.17) BITs*POLCON 0.012 (1.78)* Composite Political Risk 0.011 (1.81)* BITs*Comp. Pol. Risk -0.0002 (1.73)* Investment profile 0.091 (2.16)** BITs*Inv. profile 0.001 (1.08) Government stability 0.091 (2.34)** BITs*Gov. stability -0.001 (0.77) Law and order 0.247 (3.56)*** BITs*Law and order -0.001 (0.87) Observations 2767 1346 1369 1368 1367 Countries 120 91 91 91 91 Period 1970-2001 1984-2001 1984-2001 1984-2001 1984-2001 R-squared (overall) 0.46 0.49 0.50 0.49 0.51 Hausman test 28.58
0.8659 72.11 0.0000
68.46 0.0000
73.93 0.0000
90.24 0.0000
Notes: Absolute t-values in parentheses. Year-specific time dummies included, but
coefficients not reported. Hausman test is asymptotically χ2 distributed with p-values
in brackets.
* significant at .1 level ** at .05 level *** at .01 level.
7

Table 3. Fixed-effects estimation results (logged FDI flows in 1996 dollars).
I II III IV V BITs 0.016 0.033 0.015 0.025 0.020 (4.23)*** (3.68)*** (2.93)*** (4.52)*** (3.98)*** ln GDP p.c. 1.916 3.771 3.304 4.052 3.691 (4.04)*** (4.37)*** (3.60)*** (4.47)*** (4.21)*** ln Population -1.344 -4.942 -4.513 -5.176 -5.033 (2.66)*** (5.21)*** (4.51)*** (5.19)*** (5.24)*** Econ. growth 1.134 2.372 2.366 2.343 2.464 (1.81)* (3.35)*** (3.13)*** (3.12)*** (3.24)*** Inflation -0.0001 -0.0001 -0.0001 -0.0001 -0.0001 (3.16)*** (2.36)** (2.18)** (2.41)** (2.48)** Resource rents 0.030 0.036 0.031 0.031 0.028 (3.63)*** (2.96)*** (2.41)** (2.47)** (2.16)** Bilateral trade agreements 0.532 0.119 0.061 0.289 0.199 (2.17)** (0.66) (0.32) (1.44) (1.02) WTO membership 0.218 -0.081 -0.111 -0.047 0.027 (1.98)** (0.52) (0.73) (0.31) (0.18) POLCON 0.233 (0.71) BITs*POLCON 0.011 (1.29) Composite Political Risk 0.014 (2.05)** BITs*Comp. Pol. Risk -0.0003 (2.17)** Investment profile 0.117 (2.84)*** BITs*Inv. profile -0.000 (0.01) Government stability 0.128 (2.88)*** BITs*Gov. stability -0.001 (2.12)** Law and order 0.290 (4.13)*** BITs*Law and order -0.002 (1.14) Observations 2767 1346 1369 1368 1367 Countries 120 91 91 91 91 Period 1970-2001 1984-2001 1984-2001 1984-2001 1984-2001 R-squared (within) 0.22 0.30 0.30 0.30 0.30 Notes: Absolute t-values in parentheses. Year-specific time dummies included, but
coefficients not reported. Robust standard errors.
* significant at .1 level ** at .05 level *** at .01 level.
8
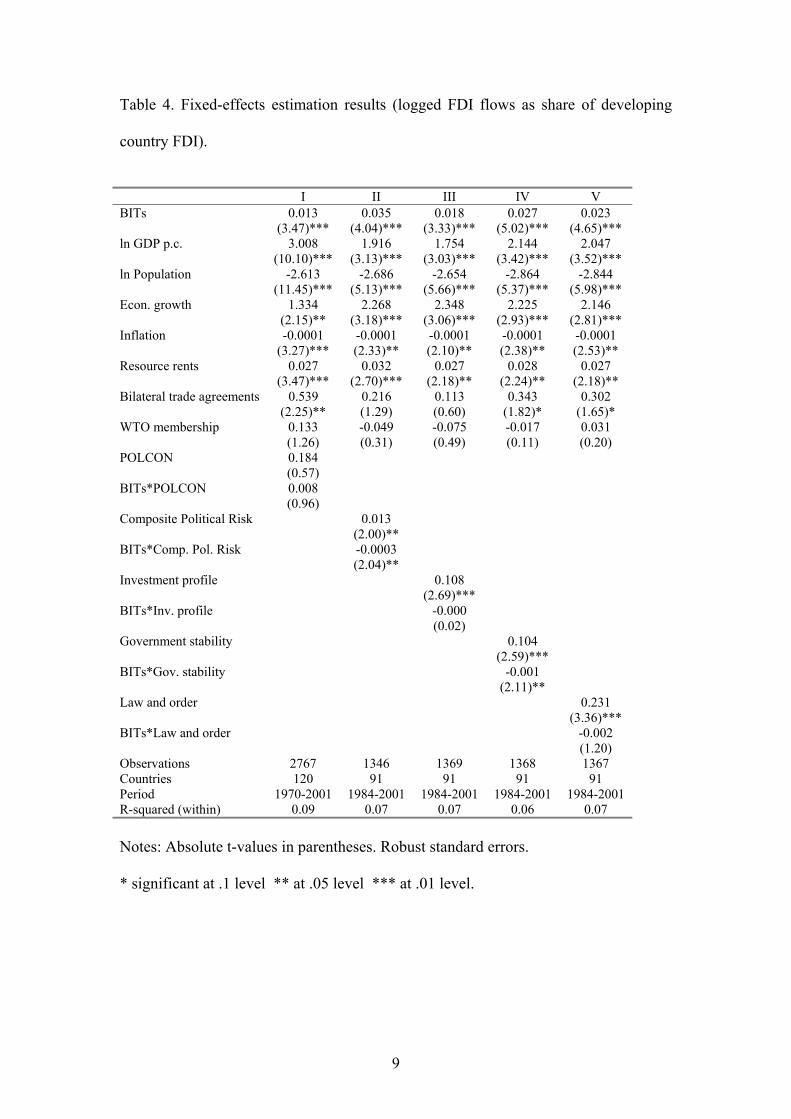
Table 4. Fixed-effects estimation results (logged FDI flows as share of developing
country FDI).
I II III IV V BITs 0.013 0.035 0.018 0.027 0.023 (3.47)*** (4.04)*** (3.33)*** (5.02)*** (4.65)*** ln GDP p.c. 3.008 1.916 1.754 2.144 2.047 (10.10)*** (3.13)*** (3.03)*** (3.42)*** (3.52)*** ln Population -2.613 -2.686 -2.654 -2.864 -2.844 (11.45)*** (5.13)*** (5.66)*** (5.37)*** (5.98)*** Econ. growth 1.334 2.268 2.348 2.225 2.146 (2.15)** (3.18)*** (3.06)*** (2.93)*** (2.81)*** Inflation -0.0001 -0.0001 -0.0001 -0.0001 -0.0001 (3.27)*** (2.33)** (2.10)** (2.38)** (2.53)** Resource rents 0.027 0.032 0.027 0.028 0.027 (3.47)*** (2.70)*** (2.18)** (2.24)** (2.18)** Bilateral trade agreements 0.539 0.216 0.113 0.343 0.302 (2.25)** (1.29) (0.60) (1.82)* (1.65)* WTO membership 0.133 -0.049 -0.075 -0.017 0.031 (1.26) (0.31) (0.49) (0.11) (0.20) POLCON 0.184 (0.57) BITs*POLCON 0.008 (0.96) Composite Political Risk 0.013 (2.00)** BITs*Comp. Pol. Risk -0.0003 (2.04)** Investment profile 0.108 (2.69)*** BITs*Inv. profile -0.000 (0.02) Government stability 0.104 (2.59)*** BITs*Gov. stability -0.001 (2.11)** Law and order 0.231 (3.36)*** BITs*Law and order -0.002 (1.20) Observations 2767 1346 1369 1368 1367 Countries 120 91 91 91 91 Period 1970-2001 1984-2001 1984-2001 1984-2001 1984-2001 R-squared (within) 0.09 0.07 0.07 0.06 0.07 Notes: Absolute t-values in parentheses. Robust standard errors.
* significant at .1 level ** at .05 level *** at .01 level.
9

Table 5. Five-year period averages fixed-effects estimation results (logged FDI flows
as share of developing country FDI).
I II III IV V BITs 0.014 0.048 0.030 0.042 0.034 (2.15)** (3.80)*** (2.91)*** (4.16)*** (3.68)*** ln GDP p.c. 3.036 1.948 1.792 2.099 1.957 (6.47)*** (2.33)** (2.17)** (2.39)** (2.47)** ln Population -2.601 -2.766 -2.702 -2.849 -2.944 (6.92)*** (3.50)*** (3.63)*** (3.58)*** (4.25)*** Econ. growth 4.337 3.488 3.300 3.564 4.014 (2.14)** (1.21) (1.03) (1.11) (1.29) Inflation -0.0001 -0.0001 -0.0001 -0.0001 -0.0001 (1.95)* (0.97) (1.06) (1.21) (1.23) Resource rents 0.029 0.039 0.042 0.045 0.045 (1.94)* (1.55) (1.69)* (1.90)* (1.84)* Bilateral trade agreements 1.112 0.482 0.336 0.634 0.530 (2.26)** (1.33) (0.79) (1.50) (1.38) WTO membership 0.242 -0.245 -0.231 -0.146 -0.099 (1.17) (0.82) (0.77) (0.49) (0.34) POLCON -0.066 (0.10) BITs*POLCON 0.008 (0.49) Composite Political Risk 0.020 (1.72)* BITs*Comp. Pol. Risk -0.000 (1.79)* Investment profile 0.138 (1.64)* BITs*Inv. profile -0.001 (0.37) Government stability 0.127 (1.71)* BITs*Gov. stability -0.002 (1.61) Law and order 0.341 (3.01)*** BITs*Law and order -0.002 (0.91) Observations 637 317 314 314 314 Countries 120 91 91 91 91 Period 1970-2001 1984-2001 1984-2001 1984-2001 1984-2001 R-squared (within) 0.19 0.19 0.20 0.19 0.21 Notes: Absolute t-values in parentheses. Robust standard errors.
* significant at .1 level ** at .05 level *** at .01 level.
10

Figure 1.
0
500
1000
1500
2000
2500
1960
1963
1966
1969
1972
1975
1978
1981
1984
1987
1990
1993
1996
1999
2002
Year
Num
ber
of B
ITs
BITs Signed Per Year BITs Signed Cumulative
Source: UNCTAD (2003b).
11

Appendix 1. List of countries included in sample.
Albania, Algeria, Angola, Antigua and Barbuda, Argentina, Armenia, Azerbaijan,
Bangladesh, Belarus, Belize, Benin, Bolivia, Botswana, Brazil, Bulgaria, Burkina
Faso, Burundi, Cambodia, Cameroon, Cape Verde, Central African Republic, Chad,
Chile, China, Colombia, Comoros, Congo (Dem. Rep.), Congo (Rep.), Costa Rica,
Côte d'Ivoire, Croatia, Czech Republic, Dominica, Dominican Republic, Ecuador,
Egypt, El Salvador, Equatorial Guinea, Estonia, Ethiopia, Fiji, Gabon, Gambia,
Georgia, Ghana, Grenada, Guatemala, Guinea, Guinea-Bissau, Guyana, Haiti,
Honduras, Hungary, India, Indonesia, Iran, Jamaica, Jordan, Kazakhstan, Kenya,
Korea (Rep.), Kyrgyz Republic, Latvia, Lebanon, Lesotho, Lithuania, Macedonia
FYR, Madagascar, Malawi, Malaysia, Mali, Mauritania, Mauritius, Mexico, Moldova,
Morocco, Mozambique, Namibia, Nepal, Nicaragua, Niger, Nigeria, Pakistan,
Panama, Papua New Guinea, Paraguay, Peru, Philippines, Poland, Romania, Russian
Federation, Rwanda, São Tomé and Principe, Senegal, Seychelles, Sierra Leone,
Slovak Republic, South Africa, Sri Lanka, St. Kitts and Nevis, St. Lucia, St. Vincent
and the Grenadines, Swaziland, Syria, Tanzania, Thailand, Togo, Trinidad and
Tobago, Tunisia, Turkey, Uganda, Ukraine, Uruguay, Uzbekistan, Venezuela,
Vietnam, Yemen, Zambia, Zimbabwe.
12

Appendix 2. ICRG’s Composite Political Risk Index.
POLITICAL RISK COMPONENTS Sequence Component Max. points
A Government Stability 12 B Socioeconomic Conditions 12 C Investment Profile 12 D Internal Conflict 12 E External Conflict 12 F Corruption 6 G Military in Politics 6 H Religion in Politics 6 I Law and Order 6 J Ethnic Tensions 6 K Democratic Accountability 6 L Bureaucracy Quality 4
Total 100
Source: www.prsgroup.com
13