Do bank-affiliated P&C insurers perform better? An ... ANNUAL MEETINGS/2018-Milan... ·...
46
1 Do bank-affiliated P&C insurers perform better? An empirical investigation Suggested short title: Do bank-affiliated P&C insurers perform better?
Transcript of Do bank-affiliated P&C insurers perform better? An ... ANNUAL MEETINGS/2018-Milan... ·...

1
Do bank-affiliated P&C insurers perform better?
An empirical investigation
Suggested short title: Do bank-affiliated P&C insurers perform better?

2
Abstract
In the last years European banks have entered the high margin P&C insurance business by
means of selling agreements with insurers and through stock holdings in captive insurance
firms whose main distribution channel is their parent banks’ branch network. This article
sheds light on these insurance companies’ performance, by means a sample comprising all
Italian P&C insurers operating in the country during the 2005-2015 timeframe. Our data show
that bank-affiliated insurers pay higher distribution costs, presumably shifting profits to parent
banks through fees. They also have a higher underwriting profitability than other insurers.
However, our evidence seems to imply that this might be due more to their ability at
transferring costs to policyholders than to their selection expertise, as bank-affiliated insurers
exhibit a more intensive use of passive reinsurance, pointing at poorer risk management skills.
Overall, our results seem to indicate that bank affiliation per se is counterproductive.

3
JEL Classification
G21, G22, L25, M21.
Keywords
Non-life insurance performance; Bancassurance; Non-life policies. P&C insurers; P&C
insurers’ profitability;

4
1. Introduction:
The debate about the merits of combining the traditional banking with other financial
activities has a long story. Proponents of financial liberalization score an important point
when, in order to foster the creation of an integrated market for financial services in Europe,
the EU Second Banking Directive was enacted in 1989. The directive set the conditions for
the entrance of (mostly) specialized national financial players into foreign markets and for the
creation of full-fledged financial conglomerates combining banking, insurance and securities
related activities.
Bancassurance is the word used to refer to the cooperation between banks and insurers
aimed at profiting from cross - selling opportunities created after 1989. It is mostly due to
banks’ entrance in the insurance industry. European banks swiftly took advantage from the
new regulatory framework. Insurers were not as assertive, also due to their dedicated
distribution networks, which are less versatile, and mostly decided to stick to their usual
business.
Even though individual banks may pursue different strategies and the national context
has an impact on its spread, todays’ bancassurance relevance is undisputed in both developed
and emerging economies1. However, while the selling of life insurance products by banks is
an established fact, banks’ interest in P&C products is more recent.
Since the 1990s, in France and the UK only at first and later in other countries too,
European banks have sold payment protection insurance policies - a.k.a. PPI products - linked
1 Fiordelisi and Ricci 2012; Sreesha 2015; Liang and Ching 2015.
5
to loans granted to customers. PPI policies are designed by an instructed insurer to protect the
lender from the borrowers’ default. These products include both life policies covering the
borrower’s death risk and non-life policies addressing various risks related to the borrower’s
health and business or professional activity. Temporary or permanent disability insurance,
health insurance and unemployment insurance are typically part of the package. PPIs may
also include a protection on the value of the loan collateral – i.e. mortgage loans have often
property policies attached2.
While purely protective non-life insurance products sold independently from credit
products (a.k.a. stand-alone policies) commanded lower priority in the past, data on European
bank branches’ annual premium market share show that this is not the case anymore: banks
have entered new lines of business such as motor and travel insurance3. Lasting low interest
rates make both the traditional banking and the life insurance business less profitable and
banks seek to enhance their performances entering the higher margin P&C insurance industry.
The range of stand-alone policies offered through banks in part covers the same risks
covered by PPI policies, from health to property risks. However, the product design is not
ancillary to any financial product. The customer or her damaged counterparties are the only
beneficiaries of the claim repayment. The risks insured by stand-alone policies include the
following: Health, (Critical illness, Medical expenses, Personal accident, Permanent
disability), Unemployment (loss of income) but also Travel, Property and Motor.
As far as the insurance and the banking activities are concerned, financial
conglomerates do not usually carry out the full range of services as in-house departments. On
one hand, national laws may still require that a specialized player take care of the
underwriting part of the process - as it happens in Italy. On the other hand, even when
2 Artikis et al. 2008. 3 Insurance Europe, 2016.

6
allowed to operate in house the entire financial business, as in Germany, conglomerates
usually combine banking and insurance activities via a separately capitalized subsidiary of
either an insurer or a bank.
Three different types of insurers perform P&C policies underwriting. First, bank-
affiliated ones, i.e. insurance companies whose shares are held by one or more banks. Parent
banks exploit the controlled insurance companies’ underwriting powerhouse to design
products (mostly) targeted to their customers and mainly (but not exclusively) sold through
their branch networks. Second, non-bank-affiliated insurers (a.k.a traditional insurers) who
signed commercial agreements with banks but also operate their own distribution networks -
through which they mostly sell their products. Last, traditional P&C insurers who do not
cooperate with banks.
While the academic literature has examined the role and performance of banks and
bank-affiliated insurers in the life industry, the exploration of banks and bank-affiliated
insurers’ behaviour and performance in the P&C sector is very limited. We want to contribute
to this investigation, by analysing the performance and its determinants for bank-affiliated
and traditional P&C insurers.
In particular, this article intends to shed light on non-life bank-affiliated insurers’
performance. First, we want to ascertain whether their profitability is different from P&C
traditional insurers’ profitability. Second, we want to examine the determinants of bank-
affiliated P&C firms’ performance in order to explain it, comparing their competitive
positioning with respect to traditional insurers’.
Spotorno et al. 2016 found that during the period 2003-2012 Italian bank-affiliated life
insurers were able to capitalize on their parent banks’ extensive distribution networks to save
on acquisition costs and that their product portfolio composition was in part different from the

7
one featured by traditional insurers, possibly to better serve bank customers’ needs.
Moreover, the proprietary link with a parent bank benefited life insurers’ performance per se.
In this paper, we investigate if that is the case for P&C insurers too. In our sample
bank-affiliated insurers’ product mix focus on risk coverage products that are mostly suitable
to retail customers, which is consistent with sales to bank customers through bank networks.
Bank-affiliated insurers’ product mix composition is different from traditional insurers’,
whose portfolios include a fair share of policies that target corporate customers, whose needs
are more complex and risks more nuanced than in the retail case. Unexpectedly, though in
line with the anecdotal evidence coming from the UK regarding PPI policies selling practices,
we found that bank-affiliated P&C insurers are less efficient than traditional ones also due to
their higher selling costs. They are also on average more reliant on passive reinsurance, even
if that is detrimental to performance, suggesting average poorer risk management abilities
than traditional insurers. On the other hand, they are more profitable at the underwriting level
- even if we suspect that this result comes from their higher ability at shifting costs to
customers and not from superior selection skills. Moreover, our analysis suggest that bank
affiliation per se impairs performance.
Our work contributes to the existing literature on bancassurance in several ways.
First, we present evidence on the relationship between their shareholders’ nature and P&C
insurers’ performance. Second, we uncover the way banks operate in the P&C insurance
sector through controlled companies: our results show that the competitive levers that banks
employ in the non-life insurance industry are different from the ones they are able to exploit
when confronting life insurers. Third, our analysis highlights that, possibly due to the peculiar
nature of the non-life business P&C deserves an autonomous investigation. Research works

8
examining the link between banks and insurers that do not recognize P&C distinctiveness
might produce flawed conclusions.
The structure of the paper is the following. The next section contains the literature
review. The third one depicts our research questions and the methodology we use. The fourth
section presents and comments on the results of our descriptive analysis while the fifth one
contains our multivariate regression analysis and its results discussion. Conclusions follow.
2. Literature review
Very little research is devoted to bancassurance activity in the non-life insurance
sector even though the phenomenon is sizeable, at least in Europe. According to Insurance
Europe4, in most Western European countries the bancassurance share in the distribution of
non-life policies lies between 5% to 15%, with Portugal (16,6%), France (13%) and Spain
(10,5%) leading the pack in 2015.
A few articles focus on banks’ sale of P&C policies attached to loans (PPI products).
As mentioned above, these contracts are meant to protect the lending bank in case of certain
negative events affecting either the borrower’s ability to repay the loan or the value of the
loan collateral. However, this literature focuses on the effect on loan interest rates5 and on the
mis-selling of these products by banks6 due to both the limitations in coverage7 and to their
high complexity and opaqueness8. These articles limit their analysis to either the bank or the
borrower point of view and do not consider the impact of banks’ PPIs selling activity on the
insurance companies underwriting the products. 4 Insurance Europe (2016). 5 Ashton and Hudson (2014). 6 Ashton and Hudson (2017). 7 Burchardt and Hills (1998). 8 FSA (2012).

9
Some works tackle the general issue of banks’ profitability linked to the cross selling
of non-bank products. However, these papers do not specifically deal with P&C insurance.
Research works examine either financial conglomerates overall profitability and efficiency9
or, when explicitly considering insurance, investigate the impact of cross selling life insurance
products only10.
Other authors investigate if there is any positive consequence on risk and return for
stockholders coming from the diversification effect due to the combination of the banking
business with the insurance business. Apart from papers dealing with product-line
diversification opportunities impact on the insurance business as a whole11, some works
specifically deal with the benefits coming from integrating the traditional bank with the non-
life insurance activity. In theory, the low correlation between the above activities should
allow the combined entity to stabilize earnings, enjoying a lower risk exposure. However,
empirical results do not always confirm this intuition. While Santomero and Chung12 and also
Boyd13 find that banks operating in the non-life insurance underwriting enjoy some risk
reduction, opposite results are obtained by Lown14 and by Nurullah and Staikouras15.
According to the latter, evidence from Europe shows that entering the non-life insurance
business significantly increase return volatility and the probability of bankruptcy for the
controlling bank while not benefiting its profitability.
9 for example see Vander Vennet (2002). 10 for example Fiordelisi and Ricci (2011), Chang et al. (2011). 11 such as Yildirim et al. (2006) and Elyasiani et al. (2015). 12 Santomero and Chung (1992). 13 Boyd et al. (1993). 14 Lown et al. (2000). 15 Nurullah and Staikouras (2008).

10
3. Research question, data and methodology
3.1 Research question and relevance of the present study
Are bank-affiliated P&C insurers different from traditional ones? And how relevant is
being “bank-affiliated” for succeeding in the non-life insurance business?
In this article, we answer the above questions by analysing the performances of Italian
non-life insurers from 2005 to 2015. We perform a descriptive analysis that help us single out
the features of bank-affiliated insurers, contrasting them with the traditional insurers’ ones
and we examine the impact that bank affiliation, distribution costs, claims, diversification and
age had on P&C insurers’ financial performance.
Our empirical evidence offers some interesting results that can enrich different streams
of literature.
First, ours is one of the few studies dealing with bancassurance that considers the
insurers’ point of view.
Second, the sale of a broad array of products, aiming at completing the range offered
to customers, can be accomplished by various means. The literature has examined the impact
of contractual agreements that reward the sellers through fees paid by the underwriters16.
However, while selling agreements are flexible and imply a limited investment, the seller can
obtain a stronger foothold in the business by controlling the underwriter, exploiting its
production powerhouse and directing its distribution. To our knowledge, the consequences of
this strategy in the P&C insurance industry are yet to be investigated. Therefore, our research
complements the existing literature on bancassurance and contributes to the debate on banks’
diversification into the insurance sector by considering a new point of view.
16 see for example Fiordelisi and Ricci (2011).
11
Third, the results of this study complete previous empirical researches devoted to the
life insurance sector17. Besides offering a detailed analysis of the Italian non-life insurance
market, our investigation indicates that the specificity of the non-life insurance sector is
relevant in defining banks’ strategies and the competitive levers they exploit.
Fourth, our paper reconciles existing literature on bancassurance with studies in the
area of non-life insurance performance18, by exploring the determinants of non-life insurers’
profitability and by investigating the impact of bank branches as an alternative distribution
network on financial results.
3.2. Methodology
After providing a detailed description of the differences between bank-affiliated and
traditional insurers, we check if bank affiliation per se creates value for non-life insurers via a
multivariate fixed effect panel regression that also enables us to explore the correlation
between differences in diversification and cost structures with our sample insurers’
performance.
In order to check the reliability of our methodology, first we performed the Hausman
test to choose among random and fixed effect panel estimation. After that, in order to treat
endogeneity problems that might arise from the impact of performance on reinsurance
decisions - bad performing firms might choose to reinsure more to save equity capital - we
instrumented the variable that measures the reinsurance used during the year and performed a
2SLS fixed effect panel estimation. Then we tested both the quality of our instrument and the
endogeneity of our instrumented variable. As we could not reject that the variable we
17 Spotorno et al. (2016). 18 see Moro and Anderloni (2014) for example.
12
instrumented is exogenous while our instrument’s quality was high, we chose to revert to a
fixed effect panel estimation, controlling for within cluster error correlation.
3.2.1. Model and variables
Our multivariate model is depicted by the following equation:
Performance measurei,t = f (αi, Bank affiliation dummyi,t ,Control variablesi,t) + εi,t
As for the dependent variable, we use both ROS (operating results/sales) and ROE
(earnings/equity) as we take into consideration both operating and shareholders’ profitability.
We calculated both Return on Sales (ROS) and Return on Equity (ROE) using as numerator
for the ratios the “Intermediate operating result”, which in turn is the sum of non-life
“Technical account result” and non-life “Net investment income”. This way we avoid the
influence of one-time items on results19.
As for the ratios’ denominator, sales are gross premiums written while equity is the
average value of two subsequent year-ends - which explains the lower number of observations
for ROE.
As mentioned, insurers are considered bank-affiliated if one or more banks own at
least 20% of their ordinary shares. The variable named Bank Affiliated_Dummy equals 1 if
that is the case and 0 whenever it is not.
As our main concern is the impact of bank affiliation on non-life insurers’
performance, several controls are necessary to disentangle it from other effects. We also
19 Nissim (2010).

13
exploited the variables listed below to single out differences in operations linked to the
insurers’ affiliation at a descriptive level.
Specifically, we check for differences in underwriting profitability (Loss ratio),
operating costs (Operating costs ratio), financial revenues (Investments financial return),
diversification (Diversified_Dummy), size (Size_Assets), age (Startup_Dummy) leverage
(Leverage) and passive reinsurance (Reinsurance ratio_Premiums).
Insurers’ underwriting profitability is usually measured using the loss ratio, which also
proxies the insurer appraisal of the current risk environment.
Our Loss ratio variable is the sum of total paid cost and total reserved cost for all
claims incurred, divided by earned premiums. We calculated both the numerator and the
denominator of the ratio net from reinsurance transfers, as the loss ratio is a measure of the
underwriting profitability of the insurance business retained by the firm (Ellis, 1998).
We expect a negative impact of this variable on profitability.
As different lines of business have structurally different levels of claims costs (also
due to the specific features of the policies sold), the loss ratio of the whole portfolio depends
on the company’s business mix. However, the claims reserve provisioning policy and the
premiums charged have also an impact on it: A low loss ratio – which indicates a high
underwriting profitability for the company – may be reconciled with an insurance company
that is covering its risks too little or that it is charging too much its customers. Both factors do
not immediately affect the insurer performance, but might have implications in the future20. If
we speculate that bank-affiliated insurers sell their policies to clients tied to their parent
20 Barth and Eckles (2009).

14
company via other products, they might be able to shift a higher portion of their costs on
customers, ceteris paribus lowering their loss ratios. On the other hand, in order to protect
customer relationships, banks might be willing to liquidate higher claims to their customers,
even if this implies a higher loss ratio (and a lower profitability) for their captive insurers.
Therefore, we do not have ex ante definite expectations about the differences in loss ratios
between traditional and bank-affiliated insurers.
The Operative costs ratio considers both distribution and administrative costs and
divides them by gross premiums written. We expect a negative impact on profitability.
At a descriptive level, we want to check if bank-affiliated insurers are able to exploit
their parent company branch network in order to save on distribution costs. We name the
variable that measures insurers’ selling efficiency Distribution costs ratio. It is the ratio
between distribution costs and gross premiums. Distribution costs are calculated by summing
up acquisition costs (the fees paid to agents, brokers and bank branches for selling the
company’s products) and fees paid for premium collection activities. Distribution costs are
then divided by gross premiums written because they include costs for selling all policies,
reinsured ones included.
In the academic literature, we found little evidence on the relevance of different
distribution channels and of their cost differentials for non-life insurers. Etgar21 compares
costs arising from different distribution choices. Berger22 offers an explanation for the
coexistence of distribution channels featuring sizable differences in costs while Kim23
suggests that the choice of the distribution channel is linked to governance issues and it is
therefore not entirely dependent on efficiency reasons only.
21 Etgar (1977). 22 Berger et al. (1997). 23 Kim et al. (1996).

15
The evidence regarding life insurers is more extensive. Spotorno24 finds lower
acquisition cost for Italian bank-affiliated life insurers. This result is confirmed by Klotzi25
that also document a variation in the difference between various distribution channels costs
depending on the country analyzed. While in Germany the difference between broker, tied
agent and bank channel are menial, in the countries where distributing policies through bank
branches is the most popular way to market life products (Austria, Belgium, Greece, Italy,
Portugal and Spain), selling through bank branches is also much cheaper than selling life
policies through other means. On the other hand, Chang26 results, coming from the analysis of
a Taiwanese life insurers’ sample, suggest that in that country bancassurance is less efficient
than the traditional sales channels in the life business.
Anecdotal evidence coming from the analysis of Italian traditional insurers’ financial
statements shows that non-bank-affiliated insurance companies tend to use a broad range of
distribution channels whose relevance depends on targeted customers (individuals or
companies) and on the range and peculiarities of operated lines of business. Traditional
insurers take advantage of the selling services offered by tied agents but also by banks’
branches and direct sales channels when selling to individuals while for corporate customers,
brokers and insurance companies’ direct selling force are prevalent.
According to information coming from surveys27, reports prepared by consultants28
and banks’ press releases29, bank-affiliated insurers, on the contrary, focus on retail customers
and tend to operate the business lines that these customers. Some banks promote the policies
they sell claiming to transfer part of their profit to customers (usually by discounting the
24 Spotorno et al. (2016). 25 Klotzi et al. (2017). 26 Chang et al. (2011). 27 Cetif (2013). 28 Meroni and Schiavi )2017). 29 Bonafede Dell’Olio (2017).

16
premium of additional policies covering ancillary risks offered to the client). If profits are
generated through cost savings, as it happens in the life business, we would expect that bank-
affiliated companies’ distribution costs are lower than non-bank-affiliated insurers. If the sale
of policies is instrumental to generate fee income for the parent bank, as it seems to have been
the case in the UK for PPI products, the opposite is to be expected.
Also at a descriptive level, we check if traditional insurers are more efficient at
managing claims than bank affiliated ones. We name Administrative costs ratio the variable
we use to perform that test. We calculate the Administrative costs ratio by dividing each firm
administrative costs by its net premiums written. Administrative costs refer to administration
expenses mainly related to the technical management of the company and are generally much
lower than distribution costs. Reinsurers manage transferred risks and this is the reason we do
not consider ceded premiums in the ratio denominator. A low administrative costs ratio might
be due to economies of scale. If bank-affiliated insurers are on average smaller, as we might
expect due to their more recent entrance in the business, their higher administrative costs over
net premiums written might not be due to their lack of skills at managing claims but to their
size.
The results of insurers’ financial investment activity are also included in our
multivariate analysis by means of the Investments financial return variable. We calculated
Investments financial return by dividing net investment financial results by the average
investments value over the year - obtained by averaging the year-end accounting value of the
firm investments over two subsequent years.
Being crucial for life insurers, investment activity is important for P&C insurance
companies as well. We obviously expect a positive impact of our variable on profitability.
Through our descriptive investigation, we also want to ascertain if bank-affiliated insurers’

17
investment results are different from traditional insurers’ ones as being part of a financial
conglomerate might positively influence investment activity through economies of scope.
As for diversification influence on performance, we check for it by a dummy variable
named Diversified_Dummy.
We had to come to terms with the fact that Italian non-life insurers are allowed to
operate eighteen different lines. In order to simplify insurers’ product portfolio composition,
we cut down to five sets by aggregating similar risks. Therefore, we considered Sickness and
Accidents as one single line that we named Health. Fire and Other property damages lines
were combined in an aggregate that we called Property. The aggregate we named Liability
contains Motor and other third-party liability lines, Transportation incorporates any kind of
vehicles and transported goods damage lines, while the Other set includes Legal expenses and
Assistance insurance, Financial losses, Credit, Suretyship.
If a company collects premiums in more than one single aggregate, we consider it to
be diversified and the dummy variable that checks for that (Diversified_Dummy) takes a value
of 1. If an insurer’s premium collection activity belongs to one aggregate only, we consider
the company to be specialized and the Diversified_Dummy variable value equals to zero.
The literature provides contrasting evidence on diversification impact on profitability:
while Cummins30 and Liebenberg and Sommer31 among others show that diversification
penalizes performance, Elango and Pope32 reaches the opposite conclusion. We want to
include diversification in our model in order to avoid misspecification problems, but we do
not have a definite expectation for its impact on our dependent variables.
30 Cummins et al. (2010). 31 Liebenberg and Sommer (2007). 32 Elango and Pope (2008)

18
As mentioned, we also included in the multivariate analysis model as additional
controls: the company size and age, its leverage and the weight of its passive reinsurance
activity. We also analyse these variables to compare their value in our two subsamples.
As for size we estimated it by using the Size_Assets variable i.e. the natural logarithm
of each firms’ total assets.
Past empirical analysis concludes that economies of scale are relevant in the P&C
insurance business33. If that is the case, we should find a positive coefficient for the size
variable. In the descriptive analysis, we also measured size with the Size_Premiums variable,
measured as the logarithm of gross written premiums. The Size_Assets variable can be
influenced by product mix as total assets of those insurers that cover big risks are increased by
technical reserves’ size and age while the Size_Premiums variable measures the company’s
size without considering its process of claims repayment. On the other hand, measuring size
by using premiums written might bias our regression results because size would correspond to
a log-transformation of the denominator of our dependent variable in the ROS case.
As for age, we single out recently created insurers by building a dummy variable
named Startup_Dummy which equals 1 if the insurer’s age is lower than 4 years. We expect a
negative coefficient sign as some time is needed for the company to establish itself in the
market.
We measured leverage (Leverage variable) by dividing the company total assets less
equity over total assets. The higher the company’s leverage the lower its capitalization. A
higher leverage benefits the company’s shareholders because, given a certain level of
operating performance, their investment in the company decreases. At the same time, a lower
33 see Praetz (1985) for a survey of the literature on the topic and also Cummins and Nini (2002), Liebenberg and Sommer (2008).

19
leverage increases the insurer’s financial strength and capability of absorbing losses. This in
turn might allow the insurer to charge higher premiums. Moreover, a lower leverage increases
the flexibility of the company investment activity because of solvency regulation and
consequently might increase profitability through this channel. The literature shows a
negative relationship between leverage and shareholders’ profitability34, and we do not have
reasons to expect a different sign in our case.
The influence of Leverage on ROS is more uncertain, because if the increased
profitability due to a lower leverage comes from the ability to charge higher premiums, this
effect influences both the numerator and the denominator of the ratio in the same direction.
Last, we include a measure of passive reinsurance activity among our controls
(Reinsurance ratio_Premiums). Reinsurance ratio_Premiums is calculated by dividing
premiums transferred to reinsurers over gross premiums written. Reinsurance is an efficient
risk management device for non-life insurers as it helps to reduce the risks portfolio
variability and to smooth losses. The level of reinsurance depends on business line
composition, as in certain risk classes risk transfer through reinsurance is highly used. For
Cummins35 reinsurance significantly increases insurers’ costs but significantly reduces loss
ratio volatility. According to Chen-Ying36 firm performance is positively related to
reinsurance utilization while Cummins37 finds a performance penalty for reinsurance
concentration. Therefore we do not have precise expectations for the coefficient sign of this
variable as passive reinsurance can be used by poor risk managers in order to compensate
inadequate selection skills and increase their profitability but, on the other hand, passive
34 Cummins and Nini (2002) and Chen-Ying (2014) among others. 35 Cummins et al. (2008). 36 Chen-Ying (2014). 37 Cummins et al. (2012).

20
reinsurance entails transaction costs due to information asymmetry that might be passed on
the transferring insurer, decreasing its performance.
We also note that reinsurance can have a tax planning purpose38. However, while
domestic tax avoidance within insurance groups comprising several P&C companies can be
obtained by exploiting the transfer of losses between taxable and non-taxable insurers, it is
impossible to attain when only one P&C firm operates within the group (as it is the case for
our bank-affiliated players).
Therefore, at a descriptive level, we do not have definite expectations. Bank affiliated
insurers might use passive insurance to avoid managing risks whose quality they might not be
sure about, but in bank affiliated insurers’ case reinsurance is not a tool to lower the
consolidated tax base, which might be the case for traditional insurers. Table 1 below
summarizes variables names, definitions and coefficients expected sign.
Table 1 Variables names, definitions and coefficients expected sign.
38 OECD (2001).

21

22
3.2.2. The sample
In order to perform our analysis, we collected data from a sample comprising all
Italian P&C insurance companies operating in the country during the 2005-2015 timeframe.
According to OECD numbers, Italy occupies the fourth place in Europe in 2015 for
non-life premiums written, making the Italian market deserving of an analysis of its own.
Distribution through banks of both life and non-life policies is an established reality and, even
if the non-life market penetration by banks is still limited – 7,2% of gross premiums written in
2015 excluding the motor third party liability business and 4% of total non-life gross
premiums written were sold through bank branches – banks’ market share is growing39. In
Italy, tied agents dominate the sale of non-life policies. However, the agents’ high fees make
the entrance in this industry attractive for players such as banks, which on paper should be
able to take advantage of current distribution inefficiencies.
Our starting sample included all non-life insurance companies headquartered in Italy,
associated to ANIA40, and operating during the 2005-2015, period, and whose financial
statements data are included in the ANIA database named Infobila.
Adopting Leech41’s threshold for identifying the minimum stake needed to influence
corporate policy, we consider an insurer to be bank-affiliated if one or more banks own at
least 20% of its equity. We label as traditional insurers the following entities: independent
companies, firms owned by other insurers, firms whose equity is participated by banks but
banks’ stake is lower than 20%.
39 Insurance Europe (2016). 40 Italian insurance association. 41 Leech (2002).

23
Information regarding insurers’ ownership structure comes from the database “Orbis”,
maintained by Bureau Van Dijk. When needed, the data were completed and integrated with
information coming from insurers’ web sites and original annual reports.
We excluded from our initial sample companies that either did not write premiums or
started their writing activity during the year. We also excluded observations pertaining to the
non-life insurance company controlled by the Italian Postal Service because of the
heterogeneous nature of its owner. Our final sample includes pure non-life companies and
companies also operating in the life business. - before 1979 operating in both life and non-life
insurance was possible and companies created before that year that were allowed to do so kept
the privilege. However, as for the latter, we only consider their non-life business in the
analysis.
In our final sample there are 25 bank-affiliated insurers and 90 traditional insurance
companies. Over time, some insurers change their “status” becoming bank-affiliated from
being traditional ones due to the establishment of joint ventures with banks or due to
acquisitions performed by banks. On the other hand, some bank-affiliated insurers become
traditional companies following a reduction or a cut of the equity links between the
participated insurer and its banking stockholders.
Our final sample includes 949 company-year level observations, of which 208 pertain
to the bank-affiliated subsample and 741 to the traditional insurers subsample.
From a descriptive point of view, our sample provides a good picture of the Italian
non-life insurance industry. Comparing the total amount of gross premiums written by
companies included in our sample with the Italian insurance regulator (IVASS) aggregate data
that covering the entire market, we reckon that companies included in our analysis collected
on average 90% of gross premiums written in Italy.

24
4. Descriptive analysis
In this paragraph we show the results of a descriptive analysis that compares bank-
affiliated insurers to traditional ones to single out differences (if any) in performance and
operations.
We divide our sample into two subsamples, according to the insurer’s affiliation, summarize
our variables for each subsample and test for differences.
In general, the number of bank-affiliated insurers and their market share, calculated as
the percentage of total gross premium written in our sample, did not change during our
timeframe. On the other hand, as one can notice from Figure 1, traditional insurers face a
gradual consolidation over time, their number steadily decreasing.
Figure 1 Percentage of premiums written and number of insurers (subsamples)

25
Figure 2 shows the product mix of the two subsamples, calculated by averaging the
percentage of gross premium written in each risk aggregate over total gross premiums in each
subsample during the period of time we analyse different customers/risk classes targeted by
bank-affiliated and traditional insurers is mirrored in the subsamples product mix
composition. Bank-affiliated companies are more active in the Health lines of business (24%
of gross premium written vs 14% for traditional insurers) and in the Other risks (13% vs 5%
for traditional insurers). The latter result is possibly linked to the fact that a fair share of the
policies included in the Other aggregate are attached to loans and bank-affiliated insurers have
a competitive advantage over traditional ones in this arena. The percentage of premiums
collected in the Property business is similar to traditional insurers (16% vs 14%) while bank-
affiliated companies show a lower involvement in the Liability business (41% vs 58%) and in
the Transportation business (6% vs 10%).
Figure 2 Product mix: bank-affiliated and traditional insurers

26
Product mix choice depends on targeted customers but has an impact on costs and
claims ratios. Therefore, the specific features of the lines probably influence positioning
decisions as well, especially for new entrants. As shown in Figure 3, risk lines featuring a
higher average loss ratio show a higher efficiency as well. On average, the table shows a
negative correlation between the average loss ratio and the average cost ratio, with bank-
affiliated insurers positioning their products where costs are higher and loss ratios are lower
(and claims possibly less difficult to manage). The most profitable risk classes (the ones
showing the lower “combined ratio”, which is the sum of the loss and cost ratios) on average
are Health, Property and Other risk lines. The share of these business lines in the bank-
affiliated insurers product mix is higher than their weight in traditional insurers product mix.
Figure 3 Average Loss ratio, Cost ratio and Combined ratio for various business lines (whole
sample)

27
If we analyse the average cost ratio and the average loss ratio over different business
lines for the two subsamples separately, we find that bank-affiliated insurers’ loss ratio is on
average markedly lower than traditional insurers’ where bank-affiliated insurers’ product mix
is concentrated. However, average loss ratios in the Transportation and Liability business
lines are higher than average loss ratios for traditional insurers covering the same risks
(Figure 4).
Figure 4 Average Loss ratio for various business lines (subsamples)
Two contrasting stories might explain that. On one hand, bank- affiliated insurers
might be able to exploit a competitive advantage in selecting and managing risks in the
business lines they mainly target - possibly profiting from information on the policy holders
coming from their controlling bank. Except for motor insurance, Transportation and Liability
business lines policies are mainly sold to corporate customers and professionals and brokers
representing customers are one of the main distribution channel: profiting from economies of
scope might be more difficult (even though banks also lend money to corporate customers).
28
On the other hand, bank-affiliated insurers might either enact a claims repayment
strategy that is more penalizing for the policy beneficiary than the one traditional insurers
apply given the amount of premium charged. According to FSA42 this case seems to have
applied to PPI policies in the UK. In 2014 the Italian supervisor conducted a survey that
examined the PPI market in Italy43. The analysis compared PPIs with stand-alone policies
belonging to the same business line. While on average P&C policies costs differentials for
policyholders are not statistically different from zero when the analysis breaks down costs by
distributors, the findings suggest that PPI policies sold by banks are more expensive than
analogous stand-alone ones.44 Unfortunately, we do not have direct information on the
amount of PPI premiums collected by insurers in our sample. However, employing data from
the cited survey (limited to 2014), a conservative back of the envelope calculation allows us
to reckon that in our sample, in 2014, 2% of total P&C premiums collected belonged to PPIs
and that 15,4% of the premiums collected in the Other business lines were PPI policies
premiums. As mentioned above, bank affiliate insurers disproportionately collect premiums in
this business line. In 2014 theirs were 5,5% of the total P&C premiums of our sample and
16,2% of the Other business lines premiums.
The analysis of the cost ratio might shed some light on this. If bank-affiliated insurers
are less efficient than traditional insurers and are able to transfer their higher costs to
policyholders through higher prices we could partly explain their lower loss ratio. The data
show that bank-affiliated insurers are less efficient than traditional ones in the very business
lines they favour – and where they thrive (Figure 4 and Figure 5). This might be due to higher
selection costs that allow banks to cherry pick and avoid risky customers (which is consistent
42 FSA (2012). 43 IVASS (2016). 44 This finding might be due to PPI life policies sold by banks having higher costs than similar stand-alone products and not to P&C products sold by banks. IVASS (2016) do not provide evidence that allow us to disentangle this effect from the distribution channel one.

29
with a low loss ratio). However, we wonder why this selection cost story works for some
business lines but not for others.
Figure 5 Average Cost ratio for various business lines (subsamples)
Figure 6 Average Combined ratio for various business lines (subsamples)
30
Higher costs could be due to bank-affiliated insurers’ average size. If on average bank-
affiliated insurers are smaller than traditional insurers - which is what we found in the data -
bank-affiliated insurers might be prevented from exploiting economies of scale. However, a
smaller size should impair these companies’ ability at selecting risks as well, which is not
what data regarding the average loss ratio suggest. On the other hand, banks asking higher
fees than the ones paid by traditional insurers to distribute their policies through other means
could give a reason for the relative average inefficiency we see in the data. This explanation is
consistent with a low loss ratio (due to higher premiums charged) and with the fact that bank-
affiliated insurers’ lower average efficiency is limited to the risk lines where distribution
through banks is relatively more popular45 and banks presumably have a higher bargaining
power.
At this stage we do not have enough evidence to discard any of the above explanations
as insurance firms accounting data on single business lines are not as detailed as the available
information on the aggregate P&C activity that we will present in the following paragraphs.
However, we intend to explore the issue in our future research.
Table 2 contains the descriptive statistics referred to our sample companies’ activity
for the whole P&C industry, broken down to single subsamples. Table 2 includes the results
of differences in means testing. As a robustness check, we also tested the difference in means
after standardizing our variables in order to discard outliers. The results these checks are
depicted in Table 3.
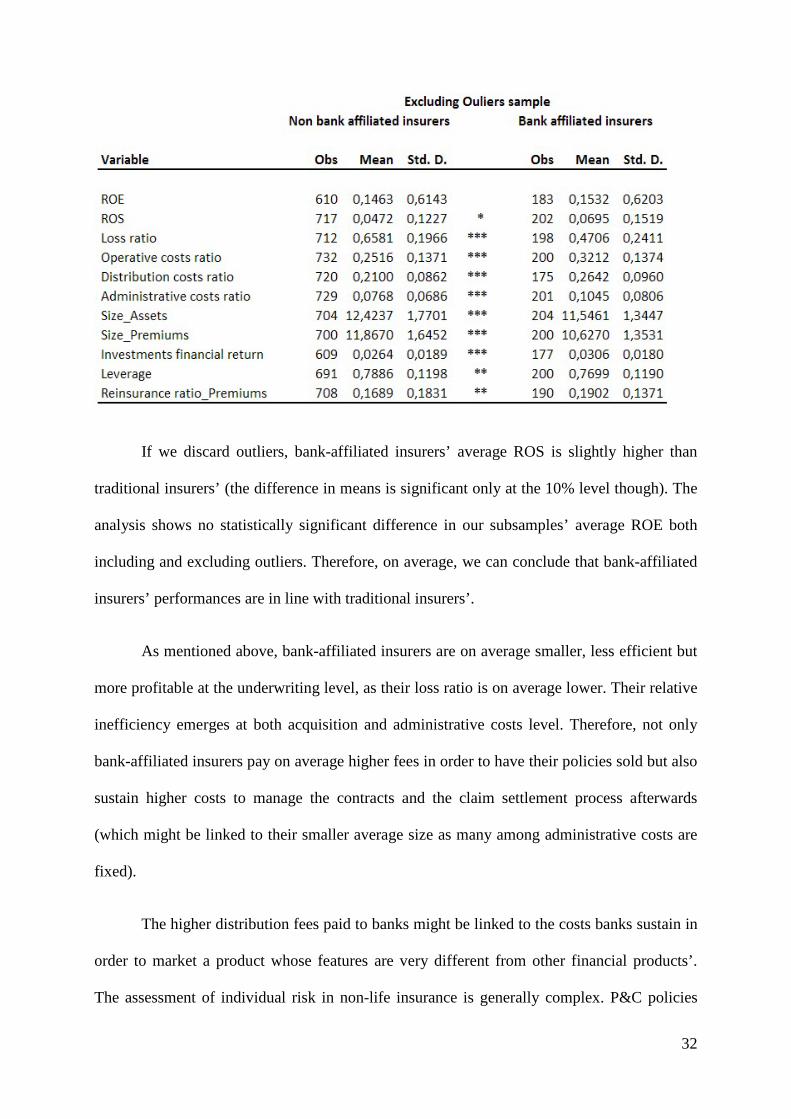
Table 2 Descriptive statistics, subsamples
45 see ANIA (2017)

31
The definitions of the variables can be found in Table 1.
*Significant at 0.10 level; **significant at 0.05 level; *** significant at 0.01 level
Table 3 Descriptive statistics, difference in means test after variable standardization,
subsamples
32
If we discard outliers, bank-affiliated insurers’ average ROS is slightly higher than
traditional insurers’ (the difference in means is significant only at the 10% level though). The
analysis shows no statistically significant difference in our subsamples’ average ROE both
including and excluding outliers. Therefore, on average, we can conclude that bank-affiliated
insurers’ performances are in line with traditional insurers’.
As mentioned above, bank-affiliated insurers are on average smaller, less efficient but
more profitable at the underwriting level, as their loss ratio is on average lower. Their relative
inefficiency emerges at both acquisition and administrative costs level. Therefore, not only
bank-affiliated insurers pay on average higher fees in order to have their policies sold but also
sustain higher costs to manage the contracts and the claim settlement process afterwards
(which might be linked to their smaller average size as many among administrative costs are
fixed).
The higher distribution fees paid to banks might be linked to the costs banks sustain in
order to market a product whose features are very different from other financial products’.
The assessment of individual risk in non-life insurance is generally complex. P&C policies

33
usually include multiple provisions to prevent policyholders’ moral hazard and bundle several
indemnities and defence coverages in a single contract, making products more difficult to
both understand and sell.
Returns from investments are on average higher for bank-affiliated insurers, possibly
due to their lower average leverage - the difference in means is significant only if we discard
outliers though- that partly free them from reserve coverage regulation. They might also
benefit from being part of a financial conglomerate. However, given that P&C policies
involve great uncertainty, non-life insurers tend to invest in assets subject to lower risk. Since
the timing of P&C claim payments is less predictable, insurance companies also tend to invest
in more liquid assets, featuring shorter maturity, in order to minimize interest rate sensitivity.
Therefore, the superior asset management ability a bank-affiliated insurer might have access
to thanks to its links with the bank might not express its benefits due to the limited range of
investible asset classes.
Bank-affiliated insurers also show a more intensive use of passive reinsurance. The
above result partly contradicts the reasoning that a higher selection ability might explain
lower loss ratios unless we assume that on average bank-affiliated insurers are systematically
able to transfer the worse part of their portfolios to reinsurers.

34
4. Regression Analysis
After performing the above descriptive analysis, we test our model over the entire
timeframe on our sample using three different specifications to include age and portfolio
diversification separately as we want to single out their influence on the insurers’
performance. We obtain our results running a fixed effect panel regression where time effects
are isolated using year dummies. As mentioned, we perform a Hausman test (not reported for
brevity) to choose between a fixed and a random effect panel regression.
Table 4 contains the descriptive statistics for the variables we included in our model.
Slightly more than a fifth of our observations belong to bank-affiliated insurers while the
rest pertain to traditional companies. A few (4%) among our observations belong to
companies whose age is less than four years, which we consider the minimum time needed to
establish their name in the market. Most firms in our sample (87%) operate in different risk
lines.
Our sample firms’ Loss ratio is on average less than one and the average combined ratio,
calculated by adding the Loss ratio and the Operative costs ratio is 0,91 implying that, on
average, firms belonging to our sample are profitable from an underwriting point of view. The
latter variables show a high variance though. As for the Loss ratio, the minimum value is
negative, due to a positive impact of the change in the claims reserve. The minimum value of
the Operative costs ratio is also negative, due to fees coming from reinsurers.

35
The Reinsurance ratio_Premiums variable shows a very high variance too. Its median
value (0,11) is lower than the average, and the probability mass is concentrated in the tails of
the distribution (kurtosis 3,62), implying that most of our sample insurers either take strong
advantage of passive reinsurance or tend not to use it. The correlation of the variable with its
lagged value shows that the use of passive reinsurance tend to be systematic (correlation is
positive and close to 1, 0,9137)
Table 4
Sample descriptive statistics
Tables 5 contains the coefficients of our model variables regressed on ROE while Table 6
depicts the impact of our variables on ROS.

36
We present results for both ROE and ROS instead of ROA. We consider ROS a better
measure of operating performance due to the features of our sample.
Yearly premium writing activity is not necessarily linked to equity or asset size. The
company equity depends on both its history – its past earnings, dividend distribution policy
and equity issuance activity - and the rules that set minimum capitalization requirements.
Asset size is also dependent on the company history, because even if the length of P&C
policies is short, in Italy some of them last up to five years. Moreover, policies belonging to
some business lines include loss occurrence clauses that entitle policyholders to ask for
refunds after maturity, provided that the event covered had happened while the policy was in
place. Therefore, even after maturity the insurer has an obligation to provision that increases
its assets. As a result, small firms from an equity/asset point of view might still be able to
collect a sizable amount of premiums.
Our results show that, irrespective of the performance measure we employ, the bank
affiliation variable coefficient has always a negative sign and it is always significant.

37
Table 5:
Regression results: Return on sales

38
Table 6:
Regression results: Return on equity

39
Therefore, being bank-affiliated places a negative weight on the insurer performance.
Other variables’ coefficients have the expected signs and most of them are highly significant.
As expected, the loss ratio has a significant and strong impact both on shareholders’
return and on operative returns. Its coefficient sign is negative as it was expected. Given the
premiums level, the higher the claims that the insurer has paid during the year and the claims
the company is expecting to pay in the future, the lower the underwriting activity profitability.
The investments financial return variable coefficient shows the expected positive sign
and is highly significant as well. Even if the P&C insurers’ investing activity is constrained by
the short-term maturity of their liabilities – and therefore we expected a low variance in the
returns which was not found in our data - the economic impact of the results coming from it
are strong as the size of the coefficient in both regression shows.
To ascertain costs impact on insurers performance, in our specifications we used the
comprehensive variable operative costs ratio, which considers both distribution and
administrative costs. It has the expected signs in both models, but its significance is stronger
in the ROS model, in all specifications, than in the ROE model – where the variable
coefficients are not statistically different from zero. If inefficient insurers are able to transfer
at least in part their costs to policyholders via increased premiums, the negative effect of their
higher expenses on earnings (and consequently on ROE) is softened as a result. On the other
hand, cost transfer activity influences the return on sales performance measure anyway,
because the value of premiums that the insurers need to collect in order to generate 1
monetary unit of earnings becomes higher.
In the regressions, we measured size as the natural logarithm of total assets. We discarded
the premiums measure of size because of its mathematical link with the denominator of the

40
ROS measure, which could bias our results. Size shows a positive and significant coefficient,
highlighting the presence of economies of scale.
The leverage variable coefficient is negative in both models. It is highly significant for
ROE, as it directly influences shareholders’ profitability. The investment of free capital,
which might increase final profits, seems to prevail in influencing ROE levels. As said before,
the impact of leverage on ROS might be more nuanced if leverage affects premiums as well
as economic results: safer - i.e. less levered - insurers might command higher premiums.
However, when we single out younger firms – which are less levered because of binding
minimum capital requirements - by adding the d_startup variable to the analysis, the impact
of leverage becomes highly significant even for ROS.
The Reinsurance ratio_Premiums is negative in both regressions, independent of the
model specifications. However, its coefficient is never statistically different from zero and we
cannot conclude that a higher use of passive reinsurance is per se detrimental to performance.
Being a startup is a disadvantage for performance in both models while diversification
shows no influence on operative returns. However, our measure of diversification might not
be able to fully capture its influence on results. A more detailed analysis of this topic will be
the object of future research.
6. Conclusions

41
While investigating the P&C insurers’ point of view, our results are consistent with some
of the few previous studies attesting little or absent advantages for banks’ entrance in non-life
business such as Lown46 and Nurullah and Staikouras47.
Opposite to what academic literature found in the life insurance business, where bank-
affiliated players are among the biggest and most profitable, bank-affiliated P&C insurers’
operations seem, for the moment, constrained on a limited portion of the market, in terms of
both line of business and customers.
Our results suggest that bank affiliation per se seem to be counterproductive.
Even though in theory having access to banks’ customers could help these insurers’
growth and profitability, this potential is still to become effective also due to some hurdles
that it will be difficult to overcome even in the future. Cross selling non-life policies is more
difficult for banks than selling life products. Conflicts arising from claims repayment in the
short term can have an impact on customer’ relations, which might entail negative
consequences on the sale of other core financial products. Lacking appropriate incentives,
bank sales representatives might not be willing to put their reputation (and bonus) at risk.
Our data show that bank-affiliated insurers pay higher distribution costs, presumably
shifting profits to banks through fees. They also have a higher underwriting profitability than
traditional insurers. Our evidence suggest that this might be linked more to costs transfers to
policyholders than to selection ability, as bank-affiliated insurers show a more intensive use
of passive reinsurance, which suggests poorer risk management skills.
Our analysis has some limitations that we hope to address in future research. Our sample
is restricted to Italy. A more detailed investigation of insurers’ riskiness could help enhance
46 Lown et al. (2000). 47 Nurullah and Staikouras (2008).

42
the explanatory power of our model - especially when return on shareholders’ investments is
concerned. Moreover, bank-affiliated insurers’ position need further analysis at single
business line level in order to corroborate our results.
References
ANIA (2017) Premi trimestrali danni, Trends, various issues
Artikis P.G., Mutenga S. and Staikouras S.K. (2008) ‘A practical approach to blend insurance
in the banking network’. The Journal of Risk Finance, 9(2): 106-124.
Ashton J. K., Hudson R. S. (2017) ‘The price, quality and distribution of mortgage payment
protection insurance: a hedonic pricing approach’ British Accounting Review, 49(2):
242-255.
Ashton J. K., Hudson R. S. (2014) ‘Do lenders cross-subsidise loans by selling payment
protection insurance?’ International Journal of the Economics of Business, 21(1): 121-
138.
Barth M.M. and D.L. Eckles (2009), ‘An empirical investigation of the effect of growth on
short-term changes in loss ratios’, Journal of Risk and Insurance, 76(4): 867-885.
Berger, A.N., J.D. Cummins and M. Weiss (1997) ‘The Coexistence of Multiple distribution
systems for financial services: the case of property liability insurance’, Journal of
Business, 70(4): 515-546.

43
Bonafede A. and L. Dell’Olio (2017) ‘Sorpresa: Intesa è già adesso la prima assicurazione
italiana’, La Repubblica, 2nd of October
Boyd, J.H., S.L. Graham and R.S. Hewitt (1993) ‘Bank holding company mergers with non-
bank financial firms: Effects on the risk of failure’, Journal of Banking and Finance,
17(1): 43-63
Burchardt T., Hill J. (1998) ‘From public to private: the case of mortgage payment insurance
in Great Britain.’ Housing Studies”, 3(3): 311-323.
Cetif Università Cattolica di Milano (2013) Rapporto di Ricerca su Innovazione nella
distribuzione di polizze vita e danni per casse di risparmio, banche popolari e banche
piccole: fra servizio al cliente e redditività, from http://www.cetif.it
Chang P. R., Peng J. L. and Fan C.K. (2011) ‘A comparison of Bancassurance and traditional
insurer sales channels’, The Geneva Papers, 36:.76-93.
Chen-Ying L. (2014) ‘The Effects of Firm Specific Factors and Macroeconomics on
Profitability of Property-liability Insurance Industry in Taiwan’, Asian Economic and
Financial Review, 4(5): 681-691
Cummins, J. D., Nini G. (2002) ‘Optimal capital utilization by financial firms: evidence from
the property-liability insurance industry’, Journal of Financial Services Research, 21:
15-53.
Cummins J. D., Dionne G., Gagné R., Nouira A. (2008) The Costs and Benefits of
Reinsurance. working paper, HEC, Montreal (Canada).

44
Cummins J.D., M. Weiss, X. Xie, H. Zi (2010) ‘Economies of Scope in financial services: A
DEA efficiency analysis of the US insurance industry’, Journal of Banking and
Finance, 34(7): 1525-1539.
Cummins J.D., Feng Z., Weiss M.A. (2012) Reinsurance Counterparty Relationships and
Firm Performance in the U.S. Property-Liability Insurance Industry, working paper
from http://ssrn.com/abstract=1997444
Elango B., Ma Y.L. and Pope N. (2008), ‘An investigation into the diversification–
performance relationship in the U.S. property–liability insurance industry’, The
Journal of Risk and Insurance, 75(3): 567-591.
Ellis P.M. (1998), ‘The nature of the loss ratio in property-casualty insurance’, Journal of
insurance issues, 21(1): 46-62.
Elyasiani E., S.K. Stailouras, P. Dontis-Charitos (2015) ‘Cross-industry prpoduct
diversification and contagion in risk and return: the case of Bank Insurance and
insurance bank takeovers’, The Journal of Risk and Insurance, 83(3): 681-718.
Etgar M. (1977) ‘Cost Effectiveness in Insurance Distribution’, The Journal of Risk and
Insurance, 44(2): 211-222.
Fiordelisi F., Ricci O. (2011) ‘Bancassurance efficiency gains: evidence from the Italian
banking and insurance industries’ The European Journal of Finance, 17(9-10): 789-810
Fiordelisi F., Ricci O. (2012) Bancassurance in Europe, past, present and future. Palgrave
Macmillan Studies in Banking and Financial Institutions, London.
FSA Financial Services Authority (2012) Parliamentary Commission on Banking Standards.
Written evidence from the Financial Services Authority, available at

45
https://publications.parliament.uk/pa/jt201314/jtselect/jtpcbs/27/27ix_we_j12.htmKlot
zki U., N. Gatzert and B. Muestermann (2017) ‘The cost of life distribution in Europe’
The Geneva Paper, 42(2): 296-322
Insurance Europe (2016) European Insurance – Key Facts, available at
www.insuranceeurope.eu
IVASS (2016) PPI Payment protection insurance. Indagine sulle polizze abbinate ai
finanziamenti: premi, caricamenti e provvigioni, available at
https://www.ivass.it/pubblicazioni-e-statistiche/pubblicazioni/altre-
pubblicazioni/2016/report-ppi/index.html
Leech D. (2002) ‘Shareholders’ Voting Power and Ownership Control of Companies’ Homo
Oeconomicus, 19(3): 345-373.
Liang H.Y., Ching Y.P. (2015) ‘Suggestions for Bancassurance Markets in China:
Implications from European Countries’, The Geneva Papers, 40: 279-294.
Liebenberg A. P., Sommer D. W. (2008), ‘Effects of corporate diversification: evidence from
the property–liability insurance industry’, The Journal of Risk and Insurance, 75(4):
893-919.
Lown, C. S., C.L. Osler, A. Sufi and P.E. Strahan (2000). ‘The Changing Landscape of the
Financial Services Industry: What Lies Ahead’, FRB of New York Economic Policy
Review, 6(4): 9-55.
Meroni G. and D. Schiavi (2017) ‘Banche e mercato assicurativo, in Italia tre opzioni
strategiche’, Il Sole 24 ore, 5th July

46
Moro, O. and L. Anderloni (2014) ‘Non-life insurance economic performances – An
empirical investigation’, Journal of Economics and Management, 18: 159-177.
Nissim D. (2010) ‘Analysis and Valuation of Insurance Companies’. Columbia Business
School, Columbia University, CE|ASA (Center for Excellence in Accounting and
Security Analysis), Industry Study No. 2, November 30th, New York.
Nurullah M., Staikouras, S.K. (2008) ‘The separation of banking from insurance: evidence
from Europe’, Multinational Finance Journal, 12(3-4): 157-184.
Praetz P.D. (1985) ‘A Note on Economies of Scale in the United Kingdom Property Liability
Insurance Industry’, Journal of Risk and Insurance, 52(2)315-320,
Santomero, A. and E. Chung (1992) Evidence in support of broader bank powers, Cambridge
MA: Blackwell Publishers, pp 1-69
Spotorno L., Moro O. and Anderloni L. (2016) ‘Bank affiliation influence on life insurers’
performance before and after the financial crisis’, Journal of Economics and
Management, 26(4): 5-33.
Sreesha C. (2015) ‘Efficency of bancassurance channels - An evaluation of the performance
of public sector banks in India’, International Journal of Multidisciplinary Research
and Development; 2(2): 495-498.
Vander Vennet R. (2002) ‘Cost and profit efficiency of financial conglomerates and universal
banks in Europe’, Journal of Money, Credit and Banking, .34: 254-282.
Yildirim, H.S., S. Kwag, C.M. Collins (2006) ‘An examination of the equity market response
to the Gramm-Leach-Bliley Act across commercial banking, investment banking and
insurance firms’, Journal of Business, Finance and Accounting, 33(9-10): 1629-1649.