How Habitat Restoration - Illinois DNR : Welcome to Illinois DNR!
Upload
washington-state-department-of-natural-resourcesCategory
view
227download
1description

Annual Report
2015

ANNUAL REVENUE FOR PUBLIC SCHOOLS AND OTHER TRUST LAND BENEFICIARIES FROM DNR-MANAGED AGRICULTURAL LAND LEASES
million21$
WHEAT BUILDS SCHOOLS Most of the nearly 1.3 million acres of
state trust land that DNR leases to farmers and ranchers for grain, orchard and vineyard fruits,
and livestock production helps support public school construction statewide.

Cont
ents
4 A Message from the Commissioner of Public Lands
6 Highlights
7 Fiscal Management Data*
35 Timber Management Data*
40 Boards and Leadership
41 Contact Information and DNR Regions Map
For copies, or for disabled persons needing this information in an alternate format, contact:
DNR Communications and Outreach Mail Stop 47003 Olympia, WA 98504-7003
E-mail [email protected]
Phone 360-902-1016
TRS: 711 Telecommunications Relay Service (Operator service that allows people who are deaf, hard of hearing, deaf, blind, or have a speech disorder to place calls to standard telephone users via a keyboard or assistive device.
This document is available in PDF format at: www.dnr.wa.gov
2015 DNR ANNUAL REPORT
Peter Goldmark Commissioner of Public Lands
* Fiscal and timber pages account for the revenues DNR generated, collected, and expended during Fiscal Year 2015.
This report was prepared by the Washington State Department of Natural Resources (DNR). It provides information required by the following statutes: RCW 79.10.010, RCW 79.64.100 and RCW 79.64.030
DNR is an equal opportunity employer.
Cover photo by D. Johnson. Back cover photo by Joe Smillie.

A Message from the
Commissioner of Public
LandsPeter Goldmark, a statewide elected official, is Washington’s thirteenth Commissioner of Public Lands since statehood in 1889.
For the Washington State Department of Natural Resources, 2015 was defined by the crucible of wildfire. Last year, our state battled the most destructive wildfire season in Washington history. More than a million acres burned, and 307 homes were destroyed. Three U.S. Forest Service firefighters died protecting homes near the Twisp River, and three DNR firefighters were injured. The catastrophic season cost state taxpayers $164 million.
The wildfire season affected the work of the agency in profound ways. DNR firefighters, with help from federal and local partners, battled fire across the state for almost half of the year. Many of those firefighters double as the foresters, biologists, and scientific experts who manage our state’s lands. They carried an especially heavy burden in 2015 on behalf of the people of Washington.
Despite the horrific fire season, DNR generated $313 million in total revenue for fiscal year 2015, which included $161.9 million in lease and product sales income that was distributed to Washington schools, universities, county services, and other beneficiaries of Washington state trust lands.
DNR’s contribution to the recovery of Puget Sound continued, as management of state-owned aquatic lands, particularly auctions for the right to harvest wild geoduck, generated $30.4 million for funds to help manage aquatic lands, including restoration, monitoring, and access projects. The agency’s own efforts to ensure healthy shorelines around Washington’s rivers, lakes, and harbors resulted in the removal of more than 1.6 million pounds of toxic and dangerous debris.
Last year, DNR was able to sell to the Squaxin Island Tribe an isolated parcel of land in the middle of their original island reservation. The Squaxin consider this land “the bond that unites our past, present, and future generations.” The sale solidified that bond while ensuring continued revenue for Washington schools.
In April, we re-opened the Woodard Bay Natural Resources Conservation Area. Five miles of undeveloped shoreline, mature forests, freshwater wetlands, and the area’s historic and cultural resources have been enhanced by a new environmental learning shelter, Native American art, expanded parking, and an exhibit focused on Puget Sound’s historic natural resource economy.
In June, the state Board of Natural Resources unanimously approved a plan to protect waterways, continue forestry and grazing, develop recreation, and restore habitat in the 50,242-acre Teanaway Community Forest.
A major 2015 accomplishment was to secure permanent funding from the legislature for the Forest Practices Adaptive Management program. This program provides science that informs the Forest Practices Board whether timber harvest rules are effective in ensuring that water quality and fish habitat are restored and protected while maintaining a viable timber industry.
In October, DNR became a full participant in the Loggers Safety Initiative, standing side-by-side with private landowners, logging industry employers, and the Department of Labor & Industries. This broad-based effort aims to use training to promote safety, reduce fatalities, and decrease the frequency and severity of injuries for those who work in our forests.
Those who cherish being on Washington’s beautiful landscapes can now enjoy 23 new miles of DNR trails across the state. One of our many valued partners, the Back Country Horsemen of Washington, joined us to preserve more than 640 acres in perpetuity for public access at BBQ Flats near Ellensburg. DNR also reopened 17 campsites to year-round access at the Cypress Island Natural Resources Conservation Area in the San Juan Islands.
In its 125th year, DNR’s Washington Geologic Survey took a technologic leap toward mapping our state’s geologic hazards, mounting an effort to use Lidar to identify past landslides. In the fall, DNR seismologists studied the seismic response of the soils around 21 schools, generating information about the resilience of these buildings to earthquakes.
Everyone who is fortunate enough to live in the Evergreen State has in some way been touched by the peerless landscapes and waterways that define this place. We pledge to the people of Washington that we, the firefighters, foresters, biologists, surveyors, and many others who make up DNR, will continue to take care of these natural resources, for now and for the years to come.
PETER GOLDMARKCOMMISSIONER OF PUBLIC LANDS
4
20
15
DN
R A
NN
UA
L R
EP
OR
T 2015 DNR ANNUAL REPORT

20
15
DN
R A
NN
UA
L RE
PO
RT
5
WILD
LAN
D FIR
E PHO
TO B
Y ©
KA
RI G
REER
/ US FO
REST SER
VIC
E
Communities like Wenatchee, Walla Walla, Chelan, and Spokane were on the front line of wildfire this year.
1,005,423
WILDFIRE COST TO WASHINGTON'S TAXPAYERS IN 2015
$164 million
TOTAL ACRES BURNED, ACROSS WASHINGTON, ALL JURISDICTIONS
ACRES BURNED ON DNR-PROTECTED LANDS
314,000
2015: A BRUTAL YEAR FOR WILDFIREWeeks of critical fire weather, marked by low humidity and strong, gusty winds against a backdrop of drought, set the stage for Washington’s worst wildfire season in memory. More than one million acres of forest, grassland, and other open lands burned in 2015.
As in previous seasons, human activity and lighting strikes were the primary causes of wildfires. What was unusual in 2015 was that cities and towns, including Wenatchee, Walla Walla, Spokane, Pateros, Chelan, Winthrop, and Okanogan, were on the front lines of rapidly spreading and unpredictable fires. Even the Olympic rainforest was not spared, with the Paradise fire burning from June to September. NASA satellite imagery showed wildfire smoke covering much of the state on August 22. By the peak of the season, about 8,500 firefighters and support personnel were fighting Washington's wildfires.
Many Washington residents joined in, too, signing up at DNR intake centers in Omak and Colville. Volunteers with previous training were sent out to help, while about 600 volunteers received training that will allow them to work alongside professional firefighters in seasons to come.

Dep
artm
ent
of N
atur
al R
esou
rces
Hig
hlig
hts 23 miles
OF NEW TRAILS that offer options for fun on state trust lands.
5,100NATURAL-AREA ACRES ADDED: 4,378 acres to natural resources conservation areas and 808 acres to natural area preserves
313$
STEWARDSHIP FORESTERS MADE
2,963 SITE VISITS TO HELP FAMILY FOREST
OWNERS MANAGE THEIR LANDS TO
IMPROVE FOREST HEALTH AND
HABITAT
COMMUNITIES, COUNTIES, AND NON-PROFITS HELPED to obtain funding for healthy urban forests
16 barriers TO FISH CULVERTS REMOVED to open 40+ miles of river for upstream habitat
21 schools STUDIED TO ASSESS earthquake vulnerability
19
BEFORE
AFTER
2015 marked the 125th year of the Washington Geologic Survey and its thousands of publications that document the geologic marvels of Washington state.
2015 DNR ANNUAL REPORT
MILLIONgenerated through trust land leases, timber sales, aquatic leases, and other sources
$30.4 millionGENERATED FOR PUGET SOUND restoration and aquatic management through state-owned aquatic land leasing and product sales
83,660HOURS OF VOLUNTEER CARE for trails, campgrounds, and picnic areas
829 tons OF DERELICT MARINE DEBRIS REMOVED from Washington rivers, lakes and harbors across 75 sites with the help of DNR Puget SoundCorps crews, including 598,400 pounds of creosote debris u
PUG
ENT
SOU
ND
CO
RPS
CR
EW A
ND
GEO
LOG
IST
PHO
TOS
BY
JO
E SM
ILLI
E /
DN
R
OVERALL AGENCY OPERATIONS 8 Total Revenue 9 Total Expenditures 10 DNR-Administered Funds 11 Funds Administered by Other Entities
STATE GRANT LANDS 12 Resource Management Cost Account (RMCA) 13 State Grant Lands 14 RMCA Upland 15 General Distribution of Revenue from Upland State Grant Lands 16 Common School, Indemnity, and Escheat Grants 17 University Grants Original and Transferred (UW) 18 Charitable, Educational, Penal, and Reformatory Institutions Grant (CEP&RI) 19 Capitol Building Grant 20 Normal School Grant (EWU, CWU, WWU, and TESC) 21 Scientific School Grant (WSU) 22 Agricultural College Trust Management Account (ACTMA) 23 Agricultural School Grant (WSU)
STATE FOREST LANDS 24 Forest Development Account (FDA) 25 General Distribution of Revenue from State Forest Lands 26 State Forest Lands
STATE AQUATIC LANDS 28 Aquatic Resources and RMCA—Aquatic 29 General Distribution of Revenue from State-Owned Aquatic Lands
30 FISCAL NOTES 34 State Trust Lands Management Fund Accounting Report
Fisc
al D
ata
Man
agem
ent
ABOUT THESE PAGES
◗ These pages account for the revenues DNR generated, collected, and expended during Fiscal Year 2015 (July 1, 2014 – June 30, 2015).
◗ Most revenues DNR generated are from activities on upland state trust lands and aquatic lands. Distribution of revenue is governed by statute and varies according to trust and revenue source.
◗ DNR manages 2.1 million acres of forestlands that generate revenue for state trusts, mostly from timber sales. On pages 37 to 41, DNR provides data on timber management activities on forested state trust lands, as required by RCW 79.10.010(3).
◗ Fiscal information is presented as a combination of tables, pie charts, and notes. The notes provide context for the tables.
◗ Underlined bold numbers are totals or subtotals.
◗ Some pages show dollars in thousands. Totals may not add exactly due to rounding.
◗ There is no individual page for the Community College Forest Reserve Trust. (See Fund Activity, page 11).
◗ These pages include data for federally granted trust lands and for legislatively established trust lands, including State Forest Lands (formerly known as Forest Board lands). Trusts are listed individually.
◗ Counties that contain State Forest Lands, but are not listed for an activity, did not have that activity during Fiscal Year 2015.
FISCAL DATA
TIMBER DATA
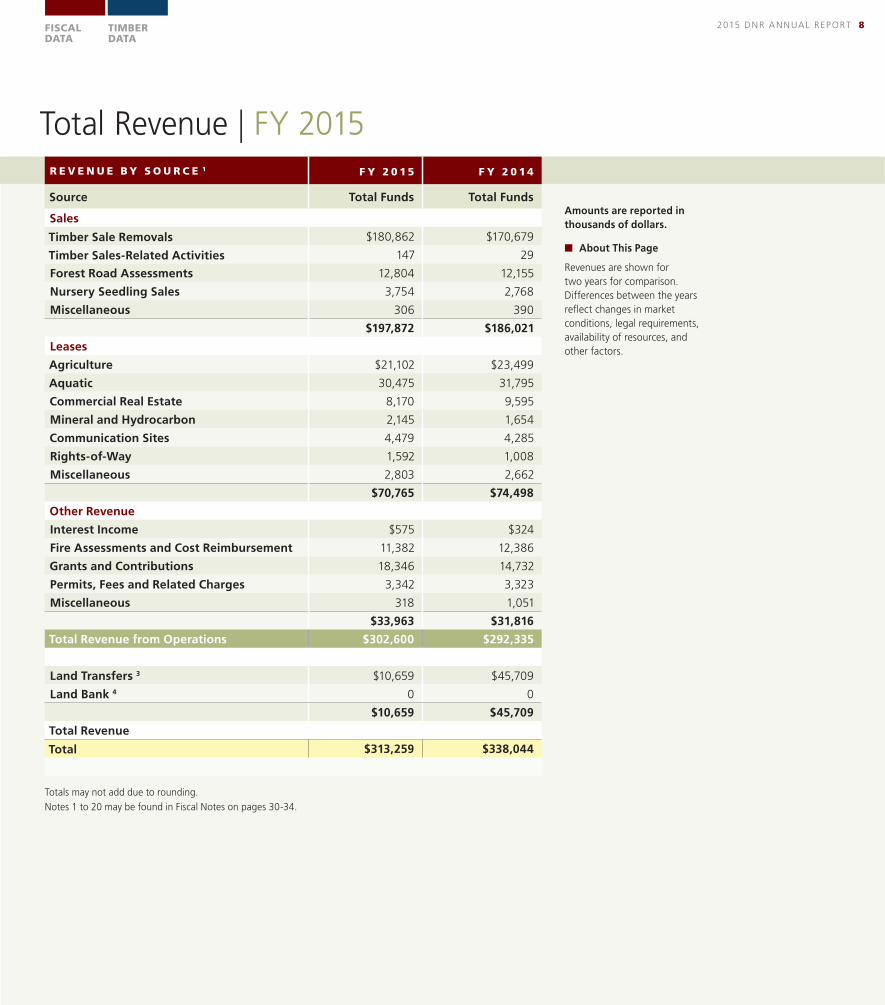
Total Revenue | FY 2015
R E V E N U E B Y S O U R C E 1 F Y 2 0 1 5 F Y 2 0 1 4
Source Total Funds Total Funds
Sales
Timber Sale Removals $180,862 $170,679
Timber Sales-Related Activities 147 29
Forest Road Assessments 12,804 12,155
Nursery Seedling Sales 3,754 2,768
Miscellaneous 306 390
$197,872 $186,021
Leases
Agriculture $21,102 $23,499
Aquatic 30,475 31,795
Commercial Real Estate 8,170 9,595
Mineral and Hydrocarbon 2,145 1,654
Communication Sites 4,479 4,285
Rights-of-Way 1,592 1,008
Miscellaneous 2,803 2,662
$70,765 $74,498
Other Revenue
Interest Income $575 $324
Fire Assessments and Cost Reimbursement 11,382 12,386
Grants and Contributions 18,346 14,732
Permits, Fees and Related Charges 3,342 3,323
Miscellaneous 318 1,051
$33,963 $31,816
Total Revenue from Operations $302,600 $292,335
Other Activity
Land Transfers 3 $10,659 $45,709
Land Bank 4 0 0
$10,659 $45,709
Total Revenue
Total $313,259 $338,044
Amounts are reported in thousands of dollars.
■ About This Page
Revenues are shown for two years for comparison. Differences between the years reflect changes in market conditions, legal requirements, availability of resources, and other factors.
Totals may not add due to rounding.
Notes 1 to 20 may be found in Fiscal Notes on pages 30-34.
2015 DNR ANNUAL REPORT 8 FISCAL DATA
TIMBER DATA

Totals may not add due to rounding.
Notes 1 to 20 may be found in Fiscal Notes on pages 30-34.
Total Expenditures | FY 2015
E X P E N D I T U R E S B Y P R O G R A M 2 F Y 2 0 1 5 F Y 2 0 1 4
Operating
Agricultural Resources $2,103 $1,770
Asset & Property Management 7,191 6,521
Product Sales & Leasing 40,983 37,106
Land Management 22,072 18,077
Aquatic Resources 19,361 13,933
Law Enforcement Services 1,325 1,184
Administration 5,427 4,697
Interagency Payments 8,848 8,785
Agency Support 17,404 16,340
Geology & Earth Resources 2,627 2,449
Forest Practices 15,569 15,261
Engineering Services 13,527 14,103
Resource Protection 19,275 18,721
Fire Suppression 89,063 30,904
Total Operating Expenditures $264,773 $189,850
Capital
Real Estate and Property Acquisition $33,947 $110,673
Trust Land Transfers 9,523 40,494
Jobs Bill 8,154 10,171
Aquatic Resources 5,244 5,023
Forest Health 3,212 888
Facilities & Roads 3,860 736
Recreation & Natural Areas 1,930 725
Forest Practices 1,264 707
Total Capital Expenditures $67,134 $169,416
Total Expenditures
Total 2 $331,907 $359,266
Amounts are reported in thousands of dollars.
■ About This Page
Expenditures are shown for two years for comparison. Differences between the years reflect changes in the programs, legal requirements, salaries and benefits, inflation, and other factors.
DNR’s expenditures reflect the Department’s diverse work.
Land management activities, funded by trust land revenue, are investments in the long-term benefits and productivity of the resources. Other activities, funded by non-trust revenue sources, support regulatory, assistance and resource protection programs, as well as agency operations.
Capital expenditures include land acquisitions on behalf of state trusts and natural areas.
2015 DNR ANNUAL REPORT 9 FISCAL DATA
TIMBER DATA

See Fiscal Notes, pages 54-58. Totals may not add due to rounding.
DNR-Administered Funds – Revenue and Expenditures | FY 2015
Fund TitleBeginning
Balance 7/1/14 Revenue ExpenditureEnding
Balance 6/30/15
Trust Management Accounts*
Forest Development (FDA) 3 $8,947 $23,495 $(25,710) $6,732
Resources Management (RMCA) Total** 47,246 43,421 (70,595) 20,073
RMCA Uplands Subtotal 17,152 30,520 (36,495) 11,177
RMCA Land Bank Subtotal 15,534 6 (13,450) 2,090
RMCA Aquatics Subtotal 14,558 12,896 (20,649) 6,805
Agricultural College (ACTMA) 195 1,312 (1,047) 461
$56,388 $68,229 $(97,352) $27,266
Other DNR-Administered Funds 14
Access Road Revolving $3,846 $12,846 $(11,351) $5,340
Aquatic Lands Dredged Material 342 24 (13) 353
Aquatic Lands Enhancement 7 n/a 17,464 (4,389) n/a
Community Forest Trust 0 26 0 26
Conservation Areas Stewardship 242 48 (30) 261
Contract Harvesting Revolving 3,213 19,821 (21,095) 1,940
Derelict Vessel Removal 8 n/a 0 (411) n/a
Forest and Fish Support 9 n/a 1 (5,050) n/a
Forest Fire Protection Assessment 6,591 10,297 (8,446) 8,443
Forest Practice Application 157 702 (237) 622
Landowner Contingency Forest Fire 3,674 859 (185) 4,348
ORV and Nonhighway Vehicle 6 n/a 1 (2,009) n/a
Park Land Trust Revolving 10 n/a 106 (1,730) n/a
Real Property Replacement 3 14,401 9,722 (18,884) 5,239
Special Forest Products Outreach & Educ. 1 1 0 1
State Forest Nursery Revolving 891 3,763 (3,697) 957
Surface Mining Reclamation 1,049 1,580 (1,496) 1,133
Surveys and Maps 839 553 (487) 905
$77,815 $(79,508)
Total DNR-Administered Funds 14 $146,044 $(176,860)
Amounts are reported in thousands of dollars.
■ About This Page
DNR’s fiscal activity includes generating revenue for a variety of funds and accounts, some of which benefit state trust beneficiaries and some of which fund state programs, including DNR’s own. DNR’s fiscal activity also includes expenditures supporting its work. Some of the accounts that receive revenue from DNR or that fund DNR’s expenditures are managed by DNR; others are managed by other agencies.
* These accounts fund DNR’s management of state trust lands. Revenue may be carried over from year to year. As a result, any given year’s expenditures do not necessarily correlate to that year’s revenue.
** The RMCA trust balance includes $15,534,747 dedicated by law (RCW 79.19) to Land Bank purchases of lands that replace previously sold trust lands.
See pages 12, 22, 24, and 28 for more detailed accounting. FDA and RMCA are funded through revenue generated from the lands whose management they support. ACTMA is not funded through such revenue, but instead, through a legislative appropriation from the State General Fund.
N/A = not applicable
2015 DNR ANNUAL REPORT 10 FISCAL DATA
TIMBER DATA
Totals may not add due to rounding.
Notes 1 to 20 may be found in Fiscal Notes on pages 30-34.

Other Funds – Revenue and Expenditures | FY 2015
Fund Title Revenue Expenditure Net Fiscal Activity
Trust Current Funds 13
Common School Construction $50,450 $0 $50,450
Community College Forest Reserve 470 0 470
WSU Bond Retirement 1,834 0 1,834
UW Bond Retirement 19 2,772 0 2,772
CEP&RI 5,240 0 5,240
EWU Capital Projects 32 0 32
CWU Capital Projects 32 0 32
WWU Capital Projects 32 0 32
TESC Capital Projects 32 0 32
Capitol Building Construction 4,870 0 4,870
Forest Board Counties 65,440 0 65,440
$131,205 $0 $131,205
Trust Permanent Funds 13
Agricultural College (WSU) $4,103 $0 $4,103
Normal School (EWU, CWU, WWU, TESC) 1,748 0 1,748
Common School (K-12) 1,091 0 1,091
Scientific (WSU) 7,112 0 7,112
State University (UW) 19 403 0 403
$14,458 $0 $14,458
Other Funds
General Fund $21,058 $(61,655) $(40,597)
Air Pollution Control 441 (469) (28)
Budget Stabilization 0 (54,512) (54,512)
Cleanup Settlement 65 0 65
Developmental Disabilities Community Trust 11 0 11
Disaster Response 0 (3,926) (3,926)
Environmental Legacy Stewardship 1 (5,965) (5,965)
Marine Resources Stewardship Trust 0 (1,879) (1,879)
NOVA Program 0 (645) (645)
Snowmobile 0 (100) (100)
State Building Construction 9 (25,895) (25,886)
State Toxics Control 17 (33) (0) (33)
$21,552 $(155,047) $(133,494)
Total Activity - Other Funds 14 $167,215 $(155,047) $12,169
Total All Funds and Activities $313,259 $(331,907)
Amounts are reported in thousands of dollars.
Totals may not add due to rounding. Notes 1 to 20 may
be found in Fiscal Notes on
pages 30-34.
■ About This Page
All revenue for the Community College Forest Reserve Trust was generated from leases. DNR expenditures from the fund were to purchase land for the trust.
2015 DNR ANNUAL REPORT 11 FISCAL DATA
TIMBER DATA
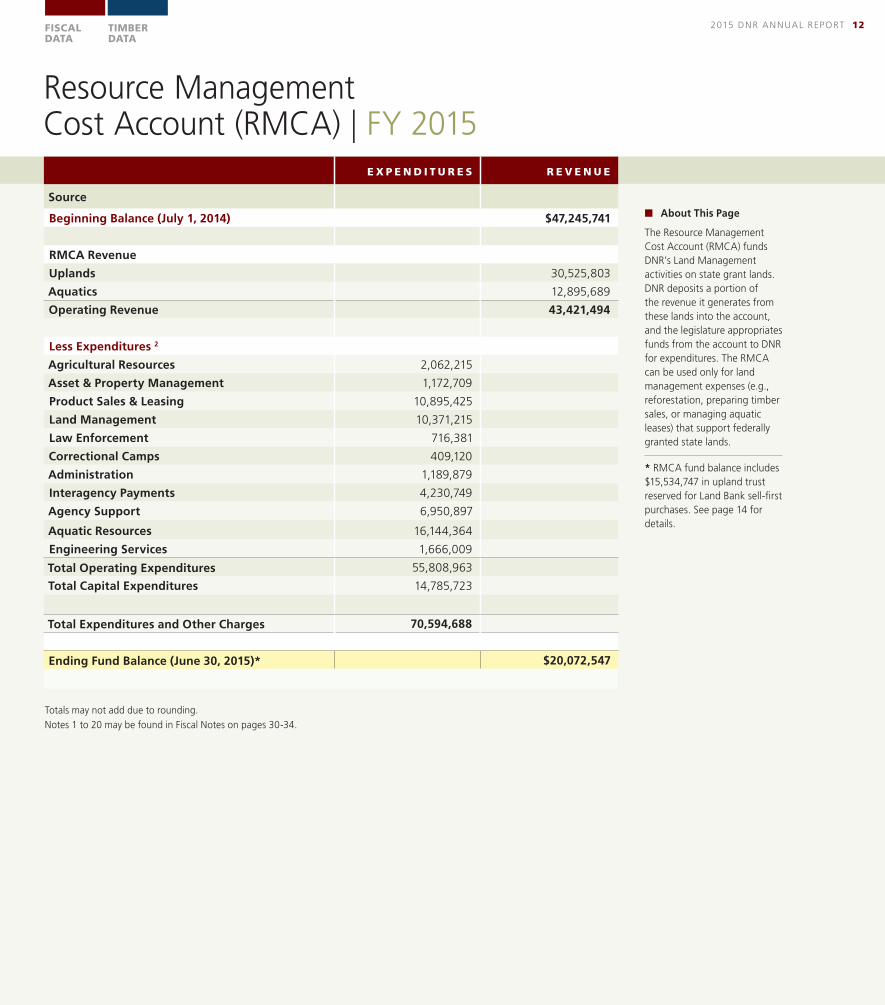
E X P E N D I T U R E S R E V E N U E
Source
Beginning Balance (July 1, 2014) $47,245,741
RMCA Revenue
Uplands 30,525,803
Aquatics 12,895,689
Operating Revenue 43,421,494
Less Expenditures 2
Agricultural Resources 2,062,215
Asset & Property Management 1,172,709
Product Sales & Leasing 10,895,425
Land Management 10,371,215
Law Enforcement 716,381
Correctional Camps 409,120
Administration 1,189,879
Interagency Payments 4,230,749
Agency Support 6,950,897
Aquatic Resources 16,144,364
Engineering Services 1,666,009
Total Operating Expenditures 55,808,963
Total Capital Expenditures 14,785,723
Total Expenditures and Other Charges 70,594,688
Ending Fund Balance (June 30, 2015)* $20,072,547
■ About This Page
The Resource Management Cost Account (RMCA) funds DNR’s Land Management activities on state grant lands. DNR deposits a portion of the revenue it generates from these lands into the account, and the legislature appropriates funds from the account to DNR for expenditures. The RMCA can be used only for land management expenses (e.g., reforestation, preparing timber sales, or managing aquatic leases) that support federally granted state lands.
* RMCA fund balance includes $15,534,747 in upland trust reserved for Land Bank sell-first purchases. See page 14 for details.
Resource Management Cost Account (RMCA) | FY 2015
2015 DNR ANNUAL REPORT 12 FISCAL DATA
TIMBER DATA
Totals may not add due to rounding.
Notes 1 to 20 may be found in Fiscal Notes on pages 30-34.
R E V E N U E D I S T R I B U T I O N
SourceGrand Total
All Funds
TrustCurrentFunds 13
TrustPermanent
Funds 13
ResourceManagement
Cost Account 15
Sales
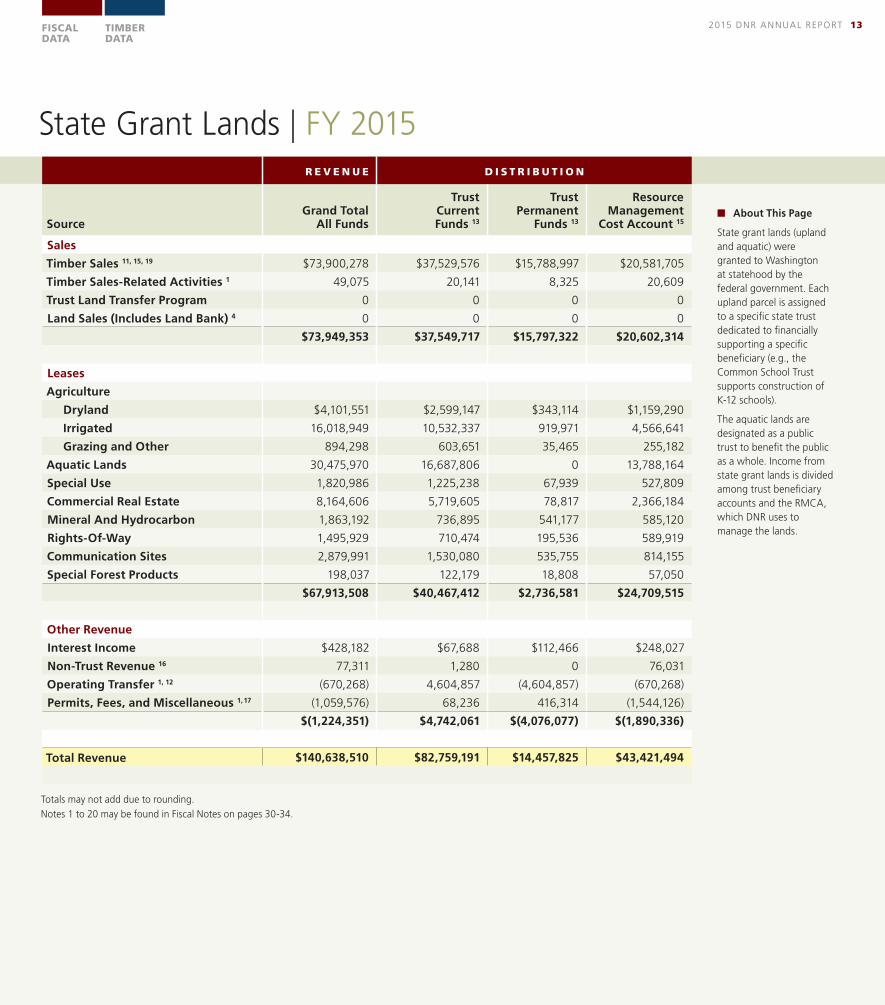
Timber Sales 11, 15, 19 $73,900,278 $37,529,576 $15,788,997 $20,581,705
Timber Sales-Related Activities 1 49,075 20,141 8,325 20,609
Trust Land Transfer Program 0 0 0 0
Land Sales (Includes Land Bank) 4 0 0 0 0
$73,949,353 $37,549,717 $15,797,322 $20,602,314
Leases
Agriculture
Dryland $4,101,551 $2,599,147 $343,114 $1,159,290
Irrigated 16,018,949 10,532,337 919,971 4,566,641
Grazing and Other 894,298 603,651 35,465 255,182
Aquatic Lands 30,475,970 16,687,806 0 13,788,164
Special Use 1,820,986 1,225,238 67,939 527,809
Commercial Real Estate 8,164,606 5,719,605 78,817 2,366,184
Mineral And Hydrocarbon 1,863,192 736,895 541,177 585,120
Rights-Of-Way 1,495,929 710,474 195,536 589,919
Communication Sites 2,879,991 1,530,080 535,755 814,155
Special Forest Products 198,037 122,179 18,808 57,050
$67,913,508 $40,467,412 $2,736,581 $24,709,515
Other Revenue
Interest Income $428,182 $67,688 $112,466 $248,027
Non-Trust Revenue 16 77,311 1,280 0 76,031
Operating Transfer 1, 12 (670,268) 4,604,857 (4,604,857) (670,268)
Permits, Fees, and Miscellaneous 1, 17 (1,059,576) 68,236 416,314 (1,544,126)
$(1,224,351) $4,742,061 $(4,076,077) $(1,890,336)
Total Revenue $140,638,510 $82,759,191 $14,457,825 $43,421,494
■ About This Page
State grant lands (upland and aquatic) were granted to Washington at statehood by the federal government. Each upland parcel is assigned to a specific state trust dedicated to financially supporting a specific beneficiary (e.g., the Common School Trust supports construction of K-12 schools).
The aquatic lands are designated as a public trust to benefit the public as a whole. Income from state grant lands is divided among trust beneficiary accounts and the RMCA, which DNR uses to manage the lands.
State Grant Lands | FY 2015
2015 DNR ANNUAL REPORT 13 FISCAL DATA
TIMBER DATA
Totals may not add due to rounding.
Notes 1 to 20 may be found in Fiscal Notes on pages 30-34.

Resource Management Cost Account (RMCA) Upland | FY 2015
SourceGranted
Trusts Land Bank*Total
Uplands
Beginning Trust Balance (July 1, 2014) $17,152,804 $15,534,733 $32,687,537
Upland Revenue
Total Upland Revenue 30,520,117 5,686 30,525,803
Less: Expenditures 2
Agricultural Resources 2,062,215 0 2,062,215
Asset & Property Management 1,172,709 0 1,172,709
Product Sales & Leasing 10,895,425 0 10,895,425
Land Management 10,371,215 0 10,371,215
Law Enforcement 716,381 0 716,381
Correctional Camps 409,120 0 409,120
Administration 832,155 0 832,155
Interagency Payments 2,517,585 0 2,517,585
Agency Support 4,548,767 0 4,548,767
Engineering Services 1,666,009 0 1,666,009
Total Operating Expenditures 35,191,582 0 35,191,582
Total Capital Expenditures 1,303,816 13,450,260 14,754,076
Total Expenditures 36,495,398 13,450,260 49,945,658
Ending Trust Balance(June 30, 2015) $11,177,523 $2,090,159 $13,267,682
About This Page
This portion of the RMCA supports the management of upland state grant lands, each of which supports a specific, designated beneficiary.
* Land Bank revenue is dedicated by law (RCW 79.19) to purchases lands that replace previously sold trust lands.
About Next Page
Generally, by law, each beneficiary of the granted land trusts receives 70 percent of the revenue earned from its lands, and the remaining 30 percent goes to the RMCA to fund DNR’s management of the lands. This chart shows the combined distribution in Fiscal Year 2015, with each trust beneficiary’s share proportional to its share of the total revenue earned, and with the RMCA share divided among DNR’s expenditures from the account for upland management activities.
Expenditures are appropriated by the legislature and are ongoing investments to keep the lands productive and to generate future income for the trusts.
* This chart is based on statewide averages. Detailed breakdown of DNR programs contain examples only, not a complete listing. This chart does not include revenue from the Agricultural School trust lands because 100 percent of revenue from those lands is distributed to the trust.
** Per Board of Natural Resources Resolution #1407, the management fund deduction of revenues from granted lands was established at 29 percent, effective July 2, 2013, through June 30, 2015.
2015 DNR ANNUAL REPORT 14 FISCAL DATA
TIMBER DATA
Totals may not add due to rounding.
Notes 1 to 20 may be found in Fiscal Notes on pages 30-34.

3.0% Univ. of Washington
0.48%Administration❙ Policy Analysis❙ Executive Management❙ Internal Audit❙ Communications❙ Budget and Economic Services ❙ Legal Affairs
8.57%Capital Investments❙ Facilities❙ Irrigation Systems❙ Property Improvements❙ Trust Land Replacement***
*** Expenditures from Land Bank.
5.0% Institutions and Prisons
1.8% Normal Schools
(WWU, EWU, CWU, and TESC)
4.6% Capitol Buildings
0.68%Asset & Property Management❙ Asset Planning❙ Land Transactions❙ Public Use❙ Recreation ❙ Washington ConservationCorps (WCC) ❙ Natural Areas❙ Natural Heritage
1.20%Agricultural Resources❙ Agricultural & Grazing Leases ❙ Weed Management❙ Permits
6.33%Product Sales & Leasing❙ Presales Activities❙ Oil, Gas, & Commercial Site Leasing❙ Rock & Gravel Sales Assessments❙ Right-of-Way Granting & Acquisition❙ Contract Administration❙ Leasing
0.24% Special Employment❙ Correction Camps Program
0.97% Engineering Services❙ Resource Mapping
2.64% Agency Support❙ Finance❙ Personnel and Equipment❙ Data Systems Management and Support❙ Geographic Information Systems❙ Region Administration❙ Facilities ❙ Environmental Analysis
1.46% Interagency Payments
0.41% Law Enforcement ❙ Investigative Services
6.02%Land Management❙ Reforestation, Pre-commercial Thinning, Fertilization, Vegetation Mgmt.❙ Genetic Improvement of Seedlings❙ Forest Nursery❙ Scientific Support❙ Data Stewardship❙ Landscape Planning
Learn more about General Distribution of Revenue from Upland State Grant Lands on page 14.
7.9% WA State University
(Scientific Trust only)
TO
TRUST BENEFICIARIES 71%
RMCA U
PLAN
D 2
9%
COM
MON SCHOOLS 48.7%
General Distribution of Revenue from Upland State Grant Lands* | FY 2015
2015 DNR ANNUAL REPORT 15 FISCAL DATA
TIMBER DATA
RESOURCE MANAGEMENT
COST ACCOUNT (RMCA) UPLAND
29%**
DISTRIBUTED TO TRUST BENEFICIARIES 71%
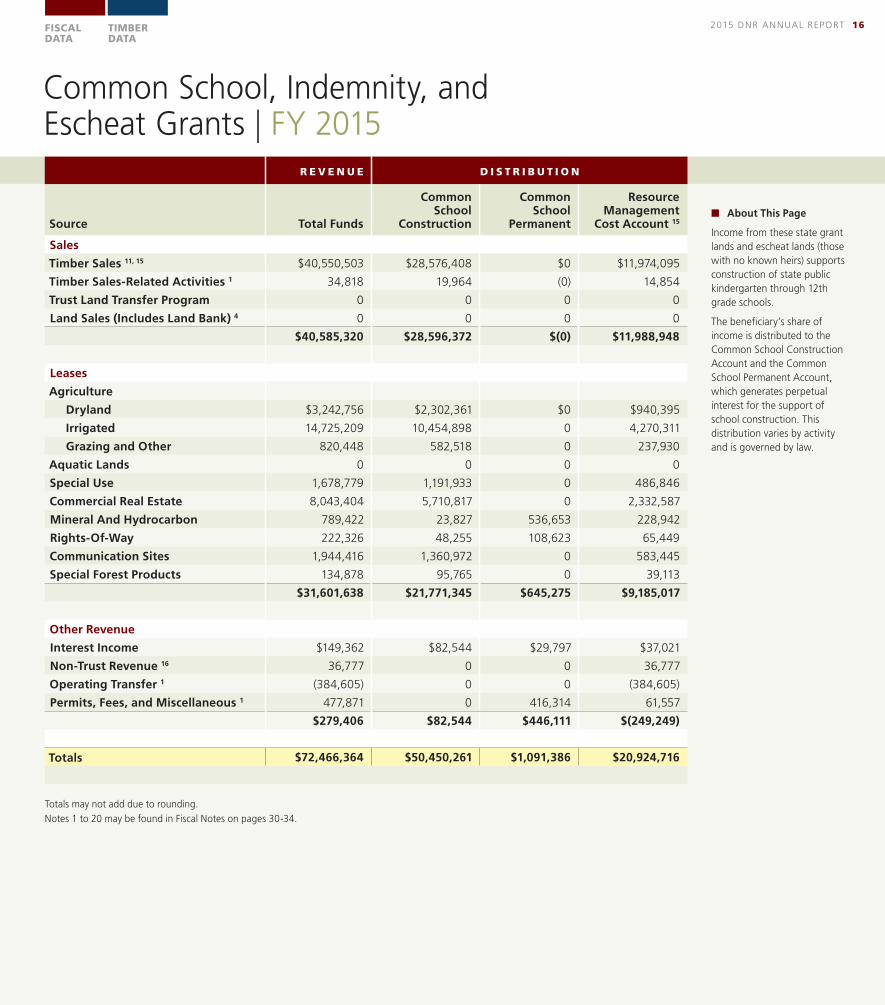
Common School, Indemnity, and Escheat Grants | FY 2015
R E V E N U E D I S T R I B U T I O N
Source Total Funds
CommonSchool
Construction
CommonSchool
Permanent
ResourceManagement
Cost Account 15
Sales
Timber Sales 11, 15 $40,550,503 $28,576,408 $0 $11,974,095
Timber Sales-Related Activities 1 34,818 19,964 (0) 14,854
Trust Land Transfer Program 0 0 0 0
Land Sales (Includes Land Bank) 4 0 0 0 0
$40,585,320 $28,596,372 $(0) $11,988,948
Leases
Agriculture
Dryland $3,242,756 $2,302,361 $0 $940,395
Irrigated 14,725,209 10,454,898 0 4,270,311
Grazing and Other 820,448 582,518 0 237,930
Aquatic Lands 0 0 0 0
Special Use 1,678,779 1,191,933 0 486,846
Commercial Real Estate 8,043,404 5,710,817 0 2,332,587
Mineral And Hydrocarbon 789,422 23,827 536,653 228,942
Rights-Of-Way 222,326 48,255 108,623 65,449
Communication Sites 1,944,416 1,360,972 0 583,445
Special Forest Products 134,878 95,765 0 39,113
$31,601,638 $21,771,345 $645,275 $9,185,017
Other Revenue
Interest Income $149,362 $82,544 $29,797 $37,021
Non-Trust Revenue 16 36,777 0 0 36,777
Operating Transfer 1 (384,605) 0 0 (384,605)
Permits, Fees, and Miscellaneous 1 477,871 0 416,314 61,557
$279,406 $82,544 $446,111 $(249,249)
Totals $72,466,364 $50,450,261 $1,091,386 $20,924,716
■ About This Page
Income from these state grant lands and escheat lands (those with no known heirs) supports construction of state public kindergarten through 12th grade schools.
The beneficiary’s share of income is distributed to the Common School Construction Account and the Common School Permanent Account, which generates perpetual interest for the support of school construction. This distribution varies by activity and is governed by law.
2015 DNR ANNUAL REPORT 16 FISCAL DATA
TIMBER DATA
Totals may not add due to rounding.
Notes 1 to 20 may be found in Fiscal Notes on pages 30-34.

University Grants Original and Transferred (UW) | FY 2015
R E V E N U E D I S T R I B U T I O N
Source 19 Total Funds
UW Retirement
Bond
State (UW) University
Permanent
ResourceManagement
Cost Account 15
Sales
Timber Sales $4,129,454 $0 $2,936,475 $1,192,980
Timber Sales-Related Activities 1 (1,690) 0 (1,741) 51
Land Sales (Includes Land Bank) 0 0 0 0
$4,127,764 $0 $2,934,734 $1,193,031
Leases
Agriculture
Dryland $190,739 $0 $135,426 $55,314
Irrigated 0 0 0 0
Grazing and Other 27,264 0 19,358 7,907
Aquatic Lands 0 0 0 0
Special Use 7,233 0 5,136 2,098
Commercial Real Estate 103,472 0 73,465 30,007
Mineral And Hydrocarbon 0 0 0 0
Rights-Of-Way 2,402 0 1,705 697
Communication Sites 0 0 0 0
Special Forest Products 7,353 0 5,226 2,127
$338,463 $0 $240,316 $98,148
Other Revenue
Interest Income $14,390 $367 $279 $13,744
Non-Trust Revenue 16 2,275 0 0 2,275
Operating Transfer 1, 12 0 2,772,077 (2,772,077) 0
Permits, Fees, and Miscellaneous 1 290 0 0 290
$16,955 $2,772,443 $(2,771,797) $16,309
Totals $4,483,182 $2,772,443 $403,252 $1,307,487
■ About This Page
Income from these state grant lands supports construction of buildings for the University of Washington. Some of these lands were acquired at the time of statehood, and some lands were transferred to this trust from the CEP&RI trust by the legislature in 1893.
The beneficiary’s share of income is distributed to the University Permanent and UW Bond Retirement accounts. This distribution varies by activity and is governed by law.
2015 DNR ANNUAL REPORT 17 FISCAL DATA
TIMBER DATA
Totals may not add due to rounding.
Notes 1 to 20 may be found in Fiscal Notes on pages 30-34.

Charitable, Educational, Penal, and Reformatory Institutions Grant (CEP&RI) | FY 2015
R E V E N U E D I S T R I B U T I O N
Source Total FundsCEP & RI Account
ResourceManagement
Cost Account 15
Sales
Timber Sales $5,914,897 $4,199,577 $1,715,320
Timber Sales-Related Activities 1 250 177 72
Land Sales (Includes Land Bank) 0 0 0
$5,915,147 $4,199,754 $1,715,393
Leases
Agriculture
Dryland $334,955 $237,818 $97,137
Irrigated 6,350 4,509 1,842
Grazing and Other 13,846 9,831 4,015
Aquatic Lands 0 0 0
Special Use 5,888 4,180 1,708
Commercial Real Estate 11,150 7,917 3,234
Mineral And Hydrocarbon 818,987 581,480 237,506
Rights-Of-Way 63,910 45,376 18,534
Communication Sites 183,048 129,724 53,324
Special Forest Products 24,756 17,577 7,179
$1,462,891 $1,038,413 $424,478
Other Revenue
Interest Income $22,131 $1,903 $20,228
Non-Trust Revenue 16 3,774 0 3,774
Operating Transfer 0 0 0
Permits, Fees, and Miscellaneous 1 2,749 304 2,445
$28,654 $2,207 $26,447
Totals $7,406,692 $5,240,374 $2,166,318
■ About This Page
Income from these state grant lands is used to establish and maintain institutions managed by the Department of Corrections (such as prisons) and the Department of Social and Health Services (such as the Western State Hospital).
The beneficiary’s share of income is distributed to the CEP&RI Account.
2015 DNR ANNUAL REPORT 18 FISCAL DATA
TIMBER DATA
Totals may not add due to rounding.
Notes 1 to 20 may be found in Fiscal Notes on pages 30-34.
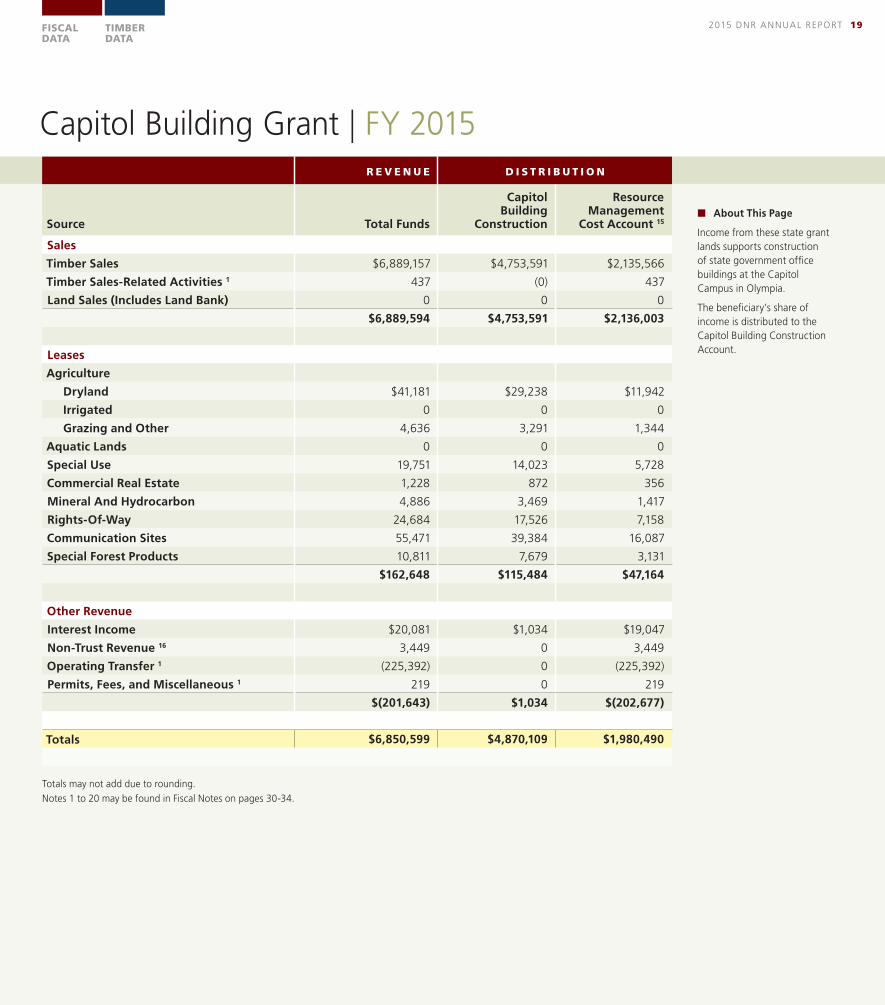
Capitol Building Grant | FY 2015
R E V E N U E D I S T R I B U T I O N
Source Total Funds
Capitol Building
Construction
ResourceManagement
Cost Account 15
Sales
Timber Sales $6,889,157 $4,753,591 $2,135,566
Timber Sales-Related Activities 1 437 (0) 437
Land Sales (Includes Land Bank) 0 0 0
$6,889,594 $4,753,591 $2,136,003
Leases
Agriculture
Dryland $41,181 $29,238 $11,942
Irrigated 0 0 0
Grazing and Other 4,636 3,291 1,344
Aquatic Lands 0 0 0
Special Use 19,751 14,023 5,728
Commercial Real Estate 1,228 872 356
Mineral And Hydrocarbon 4,886 3,469 1,417
Rights-Of-Way 24,684 17,526 7,158
Communication Sites 55,471 39,384 16,087
Special Forest Products 10,811 7,679 3,131
$162,648 $115,484 $47,164
Other Revenue
Interest Income $20,081 $1,034 $19,047
Non-Trust Revenue 16 3,449 0 3,449
Operating Transfer 1 (225,392) 0 (225,392)
Permits, Fees, and Miscellaneous 1 219 0 219
$(201,643) $1,034 $(202,677)
Totals $6,850,599 $4,870,109 $1,980,490
■ About This Page
Income from these state grant lands supports construction of state government office buildings at the Capitol Campus in Olympia.
The beneficiary’s share of income is distributed to the Capitol Building Construction Account.
2015 DNR ANNUAL REPORT 19 FISCAL DATA
TIMBER DATA
Totals may not add due to rounding.
Notes 1 to 20 may be found in Fiscal Notes on pages 30-34.

Normal School Grant (EWU, CWU, WWU and TESC) | FY 2015
R E V E N U E D I S T R I B U T I O N
Source Total Funds
EWU, CWU, WWU, TESC
Capital Projects
NormalSchool
Permanent
ResourceManagement
Cost Account 15
Sales
Timber Sales 11, 15 $2,416,736 $0 $1,744,911 $671,825
Timber Sales-Related Activities 1 89 0 48 41
Land Sales (Includes Land Bank) 0 0 0 0
$2,416,825 $0 $1,744,959 $671,866
Leases
Agriculture
Dryland $41,873 $29,730 $0 $12,143
Irrigated 102,718 72,930 0 29,788
Grazing and Other 11,283 8,011 0 3,272
Aquatic Lands 0 0 0 0
Special Use 21,270 15,101 0 6,168
Commercial Real Estate 0 0 0 0
Mineral and Hydrocarbon 0 0 0 0
Rights-Of-Way 4,858 0 3,398 1,460
Communication Sites 0 0 0 0
Special Forest Products 1,631 1,158 0 473
$183,632 $126,930 $3,398 $53,305
Other Revenue
Interest Income $6,914 $414 $3 $6,497
Non-Trust Revenue 16 1,172 0 0 1,172
Operating Transfer 1 (60,271) 0 0 (60,271)
Permits, Fees, and Miscellaneous 1 477 0 0 477
$(51,708) $414 $3 $(52,125)
Totals $2,548,749 $127,344 $1,748,360 $673,045
■ About This Page
Income from these state grant lands supports construction at Eastern Washington University, Central Washington University, and Western Washington University (regional universities). These three universities were originally called ‘normal schools.’ The Evergreen State College (TESC) was added to this trust by the legislature to begin receiving revenue after July 1, 1995.
The beneficiary’s share of income is distributed to the Normal School Permanent Account and capital project accounts for each university. This distribution varies by activity and is governed by law.
2015 DNR ANNUAL REPORT 20 FISCAL DATA
TIMBER DATA
Totals may not add due to rounding.
Notes 1 to 20 may be found in Fiscal Notes on pages 30-34.
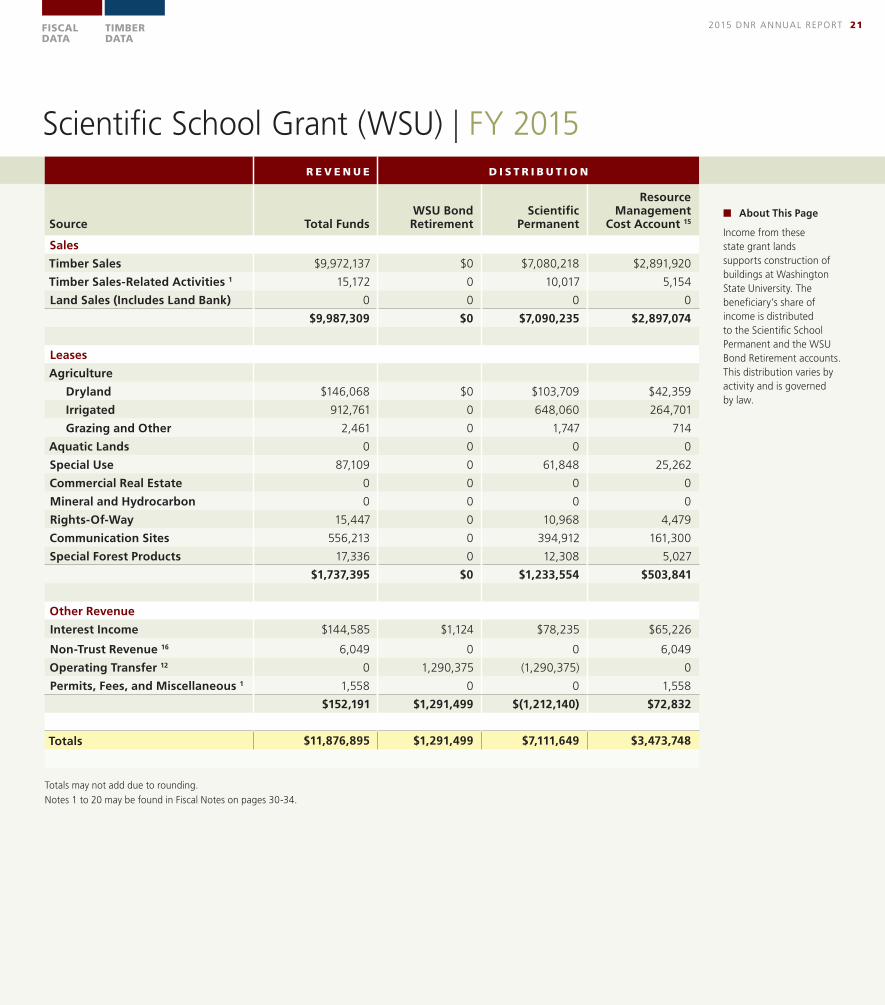
Scientific School Grant (WSU) | FY 2015
R E V E N U E D I S T R I B U T I O N
Source Total FundsWSU Bond Retirement
ScientificPermanent
ResourceManagement
Cost Account 15
Sales
Timber Sales $9,972,137 $0 $7,080,218 $2,891,920
Timber Sales-Related Activities 1 15,172 0 10,017 5,154
Land Sales (Includes Land Bank) 0 0 0 0
$9,987,309 $0 $7,090,235 $2,897,074
Leases
Agriculture
Dryland $146,068 $0 $103,709 $42,359
Irrigated 912,761 0 648,060 264,701
Grazing and Other 2,461 0 1,747 714
Aquatic Lands 0 0 0 0
Special Use 87,109 0 61,848 25,262
Commercial Real Estate 0 0 0 0
Mineral and Hydrocarbon 0 0 0 0
Rights-Of-Way 15,447 0 10,968 4,479
Communication Sites 556,213 0 394,912 161,300
Special Forest Products 17,336 0 12,308 5,027
$1,737,395 $0 $1,233,554 $503,841
Other Revenue
Interest Income $144,585 $1,124 $78,235 $65,226
Non-Trust Revenue 16 6,049 0 0 6,049
Operating Transfer 12 0 1,290,375 (1,290,375) 0
Permits, Fees, and Miscellaneous 1 1,558 0 0 1,558
$152,191 $1,291,499 $(1,212,140) $72,832
Totals $11,876,895 $1,291,499 $7,111,649 $3,473,748
■ About This Page
Income from these state grant lands supports construction of buildings at Washington State University. The beneficiary’s share of income is distributed to the Scientific School Permanent and the WSU Bond Retirement accounts. This distribution varies by activity and is governed by law.
2015 DNR ANNUAL REPORT 21 FISCAL DATA
TIMBER DATA
Totals may not add due to rounding.
Notes 1 to 20 may be found in Fiscal Notes on pages 30-34.

Agricultural College Trust Management Account (ACTMA) | FY 2015
E X P E N D I T U R E S R E V E N U E
Source
Beginning Fund Balance (July 1, 2014) $195,325
Revenue
Operating Revenue * 2,461
Interfund Transfer from General Fund 5 1,310,000
Total Revenue 1,312,461
Less Expenditures 2
Agricultural Resources 40,659
Asset & Property Management 30,629
Product Sales & Leasing 378,738
Land Management 255,992
Law Enforcement 23,197
Correctional Camps 8,493
Administration 32,003
Interagency Payments 63,383
Agency Support 156,945
Engineering Services 57,061
Total Operating Expenditures 1,047,100
Total Capital Expenditures 0
Total Expenditures and Other Charges 1,047,100
Ending Fund Balance (June 30, 2015) $460,685
■ About This Page
This account funds DNR’s management of the Agricultural College trust lands. The ACTMA is funded through an appropriation from the state General Fund. (As of July 1, 1999, Agricultural College trust lands do not contribute to the RMCA, which supports DNR’s management of other state grant lands.)
*Includes treasurer’s interest. See accompanying notes on pages 10-14.
2015 DNR ANNUAL REPORT 22 FISCAL DATA
TIMBER DATA
Totals may not add due to rounding.
Notes 1 to 20 may be found in Fiscal Notes on pages 30-34.
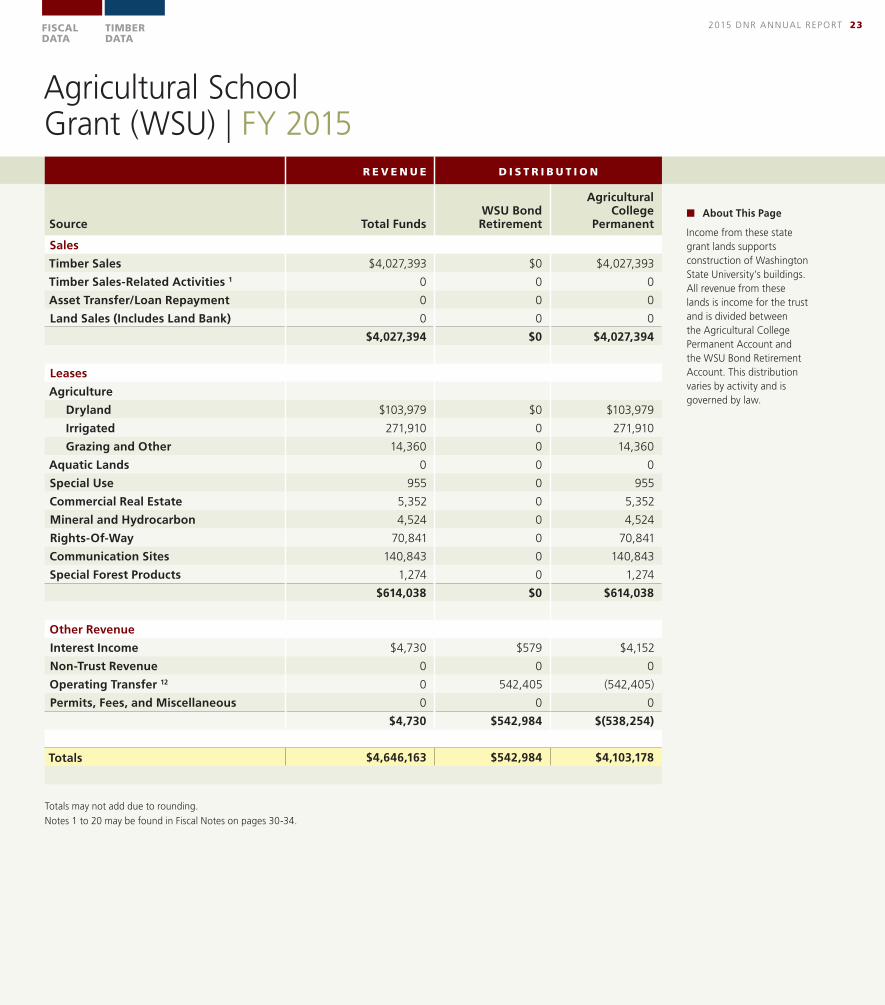
Agricultural School Grant (WSU) | FY 2015
R E V E N U E D I S T R I B U T I O N
Source Total FundsWSU Bond Retirement
Agricultural College
Permanent
Sales
Timber Sales $4,027,393 $0 $4,027,393
Timber Sales-Related Activities 1 0 0 0
Asset Transfer/Loan Repayment 0 0 0
Land Sales (Includes Land Bank) 0 0 0
$4,027,394 $0 $4,027,394
Leases
Agriculture
Dryland $103,979 $0 $103,979
Irrigated 271,910 0 271,910
Grazing and Other 14,360 0 14,360
Aquatic Lands 0 0 0
Special Use 955 0 955
Commercial Real Estate 5,352 0 5,352
Mineral and Hydrocarbon 4,524 0 4,524
Rights-Of-Way 70,841 0 70,841
Communication Sites 140,843 0 140,843
Special Forest Products 1,274 0 1,274
$614,038 $0 $614,038
Other Revenue
Interest Income $4,730 $579 $4,152
Non-Trust Revenue 0 0 0
Operating Transfer 12 0 542,405 (542,405)
Permits, Fees, and Miscellaneous 0 0 0
$4,730 $542,984 $(538,254)
Totals $4,646,163 $542,984 $4,103,178
■ About This Page
Income from these state grant lands supports construction of Washington State University’s buildings. All revenue from these lands is income for the trust and is divided between the Agricultural College Permanent Account and the WSU Bond Retirement Account. This distribution varies by activity and is governed by law.
2015 DNR ANNUAL REPORT 23 FISCAL DATA
TIMBER DATA
Totals may not add due to rounding.
Notes 1 to 20 may be found in Fiscal Notes on pages 30-34.

Forest Development Account (FDA) | FY 2015
E X P E N D I T U R E S R E V E N U E
Source
Beginning Fund Balance (July 1, 2014) $8,947,401
Revenue
Operating Revenue 23,495,310
Total Revenue 23,495,310
Less Expenditures 2
Agricultural Resources 3
Asset & Property Management 494,136
Product Sales & Leasing 8,670,064
Land Management 8,060,384
Law Enforcement 210,166
Correctional Camps 348,918
Administration 666,884
Interagency Payments 1,766,201
Agency Support 3,177,260
Engineering Services 1,605,386
Total Operating Expenditures 24,999,402
Total Capital Expenditures 710,864
Total Expenditures and Other Charges 25,710,266
Ending Fund Balance (June 30, 2015) $6,732,445
About Next Page
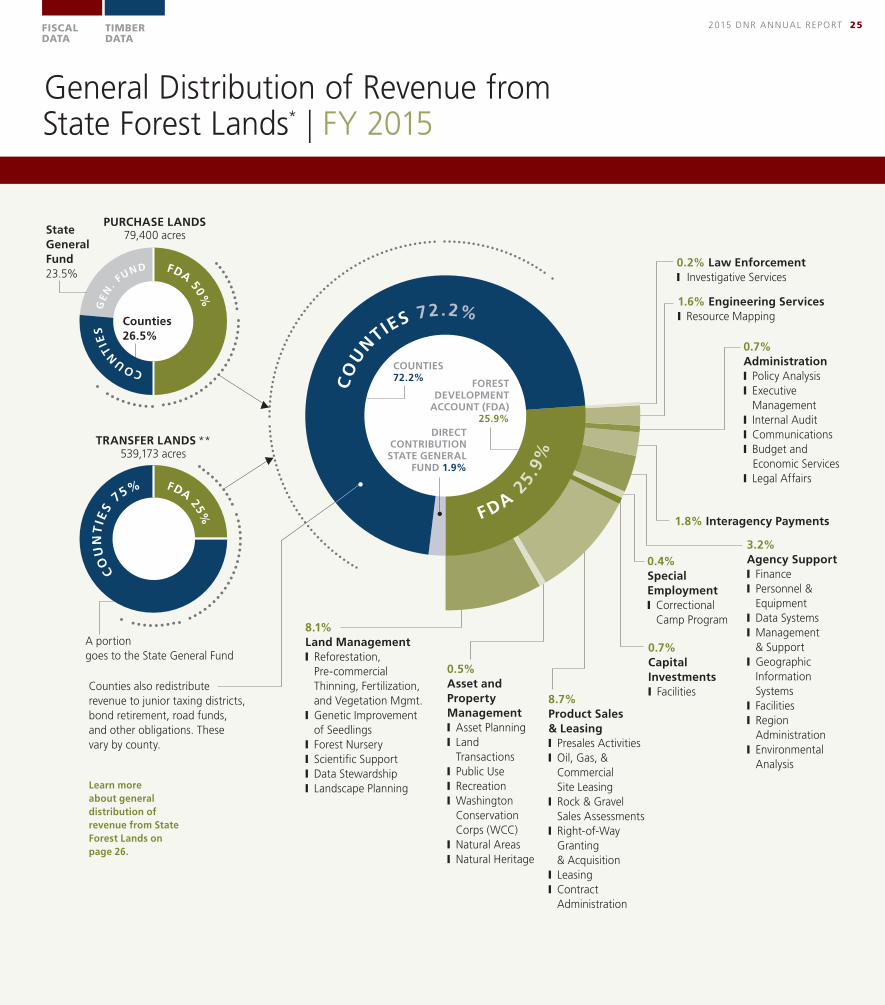
By law, revenue from State Forest Lands (formerly known as Forest Board Lands) goes to the county in which the land is located, the state general fund for the support of Common Schools, and to the FDA to fund DNR’s management of the lands. Distribution differs for Transfer lands and Purchase lands—see the small pie charts.
The large pie chart shows the combined total distribution for Fiscal Year 2015, with the FDA share divided among DNR’s expenditures from the account. Expenditures are appropriated by the legislature and are ongoing investments to keep the lands productive and to generate future revenue.
* This chart is based on statewide averages. Detailed breakdown of DNR programs contains examples only, not a complete listing.
** Per Board of Natural Resources Resolution No.1408, the management fund deduction for FDA was increased to 25% effective 7/2/13.
Totals may not add due to rounding. Notes 1 to 20 may be found in Fiscal
Notes on pages 30-34.
Purchase lands, see definition on page 26. Transfer lands, see definition on page 27.■ About This Page
The FDA funds DNR’s land management activities on State Forest Lands (formerly known as Forest Board Lands) in 21 counties. DNR deposits a portion of the revenue it generates from these lands into the FDA, and the legislature appropriates funds from the account to DNR for expenditures. The FDA is used for trust land management expenses (e.g., reforestation, preparing timber sales) on State Forest Lands.
2015 DNR ANNUAL REPORT 24 FISCAL DATA
TIMBER DATA
Totals may not add due to rounding.
Notes 1 to 20 may be found in Fiscal Notes on pages 30-34.
0.5%Asset and Property Management❙ Asset Planning❙ Land Transactions❙ Public Use ❙ Recreation❙ Washington Conservation Corps (WCC) ❙ Natural Areas❙ Natural Heritage
8.7%Product Sales & Leasing❙ Presales Activities❙ Oil, Gas, & Commercial Site Leasing❙ Rock & Gravel Sales Assessments❙ Right-of-Way Granting & Acquisition❙ Leasing❙ Contract Administration
1.6% Engineering Services❙ Resource Mapping
1.8% Interagency Payments
8.1%Land Management❙ Reforestation, Pre-commercial Thinning, Fertilization, and Vegetation Mgmt.❙ Genetic Improvement of Seedlings❙ Forest Nursery❙ Scientific Support❙ Data Stewardship❙ Landscape Planning
0.2% Law Enforcement ❙ Investigative Services
0.7%Administration❙ Policy Analysis❙ Executive Management❙ Internal Audit❙ Communications❙ Budget and Economic Services ❙ Legal Affairs
A portion goes to the State General Fund
Counties also redistribute revenue to junior taxing districts, bond retirement, road funds, and other obligations. These vary by county.
CO
UN
TIE
S
75% FDA 25% COUN
TIE
S
GE
N. F
UND FDA 50%
TRANSFER LANDS **539,173 acres
PURCHASE LANDS79,400 acresState
General Fund23.5%
Counties 26.5%
0.4%Special Employment❙ Correctional Camp Program
0.7%CapitalInvestments❙ Facilities
3.2% Agency Support❙ Finance❙ Personnel & Equipment❙ Data Systems ❙ Management & Support❙ Geographic Information Systems❙ Facilities❙ Region Administration ❙ Environmental Analysis
Learn more about general distribution of revenue from State Forest Lands on page 26.
General Distribution of Revenue from State Forest Lands* | FY 2015
2015 DNR ANNUAL REPORT 25
CO
UN
TIES 72 .2%
FDA 25.
9%
DIRECT CONTRIBUTION STATE GENERAL
FUND 1.9%
COUNTIES 72.2%
FOREST DEVELOPMENT
ACCOUNT (FDA) 25.9%
FISCAL DATA
TIMBER DATA
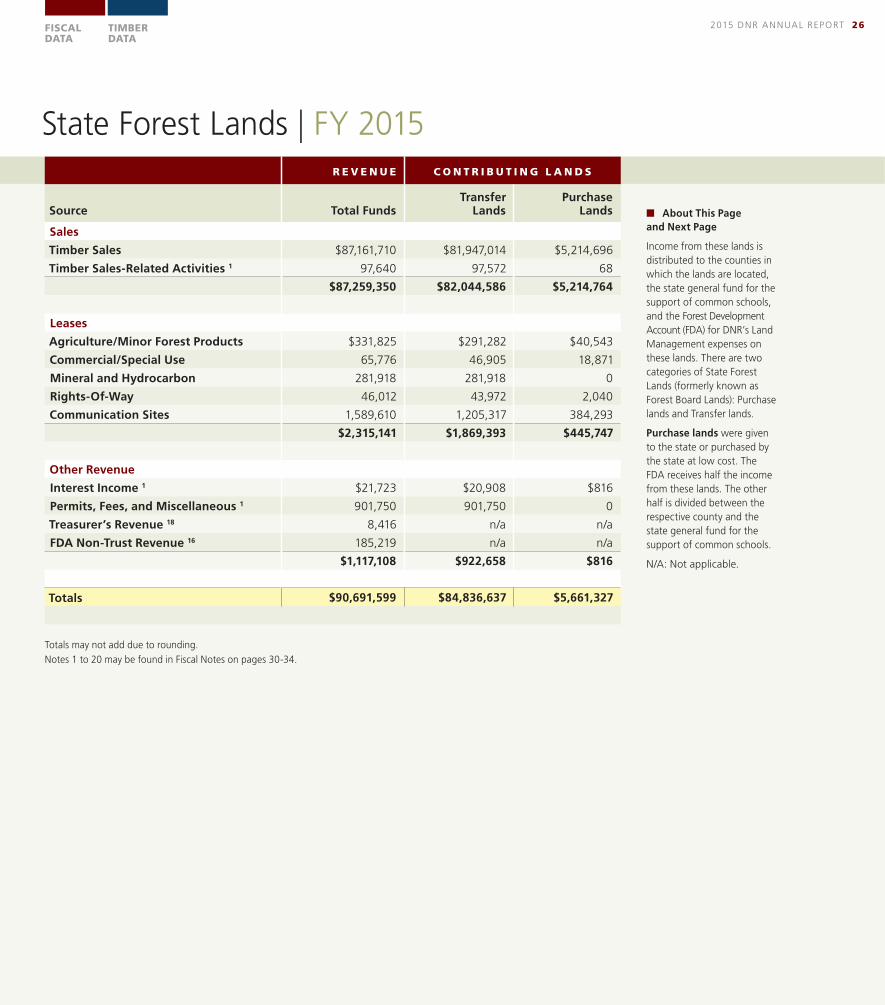
State Forest Lands | FY 2015
R E V E N U E C O N T R I B U T I N G L A N D S
Source Total FundsTransfer
LandsPurchase
Lands
Sales
Timber Sales $87,161,710 $81,947,014 $5,214,696
Timber Sales-Related Activities 1 97,640 97,572 68
$87,259,350 $82,044,586 $5,214,764
Leases
Agriculture/Minor Forest Products $331,825 $291,282 $40,543
Commercial/Special Use 65,776 46,905 18,871
Mineral and Hydrocarbon 281,918 281,918 0
Rights-Of-Way 46,012 43,972 2,040
Communication Sites 1,589,610 1,205,317 384,293
$2,315,141 $1,869,393 $445,747
Other Revenue
Interest Income 1 $21,723 $20,908 $816
Permits, Fees, and Miscellaneous 1 901,750 901,750 0
Treasurer’s Revenue 18 8,416 n/a n/a
FDA Non-Trust Revenue 16 185,219 n/a n/a
$1,117,108 $922,658 $816
Totals $90,691,599 $84,836,637 $5,661,327
■ About This Page and Next Page
Income from these lands is distributed to the counties in which the lands are located, the state general fund for the support of common schools, and the Forest Development Account (FDA) for DNR’s Land Management expenses on these lands. There are two categories of State Forest Lands (formerly known as Forest Board Lands): Purchase lands and Transfer lands.
Purchase lands were given to the state or purchased by the state at low cost. The FDA receives half the income from these lands. The other half is divided between the respective county and the state general fund for the support of common schools.
N/A: Not applicable.
2015 DNR ANNUAL REPORT 26 FISCAL DATA
TIMBER DATA
Totals may not add due to rounding.
Notes 1 to 20 may be found in Fiscal Notes on pages 30-34.

State Forest Lands | FY 2015
R E V E N U E D I S T R I B U T I O N C O N T R I B U T I N G L A N D S
Recipient Total Funds Transfer Lands Purchase Lands
County
Clallam $4,633,935 $4,633,010 $924
Clark 6,067,327 6,064,545 2,781
Cowlitz 4,118,337 4,112,638 5,699
Grays Harbor 754,535 66,377 688,158
Jefferson 2,507,316 2,507,316 0
King 2,215,324 2,215,324 0
Kitsap 167,467 146,165 21,302
Klickitat 538,918 538,918 0
Lewis 7,311,380 7,311,054 327
Mason 7,506,928 7,506,296 632
Okanogan 17 (2) (2) 0
Pacific 1,412,178 1,402,768 9,410
Pierce 222,815 0 222,815
Skagit 9,752,370 9,747,918 4,452
Skamania 3 1,664,967 1,657,446 7,522
Snohomish 9,703,697 9,703,697 0
Stevens 73,015 73,015 0
Thurston 3,382,138 2,529,242 852,896
Wahkiakum 1,633,411 1,633,411 0
Whatcom 1,765,415 1,751,559 13,856
Treasurer's Revenue 18 8,416 n/a n/a
$65,439,888 $63,600,698 $1,830,773
Forest Development Account
Trust Activity $23,078,906 $21,005,134 $2,073,772
Permits, Fees, & Miscellaneous 1 231,185 230,805 380
Treasurer's Revenue 0 n/a n/a
FDA Non-Trust Revenue 16 185,219 n/a n/a
$23,495,309 $21,235,939 $2,074,152
General Fund - State $1,756,401 $0 $1,756,401
Totals $90,691,599 $84,836,637 $5,661,327
Transfer lands were forfeited to the counties in which they were located when the private landowners failed to pay property taxes, primarily in the 1920s and 1930s. The counties turned the lands over to the state. DNR now manages these lands and distributes at least 75 percent of the income to the counties and up to 25 percent of the income to the Forest Development Account (FDA).
N/A: not applicable.
CONTINUED
2015 DNR ANNUAL REPORT 27 FISCAL DATA
TIMBER DATA
Totals may not add due to rounding.
Notes 1 to 20 may be found in Fiscal Notes on pages 30-34.
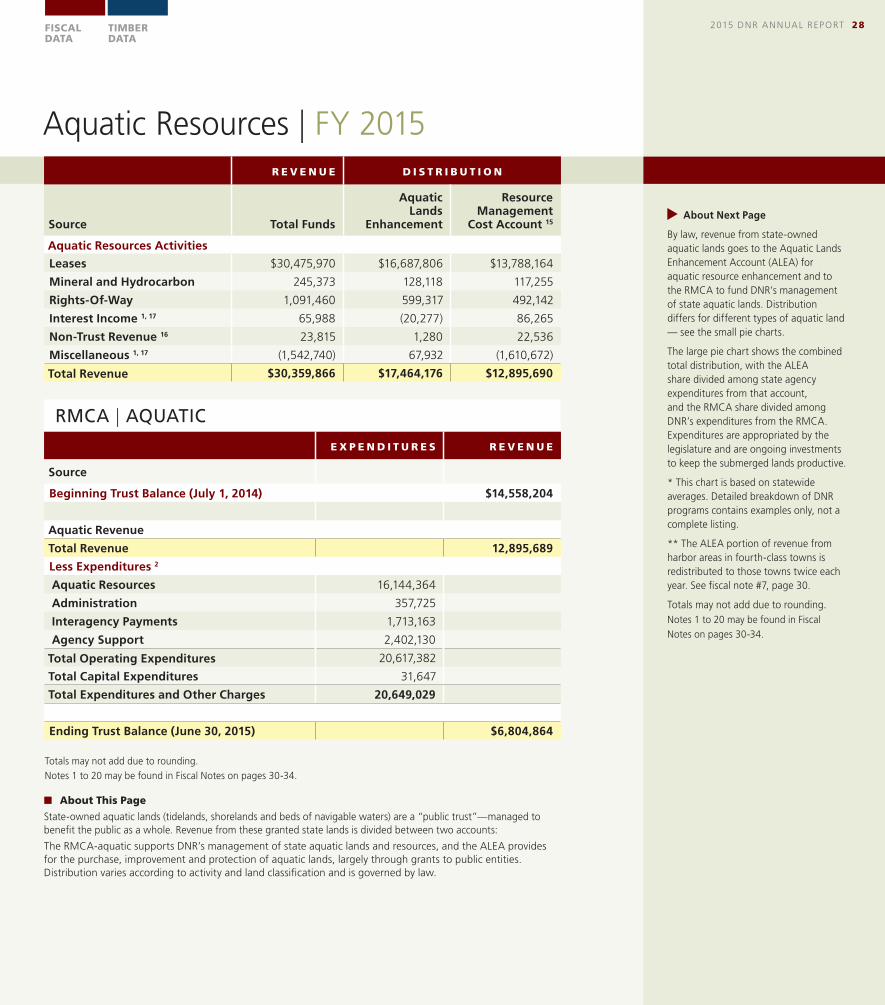
Aquatic Resources | FY 2015
R E V E N U E D I S T R I B U T I O N
Source Total Funds
Aquatic Lands
Enhancement
Resource Management
Cost Account 15
Aquatic Resources Activities
Leases $30,475,970 $16,687,806 $13,788,164
Mineral and Hydrocarbon 245,373 128,118 117,255
Rights-Of-Way 1,091,460 599,317 492,142
Interest Income 1, 17 65,988 (20,277) 86,265
Non-Trust Revenue 16 23,815 1,280 22,536
Miscellaneous 1, 17 (1,542,740) 67,932 (1,610,672)
Total Revenue $30,359,866 $17,464,176 $12,895,690
E X P E N D I T U R E S R E V E N U E
Source
Beginning Trust Balance (July 1, 2014) $14,558,204
Aquatic Revenue
Total Revenue 12,895,689
Less Expenditures 2
Aquatic Resources 16,144,364
Administration 357,725
Interagency Payments 1,713,163
Agency Support 2,402,130
Total Operating Expenditures 20,617,382
Total Capital Expenditures 31,647
Total Expenditures and Other Charges 20,649,029
Ending Trust Balance (June 30, 2015) $6,804,864
RMCA | AQUATIC
About Next Page
By law, revenue from state-owned aquatic lands goes to the Aquatic Lands Enhancement Account (ALEA) for aquatic resource enhancement and to the RMCA to fund DNR’s management of state aquatic lands. Distribution differs for different types of aquatic land — see the small pie charts.
The large pie chart shows the combined total distribution, with the ALEA share divided among state agency expenditures from that account, and the RMCA share divided among DNR’s expenditures from the RMCA. Expenditures are appropriated by the legislature and are ongoing investments to keep the submerged lands productive.
* This chart is based on statewide averages. Detailed breakdown of DNR programs contains examples only, not a complete listing.
** The ALEA portion of revenue from harbor areas in fourth-class towns is redistributed to those towns twice each year. See fiscal note #7, page 30.
Totals may not add due to rounding. Notes 1 to 20 may be found in Fiscal
Notes on pages 30-34.
■ About This Page
State-owned aquatic lands (tidelands, shorelands and beds of navigable waters) are a “public trust”—managed to benefit the public as a whole. Revenue from these granted state lands is divided between two accounts:
The RMCA-aquatic supports DNR’s management of state aquatic lands and resources, and the ALEA provides for the purchase, improvement and protection of aquatic lands, largely through grants to public entities. Distribution varies according to activity and land classification and is governed by law.
2015 DNR ANNUAL REPORT 28 FISCAL DATA
TIMBER DATA
Totals may not add due to rounding.
Notes 1 to 20 may be found in Fiscal Notes on pages 30-34.
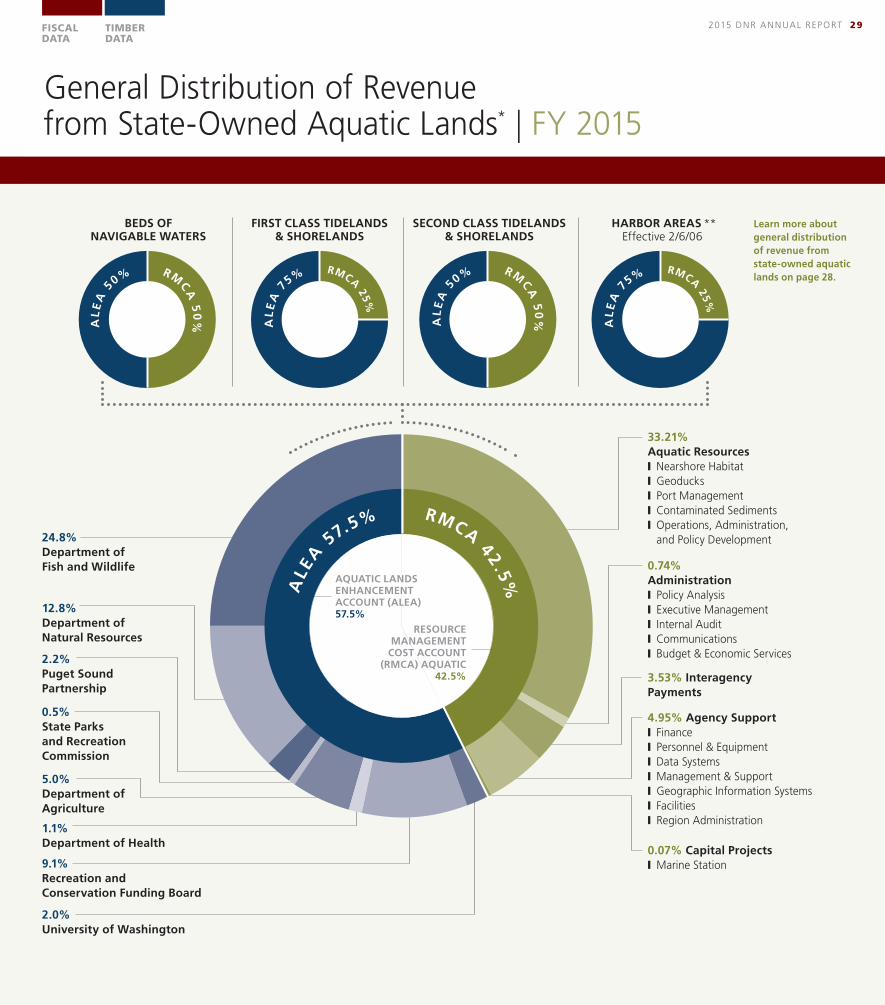
0.5%State Parks and Recreation Commission
1.1%Department of Health
2.2%Puget Sound Partnership
12.8%Department of Natural Resources
9.1% Recreation and Conservation Funding Board
2.0% University of Washington
24.8% Department of Fish and Wildlife
5.0% Department of Agriculture
0.74%Administration❙ Policy Analysis❙ Executive Management❙ Internal Audit❙ Communications❙ Budget & Economic Services
3.53% InteragencyPayments
4.95% Agency Support❙ Finance❙ Personnel & Equipment❙ Data Systems ❙ Management & Support❙ Geographic Information Systems❙ Facilities❙ Region Administration
0.07% Capital Projects❙ Marine Station
33.21%Aquatic Resources❙ Nearshore Habitat❙ Geoducks❙ Port Management❙ Contaminated Sediments❙ Operations, Administration, and Policy Development
Learn more about general distribution of revenue from state-owned aquatic lands on page 28.
A
LE
A 5
0% RM
CA
50
%
A
LE
A 5
0% RM
CA
50
%
A
LE
A 7
5% RMCA 25%
A
LE
A 7
5% RMCA 25%
BEDS OF NAVIGABLE WATERS
FIRST CLASS TIDELANDS & SHORELANDS
SECOND CLASS TIDELANDS & SHORELANDS
HARBOR AREAS ** Effective 2/6/06
General Distribution of Revenue from State-Owned Aquatic Lands* | FY 2015
ALE
A
57.5% RMCA 42.5%AQUATIC LANDS ENHANCEMENT ACCOUNT (ALEA) 57.5%
2015 DNR ANNUAL REPORT 29 FISCAL DATA
TIMBER DATA
RESOURCE MANAGEMENT
COST ACCOUNT (RMCA) AQUATIC
42.5%

ACRONYMS
These numbered notes provide context and explanations for data in the tables on the fiscal pages that follow, where they are referred to by numerical superscript. A note may apply to more than one page. Although similar to notes in prior reports, these notes apply only to this report (FY 2015).
Fiscal Notes
ACTMA Agricultural College Trust Management AccountAFRS Agency Financial Reporting SystemALEA Aquatic Lands Enhancement AccountCEP&RI Charitable, Educational, Penal, and Reformatory Institutions TrustCOLA Cost of Living AdjustmentCWU Central Washington UniversityEWU Eastern Washington UniversityFDA Forest Development AccountFY15 Fiscal Year 2015 (July 1, 2014 – June 30, 2015)K-12 Kindergarten to 12th grade schoolsRMCA Resource Management Cost AccountTESC The Evergreen State CollegeUW University of WashingtonWSU Washington State UniversityWWU Western Washington University
1 | REVENUE SOURCES
Timber sales include non-trust activity for contract harvesting sales.
Timber sale-related activities include contract extensions, slash disposal, trespasses, and default settlement payments.
Miscellaneous sales include publications, GIS data, honor camp activities, and surveys and maps.
Miscellaneous leases include special use and special forest products.
Interest income includes interest on contracts, interest assessed for late payments, and interest earned from account (treasurer’s interest).
Permits, fees and related charges include surface mining permits, log patrol licenses, aquatic lands dredged material disposal site fees, forest practices damage assessments and permits, survey records recording fees, application/assignment fees, burning permit fees, and local government assessments.
Operating transfers include transfers attributed to prior period revenue.
Miscellaneous other revenue includes prior period adjustments, recoveries of prior biennium expenditures, miscellaneous treasurer transfers, as well as revenue from the ORV & Nonhighway Vehicle and Natural Resources Conservation Areas Stewardship accounts.
2 | EXPENDITURE CATEGORIES
Administration includes Executive Management & Operations, Internal Audit, Communications, Policy & Governmental Operations, Budget & Economics, Legal Compliance, and Environmental Review.
Interagency payments are payments made to other state agencies (the Attorney General, State Auditor, Financial Management, Dept. of Enterprise Services, Secretary of State, etc.) and various telecommunication vendors for services they provide to the department.
Agency support includes the following programs: Human Resources (personnel, safety, training), Financial Management (accounting, payroll, risk management,
2015 DNR ANNUAL REPORT 30
purchasing), Information Management (IT), Geographic Information Systems, Facilities, Region Administration and Environmental Analysis.
Total Expenditures of $331,906,991 for Fiscal Year 2015 excludes the interfund transfer from General Fund to the Agricultural College Trust Management Account in the amount of $1,310,000 (see footnote #5).
3 | LAND TRANSFERS
Real Property Replacement: During Fiscal Year 2015 a total of $9,757,373, an amount equivalent to the property value, was received from (1) transfers to other government entities, (2) resolution of trespass violations, or (3) transfers in lieu of condemnation. This money is used to acquire replacement trust lands.
Trust Land Transfer: During Fiscal Year 2015 a total of $0 was distributed to the Common School Construction Account from the Trust Land Transfer program.
Encumbered State Forest Land: During Fiscal Year 2015 Encumbered State Forest Land Transfers, a program enabled by Second Substitute House Bill 1484, resulted in distributions of $225,400 to the Forest Development Account and $676,200 to Skamania County.
4 | LAND BANK
DNR uses the Land Bank program (RCW 79.19) to reposition trust land assets for better future income production. Through the Land Bank, state trust lands are first auctioned to private buyers. Proceeds of land sales made under this "sell first" process are held in the Resource Management Cost Account (RMCA) until they can be used to purchase replacement trust lands. This revenue from trust property sales should equal or exceed the cost of trust property purchases. However, during any one fiscal year the transactions may not balance (e.g., a property has been sold, but property to replace it has not yet been purchased). Land bank transactions are accounted for by trust within each of DNR’s management funds.
Revenue from Fiscal Year 2015 sales, existing contracts and interest was $5,686 to the RMCA. A total of $2,090,159 in the RMCA is reserved to acquire property to replace trust property previously sold through the "sell first" process of the Land Bank program.
5 | AGRICULTURAL COLLEGE TRUST MANAGEMENT ACCOUNT
Per RCW 79.64.090 the revenue on Agricultural College trust lands is distributed 100 percent to the agricultural college permanent fund or WSU bond retirement account. The management of the agricultural college trust lands is funded from the Agricultural College Trust Management Account. This account is dependent on legislative appropriation for funding. Currently, the legislature appropriates the money for this purpose from General Fund under a proviso. For Fiscal Year 2015 the total interfund transfer from General Fund was $1,310,000.
6 | ORV & NONHIGHWAY VEHICLE ACCOUNT
This account provides for acquisition, planning, development, maintenance and management of ORV recreation facilities, non-highway roads and non-highway road recreation facilities; education and law enforcement programs related to non-highway vehicles; and construction and maintenance of campgrounds and trailheads.
DNR, the Department of Fish and Wildlife, and the Parks and Recreation Commission spend from the account in support of these functions. The Department of Licensing collects revenue for the account from taxes, licenses, permits and fees. DNR administers the account according to Legislative appropriations.
See Figure 1 for the account’s total fiscal activity for Fiscal Year 2015.
7 | AQUATIC LANDS ENHANCEMENT ACCOUNT
This account provides for the purchase, improvement and protection of aquatic lands for public purposes. DNR, the Department of Fish and Wildlife, the Department of Agriculture, the Parks and Recreation Commission, the Recreation and Conservation Funding Board, the Department of Health and the Puget Sound Partnership spend from the account for these purposes. DNR administers this account and only the DNR fiscal activity is reported on the Department Administered Funds section of the annual report.
See Figure 2 for the account’s total fiscal activity for Fiscal Year 2015.
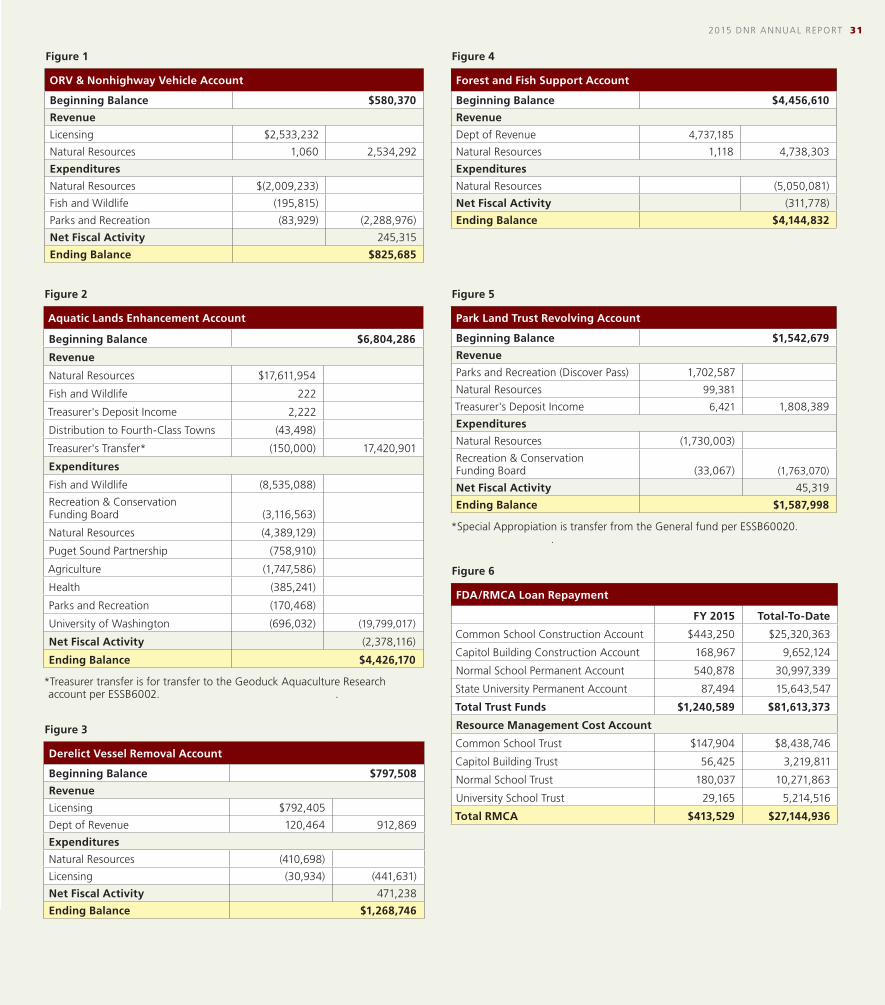
Figure 1
ORV & Nonhighway Vehicle Account
Beginning Balance $580,370
Revenue
Licensing $2,533,232
Natural Resources 1,060 2,534,292
Expenditures
Natural Resources $(2,009,233)
Fish and Wildlife (195,815)
Parks and Recreation (83,929) (2,288,976)
Net Fiscal Activity 245,315
Ending Balance $825,685
Figure 2
Aquatic Lands Enhancement Account
Beginning Balance $6,804,286
Revenue
Natural Resources $17,611,954
Fish and Wildlife 222
Treasurer's Deposit Income 2,222
Distribution to Fourth-Class Towns (43,498)
Treasurer's Transfer* (150,000) 17,420,901
Expenditures
Fish and Wildlife (8,535,088)
Recreation & Conservation Funding Board (3,116,563)
Natural Resources (4,389,129)
Puget Sound Partnership (758,910)
Agriculture (1,747,586)
Health (385,241)
Parks and Recreation (170,468)
University of Washington (696,032) (19,799,017)
Net Fiscal Activity (2,378,116)
Ending Balance $4,426,170
*Treasurer transfer is for transfer to the Geoduck Aquaculture Research account per ESSB6002. .
Figure 3
Derelict Vessel Removal Account
Beginning Balance $797,508
Revenue
Licensing $792,405
Dept of Revenue 120,464 912,869
Expenditures
Natural Resources (410,698)
Licensing (30,934) (441,631)
Net Fiscal Activity 471,238
Ending Balance $1,268,746
Figure 4
Forest and Fish Support Account
Beginning Balance $4,456,610
Revenue
Dept of Revenue 4,737,185
Natural Resources 1,118 4,738,303
Expenditures
Natural Resources (5,050,081)
Net Fiscal Activity (311,778)
Ending Balance $4,144,832
Figure 5
Park Land Trust Revolving Account
Beginning Balance $1,542,679
Revenue
Parks and Recreation (Discover Pass) 1,702,587
Natural Resources 99,381
Treasurer's Deposit Income 6,421 1,808,389
Expenditures
Natural Resources (1,730,003)
Recreation & Conservation Funding Board (33,067) (1,763,070)
Net Fiscal Activity 45,319
Ending Balance $1,587,998
*Special Appropiation is transfer from the General fund per ESSB60020. .
Figure 6
FDA/RMCA Loan Repayment
FY 2015 Total-To-Date
Common School Construction Account $443,250 $25,320,363
Capitol Building Construction Account 168,967 9,652,124
Normal School Permanent Account 540,878 30,997,339
State University Permanent Account 87,494 15,643,547
Total Trust Funds $1,240,589 $81,613,373
Resource Management Cost Account
Common School Trust $147,904 $8,438,746
Capitol Building Trust 56,425 3,219,811
Normal School Trust 180,037 10,271,863
University School Trust 29,165 5,214,516
Total RMCA $413,529 $27,144,936
2015 DNR ANNUAL REPORT 31

8 | DERELICT VESSEL REMOVAL ACCOUNT
This account provides for costs and reimbursements to authorized public entities for the removal of derelict and abandoned vessels. DNR spends from the account for these purposes and the Department of Licensing spends from the account for the purpose of administering the collection of revenue for the fund. DNR administers this account and only the DNR fiscal activity is reported on the Department Administered Funds section of the annual report.
See Figure 3 for the account’s total fiscal activity for Fiscal Year 2015.
9 | FOREST AND FISH SUPPORT ACCOUNT
This account was created in 2007 to provide for activities pursuant to the state's implementation of the forests and fish report as defined in chapter 76.09 RCW and related activities, including, but not limited to, adaptive management, monitoring, and participation grants to tribes, state and local agencies, and not-for-profit public interest organizations.
DNR spends from the account for these purposes and the Department of Revenue spends from the account for the purpose of administering the collection of revenue for the fund. Sources of revenue for this account include surcharge on timber and wood product manufacturers, extractors, and wholesalers per RCW 82.04.260 (12).
DNR administers this account and only the DNR fiscal activity is reported on the Department Administered Funds section of the annual report. See Figure 4 for the account’s total fiscal activity for Fiscal Year 2015.
10 | PARK LAND TRUST REVOLVING ACCOUNT
This account is used for acquiring real property as a replacement for the property transferred to the State Parks and Recreation Commission in order to maintain the land base of
the affected trusts, and to receive voluntary contributions for the purpose of operating and maintaining public use and recreation facilities. This account may also be used to hold funding for future acquisition of lands for the community forest trust program, or to purchase replacement forest land.
In May 2011, the Governor signed the Discover Pass into law (see also RCW Title 79A) intended to provide revenue to maintain recreation access to state lands and meet the increasing demand for outdoor recreation. Effective July 1, 2011 the Discover Pass was required for vehicle access to recreation lands which include state parks, boat launches, campgrounds, heritage sites, wildfire and natural areas, trails and trailheads. DNR’s portion (8%) of this revenue is transferred to this account by the State Parks and Recreation Commission. DNR’s recreation program spends from this portion of the account.
DNR administers this account and only the DNR fiscal activity is reported on the Department Administered Funds section of the annual report. See Figure 5 for the account’s total fiscal activity for Fiscal Year 2015.
11 | FDA/RMCA LOAN REPAYMENT
The Board of Natural Resources resolution #635 in 1990 and #756 in 1992 authorized settlement of the FDA debt to the RMCA by transferring timber-cutting rights on State Forest Purchase lands to the Common School, Capitol Building, Normal School, and University granted trusts. A one-third interest in assets (timber cutting rights) of the FDA on 35,655 acres was transferred to these trusts. The value of these transfers eliminated the debt between FDA and RMCA.
A total of $1,654,118 was distributed to the trusts from timber harvested during Fiscal Year 2015. The RMCA received $413,529 from this activity. Since this is repayment of a loan, the transactions are recorded as an operating transfer rather than current period revenue.
The values from the harvest activity by fund as well as RMCA trust for Fiscal Year 2015 and in total since the adoption of resolution 635 in 1990 are in Figure 6.
2015 DNR ANNUAL REPORT 32
12 | OPERATING TRANSFERS
According to the Office of Financial Management's interpretation of generally accepted accounting principles, debt service funds (funds used to pay off debts), such as the UW or WSU Bond Retirement accounts, cannot receive revenue directly. Instead, revenue to these two funds are recorded to the respective permanent funds, and then an operating transfer is made to the appropriate debt service fund.
13 | TRUST FUNDS– CURRENT AND PERMANENT
Trust Current Funds are funds that individual trust beneficiaries can draw from. Trust Permanent Funds are endowments, which generate interest that can be transferred to the Current Funds.
14 | FISCAL ACTIVITY FOR OTHER TYPE FUND(S) ADMINISTERED BY DNR
Natural Resources Equipment Account: Total other fiscal activity does not include funds classified as internal service funds. The Natural Resources Equipment Account is DNR’s only internal service fund. This fund is used to maintain, replace and provide equipment to the Department’s programs on a rental basis. In Fiscal Year 2015 this fund had revenue of $21,987,094 and expenses of $19,836,099.
15 | RMCA PORTION OF TRUST LAND REVENUE
The Resource Management Cost Account received 29 percent on most transactions and the trusts received 71 percent of revenue from trust lands during Fiscal Year 2015.
Also, some revenue transactions are subject to different distribution ratios. These transactions include aquatic resources, miscellaneous non-trust revenue, interest earnings, land sales transactions, and interfund loan repayment, the last of which affects the Common School, University, Capitol Building and Normal School trusts.
Figure 7 (a,b,c) reflects trust activity with Forest Board Repayment activity. Refer to footnote #19 for trust activity related to the University Trust.
16 | NON-TRUST REVENUE
Non-trust revenue cannot be attributed to a specific trust. Activities include forest road assessments, miscellaneous services, manuals & publications, prior period recoveries and adjustments, application fees, and interest income.
17 | NEGATIVE REVENUE
Any negative revenue reflects accounting adjustments (such as bad-debt write-offs, credit memos) from a prior fiscal year.
FY2015 Aquatic Resources: Negative revenue in the ALEA account include $32,710 activity related to the Cleanup Settlement account loan pursuant to ESB6074, Sec 3022 (Point Ruston Sediment Capping and Shoreline Restoration Stabilization) and $150,000 treasurer’s transfer to the Geoduck Aquaculture Research account per ESSB 602. Negative revenue in RMCA includes $1,850,000 transfer to the Marine Stewardship account per 3ESHB 5034, Sec 805.
18 | TREASURER’S REVENUE
Due to the schedule for distributing revenue, revenue from State Forest Lands may earn interest before it is distributed to the appropriate county. Interest earnings cannot be attributed specifically to Transfer Lands or Purchase Lands. This revenue is accounted for as treasurer’s revenue and is distributed to the appropriate county.
19 | UNIVERSITY TRUST – ORIGINAL, TRANSFERRED, REPAYMENT
The accounting for the University Trust combines activity from original University trust lands, lands which have been transferred to the trust, and the University trust’s share of interfund loan repayment as described in footnote #11.
See Figure 8 for the breakdown of the different elements contributing to the information for University Grants for Fiscal Year 2015.

Figure 7a
Common School / Escheat Trust
Trust ActivityTotal
RevenueCom. School Construction
Com. School Permanent RMCA
Timber Sales $40,165,898 $28,133,158 $0 $12,032,739
Timber Sales-Related (171,730) 19,964 0 (191,694)
Leases 31,601,638 21,771,345 645,275 9,185,017
Misc Interest Income 136,500 75,366 29,797 31,336
Fees / Service Charges 61,557 0 0 61,557
Operating Transfer-In 591,153 443,250 0 147,904
Subtotal 72,385,014 50,443,083 675,072 21,266,858
Forest Board Repayment
Sales 206,548 0 0 206,548
Operating Transfer-Out (591,153) 0 0 (591,153)
Subtotal (384,605) 0 0 (384,605)
Total Trust Activity 72,000,409 50,443,083 675,072 20,882,253
Non-Trust Activity
STO Interest 12,863 7,178 0 5,685
Land Sales / Trust Land Transfer 0 0 0 0
Other Revenue 453,091 0 416,314 36,777
Total Non-Trust Activity 465,954 7,178 416,314 42,462
GRAND TOTAL $72,466,364 $50,450,261 $1,091,386 $20,924,715
Figure 7b
Capitol Building
Trust ActivityTotal
RevenueCap. Bldg.
Construction RMCA
Timber Sales $6,663,765 $4,584,624 $2,079,141
Timber Sales-Related 437 (0) 437
Leases 162,648 115,484 47,164
Late Interest 332 236 96
Fees / Service Charges 219 0 219
Operating Transfer-In 225,392 168,967 56,425
Subtotal 7,052,792 4,869,311 2,183,481
Forest Board Repayment
Sales 0 0 0
Operating Transfer-Out (225,392) 0 (225,392)
Subtotal (225,392) 0 (225,392)
Total Trust Activity 6,827,401 4,869,311 1,958,090
Non-Trust Activity
STO Interest 19,750 798 18,951
Other Revenue 3,449 0 3,449
Total Non-Trust Activity 23,198 798 22,400
GRAND TOTAL $6,850,599 $4,870,109 $1,980,490
Figure 7c
Normal School
Trust ActivityTotal
RevenueCapital
ProjectsNormal Sch. Permanent RMCA
Timber Sales $2,356,465 $0 $1,204,033 $1,152,432
Timber Sales-Related (660,551) 0 51 (660,602)
Leases 183,632 126,930 3,398 53,305
Late Interest 188 133 0 55
Fees / Service Charges 477 0 0 477
Operating Transfer-In 720,915 0 540,878 180,037
Subtotal 2,601,126 127,062 1,748,360 725,704
Forest Board Repayment
Sales 660,644 0 0 660,644
Operating Transfer-Out (720,915) 0 (720,915)
Subtotal (60,271) 0 0 (60,271)
Total Trust Activity 2,540,855 127,062 1,748,360 665,433
Non-Trust Activity
STO Interest 6,722 282 0 6,440
Land Sales / Trust Land Transfer 0 0 0 0
Other Revenue 1,172 0 0 1,172
Total Non-Trust Activity 7,894 282 0 7,612
GRAND TOTAL $2,548,749 $127,344 $1,748,360 $673,045
2015 DNR ANNUAL REPORT 33

Figure 8
University Trust
Trust Source/ActivityTotal
Revenue Bond
RetirementUniversity
Permanent RMCA
University-Transferred
Timber Sales $4,012,796 $0 $2,848,981 $1,163,815
Timber Sales-Related 0 0 0 0
Leases 212,914 0 151,175 61,739
Misc-Trespass (1,690) 0 (1,741) 51
Late Interest 394 0 279 114
Sale of Property-Other 0 0 0 0
Fees/Services Charges 252 0 0 252
Operating Transfer-In 2,799,809 2,683,151 87,494 29,165
Operating Transfer-Out (2,683,151) 0 (2,683,151) 0
Total 4,341,324 2,683,151 403,037 1,255,136
University Original
Timber Sales 0 0 0 0
Leases 125,549 0 89,140 36,409
Fines & Forfeits 0 0 0 0
Late Interest (0) 0 (0) (0)
Fees/Services Charges 38 0 0 38
Operating Transfer-In 88,925 88,925 0 0
Operating Transfer-Out (88,925) (88,925) 0
Total 125,587 88,925 215 36,447
University-Repayment
Timber Sales 116,658 0 0 116,658
Timber Sales Related 0 0 0 0
Late Interest 0 0 0 0
Operating Transfer-Out (116,658) 0 0 (116,658)
Total 0 0 0 0
Non-Trust Allocation
STO Interest 13,996 367 0 13,630
Non-Trust Revenue Allocation 2,275 0 0 2,275
Total 16,271 367 0 15,904
GRAND TOTAL $4,483,182 $2,772,443 $403,252 $1,307,487
2015 DNR ANNUAL REPORT 34
20 | STATE TRUST LANDS MANAGEMENT FUND ACCOUNTING REPORT
Statutory Authority and Requirements:
Subject to legislative appropriation, DNR is authorized by RCW's 76.12.110 and 79.64.030 to use funds from the Resource Management Cost Account (RMCA) and Forest Development Account (FDA) interchangeably in the management of State Grant Lands and State Forest Lands. The law also states, however, that an annual accounting will be kept of payments made by one fund on behalf of another. For example when RMCA funds are used to pay for activities on State Forest Land, it shall be considered a debt against the FDA. RCW 79.64.030 also requires that the results of the accounting be reported to the legislature at the next regular session.
Accounting Procedures
Beginning with fiscal year 1996, the following Cost Allocation System accounting procedures have been used to calculate any debt or loan between the management funds:
A. All operating program expenditures that can be determined to benefit a particular land category are directly charged to that land category.
B. Expenditures for the majority of the department’s operating programs for which the benefiting land category cannot be determined (indirect expenditures), are allocated to land categories based on staff month percentages derived from personnel time charged directly to those land categories or by Western Washington forested acres.
C. Capital outlay expenditures that benefit particular land categories are determined in advance then charged by land category in the ratio set by appropriations.
D. Agency Administration and Support costs are allocated to land category based on Agency work plans for the year as established during the budget process.
E. Direct charges and indirect charges are totaled by land category within the Cost Allocation System. Expenditures paid from the RMCA and FDA accounts are compared to these total charges for Grant Lands and State Forest Lands to determine how much of the charges were paid from one account on behalf of the other. If RMCA funds were used to pay State Forest charges, a debt principal is incurred in that amount. If State Forest funds were used to pay RMCA charges, the debt principal is reduced by that amount. Funding adjustments may be made periodically during the fiscal year to align expenditures by fund with total charges for Grant Lands and State Forest Lands to prevent the accumulation of any new debt in the year.
F. As required by law, interest is charged on the debt incurred. A full year's interest is charged on cumulative debt carried from the previous year. One half year's interest is calculated on the change in the debt principal occurring during the current year.
G. Cumulative debt from the preceding year, plus new principal and interest charges, are totaled to determine the new cumulative debt. See Figure 9.
Figure 9
RMCA/FDA Debt/Loan Accounting For Fiscal Year 2015
Beginning Balance Grant Lands State Forest Lands
2015 Trust Charges $70,594,688 $25,710,267
RMCA Expenditures 70,594,688 0
FDA Expenditures 0 25,710,267
Cumulative Debt/Loan $0 $0
Fiscal Year 2015 Management Fund Debt StatusAs of June 30, 2015, no debt exists between the State Forest Lands (Forest Development Account) and the Grant Lands (Resource Management Cost Account).
Tim
ber D
ata
PHO
TO B
Y D
ALE
MIX
/ D
NR
FISCAL DATA
TIMBER DATA
Man
agem
ent
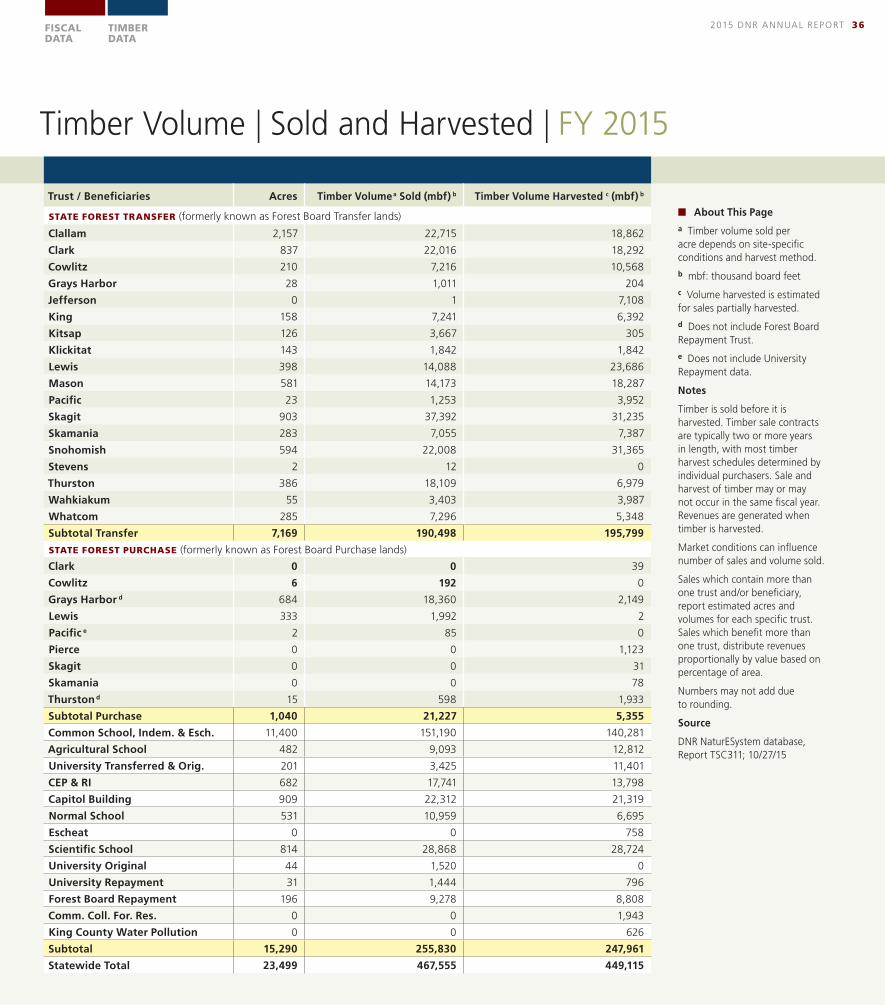
Timber Volume | Sold and Harvested | FY 2015
Trust / Beneficiaries Acres Timber Volumea Sold (mbf) b Timber Volume Harvested c (mbf) b
STATE FOREST TRANSFER (formerly known as Forest Board Transfer lands)
Clallam 2,157 22,715 18,862
Clark 837 22,016 18,292
Cowlitz 210 7,216 10,568
Grays Harbor 28 1,011 204
Jefferson 0 1 7,108
King 158 7,241 6,392
Kitsap 126 3,667 305
Klickitat 143 1,842 1,842
Lewis 398 14,088 23,686
Mason 581 14,173 18,287
Pacific 23 1,253 3,952
Skagit 903 37,392 31,235
Skamania 283 7,055 7,387
Snohomish 594 22,008 31,365
Stevens 2 12 0
Thurston 386 18,109 6,979
Wahkiakum 55 3,403 3,987
Whatcom 285 7,296 5,348
Subtotal Transfer 7,169 190,498 195,799
STATE FOREST PURCHASE (formerly known as Forest Board Purchase lands)
Clark 0 0 39
Cowlitz 6 192 0
Grays Harbor d 684 18,360 2,149
Lewis 333 1,992 2
Pacific e 2 85 0
Pierce 0 0 1,123
Skagit 0 0 31
Skamania 0 0 78
Thurston d 15 598 1,933
Subtotal Purchase 1,040 21,227 5,355
Common School, Indem. & Esch. 11,400 151,190 140,281
Agricultural School 482 9,093 12,812
University Transferred & Orig. 201 3,425 11,401
CEP & RI 682 17,741 13,798
Capitol Building 909 22,312 21,319
Normal School 531 10,959 6,695
Escheat 0 0 758
Scientific School 814 28,868 28,724
University Original 44 1,520 0
University Repayment 31 1,444 796
Forest Board Repayment 196 9,278 8,808
Comm. Coll. For. Res. 0 0 1,943
King County Water Pollution 0 0 626
Subtotal 15,290 255,830 247,961
Statewide Total 23,499 467,555 449,115
■ About This Page
a Timber volume sold per acre depends on site-specific conditions and harvest method.
b mbf: thousand board feet
c Volume harvested is estimated for sales partially harvested.
d Does not include Forest Board Repayment Trust.
e Does not include University Repayment data.
Notes
Timber is sold before it is harvested. Timber sale contracts are typically two or more years in length, with most timber harvest schedules determined by individual purchasers. Sale and harvest of timber may or may not occur in the same fiscal year. Revenues are generated when timber is harvested.
Market conditions can influence number of sales and volume sold.
Sales which contain more than one trust and/or beneficiary, report estimated acres and volumes for each specific trust. Sales which benefit more than one trust, distribute revenues proportionally by value based on percentage of area.
Numbers may not add due to rounding.
Source
DNR NaturESystem database, Report TSC311; 10/27/15
2015 DNR ANNUAL REPORT 36 FISCAL DATA
TIMBER DATA

Silviculturea | FY 2015
2015 DNR ANNUAL REPORT 37 FISCAL DATA
TIMBER DATA
■ About This Page
These data are included in the 2015 Annual Report to Trust Beneficiaries per RCW 79.10.010
a Silvicultural activities are forest management practices. Implementation of silvicultural practices varies according to site-specific conditions and availability of management funding.
b Acres planted include all planting processes and all tree species.
c Stems per acre planted depend on site-specific conditions and anticipated survival rates.
d Pre-commercially thinned acres increase yield rate per acre by selectively decreasing overcrowding of saplings.
Numbers may not add due to rounding.
Source
Source: Planning and Tracking Database 2/24/2016.
Trust / BeneficiariesAcres
Planted bStems
per AcrecPre-commercially
Thinned Acres d
STATE FOREST TRANSFER (formerly known as Forest Board Transfer lands)
Clallam 845 360 601
Clark 560 363 93
Cowlitz 130 365 0
Grays Harbor 35 243 0
Jefferson 69 351 0
King 104 413 945
Kitsap 14 374 0
Klickitat 5 200 0
Lewis 404 338 0
Mason 159 253 0
Pacific 92 456 0
Pierce 32 389 0
Skagit 468 356 705
Skamania 40 394 105
Snohomish 461 336 766
Thurston 330 390 150
Wahkiakum 82 394 0
Whatcom 201 327 426
Subtotal Transfer 4,029 356 3,791
STATE FOREST PURCHASE (formerly known as Forest Board Purchase lands)
Clallam 2 262 0
Grays Harbor 382 276 204
Lewis 78 414 0
Pacific 134 313 0
Skagit 19 414 0
Skamania 0 0 2
Snohomish 0 0 286
Thurston 56 161 368
Whatcom 16 363 54
Subtotal Purchase 685 296 913
Agricultural School 171 346 967
Capitol Grant 775 311 417
CEP & RI 301 319 362
Common School and Indemnity 7,461 276 15,843
Escheat 83 305 32
Normal School 103 470 231
Scientific School 626 415 505
University - Original 2 339 4
University - Transferred 243 258 85
Community College Forest Reserve 171 385 94
Water Pollution Control Division Trust Land 110 395 227
Total - All TRUSTS 14,759 312 23,470
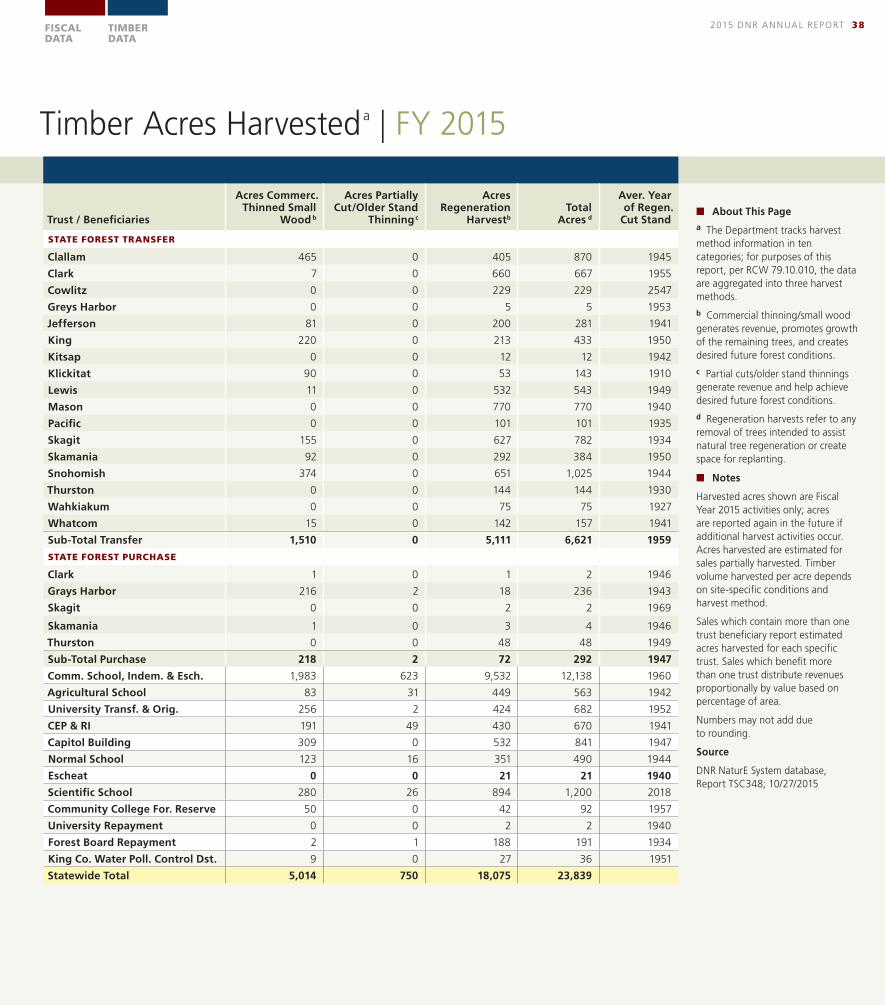
Timber Acres Harvesteda | FY 2015
■ About This Pagea The Department tracks harvest method information in ten categories; for purposes of this report, per RCW 79.10.010, the data are aggregated into three harvest methods.
b Commercial thinning/small wood generates revenue, promotes growth of the remaining trees, and creates desired future forest conditions.
c Partial cuts/older stand thinnings generate revenue and help achieve desired future forest conditions.
d Regeneration harvests refer to any removal of trees intended to assist natural tree regeneration or create space for replanting.
■ Notes
Harvested acres shown are Fiscal Year 2015 activities only; acres are reported again in the future if additional harvest activities occur. Acres harvested are estimated for sales partially harvested. Timber volume harvested per acre depends on site-specific conditions and harvest method.
Sales which contain more than one trust beneficiary report estimated acres harvested for each specific trust. Sales which benefit more than one trust distribute revenues proportionally by value based on percentage of area.
Numbers may not add due to rounding.
Source
DNR NaturE System database, Report TSC348; 10/27/2015
2015 DNR ANNUAL REPORT 38 FISCAL DATA
TIMBER DATA
Trust / Beneficiaries
Acres Commerc. Thinned Small
Wood b
Acres Partially Cut/Older Stand
Thinningc
Acres Regeneration
HarvestbTotal
Acres d
Aver. Year of Regen.
Cut Stand
STATE FOREST TRANSFER
Clallam 465 0 405 870 1945
Clark 7 0 660 667 1955
Cowlitz 0 0 229 229 2547
Greys Harbor 0 0 5 5 1953
Jefferson 81 0 200 281 1941
King 220 0 213 433 1950
Kitsap 0 0 12 12 1942
Klickitat 90 0 53 143 1910
Lewis 11 0 532 543 1949
Mason 0 0 770 770 1940
Pacific 0 0 101 101 1935
Skagit 155 0 627 782 1934
Skamania 92 0 292 384 1950
Snohomish 374 0 651 1,025 1944
Thurston 0 0 144 144 1930
Wahkiakum 0 0 75 75 1927
Whatcom 15 0 142 157 1941
Sub-Total Transfer 1,510 0 5,111 6,621 1959
STATE FOREST PURCHASE
Clark 1 0 1 2 1946
Grays Harbor 216 2 18 236 1943
Skagit 0 0 2 2 1969
Skamania 1 0 3 4 1946
Thurston 0 0 48 48 1949
Sub-Total Purchase 218 2 72 292 1947
Comm. School, Indem. & Esch. 1,983 623 9,532 12,138 1960
Agricultural School 83 31 449 563 1942
University Transf. & Orig. 256 2 424 682 1952
CEP & RI 191 49 430 670 1941
Capitol Building 309 0 532 841 1947
Normal School 123 16 351 490 1944
Escheat 0 0 21 21 1940
Scientific School 280 26 894 1,200 2018
Community College For. Reserve 50 0 42 92 1957
University Repayment 0 0 2 2 1940
Forest Board Repayment 2 1 188 191 1934
King Co. Water Poll. Control Dst. 9 0 27 36 1951
Statewide Total 5,014 750 18,075 23,839

2015 DNR ANNUAL REPORT 39
Deferrals | FY 2015 FORMERLY KNOWN AS
ACRES OFF-BASE FOR HARVEST
Trust / BeneficiariesNo Deferral
AcresShort-Term Def. Acres
Long-Term Def. Acres
STATE FOREST TRANSFER
Clallam 63,965 269 24,499
Clark 22,342 639 2,160
Cowlitz 9,797 18 570
Grays-Harbor 1,738 0 477
Jefferson 12,136 56 1,668
King 16,137 0 5,394
Kitsap 6,308 0 835
Klickitat 18,568 0 264
Lewis 31,130 0 7,138
Mason 23,081 0 3,589
Okanogan 9 0 0
Pacific 8,734 0 5,782
Pierce 7,759 0 759
Skagit 55,247 449 24,360
Skamania 24,556 71 12,169
Snohomish 47,702 43 11,871
Stevens 124 0 7
Thurston 15,195 0 3,660
Wahkiakum 8,495 32 3,834
Whatcom 20,082 0 8,065
Subtotal Transfer 393,104 1,576 117,102
Trust / BeneficiariesNo Deferral
AcresShort-Term Def. Acres
Long-Term Def. Acres
STATE FOREST PURCHASE
Clallam 138 0 92
Clark 2,420 0 1,260
Cowlitz 219 9 37
Grays-Harbor 23,548 0 4,159
Jefferson 12 0 4
Kitsap 39 0 36
Klickitat 40 0 0
Lewis 2,608 0 334
Mason 403 0 104
Pacific 4,931 30 2,824
Pierce 2,812 0 432
Skagit 741 0 32
Skamania 2,798 0 1,537
Snohomish 1,600 0 39
Stevens 35 0 4
Thurston 18,762 0 3,695
Whatcom 710 0 243
Subtotal Purchase 61,815 38 14,834
Trust / BeneficiariesNo Deferral
AcresShort-Term Def. Acres
Long-Term Def. Acres
Comm. School, Indenmity & Esch. 862,288 1,851 219,218
Capitol Grant 72,624 464 26,088
Scientific School 53,625 329 11,788
Normal School 43,832 0 11,289
University, Original & Transferred 43,956 264 13,039
Agricultural School 42,368 100 10,970
CEP&RI 34,100 5 5,608
Water Pollution Control Division Trust Land 5,049 0 504
Community College Forest Reserve 3,322 0 54
Community Forest Trust 0 0 44,923
Other Lands* 2,796 0 119,331
Total – All TRUSTS 1,618,878 4,627 594,747
■ About This Page
These data are in the 2015 Annual Report to Trust Beneficiaries, per RCW 79.10.010.
With the adoption of the 2004 Sustainable Harvest Level, DNR no longer classifies lands as “off-base” or “on-base,” but instead designates deferral status.
Long-term deferral approximates “off-base.”
Deferral status is determined by whether the silviculture and land management activities, including harvest, are permitted or deferred for a period of time. Short-term deferrals represent forestlands anticipated to be deferred from harvest in the next 10 years. Long-term deferrals represent forestlands anticipated to be deferred from harvest beyond 10 years and forestlands managed for non-timber harvest revenue objectives.
Acres are designated as deferrals because they are inoperable, are low site, contain permanent research plots, are upland wildlife management areas, are timber gene pool reserves, are on unstable slopes in riparian buffers, are located in a northern spotted owl nest patch, contain a northern spotted owl site center, are identified as marbled
FISCAL DATA
TIMBER DATA
murrelet habitat, are included in the Olympic Experimental State Forest deferral areas, or are the result of the Settlement Agreement reached in 2006, or the 2006 Policy for Sustainable Forests Old-Growth Policy (all of these decisions were included in the 2007 sustainable harvest adjustment for Western Washington State Trust forestlands). A site can be deferred due to one or more factors.
Deferral classifications are not permanent designations. DNR may change the classification as specific forest stands or sites are re-evaluated. Acreage updates and changes can occur over time due to technological refinements in data gathering and analysis.
Numbers may not add due to rounding or potential double counting.
* Includes Land Bank, Natural Resources Conservation Areas, Natural Area Preserves, administrative sites, TIDE-2nd, UC-Private, and Water Pollution Control trust data.
Source: Deferral Status of State Forestlands DNR Forest Resources Division, LDO v20150928, 2015.
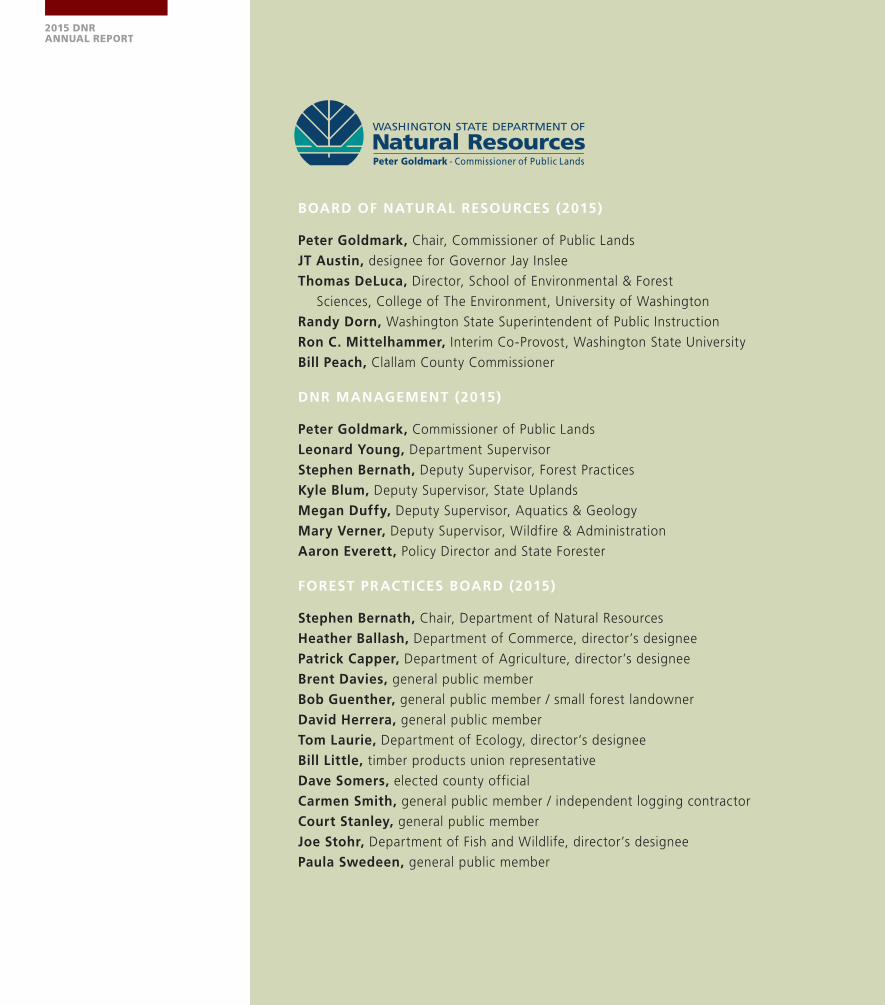
BOARD OF NATURAL RESOURCES (2015)
Peter Goldmark, Chair, Commissioner of Public Lands
JT Austin, designee for Governor Jay Inslee
Thomas DeLuca, Director, School of Environmental & Forest
Sciences, College of The Environment, University of Washington
Randy Dorn, Washington State Superintendent of Public Instruction
Ron C. Mittelhammer, Interim Co-Provost, Washington State University
Bill Peach, Clallam County Commissioner
DNR MANAGEMENT (2015)
Peter Goldmark, Commissioner of Public Lands
Leonard Young, Department Supervisor
Stephen Bernath, Deputy Supervisor, Forest Practices
Kyle Blum, Deputy Supervisor, State Uplands
Megan Duffy, Deputy Supervisor, Aquatics & Geology
Mary Verner, Deputy Supervisor, Wildfire & Administration
Aaron Everett, Policy Director and State Forester
FOREST PRACTICES BOARD (2015)
Stephen Bernath, Chair, Department of Natural Resources
Heather Ballash, Department of Commerce, director’s designee
Patrick Capper, Department of Agriculture, director’s designee
Brent Davies, general public member
Bob Guenther, general public member / small forest landowner
David Herrera, general public member
Tom Laurie, Department of Ecology, director’s designee
Bill Little, timber products union representative
Dave Somers, elected county official
Carmen Smith, general public member / independent logging contractor
Court Stanley, general public member
Joe Stohr, Department of Fish and Wildlife, director’s designee
Paula Swedeen, general public member
2015 DNR ANNUAL REPORT
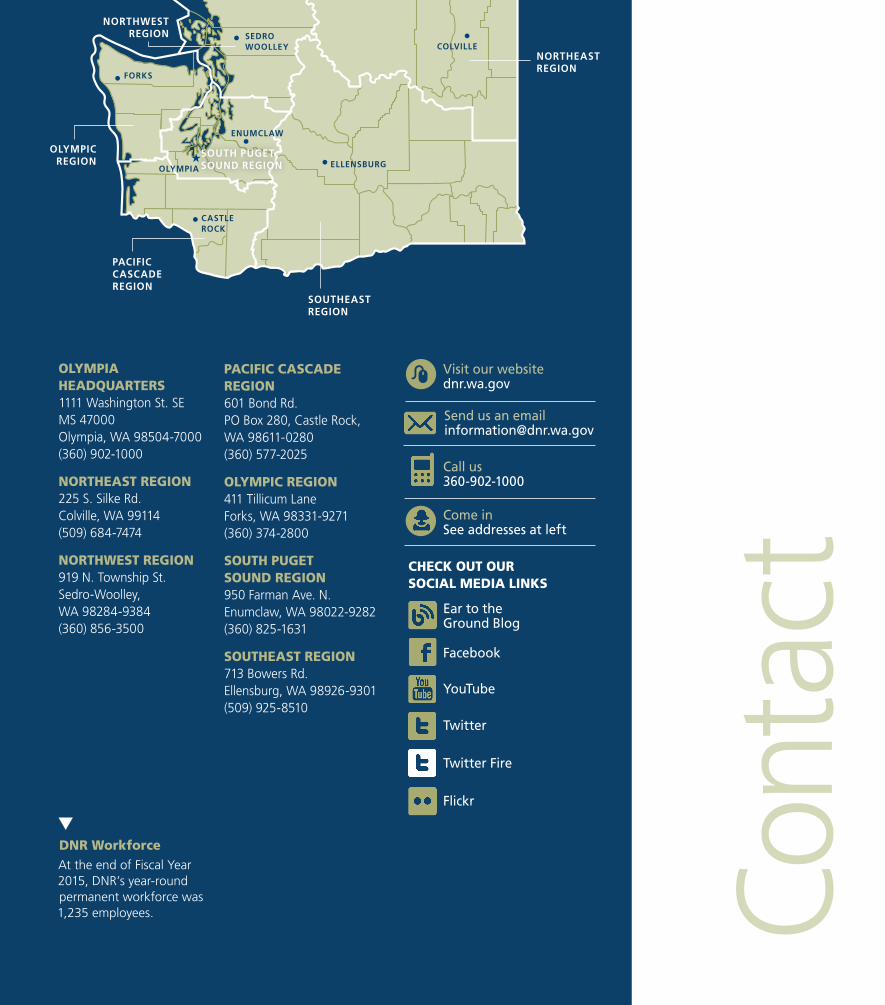
Cont
act
OLYMPIA HEADQUARTERS1111 Washington St. SE MS 47000Olympia, WA 98504-7000(360) 902-1000
NORTHEAST REGION225 S. Silke Rd.Colville, WA 99114(509) 684-7474
NORTHWEST REGION919 N. Township St.Sedro-Woolley, WA 98284-9384 (360) 856-3500
DNR WorkforceAt the end of Fiscal Year 2015, DNR’s year-round permanent workforce was 1,235 employees.
PACIFIC CASCADE REGION601 Bond Rd.PO Box 280, Castle Rock, WA 98611-0280(360) 577-2025
OLYMPIC REGION411 Tillicum LaneForks, WA 98331-9271(360) 374-2800
SOUTH PUGET SOUND REGION950 Farman Ave. N. Enumclaw, WA 98022-9282(360) 825-1631
SOUTHEAST REGION713 Bowers Rd.Ellensburg, WA 98926-9301(509) 925-8510
Send us an email [email protected]
Visit our website dnr.wa.gov
Come in See addresses at left
Call us 360-902-1000
CHECK OUT OUR SOCIAL MEDIA LINKS
Twitter Fire
Flickr
YouTube
Ear to the Ground Blog
OLYMPIA
ENUMCLAW
ELLENSBURG
SEDRO WOOLLEY COLVILLE
SOUTHEAST REGION
PACIFIC CASCADE REGION
SOUTH PUGET SOUND REGION
OLYMPIC REGION
NORTHEASTREGION
NORTHWESTREGION
CASTLE ROCK
FORKS

dnr.wa.govdnr.w
a.go
v