DNB W - Harrison, Stone & Associates, LLC · ect the views of De Nederlandsche Bank or the European...
29
DNB W ORKING P APER DNB Working Paper No. 419 / April 2014 Ekaterina Neretina, Cenkhan Sahin and Jakob de Haan Banking stress test effects on returns and risks
Transcript of DNB W - Harrison, Stone & Associates, LLC · ect the views of De Nederlandsche Bank or the European...

DN
B W
OR
KIN
G P
AP
ER
DNB Working PaperNo. 419 / April 2014
Ekaterina Neretina, Cenkhan Sahin and Jakob de Haan
Banking stress test effects onreturns and risks

De Nederlandsche Bank NV
P.O. Box 98
1000 AB AMSTERDAM
The Netherlands
Working Paper No. 419
April 2014
Banking stress test effects on returns and risks
Ekaterina Neretina, Cenkhan Sahin and Jakob de Haan *
* Views expressed are those of the authors and do not necessarily reflect official
positions of De Nederlandsche Bank.

Banking Stress Test Effects on Returns and Risks∗
Ekaterina Neretinaa,b Cenkhan Sahina,c Jakob de Haana,c,d
aDe Nederlandsche Bank, The NetherlandsbDuisenberg School of Finance, Amsterdam, The Netherlands
cUniversity of Groningen, The NetherlandsdCESifo, Munich, Germany
Abstract
We investigate the effects of the announcement and the disclosure of the clarification,methodology, and outcomes of the US banking stress tests on banks’ equity prices, creditrisk, systematic risk, and systemic risk during the 2009–13 period. We find only weak ev-idence that stress tests after 2009 affected equity returns of large US banks. In contrast,CDS spreads declined in response to the disclosure of stress test results. We also find thatbank systematic risk, as measured by betas, declined in some years after the publication ofstress test results. Our evidence suggests that stress tests affect systemic risk.
JEL code: G21, G28Key words: stress tests, bank equity returns, CDS spreads, bank betas, systemic risk.
∗The views expressed do not necessarily reflect the views of De Nederlandsche Bank or the European Systemof Central Banks. We would like to thank Viral Acharya, Rodney Ramcharan, Wolf Wagner and our colleaguesat De Nederlandsche Bank and the University of Groningen for helpful comments and discussions. Any errors oromissions are our own responsibility.

1 Introduction
Bank supervisors expect banks to hold sufficient capital to cover losses under adverse economic
conditions. Stress testing has become an important tool for bank supervisors to achieve that
goal. In stress tests the implications for individual banks’ financial positions under several
macroeconomic scenarios are examined, taking the banks’ exposures and business models into
account. Stress tests have several characteristics (Goldstein and Sapra, forthcoming). First, they
are forward looking. Second, they generally put high weight on highly adverse scenarios, thereby
providing supervisors with information about tail risks. Third, common scenarios are applied
to banks so that stress tests have the ability to provide more consistent supervisory standards
across banks. Finally, unlike traditional supervisory exams that generally are kept confidential,
the results of bank stress tests are frequently publicly disclosed in order to restore confidence
and reduce market uncertainty (Federal Reserve, 2009).
This paper examines the impact of banking stress tests in the US on banks’ stock prices, CDS
spreads, systematic risk (proxied by their betas), and systemic risk over the 2009–13 period. The
first test considered is the Supervisory Capital Assessment Program (SCAP) of the 19 largest
Bank Holding Companies (BHCs).1 The outcomes of this test were disclosed on May 7, 2009.
Since then the Federal Reserve implemented two supervisory programs. The first program, the
Comprehensive Capital Analysis and Review (CCAR), assesses the capital planning processes
and capital adequacy of banks and has been conducted annually since 2011. The CCAR links
quantitative stress test results with qualitative assessments of capital planning processes of banks.
The second program stems from the Dodd-Frank Act and requires assessing how bank capital
levels would fare in stressful scenarios (Federal Reserve, 2013b). The Dodd-Frank Act Stress
Test (DFAST) results were publicly released on March 7, 2013.
It is widely believed that stress tests conducted in the US have provided valuable information
to the market. Referring to post-crisis stress tests then Federal Reserve chairman Bernanke
stated:
”Even outside of a period of crisis, the disclosure of stress test results and assess-
ments provides valuable information to market participants and the public, enhances
transparency, and promotes market discipline.” (Bernanke, 2013)
Indeed, according to Morgan et al. (2010), the disclosure of the SCAP test results caused credit
default swap spreads to decline and equity returns to rise. We examine whether this result also
holds for the other stress tests. Our paper adds to the literature in three ways. First, we examine
the effects of all post-crisis stress tests in the US. Second, in contrast to most previous research,
our analysis is not confined to the effects of stress tests on equity returns and CDS spreads but
also considers the impact of stress tests on bank betas. Betas capture systematic risk based on
the co-movement of returns with the overall market and are therefore particularly relevant for
understanding the effects of stress tests. In addition, we study whether the change in betas is
1We refer to BHCs as large banks. The size of the banks varies between the SCAP and subsequent stresstests. In 2009 all banks having total consolidated assets of $100 bln or more were subject to stress testing. Insubsequent years the size was $50 bln or more.
2

due to changes in individual bank risk, or due to changes in systemic risk following the approach
suggested by Nijskens and Wagner (2011). Finally, we do not only consider the impact of the
publication of the stress test outcomes, but also examine other disclosure events, such as the
announcement of the stress test and the disclosure of the methodology to be used, as these may
also provide information (Petrella and Resti, 2013) and (Gick and Pausch, 2012).
As will be pointed out in more detail in Section 2, our paper is related to three strands
of literature. The first strand examines whether information provided by the disclosure of the
outcomes of stress tests reduces the opacity of banks (Morgan et al. (2010); Cardinali and
Nordmark (2011); Beltratti (2011); Ellahie (2012) and Petrella and Resti (2013)). Most (but not
all) studies conclude that stress tests produce valuable information for market participants and
can play a role in mitigating bank opacity. The second strand of related literature examines to
what extent supervisory information should be disclosed (e.g. Goldstein and Sapra (forthcoming)
and Schuermann (2013)). Several of these studies conclude that it may not always be optimal to
fully disclose stress test results. The final related strand of literature examines how stress tests
can be used to set capital ratios, limit capital distributions, and set-up resolution regimes in case
of financial distress (BCBS, 2012).
Our findings suggest that the release of the 2009 stress test outcomes had a clear effect on
equity returns in line with the results of Morgan et al. (2010). In contrast, we find only weak
evidence that the CCAR and DFAST stress tests affected equity returns. However, there is
strong evidence that the publication of stress test results reduced CDS spreads for all years,
irrespective of banks’ capital shortfalls. We find mixed results for other dates on which stress
test information was released. Our analysis of systematic risk indicates that betas were affected
by the publication of stress test results for nearly all stress tests. Moreover, we find evidence
that the decline in betas for some years is in part driven by the correlation of the banks’ stocks
with the market. We interpret these findings as a decrease in systemic risk.
The paper is structured as follows. Section 2 provides a summary of related literature and
outlines how our research is related to this literature. Section 3 gives an overview of the stress
tests conducted in the US. Section 4 outlines our methodology and Section 5 presents our findings.
Finally, Section 6 concludes.
2 Related studies and contribution
Our paper is related to three strands of literature. First, several studies examine whether bank
opacity differs from that of non-financial firms in ’normal’ times (cf. Morgan (2002); Flannery
et al. (2004); Iannotta (2006); Jones et al. (2012) and Haggard and Howe (2012)). A good example
is the recent paper by Flannery et al. (2013) who study bank equity’s trading characteristics and
find mixed evidence of bank opaqueness during normal times. From this perspective, some recent
studies examine the information value of stress tests. Morgan et al. (2010) conclude that the
disclosure of the results of the SCAP stress test suggests that market participants correctly
identified which institutions had sufficient capital, but were surprised by how much capital was
required for under-capitalized banks.
3

Stress tests have also been conducted by European supervisors and several recent papers
examine whether the disclosure of the outcomes affected financial markets. Petrella and Resti
(2013) find significant but modest market responses to the European Banking Authority (EBA)
stress test in 2011. Ellahie (2012) studies equity and credit market data of Eurozone banks
that took part in the stress tests in 2010 and 2011. His findings indicate that equity and bid-
ask spreads were not significantly affected by stress test announcements but declined after the
disclosure of stress test results. Cardinali and Nordmark (2011) report that the announcements
of the stress test and the clarification of the methodology in 2010 were relatively uninformative to
markets. In contrast, they find that the disclosure in 2011 by EBA of the stress test methodology
was highly informative for all stress-tested banks. Likewise, Beltratti (2011) argues that the 2011
EBA stress test produced new information, as investors could not a priori distinguish between
capitalized and under-capitalized banks.
Table 1 provides a summary of recent empirical papers on the market response to stress tests.
In line with some previous papers on European stress tests, in our analysis of US stress tests we
distinguish between several tests-related events, such as the announcement of the stress test and
the disclosure of the methodology and the stress test outcomes. We also distinguish between
banks with and banks without capital shortfalls. So our paper complements the work of Morgan
et al. (2010) by documenting the effects of stress tests on equity returns and CDS spreads for
stress tests conducted in the US after the SCAP. To the best of our knowledge, we are the first
to document the effects of stress tests on the betas of banks.
The literature on supervisory transparency and disclosure is also closely related to our work.
The central question addressed in these studies is to what extent supervisory information should
be disclosed. As shown by Liedorp et al. (2013), the transparency of banking supervisors differs
considerably. According to Goldstein and Sapra (forthcoming), in certain environments more
disclosure is not necessarily better if one considers economic efficiency. Accordingly, the costs
associated with disclosure of stress test results can be minimized in particular by disclosing
aggregate, rather than bank-specific results. Also Schuermann (2013) argues that the degree of
optimal disclosure may depend on the environment. During times of crisis the need for bank-
specific disclosure is greater while during normal times the cost-benefit of stress testing disclosure
may lean towards more aggregated information. Gick and Pausch (2012) argue that a supervisory
authority can create value by disclosing the stress-testing methodology together with the stress
test result. Bischof and Daske (2013) investigate the interaction between mandatory supervisory
disclosure and voluntary disclosure strategies of Eurozone banks that were subject to the stress
test in 2011. Their findings indicate that lower market liquidity is attributable to banks that did
not voluntarily disclose their sovereign risk exposures. Banks disclosing their exposures witnessed
increases in liquidity and decreases in the equity bid-ask spread.
Our paper is related to this line of literature, as we do not only examine the effects of the
publication of the stress test results, but also the effects of the announcement of the stress test
(Petrella and Resti, 2013) and the disclosure of the methodology (Gick and Pausch, 2012).
Finally, our paper is related to the literature on the impact of regulation of Systemically
Important Financial Institutions (SIFIs). Stress tests are used to set capital ratios, limit capital
distributions, and set-up resolution regimes in case of financial distress (BCBS, 2012). Bongini
4

and Nieri (2013) investigate the response of financial markets to the Financial Stability Board’s
publication of the list of institutions that are too big to fail. They quantify the value of an implicit
too-big-to-fail subsidy and find that financial markets did not strongly react to the proposed new
regulation regarding SIFIs. Schaefer et al. (2013) investigate the reaction of the stock returns
and CDS spreads of US and European banks to several regulatory reforms including the too-big-
to-fail regulation in Switzerland. These authors report significant market reactions in response
to this regulation, which strongly increased CDS spreads of systemic banks, but affected equity
prices only mildly.
Our study is related to this literature as we examine the systematic risk of banks. We
expect the beta of a bank to decline following the publication of the results of a stress test.
The information provided by the stress tests could reduce the uncertainty on bank stability
and therefore would lower the overall level of risk in the industry. This would manifest itself
in the form of a decline in bank betas. To study the underlying shifts in systematic risk we
decompose the changes in betas into changes in the correlation of stocks with the market and
changes in the relative variance following a similar approach as Nijskens and Wagner (2011).
These authors study credit risk transfers of banks through issuance of CDS and CLO contracts.
They disentangle the changes in betas and find that the increase in betas was primarily due to
an increase in the correlation of stocks with the market. Although banks became individually
less risky using credit risk transfers, systemic risk increased. As we examine the changes in betas
in a similar way we can examine how stress tests have affected systemic risk.
3 Stress tests in the US
The Federal Reserve’s CCAR exercises conducted in 2011–13 can be classified as micro-prudential
supervisory stress tests. They are ’top down’ in the sense that the Fed independently produced
loss estimates using its own supervisory models. Although the Fed publishes the results of stress
tests, the specification of the models used to arrive at them remains a ’black box’ (Bernanke,
2013). An important reason for this is to prevent the homogenization of stress test models, as
banks would over time have fewer incentives to maintain independent risk management systems
and adopt the specifications used by the Fed. These tests were conducted in the aftermath of the
crisis and unlike the SCAP in 2009 and the stress tests in Europe were not crisis management
stress tests. The latter differ in their emphasis on solvency, current risks, and their specific
’constrained bottom-up’ approach (Oura and Schumacher, 2012). For the SCAP exercise the
Fed relied more on the banks’ own estimates.
Although stress tests have been criticized because of insufficient coverage or their implemen-
tation strategy, they have become an important instrument in supervisory authorities’ toolkit.
This is true for micro-prudential (BCBS, 2012) as well as macro-prudential stress tests (Borio
et al., 2013).2 Table 2 provides a descriptive overview of the stress tests conducted in the US
2Macro-prudential stress testing has evolved over time. This type of stress tests is discussed e.g. by Cihak(2007), Borio et al. (2013), FSA (2009), de Larosiere (2009), Sorge (2004), and Galati and Moessner (2013).Criticism raised has led to the development of new stress testing models, such as Foglia (2009), Chan-Lau (2013),Swinburne (2007), Breuer et al. (2009), Schechtman and Gaglianone (2012), and Huang et al. (2012).
5

Table 1: Related studies
Stress test Data Findings
Morgan et al. (2010) SCAP 2009 Stock prices and CDSspreads.
Stress tests produce significant mar-ket reaction of stock prices. Under-capitalized banks have experienced morenegative abnormal returns. CDS spreads,particularly for under-capitalized banks,decline following the release of stress testresults.
Cardinali and Nordmark(2011)
EBA 2010,partly EBA2011
Stock prices The 2010 EU stress test was uninforma-tive to financial markets. The method-ology release of the EBA stress test in2011 on the other hand had a clear im-pact on banks. Stress tests showed no ef-fects of GIIPS-banks being more opaquethan banks from Northern Europe.
Ellahie (2012) EBA 2010, 2011 Equity and creditbid-ask spreads, CDSspreads
The 2011 stress test reduced informa-tion asymmetry (i.e. equity-credit bid-ask spreads) and increased informationuncertainty (measured by equity optionimplied volatilities and ratio of CDSspreads) of banks.
Alves et al. (2013) EBA 2010, 2011 Stock prices Both European stress tests have affectedthe stock prices of banks. The 2010 stresstest reduced the volatility in stock priceswhile the volatility increased followingthe release of the 2011 stress test results.
Petrella and Resti(2013)
EBA 2011 Stock indices, variousbank balance-sheet data
Stress tests significantly affect the marketand are a credible evaluation tool thatreduce bank opaqueness.
6

Table 2: Description of US stress tests
Purpose Requirements Results
SCAP 2009 Restoring confidence,identifying future con-ditions for banks withinsufficient capital.
Banks are well-capitalized withTier 1 capital above 6% of RWAand solvent with 4% Tier 1 com-mon equity ratio.
Ten banks with capital gap. Tier1 common capital increased to$759 bln. and Tier 1 common eq-uity ratio increased to 10.4%.
CCAR 2011 Quantitative assessmentof capital levels andqualitative assessment ofinternal capital planningprocesses of banks.
Banks submit capital plans tothe Fed, largest 6 banks submittrading P&L statements.
Banks mostly had to lower theircapital distributions, payout de-creased to 15% in 2011 from 38%in 2006.
CCAR 2012 Banks that did not par-ticipate earlier are nowsubject to a CapitalPlan Rule.
Banks are solvent with a 5% Tier1 common ratio.
Four banks had a capital gap.Doubling of weighted Tier 1 com-mon equity ratio.
DFAST 2013 Quantitatively assesshow bank capital levelswould fare in adverseeconomic conditions.
Financial companies with totalconsolidated assets between $10bln and $50 bln are required toconduct their own stress tests.
One bank failed to adhere to theminimum of 5% Tier 1 commonequity ratio.
CCAR 2013 Quantitative and qual-itative evaluation ofwhether a bank’s capitalaccretion and distri-bution decisions areprudent.
Banks have to disclose their ownestimates of stressed losses andrevenues. The Fed also discloseswhether or not it objected toeach banks capital plan.
Two banks conditionally ap-proved, two banks not approved.
on which we focus. ’Stress test design’ evolved.3 In subsequent stress test implementations the
Fed refined the hypothetical scenarios taking into account the procyclicality of the financial sys-
tem and severe adverse developments on housing, equity, and asset markets (Federal Reserve,
2012), (Federal Reserve, 2013a), and (Federal Reserve, 2013b). Moreover, supervisors can now
project losses and revenues independently allowing them to distinguish portfolio risks more ap-
propriately. Another enhancement is the focus on the capital planning processes of banks where
supervisors can scrutinize the need for capital above the proposed regulatory requirements.
To see how much attention stress tests received we collected news articles from a variety
of news sources for the 2009–2013 period from the Dow Jones Factiva database. We searched
for all news containing the words ”stress test” related to the banking stress tests procedure.
The constructed index of the number of news articles related to stress test events provides a
crude indication of how much attention stress tests received over 2009–13. Our final list of 2201
articles contains news on individual banks, the banking industry, and the US economy. The
news was filtered with all the relevant bank names and with the names of related government
agencies, such as the Federal Reserve, FDIC and the US Department of the Treasury. Earnings
announcements were also included into the corporate news group if they contained any discussion
on the government-regulated stress test procedure. We verified all news manually for relevance.
3The design of stress tests also received attention in the literature. BCBS (2009) provides principles for soundstress testing. Greenlaw et al. (2012) propose conceptual principals for stress testing while Oura and Schumacher(2012) suggest operational principals. Spargoli (2012) argues that stress tests can remove information asymmetriesonly if supervisory authorities implement policies to fix under-capitalized banks.
7

Figure A1 displays the number of news articles and gives an impression of the equity and
credit markets around the main stress test events. The figure suggests that the SCAP received
considerable more attention than the subsequent CCARs and DFAST. The news index also
reveals that stress tests were a substantial part of market sentiment in 2009–2013. The number
of stress test news items made up about 10 percent of all news about the U.S. banking industry
in this period. Not surprisingly, the highest frequency of news reports on this topic appeared
when the stress test outcomes were disclosed. Other peaks occur when the details of the stress
tests were announced and when the results for participating banks were released.
The top part of Figure A1 suggests that in response to the disclosure of stress test results
credit risk of banks declined while returns display a moderate increase. In the remainder of our
paper, we use an event study approach to quantify the effects of the disclosure of stress test
information on market movements.
4 Data and methodology
4.1 Data
We use equity returns and CDS spreads of banks that have participated in the US stress tests
over the 2009–2013 period. Data were obtained from Bloomberg. Table 3 lists the participating
banks considered in our research and shows the results of the stress tests.4 To eliminate possible
disturbances caused by dividend payments, stock splits and other capital actions, we use total
return indices for individual stocks. We use the S&P 500 return index as proxy for the market
portfolio. In addition, we employ daily data on 5-year senior CDS spreads for a subset of the
banks.5 We employ the CDX Investment Grade Index provided by Bloomberg as proxy for a
market portfolio in the CDS market. This index represents the rolling equally-weighted average
of 125 of the most liquid North American CDS series with relevant rating of at least ”BBB-”
or ”Baa3” and with 5 years maturity. In all analyses we exclude official holidays and days with
limited trading.
4.2 Methodology
To examine whether stress tests have caused abnormal movements in equity or CDS markets we
follow an event study methodology described e.g. in Brown and Warner (1985), Thompson (1995),
or MacKinlay (1997). Figure 1 provides an overview of all the relevant stress test events. The
days on which the results of stress tests are disclosed are arguably one-day events. Nevertheless,
because of scrutiny we expand the event day in order to capture effects that occur after the
markets close.6 This is particularly the case when results are disclosed after markets had closed.
4We exclude Ally Financial as it was not publicly traded. MetLife was excluded from DFAST and CCAR in2013, since the company sold its banking business branch to a subsidiary of General Electric, GE Capital RetailBank. The banks included in the stress tests cover approximately 66% of total US banking sector assets.
5The sample for our CDS analysis is smaller as credit default swaps of some banks were not available or werehardly traded. Table A1 lists the banks in our CDS analysis.
6There is a case to be made for expanding the event windows. Jenkins et al. (2011) note that details of theEBA 2011 stress test methodology leaked beforehand. Although our news analysis did not yield evidence of newsleakages one cannot guarantee absence of leakages. Moreover one captures, if any, lagged market responses.
8

Table 3: List of the banks which passed/failed the stress tests
Banks 2009 2012 2013 DFAST 2013 CCAR SIFI
Ally Financial - - - - dAmerican Express + + + - dBank of America - + + + gBank of New York Mellon + + + + gBB&T + + + - dCapital One Financial + + + + dCitigroup - - + + gFifth Third Bank - + + + dGoldman Sachs + + + - gJPMorgan Chase + + + - gKeyCorp - + + + -MetLife + - N.a. N.a. -Morgan Stanley - + + + gPNC Financial Services - + + + dRegions Financial - + + + dState Street + + + + gSunTrust Banks - - + + dU.S. Bancorp + + + + dWells Fargo - + + + g
Notes: This table presents the list of the banks which passed/failed the 2009-2013 stress tests. ’+’ means that a bank passed the stress testwithout any frictions (’No-Gap’ banks), and ’-’ indicates that a bank had a capital gap or did not receive approval for capital distributions(’Gap’ banks). ’N.a.’ denotes that the bank did not participate in the corresponding testing procedure. ’g’/’d’ denotes that the bank is aglobal/domestic SIFI according to the Financial Stability Board (FSB, 2013).
We present findings for a 3-days event window (-1,+1).7 Our estimation window for equity
returns and CDS spreads consists of 150 trading days, i.e. the (-160,-10) time interval, where
t = 0 is the event date of the corresponding stress test. This window is sufficiently long to conduct
an event study using daily data (MacKinlay, 1997) and sufficiently short to avoid overlaps with
events related to stress tests in other years. When event windows are overlapping, or a single
event affects multiple banks, we can no longer assume that the abnormal returns of securities
are cross-sectionally uncorrelated. Figure 1 shows that the date of the methodology release and
the date of the disclosure of the results of the CCAR in 2012 are particularly close. In this case
the covariance between these may deviate from zero and we can no longer use the distributional
results for the aggregated abnormal returns (MacKinlay, 1997). Consequently, we treat the
disclosure of the methodology and the results of CCAR 2012 as a ”large” event and use one
dummy for both events.8 Moreover, we use adjusted test statistics, described below, to address
the correlation between time series.
To measure the impact of an event we set the abnormal return of a security as the difference
between the actual (ex post) return and the normal return over the relevant event window.
7We have considered different event windows as well: (-2,0), (0,+2), (-2,+2), (-3,0), (0,+3), (-3,+3), (-10,0),(0,+10), and (-10,+10). The findings (available on request) did not yield additional information and consequentlywe only report results for the (-1,+1) time interval.
8In this respect our approach is similar to that of Morgan et al. (2010) who consider the clarification eventof the SCAP in 2009, which actually consist of two events: Bernanke’s testimony on 24 March 2009 and therelease of further details about the stress test on 23 and 25 March 2009. They disentangle the effects of the eventsby considering how equity and bond-holders are affected. They reason that the former event mattered for bothmarket participants but the release of the Capital Assistance Plan details mattered only for equity holders.
9
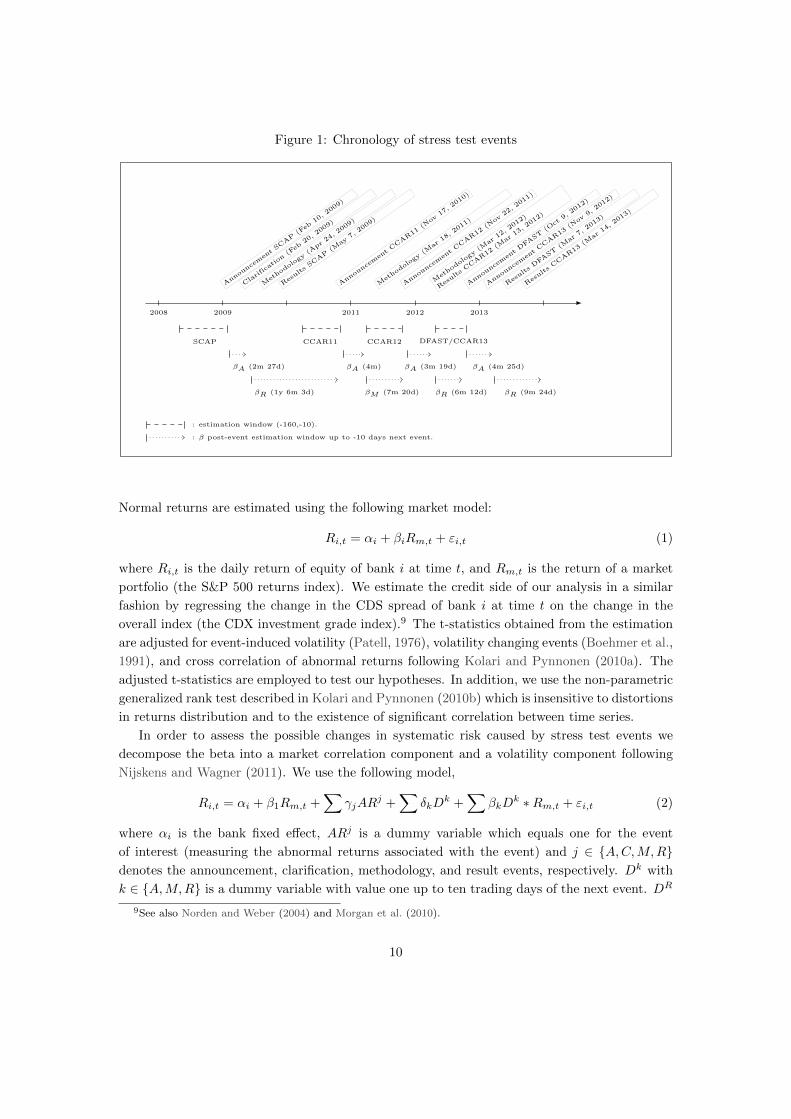
Figure 1: Chronology of stress test events
2008 2009 2011 2012 2013
Ann
ounc
emen
tSC
AP
(Feb
10, 2
009)
Clarific
ation(F
eb20
, 200
9)
Metho
dology
(Apr
24, 2
009)
Results
SCAP
(May
7,20
09)
Ann
ounc
emen
tCCAR11
(Nov
17, 2
010)
Metho
dology
(Mar
18, 2
011)
Ann
ounc
emen
tCCAR12
(Nov
22, 2
011)
Metho
dology
(Mar
12, 2
012)
Results
CCAR12
(Mar
13, 2
012)
Ann
ounc
emen
tDFA
ST(O
ct9,
2012
)
Ann
ounc
emen
tCCAR13
(Nov
9,20
12)
Results
DFA
ST(M
ar7,
2013
)
Results
CCAR13
(Mar
14, 2
013)
: estimation window (-160,-10).
: β post-event estimation window up to -10 days next event.
SCAP CCAR11 CCAR12 DFAST/CCAR13
βA (2m 27d)
βR (1y 6m 3d)
βA (4m)
βM (7m 20d)
βA (3m 19d)
βR (6m 12d)
βA (4m 25d)
βR (9m 24d)
Normal returns are estimated using the following market model:
Ri,t = αi + βiRm,t + εi,t (1)
where Ri,t is the daily return of equity of bank i at time t, and Rm,t is the return of a market
portfolio (the S&P 500 returns index). We estimate the credit side of our analysis in a similar
fashion by regressing the change in the CDS spread of bank i at time t on the change in the
overall index (the CDX investment grade index).9 The t-statistics obtained from the estimation
are adjusted for event-induced volatility (Patell, 1976), volatility changing events (Boehmer et al.,
1991), and cross correlation of abnormal returns following Kolari and Pynnonen (2010a). The
adjusted t-statistics are employed to test our hypotheses. In addition, we use the non-parametric
generalized rank test described in Kolari and Pynnonen (2010b) which is insensitive to distortions
in returns distribution and to the existence of significant correlation between time series.
In order to assess the possible changes in systematic risk caused by stress test events we
decompose the beta into a market correlation component and a volatility component following
Nijskens and Wagner (2011). We use the following model,
Ri,t = αi + β1Rm,t +∑
γjARj +
∑δkD
k +∑
βkDk ∗Rm,t + εi,t (2)
where αi is the bank fixed effect, ARj is a dummy variable which equals one for the event
of interest (measuring the abnormal returns associated with the event) and j ∈ {A,C,M,R}denotes the announcement, clarification, methodology, and result events, respectively. Dk with
k ∈ {A,M,R} is a dummy variable with value one up to ten trading days of the next event. DR
9See also Norden and Weber (2004) and Morgan et al. (2010).
10

therefore measures any mean effects associated with a result event for the post-results period.
DA ∗ Rm,t, DM ∗ Rm,t, and DR ∗ Rm,t are the interaction terms of interest. Their coefficients
will capture the change in bank betas after the announcement events, methodology event, and
after the result events, respectively.10 Figure 1, shows the post-event estimation windows for the
betas associated with the interaction terms.
Next, we decompose the changes in betas into changes in the correlation of stocks with the
market and changes in the relative variance. That is, the beta can be represented by,
βi = ρi,mσiσm
(3)
where ρi,m is the correlation coefficient between the equity and the market and σm the variance
of the market.11 The beta in (3) is the product of the correlation of a bank’s equity price with
the market and its standard deviation relative to that of the market. We then normalize our
model in (2) by dividing the equity and market returns by their respective standard deviations.
As a consequence the coefficient of the normalized returns equals the correlation of the previous
series, and (3) changes to βi = ρi. The regression equation is then changed to,
R̃i,t = α̃i + ρ1R̃m,t +∑
γjARj +
∑δkD
k +∑
ρkDk ∗ R̃m,t + εi,t (4)
where
R̃i,t =Ri,t/σi,t<ti if t< tiRi,t/σi,t≥ti if t≥ ti
and R̃m,i,t =Rm,i,t/σm,t<ti if t< tiRm,i,t/σm,t≥ti if t≥ ti
and ti stands for the event date.12
5 Results
5.1 How do stress tests affect equity returns and credit risk?
We present our findings in Tables 4 and 5 and Figure A2. Table 4 shows reactions in the equity
market and Table 5 shows reactions in the credit market. We discuss each market in turn,
considering the announcement, clarification, methodology, and result events.
10Note that we exclude the clarification and methodology events of 2009 in our beta analysis as they are veryclose to the announcement and result release of SCAP, respectively. Similarly, we only consider the announcementof DFAST and the results release of CCAR as these are the first and last events of interest in 2013, respectively.
11To arrive at (3), note that individual stock beta βi =covi,mσ2m
can be represented as βi = ρi,mσiσm
using the
correlation notation ρi,m =covi,mσiσm
.12To identify shifts in the relative variance, σi/σm, we do the following decomposition: β1 = β0 +∆β where the
superscripts denote the beta before and after the event. Using β1 = ρ1i,m
σ1i
σ1m
= (ρ0i,m+∆ρi,m)
σ1i
σ1m
relative variance
can be rearranged asσ1i
σ1m
= β0+∆β
ρ0i,m+∆ρi,mand, therefore, a change in relative variance is ∆
σ1i
σ1m
=σ1i
σ1m
− σ0i
σ0m
=
β0+∆β
ρ0i,m+∆ρi,m− β0
ρ0i,m.
11

Table 4: Stock market reaction to stress tests (in %)
All No-Gap Gap
CAR %>0 CAR %>0 CAR %>02009Announcement -.6205 44.44 -.2985 44.44 -.9424 44.44Clarification 20.92* 100.0 10.59* 100.0 31.26** 100.0Methodology .1488 50.00 3.952 66.67 -3.654 33.33Results 14.10** 77.78 11.24** 77.78 16.95** 77.78
2011Announcement -2.210 27.78**Methodology -1.620 16.67***
2012Announcement -.1115 44.44 .1312 53.33 -1.325*** .000**Results 2.399 88.89 3.034** 93.33 -.7762 66.67
2013Announcement DFAST 1.998** 94.12Announcement CCAR 1.442 82.35 1.491 76.92 1.282*** 100.00Results DFAST 1.446 88.24Results CCAR .8309 70.59 1.141 76.92 -.1767 50.00
Notes: *** - 1% ** - 5%, * - 10% significance level. This table presents CARs for the main stress test events over the 2009-2013 periodcalculated using Equation (1) with a (-1,+1) event window. We report the significance level of tests with p-value less than 0.1. Whenp-values for all tests (the Kolari and Pynnonen (2010a) adjusted tests and the rank test) exceed 0.1, significance is not reported.
Stock market As shown in Table 4, the announcements of stress tests generally had no effect
on equity returns. Except for the announcement of DFAST, the responses are insignificant when
we consider banks jointly. This may reflect that generally stress test announcements provide
limited (quantitative) information on the way the stress tests will be conducted or how their
results will be used. However, when we distinguish between banks with capital shortfalls and
those without (denoted gap and no-gap in the tables), the announcement of the CCAR in 2012
and 2013 led to significant market movements.
The market’s reaction to then chairman Bernanke’s clarification in 2009 that banks would
not be nationalized caused a strong upward movement in equity returns. The clarification event
notably increased the CARs of gap banks by 31.26 percent as these banks were at the time
considered to be at risk to be nationalized (Morgan et al., 2010). In line with Morgan et al.
(2010), we find no evidence that the methodology disclosure of the SCAP has led to changes in
stock prices. This is also the case for CCAR in 2011. In the other years the methodology and
results were released jointly.13
Table 4 shows that CARs of bank equity returns in 2009 were 14.1 percent higher after the
release of stress test results. Both gap and no-gap banks’ stock prices were strongly affected.
This is also shown in Figure A2. In the left panel of the figure the movement of CARs of equity
returns over a 21-day period is provided where 0 denotes the result event. Equity prices increased
days before the publication of the SCAP results. The figure also confirms that CARs were larger
for gap banks.
13In 2012 the methodology and results were released on two consecutive days. As discussed in our methodologysection we treat these events as a single ’large’ event.
12

Table 5: Credit market reaction to stress tests (in bps)
All No-Gap Gap
CAR %>0 CAR %>0 CAR %>02009Announcement -13.54** .000*** -11.36* .000*** -16.26** .000**Clarification 17.83 55.56 31.17 60.00 1.157 50.00Methodology -11.30 33.33 -19.61 20.00* -.9207 50.00Results -81.30** .000*** -54.71** .000** -114.5*** .000**
2011Announcement 2.871 60.00Methodology -11.04** .000***
2012Announcement 8.754 70.00 6.513 57.14 13.98** 100.0Results -11.62* .000*** -11.15** .000*** -12.73** .000*
2013Announcement DFAST .2970 44.44Announcement CCAR -6.172 22.22* -6.486 20.00 -5.779 25.00Results DFAST -.6295 44.44Results CCAR -4.586* .000*** -3.859** .000** -5.495* .000**
Notes: *** - 1% ** - 5%, * - 10% significance level. This table presents CARs for the main stress test events over the 2009-2013 periodcalculated using changes in CDS spreads for (-1,+1) event window. We report the significance level of tests with p-value less than 0.1.When p-values for all tests (the Kolari and Pynnonen (2010a) adjusted tests and the rank test) exceed 0.1, significance is not reported.
For stress tests conducted after 2009, the evidence is weaker. For the sample of all banks we
find no evidence that the equity market reacted to the disclosure of the results of stress tests.
For no-gap banks we find a significant effect in 2012. However, the magnitude of the impact is
lower in 2012 than in 2009. We attribute the greater response in CARs to the higher financial
turbulence in the latter period.
The findings suggest that post-crisis stress tests had a limited effect on the equity market.
Arguably, during a crisis the need for credible information is greater than in calmer periods so
the market may have valued the information disclosed in 2009 more (Schuermann, 2013). This
reasoning is also in agreement with the lower panel of Figure A1.
Credit market As Table 5 shows, the announcement events only had a significant effect on
CDS spreads in 2009 and in 2012 (the announcement of CCAR). Moreover, we see that Bernanke’s
clarification of the stress test in 2009 did not affect the CDS market. This response is expected
due to the structure of the CDS agreements where any change in ownership due to nationalization
would not bring additional losses to contract parties.14
For the methodology events we find mixed results. As Table 5 shows, for 2009 we find no
impact on CDS spreads. However, in 2011 CDS spreads declined significantly following the
release of the stress test methodology. This suggests that the release of the methodology in
2009 was less informative for the market compared to 2011. In 2011 there was no disclosure
14Morgan et al. (2010) do find a decline in CDS spreads following the clarification event (though only for gapbanks). However, they consider CDS contracts with an MR document clause. This entails that these contractsdo not suppose full coverage in case of a credit event. As we do not consider these types of contracts a possiblenationalization would not affect the spreads.
13

of stress test results, which could have led the market valuing the information provided by the
methodology disclosure relatively strongly.
As Table 5 shows, average CDS spreads dropped following the publication of the stress test
results. The disclosure of stress test results reduced CDS spreads in all years. The strongest
decline is observed after the disclosure of the SCAP outcomes when spreads declined 81.3 basis
points. In contrast, the DFAST results event seems to have been uninformative to the market.
The fact that CCAR in 2013 affected CDS spreads stronger than DFAST could be due to two
reasons. Firstly, as Table 3 shows, all seventeen banks in DFAST received approval while in
CCAR three of these banks were not approved. The market may therefore have attached more
importance to the results of CCAR. Alternatively, it could be due to the underlying assumptions
of the stress tests. While DFAST was conducted conditional on no change in the capital distri-
butions, CCAR incorporated the capital plans proposed by the banks and, therefore, may have
better reflected creditworthiness (Federal Reserve, 2013a).
As expected, gap banks experienced a stronger reaction than no-gap banks. Overall, the
findings indicate that stress tests have provided new information to CDS markets after the crisis.
5.2 How do stress tests affect systematic and systemic risk?
Tables 6 and 7 report the results. Reported significance levels are based on panel-corrected
standard errors.
Systematic risk Table 6 presents event dummies associated with the stress tests and the
interaction terms with betas. We focus our discussion on these interaction terms.15 Table 6
shows that the impact of the announcement effects are mixed. In 2009 the announcement of
SCAP has led to an increase in systematic risk. For the remaining years there is no consistent
evidence of movement in betas. Considering results events, in 2009 the betas were reduced
following the results of the SCAP. Specifically, the decrease in systematic risk amounts to 0.2222
after the publication of results. Similarly, the beta of banks declined after the release of stress
test results in 2013 (-.2223). These findings suggest that market participants expected stress test
results to be worse than they ex-post turned out to be and as a consequence betas declined in
2009 and 2013.
Systemic risk Table 7 presents the estimation results for our standardized model expressed
in Equation (4). We are interested in the coefficients of the interaction terms, denoted by ρ.
Following Nijskens and Wagner (2011), we interpret a decline in the correlation component as
a decline in systemic risk. Except from a weak effect in 2012, we see no evidence that the
announcement events affected systemic risk of banks. However, the methodology release in 2011
increased ρ and contributed to the increase in beta in Table 6. For results events there is a
decrease in the correlation of the stock series with the market for all years, suggesting that
systemic risk declined. We attribute the insignificance of the corresponding beta for CCAR 2012
15Note, however, the consistency of the event dummies in Table 6 with the findings reported in Table 4. Equityreturns in both tables are positively affected by the clarification and results events of the SCAP 2009 as well as bythe DFAST 2013 announcement, while stress tests conducted in 2011–13 did not affect equity returns significantly.
14

Table 6: Systematic risk
2009 2011 2012 2013
Market β 1.783*** 1.433*** 1.563*** 1.452***(.0608) (.0566) (.0427) (.0573)
Announcement -.0031 -.0077 -.0002 .0042(.0138) (.0053) (.0053) (.0034)
Announcement DFAST .0066**(.0034)
Clarification .0754***(.0141)
Methodology -.0032 -.0057(.0143) (.0054)
Results .0448*** .0061 .0029(.0138) (.0045) (.0033)
Results DFAST .0047(.0034)
Announcement mean effect -.0031 .0009 .0013 .0001(.0038) (.0013) (.0013) (.0008)
Methodology mean effect -.0006(.0010)
Results mean effect -.0010 .0011 .0002(.0022) (.0011) (.0006)
Announcement β effect .9920*** .0431 .1343 -.1217(.1447) (.1416) (.1171) (.0948)
Methodology β effect .1207*(.0723)
Results β effect -.2222* -.0893 -.2223***(.1227) (.0994) (.0809)
Constant -.0009 -.0027** -.0023* -.0000(.0024) (.0012) (.0013) (.0008)
Number of id 18 18 18 17Trading days 597 406 371 445R2 .4833 .6260 .6392 .4881
*** p<0.01, ** p<0.05, * p<0.1Robust standard errors in parentheses
in Table 6 to the relative variance component, which could have added sufficient noise to make
the overall change in beta insignificant. Overall, we conclude that the information revealed in
the stress test results decreased systemic risk.
Gap vs no-gap To examine whether gap and no-gap banks were affected differently, we re-
estimate our models. The results are shown in Tables A2 and A3. As a first step, we add a dummy
variable and an interaction term to Equations (2) and (4) specifically for gap banks. In a separate
regression we include dummy variables for both gap and no-gap banks and their interactions with
the market index.16 The resulting regressions are shown in, respectively, columns (1) and (2) in
Tables A2 and A3. Columns (1) display whether the changes in betas of gap banks are different
from changes in betas of no-gap banks. Columns (2) display the effects on betas of gap and
16We did not run separate regressions for gap and no-gap banks because in some years there were only a fewbanks with capital shortfalls.
15

Table 7: Systemic risk
2009 2011 2012 2013
Market ρ .7334*** .7674*** .8566*** .7463***(.0327) (.0291) (.0282) (.0341)
Announcement .1506 -.4591** .1082 .2635(.2464) (.2170) (.2125) (.2231)
Announcement DFAST .4085*(.2328)
Clarification .7271***(.2509)
Methodology -.0244 -.2561(.2511) (.2186)
Results .8189*** .3159* .2135(.2468) (.1830) (.2301)
Results DFAST .3589(.2312)
Announcement mean effect -.0293 .0349 .0366 -.0030(.0681) (.0512) (.0524) (.0531)
Methodology mean effect -.0072(.0416)
Results mean effect -.0397 .0282 .0100(.0400) (.0422) (.0442)
Announcement ρ effect .0199 -.0813 -.0874* -.0588(.0661) (.0516) (.0521) (.0527)
Methodology ρ effect .0803*(.0413)
Results ρ effect -.0634 -.1273*** -.0433(.0394) (.0423) (.0438)
Constant -.0179 -.0879*** -.0612 -.0090(.0403) (.0389) (.0411) (.0447)
Number of id 18 18 18 17Trading days 597 406 371 445R2 .4958 .6175 .6403 .5071
*** p<0.01, ** p<0.05, * p<0.1Robust standard errors in parentheses
16

no-gap banks. In what follows we focus our discussion on the beta effects associated with the
results events.
As columns (1) in Table A2 show, changes in betas of gap banks significantly differ from
changes in betas of no-gap banks in all years. As revealed by the stress test results, most banks
had sufficient capital to maintain their operations under the adverse economic scenario employed,
but some banks appeared to be under-capitalized. The signs in columns (1) associated with stress
test results for gap and no-gap banks suggest that the betas move in opposite directions.17
Considering column (2), we see that the decrease in the beta in 2009 as reported in Table 6
was due to the effects on no-gap banks. The results of SCAP seem to have caused a significant
decrease in betas of no-gap banks while the betas of gap banks were not affected. This finding
complements the findings of Morgan et al. (2010) who show that market participants’ ex ante
expectations of capital shortfalls were worse than they ex post turned out to be. For the remaining
years in Table A2, it turns out that the publication of the CCAR 2012 result did affect the betas
of gap banks. The increase in beta amounts to .2284. This suggests that also in 2012 the betas
of gap banks were affected, albeit positively. In 2013, the change in overall beta following the
results of CCAR is due to both gap (-.2617) and no-gap (-.2110) banks.
Considering systemic risk for gap banks in Table A3, there is evidence that stress test results
affect systemic risk also in 2009. The release of stress test results in 2009 decreased the beta of
gap banks but not of no-gap banks. The decline in betas amounts to .0976. In 2012, both gap
and no-gap banks’ betas were affected.
6 Conclusion
As stress tests are an important tool for banking supervisors, it is important to consider their
effects on stock and credit markets. We have quantified the market reactions of US stress tests
performed after the start of the financial crisis by considering their effects on stock returns, CDS
spreads, systematic risk, and systemic risk. We conclude that stress tests have produced valuable
information for market participants and can play a role in mitigating bank opacity. Our findings
indicate that post-crisis stress tests affected the CDS market strongly but had less impact on
bank stock returns. Equity returns were only affected by the disclosure of the stress test results
in 2012 and only for non-gap banks.
Our analysis of banks’ betas suggests that the publication of stress test results has affected
banks’ systematic risk for all years. Stress tests contributed to diminishing systematic risk in
2009 and 2013. However, for 2012 we find some evidence that the systematic risk of gap banks
increased following the publication of the results of CCAR. Studying the changes in betas we
find that stress tests reduced systemic risk in 2009 (for gap banks) and in 2012 (for all banks).
Overall, our findings suggest that stress tests are a useful tool in mitigating risk in stock and
credit markets.
17A finding in agreement with Baker and Wurgler (2013) who confirm that the equity of better-capitalizedbanks has lower systematic (beta) risk.
17

References
Alves, C., Mendes, V., da Silva, P. P., 2013. Do stress tests matter? An event study on the impact
of the disclosure of stress test results on European financial stocks. Comissao do Mercado de
Valores Mobiliarios. Working Paper 07/02/2013.
Baker, M., Wurgler, J., 2013. Do strict capital requirements raise the cost of capital? Bank
regulation and the low risk anomaly. National Bureau of Economic Research. Working Paper
19018.
BCBS, 2009. Principles for sound stress testing practices and supervision. Basel Committee on
Banking Supervision.
URL https://www.bis.org/publ/bcbs147.pdf
BCBS, 2012. Peer review of supervisory authorities? Implementation of stress testing principles.
Basel Committee on Banking Supervision.
URL https://www.bis.org/publ/bcbs218.htm
Beltratti, A., 2011. Do stress tests carry useful information? Evidence from Europe. Bocconi
University.
Bernanke, B. S., 2013. Stress testing banks: What have we learned? Financial Markets Confer-
ence Speech, Federal Reserve Bank of Atlanta.
URL http://www.federalreserve.gov/newsevents/speech/bernanke20130408a.htm
Bischof, J., Daske, H., 2013. Mandatory disclosure, voluntary disclosure, and stock market liquid-
ity: Evidence from the EU bank stress tests. Journal of Accounting Research 51 (5), 997–1029.
Boehmer, E., Masumeci, J., Poulsen, A. B., 1991. Event-study methodology under conditions of
event-induced variance. Journal of Financial Economics 30 (2), 253–272.
Bongini, P., Nieri, L., 2013. The importance of being systemically important financial institu-
tions. Digital Commons Network. Working Paper Jul 2013.
URL http://works.bepress.com/paola_bongini/19
Borio, C., Drehmann, M., Tsatsaronis, K., 2013. Stress-testing macro stress testing: Does it live
up to expectations? Journal of Financial Stability, 1–13.
Breuer, T., Jandacka, M., Rheinberger, K., Summer, M., 2009. How to find plausible, severe and
useful stress scenarios. International Journal of Central Banking 5 (3), 205–224.
Brown, S. J., Warner, J. B., 1985. Using daily stock returns: The case of event studies. Journal
of Financial Economics 14 (1), 3–31.
Cardinali, A., Nordmark, J., 2011. How informative are bank stress tests? Bank opacity in the
European Union. Master’s thesis, Lund University.
Chan-Lau, J. A., 2013. Market-based structural top-down stress tests of the banking system.
IMF Working Paper 13/88.
18

Cihak, M., 2007. Introduction to applied stress testing. IMF Working Paper 7/59.
de Larosiere, J., 2009. The high-level group on financial supervision in the EU. European Com-
mission report on supervision.
Ellahie, A., 2012. Capital market consequences of EU bank stress tests. London Business School
Working Paper.
URL http://ssrn.com/abstract=2157715
Federal Reserve, 2009. The Supervisory Capital Assessment Program: Overview of results. Fed-
eral Reserve, Washington DC.
URL http://www.federalreserve.gov/newsevents/press/bcreg/bcreg20090507a1.pdf
Federal Reserve, 2012. Comprehensive Capital Analysis and Review 2012: Methodology and
results for stress scenario projections. Federal Reserve, Washington DC.
URL http://www.federalreserve.gov/newsevents/press/bcreg/bcreg20120313a1.pdf
Federal Reserve, 2013a. Comprehensive Capital Analysis and Review 2013: Assessment frame-
work and results. Federal Reserve, Washington DC.
URL http://www.federalreserve.gov/bankinforeg/ccar-2013-results-20130314.pdf
Federal Reserve, 2013b. Dodd-Frank Act Stress Test 2013: Supervisory stress test methodology
and results. Federal Reserve, Washington DC.
URL http://www.federalreserve.gov/newsevents/press/bcreg/dfast_2013_results_
20130314.pdf
Flannery, M. J., Kwan, S. H., Nimalendran, M., 2004. Market evidence on the opaqueness of
banking firms’ assets. Journal of Financial Economics 71 (3), 419–460.
Flannery, M. J., Kwan, S. H., Nimalendran, M., 2013. The 2007-09 financial crisis and bank
opaqueness. Journal of Financial Intermediation 22 (1), 55–84.
Foglia, A., 2009. Stress testing credit risk: A survey of authorities’ approaches. International
Journal of Central Banking 5 (3), 9–45.
FSA, 2009. The Turner Review: A regulatory response to the global banking crisis. Report of
the Financial Services Authority.
URL http://www.fsa.gov.uk/pubs/other/turnerreview.pdf
FSB, 2013. 2013 update of group of global systemically important banks (G-SIBS). Financial
Stability Board.
URL https://www.financialstabulityboard.org/publications/r_131111
Galati, G., Moessner, R., 2013. Macroprudential policy - a literature review. Journal of Economic
Surveys 27 (5), 846–878.
19

Gick, W., Pausch, T., 2012. Persuasion by stress testing: Optimal disclosure of supervisory
information in the banking sector. Available at SSRN.
URL http://ssrn.com/abstract=2006852
Goldstein, I., Sapra, H., forthcoming. Should banks’ stress test results be disclosed? An analysis
of the costs and benefits. Foundations and Trends in Finance.
Greenlaw, D., Kashyap, A., Schoenholtz, K., 2012. Stressed out: Macroprudential principles for
stress testing. Booth Business School Research Paper.
Haggard, K. S., Howe, J. S., 2012. Are banks opaque? International Review of Accounting,
Banking and Finance 4 (1), 51–72.
Huang, X., Zhou, H., Zhu, H., 2012. Assessing the systemic risk of a heterogeneous portfolio of
banks during the recent financial crisis. Journal of Financial Stability 8 (3), 193–205.
Iannotta, G., 2006. Testing for opaqueness in the European banking industry: Evidence from
bond credit ratings. Journal of Financial Services Research 30 (3), 287–309.
Jenkins, P., Wilson, J., Atkins, R., Tait, N., 2011. Concerns of latest EU bank stress tests.
Financial Times, online 8 March 2011.
URL http://www.ft.com/cms/s/0/1fdfeede-4971-11e0-b051-00144feab49a.html#
axzz1JnL0du5y
Jones, J. S., Lee, W. Y., Yeager, T. J., 2012. Opaque banks, price discovery, and financial
instability. Journal of Financial Intermediation 21 (3), 383–408.
Kolari, J. W., Pynnonen, S., 2010a. Event study testing with cross-sectional correlation of ab-
normal returns. Review of Financial Studies 23 (11), 3996–4025.
Kolari, J. W., Pynnonen, S., 2010b. Nonparametric rank tests for event studies. 21st Australasian
Finance and Banking Conference 2008 Paper. Available at SSRN.
URL http://ssrn.com/abstract=1254022
Liedorp, F., Mosch, R., van der Cruijsen, C., de Haan, J., 2013. Transparency of banking super-
visors. IMF Economic Review 61 (2), 310–335.
MacKinlay, A. C., 1997. Event studies in Economics and Finance. Journal of Economic Literature
35 (1), 13–39.
Morgan, D. P., 2002. Rating banks: Risk and uncertainty in an opaque industry. The American
Economic Review 92 (4), 874–888.
Morgan, D. P., Peristiani, S., Savino, V., 2010. The information value of the stress test and bank
opacity. Federal Reserve Bank of New York Staff Reports 460.
Nijskens, R., Wagner, W., 2011. Credit risk transfer activities and systemic risk: How banks
became less risky individually but posed greater risks to the financial system at the same
time. Journal of Banking and Finance 35 (6), 1391–1398.
20

Norden, L., Weber, M., 2004. Informational efficiency of credit default swap and stock markets:
The impact of credit rating announcements. Journal of Banking and Finance 28 (11), 2813–
2843.
Oura, H., Schumacher, L. B., 2012. Macrofinancial stress testing: Principles and practices. In-
ternational Monetary Fund.
URL http://ssrn.com/abstract=2157071
Patell, J. M., 1976. Corporate forecasts of earnings per share and stock price behavior: Empirical
test. Journal of Accounting Research 14 (2), 246–276.
Petrella, G., Resti, A., 2013. Supervisors as information producers: Do stress tests reduce bank
opaqueness? Journal of Banking and Finance 37 (12), 5406–5420.
Schaefer, A., Schnabel, I., di Mauro, B. W., 2013. Financial sector reform after the crisis: Has
anything happened? CEPR Discussion Papers 9502.
Schechtman, R., Gaglianone, W. P., 2012. Macro stress testing of credit risk focused on the tails.
Journal of Financial Stability 8 (3), 174–192.
Schuermann, T., 2013. Stress testing banks. Financial Institutions Center, The Wharton School,
University of Pennsylvania Working Paper 12-08.
Sorge, M., 2004. Stress-testing financial systems: an overview of current methodologies. Bank
for International Settlements Working Paper 165.
Spargoli, F., 2012. The optimal design of a bank stress test.
Swinburne, M., 2007. The IMF’s experience with macro stress-testing. Paper Presented at the
ECB High Level Conference on Simulating Financial Instability, Frankfurt am Main, Germany.
URL http://www.ecb.int/events/pdf/conferences/sfi/Swinburne.pdf
Thompson, R., 1995. Empirical methods of event studies in corporate Finance. Handbook in
Operations Research and Management Science. Finance, Elsevier. North-Holland, Amsterdam.
21

A Additional Figures and Tables
Figure A1: Stress test news
0.2
.4.6
.81
No
rma
lize
d s
erie
s
Apr Jul Oct Jan10 Apr Jul Oct Jan11 Apr Jul Oct Jan12 Apr Jul Oct Jan13
Announcement Clarification Methodology Results S&P Index CDX IG
02
04
06
08
01
00
# o
f N
ew
s
Apr Jul Oct Jan10 Apr Jul Oct Jan11 Apr Jul Oct Jan12 Apr Jul Oct Jan13
News
Table A1: Composition of CDS data
Banks Number of CDS spreads Total Obs
2008 2009 2010 2011 2012 2013
Ally Financial 85 238 244 251 249 169 1236American Express 190 250 252 250 250 236 1428Bank of America 248 252 252 252 250 250 1504Capital One Financial 109 250 251 251 250 241 1352Citigroup 247 250 252 252 251 251 1503Goldman Sachs Group 207 251 252 252 252 252 1466JPMorgan Chase 247 251 252 252 252 252 1506MetLife 173 249 251 252 251 235 1411Morgan Stanley 206 249 245 251 251 247 1449Wells Fargo 185 250 251 252 249 247 1434
Notes: This table includes the amounts of non-missed and non-zero changes in 5Y CDS spreads available at the Bloombergdatabase for the period of 2008-2013.
22

Figure A2: CARs of equity returns and CDS spreads of US banks
−1
00
10
20
Equitie
s
−10−9 −8 −7 −6 −5 −4 −3 −2 −1 0 1 2 3 4 5 6 7 8 9 10
SCAP09
Equities
−2
00
−1
00
01
00
Equitie
s
−10−9 −8 −7 −6 −5 −4 −3 −2 −1 0 1 2 3 4 5 6 7 8 9 10
CDSs
−2
02
46
8
Equitie
s
−10−9 −8 −7 −6 −5 −4 −3 −2 −1 0 1 2 3 4 5 6 7 8 9 10
CCAR12
−3
0−
20
−1
00
Equitie
s
−10−9 −8 −7 −6 −5 −4 −3 −2 −1 0 1 2 3 4 5 6 7 8 9 10
(1) (2)
−2
−1
01
2
Equitie
s
−10−9−8−7−6−5−4−3−2−1 0 1 2 −2−1 0 1 2 3 4 5 6 7 8 9 10
DFAST (1) & CCAR (2)
(1) (2)
−1
00
10
20
Equitie
s
−10−9−8−7−6−5−4−3−2−1 0 1 2 −2−1 0 1 2 3 4 5 6 7 8 9 10
All Gap No Gap
23

Table A2: Systematic risk gap and no-gap banks
2009 2012 2013(1) (2) (1) (2) (1) (2)
Market β 1.783*** 1.783*** 1.563*** 1.563*** 1.465*** 1.465***(.0608) (.0608) (.0426) (.0426) (.0565) (.0565)
Announcement -.0031 -.0031 -.0002 -.0002 .0041 .0041(.0138) (.0138) (.0053) (.0053) (.0033) (.0033)
Announcement DFAST .0066** .0066**(.0033) (.0033)
Clarification .0754*** .0754***(.0141) (.0141)
Methodology -.0032 -.0032(.0143) (.0143)
Results .0448*** .0448*** .0061 .0061 .0029 .0029(.0138) (.0138) (.0045) (.0045) (.0033) (.0033)
Results DFAST .0055* .0055*(.0033) (.0033)
Announcement mean effect -.0031 -.0031 .0013 .0013 .0001 .0001(.0038) (.0038) (.0013) (.0013) (.0008) (.0008)
Results mean effect ’Gap’ .0008 -.0007 .0004 .0014 .0000 .0003(.0019) (.0028) (.0009) (.0014) (.0005) (.0007)
Results mean effect ’No Gap’ -.0014 -.0014 .0010 .0010 .0003 .0003(.0019) (.0019) (.0010) (.0010) (.0007) (.0007)
Announcement β effect .9922*** .9922*** .1343 .1343 -.1077 -.1077(.1447) (.1447) (.1171) (.1171) (.0934) (.0934)
Results β effect ’Gap’ .2105** -.1170 .3813*** .2284* -.0507 -.2617***(.1007) (.1540) (.0835) (.1300) (.0488) (.0837)
Results β effect ’No Gap’ -.3275*** -.3275** -.1529 -.1529 -.2110** -.2110***(.1070) (.1070) (.0982) (.0982) (.0819) (.0837)
Constant -.0018 -.0012 -.0023* -.0023* -.0001 -.0001(.0026) (.0026) (.0013) (.0013) (.0008) (.0008)
Number of id 18 18 18 18 17 17Trading days 597 597 371 371 445 445R2 .4836 .4836 .6401 .6401 .4927 .4927
*** p<0.01, ** p<0.05, * p<0.1Robust standard errors in parentheses
24

Table A3: Systemic risk gap and no-gap banks
2009 2012 2013(1) (2) (1) (2) (1) (2)
Market ρ .7334*** .7334*** .8566*** .8566*** .7491*** .7491***(.0327) (.0327) (.0282) (.0282) (.0336) (.0336)
Announcement .1510 .1510 .1082 .1082 .2533 .2533(.2467) (.2467) (.2125) (.2125) (.2292) (.2292)
Announcement DFAST .4101* .4101*(.2289) (.2289)
Clarification .7267*** .7267***(.2512) (.2512)
Methodology -.0243 -.0243(.2513) (.2513)
Results .8196*** .8196*** .3159* .3159* .2124 .2124(.2470) (.2470) (.1830) (.1830) (.2262) (.2262)
Results DFAST .4094* .4094*(.2273) (.2273)
Announcement mean effect -.0292 -.0292 .0366 .0366 -.0019 -.0019(.0681) (.0681) (.0524) (.0524) (.0523) (.0523)
Results mean effect ’Gap’ .0029 -.0382 .0195 .0445 -.0080 .0076(.0285) (.0453) (.0323) (.0496) (.0326) (.0480)
Results mean effect ’No Gap’ -.0412 -.0412 .0250 .0250 .0156 .0156(.0396) (.0396) (.0427) (.0427) (.0448) (.0448)
Announcement ρ effect .0198 .0198 -.0874* -.0874* -.0537 -.0537(.0661) (.0661) (.0521) (.0521) (.0518) (.0518)
Results ρ effect ’Gap’ -.0686*** -.0976*** .0331 -.0997** .0166 -.0355(.0174) (.0414) (.0261) (.0472) (.0238) (.0456)
Results ρ effect ’No Gap’ -.0290 -.0290 -.1328*** -.1328*** -.0520 -.0520(.0392) (.0392) (.0426) (.0426) (.0438) (.0438)
Constant -.0175 -.0175 -.0599 -.0599 -.0119 -.0119(.0425) (.0425) (.0412) (.0412) (.0446) (.0446)
Number of id 18 18 18 18 17 17Trading days 597 597 371 371 445 445R2 .4966 .4966 .6403 .6403 .5099 .5099
*** p<0.01, ** p<0.05, * p<0.1Robust standard errors in parentheses
25

Previous DNB Working Papers in 2014 No. 406 Raymond Chaudron and Jakob de Haan, Identifying and dating systemic banking crises
using incidence and size of bank failures No. 407 Ayako Saiki and Sunghyun Henry Kim, Business cycle synchronization and vertical trade
integration: A case study of the Eurozone and East Asia No. 408 Emmanuel de Veirman and Andrew Levin, Cyclical changes in firm volatility No. 409 Carlos Arango, Yassine Bouhdaoui, David Bounie, Martina Eschelbach and Lola
Hernández, Cash management and payment choices: A simulation model with international comparisons
No. 410 Dennis Veltrop and Jakob de Haan, I just cannot get you out of my head: Regulatory capture of financial sector supervisors
No. 411 Agnieszka Markiewicz and Andreas Pick, Adaptive learning and survey data No. 412 Michael Ehrmann and David-Jan Jansen, It hurts (stock prices) when your team is about to
lose a soccer match No. 413 Richhild Moessner, Jakob de Haan and David-Jan Jansen, The effect of the zero lower
bound, forward guidance and unconventional monetary policy on interest rate sensitivity to economic news in Sweden
No. 414 Dirk Broeders, An Chen and Birgit Koos, Utility-equivalence of pension security mechanisms
No. 415 Irma Hindrayanto, Siem Jan Koopman and Jasper de Winter, Nowcasting and forecasting economic growth in the euro area using principal components
No. 416 Richhild Moessner, Effects of ECB balance sheet policy announcements on inflation expectations
No. 417 Irma Hindrayanto, Jan Jacobs and Denise Osborn, On trend-cycle-seasonal interactions No. 418 Ekaterina Neretina, Cenkhan Sahin and Jakob de Haan, Banking stress test effects on
returns and risks

DN
B W
OR
KIN
GP
AP
ER
DNB Working PaperNo. 35/April 2005
Jan Kakes and Cees Ullersma
Financial acceleration of booms
and busts
De Nederlandsche BankDe Nederlandsche Bank