DNB grOuP - mb.cision.com
42
DNB GROUP Third quarter report 2012 (UNAUDITED) 3
Transcript of DNB grOuP - mb.cision.com

DNB grOuP
Third quarter report 2012(uNauDiTeD)
3

Financial highlights
DNB Group Income statement 3rd quarter 3rd quarter January-September Full year Amounts in NOK million 2012 2011 2012 2011 2011 Net interest income 6 828 6 394 20 115 18 460 25 252
Net commissions and fees, core business 1) 1 852 1 933 5 615 5 804 7 436 Net financial items 1 776 1 770 4 824 5 351 9 317
Net other operating income, total 3 628 3 703 10 439 11 154 16 754 Ordinary operating expenses 5 106 4 862 15 360 14 587 19 792 Other expenses 85 0 85 0 380 Pre-tax operating profit before write-downs 5 265 5 235 15 109 15 028 21 833 Net gains on fixed and intangible assets 20 6 63 20 19 Write-downs on loans and guarantees 521 1 170 1 990 2 519 3 445 Pre-tax operating profit 4 763 4 072 13 182 12 529 18 407 Taxes 1 256 1 604 3 427 3 633 5 423 Profit from operations held for sale, after taxes 0 25 92 (5) (5) Profit for the period 3 507 2 493 9 847 8 890 12 979
Balance sheet 30 Sept. 31 Dec. 30 Sept. Amounts in NOK million 2012 2011 2011 Total assets 2 369 123 2 126 098 2 183 100 Lending to customers 1 307 047 1 279 259 1 247 477 Deposits from customers 843 340 740 036 752 660 Total equity 124 464 117 815 113 776 Average total assets 2 361 664 2 147 853 2 131 917 Total combined assets 2 638 973 2 394 579 2 445 050
Key figures 3rd quarter 3rd quarter January-September Full year 2012 2011 2012 2011 2011
Combined weighted total average spread for lending and deposits (per cent) 1.18 1.11 1.17 1.11 1.12 Cost/income ratio (per cent) 48.8 48.2 50.3 49.3 47.1 Write-downs relative to average net lending to customers, annualised 0.16 0.38 0.21 0.28 0.28 Return on equity, annualised (per cent) 11.4 8.8 10.9 10.6 11.4 Earnings per share (NOK) 2.15 1.53 6.05 5.47 7.98 Dividend per share (NOK) - - - - 2.00 Equity Tier 1 capital ratio at end of period (per cent) 2) 10.0 8.8 10.0 8.8 9.4 Tier 1 capital ratio at end of period (per cent) 2) 10.6 9.3 10.6 9.3 9.9 Capital ratio at end of period (per cent) 2) 12.2 11.0 12.2 11.0 11.4 Share price at end of period (NOK) 70.25 59.40 70.25 59.40 58.55 Price/book value 0.92 0.85 0.92 0.85 0.81
1) Includes commissions and fees related to money transfers and interbank transactions, asset management services, credit broking, real estate broking, custodial services and securities trading as well as the sale of insurance products and other commissions and fees from banking services.
2) Including 50 per cent of profit for the period, exept for the full year figures. There has been no full or partial external audit of the quarterly directors’ report and accounts, though the report has been reviewed by DNB's Group Audit. The report has also been reviewed by the Audit Committee.

DNB third quarter report 2012 Unaudited 1
Third quarter report 2012 Directors’ report ......................................................................................................................................... 2 Accounts for the DNB Group Income statement ............................................................................................................................................. 12
Comprehensive income statement .................................................................................................................... 12
Balance sheet ................................................................................................................................................... 13
Statement of changes in equity ......................................................................................................................... 14
Cash flow statement ......................................................................................................................................... 15
Note 1 Accounting principles .................................................................................................................. 16
Note 2 Important accounting estimates and discretionary assessments ................................................ 16
Note 3 Changes in group structure ......................................................................................................... 16
Note 4 Segments ................................................................................................................................... 17
Note 5 Net interest income ..................................................................................................................... 22
Note 6 Net commissions and fees receivable ......................................................................................... 22
Note 7 Net gains on financial instruments at fair value ........................................................................... 22
Note 8 Profit from companies accounted for by the equity method ......................................................... 23
Note 9 Other income .............................................................................................................................. 23
Note 10 Operating expenses .................................................................................................................... 23
Note 11 Number of employees/full-time positions ..................................................................................... 24
Note 12 Write-downs on loans and guarantees ........................................................................................ 24
Note 13 Lending to customers .................................................................................................................. 24
Note 14 Net impaired loans and guarantees for principal customer groups .............................................. 25
Note 15 Commercial paper and bonds, held to maturity ........................................................................... 25
Note 16 Investment property ................................................................................................................... 27
Note 17 Intangible assets ......................................................................................................................... 28
Note 18 Debt securities issued and subordinated loan capital .................................................................. 28
Note 19 Capital adequacy ........................................................................................................................ 29
Note 20 Liquidity risk ................................................................................................................................ 31
Note 21 Information on related parties ...................................................................................................... 32
Note 22 Off-balance sheet transactions, contingencies and post-balance sheet events ........................... 33 Accounts for DNB ASA Income statement ............................................................................................................................................. 34
Balance sheet ................................................................................................................................................... 34
Statement of changes in equity ......................................................................................................................... 34
Accounting principles ........................................................................................................................................ 34 Additional information DNB Group Key figures ....................................................................................................................................................... 35
Profit and balance sheet trends ........................................................................................................................ 37
Information about the DNB Group ..................................................................................................................... 39

2 Unaudited DNB third quarter report 2012
Directors’ report Introduction Third quarter 2012 DNB recorded profits of NOK 3 507 million in the third quarter of 2012, up from NOK 2 493 million in the third quarter of 2011. Compared with the preceding quarters, there was an increase in net interest income, a reduction in write-downs and an improvement in capital adequacy. All business areas recorded a rise in profits. Mark-to-market adjustments of basis swaps1
Average lending volumes increased by 6.9 per cent from the third quarter of 2011. Lending growth slowed down, with a 1 per cent increase from the second to the third quarter of 2012. Lending spreads widened slightly, while deposit spreads narrowed somewhat from the preceding quarter. Overall, spreads remained stable. Long-term funding costs were relatively stable from the second to the third quarter. Total net interest income rose by 6.8 per cent compared with the third quarter of 2011 and by 2.9 per cent from the second quarter of 2012. Over a trailing 12-month period, there was a 9.3 per cent increase from the third quarter of 2011.
) had a negative effect on other operating income of NOK 566 million. Compared with the third quarter of 2011, such adjustments caused a NOK 1 964 million reduction in income.
Adjusted for the accounting effect of basis swaps, the level of net other operating income was high in the third quarter, rising by 82 per cent from the third quarter of 2011. There was an increase in the contribution from DNB Livsforsikring, primarily due to strong financial market developments. DNB Markets recorded a healthy level of trading income, which primarily reflected a rise in mark-to-market income, while customer-related revenues declined somewhat. Adjusted for non-recurring costs and costs pertaining to non-core operations acquired by the Group, operating expenses rose by 3.5 per cent from the third quarter of 2011, reflecting the establishment of new operations in Norway and internationally towards the end of 2011. The rise in expenses included higher costs in DNB Finans and DNB Eiendom which are directly related to an increase in income from these operations. The number of full-time positions, which increased through 2011, was reduced by 166 from end-June 2012. Write-downs on loans and guarantees totalled NOK 521 million and were thus more than halved from the third quarter of 2011. There was a NOK 164 million reduction in write-downs from the second quarter of 2012. Overall, individual write-downs were on a level with the first two quarters of 2012, with lower write-downs in Retail Banking and a certain increase in write-downs within shipping. Return on equity was 11.4 per cent, up from 8.8 per cent in the July through September period in 2011. Earnings per share were NOK 2.15 and NOK 1.53 for the respective periods. Adjusted for changes in the value of basis swaps, return on equity was 12.7 per cent and earnings per share NOK 2.40 in the third quarter of 2012. DNB is working to strengthen its capital adequacy ratio to close to 10 per cent by year-end 2012 through profit accumulation and efficient capital utilisation. Parallel to this, the Group is continuing its adaptations to the new liquidity and capital requirements which are expected to be introduced over the next few years. The common equity Tier 1 capital ratio, calculated according to the Basel II transiti-
1) Basis swaps are derivative contracts entered into by the bank when issuing senior bonds or raising other long-term funding in the international capital markets and converting the relevant currency to Norwegian kroner.
onal rules, increased to 10.0 per cent at end-September 2012, includ-ing 50 per cent of interim profits. Based on full implementation of Basel II and excluding the effects of the limitations ensuing from the transitional rules, the common equity Tier 1 capital ratio would have been 11.4 per cent. Under Basel III, based on the Group’s interpret-tation of the draft regulations and in accordance with amendments to IAS 19, the common equity Tier 1 capital ratio would have been 10.8 per cent at end-September 2012. The Board of Directors considers DNB to be well capitalised in relation to the risk of operations and well prepared to meet future capital adequacy requirements. DNB has entered into an agreement to sell the branch network in Poland. The sale is part of DNB’s new strategy in Poland, where the Group will primarily concentrate on corporate customer operations. The transaction is subject to the approval of the financial supervisory authority in Poland and must also be approved by a significant percentage of the Polish customers. The acquisition is scheduled to take place in the second quarter of 2013. It is expected that some 250 employees will be transferred to the new owner in connection with the transaction. During the third quarter, DNB also entered into an agreement to sell its wholly-owned Swedish subsidiary SalusAnsvar AB, whereby 140 full-time positions will be transferred to the new owner. The sale is subject to approval by the supervisory authorities. DNB’s group management team and some of the business areas’ operations were moved to the new head office in Bjørvika in Oslo at the end of September. The Group’s other employees in Oslo will move to Bjørvika by spring 2014 as and when the premises are completed. The move is expected to result in a streamlining of operations. First three quarters 2012 DNB recorded profits of NOK 9 847 million in the January through September period in 2012, an increase from NOK 8 890 million in the corresponding period of 2011. Adjusted for the effects of basis swaps, profits for the period increased by NOK 3 033 million or 37 per cent from the year-earlier period. There was a healthy trend in net interest income, which increased by 9 per cent from the first three quarters of 2011. Average lending volumes rose by 8.3 per cent, while lending spreads widened by 0.37 percentage points measured against the 3-month money market rate during the same period. Average deposit volumes rose 16.9 per cent, while deposit spreads contracted by 0.38 percentage points, primarily due to lower interest rate levels and stronger competition for deposits. Other operating income, adjusted for mark-to-market adjustments of basis swaps, was up 21.3 per cent from the first three quarters of 2011, which mainly reflected a high level of income from foreign exchange and interest rate instruments and a greater profit contribution from DNB Livsforsikring and associated companies. Operating expenses, excluding impairment losses for goodwill and intangible assets, rose by 5.3 per cent from the January through September period in 2011, reflecting an increase in pension expenses due to lower interest rate levels, growth in the largest Norwegian cities and a higher level of activity at certain international offices. At NOK 1 990 million, write-downs on loans and guarantees were NOK 529 million lower than in the first three quarters of 2011. There was a rise in write-downs in both Retail Banking and Large Corporates and International, while there was a significant reduction in write-downs in the Baltics and lower collective write-downs.

DNB third quarter report 2012 Unaudited 3
Return on equity was 10.9 per cent, up from 10.6 per cent in the January through September period in 2011. Earnings per share were NOK 6.05 and NOK 5.47 for the respective periods. Adjusted for changes in the value of basis swaps, return on equity was 12.4 per cent and earnings per share NOK 6.90 in the January through September period in 2012. DNB continued to climb on Ipsos MMI’s Norwegian corporate reputation list. This year, the Group achieved 23rd place, best among the banks. In addition, DNB improved its score from 66 to 70 in RepTrak’s quarterly reputation survey. DNB still qualified for inclusion in the Dow Jones Sustainability Index in 2012 and thus remains among the top 10 per cent companies within its industry group with respect to sustainability. Income statement for the third quarter of 2012 Net interest income 3rd quarter 3rd quarter Amounts in NOK million 2012 Change 2011
Net interest income 6 828 434 6 394
Lending and deposit volumes 376 Lending and deposit spreads 588 Exchange rate movements 74 Amortisation effects in the international bond portfolio (116) Long-term funding costs (373) Equity and non-interest bearing items (117) Other net interest income 1
Net interest income showed a healthy trend, rising by NOK 434 mil-lion or 6.8 per cent from the third quarter of 2011. Lending spreads widened while deposit spreads narrowed. Parallel to this, there was a significant rise in long-term funding costs compared with the third quarter of 2011.These costs have stopped rising and were relatively stable from the second to the third quarter of 2012. Average lending volumes increased by 6.9 per cent from the year-earlier period, though the growth in lending was waning. Deposits increased by 19.5 per cent during the corresponding period. A declining interest rate level resulted in lower interest income on equity. Net other operating income 3rd quarter 3rd quarter Amounts in NOK million 2012 Change 2011
Net other operating income 3 628 (75) 3 703
Net financial and risk result from DNB Livsforsikring 1) 1 039 Net other gains on foreign exchange and interest rate instruments 2) 589 Profits from associated companies 325 Net other commissions and fees (52) Net gains on investment property (89) Basis swaps (1 964) Other operating income 78
1) Guaranteed returns and allocations to policyholders deducted. 2) Excluding guarantees and basis swaps.
Net other operating income declined by NOK 75 million from the third quarter of 2011. Adjusted for the effect of basis swaps, there was a healthy level of other operating income for the quarter, increasing by NOK 1 889 million or 82 per cent from the third quarter of 2011. Due to the strong financial market trend, the contribution from DNB Livsforsikring was up NOK 1 039 million. In addition, there was a high level of income from foreign exchange and interest rate instruments, partly due to mark-to-market assessments. Profits from associated companies, primarily Eksportfinans, increased during the quarter. Operating expenses 3rd quarter 3rd quarter Amounts in NOK million 2012 Change 2011
Operating expenses 5 191 330 4 862
Costs for non-core operations 30 Non-recurring costs: Impairment losses for goodwill and intangible assets 85 Restructuring costs 44
Total adjusted operating expenses 5 025 171 4 854
Income-related costs: Operational leasing 29 Performance-based pay (28) Expenses related to operations: Cost programme (71) Wage and price inflation 160 IT expenses (52) Rise in pension expenses 96 Other costs 36
The Group's operating expenses were up 6.8 per cent from the third quarter of 2011. Adjusted for costs for non-core operations acquired by the Group and non-recurring costs, there was a NOK 171 million or 3.5 per cent rise in expenses compared with the third quarter of 2011. IT expenses were reduced by NOK 52 million from the year-earlier period, primarily due to the reversal of costs related to the Baltics. Pension expenses were up NOK 96 million, mainly due to the low interest rate levels. The cost programme remained a key tool for the implementation of cost efficiency measures. During 2011, the Group expanded its operations both in Norway and internationally, while the number of full-time positions was reduced through the second and third quarter of 2012. Overall, the number of full-time positions was reduced by 55 from end-September 2011. Write-downs on loans and guarantees Write-downs on loans and guarantees totalled NOK 521 million, down 55.5 per cent from NOK 1 170 million in the third quarter of 2011. There was also a reduction of NOK 164 million from the second quarter of 2012. At NOK 670 million, individual write-downs were relatively stable compared with the first and second quarter of 2012, but represented a lower share of average lending at 0.16 per cent in the third quarter. The level of write-downs was thus markedly lower than normalised losses. Individual write-downs in Retail Banking were reduced during the quarter, reflecting the strong Norwegian economy. There was also a decline in write-downs in most segments in Large Corporates and International, but an increase within shipping. Total write-downs in the Baltics and Poland were reduced from 5.18 per cent of lending in the third quarter of 2011 to 0.43 per cent in the third quarter of 2012. There were reversals on collective write-downs of NOK 148 mil-lion in the third quarter of 2012, compared with new collective write-

4 Unaudited DNB third quarter report 2012
downs of NOK 251 million in the year-earlier period. This mainly reflected improved portfolio quality. Net non-performing and doubtful commitments totalled NOK 19.6 billion at end-September 2012, an increase from NOK 14.5 billion at end-September 2011, and a slight increase from NOK 19.3 billion at end-June 2012. Net non-performing and doubtful commitments represented 1.47 per cent of lending volume, up 0.33 percentage points from end-September 2011 and 0.02 percentage points from end-June 2012. Taxes The DNB Group's tax charge for the third quarter of 2012 was NOK 1 256 million, down from NOK 1 604 million in the year-earlier period. Relative to pre-tax operating profits, the estimated tax charge was 26 per cent. The tax charge was reduced from approximately 39 per cent in the third quarter of 2011, but on a level with the tax charge in the second quarter of 2012. The main factor behind the high tax charge in the third quarter of 2011 was losses on equities in DNB Livsforsikring classified within the tax exemption method. The Norwegian government has previously presented draft legislation on changes in tax rules for life insurance companies, and in October, this was confirmed in the National Budget for 2013. With effect from 2012, life insurance companies will no longer be able to use the tax exemption method for returns on equities which are realised in the common portfolio. As these rules had not been approved on the balance sheet date, they did not affect the tax charge for the third quarter of 2012. An approved rule change will entail higher future tax charges for the DNB Group. There is still great uncertainty concerning the final rules, and the Group has to await new regulations to estimate the outcome of the new rules, including possible transitional effects. Business areas Activities in DNB are organised in the business areas Retail Banking, Large Corporates and International, DNB Markets and Insurance and Asset Management. The business areas operate as independent profit centres and have responsibility for serving all of the Group's customers and for the total range of products and services. In addition, operations in DNB Baltics and Poland are reported as a separate profit centre. Retail Banking Retail Banking is responsible for serving the Group's 2.1 million personal customers and some 220 000 corporate customers through the branch network in Norway. DNB aspires to be a local bank for the whole of Norway, while offering the expertise of a large bank. The aim is that coordinated service to these customer segments will make the services more accessible and give customers good personal financial advice. Pre-tax operating profits totalled NOK 2 442 million in the third quarter of 2012, an increase of NOK 658 million from the year-earlier period. There was strong growth in both lending and deposits during the period, parallel to a satisfactory trend in non-performing commit-ments and write-downs.
Income statement in NOK million 2012 2011 NOK mill % Net interest income 4 219 3 519 699 19.9Other operating income 1 047 997 50 5.0Income attributable to product suppliers 242 380 (138) (36.3)Net other operating income 1 289 1 377 (88) (6.4)Total income 5 507 4 896 611 12.5Other operating expenses 2 781 2 680 101 3.8Costs attributable to product suppliers 125 177 (52) (29.4)Total operating expenses 2 906 2 858 48 1.7Pre-tax operating profit before write-downs 2 601 2 038 563 27.6Net gains on fixed assets 0 0 0Net write-downs on loans 154 250 (97) (38.6)Profit from repossessed operations (5) 0 (5)Pre-tax operating profit 2 442 1 788 654 36.6
Average balance sheet items in NOK billionNet lending to customers 855.8 790.3 65.5 8.3Deposits from customers 459.4 411.3 48.1 11.7
Key figures in per cent
Lending spread 1) 2.04 1.46
Deposit spread 1) (0.12) 0.50
Return on risk-adjusted capital 2) 34.8 27.2Cost/income ratio 51.9 58.4Ratio of deposits to lending 53.7 52.0
Number of full-time positions, end of period 4 909 5 001 (92) (1.8)
1) Calculated relative to the 3-month money market rate.2) Calculated on the basis of internal measurement of risk-adjusted capital.
3rd quarter Change
There was continued brisk growth in home mortgages during the quarter. Average net lending increased by 8.3 per cent from the third quarter of 2011, parallel to brisk deposit growth at 11.7 per cent for the period. Along with customer deposits, covered bonds based on home mortgages in DNB Boligkreditt were key sources of funding. At end-September 2012, 94 per cent of lending volume in Retail Banking was funded by deposits and covered bonds. Rising volumes and widening lending spreads relative to the 3-month money market rate contributed to the rise in net interest income from the third quarter of 2011. Deposit spreads narrowed due to lower interest rate levels and strong competition in the market. The volume-weighted interest rate spread was 1.29 per cent in the third quarter of 2012, an increase from 1.13 per cent in the year-earlier period. Total other operating income was NOK 88 million lower than in the third quarter of 2011. Income from guarantee commissions, payment services and real estate broking showed a positive trend during the period, while there was a reduction in income from interest rate instruments. Operating expenses were NOK 48 million higher than in the third quarter of 2011, which was mainly due to impairment losses for goodwill in connection with the agreement to sell SalusAnsvar AB. The number of full-time positions was 4 909 at end-September 2012, a reduction of 92 positions from end-September 2011. There were 4 583 full-time positions in the business area's units in Norway at end-September 2012. The quality of the loan portfolio was sound, with relatively low write-downs in both the retail and corporate markets. On an annual basis, net write-downs on loans represented 0.07 per cent of net lending, down from 0.13 per cent in the third quarter of 2011. Net non-performing and doubtful commitments amounted to NOK 5 997 million at end-September 2012, down NOK 198 million from end-September 2011.

DNB third quarter report 2012 Unaudited 5
Nordlandsbanken was formally merged with DNB Bank ASA with effect from 1 October 2012, but will remain a separate brand in the Group for a transitional period of up to two years. DNB has entered into an agreement to sell the wholly-owned Swedish distribution company SalusAnsvar AB. The transaction is subject to approval by the supervisory authorities. DNB’s new insurance product for children and young adults, which can be bought online and includes an electronic medical history statement, was launched on 8 October. There will be continued focus on small companies in a start-up phase through the ”Start-up” financing concept. In spite of the financial market turmoil and the uncertain prospects for the global economy, the Norwegian mainland economy has shown a positive trend. Low interest rates combined with a marked increase in real income and a stable, low unemployment rate provide the basis for strong consumption growth. Retail Banking expects continued strong growth in home mortgages and more subdued growth in lending to small and medium-sized companies. The level of write-downs on loans to both personal and corporate customers is expected to remain low. Large Corporates and International Large Corporates and International serves the bank’s largest Norwe-gian corporate customers and is responsible for DNB’s international service concept. Operations are based on broad industry expertise and long-term customer relationships. Pre-tax operating profits came to NOK 1 946 million in the third quarter of 2012, up NOK 209 million from the third quarter of 2011.
Income statement in NOK million 2012 2011 NOK mill % Net interest income 2 308 2 052 256 12.5Other operating income 313 221 92 41.5Income attributable to product suppliers 530 579 (50) (8.6)Net other operating income 842 800 42 5.3Total income 3 150 2 852 298 10.4Other operating expenses 652 588 64 10.8Costs attributable to product suppliers 240 234 6 2.6Total operating expenses 892 822 70 8.5Pre-tax operating profit before write-downs 2 258 2 030 228 11.2Net gains on fixed assets 0 0 0Net write-downs on loans 250 233 17 7.5
Profit from repossessed operations (63) (60) (2)Pre-tax operating profit 1 946 1 737 209 12.0
Average balance sheet items in NOK billionNet lending to customers 399.5 371.2 28.3 7.6Deposits from customers 294.7 228.1 66.6 29.2
Key figures in per cent
Lending spread 1) 1.95 1.68
Deposit spread 1) (0.20) 0.01
Return on risk-adjusted capital 2) 21.4 22.8Cost/income ratio 28.3 28.8Ratio of deposits to lending 73.8 61.4
Number of full-time positions, end of period 1 144 1 138 6 0.5
1) Calculated relative to the 3-month money market rate.2) Calculated on the basis of internal measurement of risk-adjusted capital.
3rd quarter Change
Average lending increased by 7.6 per cent from the third quarter of 2011, while there was a 0.8 per cent reduction from the second quarter of 2012. Adjusted for exchange rate movements, there was a 4.0 per cent rise in lending from the third quarter of 2011.
Average deposits rose by 29.2 per cent from the third quarter of 2011. Adjusted for exchange rate movements, deposits increased by 26.2 per cent. There was a 2.2 per cent rise in deposits from the second quarter of 2012. Relative to the 3-month money market rate, lending spreads showed a positive trend, widening by 0.28 percentage points from the third quarter of 2011 and 0.08 percentage points from the second quarter of 2012. The widening spreads helped compensate for higher long-term funding costs. The strong competition for deposits caused pressure on deposit spreads, which declined by 0.21 percentage points from the third quarter of 2011 and by 0.04 percentage points from the second quarter of 2012. The rise in other operating income was mainly attributable to a positive development in the market value of equities and an increase in guarantee commissions. Personnel expenses were higher in the third quarter of 2012 than in the year-earlier period, mainly due to a rise in staff numbers in strategic priority areas in 2011. The cost level reflected restructuring costs at the Group’s international units and a non-recurring cost item related to health insurance for the employees at the New York office. Adjusted for these items, costs rose by 4.5 and 3.3 per cent, respectively, from the third quarter of 2011 and the second quarter of 2012. At end-September 2012, staff in the business area represented 1 144 full-time positions, including 655 positions outside Norway. Large Corporates and International has started the process to pare down costs in order to reach the targets presented on the Capital Markets Day, and the number of full-time positions declined from end-June 2012. There was a decline in write-downs on loans in most segments, though write-downs within shipping showed a certain increase. Net write-downs on loans represented 0.25 per cent of net lending to customers on an annual basis, while individual write-downs repre-sented 0.35 per cent. In the third quarter of 2011, net write-downs came to 0.25 per cent of net lending, of which individual write-downs represented 0.13 per cent. Net non-performing and doubtful commitments amounted to NOK 8 billion at end-September 2012, a slight increase from end-June 2012. The corresponding figure at end-September 2011 was NOK 1.4 billion. The quality of the loan portfolios remained sound and, on average, showed a positive trend from the preceding quarters. However, portfolio quality deteriorated somewhat in the dry bulk and tanker segments due to the weak market situation. Close follow-up of customers and good preventive measures have reduced the need for write-downs. DNB will give priority to strong, long-term and profitable customer relationships. Large Corporates and International aims to rebalance its portfolios by reducing its exposure somewhat within shipping and commercial real estate, while capitalising on the opportunities within sectors such as energy, offshore, telecom and healthcare. Average lending spreads are expected to increase somewhat, which is necessary to compensate for higher funding costs. It is anticipated that the strong competition for stable customer deposits and significant pressure on deposits spreads will continue. DNB Markets DNB Markets, Norway’s largest provider of securities and investment services, recorded a satisfactory level of profits in the third quarter of 2012. Pre-tax operating profits totalled NOK 1 285 million, up NOK 318 million or 32.9 per cent compared with the year-earlier period. The third quarter of 2012 saw a low level of customer activity in most markets, while narrower credit margins ensured considerable capital gains on bonds.
6 Unaudited DNB third quarter report 2012
Income statement in NOK million 2012 2011 NOK mill %
FX, interest rate and commodity derivatives 358 433 (75) (17.3)
Investment products 70 91 (21) (22.7)
Corporate finance 177 227 (50) (22.0)
Securities services 59 52 6 12.1Total customer revenues 664 803 (139) (17.3)Net income from international bond portfolio 714 (1) 715Other market making/trading revenues 413 608 (195) (32.1)Total trading revenues 1 126 607 520 85.7Interest income on allocated capital 36 44 (8) (18.2)Total income 1 826 1 454 373 25.6Operating expenses 541 486 55 11.3Pre-tax operating profit 1 285 967 318 32.9
Key figures in per cent
Return on risk-adjusted capital 1) 56.1 45.9Cost/income ratio 29.6 33.5
Number of full-time positions, end of period 721 693 28 4.1
1) Calculated on the basis of internal measurement of risk-adjusted capital.
3rd quarter Change
Customer-related revenues totalled NOK 664 million, down NOK 139 million from the third quarter of 2011. Due to the uncertain situation in Southern Europe and in the international economy in general, many investors adopted a waiting attitude. This resulted in a reduction in customer-related revenues, while income from arranging bond issues gave a strong income contribution in the third quarter of 2012. The decline in customer-related income from foreign exchange and interest rate and commodity derivatives reflected a lower level of activity within interest rate hedging as a large number of customers have already entered into hedging contracts. The level of income from foreign exchange was unchanged from the third quarter of 2011, while income from commodity hedging showed healthy growth. In consequence of lower income from equities brokerage, there was a reduction in customer-related income from the sale of securities and other investment products. A high level of activity within bond and commercial paper brokerage partly compensated for the reduction in income on equities. Customer-related revenues from corporate finance services declined from the third quarter of 2011 in spite of a very high level of activity in arranging ordinary and high-yield bond issues. However, there was fierce competition among arrangers of such transactions, whereby a greater number of players had to share lower margins. There were sluggish market conditions for initial public offerings and share issues, while there was an increase in merger and acquisition advisory services during the quarter. A corporate finance unit was established in Stockholm during the third quarter. Due to a high level of activity within both securities lending and securities services during the quarter, there was a rise in customer-related revenues from custodial and other securities services. Market making and other proprietary trading generated revenues of NOK 1 126 million, an increase of NOK 520 million from the year-earlier period. The continued normalisation of the financial markets had a positive effect on income for the quarter, resulting in a signifi-cant reduction in credit margins and in turn in capital gains on DNB Markets’ bond portfolios. The cost/income ratio was 29.6 per cent in the third quarter of 2012, down from 33.5 per cent a year earlier. Developments in the equity, credit, commodity, currency and interest rate markets will be decisive for the business area's future profits.
Insurance and Asset Management Insurance and Asset Management is responsible for life insurance, pension savings, asset management and non-life insurance in DNB. The business area recorded pre-tax operating profits of NOK 426 mil-lion, a NOK 1 115 million increase from the third quarter of 2011.
Income statement in NOK million 2012 2011 NOK mill % Total income 990 (114) 1 104Operating expenses 564 575 (11) (1.9)Pre-tax operating profit 426 (689) 1 115Tax (75) 519 (594)Profit 501 (1 208) 1 709
Balances in NOK billion (end of period)Assets under management 542.8 519.7 23.1 4.5
Key figures in per cent
Return on risk-adjusted capital 1) 16.7 (27.1)Cost/income ratio 56.9
Number of full-time positions, end of period 1 035 1 067 (32) (3.0)
1) Calculated on the basis of internal measurement of risk-adjusted capital.
3rd quarter Change
DNB Livsforsikring’s pre-tax operating profits came to NOK 348 mil-lion in the third quarter of 2012, which represented a NOK 1 104 mil-lion increase from the third quarter of 2011.
DNB Livsforsikring
Income statement in NOK million 2012 2011 NOK mill % Interest result 930 (3 954) 4 884Risk result (26) 202 (228)
- Of which provisions for higher life expectancy 1) 100 33 67
Administration result 2 (8) 10Upfront pricing of risk and guaranteed rate of return 146 132 14Other (6) (6) 0Provisions for higher life expectancy and
proposed allocations to policyholders 699 (2 877) 3 576Pre-tax profit 348 (756) 1 104Tax charge (105) 508 (613)Profit 453 (1 264) 1 717
Balances in NOK billion (end of period)Total assets 270.5 255.7 14.9 5.8Assets under management 246.6 234.2 12.4 5.3 - individual customers 60.8 62.3 (1.5) (2.4) - corporate customers 148.1 136.4 11.7 8.6 - public sector 37.6 35.4 2.2 6.3
Key figures in per cent
Return on risk-adjusted capital 2) 15.8 (30.2)Recorded return on assets 1.2 (1.6)Value-adjusted return on assets 1.6 (1.7)
Number of full-time positions, end of period 703 740 (37) (5.0)
1) Increase in premium reserves for individual pensions.2) Calculated on the basis of internal measurement of risk-adjusted capital.
3rd quarter Change
The positive financial market trend in the third quarter ensured healthy returns on DNB Livsforsikring’s portfolios. However, market developments remain highly uncertain, and the company reduced the equity exposure in the common portfolio during the quarter. The recorded return was higher than the guaranteed rate of return in all portfolios. DNB Livsforsikring's common portfolio represents a

DNB third quarter report 2012 Unaudited 7
sound base, with more than half of the funds invested in property and bonds held to maturity generating annual returns of approximately 5 per cent. These investments contribute to stabilising returns. The property portfolio gave a direct return of 1.3 per cent in the third quarter of 2012, while the corporate portfolio generated a return of 0.9 per cent. Total assets as at 30 September 2012 were NOK 271 billion, an increase of 4.5 per cent since year-end 2011. Recorded policy-holders’ funds within defined-contribution pension schemes totalled NOK 19.0 billion, an increase of 28.1 per cent from end-December 2011. Premium income totalled NOK 4.8 billion, down 21.1 per cent compared with the third quarter of 2011. DNB Livsforsikring reported a net outflow of transfers of NOK 288 million, compared with a net inflow of NOK 261 million in the third quarter of 2011. There was a negative risk result of NOK 26 million, compared with a positive result of NOK 202 million in the year-earlier period. Provisions for higher life expectancy of NOK 100 million were made, relating to individual annuity and pension insurance and group association insurance, of which NOK 35 million was charged to the owner. The company’s solvency capital increased by NOK 7.4 billion from 31 December 2011, totalling NOK 32.7 billion at end-September 2012. The capital adequacy ratio was 14.7 per cent, well above the 8 per cent requirement. DNB Livsforsikring's market share of total policyholders' funds was 28.3 per cent at end-June 2012, down 1.4 percentage points from end-June 2011. DNB Livsforsikring has continued to rebalance its portfolio by reducing its equity and property exposure, aiming to ensure lower risk and more stable returns. If the low interest rate level persists, it will represent a challenge for the life insurance industry, as it may affect the companies’ ability to make contractual future pension payments. As part of the upward adjustment of life expectancy assumptions, an increase of NOK 663 million in provisions for group pension insurance was proposed for the third quarter, while total provisions of NOK 2 394 million have been proposed for the January through September period of 2012. In addition, provisions for individual pensions were increased by NOK 100 million in the third quarter and by NOK 301 million for the first nine months of the year. The provi-sions, which are financed through the interest and risk result, are preliminary and may be reversed if returns decline. The provisions will be finally determined at year-end. It has been estimated that provisions representing approximately 5 per cent of the premium reserve will be required over the next few years to strengthen the premium reserve within group pension schemes to reflect higher life expectancy. The company expects to be able to finance the increase through its future interest and risk result, though the duration of the escalation period and the possible contri-bution from equity remain to be clarified. The industry is awaiting a clarification from the authorities regarding these matters. The life insurance industry is facing major changes in the regulatory framework, including higher capital requirements in consequence of Solvency II, the introduction of a new occupational pension product and changes in taxation rules for life insurance companies. The Solvency II rules are yet to be finalised, especially with respect to their implementation in Norwegian legislation. The Banking Law Commission is in the process of preparing new rules for defined benefit occupational pensions, aiming for harmonisation with the rules governing retirement pensions in the new National Insurance Scheme. In the National Budget for 2013, the government has proposed more restrictive use of the tax exemption method for equities etc. held by life insurance and pension companies in line with the proposal presented earlier. See further description in the chapters on tax and the new regulatory framework.
DNB Asset Management recorded pre-tax operating profits of NOK 51 million in the third quarter of 2012, up NOK 15 million from the year-earlier period. The rise in profits mainly reflected higher performance-based commission income.
DNB Asset Management
Income statement in NOK million 2012 2011 NOK mill %
Net interest income (6) (6) 0
Commission income- from retail customers 64 79 (14) (18.2)
- from institutional clients 135 107 28 25.8
Other operating income 4 5 (1) (23.5)
Total income 197 184 12 6.6
Operating expenses 146 149 (3) (1.8)
Pre-tax operating profit 51 36 15 41.3
Balances in NOK billion (end of period)Asset under management 493.1 467.5 25.5 5.5 - retail customers 35.1 36.0 (0.9) (2.5) - institutional clients 458.0 431.5 26.4 6.1
Key figures in per cent
Return on risk-adjusted capital 1) 25.1 19.1Cost/income ratio 74.2 80.5
Number of full-time positions, end of period 208 216 (8) (3.6)
1) Calculated on the basis of internal measurement of risk-adjusted capital.
3rd quarter Change
Commission income increased by a total of NOK 13 million from the third quarter of 2011. There was a NOK 17 million rise in performance-based income. Market developments over the past 12-month period gave a NOK 37 billion rise in assets under management, and exchange rate movements caused a NOK 4 billion increase. Developments in net sales resulted in a NOK 15 billion reduction in assets under management. DNB Asset Management is one of Norway's leading providers of mutual funds and discretionary asset management and has a market share of 21.5 per cent of the total mutual fund market in Norway. At end-September 2012, the company had approximately 243 000 mutual fund savings schemes in the Norwegian market, with annual subscriptions of around NOK 2.5 billion. 31 per cent of DNB's mutual funds had received four or five stars from the rating company Morningstar at end-September 2012. Four of the funds had achieved the highest ranking, with five stars. DNB Asset Management expects an increase in private financial savings in both Norway and Sweden. Competition for savings will necessitate the continued development and adaptation of products and services. The expectations of investors regarding developments in financial markets, together with investor confidence in the stock market, will strongly influence the area’s profit performance.
DNB Skadeforsikring offers non-life insurance products such as home insurance, car insurance and travel insurance, primarily to the Norwegian retail customer market. Products are sold mainly through the bank's distribution network, and special initiatives in the large cities have produced good results. DNB Skadeforsikring is still in an expansion phase, and total premium income and the number of policyholders showed a strong trend in the third quarter of 2012. The company showed a very positive profit trend during the quarter, recording pre-tax operating profits of NOK 55 million, which was an increase of NOK 57 million from the year-earlier period.
DNB Skadeforsikring

8 Unaudited DNB third quarter report 2012
DNB Baltics and Poland DNB Baltics and Poland offers financial services to corporate and personal customers in Estonia, Latvia and Lithuania. The strategy in Poland has been changed, whereby future operations will focus on the corporate market within the DNB Group’s international priority areas. An agreement has been entered into on the sale of the branch network in Poland, including the appurtenant customer relationships with personal customers and small and medium-sized companies. The sale is subject to approval by the authorities and must also be approved by a significant percentage of the Polish customers. DNB Baltics and Poland achieved pre-tax operating profits of NOK 78 million in the third quarter of 2012, representing an increase of NOK 559 million from the year-earlier period.
Income statement in NOK million 2012 2011 NOK mill % Net interest income 251 335 (84) (25.1)Other operating income 227 172 55 32.0Total income 478 507 (29) (5.8)Operating expenses 342 294 48 16.3Pre-tax operating profit before write-downs 136 213 (77) (36.1)Net gains on fixed assets (1) 5 (6) (118.8)Net write-downs on loans 57 700 (643) (91.8)Pre-tax operating profit 78 (481) 559 (116.3)
Average balance sheet items in NOK billionNet lending to customers 52.8 53.7 (1.0) (1.8)Deposits from customers 29.1 22.7 6.5 28.5
Key figures in per cent
Lending spread 1) 1.97 1.80
Deposit spread 1) 0.31 1.10
Return on risk-adjusted capital 2) 6.9 (42.6)Cost/income ratio 71.5 57.9Ratio of deposits to lending 55.2 42.2
Number of full-time positions, end of period 3 203 3 234 (31) (1.0)
1) Calculated relative to the 3-month money market rate.2) Calculated on the basis of internal measurement of risk-adjusted capital.
3rd quarter Change
The macroeconomic situation in the Baltic region is gradually improving. However, credit demand remained low during the third quarter, and there was a continued decline in DNB’s lending volumes in the Baltics. Operations in Poland reflected DNB’s change of strategy in this country. Average lending was reduced by 1.8 per cent from the third quarter of 2011. In spite of a 4.3 per cent decline in lending in the Baltics from year-end 2011, there was a rise in market share during the period. DNB Poland experienced a relatively strong increase in lending throughout 2011. However, the change of strategy has put a strong damper on lending growth, and there was a 3.8 per cent decline in lending from the second to the third quarter of 2012. Average customer deposits showed a healthy trend and rose by 28.5 per cent from the year-earlier period. This demonstrates that customers in this region had faith in DNB Baltics and Poland as part of a sound Norwegian bank. The reduction in net interest income from the third quarter of 2011 reflected a combination of rising funding costs, lower lending volumes and pressure on deposit spreads. There was a positive trend in lending spreads, measured against the 3-month money market rate, while deposit spreads narrowed, partly due to strong competition for deposits. There was a further reduction in net write-downs on loans in the third quarter of 2012, and write-downs represented 0.43 per cent of average lending on an annual basis, down from 0.74 per cent in the
second quarter of 2012. In the third quarter of 2011, write-downs represented 5.2 per cent of average lending. Efforts to improve portfolio quality and cost efficiency will be high on the agenda. Write-downs on loans are expected to be significantly lower than in 2011. In the longer term, growth in the Baltics is expected to surpass average European levels. DNB will work to improve operations and widen the product range in the region. Operations in Poland will be adapted to the amended strategy, concentrating on the corporate segment. Improved operations combined with lower write-down levels are expected to ensure improved profitability. Funding, liquidity and balance sheet The Group had ample access to the short-term funding markets throughout the third quarter. The level of market uncertainty was gradually reduced, and investors showed a greater interest in funding with longer maturities than before. There was an increase in the number of banks to which investors were willing to lend money, though the markets remained selective. Banks with strong credit ratings had the best access to funding, and DNB was one of these banks. The long-term funding markets were functioning almost as normal during the third quarter. There was a significant reduction in funding costs for both new covered bonds and senior bond debt. This reflected the need of investors to invest money while banks have less need for new funding in the short and medium term. In addition, measures launched by the European Central Bank, ECB, to purchase European sovereign debt had positive effects on the market. This resulted in less uncertainty, and the price level for new long-term funding was reduced, especially for financially strong banks. In spite of this, the Group’s funding costs were much higher than prior to the financial crisis. Experience shows that market conditions can change quickly, and highly volatile funding costs and varying access to capital must still be expected. Conservative limits have been set for the refinancing of the Group’s short-term funding. The Group stayed well within these limits during the third quarter of 2012. In order to keep the Group’s long-term liquidity risk at a low level, the majority of loans should be financed through stable sources, such as customer deposits, long-term securities, subordinated loan capital and equity. At end-September 2012, such financing represented 113.9 per cent of customer lending. At end-September 2012, total combined assets in the DNB Group were NOK 2 639 billion, an increase of NOK 194 billion or 7.9 per cent from a year earlier. Total assets in the Group’s balance sheet were NOK 2 369 billion as at 30 September 2012 and NOK 2 183 billion a year earlier. Total assets in DNB Livsforsikring were NOK 271 billion and NOK 256 billion, respectively, on the same dates. Measured in Norwegian kroner, net lending to customers increased by NOK 60 billion or 4.8 per cent from end-September 2011. Customer deposits increased by NOK 91 billion or 12 per cent during the same period. The Group's ratio of deposits to lending to customers increased from 60.3 per cent at end-September 2011 to 64.5 per cent. The ratio of deposits to lending in DNB Bank ASA rose from 104.6 per cent to 115.8 per cent during the same period. The average remaining term to maturity for the portfolio of senior bond debt and covered bonds was 4.6 years at end-September 2012, compared with 4.4 years a year earlier.

DNB third quarter report 2012 Unaudited 9
Risk and capital adequacy Various factors affected the risk picture in the third quarter. On the positive side, capital markets normalised, which implied lower credit risk premiums and reduced additional costs related to currency swap agreements, as well as generally better access for banks to short and long-term funding. On the negative side, growth forecasts for the global economy were once again adjusted downwards. Developments in both Europe and the US entail a high level of risk. The DNB Group quantifies risk by measuring risk-adjusted capital requirements, which declined by NOK 2.2 billion in the third quarter of 2012, to NOK 74.9 billion. The table below shows developments in the risk-adjusted capital requirement 2
).
30 Sept. 30 June 31 Dec. 30 Sept. Amounts in NOK billion 2012 2012 2011 2011
Credit risk 59.5 62.0 64.5 68.0 Market risk 6.0 5.7 5.3 6.2 Market risk in life insurance 9.1 10.9 10.6 13.7 Insurance risk in life insurance 1.0 1.0 1.0 1.0 Non-life insurance 0.8 0.7 0.8 0.9 Operational risk 9.8 9.0 9.0 9.0 Business risk 4.6 4.4 4.7 4.7
Gross risk-adjusted capital requirement 90.8 93.7 95.9 103.5 Diversification effect 1) (16.0) (16.5) (16.1) (17.1)
Net risk-adjusted capital requirement 74.9 77.1 79.8 86.4 Diversification effect in per cent of gross risk-adjusted capital requirement 1) 17.6 17.6 16.8 16.5
1) The diversification effect refers to the effect achieved by the Group in
reducing risk by operating within several risk categories where unexpected losses are unlikely to occur at the same time.
The risk-adjusted capital requirement for credit declined by NOK 2.5 billion in the third quarter of 2012, reflecting a reduction in volumes within Large Corporates and International, partly due to the strength-ening of the NOK rate relative to the US dollar and the euro. Overall, there was stable, sound credit quality. There was a certain improve-ment in the Baltics, while there was a weaker trend in the shipping sector. Other parts of the portfolio showed a positive trend. Tanker and dry bulk rates remained at record-low levels. For a number of segments, the rates did not cover running operating expenses. Even though the number of new ships on order is declining, the market situation for the tanker, dry bulk and container segments will probably worsen in the short term. In the Norwegian commercial property market, there was a positive development in rental prices in central areas due to strong employment growth. Nevertheless, property values showed a weak trend. Market risk in life insurance declined by NOK 1.8 billion during the
2) In the third quarter of 2012, significant changes were made in the calculation method for risk-adjusted capital for credit. The diversification effects were reduced, while the probability of default was adjusted upwards for some portfolios to ensure greater consistency between external capital adequacy calculations and internal risk measurement. In addition, risk-adjusted capital calculations for non-performing and doubtful commitments were introduced. These changes have thus far not been reflected in the allocation of capital to the business areas or in risk-adjusted profitability measurement. The changes will affect these calculations as from 1 January 2013. With respect to operational risk, the Group no longer uses an internal quality index to modify the risk-adjusted capital requirement. Figures for previous periods have been adjusted correspondingly.
third quarter, reflecting a lower equity exposure and an increase in the market value adjustment reserve. Total equity exposure, adjusted for hedging instruments, was 6.8 per cent at end-September. Interest rate levels declined during the quarter, which ensured higher short-term returns. In the longer term, however, this will make it even more challenging to meet the guaranteed rate of return for policyholders. Moreover, falling interest rate levels will require additional capital in order to meet the forthcoming new solvency requirements. See further description in the chapter on the new regulatory framework. Market risk in operations other than life insurance remained relatively stable. There were no significant changes in market risk limits during the quarter. Due to the normalisation of credit spreads and margins on currency swaps, the bank recorded gains on its portfolio of fixed-income securities carried at fair market value, while there was an opposite effect on basis swaps. The capital requirement for operational risk increased by NOK 0.8 billion from the second quarter of 2012. ICT crime, and Internet banking fraud in particular, is an increasing problem meaning that the bank must devote greater resources to ensuring that it is protected against such attacks. In addition, other business disruptions in the Group’s IT systems affected customers during the third quarter. Extensive resources have been mobilised in order to reduce the probability that customers will be negatively affected in the future. Risk-weighted volume included in the calculation of the formal capital adequacy requirement declined by NOK 24 billion during the quarter, to NOK 1 092 billion. In 2012, risk-weighted volume cannot be less than 80 per cent of the corresponding figure calculated according to the Basel I regulations. Including 50 per cent of interim profits, the common equity Tier 1 capital ratio was 10 per cent, while the capital adequacy ratio was 12.2 per cent. Calculations have also been made of full future implementation of the Basel II rules on all of the banking group’s credit portfolios, excluding those in DNB Baltics and Poland, disregarding the limi-tations ensuing from the transitional rules. The calculations showed a pro forma risk-weighted volume of NOK 957 billion and a potential common equity Tier 1 capital ratio of 11.4 per cent. Under Basel III, based on the Group’s interpretation of the draft regulations and in accordance with amendments to IAS 19, the common equity Tier 1 capital ratio would have been 10.8 per cent at end-September 2012. Macroeconomic developments Norway’s major trading partners have experienced sluggish economic growth thus far in 2012. There are high and rising unemployment levels in most European countries. A number of countries are struggling with high sovereign debt levels and budget deficits. Parallel to this, the required fiscal policy tightening will contribute to lower future growth, which will make it more difficult to find a way out of the sovereign debt crisis. Thus, the weak growth in Europe could prevail for several years ahead. Economic growth has slowed in China, India and other emerging economies, which puts a further damper on growth in the rest of the world. In order to stimulate growth, key policy rates in a number of countries are being kept close to zero. Central banks have also used so-called quantitative easing to stimulate their economies. This policy includes increasing central bank funding of banks as well as central banks’ purchases of bonds to keep the long-term interest rate level down. In consequence of the international economic downturn, the prices of many commodities and semi-manufactured goods which are important for traditional Norwegian exports, have shown a weak trend. The price of crude oil is an important exception which, after a fall, picked up during the summer. Along with new oil and gas discoveries, these developments have ensured a high level of optimism in the Norwegian petroleum industry. The industry was a key driving force underlying the Norwegian economic upturn through
10 Unaudited DNB third quarter report 2012
2011 and 2012. The Norwegian economy will thus probably receive further stimuli from a rise in petroleum activity over the coming period. This will also affect much other economic activity in Norway and will probably contribute to low unemployment levels and a significant increase in household demand. Norwegian industries exposed to competition, which do not receive positive impulses from the petroleum sector and have to compete in weak international markets, are experiencing stagnation, and some are experiencing a fall in production and employment levels. A strong Norwegian krone rate and a squeezed labour market also make the situation difficult for these companies. Housing prices have continued to show a clear upward trend. High population growth, a moderate number of new residential properties, higher employment levels, a stable, low unemployment rate, strong wage growth and prospects of continuing low interest rate levels point towards a further increase in housing prices and reduce the risk of a short-term fall in prices. Relatively high housing prices and stricter equity requirements introduced by Finanstilsynet (the Financial Supervisory Authority of Norway) could put a damper on price growth. According to DNB’s model for housing market developments, housing prices are not unnaturally high in a longer-term perspective in light of the basic factors which influence the housing market. New regulatory framework The Basel III regulatory framework, which introduces stricter capital adequacy and liquidity requirements, will be implemented in the EU/EEA in the form of a new capital requirements directive, CRD IV. There were plans to introduce the directive on 1 January 2013. Due to the pace of the political negotiations, however, the introduction will probably be postponed until spring 2013. The Norwegian Ministry of Finance has prepared draft legislation and a consultation paper for implementing CRD IV in Norway and aims to approve changes in regulations in 2013. In 2011, the European Banking Authority, EBA, prepared a plan for further recapitalisation of banks. Several EU countries, including Sweden, have chosen to use the Internal Ratings Based, IRB, approach from the Basel II framework as a calculation base for this requirement. The Norwegian supervisory authorities, on the other hand, require that risk-weighted volume must represent minimum 80 per cent of risk-weighted volume measured according to standard risk weights under the Basel I rules. Thus, Norwegian financial institutions will be subject to a higher capital requirement than corresponding institutions in the Nordic region and the rest of Europe, which use the IRB approach. The Nordic supervisory authorities have been invited by the Nordic Ministers of Finance to look into the possibility of arriving at a common understanding of the forthcoming liquidity and capital requirements and similar practices. DNB supports this process and believes it is vital that equal framework conditions are established in the market, both in the Nordic region and in the rest of Europe. For several years, the value of the Norwegian Banks' Guarantee Fund has exceeded the minimum requirement in the Guarantee Schemes Act. Thus, no ordinary levies have been collected from the banks during this period. The Ministry of Finance wishes to strengthen the Guarantee Fund’s ability to handle banks’ potential future problems and thus aims to present draft legislation proposing to remove the maximum limit on the Fund’s capital. If this proposal is approved, the banks will subsequently have to pay an annual levy to the Guarantee Fund independent of the Fund’s size. New solvency capital requirements for insurance companies, Solvency II, will be introduced over the coming years. As yet, there is no precise phase-in plan. There has been strong opposition against the proposed regulations throughout the European insurance industry, and it has been signalled that this will be taken into account
in the further process. DNB and the Norwegian life insurance industry are in dialogue with the Norwegian authorities to find good solutions in accordance with the new regulations. Higher life expectancy will result in rising pension costs for employers and greater risk for pension companies. Finanstilsynet has indicated that the required increase in insurance reserves must be made in 2012 and 2013. This is challenging, considering that the commitments are as much as 40 years ahead in time. New premium rates which reflect an increase in life expectancy are not expected to affect premiums written on new pension entitlements until 2014. The industry is in dialogue with the authorities to clarify, among other things, the duration of the escalation period. The Norwegian government has previously presented draft legislation on changes in tax rules for life insurance companies, and in October, this was confirmed in the National Budget proposal for 2013. According to the proposal, life insurance companies will no longer be able to use the tax exemption method for returns on equities which are realised in the common portfolio. As these rules had not been approved on the balance sheet date, they did not affect the tax charge for the third quarter of 2012. The changes may entail higher future tax charges for the DNB Group. There is still great uncertainty concerning the final rules, and the Group has to await new regulations to estimate the outcome of the new rules, including possible transitional effects. Up until the new regulations are introduced, DNB will seek to gradually adapt to the expected new rules. Future prospects DNB presented updated financial targets at its Capital Markets Day event in September. The targets for the 2012-2015 period are annual growth in net interest income above 6 per cent and maximum 2 per cent annual cost growth, including restructuring costs. In 2015, return on equity should be above 12 per cent, while the common equity Tier 1 capital ratio according to Basel III should be 12.0–12.5 per cent. The targets have been adjusted downwards somewhat compared with previous targets, mainly due to expectations of lower interest rate levels and a higher tax charge than previously assumed, as well as stricter capitalisation requirements from the authorities. There are a number of key factors which make DNB believe that these targets are attainable. In spite of a weak international economic trend, the Norwegian economy is expected to remain strong. Coupled with strict cost control, this will provide the basis for a healthy profit trend in the Group’s Norwegian operations. During the period up to 2015, Large Corporates and International will rebalance its large corporate portfolio by reducing its exposure within shipping and commercial real estate and increasing its initiatives within sectors such as energy, offshore and telecommunications. In addition, DNB will implement other measures to reduce the exposure to capital-intensive operations while focusing on operations which increase less capital-intensive income. In the Retail Banking business area, rising lending volumes, slightly widening lending spreads, pressure on deposit spreads and a continued low level of write-downs on loans are expected. The Large Corporates and International business area will rebalance its portfolios. Wider lending spreads and pressure on deposit spreads are expected. With the exception of the shipping segment, a continued low level of write-downs on loans is anticipated. A high level of financial market volatility will have a positive impact on income in DNB Markets. On the other hand, prevailing price pressure and a lower level of activity, especially in the stock market, will negatively affect income. In the Insurance and Asset Management business area, lower risk and a reduced equity exposure are expected to ensure more predictable profit levels. Cost-efficiency measures will help boost profits, and the focus on capital-efficient products will strengthen capital adequacy. A stricter regulatory

DNB third quarter report 2012 Unaudited 11
framework for the life insurance industry could have a negative impact on earnings. Operations in the Baltics are expected to show further improvement and to record lower write-downs, leading to a positive profit trend.
DNB will adhere to its customer-oriented strategy, which forms the basis for the Group’s operations and will retain its profit estimate for 2012, with write-downs on loans and guarantees roughly on a level with 2011 and a cost/income ratio below 46 per cent.
Oslo, 24 October 2012 The Board of Directors of DNB ASA Anne Carine Tanum Tore Olaf Rimmereid (chairman) (vice-chairman) Jarle Bergo Bente Brevik Sverre Finstad Carl A. Løvvik Vigdis Mathisen Berit Svendsen Rune Bjerke (group chief executive)

12 Unaudited DNB third quarter report 2012
Income statement DNB Group
3rd quarter 3rd quarter January-September Full year Amounts in NOK million Note 2012 2011 2012 2011 2011 Total interest income 5 15 926 15 424 48 066 44 078 60 075 Total interest expenses 5 9 098 9 030 27 951 25 618 34 823 Net interest income 5 6 828 6 394 20 115 18 460 25 252 Commissions and fees receivable etc. 6 2 285 2 368 6 936 7 048 9 135 Commissions and fees payable etc. 6 587 580 1 774 1 664 2 256 Net gains on financial instruments at fair value 7 906 2 250 2 547 4 263 7 661 Net gains on assets in DNB Livsforsikring 4 286 (5 266) 10 789 1 565 5 834 Guaranteed returns and allocations to policyholders in DNB Livsforsikring 4 077 (4 208) 10 070 1 648 5 772 Premium income etc. included in the risk result in DNB Livsforsikring 1 586 1 213 3 907 3 650 4 941 Insurance claims etc. included in the risk result in DNB Livsforsikring 1 617 1 017 4 051 3 606 4 853 Premium income, DNB Skadeforsikring 313 292 926 805 1 094 Insurance claims etc., DNB Skadeforsikring 207 218 679 624 849 Profit from companies accounted for by the equity method 8 246 (79) 612 (34) 77 Net gains on investment property 16 4 93 (324) 100 (32) Other income 9 492 439 1 623 1 300 1 775 Net other operating income 3 628 3 703 10 439 11 154 16 754 Total income 10 456 10 097 30 554 29 614 42 006 Salaries and other personnel expenses 10, 11 2 867 2 603 8 425 7 661 10 279 Other expenses 10 1 779 1 819 5 552 5 623 7 722 Depreciation and write-downs of fixed and intangible assets 10 545 439 1 469 1 302 2 172 Total operating expenses 10 5 191 4 862 15 445 14 587 20 172 Net gains on fixed and intangible assets 20 6 63 20 19 Write-downs on loans and guarantees 12 521 1 170 1 990 2 519 3 445 Pre-tax operating profit 4 763 4 072 13 182 12 529 18 407 Taxes 1 256 1 604 3 427 3 633 5 423 Profit from operations held for sale, after taxes 0 25 92 (5) (5) Profit for the period 3 507 2 493 9 847 8 890 12 979
Earnings/diluted earnings per share (NOK) 2.15 1.53 6.05 5.47 7.98Earnings per share excluding operations held for sale (NOK) 2.15 1.52 6.00 5.47 7.99
Comprehensive income statement
DNB Group 3rd quarter 3rd quarter January-September Full year
Amounts in NOK million 2012 2011 2012 2011 2011 Profit for the period 3 507 2 493 9 847 8 890 12 979 Exchange differences arising from the translation of foreign operations (55) 130 (106) (118) (53) Comprehensive income for the period 3 452 2 623 9 741 8 772 12 926

DNB third quarter report 2012 Unaudited 13
Balance sheet DNB Group
30 Sept. 31 Dec. 30 Sept. Amounts in NOK million Note 2012 2011 2011
AssetsCash and deposits with central banks 367 409 224 581 276 593 Lending to and deposits with credit institutions 42 424 28 754 56 432 Lending to customers 13, 14 1 307 047 1 279 259 1 247 477 Commercial paper and bonds at fair value 198 774 177 980 157 164 Shareholdings 47 884 53 012 72 069 Financial assets, customers bearing the risk 27 600 23 776 22 712 Financial derivatives 101 302 96 693 110 664 Commercial paper and bonds, held to maturity 15 190 312 166 965 165 849 Investment property 16 45 060 42 796 42 802 Investments in associated companies 2 795 2 189 2 050 Intangible assets 17 7 035 7 003 7 151 Deferred tax assets 631 643 505 Fixed assets 6 966 6 336 6 010 Assets held for sale 15 1 054 1 206 Other assets 23 871 15 055 14 417 Total assets 2 369 123 2 126 098 2 183 100
Liabilities and equityLoans and deposits from credit institutions 293 530 279 553 356 347 Deposits from customers 843 340 740 036 752 660 Financial derivatives 66 207 64 365 75 908 Debt securities issued 18 727 925 635 157 596 266 Insurance liabilities, customers bearing the risk 27 600 23 776 22 712 Liabilities to life insurance policyholders in DNB Livsforsikring 220 574 212 271 209 889 Insurance liabilities, DNB Skadeforsikring 1 914 1 589 1 644 Payable taxes 3 267 634 3 729 Deferred taxes 3 860 4 897 205 Other liabilities 26 849 17 550 19 188 Liabilities held for sale 0 383 360 Provisions 662 787 560 Pension commitments 3 133 3 123 3 360 Subordinated loan capital 18 25 799 24 163 26 495 Total liabilities 2 244 659 2 008 284 2 069 325
Share capital 16 288 16 260 16 273 Share premium reserve 22 609 22 609 22 609 Other equity 85 567 78 946 74 894 Total equity 124 464 117 815 113 776 Total liabilities and equity 2 369 123 2 126 098 2 183 100
Off-balance sheet transactions, contingenciesand post-balance sheet events 22
14 Unaudited DNB third quarter report 2012
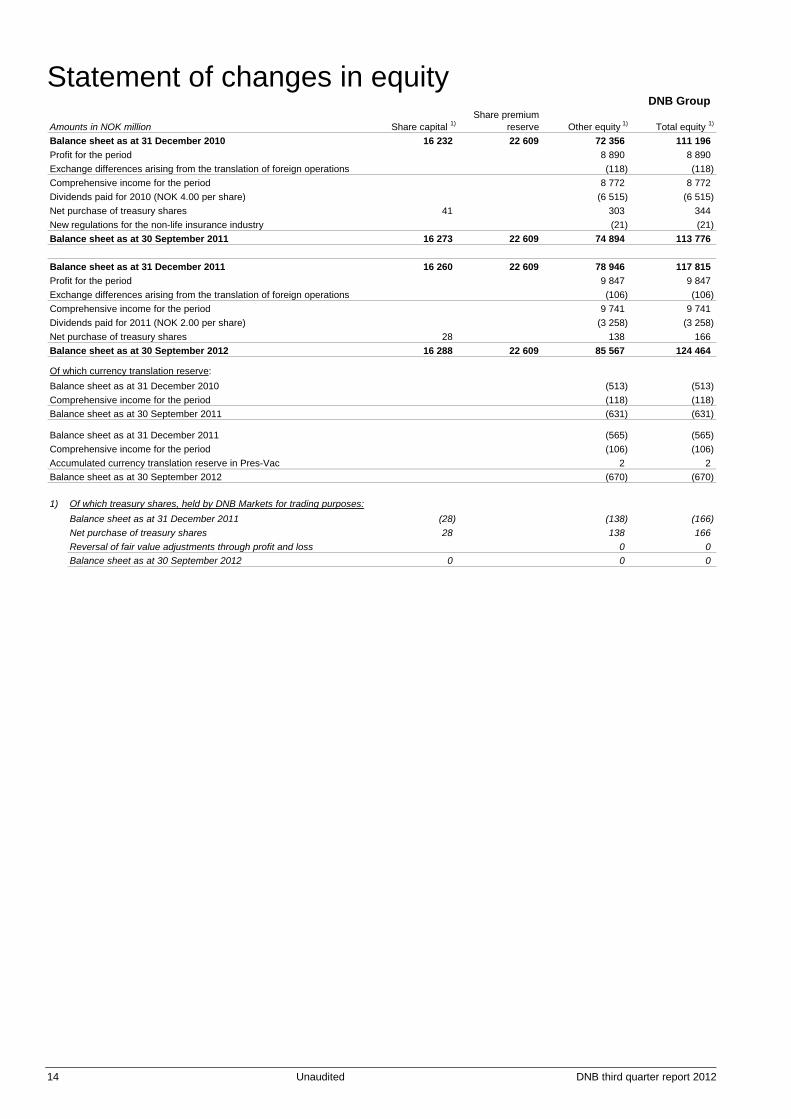
Statement of changes in equity DNB Group
Share premium Amounts in NOK million Share capital 1) reserve Other equity 1) Total equity 1)
Balance sheet as at 31 December 2010 16 232 22 609 72 356 111 196 Profit for the period 8 890 8 890 Exchange differences arising from the translation of foreign operations (118) (118) Comprehensive income for the period 8 772 8 772 Dividends paid for 2010 (NOK 4.00 per share) (6 515) (6 515) Net purchase of treasury shares 41 303 344 New regulations for the non-life insurance industry (21) (21) Balance sheet as at 30 September 2011 16 273 22 609 74 894 113 776
Balance sheet as at 31 December 2011 16 260 22 609 78 946 117 815 Profit for the period 9 847 9 847 Exchange differences arising from the translation of foreign operations (106) (106) Comprehensive income for the period 9 741 9 741 Dividends paid for 2011 (NOK 2.00 per share) (3 258) (3 258) Net purchase of treasury shares 28 138 166 Balance sheet as at 30 September 2012 16 288 22 609 85 567 124 464
Of which currency translation reserve:Balance sheet as at 31 December 2010 (513) (513) Comprehensive income for the period (118) (118) Balance sheet as at 30 September 2011 (631) (631)
Balance sheet as at 31 December 2011 (565) (565) Comprehensive income for the period (106) (106) Accumulated currency translation reserve in Pres-Vac 2 2 Balance sheet as at 30 September 2012 (670) (670)
1) Of which treasury shares, held by DNB Markets for trading purposes:Balance sheet as at 31 December 2011 (28) (138) (166) Net purchase of treasury shares 28 138 166 Reversal of fair value adjustments through profit and loss 0 0 Balance sheet as at 30 September 2012 0 0 0

DNB third quarter report 2012 Unaudited 15
Cash flow statement DNB Group
January-September Full year Amounts in NOK million 2012 2011 2011
Operating activitiesNet payments on loans to customers (42 335) (78 783) (108 418) Interest received from customers 42 175 38 311 52 398 Net receipts on deposits from customers 103 361 104 310 96 698 Interest paid to customers (6 995) (6 588) (17 712) Net receipts/payments on loans to credit institutions (1 428) 81 494 36 929 Interest received from credit institutions 1 233 976 1 425 Interest paid to credit institutions (2 372) (3 468) (4 719) Net receipts/payments on the sale of financial assets for investment or trading (22 390) 52 676 69 052 Interest received on bonds and commercial paper 3 000 7 057 8 391 Net receipts on commissions and fees 5 126 5 380 6 897 Payments to operations (13 326) (13 140) (17 815) Taxes paid (453) (5 428) (5 428) Receipts on premiums 13 855 15 242 17 020 Net receipts/payments on premium reserve transfers (721) 2 068 2 061 Payments of insurance settlements (11 150) (10 341) (13 641) Other receipts/payments (4 827) 5 074 (6 452) Net cash flow from operating activities 62 753 194 840 116 686
Investment activities Net payments on the acquisition of fixed assets (2 113) (1 535) (2 738) Net payments, investment property (329) (493) (688) Receipts on the sale of long-term investments in shares 0 85 85 Dividends received on long-term investments in shares 97 105 105 Net cash flow from investment activities (2 345) (1 838) (3 236)
Funding activities Receipts on issued bonds and commercial paper 388 449 307 240 367 414 Payments on redeemed bonds and commercial paper (287 832) (223 699) (244 281) Interest payment on issued bonds and commercial paper (11 107) (11 067) (14 933) Receipts on the raising of primary capital subordinated loan capital 5 531 0 0 Redemptions of subordinated loan capital (3 968) (7 524) (9 806) Interest payment on subordinated loan capital (455) (466) (721) Dividend payments (3 258) (6 515) (6 515) Net cash flow from funding activities 87 360 57 968 91 158 Effects of exchange rate changes on cash and cash equivalents (5 112) 7 081 967 Net cash flow 142 656 258 051 205 575 Cash as at 1 January 229 301 23 726 23 726 Net receipts/payments of cash 142 656 258 051 205 575 Cash at end of period *) 371 958 281 777 229 301
*) Of which: Cash and deposits with central banks 367 409 276 593 224 581 Deposits with credit institutions with no agreed period of notice 1) 4 549 5 184 4 721
1) Recorded under "Lending to and deposits with credit institutions" in the balance sheet.
The cash flow statement shows receipts and payments of cash and cash equivalents during the period. The statement has been prepared in accordance with the direct method. Cash flows are classified as operating activities, investment activities or funding activities. Balance sheet items are adjusted for the effects of exchange rate movements. Cash is defined as cash and deposits with central banks, and deposits with credit institutions with no agreed period of notice. During the fourth quarter of 2011, certain items in the cash flow statement were reclassified. Among other things, Net receipts/ payments on loans to credit institutions and appurtenant interest were included in operating activities with effect from the fourth quarter of 2011. Prior to this, these items were included under funding activities. Comparable figures for previous period have been restated.

16 Unaudited DNB third quarter report 2012
Note 1 Accounting principles
The third quarter accounts 2012 have been prepared according to IAS 34 Interim Financial Reporting. A description of the accounting principles applied by the Group is found in the annual report for 2011. The annual and interim accounts for the Group are prepared according to IFRS principles as endorsed by the EU. The statutory accounts of DNB ASA have been prepared according to the Norwegian Ministry of Finance's regulations on annual accounts, Section 1-5, on the use of IFRS, which implies that recognition and measurements are in accordance with IFRS and that the presentation and note information are in accordance with the Norwegian Accounting Act and accounting standards and practices generally accepted in Norway. The Group's accounting principles and calculation methods are essentially the same as those described in the annual report for 2011. With effect from the first quarter of 2012, however, profits from repossessed operations which are fully consolidated in the DNB Group are presented net under ”Profit from repossessed operations” in the company’s internal reporting of business areas. The repossessed operations are included in the Group Centre. The presentation in note 4 Segments has been adjusted correspondingly, including comparable figures. The changes are of significance only to the presentation of profits for the individual business areas and have no impact on the presentation of the Group’s income statement.
No new or amended accounting standards or interpretations entered into force during the first three quarters of 2012, apart from the amendments to IAS 12 Income Taxes, described below, which have yet to be endorsed by the EU. Amendments to IAS 12 Income Taxes The amendments imply that deferred tax on investment property carried at fair value according to IAS 40 Investment Property, as a rule should be determined based on the presumption that the carrying amount of the asset will be recovered through sale rather than use. The amendments also apply to non-depreciable assets recorded at fair value according to the rules in IAS 16 Property, Plant and Equipment. The amendments to IAS 12 entered into force on 1 January 2012 and are expected to be endorsed by the EU in the fourth quarter of 2012. The amendments are not expected to have any significant impact on the Group’s use of accounting principles.
Note 2 Important accounting estimates and discretionary assessments
When preparing the consolidated accounts, management makes estimates and discretionary assessments and prepares assumptions that influence the effect of the accounting principles applied and thus the recorded values of assets, liabilities, income and expenses. A more detailed description of important estimates and assumptions is presented in note 1 Important accounting estimates and discretionary assessments in the annual report for 2011.
Note 3 Changes in group structure
Pres-Vac Pres-Vac Engineering Aps and Valpress GmbH (Pres-Vac) develop and produce, among other things, tank valves for ships which transport liquid cargo. As part of the restructuring of the bank’s commitment with the companies, DNB Bank ASA took over all the shares in the companies. With effect from the first quarter of 2012, the companies are consolidated in the group accounts.
The companies were taken over at a price of DKK 1 and EUR 1, respectively. At the beginning of 2012, the Pres-Vac Group had a total negative equity of DKK 208 million. Prior to the acquisition, DNB Bank ASA had written down the commitment by approximately DKK 272 million. In the acquisition analysis, the remaining DKK 64 million was considered to represent the difference between fair value and recorded value of goodwill in Pres-Vac’s consolidated accounts.
During the first quarter of 2012, DKK 105 million of the company’s debt to the bank was converted to equity. Sales revenues for the first three quarters of 2012 were DKK 68 million, while operating expenses came to DKK 116 million (including impairment losses for goodwill of DKK 38 million). The company recorded an operating loss of DKK 50 million. Bryggetorget Holding AS After Faktor Eiendom ASA went into liquidation, Bryggetorget Holding AS, which is owned by DNB Bank ASA, took over Skurufjellet Eiendom AS, Trysiltunet Eiendom AS and Trysilfjell Apartment Eiendom AS from the estate in the first quarter of 2012. In addition, 31 holiday apart-ments in Uvdal organised as a housing cooperative were taken over. The properties were acquired at fair value. After the acquisition, the balance sheet value of the properties in Bryggetorget Holding was NOK 222 million.
SalusAnsvar During the third quarter of 2012, DNB entered into an agreement to sell the wholly-owned subsidiary SalusAnsvar AB to the insurance company Folksam Sak AB at a price of approximately SEK 480 million. SalusAnsvar primarily offers non-life insurance and personal insurance in the Swedish market. The company’s staff represents 140 full-time positions. The sale is subject to approval by the supervisory authorities and has thus not been reflected in the accounts. In consequence of the agreement, the DNB Group recorded impairment losses for goodwill of SEK 55 million (corresponding to NOK 47 million) in the third quarter of 2012.

DNB third quarter report 2012 Unaudited 17
Note 4 Segments Business areas The operational structure of DNB includes four business areas and four staff and support units. The business areas are independent profit centres and have responsibility for serving all of the Group's customers and for the total range of products. DNB's business areas comprise Retail Banking, Large Corporates and International, DNB Markets and Insurance and Asset Management. In addition, operations in DNB Baltics and Poland are reported as a separate profit centre.
Retail Banking - offers a broad range of financial products and services through a wide distribution network. In cooperation with several of the Group's product areas, customers are offered various financing and leasing, deposit and investment alternatives, insurance, as well as real estate broking and financial advisory services. In addition, extensive everyday banking services are provided through the internet bank, mobile banking, SMS services, branch offices, in-store banking outlets, in-store postal outlets and Norway Post. The ordinary home mortgage operations of DNB Boligkreditt AS are integrated in Retail Banking, while the company’s debt capital funding is shown under the Group Centre.
Large Corporates - offers a broad range of financial products and services to large Norwegian and international customers and International in cooperation with several of the Group's product areas, including various types of financing solutions,
deposits and investments, insurance, e-commerce products, commercial property brokerage, foreign currency, interest rate products, trade finance and corporate finance services.
DNB Markets - is the Group's investment bank with the key products foreign exchange, interest rate and commodity products, securities and other investment products, debt and equity financing in capital markets, research and advisory services, as well as custodial and other securities services.
Insurance and - is responsible for life insurance, non-life insurance, pension savings and asset management. DNB Asset Management Livsforsikring is shown as a separate reporting segment under Insurance and Asset Management.
DNB Baltics and Poland - offers financial services to corporate and personal customers in Estonia, Latvia and Lithuania. The strategy in Poland has been changed, whereby future operations will focus on the corporate market within the DNB Group’s international priority areas.
The income statement and balance sheet for the business areas have been prepared on the basis of internal financial reporting for the functional organisation of the DNB Group into business areas, as reported to group management (highest decision-making body) for an assessment of current developments and the allocation of resources. Figures for the business areas are based on DNB's management model and the Group's accounting principles. The figures have been restated in accordance with the Group's current principles for allocating costs and capital between business areas and are based on a number of assumptions, estimates and discretionary distribution. Internal transfer rates used between the business areas are determined based on observable market rates, e.g. NIBOR. Additional costs relating to the Group's long-term funding are charged to the business areas. With effect from the first quarter of 2012, profits from repossessed operations which are fully consolidated in the DNB Group are presented net under ”Profit from repossessed operations”. The repossessed operations are included in the Group Centre. See note 1 Accounting principles. Figures for previous periods have been restated.
The risk-adjusted capital requirement is a measure of the Group's economic capital, based on its risk systems. It is used to measure the capital required to fund transactions and volumes. The Group's actual equity is affected by external parameters and is not directly comparable with the risk-adjusted capital requirement. Returns in the table of key figures below are calculated based on the risk-adjusted capital require-ment.
Certain customers and transactions of major importance require extensive cooperation within the Group. To stimulate such cooperation, operating income and expenses relating to some of these customers and transactions are recorded in the accounts of all relevant business areas. This refers primarily to income from customer trading in DNB Markets. Double entries are presented gross in the income statement. Income is presented under "Income attributable to product suppliers", appurtenant costs under "Costs attributable to product suppliers" and write-downs under "Write-downs attributable to product suppliers". Double entries also include income from Insurance and Asset Management. Double entries are eliminated in the group accounts.

18 Unaudited DNB third quarter report 2012
Note 4 Segments (continued) Income statement, third quarter DNB Group
Amounts in NOK million 2012 2011 2012 2011 2012 2011 2012 2011 2012 2011 2012 2011 2012 2011
4 107 3 379 2 163 1 890 111 236 (88) (92) 248 321 287 660 6 828 6 394
111 141 145 162 36 44 65 130 3 15 (361) (492) 0 0
4 219 3 519 2 308 2 052 147 280 (23) 38 251 335 (74) 169 6 828 6 394
Other operating income 1 047 997 313 221 1 679 1 173 1 013 (152) 227 172 (650) 1 293 3 628 3 703
Income attributable to product suppliers 242 380 530 579 0 0 0 0 0 0 (772) (959) 0 0
1 289 1 377 842 800 1 679 1 173 1 013 (152) 227 172 (1 422) 333 3 628 3 703
5 507 4 896 3 150 2 852 1 826 1 454 990 (114) 478 507 (1 496) 502 10 456 10 097
Other operating expenses 2 781 2 680 652 588 541 486 564 575 342 294 312 238 5 191 4 862
Cost attributable to product suppliers 125 177 240 234 0 0 0 0 0 0 (365) (412) 0 0
2 906 2 858 892 822 541 486 564 575 342 294 (53) (173) 5 191 4 862
2 601 2 038 2 258 2 030 1 285 967 426 (689) 136 213 (1 442) 675 5 265 5 235
0 0 0 0 0 0 0 0 (1) 5 20 1 20 6
154 250 250 232 0 0 0 0 57 700 60 (13) 521 1 170
0 0 0 0 0 0 0 0 0 0 0 0 0 0
(5) 0 (63) (60) 0 0 0 0 0 0 68 60 0 0
2 442 1 788 1 946 1 737 1 285 967 426 (689) 78 (481) (1 415) 749 4 763 4 072
DNB Baltics Group
3rd quarter
DNB Other
Pre-tax operating profit
Net other operating income
Total income
Operating expenses
Pre-tax operating profit before write-downs
Write-downs attributable to product suppliers
Profit from repossessed operations
Net interest income - ordinary operations
Write-downs on loans and guarantees 3)
Net gains on fixed and intangible assets
Interest on allocated capital 2)
Net interest income
3rd quarter 3rd quarter 3rd quarter Retail Banking and International Markets
DNB operations/ and Asset Insurance
Large Corporates
3rd quarter 3rd quarter 3rd quarter Management and Poland eliminations 1)
1) Other operations/eliminations:
Amounts in NOK million 2012 2011 2012 2011 2012 2011 2012 2011
Net interest income - ordinary operations 0 0 (26) (25) 313 685 287 660 Interest on allocated capital 2) 0 0 0 0 (361) (492) (361) (492)
Net interest income 0 0 (26) (25) (48) 193 (74) 169
Other operating income 0 0 (278) (282) (372) 1 575 (650) 1 293
Income attributable to product suppliers (772) (959) 0 0 0 0 (772) (959)
Net other operating income (772) (959) (278) (282) (372) 1 575 (1 422) 333
Total income (772) (959) (304) (307) (420) 1 768 (1 496) 502
Other operating expenses 0 0 (304) (307) 616 545 312 238
Cost attributable to product suppliers (365) (412) 0 0 0 0 (365) (412)
Operating expenses (365) (412) (304) (307) 616 545 (53) (173)
Pre-tax operating profit before write-downs (406) (548) 0 0 (1 036) 1 223 (1 442) 675
Net gains on fixed and intangible assets 0 0 0 0 20 1 20 1 Write-downs on loans and guarantees 3) 0 0 0 0 60 (13) 60 (13)
Write-downs attributable to product suppliers 0 0 0 0 0 0 0 0
Profit from repossessed operations 0 0 0 0 68 60 68 60
Pre-tax operating profit (407) (548) 0 0 (1 008) 1 297 (1 415) 749
cost attributable Group Centre *) eliminations
3rd quarter 3rd quarter to product suppliers Total
Other
3rd quarter 3rd quarter
Elimination of income/
The eliminations refer mainly to internal services from support units to business areas and between business areas. Further, intra-group transactions and gains and losses on transactions between companies in the Group are eliminated. The elimination of income/cost attributable to product suppliers primarily concerns net profits on customer business carried out in cooperation between DNB Markets and other business areas and taken to income in both areas.
The Group Centre includes Operations, HR (Human Resources), IT, Group Finance and Risk Management, Marketing, Communications and eBusiness,
Corporate Centre, Treasury, the partially owned company Eksportfinans, investments in IT infrastructure and shareholder-related costs. In addition, the Group Centre includes that part of the Group’s equity that is not allocated to the business areas. With effect from the first quarter of 2012, profits from repossessed operations which are fully consolidated in the DNB Group are presented net under ”Profit from repossessed operations” in the business areas. The repossessed operations are included in the Group Centre. Figures for previous periods have been restated.
*) Group Centre - pre-tax operating profit in NOK million 2012 2011 + Interest on unallocated equity etc. 195 280 + Income from equities investments 61 61 + Gains on fixed and intangible assets 20 1 + Mark-to-market adjustments Treasury and fair value on lending (446) 85 + Basis swaps (566) 1 198 + Eksportfinans ASA 232 (27) - Unallocated write-downs on loans and guarantees 60 (13) - Ownership-related expenses (costs relating to shareholders, investor relations, strategic planning etc.) 108 64 - Unallocated pension expenses 76 14 - Unallocated IT expenses 29 23 - Funding costs on goodwill 12 14 - Operating expenses relating to the move to the new head office in Bjørvika 57 0 - Impairment losses for intangible assets 38 0 Other (124) (198) Pre-tax operating profit (1 008) 1 297
3rd quarter
2) The interest is calculated on the basis of internal measurement of risk-adjusted capital requirement. 3) See note 12 Write-downs on loans and guarantees for an analysis of the gross change in write-downs for the Group.

DNB third quarter report 2012 Unaudited 19
Note 4 Segments (continued) Main average balance sheet items DNB Group
Amounts in NOK billion 2012 2011 2012 2011 2012 2011 2012 2011 2012 2011 2012 2011 2012 2011 Net lending to customers 1) 855.8 790.3 399.5 371.2 3.0 2.0 2.0 0.9 52.8 53.7 (2.0) 3.4 1 311.1 1 221.5 Deposits from customers 1) 459.4 411.3 294.7 228.1 57.3 36.5 29.1 22.7 (6.3) (0.9) 834.2 697.6Assets under management 2) 536.1 525.0 536.1 525.0Allocated capital 3) 20.1 18.8 26.0 21.8 6.6 6.0 12.0 17.7 3.6 3.6
DNB Baltics Group
3rd quarter Markets eliminations and Poland Management
3rd quarter
DNB
3rd quarter 3rd quarter 3rd quarter
Other and Asset Insurance
3rd quarter 3rd quarter
DNB Retail Banking and International
Large Corporates operations/
Key figures DNB Group
Per cent 2012 2011 2012 2011 2012 2011 2012 2011 2012 2011 2012 2011 2012 2011 Cost/income ratio 4) 5) 51.9 58.4 28.3 28.8 29.6 33.5 56.9 (504.2) 71.5 57.9 48.8 48.2Ratio of deposits to lending 1) 6) 53.7 52.0 73.8 61.4 55.2 42.2 63.6 57.1Return on allocated capital, annualised 3) 34.8 27.2 21.4 22.8 56.1 45.9 16.7 (27.1) 6.9 (42.6) 21.2 13.4Number of full-time positions as at 30 Sept. 7) 4 909 5 001 1 144 1 138 721 693 1 035 1 067 3 203 3 234 2 415 2 348 13 426 13 481
3rd quarter operations and Poland
Large Corporates DNB Baltics DNB Markets Retail Banking
and Asset DNB
3rd quarter
Other Group
3rd quarter and International Management
3rd quarter
Insurance
3rd quarter 3rd quarter 3rd quarter
1) Lending to customers includes accrued interest, write-downs and value adjustments. Lending to credit institutions is not included. Correspondingly, deposits from customers include accrued interest and value adjustments. Deposits from credit institutions are not included.
2) The figures include total assets in DNB Livsforsikring. With effect from 2012, total assets in DNB Private Equity, totalling NOK 5.9 billion, have been included. Figures for previous periods have been restated. 3) The allocated capital and return on allocated capital for the business areas are calculated on the basis of internal measurement of risk-adjusted capital
requirement. Recorded capital are used for the Group. 4) Total operating expenses relative to total income. 5) Due to stock market developments, operating income in DNB Livsforsikring was negative at NOK 371 million in the third quarter of 2011. This resulted in
negative income for the Insurance and Asset Management business area. 6) Deposits from customers relative to net lending to customers. 7) Historical figures for DNB Baltics and Poland do not include DnB NORD’s operations and branches in Finland and Denmark which have been closed down or
transferred to DNB in Oslo.
Income statement, January-September DNB Group
Amounts in NOK million 2012 2011 2012 2011 2012 2011 2012 2011 2012 2011 2012 2011 2012 2011
11 609 10 159 6 508 5 332 473 647 (281) (267) 781 954 1 024 1 636 20 115 18 460
377 426 465 472 126 114 244 342 21 36 (1 233) (1 390) 0 0
11 986 10 584 6 973 5 805 599 762 (37) 74 801 990 (209) 246 20 115 18 460
Other operating income 3 033 2 790 958 811 5 388 3 905 2 895 2 186 665 537 (2 499) 925 10 439 11 154
Income attributable to product suppliers 837 988 1 710 1 584 0 0 0 0 0 0 (2 547) (2 572) 0 0
3 871 3 778 2 668 2 395 5 388 3 905 2 895 2 186 665 537 (5 047) (1 646) 10 439 11 154
15 857 14 362 9 641 8 199 5 987 4 667 2 858 2 260 1 466 1 527 (5 255) (1 401) 30 554 29 614
Other operating expenses 8 178 7 906 1 929 1 758 1 657 1 516 1 711 1 757 1 050 914 919 735 15 445 14 587
Cost attributable to product suppliers 414 482 704 654 0 0 0 0 0 0 (1 118) (1 136) 0 0
8 592 8 388 2 633 2 412 1 657 1 516 1 711 1 757 1 050 914 (199) (400) 15 445 14 587
7 264 5 974 7 008 5 788 4 330 3 151 1 147 503 416 613 (5 057) (1 000) 15 109 15 028
(1) 2 0 0 0 0 0 0 3 12 61 6 63 20
672 603 1 004 838 0 0 0 0 220 1 063 93 15 1 990 2 519
0 0 0 2 0 0 0 0 0 0 0 (2) 0 0
(12) 0 (146) (60) 0 0 0 0 0 0 158 60 0 0
6 579 5 372 5 859 4 888 4 330 3 151 1 147 503 199 (438) (4 931) (947) 13 182 12 529
DNB Baltics Large Corporates
Jan.-Sept. Jan.-Sept. Jan.-Sept. Management and Poland eliminations
DNB operations/ and Asset Insurance
Jan.-Sept. Jan.-Sept. Jan.-Sept. Retail Banking and International Markets
Other
Interest on allocated capital
Net interest income
Net interest income - ordinary operations
Write-downs on loans and guarantees
Net gains on fixed and intangible assets
Pre-tax operating profit
Net other operating income
Total income
Operating expenses
Pre-tax operating profit before write-downs
Write-downs attributable to product suppliers
Profit from repossessed operations
DNB Group
Jan.-Sept.

20 Unaudited DNB third quarter report 2012
Note 4 Segments (continued) DNB Livsforsikring The business area Insurance and Asset Management comprises DNB Livsforsikring ASA and DNB Asset Management Holding AS and their respective subsidiaries, in addition to DNB Skadeforsikring. DNB Livsforsikring ASA including subsidiaries is fully consolidated in the DNB Group accounts. DNB Livsforsikring's lines of business are life insurance and pension savings. Operations are thus different from operations in the rest of the Group. Profit sharing between policyholders and the owner in life insurance companies is based on special accounting regulations for such operations stipulated by the Norwegian Ministry of Finance. Regulations relating to profit sharing between the owner and policyholders in life insurance companies limit the DNB Group’s access to revenues and assets from life insurance operations. The tables below describe the income statement, balance sheet and key figures for DNB Livsforsikring. Income statement 1) DNB Livsforsikring
3rd quarter 3rd quarter January-September Full year Amounts in NOK million 2012 2011 2012 2011 2011 Commissions and fees receivable etc. 584 567 1 729 1 735 2 162 Commissions and fees payable etc. 84 74 252 237 315 Net gains on assets in DNB Livsforsikring 4 318 (5 275) 10 801 1 540 5 795 Guaranteed returns and allocations to policyholders in DNB Livsforsikring 4 077 (4 208) 10 070 1 648 5 772 Premium income etc. included in the risk result in DNB Livsforsikring 1 586 1 213 3 907 3 650 4 941 Insurance claims etc. included in the risk result in DNB Livsforsikring 1 617 1 017 4 051 3 606 4 853 Other income 8 5 23 20 29 Net other operating income 718 (372) 2 086 1 455 1 988 Total income 718 (372) 2 086 1 455 1 988 Salaries and other personnel expenses 185 162 552 521 674 Other expenses 161 195 491 578 791 Depreciation and impairment of fixed and intangible assets 23 27 69 81 107 Total operating expenses 370 384 1 112 1 181 1 573 Net gains on fixed and intangible assets 0 0 0 0 0 Pre-tax operating profit 348 (756) 975 274 415 Taxes (105) 508 (276) 255 101 Profit for the period 2) 453 (1 264) 1 250 19 314 1) The figures encompass DNB Livsforsikring ASA including subsidiaries as included in the DNB Group accounts before eliminations for intra-group
transactions and balances. 2) Breakdown of income statement DNB Livsforsikring
3rd quarter 3rd quarter January-September Full year Amounts in NOK million 2012 2011 2012 2011 2011 Interest result 930 (5 540) 3 529 (1 644) (74) Application of/(transferred to) additional allocations 0 1 586 0 1 586 524 Risk result (26) 202 (134) 67 129 Administration result 2 (8) (17) (30) (192) Upfront pricing of risk and guaranteed rate of return 146 132 434 395 531 Transferred from security reserve (6) (6) (11) (22) (41)
699 (2 877) 2 828 78 462 Pre-tax operating profit 348 (756) 975 274 415 Taxes (105) 508 (276) 255 101 Profit for the period 453 (1 264) 1 250 19 314
Provisions for higher life expectancy and proposed allocations to policyholders *)
*) Allocations to policyholders include a proposed increase in premium reserves for group pensions to reflect higher life expectancy, totalling NOK 663 million in the third quarter of 2012 and NOK 2 394 million in the first three quarters of 2012. The provisions, which are preliminary, are financed through the interest result and will be finally determined at year-end. In 2011, the premium reserves for group pensions were increased by NOK 464 million to reflect higher life expectancy.

DNB third quarter report 2012 Unaudited 21
Note 4 Segments (continued)
Balance sheets 1) DNB Livsforsikring 30 Sept. 31 Dec. 30 Sept.
Amounts in NOK million 2012 2011 2011
AssetsLending to and deposits with credit institutions 5 543 4 999 7 532 Lending to customers 1 927 1 858 996 Commercial paper and bonds 62 688 72 810 52 284 Shareholdings 39 072 40 607 58 974 Financial assets, customers bearing the risk 27 600 23 776 22 712 Financial derivatives 1 548 1 470 1 505 Commercial paper and bonds, held to maturity 88 493 73 954 69 677 Investment property 2) 39 935 37 632 37 494 Investments in associated companies 17 16 16 Intangible assets 208 240 246 Deferred tax assets 200 0 69 Fixed assets 6 10 12 Other assets 3 293 1 460 4 135 Total assets 270 529 258 831 255 653
Liabilities and equityFinancial derivatives 1 161 2 322 2 282 Insurance liabilities, customers bearing the risk 27 600 23 776 22 712 Liabilities to life insurance policyholders in DNB Livsforsikring 220 574 212 271 209 889 Payable taxes 20 214 1 085 Deferred taxes 0 382 0 Other liabilities 2 703 2 646 5 724 Pension commitments 231 224 223 Subordinated loan capital 2 502 2 509 2 505 Total liabilities 254 791 244 343 244 420
Share capital 1 621 1 621 1 321 Share premium reserve 3 875 3 875 1 175 Other equity 10 242 8 992 8 737 Total equity 15 738 14 488 11 233 Total liabilities and equity 270 529 258 831 255 653
1) The figures encompass DNB Livsforsikring ASA including subsidiaries as included in the DNB Group accounts before eliminations for intra-group transactions and balances.
2) See note 16 Investment property. Key figures DNB Livsforsikring
3rd quarter 3rd quarter January-September Full year Per cent 2012 2011 2012 2011 2011 Recorded return, excluding unrealised gains on financial instruments 1) 1.2 (1.6) 4.0 1.7 3.2Value-adjusted return, excluding unrealised gains on commercial paper and bonds, held to maturity 1) 1.6 (1.7) 4.5 0.4 2.1Value-adjusted return, including unrealised gains on commercial paper and bonds, held to maturity, and unrealised gains on current assets 1) 2.5 (0.9) 5.7 1.2 2.8Capital adequacy ratio at end of period 2) 14.7 9.8 14.7 9.8 15.3Core capital ratio at end of period 2) 13.6 8.6 13.6 8.6 13.9Solvency margin capital in per cent of requirement at end of period 2) 3) 180 154 180 154 192
1) Refers to the common portfolio. 2) Finanstilsynet (the Financial Supervisory Authority of Norway) and the Ministry of Finance have not adapted capital adequacy or solvency margin capital
regulations to IFRS. 3) Solvency margin capital is measured against the solvency margin requirement, which is linked to the company's insurance commitments. The solvency
margin capital requirements for Norwegian life insurance companies are subject to regulations laid down by the Ministry of Finance on 19 May 1995.

22 Unaudited DNB third quarter report 2012
Note 5 Net interest income
DNB Group 3rd quarter 3rd quarter January-September Full year
Amounts in NOK million 2012 2011 2012 2011 2011 Interest on loans to and deposits with credit institutions 327 248 1 306 1 087 1 353 Interest on loans to customers 13 158 12 015 39 840 35 286 48 661 Interest on impaired commitments 155 150 461 462 548 Interest on commercial paper and bonds 1 167 1 780 4 064 5 237 6 692 Front-end fees etc. 92 61 254 201 292 Other interest income 1 026 1 171 2 139 1 805 2 528 Total interest income 15 926 15 424 48 066 44 078 60 075 Interest on loans and deposits from credit institutions 831 1 115 2 591 3 468 4 426 Interest on deposits from customers 3 923 3 642 11 969 10 011 13 942 Interest on debt securities issued 3 257 3 095 10 167 8 802 12 118 Interest on subordinated loan capital 179 156 533 466 616 Other interest expenses 1) 907 1 022 2 691 2 871 3 721 Total interest expenses 9 098 9 030 27 951 25 618 34 823 Net interest income 6 828 6 394 20 115 18 460 25 252
1) Other interest expenses include interest rate adjustments resulting from interest swaps entered into.
Note 6 Net commissions and fees receivable
DNB Group 3rd quarter 3rd quarter January-September Full year
Amounts in NOK million 2012 2011 2012 2011 2011 Money transfer fees receivable 823 783 2 383 2 223 2 984 Fees on asset management services 273 254 781 832 1 115 Fees on custodial services 81 71 241 238 311 Fees on securities broking 40 59 139 217 254 Corporate finance 108 107 392 331 454 Interbank fees 12 24 32 69 92 Credit broking commissions 61 190 302 455 488 Sales commissions on insurance products 660 646 1 975 1 965 2 468 Sundry commissions and fees receivable on banking services 228 234 689 716 968 Total commissions and fees receivable etc. 2 285 2 368 6 936 7 048 9 135
Money transfer fees payable 290 277 839 771 1 049 Commissions payable on fund management services 44 33 120 102 133 Fees on custodial services payable 30 28 105 94 122 Interbank fees 19 32 58 96 130 Credit broking commissions 24 22 71 64 93 Commissions payable on the sale of insurance products 32 26 96 93 124 Sundry commissions and fees payable on banking services 147 162 485 443 605 Total commissions and fees payable etc. 587 580 1 774 1 664 2 256 Net commissions and fees receivable 1 697 1 788 5 162 5 383 6 879
Note 7 Net gains on financial instruments at fair value
DNB Group 3rd quarter 3rd quarter January-September Full year
Amounts in NOK million 2012 2011 2012 2011 2011 Dividends 71 105 344 458 521 Net gains on commercial paper and bonds 1 071 266 2 255 369 418 Net gains on shareholdings 43 33 (71) (21) (247) Net gains on other financial instruments 1) (279) 1 846 19 3 457 6 969 Net gains on financial instruments at fair value 906 2 250 2 547 4 263 7 661
1) Net losses on other financial instruments in the third quarter of 2012 mainly reflected mark-to-market adjustments of financial instruments used to convert funding to the preferred currency (basis swaps). Greater financial market instability resulted in unrealised losses on basis swaps of NOK 566 million. In the third quarter of 2011, unrealised gains came to NOK 1 398 million. Unrealised gains and losses will be reversed over the instruments’ term to maturity.

DNB third quarter report 2012 Unaudited 23
Note 8 Profit from companies accounted for by the equity method
Moody’s and Standard & Poor’s downgrades of Eksportfinans’ credit rating in the fourth quarter of 2011 resulted in sizeable unrealised gains on the company’s long-term funding. The effect of such unrealised gains on DNB’s holding, after tax, represented NOK 11.8 billion in the fourth quarter of 2011. After reviewing the fair value of the company in connection with the closing of the annual accounts, DNB wrote down the value by an amount corresponding to unrealised gains on Eksportfinans’ own debt in the fourth quarter. In 2012, the required rate of return in the market has been reduced, and Eksportfinans has sizeable unrealised losses on own debt. The write-down made by DNB in the fourth quarter of 2011 has been reversed by an amount corresponding to these unrealised losses. The reversal represented just under NOK 5.5 billion of DNB’s holding after tax. The write-down in 2011 and the reversal in 2012 have been reported on the line ”Profit from companies accounted for by the equity method” along with DNB’s share of profits from the company.
Note 9 Other income
DNB Group 3rd quarter 3rd quarter January-September Full year
Amounts in NOK million 2012 2011 2012 2011 2011 Income from owned/leased premises 19 9 48 20 26 Income from investment properties 72 65 207 133 197 Fees on real estate broking 263 252 846 752 1 012 Miscellaneous operating income 138 113 522 395 540 Total other income 492 439 1 623 1 300 1 775
Note 10 Operating expenses
DNB Group 3rd quarter 3rd quarter January-September Full year
Amounts in NOK million 2012 2011 2012 2011 2011 Salaries 2 006 1 931 5 964 5 608 7 594 Employer's national insurance contributions 282 263 861 791 985 Pension expenses 346 250 1 013 760 989 Restructuring expenses 37 (4) 43 (1) 11 Other personnel expenses 195 163 544 502 701 Total salaries and other personnel expenses 2 867 2 603 8 425 7 661 10 279
Fees 1) 317 434 915 1 249 1 775 IT expenses 1) 454 420 1 436 1 255 1 658 Postage and telecommunications 84 87 264 273 370 Office supplies 18 21 65 67 105 Marketing and public relations 219 218 700 708 949 Travel expenses 44 54 171 183 277 Reimbursement to Norway Post for transactions executed 39 43 104 128 167 Training expenses 10 11 44 50 75 Operating expenses on properties and premises 388 328 1 068 1 029 1 383 Operating expenses on machinery, vehicles and office equipment 35 36 107 109 146 Other operating expenses 170 168 677 573 816 Total other expenses 1 779 1 819 5 552 5 623 7 722
Impairment losses for goodwill 2) 85 0 85 0 190 Depreciation and write-downs of fixed and intangible assets 460 439 1 384 1 302 1 982 Total depreciation and write-downs of fixed and intangible assets 545 439 1 469 1 302 2 172 Total operating expenses 5 191 4 862 15 445 14 587 20 172
1) Fees also include system development fees and must be viewed relative to IT expenses. 2) Impairment losses for goodwill of NOK 47 million relating to SalusAnsvar and NOK 38 million to Pres-Vac were recorded in the third quarter of 2012.
Impairment losses for goodwill of NOK 190 million relating to Poland were recorded in the fourth quarter of 2011.

24 Unaudited DNB third quarter report 2012
Note 11 Number of employees/full-time positions
DNB Group 3rd quarter 3rd quarter January-September Full year
2012 2011 2012 2011 2011 Number of employees at end of period 13 846 13 885 13 846 13 885 14 072
- of which number of employees abroad 4 526 4 551 4 526 4 551 4 674
Number of employees calculated on a full-time basis at end of period 13 426 13 481 13 426 13 481 13 620 - of which number of employees calculated on a full-time basis abroad 4 444 4 468 4 444 4 468 4 560
Average number of employees 13 971 13 708 14 039 13 523 13 641 Average number of employees calculated on a full-time basis 13 538 13 316 13 595 13 145 13 250
Note 12 Write-downs on loans and guarantees
DNB Group 3rd quarter 3rd quarter January-September Full year
Amounts in NOK million 2012 2011 2012 2011 2011 Write-offs 56 53 200 447 550 New individual write-downs 920 1 118 2 730 2 855 4 120 Total new individual write-downs 976 1 171 2 930 3 302 4 670 Reassessed individual write-downs 200 157 660 788 1 015 Recoveries on commitments previously written off 107 94 304 318 437 Net individual write-downs 670 919 1 966 2 197 3 217 Change in collective write-downs on loans (148) 251 23 322 227 Write-downs on loans and guarantees 1) 521 1 170 1 990 2 519 3 445
Write-offs covered by individual write-downs made in previous years 422 485 1 900 1 983 2 753
1) Of which individual write-downs on guarantees 4 (16) 63 (14) 26
Note 13 Lending to customers
DNB Group 30 Sept. 31 Dec. 30 Sept.
Amounts in NOK million 2012 2011 2011 Lending to customers, nominal amount 1 185 691 1 186 159 1 169 652 Individual write-downs 9 450 9 521 9 266 Lending to customers, after individual write-downs 1 176 241 1 176 639 1 160 386 + Accrued interest and amortisation 2 664 2 156 2 269 - Individual write-downs of accrued interest and amortisation 699 710 726 - Collective write-downs 2 104 2 119 2 204 Lending to customers, at amortised cost 1 176 102 1 175 966 1 159 725
Lending to customers, nominal amount 129 001 102 284 86 701 + Accrued interest 464 453 443 + Adjustment to fair value 1 479 558 608 Lending to customers, at fair value 1) 130 944 103 294 87 752 Lending to customers 1 307 047 1 279 259 1 247 477
1) The fair value of loans in Norwegian kroner increased by NOK 91 million from 31 December 2011 due to narrowing margin requirement.

DNB third quarter report 2012 Unaudited 25
Note 14 Net impaired loans and guarantees for principal customer groups 1)
DNB Group 30 Sept. 31 Dec. 30 Sept.
Amounts in NOK million 2012 2011 2011 Private individuals 3 501 3 771 3 793 Transportation by sea and pipelines and vessel construction 4 988 3 551 279 Real estate 3 395 3 575 2 724 Manufacturing 1 889 2 072 2 246 Services 660 572 1 100 Trade 469 854 511 Oil and gas 42 0 0 Transportation and communication 606 334 412 Building and construction 1 252 647 618 Power and water supply 2 0 2 Seafood 69 67 60 Hotels and restaurants 208 298 318 Agriculture and forestry 292 260 284 Central and local government 0 0 0 Other sectors 58 22 17 Total customers 17 431 16 023 12 364 Credit institutions 0 21 0 Total net impaired loans and guarantees 17 431 16 043 12 364 Non-performing loans and guarantees not subject to write-downs 2 195 3 422 2 102 Total net non-performing and doubtful loans and guarantees 19 626 19 465 14 466
1) Includes loans and guarantees subject to individual write-downs and total non-performing loans and guarantees not subject to write-downs. The breakdown into principal customer groups is based on standardised sector and industry categories set up by Statistics Norway.
Note 15 Commercial paper and bonds, held to maturity
DNB Group 30 Sept. 31 Dec. 30 Sept.
Amounts in NOK million 2012 2011 2011 DNB Markets 75 557 95 062 97 871 DNB Livsforsikring 88 493 73 954 69 677 Other units 1) 26 262 (2 050) (1 700) Commercial paper and bonds, held to maturity 190 312 166 965 165 849
1) Including eliminations of DNB Livsforsikring's investments in bonds issued by DNB Boligkreditt. The increase in the third quarter 2012 refers to investments in Treasury bills with short maturities.
As part of ongoing liquidity management, DNB Bank has invested in a portfolio of securities. The portfolio can be used to regulate the liquidity requirement and as a basis for furnishing collateral for operations in various countries. Among other things, the securities serve as collateral for short and long-term borrowing in a number of central banks and as a basis for liquidity buffers to meet regulatory requirements. With effect from 1 July 2008, the international bond portfolio in DNB Markets was reclassified from the category "fair value through profit or loss" to "held-to-maturity investments". Portfolios in this category are recorded at amortised cost and written down if there is objective evidence of a decrease in value.
In line with IAS 39, the portfolio has been reviewed to identify objective indications of impairment. No impairment losses have been identified in the portfolio.
Measurement of the reclassified bond portfolio The reclassification in accordance with IAS 39 Financial Instruments: Recognition and Measurements requires that the value of the portfolio based on the principles applied before the reclassification must be reported. In a normal market situation, the portfolio would have been recorded at external observable prices before the reclassification. Due to the financial turmoil, there were no such observable prices in the market in 2008. In order to meet the disclosure requirement at end-September 2012, the portfolio has been measured at fair value according to models used for financial instruments not traded in an active market. The model applied is based on a regression analysis whereby historical market data (explanatory variables) which have been observable even during the financial turmoil are used to explain historical changes in value in the portfolio. During the period from the fourth quarter of 2006 up to and including the second quarter of 2008, the model shows a high level of correlation between changes in given market data and changes in value in the portfolio, which at the time was priced in an active market or through broker quotes which were believed to be fairly reliable. If the model had been applied to the portfolio in the third quarter of 2012, there would have been a NOK 592 million increase in profits.
Effects of the reclassifications of the international bond portfolio By measuring the portfolio at amortised cost, the value of the portfolio as at 30 September 2012 was NOK 1.4 billion higher than if the previous valuation principle had been retained. On the reclassification date, the book value of the portfolio was NOK 88.0 billion, compared with NOK 28.5 billion at end-September 2012. The average term to maturity of the portfolio was 4.5 years, and the change in value resulting from an interest rate adjustment of one basis point was NOK 13 million at end-September 2012.

26 Unaudited DNB third quarter report 2012
Note 15 Commercial paper and bonds, held to maturity (continued) Effects on profits of the reclassification DNB Group
3rd quarter 3rd quarter January-September Full year Amounts in NOK million 2012 2011 2012 2011 2011 Recorded amortisation effect 28 110 134 267 329 Net gain, if valued at fair value 621 (1 476) 855 (1 248) (1 181) Effects of reclassification on profits (592) 1 586 (721) 1 515 1 510
Effects on the balance sheet of the reclassification DNB Group 30 Sept. 31 Dec. 30 Sept.
Amounts in NOK million 2012 2011 2011 Recorded, unrealised losses 771 905 967 Unrealised losses, if valued at fair value 2 193 3 048 3 116 Effects of reclassification on the balance sheet 1 422 2 144 2 149
Development in the portfolio after the reclassification DNB Group 30 Sept. 31 Dec. 30 Sept.
Amounts in NOK million 2012 2011 2011 Reclassified portfolio, recorded value 28 545 39 825 42 367 Reclassified portfolio, if valued at fair value 27 123 37 682 40 218 Effects of reclassification on the balance sheet 1 422 2 144 2 149
DNB Markets' international bond portfolio After the reclassification date, DNB Markets has chosen to increase its investments in held-to-maturity securities. According to new proposed liquidity requirements for banks, in order for the securities to be classified as liquid funds, they must qualify for immediate sale. New investments in the currency bond portfolio as from 2011 mainly represent covered bonds carried at fair value. As at 30 September 2012 DNB Markets' international bond portfolio represented NOK 115.4 billion. 86.0 per cent of the securities in the portfolio had an AAA rating, while 8.3 per cent were rated AA. There were no synthetic securities in the portfolio and no investments in US sub-prime bonds or Collateralised Debt Obligations, CDOs. Nor were any investments made in Treasury bills in Portugal, Italy, Ireland, Greece or Spain. The structure of DNB Markets' international bond portfolio is shown below.
DNB Group Per cent NOK million
30 Sept. 2012 30 Sept. 2012 Asset class
Consumer credit 0.2 209 Residential mortgages 39.2 45 521 Corporate loans 0.9 1 022 Government related 27.2 31 579 Covered bonds 32.6 37 853
Total international bond portfolio DNB Markets, nominal values 100.0 116 185 Accrued interest, amortisation effects and fair value adjustments (819) Total international bond portfolio DNB Markets 115 367 Total international bond portfolio DNB Markets, held to maturity 75 557 Of which reclassified portfolio 28 545
The average term to maturity of DNB Markets' international bond portfolio is 3.1 years, and the change in value resulting from an interest rate adjustment of one basis point was NOK 18 million at end-September 2012. DNB Livsforsikring DNB Livsforsikring's portfolio of held-to-maturity bonds represents bonds issued by highly creditworthy borrowers. At end-September 2012, bonds with government guarantees represented approximately 23 per cent of the portfolio, while covered bonds represented approximately 29 per cent of the portfolio. The remaining bonds are generally issued by municipalities, county municipalities and finance companies with sound creditworthiness. All investments in bonds issued by finance companies represent senior debt, which has the highest ranking in the capital structure and first priority if the issuer goes bankrupt. Only in exceptional cases does DNB Livsforsikring invest in bonds issued by traditional manufacturing companies.
In line with IAS 39, the portfolio has been reviewed to identify objective indications of impairment. No impairment losses have been identified in the portfolio.
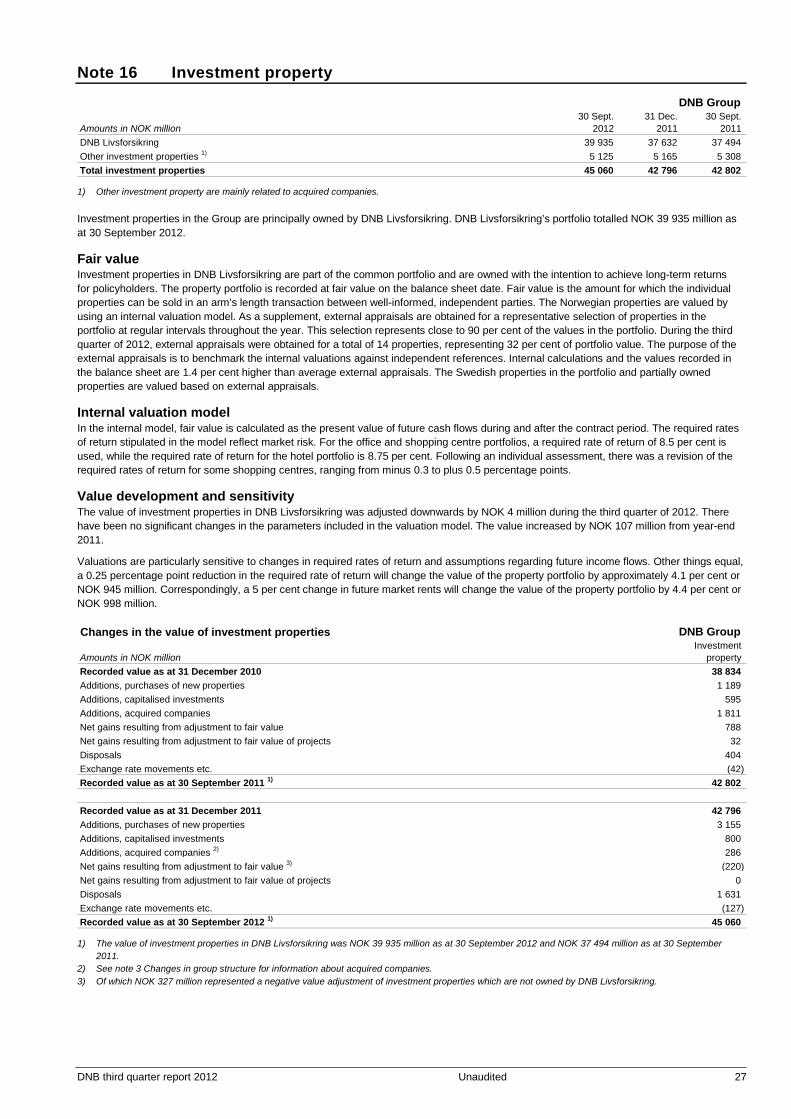
DNB third quarter report 2012 Unaudited 27
Note 16 Investment property
DNB Group 30 Sept. 31 Dec. 30 Sept.
Amounts in NOK million 2012 2011 2011 DNB Livsforsikring 39 935 37 632 37 494 Other investment properties 1) 5 125 5 165 5 308 Total investment properties 45 060 42 796 42 802
1) Other investment property are mainly related to acquired companies. Investment properties in the Group are principally owned by DNB Livsforsikring. DNB Livsforsikring’s portfolio totalled NOK 39 935 million as at 30 September 2012. Fair value Investment properties in DNB Livsforsikring are part of the common portfolio and are owned with the intention to achieve long-term returns for policyholders. The property portfolio is recorded at fair value on the balance sheet date. Fair value is the amount for which the individual properties can be sold in an arm’s length transaction between well-informed, independent parties. The Norwegian properties are valued by using an internal valuation model. As a supplement, external appraisals are obtained for a representative selection of properties in the portfolio at regular intervals throughout the year. This selection represents close to 90 per cent of the values in the portfolio. During the third quarter of 2012, external appraisals were obtained for a total of 14 properties, representing 32 per cent of portfolio value. The purpose of the external appraisals is to benchmark the internal valuations against independent references. Internal calculations and the values recorded in the balance sheet are 1.4 per cent higher than average external appraisals. The Swedish properties in the portfolio and partially owned properties are valued based on external appraisals. Internal valuation model In the internal model, fair value is calculated as the present value of future cash flows during and after the contract period. The required rates of return stipulated in the model reflect market risk. For the office and shopping centre portfolios, a required rate of return of 8.5 per cent is used, while the required rate of return for the hotel portfolio is 8.75 per cent. Following an individual assessment, there was a revision of the required rates of return for some shopping centres, ranging from minus 0.3 to plus 0.5 percentage points. Value development and sensitivity The value of investment properties in DNB Livsforsikring was adjusted downwards by NOK 4 million during the third quarter of 2012. There have been no significant changes in the parameters included in the valuation model. The value increased by NOK 107 million from year-end 2011.
Valuations are particularly sensitive to changes in required rates of return and assumptions regarding future income flows. Other things equal, a 0.25 percentage point reduction in the required rate of return will change the value of the property portfolio by approximately 4.1 per cent or NOK 945 million. Correspondingly, a 5 per cent change in future market rents will change the value of the property portfolio by 4.4 per cent or NOK 998 million. Changes in the value of investment properties DNB Group
Investment Amounts in NOK million property Recorded value as at 31 December 2010 38 834 Additions, purchases of new properties 1 189 Additions, capitalised investments 595 Additions, acquired companies 1 811 Net gains resulting from adjustment to fair value 788 Net gains resulting from adjustment to fair value of projects 32 Disposals 404 Exchange rate movements etc. (42) Recorded value as at 30 September 2011 1) 42 802
Recorded value as at 31 December 2011 42 796 Additions, purchases of new properties 3 155 Additions, capitalised investments 800 Additions, acquired companies 2) 286 Net gains resulting from adjustment to fair value 3) (220) Net gains resulting from adjustment to fair value of projects 0 Disposals 1 631 Exchange rate movements etc. (127) Recorded value as at 30 September 2012 1) 45 060
1) The value of investment properties in DNB Livsforsikring was NOK 39 935 million as at 30 September 2012 and NOK 37 494 million as at 30 September 2011.
2) See note 3 Changes in group structure for information about acquired companies. 3) Of which NOK 327 million represented a negative value adjustment of investment properties which are not owned by DNB Livsforsikring.

28 Unaudited DNB third quarter report 2012
Note 17 Intangible assets
DNB Group 30 Sept. 31 Dec. 30 Sept.
Amounts in NOK million 2012 2011 2011 Goodwill 1) 5 128 5 174 5 295 IT systems development 1) 1 589 1 511 1 548 Other intangible assets 318 319 308 Total intangible assets 7 035 7 003 7 151
1) Impairment losses for goodwill related to SalusAnsvar AB of SEK 55 million were recorded in the third quarter of 2012 after an agreement on the sale of the company had been concluded. The sale is subject to approval by the supervisory authorities and has thus not been reflected in the accounts. The impairment losses correspond to the agreed sales price for the company. Impairment losses for goodwill related to Pres-Vac Engineering Aps of DKK 38 million were recorded in the third quarter of 2012 due to market developments for the company, which, among other things, produces tank valves for ships which transport liquid cargo. There has not been identified any other impairment losses of goodwill or IT systems development. The valuations are based on reported figures for the third quarter compared with approved plans for the various cash-generating units.
Note 18 Debt securities issued and subordinated loan capital As an element in liquidity management, the DNB Group issues and redeems own securities. Debt securities issued DNB Group
30 Sept. 31 Dec. 30 Sept. Amounts in NOK million 2012 2011 2011 Commercial paper issued, nominal amount 270 085 228 430 205 599 Bond debt, nominal amount 1) 429 703 386 384 373 116 Adjustments 28 137 20 343 17 551 Total debt securities issued 727 925 635 157 596 266
Changes in debt securities issued DNB Group Balance sheet Matured/ Exchange rate Other Balance sheet
30 Sept. Issued redeemed movements adjustments 31 Dec. Amounts in NOK million 2012 2012 2012 2012 2012 2011 Commercial paper issued, nominal amount 270 085 270 027 228 373 1 228 430 Bond debt, nominal amount 1) 429 703 118 421 59 459 (15 643) 386 384 Adjustments 28 137 7 794 20 343 Total debt securities issued 727 925 388 449 287 832 (15 642) 7 794 635 157
Changes in subordinated loan capital and perpetual subordinated loan capital securities DNB Group Balance sheet Matured/ Exchange rate Other Balance sheet
30 Sept. Issued redeemed movements adjustments 31 Dec. Amounts in NOK million 2012 2012 2012 2012 2012 2011 Term subordinated loan capital, nominal amount 14 367 5 531 3 968 (54) 12 859Perpetual subordinated loan capital, nominal amount 3 966 (191) 4 158Perpetual subordinated loan capital securities,
nominal amount 2) 5 812 (161) 5 973Adjustments 1 653 479 1 174Total subordinated loan capital and perpetual
subordinated loan capital securities 25 799 5 531 3 968 (406) 479 24 163
1) Minus own bonds. Outstanding covered bonds in DNB Boligkreditt totalled NOK 351.5 billion as at 30 September 2012. The cover pool represented NOK 507.2 billion.
2) Perpetual subordinated loan capital securities are eligible for inclusion in core capital by an amount not exceeding 15 per cent of total core capital. Finanstilsynet may require that the securities should be written down proportionally to equity if the bank's core capital ratio falls below 5 per cent or capital adequacy ratio falls below 8 per cent. Amounts written down on the securities must be revalued before the distribution of dividends to shareholders or revaluation of equity.
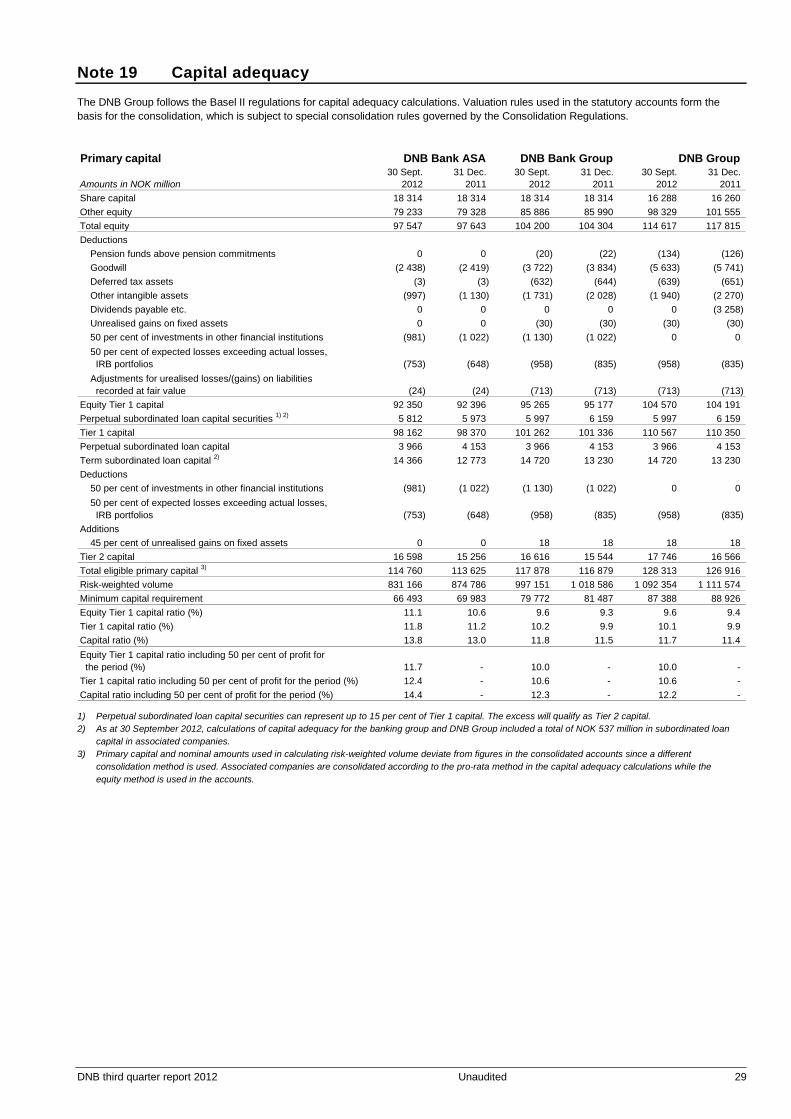
DNB third quarter report 2012 Unaudited 29
Note 19 Capital adequacy
The DNB Group follows the Basel II regulations for capital adequacy calculations. Valuation rules used in the statutory accounts form the basis for the consolidation, which is subject to special consolidation rules governed by the Consolidation Regulations. Primary capital DNB Bank ASA DNB Bank Group DNB Group
30 Sept. 31 Dec. 30 Sept. 31 Dec. 30 Sept. 31 Dec. Amounts in NOK million 2012 2011 2012 2011 2012 2011 Share capital 18 314 18 314 18 314 18 314 16 288 16 260 Other equity 79 233 79 328 85 886 85 990 98 329 101 555 Total equity 97 547 97 643 104 200 104 304 114 617 117 815 Deductions
Pension funds above pension commitments 0 0 (20) (22) (134) (126) Goodwill (2 438) (2 419) (3 722) (3 834) (5 633) (5 741) Deferred tax assets (3) (3) (632) (644) (639) (651) Other intangible assets (997) (1 130) (1 731) (2 028) (1 940) (2 270) Dividends payable etc. 0 0 0 0 0 (3 258) Unrealised gains on fixed assets 0 0 (30) (30) (30) (30) 50 per cent of investments in other financial institutions (981) (1 022) (1 130) (1 022) 0 0 50 per cent of expected losses exceeding actual losses, IRB portfolios (753) (648) (958) (835) (958) (835) Adjustments for urealised losses/(gains) on liabilities recorded at fair value (24) (24) (713) (713) (713) (713)
Equity Tier 1 capital 92 350 92 396 95 265 95 177 104 570 104 191 Perpetual subordinated loan capital securities 1) 2) 5 812 5 973 5 997 6 159 5 997 6 159 Tier 1 capital 98 162 98 370 101 262 101 336 110 567 110 350 Perpetual subordinated loan capital 3 966 4 153 3 966 4 153 3 966 4 153 Term subordinated loan capital 2) 14 366 12 773 14 720 13 230 14 720 13 230 Deductions
50 per cent of investments in other financial institutions (981) (1 022) (1 130) (1 022) 0 0 50 per cent of expected losses exceeding actual losses, IRB portfolios (753) (648) (958) (835) (958) (835)
Additions45 per cent of unrealised gains on fixed assets 0 0 18 18 18 18
Tier 2 capital 16 598 15 256 16 616 15 544 17 746 16 566 Total eligible primary capital 3) 114 760 113 625 117 878 116 879 128 313 126 916 Risk-weighted volume 831 166 874 786 997 151 1 018 586 1 092 354 1 111 574 Minimum capital requirement 66 493 69 983 79 772 81 487 87 388 88 926 Equity Tier 1 capital ratio (%) 11.1 10.6 9.6 9.3 9.6 9.4 Tier 1 capital ratio (%) 11.8 11.2 10.2 9.9 10.1 9.9 Capital ratio (%) 13.8 13.0 11.8 11.5 11.7 11.4 Equity Tier 1 capital ratio including 50 per cent of profit for the period (%) 11.7 - 10.0 - 10.0 - Tier 1 capital ratio including 50 per cent of profit for the period (%) 12.4 - 10.6 - 10.6 - Capital ratio including 50 per cent of profit for the period (%) 14.4 - 12.3 - 12.2 -
1) Perpetual subordinated loan capital securities can represent up to 15 per cent of Tier 1 capital. The excess will qualify as Tier 2 capital. 2) As at 30 September 2012, calculations of capital adequacy for the banking group and DNB Group included a total of NOK 537 million in subordinated loan
capital in associated companies. 3) Primary capital and nominal amounts used in calculating risk-weighted volume deviate from figures in the consolidated accounts since a different
consolidation method is used. Associated companies are consolidated according to the pro-rata method in the capital adequacy calculations while the equity method is used in the accounts.

30 Unaudited DNB third quarter report 2012
Note 19 Capital adequacy (continued) Specification of risk-weighted volume and capital requirements DNB Group
Nominal Risk-weighted Capital Capital exposure EAD 1) volume requirements requirements 30 Sept. 30 Sept. 30 Sept. 30 Sept. 31 Dec.
Amounts in NOK million 2012 2012 2012 2012 2011 IRB approach
Corporate 826 416 691 812 373 263 29 861 30 453 Specialised Lending (SL) 4 498 4 439 2 246 180 286 Retail - mortgage loans 572 659 572 659 70 360 5 629 5 515 Retail - other exposures 96 263 79 164 24 996 2 000 1 891 Securitisation 75 557 75 557 10 663 853 752
Total credit risk, IRB approach 1 575 393 1 423 631 481 529 38 522 38 898 Standardised approach
Central government 88 430 100 571 118 9 10 Institutions 142 706 105 055 23 604 1 888 1 922 Corporate 329 700 255 826 242 482 19 399 22 278 Retail - mortgage loans 42 749 40 763 22 730 1 818 1 674 Retail - other exposures 98 751 52 103 34 760 2 781 2 857 Equity positions 3 958 3 958 4 060 325 288 Securitisation 6 258 6 258 1 180 94 143 Other assets 13 778 13 778 13 778 1 102 901
Total credit risk, standardised approach 726 329 578 310 342 712 27 417 30 074 Total credit risk 2 301 722 2 001 941 824 241 65 939 68 971 Market risk
Position risk, debt instruments 38 384 3 071 2 833 Position risk, equity instruments 1 221 98 95 Currency risk 0 0 0
Total market risk 39 606 3 168 2 928 Operational risk 67 320 5 386 5 386 Net insurance, after eliminations 98 353 7 868 7 708 Deductions (494) (39) (50) Total risk-weighted volume and capital requirements before transitional rule 1 029 025 82 322 84 942 Additional capital requirements according to transitional rules 2) 63 329 5 066 3 984 Total risk-weighted volume and capital requirements 1 092 354 87 388 88 926
1) EAD, exposure at default. 2) Due to transitional rules, the minimum capital adequacy requirements cannot be reduced below 80 per cent relative to the Basel I requirements.

DNB third quarter report 2012 Unaudited 31
Note 19 Capital adequacy (continued) Basel II implementation Further progress A major reduction in risk-weighted assets is expected upon full implementation of the IRB system. The IRB system is defined as the models, work processes, decision-making processes, control mechanisms, IT systems and internal guidelines and routines used to classify and quantify credit risk. Status and a time schedule for the implementation of the different reporting methods used for the Group's portfolios are shown below.
Portfolios 30 Sept. 2012 31 Dec. 2012 1)
Retail:- mortgage loans, DNB Bank and DNB Boligkreditt IRB 2) IRB 2)
- qualifying revolving retail exposures, DNB Bank 3) IRB 2) IRB 2)
- mortgage loans, Nordlandsbanken Standardised IRB 2)
- loans in Norway, DNB Finans, DNB Bank IRB 2) IRB 2)
Corporates:- small and medium-sized corporates, DNB Bank Advanced IRB Advanced IRB- large corporate clients (scorecard models), DNB Bank Advanced IRB Advanced IRB- large corporate clients (simulation models), DNB Bank Standardised Advanced IRB- corporate clients, Nordlandsbanken Standardised Advanced IRB- leasing, DNB Bank Advanced IRB Advanced IRB- corporate clients, DNB Næringskreditt Standardised Advanced IRB
Securitisation positions:- international bond portfolio, DNB Markets IRB 2) IRB 2)
Institutions:- banks and financial institutions, DNB Bank Standardised Advanced IRB
Exceptions:- approved exceptions: government and municipalities, equity positions Standardised Standardised- temporary exceptions: DNB Baltics and Poland, DNB Luxembourg, JSC DNB Bank and various other small portfolios Standardised Standardised
Reporting methods for credit riskin capital adequacy calculations
1) As according to implementation plan. The conversion is, however, subject to final approval from the Norwegian FSA. 2) There is only one IRB approach for retail exposures and securitisation positions. 3) Reported according to the IRB category Retail - other exposures.
Note 20 Liquidity risk
Liquidity risk is the risk that the DNB Group will be unable to meet its payment obligations. Overall liquidity management in the Group implies that DNB Bank ASA is responsible for funding domestic subsidiaries, as well as international branches and subsidiaries. Liquidity risk is managed and measured by means of various measurement techniques.
The Board of Directors has approved internal limits which restrict the short-term maturity of liabilities within different time frames. The various maturities are subject to stress testing based on a bank-specific crisis and a systemic crisis, and a contingency plan has been established to handle market events. In addition, limits have been approved for structural liquidity risk, which implies that lending to customers should largely be financed through customer deposits, subordinated capital and long-term funding. Senior bond debt and covered bonds are the major sources of long-term funding. The Group's ratio of deposits to lending was 64.5 per cent at end-September 2012, up from 60.3 per cent a year earlier. The ratio of deposits to lending in DNB Bank ASA was 115.8 per cent at end-September 2012.
There was a lower level of uncertainty in the third quarter than in the preceding quarters. DNB had ample access to short-term funding, and investors showed increasing interest in longer maturities. The markets remain selective, and banks with strong credit ratings have the best access to funding. DNB is one of these banks.
The long-term funding markets were functioning almost as normal during the third quarter. There was a significant reduction in funding costs for both new covered bonds and new senior bond debt. This reflects that investors need to invest their money while bond issuers have less need for new funding in the short and medium term. In addition, measures launched by the European Central Bank, ECB, to purchase sovereign debt in the countries which apply for support from the bailout fund, had positive effects on the market. This resulted in less uncertainty, and the price level for new long-term funding was reduced, especially for financially strong banks. In spite of this, the Group’s funding costs are generally much higher than prior to the financial crisis. Experience shows that market conditions can change quickly. Depending on developments in the Eurozone, highly volatile funding costs and varying access to funding must still be expected.
The average remaining term to maturity for the portfolio of senior bond debt was 4.6 years at end-September 2012, compared with 4.4 years a year earlier. The Group aims to achieve a sound and stable maturity structure for funding.

32 Unaudited DNB third quarter report 2012
Note 21 Information on related parties
Major transactions and agreements with related parties: Eksportfinans DNB Bank ASA has a 40 per cent ownership interest in Eksportfinans. Financial market turbulence resulted in sizeable unrealised losses in Eksportfinans' liquidity portfolio in the first quarter of 2008. In order to ensure an adequate capital base for the company, its Board of Directors implemented three measures:
A share issue of NOK 1.2 billion aimed at the company's owners was implemented, and all owners participated based on their proportional shares.
A portfolio hedge agreement was entered into, and the owners were invited to participate. DNB Bank ASA's share of the agreement corresponded to 40.43 per cent. The agreement secures Eksportfinans against further decreases in portfolio values of up to NOK 5 billion effective from 29 February 2008. Any recovery of values relative to nominal values will accrue to the participants in the portfolio hedge agreement as payment for their hedging commitment.
During the first quarter of 2008, Eksportfinans' largest owner banks, DNB Bank ASA, Nordea Bank AB and Danske Bank A/S, approved a committed credit line giving the company access to a liquidity reserve of up to USD 4 billion. The agreement was renewed in June 2009, June 2010 and June 2011. The renewal in 2010 resulted in a reduction in the limit for the liquidity reserve to USD 2 billion. DNB Bank ASA's share of this agreement represents approximately USD 1.1 billion. Eksportfinans has not availed itself of this credit line.
The transactions with Eksportfinans have been entered into on ordinary market terms as if they had taken place between independent parties. Stimulus packages On 24 October 2008, the Norwegian parliament authorised the Ministry of Finance to launch a scheme whereby the government and the banks exchange Treasury bills for covered bonds for an agreed period. Norges Bank administers the scheme on commission from the Ministry of Finance.
Under the swap scheme, the government sells Treasury bills to the banks in a time-limited swap for covered bonds. The banks have free disposal over the Treasury bills they acquire and may sell them in the market if they so wish. Treasury bill maturities are between three and six months. The swap agreements last for periods of up to five years, and the banks undertake to purchase new Treasury bills as and when the Treasury bills reach maturity during the agreement period. The Treasury bills are priced at NIBOR plus a premium corresponding to the margin at the time the agreement was concluded. As an additional requirement, there must be a spread of minimum 40 basis points between the agreed interest rate and the Treasury bill yield. Upon expiry of the agreements, the banks are under an obligation to repurchase the covered bonds from the government at the original selling price. Payments related to the covered bonds are credited to the banks on the same day as the payments are made, unless default occurs during the duration of the swap agreement.
The bank has purchased bonds from DNB Boligkreditt, which have been used as collateral for swap agreements with Norges Bank. The bank is required to repurchase the covered bonds at the original selling price. The bank receives yield from the covered bonds as if they never had been sold. The accounting treatment of sales of financial instruments where the seller retains substantially all the risks and returns associated with the instrument, is described in IAS 39.20 Financial Instruments – Recognition and Measurement. The bank is of the opinion that the requirement for transfer of risk and returns associated with the bonds in accordance with this standard have not been fulfilled, and that the bonds thus cannot be derecognised from the balance sheet of the bank. On a consolidated basis, the bonds are treated as own bonds and netted against issued bonds in DNB Boligkreditt.
In practice, the swap agreements imply that the bank purchases Treasury bills from Norges Bank. These are initially recorded as investments in Treasury bills. The obligation to repurchase the bonds at a price corresponding to the value of the Treasury bills is recorded as funding from Norges Bank. At end-September 2012, this funding represented NOK 56.1 billion. At end-September 2012, the bank's investments in Treasury bills used in the swap agreements represented NOK 36.9 billion. Capitalisation and valuation of subsidiaries During the first quarter of 2012, DNB Bank ASA took over the shares in AS DNB Pank (former AS DNB Liising) in Estonia at a price of EUR 10.5 million, while the shares in AS DNB Baltics IT were taken over at a price of EUR 2.8 million in the second quarter of 2012. Both companies were acquired from Bank DNB A/S in Copenhagen. The transactions are part of the integration of operations in the former DnB NORD into the DNB Group.
During the second quarter of 2012, AS DNB Pank in Estonia received a capital injection of just over EUR 90 million, while the Polish subsidiary of Bank DNB A/S received a capital injection of PLN 487 million. During the third quarter of 2012, the share capital of DNB Baltic IT was increased by DKK 660 million.

DNB third quarter report 2012 Unaudited 33
Note 22 Off-balance sheet transactions, contingencies and post-balance sheet events
Off-balance sheet transactions and additional information DNB Group 30 Sept. 31 Dec. 30 Sept.
Amounts in NOK million 2012 2011 2011 Performance guarantees 44 273 47 530 51 060 Payment guarantees 24 106 23 439 23 264 Loan guarantees 1) 18 679 17 666 14 293 Guarantees for taxes etc. 6 508 5 645 5 272 Other guarantee commitments 2 525 2 285 2 320 Total guarantee commitments 96 091 96 565 96 209 Support agreements 10 551 10 237 9 457 Total guarantee commitments etc. *) 106 642 106 802 105 666 Unutilised credit lines and loan offers 499 838 519 143 511 726 Documentary credit commitments 2 365 2 594 3 523 Other commitments 2 591 1 381 1 483 Total commitments 504 793 523 118 516 732 Total guarantee and off-balance commitments 611 436 629 920 622 398
Pledged securities 95 038 90 524 81 421
*) Of which counter-guaranteed by financial institutions 1 237 19 20
1) DNB Bank ASA carries loans in its balance sheet that subject to legal agreement have been transferred to Eksportfinans and for which the bank has issued guarantees. According to the agreement, DNB Bank still carries interest rate risk and credit risk for the transferred portfolio. Customer loans in the portfolio totalling NOK 4 900 million were recorded in the balance sheet as at 30 September 2012. These loans are not included under guarantees in the table.
Contingencies Due to its extensive operations in Norway and abroad, the DNB Group will regularly be party to a number of legal actions. None of the current disputes are expected to have any material impact on the Group's financial position.
Ivar Petter Røeggen has instituted legal proceedings against DNB Bank ASA, claiming that two investment agreements for structured products be declared null and void. The Borgarting Court of Appeal found in favour of the bank on 30 September 2011. The disputed amount only applies to the civil action in question, which must be evaluated as a separate case. The judgment has been appealed to the Supreme Court, and the court proceedings are scheduled for 23 October 2012.
In addition to the civil action brought by Ivar Petter Røeggen, a group action against DNB Bank ASA with 19 plaintiffs has been described in previous quarterly reports, relating to the sale of the same structured products as the action brought by Røeggen. The group action has been dismissed in a final judgment. Several of the plaintiffs from the original multi-party action, together with some of the other plaintiffs, have submitted a civil action against DNB Bank ASA in accordance with the rules on joinder of parties. The action has been halted by the Oslo District Court awaiting a final decision in the civil action from Røeggen. Other units in the Group are also involved in legal disputes relating to structured products. The DNB Group contests the claims.
DNB Bank ASA has brought an action against seven Norwegian municipalities for the settlement of interest swaps on commercial terms. The municipalities have stopped their payments under the agreements citing that full settlement took place upon payment of the residual value of the investments made. The bank's total claim in the civil action is NOK 825 million plus interest on overdue payments.
Post-balance sheet events The Norwegian government has previously presented draft legislation on changes in tax rules for life insurance companies, and in October, this was confirmed in the National Budget for 2013. With effect from 2012, life insurance companies will no longer be able to use the tax exemption method for returns on equities which are realised in the common portfolio. As these rules had not been approved on the balance sheet date, they did not affect the tax charge for the third quarter of 2012. The changes are expected to entail higher future tax charges for the DNB Group. There is still great uncertainty concerning the final rules, and the Group has to await new regulations to estimate the outcome of the new rules, including possible transitional effects.
No additional information has come to light about important circumstances which had occurred on the balance sheet date on 30 September 2012 and up till the Board of Directors' final consideration of the accounts on 24 October 2012.

34 Unaudited DNB third quarter report 2012
DNB ASA Income statement DNB ASA
3rd quarter 3rd quarter January-September Full year Amounts in NOK million 2012 2011 2012 2011 2011 Total interest income 25 136 115 364 474 Total interest expenses 94 100 317 283 385 Net interest income (69) 36 (201) 81 90 Commissions and fees payable etc. 1 1 4 5 6 Other income 1) 0 0 0 0 183 Net other operating income (1) (1) (4) (5) 177 Total income (70) 35 (206) 77 267 Salaries and other personnel expenses 4 1 4 4 6 Other expenses 104 63 317 183 243 Total operating expenses 108 64 321 187 249 Pre-tax operating profit (177) (30) (526) (110) 18 Taxes (50) (8) (147) (31) 5 Profit for the period (128) (22) (379) (80) 13
Earnings/diluted earnings per share (NOK) (0.08) (0.01) (0.23) (0.05) 0.01Earnings per share excluding operations held for sale (NOK) (0.08) (0.01) (0.23) (0.05) 0.01
1) Dividends from group companies/group contributions.
Balance sheet DNB ASA 30 Sept. 31 Dec. 30 Sept.
Amounts in NOK million 2012 2011 2011
AssetsDeposits with DNB Bank ASA 3 993 7 356 18 289 Lending to other group companies 225 225 225 Investments in group companies 62 216 62 216 51 216 Receivables due from group companies 0 183 0 Other assets 147 0 31 Total assets 66 582 69 981 69 761
Liabilities and equityLoans from and outstandings to DNB Bank ASA 10 721 10 477 10 353 Other liabilities and provisions 1 3 263 3 Paid-in capital 38 844 38 844 38 844 Retained earnings 17 016 17 395 20 560 Total liabilities and equity 66 582 69 981 69 761
Statement of changes in equity DNB ASA Share
Share premium Other Total Amounts in NOK million capital reserve equity equity Balance sheet as at 31 December 2010 16 288 22 556 20 640 59 484 Profit for the period (80) (80) Balance sheet as at 30 September 2011 16 288 22 556 20 560 59 405
Balance sheet as at 31 December 2011 16 288 22 556 17 395 56 240 Profit for the period (379) (379) Balance sheet as at 30 September 2012 16 288 22 556 17 016 55 861
Accounting principles DNB ASA has prepared accounts according to the Norwegian Ministry of Finance's regulations on annual accounts, Section 1-5, on the use of IFRS (International Financial Reporting Standards). These regulations give permission to record provisions for dividends and group contributions in subsidiaries as income and record the Board of Directors' proposed dividends and group contributions as liabilities on the balance sheet date. According to IFRS, dividends should be classified as equity until approved by the general meeting. A description of the accounting principles applied by DNB ASA in preparing the accounts is found in the annual report for 2011.
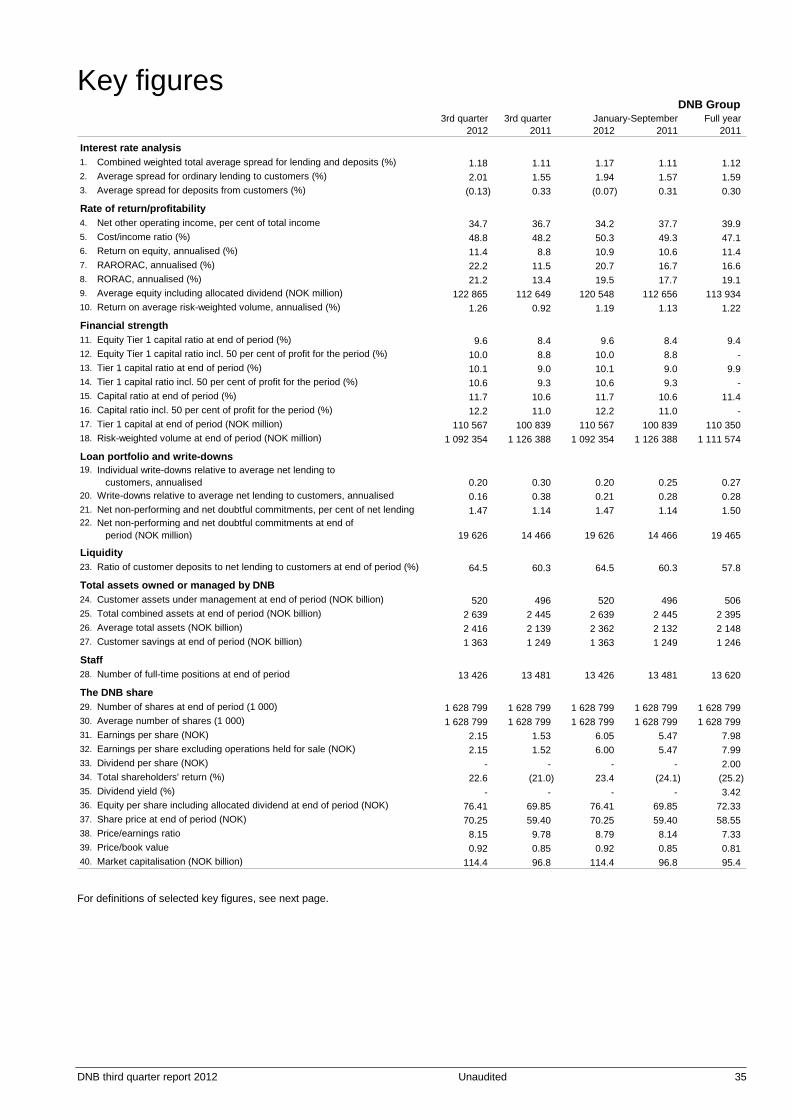
DNB third quarter report 2012 Unaudited 35
Key figures DNB Group
3rd quarter 3rd quarter January-September Full year 2012 2011 2012 2011 2011
Interest rate analysis1. Combined weighted total average spread for lending and deposits (%) 1.18 1.11 1.17 1.11 1.122. Average spread for ordinary lending to customers (%) 2.01 1.55 1.94 1.57 1.593. Average spread for deposits from customers (%) (0.13) 0.33 (0.07) 0.31 0.30
Rate of return/profitability4. Net other operating income, per cent of total income 34.7 36.7 34.2 37.7 39.95. Cost/income ratio (%) 48.8 48.2 50.3 49.3 47.16. Return on equity, annualised (%) 11.4 8.8 10.9 10.6 11.47. RARORAC, annualised (%) 22.2 11.5 20.7 16.7 16.68. RORAC, annualised (%) 21.2 13.4 19.5 17.7 19.19. Average equity including allocated dividend (NOK million) 122 865 112 649 120 548 112 656 113 934 10. Return on average risk-weighted volume, annualised (%) 1.26 0.92 1.19 1.13 1.22
Financial strength11. Equity Tier 1 capital ratio at end of period (%) 9.6 8.4 9.6 8.4 9.412. Equity Tier 1 capital ratio incl. 50 per cent of profit for the period (%) 10.0 8.8 10.0 8.8 -13. Tier 1 capital ratio at end of period (%) 10.1 9.0 10.1 9.0 9.914. Tier 1 capital ratio incl. 50 per cent of profit for the period (%) 10.6 9.3 10.6 9.3 -15. Capital ratio at end of period (%) 11.7 10.6 11.7 10.6 11.416. Capital ratio incl. 50 per cent of profit for the period (%) 12.2 11.0 12.2 11.0 -17. Tier 1 capital at end of period (NOK million) 110 567 100 839 110 567 100 839 110 350 18. Risk-weighted volume at end of period (NOK million) 1 092 354 1 126 388 1 092 354 1 126 388 1 111 574
Loan portfolio and write-downs19. Individual write-downs relative to average net lending to
customers, annualised 0.20 0.30 0.20 0.25 0.2720. Write-downs relative to average net lending to customers, annualised 0.16 0.38 0.21 0.28 0.2821. Net non-performing and net doubtful commitments, per cent of net lending 1.47 1.14 1.47 1.14 1.5022. Net non-performing and net doubtful commitments at end of
period (NOK million) 19 626 14 466 19 626 14 466 19 465
Liquidity23. Ratio of customer deposits to net lending to customers at end of period (%) 64.5 60.3 64.5 60.3 57.8
Total assets owned or managed by DNB24. Customer assets under management at end of period (NOK billion) 520 496 520 496 506 25. Total combined assets at end of period (NOK billion) 2 639 2 445 2 639 2 445 2 395 26. Average total assets (NOK billion) 2 416 2 139 2 362 2 132 2 148 27. Customer savings at end of period (NOK billion) 1 363 1 249 1 363 1 249 1 246
Staff28. Number of full-time positions at end of period 13 426 13 481 13 426 13 481 13 620
The DNB share29. Number of shares at end of period (1 000) 1 628 799 1 628 799 1 628 799 1 628 799 1 628 799 30. Average number of shares (1 000) 1 628 799 1 628 799 1 628 799 1 628 799 1 628 799 31. Earnings per share (NOK) 2.15 1.53 6.05 5.47 7.9832. Earnings per share excluding operations held for sale (NOK) 2.15 1.52 6.00 5.47 7.9933. Dividend per share (NOK) - - - - 2.0034. Total shareholders' return (%) 22.6 (21.0) 23.4 (24.1) (25.2)35. Dividend yield (%) - - - - 3.4236. Equity per share including allocated dividend at end of period (NOK) 76.41 69.85 76.41 69.85 72.3337. Share price at end of period (NOK) 70.25 59.40 70.25 59.40 58.5538. Price/earnings ratio 8.15 9.78 8.79 8.14 7.3339. Price/book value 0.92 0.85 0.92 0.85 0.8140. Market capitalisation (NOK billion) 114.4 96.8 114.4 96.8 95.4
For definitions of selected key figures, see next page.

36 Unaudited DNB third quarter report 2012
Key figures (continued) Definitions
1, 2, 3 Based on nominal values excluding impaired loans, measured against the 3-month money market rate.
5 Total operating expenses relative to total income. Total expenses exclude impairment losses for goodwill and other intangible assets.
6 Average equity is calculated on the basis of recorded equity.
7 RARORAC (Risk-Adjusted Return On Risk-Adjusted Capital) is defined as risk-adjusted profits relative to risk-adjusted capital requirement. Risk-adjusted profits indicate the level of profits in a normalised situation. The risk-adjusted capital requirement is described in further detail in note 4 Segments.
8 RORAC (Return On Risk-Adjusted Capital) is defined as profits for the period relative to risk-adjusted capital requirement. Profits for the period are adjusted for the difference between recorded interest on average equity and interest on risk-adjusted capital.
10 Profit for the period relative to average risk-weighted volume.
24 Total assets under management for customers in Insurance and Asset Management.
25 Total assets and customer assets under management.
27 Total deposits from customers, assets under management and equity-linked bonds.
29 The Annual General Meeting on 25 April 2012 authorised the Board of Directors of DNB ASA to acquire own shares for a total face value of up to NOK 732 959 487, corresponding to 4.5 per cent of share capital. The shares may be purchased through the stock market. Each share may be purchased at a price between NOK 10 and NOK 150. The authorisation is valid for a period of 12 months from 25 April 2012. Acquired shares shall be redeemed in accordance with regulations on the reduction of capital. An agreement has been signed with Norwegian Government/Ministry of Trade and Industry for the redemption of a proportional share of government holdings to ensure that the government's percentage ownership does not change as a result of the redemption of repurchased shares.
31 Holdings of own shares are not included in calculations of earnings per share.
32 Excluding operations held for sale. Holdings of own shares are not included in calculations of the number of shares.
34 Closing price at end of period less closing price at beginning of period, including dividends reinvested in DNB shares on the dividend payment date, relative to closing price at beginning of period.
36 Equity at end of period relative to number of shares at end of period.
38 Closing price at end of period relative to annualised earnings per share.
39 Closing price at end of period relative to recorded equity at end of period.
40 Number of shares multiplied by the closing share price at end of period.
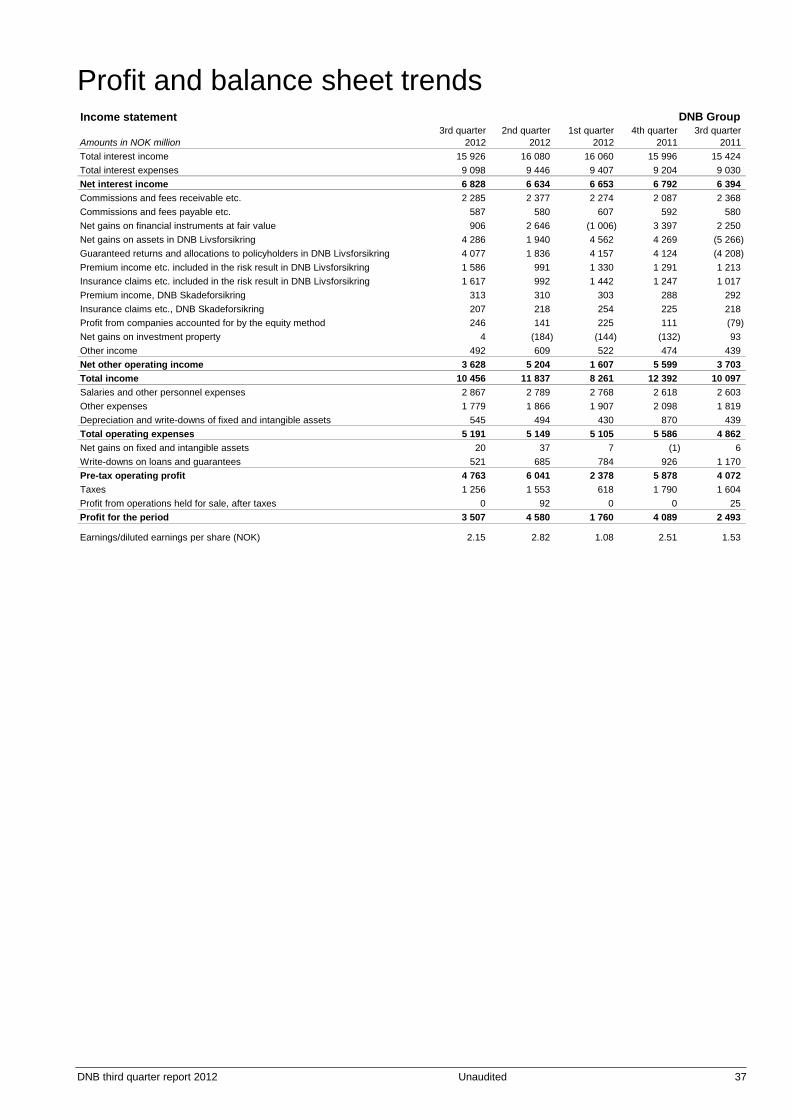
DNB third quarter report 2012 Unaudited 37
Profit and balance sheet trends Income statement DNB Group
3rd quarter 2nd quarter 1st quarter 4th quarter 3rd quarter Amounts in NOK million 2012 2012 2012 2011 2011 Total interest income 15 926 16 080 16 060 15 996 15 424 Total interest expenses 9 098 9 446 9 407 9 204 9 030 Net interest income 6 828 6 634 6 653 6 792 6 394 Commissions and fees receivable etc. 2 285 2 377 2 274 2 087 2 368 Commissions and fees payable etc. 587 580 607 592 580 Net gains on financial instruments at fair value 906 2 646 (1 006) 3 397 2 250 Net gains on assets in DNB Livsforsikring 4 286 1 940 4 562 4 269 (5 266) Guaranteed returns and allocations to policyholders in DNB Livsforsikring 4 077 1 836 4 157 4 124 (4 208) Premium income etc. included in the risk result in DNB Livsforsikring 1 586 991 1 330 1 291 1 213 Insurance claims etc. included in the risk result in DNB Livsforsikring 1 617 992 1 442 1 247 1 017 Premium income, DNB Skadeforsikring 313 310 303 288 292 Insurance claims etc., DNB Skadeforsikring 207 218 254 225 218 Profit from companies accounted for by the equity method 246 141 225 111 (79) Net gains on investment property 4 (184) (144) (132) 93 Other income 492 609 522 474 439 Net other operating income 3 628 5 204 1 607 5 599 3 703 Total income 10 456 11 837 8 261 12 392 10 097 Salaries and other personnel expenses 2 867 2 789 2 768 2 618 2 603 Other expenses 1 779 1 866 1 907 2 098 1 819 Depreciation and write-downs of fixed and intangible assets 545 494 430 870 439 Total operating expenses 5 191 5 149 5 105 5 586 4 862 Net gains on fixed and intangible assets 20 37 7 (1) 6 Write-downs on loans and guarantees 521 685 784 926 1 170 Pre-tax operating profit 4 763 6 041 2 378 5 878 4 072 Taxes 1 256 1 553 618 1 790 1 604 Profit from operations held for sale, after taxes 0 92 0 0 25 Profit for the period 3 507 4 580 1 760 4 089 2 493
Earnings/diluted earnings per share (NOK) 2.15 2.82 1.08 2.51 1.53

38 Unaudited DNB third quarter report 2012
Profit and balance sheet trends (continued) Balance sheet DNB Group
30 Sept. 30 June 31 March 31 Dec. 30 Sept. Amounts in NOK million 2012 2012 2012 2011 2011
AssetsCash and deposits with central banks 367 409 410 135 433 396 224 581 276 593 Lending to and deposits with credit institutions 42 424 32 258 35 018 28 754 56 432 Lending to customers 1 307 047 1 308 599 1 284 526 1 279 259 1 247 477 Commercial paper and bonds at fair value 198 774 196 935 199 431 177 980 157 164 Shareholdings 47 884 49 417 53 024 53 012 72 069 Financial assets, customers bearing the risk 27 600 25 391 25 770 23 776 22 712 Financial derivatives 101 302 90 707 81 555 96 693 110 664 Commercial paper and bonds, held to maturity 190 312 170 499 168 644 166 965 165 849 Investment property 45 060 45 573 43 049 42 796 42 802 Investments in associated companies 2 795 2 552 2 407 2 189 2 050 Intangible assets 7 035 7 097 7 020 7 003 7 151 Deferred tax assets 631 633 640 643 505 Fixed assets 6 966 6 780 6 569 6 336 6 010 Assets held for sale 15 9 1 092 1 054 1 206 Other assets 23 871 25 762 28 811 15 055 14 417 Total assets 2 369 123 2 372 347 2 370 952 2 126 098 2 183 100
Liabilities and equityLoans and deposits from credit institutions 293 530 294 125 353 395 279 553 356 347 Deposits from customers 843 340 853 877 805 985 740 036 752 660 Financial derivatives 66 207 60 857 56 039 64 365 75 908 Debt securities issued 727 925 729 309 717 598 635 157 596 266 Insurance liabilities, customers bearing the risk 27 600 25 391 25 770 23 776 22 712 Liabilities to life insurance policyholders in DNB Livsforsikring 220 574 218 081 218 093 212 271 209 889 Insurance liabilities, DNB Skadeforsikring 1 914 1 954 1 945 1 589 1 644 Payable taxes 3 267 1 584 356 634 3 729 Deferred taxes 3 860 4 029 4 856 4 897 205 Other liabilities 26 849 32 591 34 342 17 550 19 188 Liabilities held for sale 0 0 361 383 360 Provisions 662 610 525 787 560 Pension commitments 3 133 3 138 3 149 3 123 3 360 Subordinated loan capital 25 799 25 968 29 021 24 163 26 495 Total liabilities 2 244 659 2 251 516 2 251 434 2 008 284 2 069 325
Share capital 16 288 16 261 16 275 16 260 16 273 Share premium reserve 22 609 22 609 22 609 22 609 22 609 Other equity 85 567 81 961 80 634 78 946 74 894 Total equity 124 464 120 831 119 518 117 815 113 776 Total liabilities and equity 2 369 123 2 372 347 2 370 952 2 126 098 2 183 100

DNB third quarter report 2012 Unaudited 39
Information about the DNB Group Head office DNB ASA Mailing address P.O.Box 1600 Sentrum, NO-0021 Oslo Visiting address Dronning Eufemias gate 30, Oslo Telephone +47 915 03000 Internet dnb.no Organisation number Register of Business Enterprises NO 981 276 957 MVA
Board of Directors in DNB ASA Anne Carine Tanum, chairman Tore Olaf Rimmereid, vice-chairman Jarle Bergo Bente Brevik Sverre Finstad Carl A. Løvvik Vigdis Mathisen Berit Svendsen
Group management Rune Bjerke Group chief executive Bjørn Erik Næss Chief financial officer Karin Bing Orgland Group executive vice president, Retail Banking Leif Teksum Group executive vice president, Large Corporates and International Ottar Ertzeid Group executive vice president, DNB Markets Tom Rathke Group executive vice president, Insurance and Asset Management Liv Fiksdahl Group executive vice president, Operations Solveig Hellebust Group executive vice president, HR Cathrine Klouman Group executive vice president, IT Trond Bentestuen Group executive vice president, Marketing, Communications and eBusiness Kari Olrud Moen Group executive vice president, Corporate Centre
Investor Relations Bjørn Erik Næss, chief financial officer tel. +47 2326 8401 [email protected] Per Sagbakken, head of IR/Long-term Funding tel. +47 2326 8400 [email protected] Thor Tellefsen tel. +47 2326 8404 [email protected] Trond Sannes Marthinsen tel. +47 2326 8403 [email protected] Kristine Øvrebø tel.+47 2326 8519 [email protected]
Financial calendar 2013 Preliminary results 2012 and fourth quarter 2012 7 February Annual General Meeting 30 April Ex-dividend date 2 May Distribution of dividends as of 13 May First quarter 2013 26 April Second quarter 2013 11 July Third quarter 2013 24 October
Other sources of information Annual and quarterly reports Separate annual and quarterly reports are prepared for the DNB Bank Group, DNB Boligkreditt and DNB Livsforsikring. The reports and supplementary information for investors and analysts are available on dnb.no. Annual and quarterly reports can be ordered by sending an e-mail to [email protected]. The quarterly report has been produced by Group Financial Reporting in DNB. Translation: Gina Fladmoe, Nathalie Samuelsen and Pål Jørgen Bakke, DNB.

DNBDronning Eufemias gate 30Bjørvika, OsloP.O.Box 1600 SentrumN-0021 Oslo
dnb.no