DNA Tribes® SNP Report for Example North Moroccan · PDF fileDNA Tribes® Example North...
38
© 2006-2012 DNA Tribes. DNA Tribes®. DNA Tribes genetic ancestry analysis is available exclusively from DNA Tribes. All rights reserved. Satellite images courtesy NASA Earth Observatory. DNA Tribes ® SNP Report for Example North Moroccan Person http://www.dnatribes.com/snp.html Customer Support: [email protected] 8/30/2012 Page 1 of 38 DNA Tribes® SNP Report for Example North Moroccan Person Introduction DNA Tribes® SNP is a geographical analysis that uses autosomal SNPs (Single Nucleotide Polymorphisms) to identify your Deep Ancestry (ancient ancestry). Your autosomal DNA is inherited 50% from your paternal and 50% from your maternal ancestors, including genetic material from all four grandparents. This Deep Ancestry analysis emphasizes the more ancient genetic links between world populations, rather than a more limited search for family relatives or recent nationality or ethnicity. Your report includes several types of analysis, each providing a different perspective on your Deep Ancestry: (1) Admixture Analysis based on DNA Tribes® proprietary analysis of world population structure; (2) Multi-Dimensional Scaling (MDS) to visualize your genotype's position among populations and regions; and (3) Total Similarity Analysis based on how your genotype as a whole compares to members of ethnic groups around the world. Table of Contents Introduction .............................................................................................................................................. 1 Admixture Analysis: 8 Continental Zones ................................................................................................. 3 Admixture Analysis: 24 World Regions ..................................................................................................... 4 Description of World Regions ................................................................................................................... 5 Admixture Analysis: Native Populations ................................................................................................... 6 Admixture Analysis: All Populations (including Diasporic) ....................................................................... 7 Multi-Dimensional Scaling (MDS): 8 Continental Zones ........................................................................... 8 Multi-Dimensional Scaling (MDS): 24 World Regions ............................................................................... 9 Multi-Dimensional Scaling (MDS): Native Populations ........................................................................... 10 Multi-Dimensional Scaling (MDS): All Populations (including Diasporic) ............................................... 11 Total Similarity: Shaded World Grid ....................................................................................................... 12 Total Similarity: African Populations....................................................................................................... 13 Total Similarity: Caucasus Mountains Populations ................................................................................. 16 Total Similarity: East Asian Populations .................................................................................................. 16 Total Similarity: European Populations................................................................................................... 19 Total Similarity: Middle Eastern Populations.......................................................................................... 21
Transcript of DNA Tribes® SNP Report for Example North Moroccan · PDF fileDNA Tribes® Example North...

© 2006-2012 DNA Tribes. DNA Tribes®. DNA Tribes genetic ancestry analysis is available exclusively from DNA Tribes. All rights reserved.
Satellite images courtesy NASA Earth Observatory.
DNA Tribes® SNP Report for Example North Moroccan Person http://www.dnatribes.com/snp.html
Customer Support: [email protected] 8/30/2012 Page 1 of 38
DNA Tribes® SNP Report for Example North Moroccan Person
Introduction DNA Tribes® SNP is a geographical analysis that uses autosomal SNPs (Single Nucleotide Polymorphisms) to identify your Deep Ancestry (ancient ancestry). Your autosomal DNA is inherited 50% from your paternal and 50% from your maternal ancestors, including genetic material from all four grandparents. This Deep Ancestry analysis emphasizes the more ancient genetic links between world populations, rather than a more limited search for family relatives or recent nationality or ethnicity. Your report includes several types of analysis, each providing a different perspective on your Deep Ancestry: (1) Admixture Analysis based on DNA Tribes® proprietary analysis of world population structure; (2) Multi-Dimensional Scaling (MDS) to visualize your genotype's position among populations and regions; and (3) Total Similarity Analysis based on how your genotype as a whole compares to members of ethnic groups around the world.
Table of Contents Introduction .............................................................................................................................................. 1
Admixture Analysis: 8 Continental Zones ................................................................................................. 3
Admixture Analysis: 24 World Regions ..................................................................................................... 4
Description of World Regions ................................................................................................................... 5
Admixture Analysis: Native Populations ................................................................................................... 6
Admixture Analysis: All Populations (including Diasporic) ....................................................................... 7
Multi-Dimensional Scaling (MDS): 8 Continental Zones ........................................................................... 8
Multi-Dimensional Scaling (MDS): 24 World Regions ............................................................................... 9
Multi-Dimensional Scaling (MDS): Native Populations ........................................................................... 10
Multi-Dimensional Scaling (MDS): All Populations (including Diasporic) ............................................... 11
Total Similarity: Shaded World Grid ....................................................................................................... 12
Total Similarity: African Populations ....................................................................................................... 13
Total Similarity: Caucasus Mountains Populations ................................................................................. 16
Total Similarity: East Asian Populations .................................................................................................. 16
Total Similarity: European Populations ................................................................................................... 19
Total Similarity: Middle Eastern Populations .......................................................................................... 21
© 2006-2012 DNA Tribes. DNA Tribes®. DNA Tribes genetic ancestry analysis is available exclusively from DNA Tribes. All rights reserved.
Satellite images courtesy NASA Earth Observatory.
DNA Tribes® SNP Report for Example North Moroccan Person http://www.dnatribes.com/snp.html
Customer Support: [email protected] 8/30/2012 Page 2 of 38
Total Similarity: Native American Populations ....................................................................................... 23
Total Similarity: North Asian Populations ............................................................................................... 24
Total Similarity: Oceanian Populations ................................................................................................... 26
Total Similarity: South Asian Populations ............................................................................................... 27
Total Similarity: Diasporic Populations ................................................................................................... 30
Total Similarity: List of All Populations ................................................................................................... 32

© 2006-2012 DNA Tribes. DNA Tribes®. DNA Tribes genetic ancestry analysis is available exclusively from DNA Tribes. All rights reserved.
Satellite images courtesy NASA Earth Observatory.
DNA Tribes® SNP Report for Example North Moroccan Person http://www.dnatribes.com/snp.html
Customer Support: [email protected] 8/30/2012 Page 3 of 38
Admixture Analysis: 8 Continental Zones This portion of your report identifies ancestral contributions to your genome from 8 continental zones (illustrated in the map below). These continental zones can include multiple cultures and languages and cross perceived boundaries between modern nations and ethnic groups. Your results below can express recent genealogical ancestry, as well as more ancient relationships among world populations.
Continent Percentage Middle Eastern 92.2% Sub-Saharan African 5.7% Northeast African 2.1% East Asian 0.0% North Asian 0.0% South Asian 0.0% European 0.0% Native American 0.0%

© 2006-2012 DNA Tribes. DNA Tribes®. DNA Tribes genetic ancestry analysis is available exclusively from DNA Tribes. All rights reserved.
Satellite images courtesy NASA Earth Observatory.
DNA Tribes® SNP Report for Example North Moroccan Person http://www.dnatribes.com/snp.html
Customer Support: [email protected] 8/30/2012 Page 4 of 38
Admixture Analysis: 24 World Regions This portion of your report identifies ancestral contributions to your genome from 24 world regions (illustrated in the map below) identified by DNA Tribes® proprietary statistical analysis of world population structure. These genetic regions can include multiple cultures and languages and can cross perceived boundaries between modern countries and ethnic groups (see page 5 for more detailed descriptions). Your results below can express recent genealogical ancestry, as well as more ancient relationships among world populations.
Region Percentage North African 63.4% Egyptian 16.6% Iberian 9.0% Horn of Africa 7.4% Northwest European 3.6% East Asian 0.0% North India 0.0% East African 0.0% West Siberian 0.0% Persian 0.0% Tibetan 0.0% Balochi 0.0% North Caucasus 0.0%
Baltic-Urals 0.0% West African 0.0% Indus Valley 0.0% Southeast Asian 0.0% South India 0.0% Mesoamerican 0.0% Arabian 0.0% Oceanian 0.0% East Mediterranean 0.0% East Siberian 0.0% Arctic 0.0%

© 2006-2012 DNA Tribes. DNA Tribes®. DNA Tribes genetic ancestry analysis is available exclusively from DNA Tribes. All rights reserved.
Satellite images courtesy NASA Earth Observatory.
DNA Tribes® SNP Report for Example North Moroccan Person http://www.dnatribes.com/snp.html
Customer Support: [email protected] 8/30/2012 Page 5 of 38
Description of World Regions More detailed descriptions of the 24 world regions used in your admixture analysis (see page 4) are provided below. These regions have been identified by DNA Tribes® proprietary statistical analysis to provide the most detailed and representative comparison of your DNA to world population structure. World Region Description of World Region Other Related Populations Arabian The Arabian Peninsula. Gulf Arabs; Bedouin. Southwest Asia.
Arctic Far East Siberians; Inuit (Eskimo) populations of North America.
Other North American Indians; Northern Asia.
Balochi Southwest Asia near the Arabian Sea.
Baltic-Urals Northeastern Europe between the Baltic Sea and Ural Mountains.
Central and Northern Europe; Siberia.
East African Eastern and Southern Africa. West Africa. East Asian China and Japan. Mainland Southeast Asia. East Mediterranean Cyprus; the Levant; Transcaucasus. Sicily; Italy; West Asia; Balkan
Peninsula. East Siberian Indigenous East Siberians. Central Asia; Northeast Asia. Egyptian Nile Valley; Western Arabian Peninsula. Red Sea; Levant. Horn of Africa Somalia; Ethiopia; Maasai. Eastern Africa; Nile Valley. Iberian West Mediterranean. Throughout Continental Europe.
Indus Valley Indus River Valley; Hindu Kush Mountains. Central Asia; Nepal; Northern India.
Mesoamerican Indigenous populations of North, Central and South America.
North African The Maghreb and Sahara Desert. Southwestern Europe. North Caucasus The Northern Caucasus Mountains. West Asia. North India Northern India. Brahmins throughout India. Northwest European The British Isles; Western Europe; Scandinavia. Throughout Continental Europe.
Oceanian Melanesian populations of the Pacific Ocean. Polynesians. Persian Lake Urmia; Zagros and Elburz Mountains. West Asia. South India Southern and Eastern India. Northern India; Southeast Asia. Southeast Asian
Malay Archipelago; Polynesia; Mainland Southeast Asia. Eastern India.
Tibetan Tibetan Plateau. Highland East Asia. West African Western Africa. Southern Africa. West Siberian Yenisei River; Altai Mountains. Central Asia; East Siberia.
© 2006-2012 DNA Tribes. DNA Tribes®. DNA Tribes genetic ancestry analysis is available exclusively from DNA Tribes. All rights reserved.
Satellite images courtesy NASA Earth Observatory.
DNA Tribes® SNP Report for Example North Moroccan Person http://www.dnatribes.com/snp.html
Customer Support: [email protected] 8/30/2012 Page 6 of 38
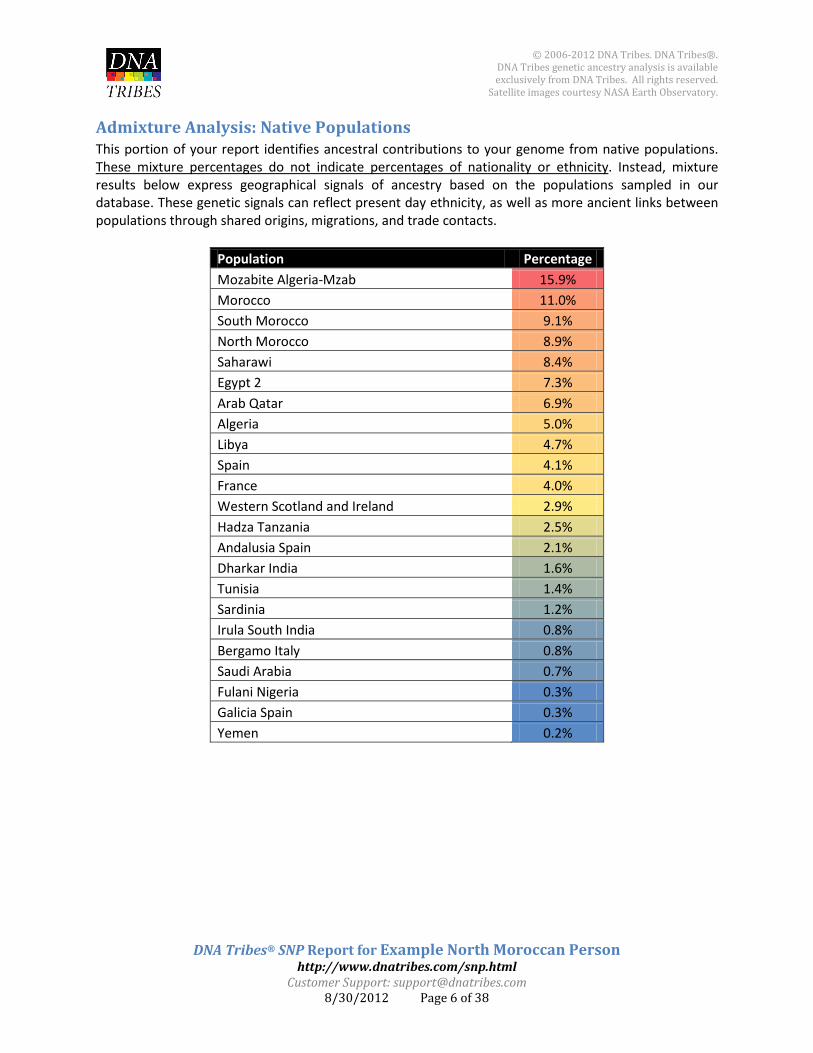
Admixture Analysis: Native Populations This portion of your report identifies ancestral contributions to your genome from native populations. These mixture percentages do not indicate percentages of nationality or ethnicity. Instead, mixture results below express geographical signals of ancestry based on the populations sampled in our database. These genetic signals can reflect present day ethnicity, as well as more ancient links between populations through shared origins, migrations, and trade contacts.
Population Percentage Mozabite Algeria-Mzab 15.9% Morocco 11.0% South Morocco 9.1% North Morocco 8.9% Saharawi 8.4% Egypt 2 7.3% Arab Qatar 6.9% Algeria 5.0% Libya 4.7% Spain 4.1% France 4.0% Western Scotland and Ireland 2.9% Hadza Tanzania 2.5% Andalusia Spain 2.1% Dharkar India 1.6% Tunisia 1.4% Sardinia 1.2% Irula South India 0.8% Bergamo Italy 0.8% Saudi Arabia 0.7% Fulani Nigeria 0.3% Galicia Spain 0.3% Yemen 0.2%

© 2006-2012 DNA Tribes. DNA Tribes®. DNA Tribes genetic ancestry analysis is available exclusively from DNA Tribes. All rights reserved.
Satellite images courtesy NASA Earth Observatory.
DNA Tribes® SNP Report for Example North Moroccan Person http://www.dnatribes.com/snp.html
Customer Support: [email protected] 8/30/2012 Page 7 of 38
Admixture Analysis: All Populations (including Diasporic) This portion of your report identifies ancestral contributions to your genome from all world populations in our database, including modern populations that have mixed and migrated within the past 500 years. These mixture percentages do not indicate percentages of nationality or ethnicity. Instead, mixture results below express geographical signals of ancestry based on the populations sampled in our database. These genetic signals can reflect present day ethnicity, as well as more ancient links between populations through shared origins, migrations, and trade contacts.
Population Percentage Mozabite Algeria-Mzab 15.7% Morocco 10.8% North Morocco 8.8% South Morocco 8.7% Saharawi 8.3% Egypt 2 6.6% Arab Qatar 5.9% Algeria 4.8% Libya 4.4% Spain 4.1% France 3.9% Western Scotland and Ireland 2.9% Andalusia Spain 2.1% Hadza Tanzania 1.8% Oromo Ethiopia 1.7% Amhara Ethiopia 1.5% Dharkar India 1.5% Tunisia 1.3% Sardinia 1.3% Jewish Azerbaijan 0.9% Lebanon 0.8% Bergamo Italy 0.7% Irula South India 0.7% Saudi Arabia 0.5% Galicia Spain 0.4%
© 2006-2012 DNA Tribes. DNA Tribes®. DNA Tribes genetic ancestry analysis is available exclusively from DNA Tribes. All rights reserved.
Satellite images courtesy NASA Earth Observatory.
DNA Tribes® SNP Report for Example North Moroccan Person http://www.dnatribes.com/snp.html
Customer Support: [email protected] 8/30/2012 Page 8 of 38
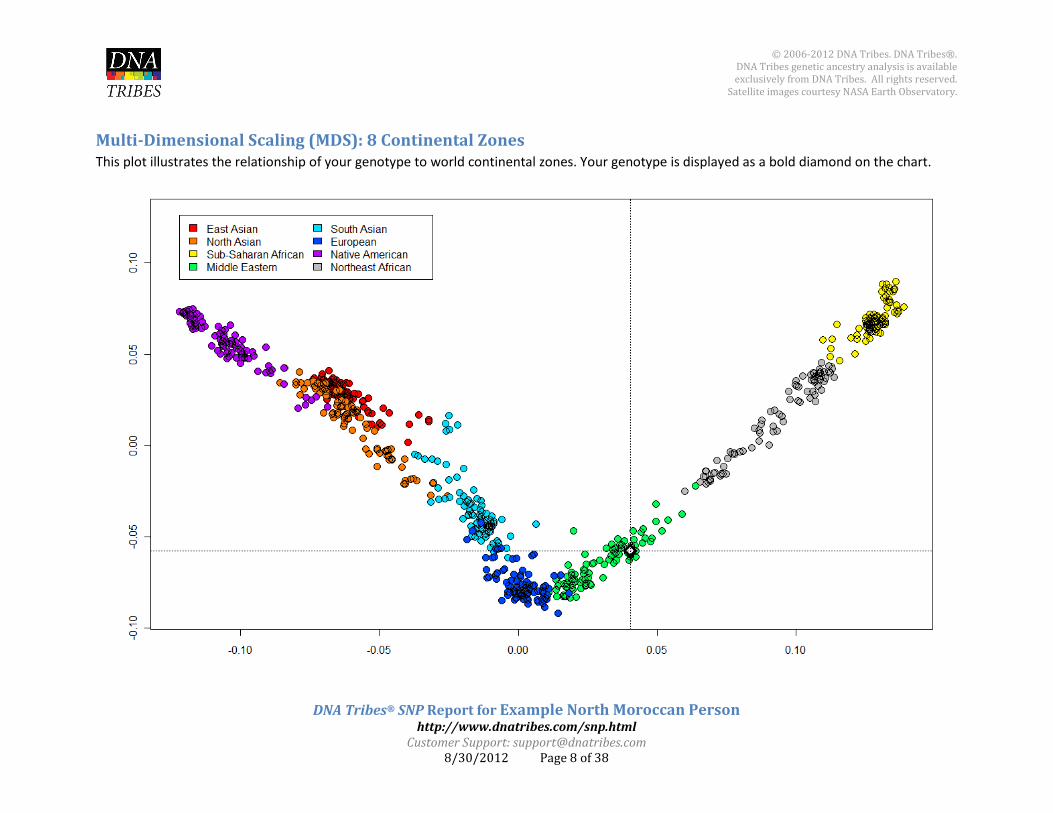
Multi-Dimensional Scaling (MDS): 8 Continental Zones This plot illustrates the relationship of your genotype to world continental zones. Your genotype is displayed as a bold diamond on the chart.

© 2006-2012 DNA Tribes. DNA Tribes®. DNA Tribes genetic ancestry analysis is available exclusively from DNA Tribes. All rights reserved.
Satellite images courtesy NASA Earth Observatory.
DNA Tribes® SNP Report for Example North Moroccan Person http://www.dnatribes.com/snp.html
Customer Support: [email protected] 8/30/2012 Page 9 of 38
Multi-Dimensional Scaling (MDS): 24 World Regions This plot illustrates the relationship of your genotype to the closest world regions. Your genotype is displayed as a bold diamond on the chart.

© 2006-2012 DNA Tribes. DNA Tribes®. DNA Tribes genetic ancestry analysis is available exclusively from DNA Tribes. All rights reserved.
Satellite images courtesy NASA Earth Observatory.
DNA Tribes® SNP Report for Example North Moroccan Person http://www.dnatribes.com/snp.html
Customer Support: [email protected] 8/30/2012 Page 10 of 38
Multi-Dimensional Scaling (MDS): Native Populations This plot illustrates the relationship of your genotype to the closest native populations. Your genotype is displayed as a bold diamond on the chart.

© 2006-2012 DNA Tribes. DNA Tribes®. DNA Tribes genetic ancestry analysis is available exclusively from DNA Tribes. All rights reserved.
Satellite images courtesy NASA Earth Observatory.
DNA Tribes® SNP Report for Example North Moroccan Person http://www.dnatribes.com/snp.html
Customer Support: [email protected] 8/30/2012 Page 11 of 38
Multi-Dimensional Scaling (MDS): All Populations (including Diasporic) This plot illustrates the relationship of your genotype to the closest world populations, in some cases including ethnic groups that have migrated or mixed in recent history. Your genotype is displayed as a bold diamond on the chart.
© 2006-2012 DNA Tribes. DNA Tribes®. DNA Tribes genetic ancestry analysis is available exclusively from DNA Tribes. All rights reserved.
Satellite images courtesy NASA Earth Observatory.
DNA Tribes® SNP Report for Example North Moroccan Person http://www.dnatribes.com/snp.html
Customer Support: [email protected] 8/30/2012 Page 12 of 38
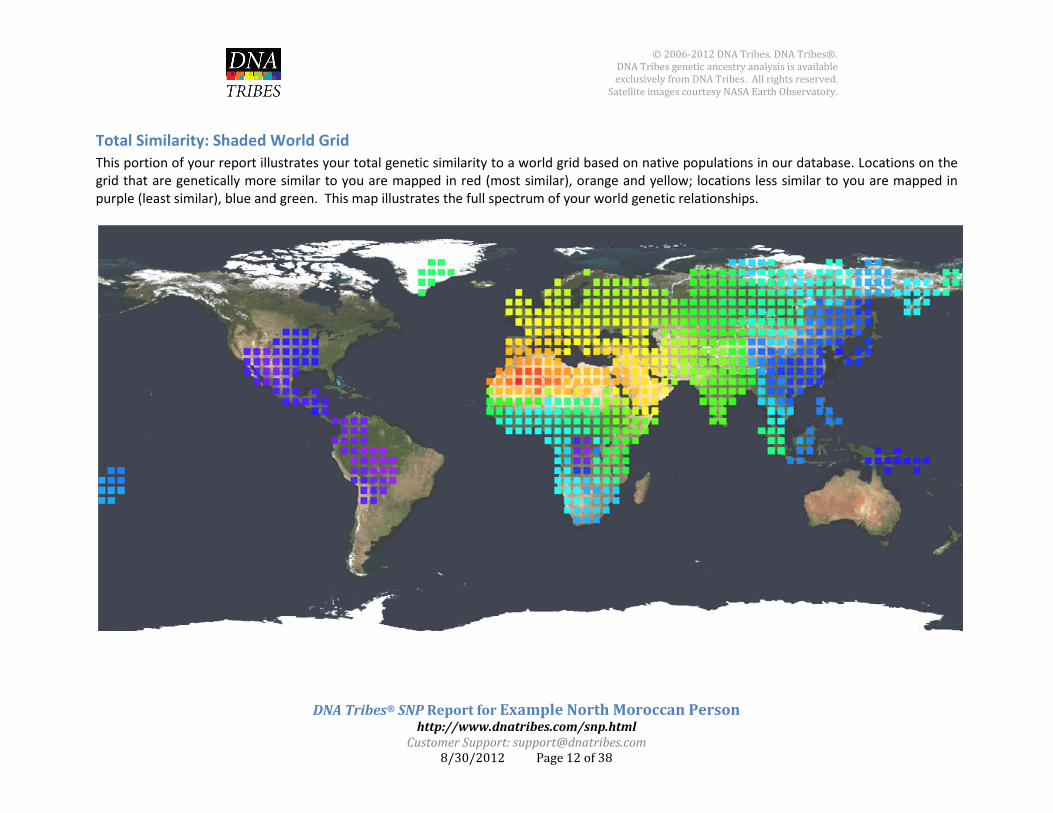
Total Similarity: Shaded World Grid This portion of your report illustrates your total genetic similarity to a world grid based on native populations in our database. Locations on the grid that are genetically more similar to you are mapped in red (most similar), orange and yellow; locations less similar to you are mapped in purple (least similar), blue and green. This map illustrates the full spectrum of your world genetic relationships.

© 2006-2012 DNA Tribes. DNA Tribes®. DNA Tribes genetic ancestry analysis is available exclusively from DNA Tribes. All rights reserved.
Satellite images courtesy NASA Earth Observatory.
DNA Tribes® SNP Report for Example North Moroccan Person http://www.dnatribes.com/snp.html
Customer Support: [email protected] 8/30/2012 Page 13 of 38
Total Similarity: African Populations This portion of your report identifies your total genetic similarity to African populations in our database. Each population on the map is labeled with a number expressing the ranking among your world population matches (see page 32 for a complete list). In the table, each population is listed with a Member Similarity score that expresses the percentage of your DNA shared with members of that population. Circled populations (labeled "Match" in the table) identify ethnic groups where your genotype fits well among members, based on a proprietary statistical test developed by DNA Tribes®.
Rank Population Member Similarity Match Map Section
1 Morocco 0.7100 Match Africa 2 North Morocco 0.7090 Match Africa 6 Saharawi 0.7077 - Africa

© 2006-2012 DNA Tribes. DNA Tribes®. DNA Tribes genetic ancestry analysis is available exclusively from DNA Tribes. All rights reserved.
Satellite images courtesy NASA Earth Observatory.
DNA Tribes® SNP Report for Example North Moroccan Person http://www.dnatribes.com/snp.html
Customer Support: [email protected] 8/30/2012 Page 14 of 38
7 Mozabite Algeria-Mzab 0.7077 - Africa 9 Libya 0.7076 - Africa
25 Algeria 0.7066 - Africa 36 Tunisia 0.7055 - Africa 49 South Morocco 0.7042 - Africa 78 Tigray Ethiopia 0.7016 - Africa 81 Amhara Ethiopia 0.7008 - Africa
103 Somalia 0.6946 - Africa 106 Oromo Ethiopia 0.6942 - Africa 134 Fulani Nigeria 0.6897 - Africa 146 Maasai Kenya 0.6871 - Africa 159 Hema East-Central Africa 0.6829 - Africa 161 Sandawe Tanzania 0.6828 - Africa 170 Bulala Chad 0.6805 - Africa 179 Bantu Kenya 0.6780 - Africa 180 Brong 0.6780 - Africa 182 Luhya Kenya 0.6777 - Africa 184 Igbo Nigeria 0.6775 - Africa 185 Bambara West Africa 0.6773 - Africa 187 Kongo 0.6770 - Africa 189 Hausa Nigeria 0.6769 - Africa 190 Mandenka Senegal 0.6769 - Africa 191 Kaba Chad 0.6768 - Africa 192 Mada Cameroon 0.6768 - Africa 195 Bamoun Cameroon 0.6761 - Africa 196 Xhosa 0.6759 - Africa 197 Dogon West Africa 0.6759 - Africa 198 Yoruba Nigeria 0.6759 - Africa 201 Nguni South Africa 0.6756 - Africa 202 Tswana South Africa 0.6756 - Africa 203 Pedi South Africa 0.6755 - Africa 204 Fang Cameroon 0.6752 - Africa 205 Ovambo South Africa 0.6751 - Africa 208 Alur East-Central Africa 0.6748 - Africa 211 Herero South Africa 0.6744 - Africa 215 Sotho South Africa 0.6735 - Africa 224 Hadza Tanzania 0.6723 - Africa 233 Khomani San South Africa 0.6711 - Africa 240 Aka Central African Republic 0.6692 - Africa

© 2006-2012 DNA Tribes. DNA Tribes®. DNA Tribes genetic ancestry analysis is available exclusively from DNA Tribes. All rights reserved.
Satellite images courtesy NASA Earth Observatory.
DNA Tribes® SNP Report for Example North Moroccan Person http://www.dnatribes.com/snp.html
Customer Support: [email protected] 8/30/2012 Page 15 of 38
241 Kung Kalahari Desert 0.6678 - Africa 244 San Namibia 0.6644 - Africa 245 Mbuti East-Central Africa 0.6639 - Africa

© 2006-2012 DNA Tribes. DNA Tribes®. DNA Tribes genetic ancestry analysis is available exclusively from DNA Tribes. All rights reserved.
Satellite images courtesy NASA Earth Observatory.
DNA Tribes® SNP Report for Example North Moroccan Person http://www.dnatribes.com/snp.html
Customer Support: [email protected] 8/30/2012 Page 16 of 38
Total Similarity: Caucasus Mountains Populations This portion of your report identifies your total genetic similarity to Caucasus Mountains populations in our database. Each population on the map is labeled with a number expressing the ranking among your world population matches (see page 32 for a complete list). In the table, each population is listed with a Member Similarity score that expresses the percentage of your DNA shared with members of that population. Circled populations (labeled "Match" in the table) identify ethnic groups where your genotype fits well among members, based on a proprietary statistical test developed by DNA Tribes®.
Rank Population Member Similarity Match Map Section
31 Armenian 0.7059 - Caucasus 46 Georgia Caucasus 0.7043 - Caucasus 58 Abkhazian 0.7037 - Caucasus 63 Kumyk 0.7031 - Caucasus 65 Turkey 0.7030 - Caucasus 66 Balkar 0.7029 - Caucasus 68 Chechen 0.7027 - Caucasus 71 Adyghe North Caucasus 0.7025 - Caucasus 82 North Ossetia 0.7008 - Caucasus 83 Lezgin Caucasus 0.7005 - Caucasus 84 Nogay 0.6996 - Caucasus 86 Dargin Urkarah Dagestan 0.6990 - Caucasus

© 2006-2012 DNA Tribes. DNA Tribes®. DNA Tribes genetic ancestry analysis is available exclusively from DNA Tribes. All rights reserved.
Satellite images courtesy NASA Earth Observatory.
DNA Tribes® SNP Report for Example North Moroccan Person http://www.dnatribes.com/snp.html
Customer Support: [email protected] 8/30/2012 Page 17 of 38
Total Similarity: East Asian Populations This portion of your report identifies your total genetic similarity to East Asian populations in our database. Each population on the map is labeled with a number expressing the ranking among your world population matches (see page 32 for a complete list). In the table, each population is listed with a Member Similarity score that expresses the percentage of your DNA shared with members of that population. Circled populations (labeled "Match" in the table) identify ethnic groups where your genotype fits well among members, based on a proprietary statistical test developed by DNA Tribes®.
Rank Population Member Similarity Match Map Section
130 Uyghur China 0.6905 - East Asia 174 Thailand 0.6785 - East Asia 176 Cambodia 0.6783 - East Asia 181 Malay Singaporean 0.6777 - East Asia 183 Burma 0.6776 - East Asia 193 Vietnam 0.6762 - East Asia 194 Monguor China 0.6762 - East Asia 206 Yi China 0.6749 - East Asia 209 Tibet 0.6746 - East Asia 212 Iban Borneo 0.6743 - East Asia

© 2006-2012 DNA Tribes. DNA Tribes®. DNA Tribes genetic ancestry analysis is available exclusively from DNA Tribes. All rights reserved.
Satellite images courtesy NASA Earth Observatory.
DNA Tribes® SNP Report for Example North Moroccan Person http://www.dnatribes.com/snp.html
Customer Support: [email protected] 8/30/2012 Page 18 of 38
216 Naxi China 0.6733 - East Asia 217 Dai China 0.6733 - East Asia 218 Han Southern China 0.6731 - East Asia 220 Han Beijing China 0.6728 - East Asia 222 Tujia China 0.6725 - East Asia 225 Lahu China 0.6722 - East Asia 226 Japan 0.6722 - East Asia 228 Miao China 0.6721 - East Asia 234 She China 0.6710 - East Asia 239 Naga India 0.6692 - East Asia

© 2006-2012 DNA Tribes. DNA Tribes®. DNA Tribes genetic ancestry analysis is available exclusively from DNA Tribes. All rights reserved.
Satellite images courtesy NASA Earth Observatory.
DNA Tribes® SNP Report for Example North Moroccan Person http://www.dnatribes.com/snp.html
Customer Support: [email protected] 8/30/2012 Page 19 of 38
Total Similarity: European Populations This portion of your report identifies your total genetic similarity to European populations in our database. Each population on the map is labeled with a number expressing the ranking among your world population matches (see page 32 for a complete list). In the table, each population is listed with a Member Similarity score that expresses the percentage of your DNA shared with members of that population. Circled populations (labeled "Match" in the table) identify ethnic groups where your genotype fits well among members, based on a proprietary statistical test developed by DNA Tribes®.
Rank Population Member Similarity Match Map Section
4 Andalusia Spain 0.7082 - Europe 8 Italy General 0.7076 - Europe
10 Galicia Spain 0.7074 - Europe 11 Bergamo Italy 0.7073 - Europe 12 Spain 0.7073 - Europe 14 Greek Mixed 0.7072 - Europe 16 Basque Spain 0.7071 - Europe 18 Sardinia 0.7069 - Europe 20 France 0.7067 - Europe 21 Basque France 0.7067 - Europe 22 Western Scotland and Ireland 0.7067 - Europe

© 2006-2012 DNA Tribes. DNA Tribes®. DNA Tribes genetic ancestry analysis is available exclusively from DNA Tribes. All rights reserved.
Satellite images courtesy NASA Earth Observatory.
DNA Tribes® SNP Report for Example North Moroccan Person http://www.dnatribes.com/snp.html
Customer Support: [email protected] 8/30/2012 Page 20 of 38
23 Serbia and Croatia 0.7066 - Europe 24 Tuscany Italy 0.7066 - Europe 26 Germany and Austria 0.7065 - Europe 27 Southern Italy and Sicily 0.7064 - Europe 28 Bulgaria 0.7062 - Europe 34 Cornwall West Britain 0.7058 - Europe 35 Romania 0.7056 - Europe 37 Orkney Islands Scotland 0.7054 - Europe 40 Portugal 0.7048 - Europe 42 Netherlands 0.7048 - Europe 43 Slovenia 0.7047 - Europe 44 Hungary 0.7046 - Europe 47 Belarus 0.7042 - Europe 48 England 0.7042 - Europe 50 Ukraine 0.7042 - Europe 51 Lithuania 0.7042 - Europe 57 Russia General 0.7038 - Europe 60 Poland 0.7036 - Europe 61 Scandinavia 0.7035 - Europe 67 Finland 0.7028 - Europe 76 Vologda Northern Russia 0.7018 - Europe 79 Mordvin 0.7015 - Europe 88 Chuvash Russian Federation 0.6988 - Europe

© 2006-2012 DNA Tribes. DNA Tribes®. DNA Tribes genetic ancestry analysis is available exclusively from DNA Tribes. All rights reserved.
Satellite images courtesy NASA Earth Observatory.
DNA Tribes® SNP Report for Example North Moroccan Person http://www.dnatribes.com/snp.html
Customer Support: [email protected] 8/30/2012 Page 21 of 38
Total Similarity: Middle Eastern Populations This portion of your report identifies your total genetic similarity to Middle Eastern populations in our database. Each population on the map is labeled with a number expressing the ranking among your world population matches (see page 32 for a complete list). In the table, each population is listed with a Member Similarity score that expresses the percentage of your DNA shared with members of that population. Circled populations (labeled "Match" in the table) identify ethnic groups where your genotype fits well among members, based on a proprietary statistical test developed by DNA Tribes®.
Rank Population Member Similarity Match Map Section
15 Cyprus 0.7071 - Middle East 17 Egypt 2 0.7071 - Middle East 30 Palestinian Israel 0.7060 - Middle East 32 Egypt 1 0.7058 - Middle East 33 Jordan 0.7058 - Middle East 38 Assyrian 0.7051 - Middle East

© 2006-2012 DNA Tribes. DNA Tribes®. DNA Tribes genetic ancestry analysis is available exclusively from DNA Tribes. All rights reserved.
Satellite images courtesy NASA Earth Observatory.
DNA Tribes® SNP Report for Example North Moroccan Person http://www.dnatribes.com/snp.html
Customer Support: [email protected] 8/30/2012 Page 22 of 38
45 Saudi Arabia 0.7044 - Middle East 53 Syria 0.7041 - Middle East 54 Arab Qatar 0.7041 - Middle East 55 Druze Israel-Carmel 0.7041 - Middle East 59 Kurdish 0.7036 - Middle East 64 Lebanon 0.7031 - Middle East 69 Bedouin Negev Desert Israel 0.7027 - Middle East 73 Samaritan 0.7024 - Middle East 74 Iran 0.7021 - Middle East 77 Yemen 0.7017 - Middle East
© 2006-2012 DNA Tribes. DNA Tribes®. DNA Tribes genetic ancestry analysis is available exclusively from DNA Tribes. All rights reserved.
Satellite images courtesy NASA Earth Observatory.
DNA Tribes® SNP Report for Example North Moroccan Person http://www.dnatribes.com/snp.html
Customer Support: [email protected] 8/30/2012 Page 23 of 38
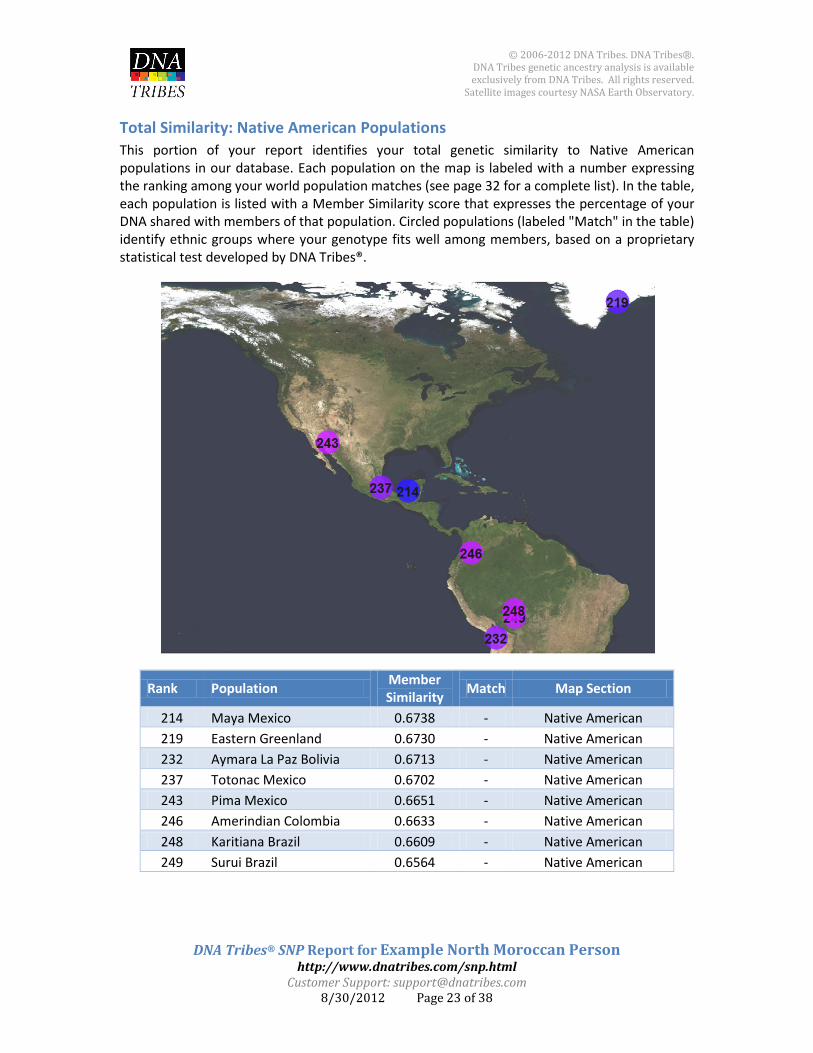
Total Similarity: Native American Populations This portion of your report identifies your total genetic similarity to Native American populations in our database. Each population on the map is labeled with a number expressing the ranking among your world population matches (see page 32 for a complete list). In the table, each population is listed with a Member Similarity score that expresses the percentage of your DNA shared with members of that population. Circled populations (labeled "Match" in the table) identify ethnic groups where your genotype fits well among members, based on a proprietary statistical test developed by DNA Tribes®.
Rank Population Member Similarity Match Map Section
214 Maya Mexico 0.6738 - Native American 219 Eastern Greenland 0.6730 - Native American 232 Aymara La Paz Bolivia 0.6713 - Native American 237 Totonac Mexico 0.6702 - Native American 243 Pima Mexico 0.6651 - Native American 246 Amerindian Colombia 0.6633 - Native American 248 Karitiana Brazil 0.6609 - Native American 249 Surui Brazil 0.6564 - Native American

© 2006-2012 DNA Tribes. DNA Tribes®. DNA Tribes genetic ancestry analysis is available exclusively from DNA Tribes. All rights reserved.
Satellite images courtesy NASA Earth Observatory.
DNA Tribes® SNP Report for Example North Moroccan Person http://www.dnatribes.com/snp.html
Customer Support: [email protected] 8/30/2012 Page 24 of 38
Total Similarity: North Asian Populations This portion of your report identifies your total genetic similarity to North Asian populations in our database. Each population on the map is labeled with a number expressing the ranking among your world population matches (see page 32 for a complete list). In the table, each population is listed with a Member Similarity score that expresses the percentage of your DNA shared with members of that population. Circled populations (labeled "Match" in the table) identify ethnic groups where your genotype fits well among members, based on a proprietary statistical test developed by DNA Tribes®.
Rank Population Member Similarity Match Map Section
114 Uzbek Central Asia 0.6926 - North Asia 118 Hazara Pakistan 0.6917 - North Asia 147 Kyrgyz 0.6870 - North Asia 155 Selkup Russian Federation 0.6836 - North Asia 162 Altai Russian Federation 0.6826 - North Asia 165 Mongol Mongolia 0.6822 - North Asia 167 Tuvinians Russian Federation 0.6809 - North Asia 171 Ket Russian Federation 0.6804 - North Asia 175 Dolgan Russian Federation 0.6784 - North Asia 177 Yakut Siberia 0.6781 - North Asia 178 Buryat China 0.6781 - North Asia 186 Buryat Russian Federation 0.6771 - North Asia 188 Mongola China 0.6770 - North Asia 200 Daur China 0.6757 - North Asia 207 Evenk Russian Federation 0.6748 - North Asia

© 2006-2012 DNA Tribes. DNA Tribes®. DNA Tribes genetic ancestry analysis is available exclusively from DNA Tribes. All rights reserved.
Satellite images courtesy NASA Earth Observatory.
DNA Tribes® SNP Report for Example North Moroccan Person http://www.dnatribes.com/snp.html
Customer Support: [email protected] 8/30/2012 Page 25 of 38
210 Xibo China 0.6746 - North Asia 213 Yukaghir Russian Federation 0.6742 - North Asia 223 Hezhen China 0.6724 - North Asia 229 Chukchi Russian Federation 0.6721 - North Asia 230 Koryak Russian Federation 0.6720 - North Asia 231 Oroqen China 0.6713 - North Asia 236 Nganasan Russian Federation 0.6705 - North Asia
© 2006-2012 DNA Tribes. DNA Tribes®. DNA Tribes genetic ancestry analysis is available exclusively from DNA Tribes. All rights reserved.
Satellite images courtesy NASA Earth Observatory.
DNA Tribes® SNP Report for Example North Moroccan Person http://www.dnatribes.com/snp.html
Customer Support: [email protected] 8/30/2012 Page 26 of 38
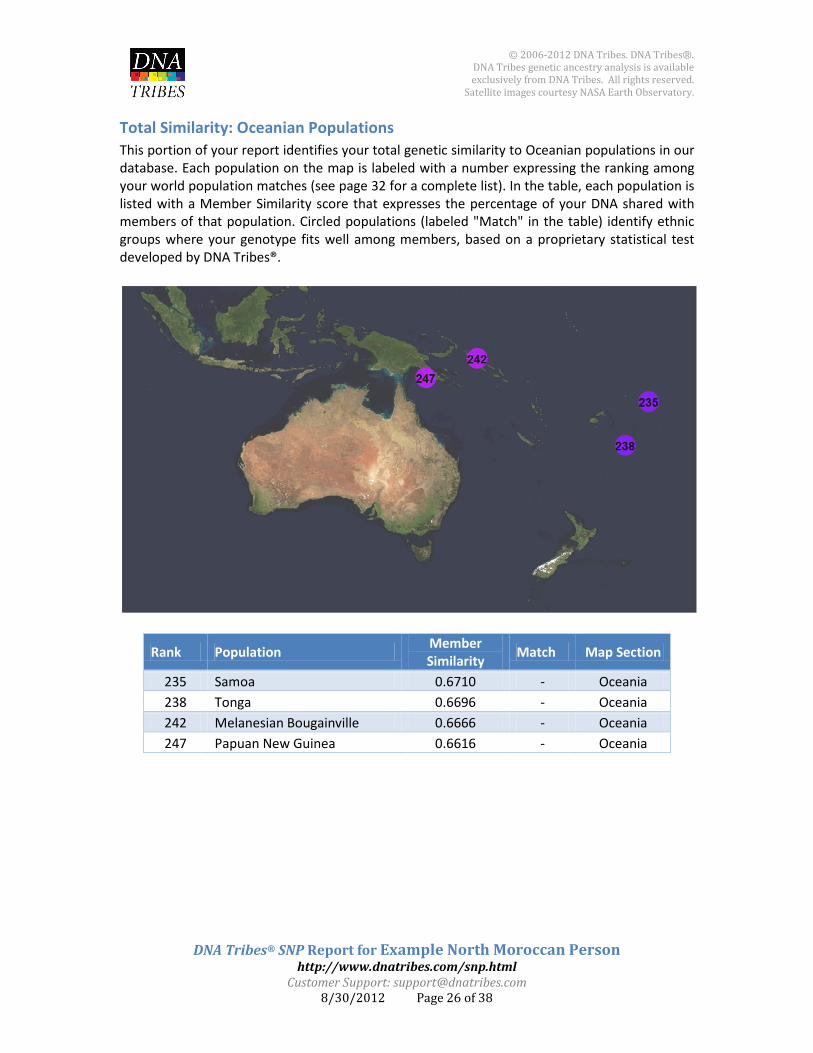
Total Similarity: Oceanian Populations This portion of your report identifies your total genetic similarity to Oceanian populations in our database. Each population on the map is labeled with a number expressing the ranking among your world population matches (see page 32 for a complete list). In the table, each population is listed with a Member Similarity score that expresses the percentage of your DNA shared with members of that population. Circled populations (labeled "Match" in the table) identify ethnic groups where your genotype fits well among members, based on a proprietary statistical test developed by DNA Tribes®.
Rank Population Member Similarity Match Map Section
235 Samoa 0.6710 - Oceania 238 Tonga 0.6696 - Oceania 242 Melanesian Bougainville 0.6666 - Oceania 247 Papuan New Guinea 0.6616 - Oceania
© 2006-2012 DNA Tribes. DNA Tribes®. DNA Tribes genetic ancestry analysis is available exclusively from DNA Tribes. All rights reserved.
Satellite images courtesy NASA Earth Observatory.
DNA Tribes® SNP Report for Example North Moroccan Person http://www.dnatribes.com/snp.html
Customer Support: [email protected] 8/30/2012 Page 27 of 38
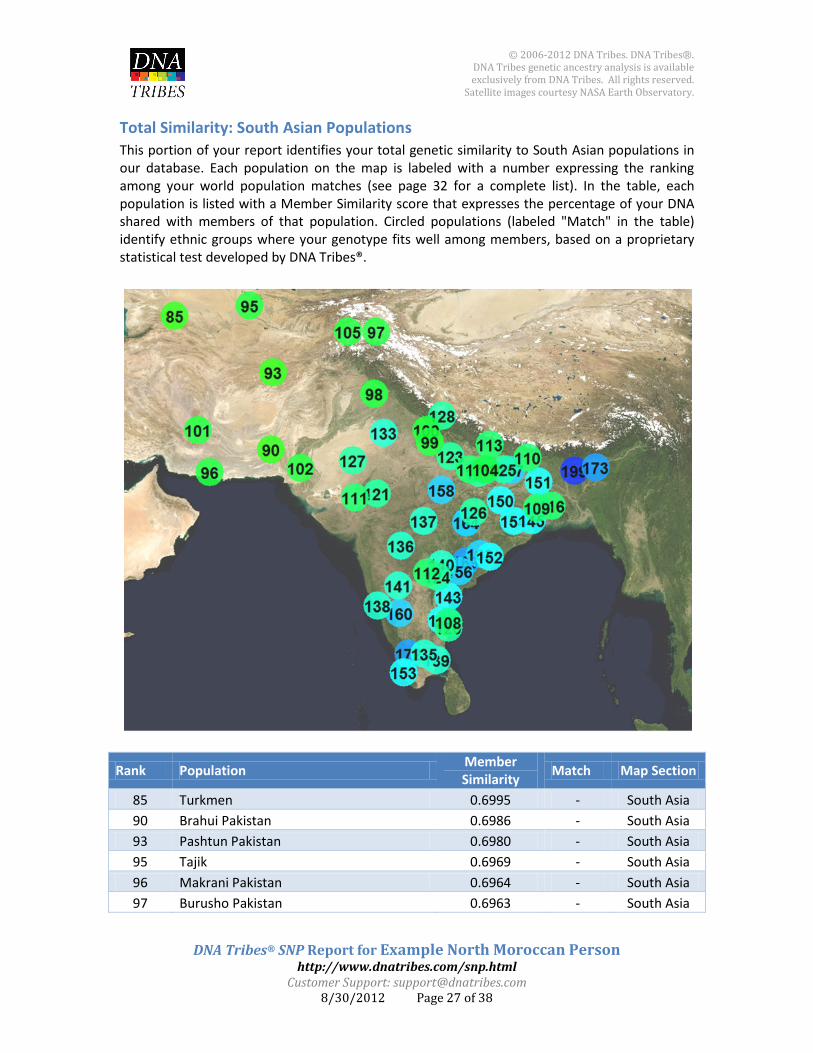
Total Similarity: South Asian Populations This portion of your report identifies your total genetic similarity to South Asian populations in our database. Each population on the map is labeled with a number expressing the ranking among your world population matches (see page 32 for a complete list). In the table, each population is listed with a Member Similarity score that expresses the percentage of your DNA shared with members of that population. Circled populations (labeled "Match" in the table) identify ethnic groups where your genotype fits well among members, based on a proprietary statistical test developed by DNA Tribes®.
Rank Population Member Similarity Match Map Section
85 Turkmen 0.6995 - South Asia 90 Brahui Pakistan 0.6986 - South Asia 93 Pashtun Pakistan 0.6980 - South Asia 95 Tajik 0.6969 - South Asia 96 Makrani Pakistan 0.6964 - South Asia 97 Burusho Pakistan 0.6963 - South Asia

© 2006-2012 DNA Tribes. DNA Tribes®. DNA Tribes genetic ancestry analysis is available exclusively from DNA Tribes. All rights reserved.
Satellite images courtesy NASA Earth Observatory.
DNA Tribes® SNP Report for Example North Moroccan Person http://www.dnatribes.com/snp.html
Customer Support: [email protected] 8/30/2012 Page 28 of 38
98 Arain Punjab Pakistan 0.6962 - South Asia 99 Kshatriya Uttar Pradesh India 0.6953 - South Asia
100 Brahmin Uttar Pradesh India 0.6953 - South Asia 101 Balochi Pakistan 0.6952 - South Asia 102 Sindhi Pakistan 0.6948 - South Asia 104 Dharkar India 0.6946 - South Asia 105 Kalash Pakistan 0.6943 - South Asia 108 Brahmin Tamil Nadu India 0.6939 - South Asia 109 Kurmi India 0.6934 - South Asia 110 Nepal 0.6933 - South Asia 111 Gujarat India 0.6933 - South Asia 112 Brahmin Andhra Pradesh India 0.6928 - South Asia 113 Tharu India 0.6927 - South Asia 116 Bengali India 0.6920 - South Asia 117 Muslim Uttar Pradesh India 0.6917 - South Asia 119 Scheduled Caste Uttar Pradesh India 0.6916 - South Asia 120 Scheduled Caste Tamil Nadu India 0.6915 - South Asia 121 Lambadi India 0.6915 - South Asia 123 Kanjar India 0.6914 - South Asia 124 Velama India 0.6913 - South Asia 125 Dusadh India 0.6910 - South Asia 126 Gond India 0.6910 - South Asia 127 Meghawal India 0.6908 - South Asia 128 Brahmin Uttaranchal India 0.6908 - South Asia 129 Kol India 0.6907 - South Asia 132 Chamar India 0.6900 - South Asia 133 Meena India 0.6899 - South Asia 135 Piramalai Kallar India 0.6894 - South Asia 136 Madiga Andhra Pradesh India 0.6893 - South Asia 137 Nihali India 0.6890 - South Asia 138 Hakkipikki India 0.6888 - South Asia 139 Sakilli India 0.6885 - South Asia 140 Chenchu India 0.6884 - South Asia 141 North Kannadi India 0.6882 - South Asia 143 Mala Andhra Pradesh India 0.6882 - South Asia 144 Dalit Tamil Nadu India 0.6874 - South Asia 145 Kurumba India 0.6873 - South Asia 148 Irula South India 0.6868 - South Asia 150 Asur Jharkand India 0.6860 - South Asia

© 2006-2012 DNA Tribes. DNA Tribes®. DNA Tribes genetic ancestry analysis is available exclusively from DNA Tribes. All rights reserved.
Satellite images courtesy NASA Earth Observatory.
DNA Tribes® SNP Report for Example North Moroccan Person http://www.dnatribes.com/snp.html
Customer Support: [email protected] 8/30/2012 Page 29 of 38
151 Santhal Jharkand India 0.6853 - South Asia 152 Gadaba Orissa India 0.6842 - South Asia 153 Malayan India 0.6839 - South Asia 154 Juang Orissa India 0.6838 - South Asia 156 Savara Orissa India 0.6835 - South Asia 157 Ho Bihar India 0.6835 - South Asia 158 Mawasi India 0.6831 - South Asia 160 Paniya India 0.6829 - South Asia 163 Dhurwa India 0.6823 - South Asia 164 Bhunjia India 0.6822 - South Asia 168 Kharia Chattishgarh India 0.6807 - South Asia 169 Bonda Orissa India 0.6805 - South Asia 172 Pulliyar India 0.6798 - South Asia 173 Khasi Meghalaya India 0.6793 - South Asia 199 Garo Meghalaya India 0.6758 - South Asia
© 2006-2012 DNA Tribes. DNA Tribes®. DNA Tribes genetic ancestry analysis is available exclusively from DNA Tribes. All rights reserved.
Satellite images courtesy NASA Earth Observatory.
DNA Tribes® SNP Report for Example North Moroccan Person http://www.dnatribes.com/snp.html
Customer Support: [email protected] 8/30/2012 Page 30 of 38
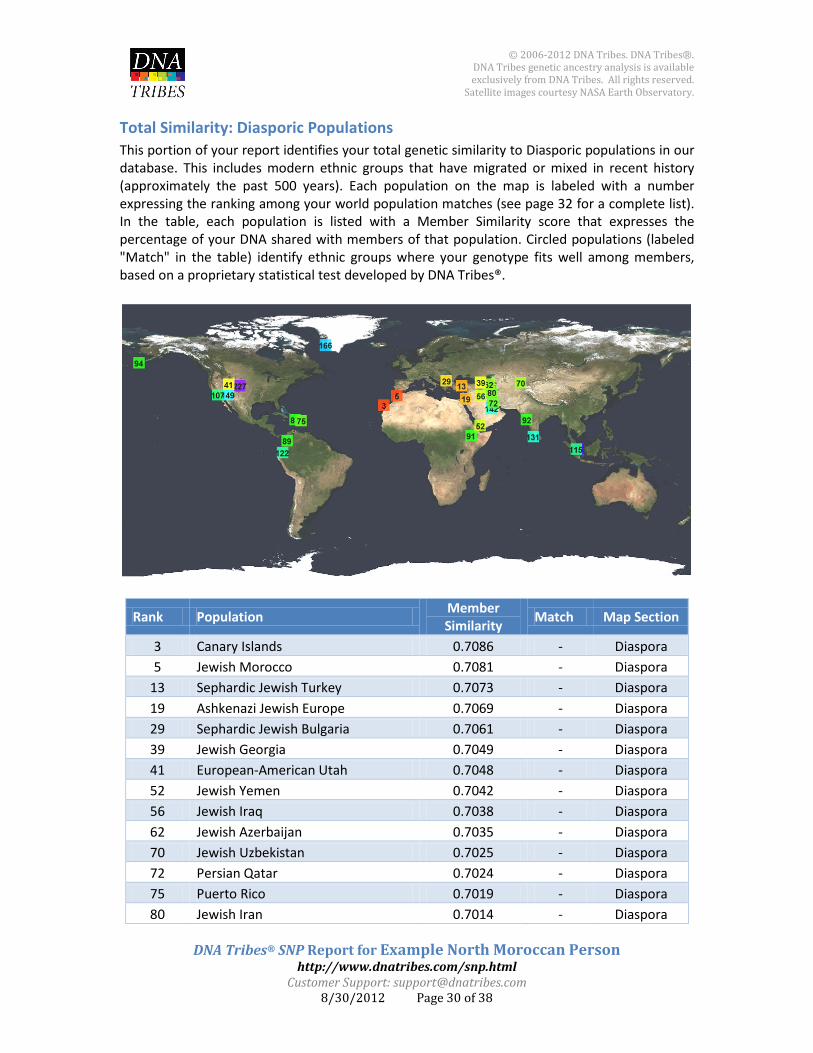
Total Similarity: Diasporic Populations This portion of your report identifies your total genetic similarity to Diasporic populations in our database. This includes modern ethnic groups that have migrated or mixed in recent history (approximately the past 500 years). Each population on the map is labeled with a number expressing the ranking among your world population matches (see page 32 for a complete list). In the table, each population is listed with a Member Similarity score that expresses the percentage of your DNA shared with members of that population. Circled populations (labeled "Match" in the table) identify ethnic groups where your genotype fits well among members, based on a proprietary statistical test developed by DNA Tribes®.
Rank Population Member Similarity Match Map Section
3 Canary Islands 0.7086 - Diaspora 5 Jewish Morocco 0.7081 - Diaspora
13 Sephardic Jewish Turkey 0.7073 - Diaspora 19 Ashkenazi Jewish Europe 0.7069 - Diaspora 29 Sephardic Jewish Bulgaria 0.7061 - Diaspora 39 Jewish Georgia 0.7049 - Diaspora 41 European-American Utah 0.7048 - Diaspora 52 Jewish Yemen 0.7042 - Diaspora 56 Jewish Iraq 0.7038 - Diaspora 62 Jewish Azerbaijan 0.7035 - Diaspora 70 Jewish Uzbekistan 0.7025 - Diaspora 72 Persian Qatar 0.7024 - Diaspora 75 Puerto Rico 0.7019 - Diaspora 80 Jewish Iran 0.7014 - Diaspora

© 2006-2012 DNA Tribes. DNA Tribes®. DNA Tribes genetic ancestry analysis is available exclusively from DNA Tribes. All rights reserved.
Satellite images courtesy NASA Earth Observatory.
DNA Tribes® SNP Report for Example North Moroccan Person http://www.dnatribes.com/snp.html
Customer Support: [email protected] 8/30/2012 Page 31 of 38
87 Dominican Republic 0.6989 - Diaspora 89 Colombia 0.6987 - Diaspora 91 Jewish Ethiopia 0.6982 - Diaspora 92 Bene Israel India 0.6981 - Diaspora 94 Aleut Alaska 0.6979 - Diaspora
107 Mexican-American Los Angeles CA 0.6942 - Diaspora 115 Indian Singaporean 0.6924 - Diaspora 122 Ecuador 0.6914 - Diaspora 131 Cochin Jewish India 0.6902 - Diaspora 142 African Qatar 0.6882 - Diaspora 149 African-American Southwest USA 0.6864 - Diaspora 166 Western Greenland 0.6816 - Diaspora 221 Chinese Singaporean 0.6727 - Diaspora 227 Chinese-American Denver CO 0.6722 - Diaspora
© 2006-2012 DNA Tribes. DNA Tribes®. DNA Tribes genetic ancestry analysis is available exclusively from DNA Tribes. All rights reserved.
Satellite images courtesy NASA Earth Observatory.
DNA Tribes® SNP Report for Example North Moroccan Person http://www.dnatribes.com/snp.html
Customer Support: [email protected] 8/30/2012 Page 32 of 38
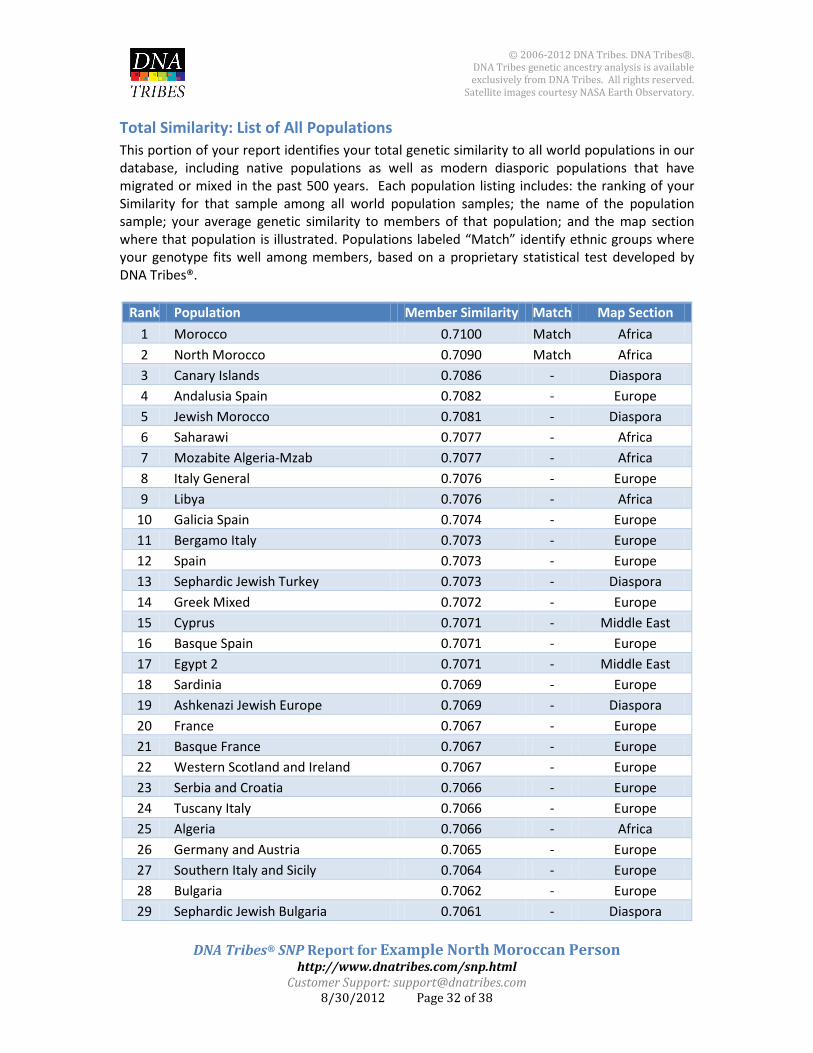
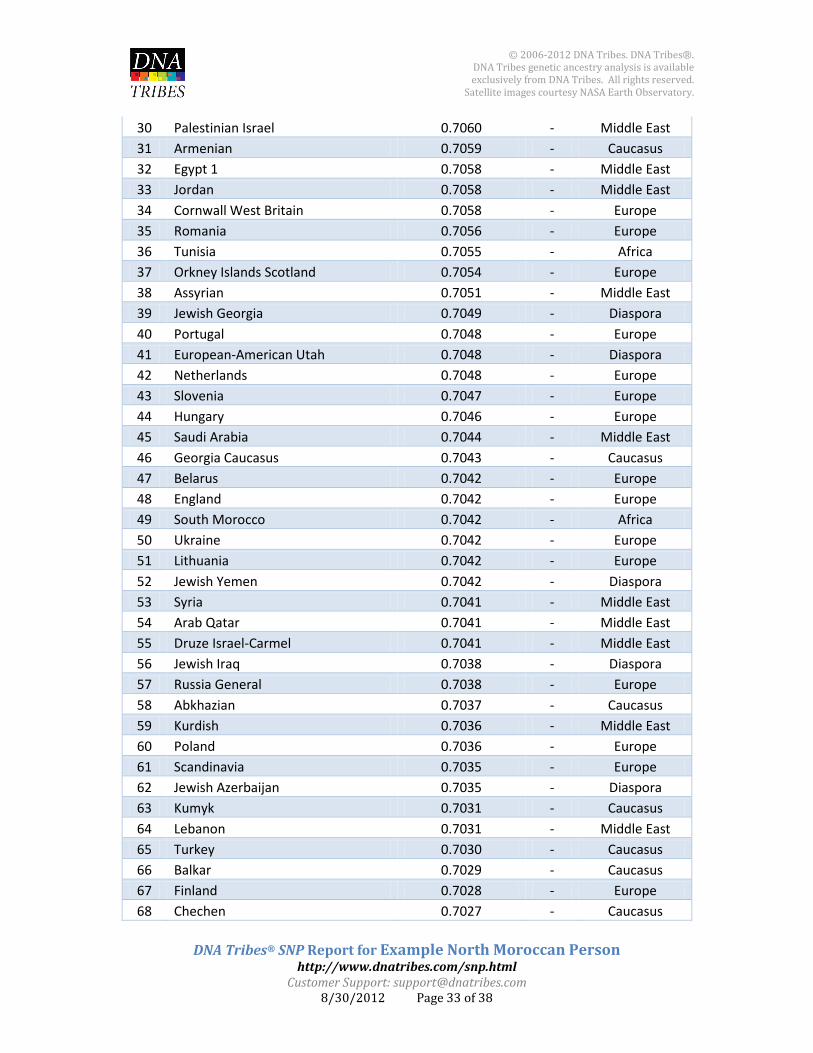
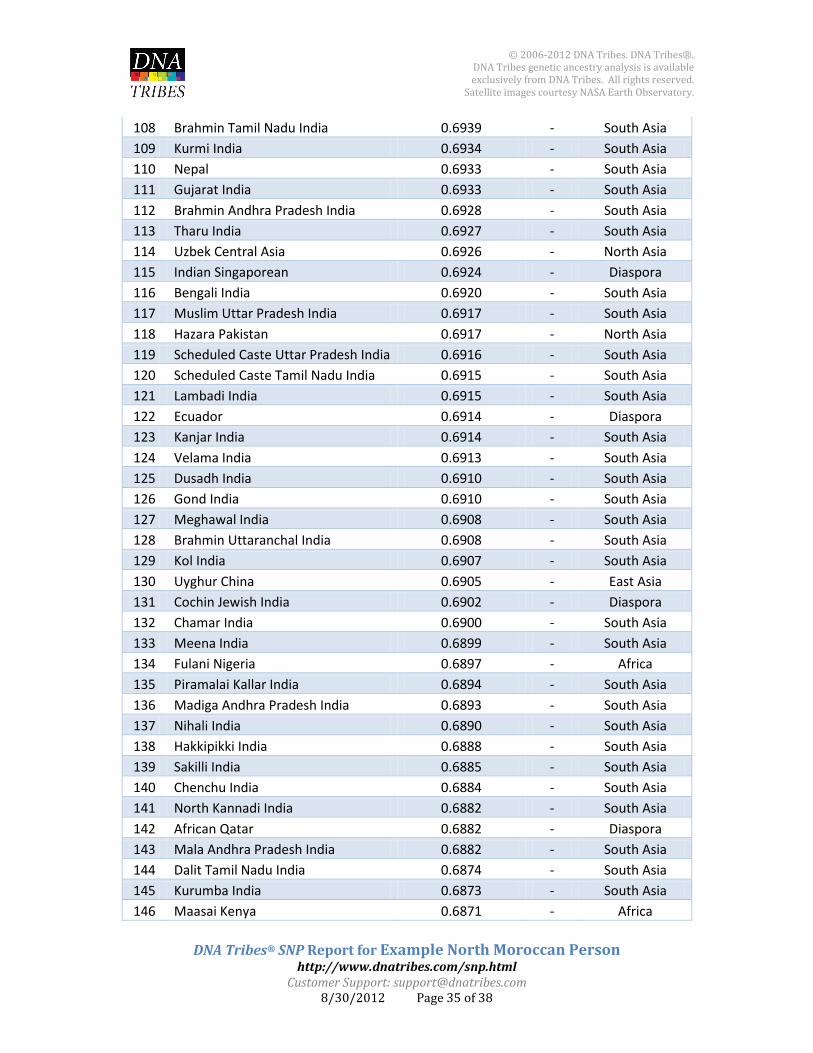
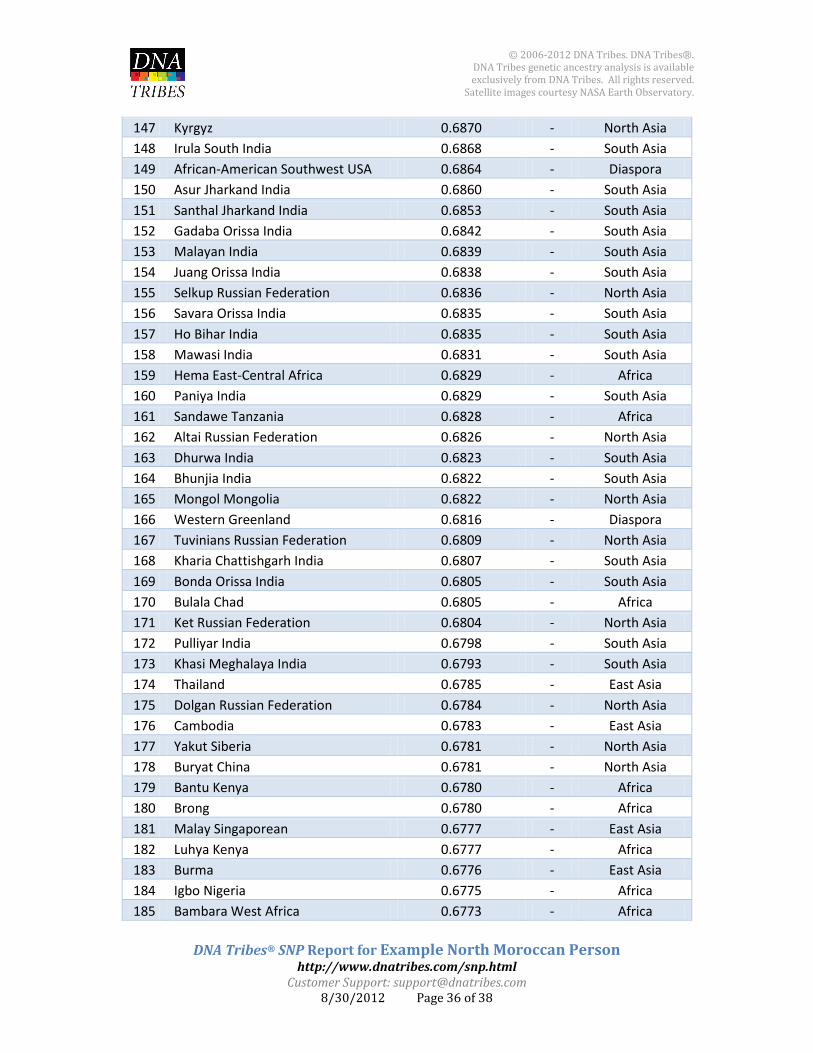
Total Similarity: List of All Populations This portion of your report identifies your total genetic similarity to all world populations in our database, including native populations as well as modern diasporic populations that have migrated or mixed in the past 500 years. Each population listing includes: the ranking of your Similarity for that sample among all world population samples; the name of the population sample; your average genetic similarity to members of that population; and the map section where that population is illustrated. Populations labeled “Match” identify ethnic groups where your genotype fits well among members, based on a proprietary statistical test developed by DNA Tribes®.
Rank Population Member Similarity Match Map Section 1 Morocco 0.7100 Match Africa 2 North Morocco 0.7090 Match Africa 3 Canary Islands 0.7086 - Diaspora 4 Andalusia Spain 0.7082 - Europe 5 Jewish Morocco 0.7081 - Diaspora 6 Saharawi 0.7077 - Africa 7 Mozabite Algeria-Mzab 0.7077 - Africa 8 Italy General 0.7076 - Europe 9 Libya 0.7076 - Africa
10 Galicia Spain 0.7074 - Europe 11 Bergamo Italy 0.7073 - Europe 12 Spain 0.7073 - Europe 13 Sephardic Jewish Turkey 0.7073 - Diaspora 14 Greek Mixed 0.7072 - Europe 15 Cyprus 0.7071 - Middle East 16 Basque Spain 0.7071 - Europe 17 Egypt 2 0.7071 - Middle East 18 Sardinia 0.7069 - Europe 19 Ashkenazi Jewish Europe 0.7069 - Diaspora 20 France 0.7067 - Europe 21 Basque France 0.7067 - Europe 22 Western Scotland and Ireland 0.7067 - Europe 23 Serbia and Croatia 0.7066 - Europe 24 Tuscany Italy 0.7066 - Europe 25 Algeria 0.7066 - Africa 26 Germany and Austria 0.7065 - Europe 27 Southern Italy and Sicily 0.7064 - Europe 28 Bulgaria 0.7062 - Europe 29 Sephardic Jewish Bulgaria 0.7061 - Diaspora
© 2006-2012 DNA Tribes. DNA Tribes®. DNA Tribes genetic ancestry analysis is available exclusively from DNA Tribes. All rights reserved.
Satellite images courtesy NASA Earth Observatory.
DNA Tribes® SNP Report for Example North Moroccan Person http://www.dnatribes.com/snp.html
Customer Support: [email protected] 8/30/2012 Page 33 of 38
30 Palestinian Israel 0.7060 - Middle East 31 Armenian 0.7059 - Caucasus 32 Egypt 1 0.7058 - Middle East 33 Jordan 0.7058 - Middle East 34 Cornwall West Britain 0.7058 - Europe 35 Romania 0.7056 - Europe 36 Tunisia 0.7055 - Africa 37 Orkney Islands Scotland 0.7054 - Europe 38 Assyrian 0.7051 - Middle East 39 Jewish Georgia 0.7049 - Diaspora 40 Portugal 0.7048 - Europe 41 European-American Utah 0.7048 - Diaspora 42 Netherlands 0.7048 - Europe 43 Slovenia 0.7047 - Europe 44 Hungary 0.7046 - Europe 45 Saudi Arabia 0.7044 - Middle East 46 Georgia Caucasus 0.7043 - Caucasus 47 Belarus 0.7042 - Europe 48 England 0.7042 - Europe 49 South Morocco 0.7042 - Africa 50 Ukraine 0.7042 - Europe 51 Lithuania 0.7042 - Europe 52 Jewish Yemen 0.7042 - Diaspora 53 Syria 0.7041 - Middle East 54 Arab Qatar 0.7041 - Middle East 55 Druze Israel-Carmel 0.7041 - Middle East 56 Jewish Iraq 0.7038 - Diaspora 57 Russia General 0.7038 - Europe 58 Abkhazian 0.7037 - Caucasus 59 Kurdish 0.7036 - Middle East 60 Poland 0.7036 - Europe 61 Scandinavia 0.7035 - Europe 62 Jewish Azerbaijan 0.7035 - Diaspora 63 Kumyk 0.7031 - Caucasus 64 Lebanon 0.7031 - Middle East 65 Turkey 0.7030 - Caucasus 66 Balkar 0.7029 - Caucasus 67 Finland 0.7028 - Europe 68 Chechen 0.7027 - Caucasus

© 2006-2012 DNA Tribes. DNA Tribes®. DNA Tribes genetic ancestry analysis is available exclusively from DNA Tribes. All rights reserved.
Satellite images courtesy NASA Earth Observatory.
DNA Tribes® SNP Report for Example North Moroccan Person http://www.dnatribes.com/snp.html
Customer Support: [email protected] 8/30/2012 Page 34 of 38
69 Bedouin Negev Desert Israel 0.7027 - Middle East 70 Jewish Uzbekistan 0.7025 - Diaspora 71 Adyghe North Caucasus 0.7025 - Caucasus 72 Persian Qatar 0.7024 - Diaspora 73 Samaritan 0.7024 - Middle East 74 Iran 0.7021 - Middle East 75 Puerto Rico 0.7019 - Diaspora 76 Vologda Northern Russia 0.7018 - Europe 77 Yemen 0.7017 - Middle East 78 Tigray Ethiopia 0.7016 - Africa 79 Mordvin 0.7015 - Europe 80 Jewish Iran 0.7014 - Diaspora 81 Amhara Ethiopia 0.7008 - Africa 82 North Ossetia 0.7008 - Caucasus 83 Lezgin Caucasus 0.7005 - Caucasus 84 Nogay 0.6996 - Caucasus 85 Turkmen 0.6995 - South Asia 86 Dargin Urkarah Dagestan 0.6990 - Caucasus 87 Dominican Republic 0.6989 - Diaspora 88 Chuvash Russian Federation 0.6988 - Europe 89 Colombia 0.6987 - Diaspora 90 Brahui Pakistan 0.6986 - South Asia 91 Jewish Ethiopia 0.6982 - Diaspora 92 Bene Israel India 0.6981 - Diaspora 93 Pashtun Pakistan 0.6980 - South Asia 94 Aleut Alaska 0.6979 - Diaspora 95 Tajik 0.6969 - South Asia 96 Makrani Pakistan 0.6964 - South Asia 97 Burusho Pakistan 0.6963 - South Asia 98 Arain Punjab Pakistan 0.6962 - South Asia 99 Kshatriya Uttar Pradesh India 0.6953 - South Asia
100 Brahmin Uttar Pradesh India 0.6953 - South Asia 101 Balochi Pakistan 0.6952 - South Asia 102 Sindhi Pakistan 0.6948 - South Asia 103 Somalia 0.6946 - Africa 104 Dharkar India 0.6946 - South Asia 105 Kalash Pakistan 0.6943 - South Asia 106 Oromo Ethiopia 0.6942 - Africa 107 Mexican-American Los Angeles CA 0.6942 - Diaspora
© 2006-2012 DNA Tribes. DNA Tribes®. DNA Tribes genetic ancestry analysis is available exclusively from DNA Tribes. All rights reserved.
Satellite images courtesy NASA Earth Observatory.
DNA Tribes® SNP Report for Example North Moroccan Person http://www.dnatribes.com/snp.html
Customer Support: [email protected] 8/30/2012 Page 35 of 38
108 Brahmin Tamil Nadu India 0.6939 - South Asia 109 Kurmi India 0.6934 - South Asia 110 Nepal 0.6933 - South Asia 111 Gujarat India 0.6933 - South Asia 112 Brahmin Andhra Pradesh India 0.6928 - South Asia 113 Tharu India 0.6927 - South Asia 114 Uzbek Central Asia 0.6926 - North Asia 115 Indian Singaporean 0.6924 - Diaspora 116 Bengali India 0.6920 - South Asia 117 Muslim Uttar Pradesh India 0.6917 - South Asia 118 Hazara Pakistan 0.6917 - North Asia 119 Scheduled Caste Uttar Pradesh India 0.6916 - South Asia 120 Scheduled Caste Tamil Nadu India 0.6915 - South Asia 121 Lambadi India 0.6915 - South Asia 122 Ecuador 0.6914 - Diaspora 123 Kanjar India 0.6914 - South Asia 124 Velama India 0.6913 - South Asia 125 Dusadh India 0.6910 - South Asia 126 Gond India 0.6910 - South Asia 127 Meghawal India 0.6908 - South Asia 128 Brahmin Uttaranchal India 0.6908 - South Asia 129 Kol India 0.6907 - South Asia 130 Uyghur China 0.6905 - East Asia 131 Cochin Jewish India 0.6902 - Diaspora 132 Chamar India 0.6900 - South Asia 133 Meena India 0.6899 - South Asia 134 Fulani Nigeria 0.6897 - Africa 135 Piramalai Kallar India 0.6894 - South Asia 136 Madiga Andhra Pradesh India 0.6893 - South Asia 137 Nihali India 0.6890 - South Asia 138 Hakkipikki India 0.6888 - South Asia 139 Sakilli India 0.6885 - South Asia 140 Chenchu India 0.6884 - South Asia 141 North Kannadi India 0.6882 - South Asia 142 African Qatar 0.6882 - Diaspora 143 Mala Andhra Pradesh India 0.6882 - South Asia 144 Dalit Tamil Nadu India 0.6874 - South Asia 145 Kurumba India 0.6873 - South Asia 146 Maasai Kenya 0.6871 - Africa
© 2006-2012 DNA Tribes. DNA Tribes®. DNA Tribes genetic ancestry analysis is available exclusively from DNA Tribes. All rights reserved.
Satellite images courtesy NASA Earth Observatory.
DNA Tribes® SNP Report for Example North Moroccan Person http://www.dnatribes.com/snp.html
Customer Support: [email protected] 8/30/2012 Page 36 of 38
147 Kyrgyz 0.6870 - North Asia 148 Irula South India 0.6868 - South Asia 149 African-American Southwest USA 0.6864 - Diaspora 150 Asur Jharkand India 0.6860 - South Asia 151 Santhal Jharkand India 0.6853 - South Asia 152 Gadaba Orissa India 0.6842 - South Asia 153 Malayan India 0.6839 - South Asia 154 Juang Orissa India 0.6838 - South Asia 155 Selkup Russian Federation 0.6836 - North Asia 156 Savara Orissa India 0.6835 - South Asia 157 Ho Bihar India 0.6835 - South Asia 158 Mawasi India 0.6831 - South Asia 159 Hema East-Central Africa 0.6829 - Africa 160 Paniya India 0.6829 - South Asia 161 Sandawe Tanzania 0.6828 - Africa 162 Altai Russian Federation 0.6826 - North Asia 163 Dhurwa India 0.6823 - South Asia 164 Bhunjia India 0.6822 - South Asia 165 Mongol Mongolia 0.6822 - North Asia 166 Western Greenland 0.6816 - Diaspora 167 Tuvinians Russian Federation 0.6809 - North Asia 168 Kharia Chattishgarh India 0.6807 - South Asia 169 Bonda Orissa India 0.6805 - South Asia 170 Bulala Chad 0.6805 - Africa 171 Ket Russian Federation 0.6804 - North Asia 172 Pulliyar India 0.6798 - South Asia 173 Khasi Meghalaya India 0.6793 - South Asia 174 Thailand 0.6785 - East Asia 175 Dolgan Russian Federation 0.6784 - North Asia 176 Cambodia 0.6783 - East Asia 177 Yakut Siberia 0.6781 - North Asia 178 Buryat China 0.6781 - North Asia 179 Bantu Kenya 0.6780 - Africa 180 Brong 0.6780 - Africa 181 Malay Singaporean 0.6777 - East Asia 182 Luhya Kenya 0.6777 - Africa 183 Burma 0.6776 - East Asia 184 Igbo Nigeria 0.6775 - Africa 185 Bambara West Africa 0.6773 - Africa

© 2006-2012 DNA Tribes. DNA Tribes®. DNA Tribes genetic ancestry analysis is available exclusively from DNA Tribes. All rights reserved.
Satellite images courtesy NASA Earth Observatory.
DNA Tribes® SNP Report for Example North Moroccan Person http://www.dnatribes.com/snp.html
Customer Support: [email protected] 8/30/2012 Page 37 of 38
186 Buryat Russian Federation 0.6771 - North Asia 187 Kongo 0.6770 - Africa 188 Mongola China 0.6770 - North Asia 189 Hausa Nigeria 0.6769 - Africa 190 Mandenka Senegal 0.6769 - Africa 191 Kaba Chad 0.6768 - Africa 192 Mada Cameroon 0.6768 - Africa 193 Vietnam 0.6762 - East Asia 194 Monguor China 0.6762 - East Asia 195 Bamoun Cameroon 0.6761 - Africa 196 Xhosa 0.6759 - Africa 197 Dogon West Africa 0.6759 - Africa 198 Yoruba Nigeria 0.6759 - Africa 199 Garo Meghalaya India 0.6758 - South Asia 200 Daur China 0.6757 - North Asia 201 Nguni South Africa 0.6756 - Africa 202 Tswana South Africa 0.6756 - Africa 203 Pedi South Africa 0.6755 - Africa 204 Fang Cameroon 0.6752 - Africa 205 Ovambo South Africa 0.6751 - Africa 206 Yi China 0.6749 - East Asia 207 Evenk Russian Federation 0.6748 - North Asia 208 Alur East-Central Africa 0.6748 - Africa 209 Tibet 0.6746 - East Asia 210 Xibo China 0.6746 - North Asia 211 Herero South Africa 0.6744 - Africa 212 Iban Borneo 0.6743 - East Asia 213 Yukaghir Russian Federation 0.6742 - North Asia 214 Maya Mexico 0.6738 - Native American 215 Sotho South Africa 0.6735 - Africa 216 Naxi China 0.6733 - East Asia 217 Dai China 0.6733 - East Asia 218 Han Southern China 0.6731 - East Asia 219 Eastern Greenland 0.6730 - Native American 220 Han Beijing China 0.6728 - East Asia 221 Chinese Singaporean 0.6727 - Diaspora 222 Tujia China 0.6725 - East Asia 223 Hezhen China 0.6724 - North Asia 224 Hadza Tanzania 0.6723 - Africa

© 2006-2012 DNA Tribes. DNA Tribes®. DNA Tribes genetic ancestry analysis is available exclusively from DNA Tribes. All rights reserved.
Satellite images courtesy NASA Earth Observatory.
DNA Tribes® SNP Report for Example North Moroccan Person http://www.dnatribes.com/snp.html
Customer Support: [email protected] 8/30/2012 Page 38 of 38
225 Lahu China 0.6722 - East Asia 226 Japan 0.6722 - East Asia 227 Chinese-American Denver CO 0.6722 - Diaspora 228 Miao China 0.6721 - East Asia 229 Chukchi Russian Federation 0.6721 - North Asia 230 Koryak Russian Federation 0.6720 - North Asia 231 Oroqen China 0.6713 - North Asia 232 Aymara La Paz Bolivia 0.6713 - Native American 233 Khomani San South Africa 0.6711 - Africa 234 She China 0.6710 - East Asia 235 Samoa 0.6710 - Oceania 236 Nganasan Russian Federation 0.6705 - North Asia 237 Totonac Mexico 0.6702 - Native American 238 Tonga 0.6696 - Oceania 239 Naga India 0.6692 - East Asia 240 Aka Central African Republic 0.6692 - Africa 241 Kung Kalahari Desert 0.6678 - Africa 242 Melanesian Bougainville 0.6666 - Oceania 243 Pima Mexico 0.6651 - Native American 244 San Namibia 0.6644 - Africa 245 Mbuti East-Central Africa 0.6639 - Africa 246 Amerindian Colombia 0.6633 - Native American 247 Papuan New Guinea 0.6616 - Oceania 248 Karitiana Brazil 0.6609 - Native American 249 Surui Brazil 0.6564 - Native American