DNA Plc Interim Report January–September 2019
51
INTERIM REPORT JANUARY–SEPTEMBER 2019
Transcript of DNA Plc Interim Report January–September 2019

INTERIM REPORTJANUARY–SEPTEMBER 2019
2
DNA Plc's Interim Report 1–9 / 2019
Index
Summary . . . . . . . . . . . . . . . . . . . . . . . . . . . . . . . . . . . . . . . . . . . . . . . . . . . . . . . . . . . . . . . . 3
CEO’s review . . . . . . . . . . . . . . . . . . . . . . . . . . . . . . . . . . . . . . . . . . . . . . . . . . . . . . . . . . . . . 5
DNA Plc Interim Report 1–9/2019 . . . . . . . . . . . . . . . . . . . . . . . . . . . . . . . . . . . . . . . . . . . . 6
Net sales and result . . . . . . . . . . . . . . . . . . . . . . . . . . . . . . . . . . . . . . . . . . . . . . . . . . . . . 7
Cash flow and financial position . . . . . . . . . . . . . . . . . . . . . . . . . . . . . . . . . . . . . . . . . . 9
Development per business segment . . . . . . . . . . . . . . . . . . . . . . . . . . . . . . . . . . . . . . 10
Capital expenditure . . . . . . . . . . . . . . . . . . . . . . . . . . . . . . . . . . . . . . . . . . . . . . . . . . . . 12
Network infrastructure and new technologies . . . . . . . . . . . . . . . . . . . . . . . . . . . . . . 13
Personnel . . . . . . . . . . . . . . . . . . . . . . . . . . . . . . . . . . . . . . . . . . . . . . . . . . . . . . . . . . . . 14
Significant litigation matters . . . . . . . . . . . . . . . . . . . . . . . . . . . . . . . . . . . . . . . . . . . . 14
Change in DNA’s Executive Team . . . . . . . . . . . . . . . . . . . . . . . . . . . . . . . . . . . . . . . . 14
Decisions of Annual General Meeting . . . . . . . . . . . . . . . . . . . . . . . . . . . . . . . . . . . . 15
Shares and shareholders . . . . . . . . . . . . . . . . . . . . . . . . . . . . . . . . . . . . . . . . . . . . . . . . 16
DNA’s financial objectives and dividend policy . . . . . . . . . . . . . . . . . . . . . . . . . . . . . 18
Corporate responsibility . . . . . . . . . . . . . . . . . . . . . . . . . . . . . . . . . . . . . . . . . . . . . . . . 18
Events after the review period . . . . . . . . . . . . . . . . . . . . . . . . . . . . . . . . . . . . . . . . . . . 19
Near-term risks and uncertainties . . . . . . . . . . . . . . . . . . . . . . . . . . . . . . . . . . . . . . . . 20
Outlook for 2019 . . . . . . . . . . . . . . . . . . . . . . . . . . . . . . . . . . . . . . . . . . . . . . . . . . . . . . 21
Group key figures . . . . . . . . . . . . . . . . . . . . . . . . . . . . . . . . . . . . . . . . . . . . . . . . . . . . . 22
Calculation of key figures . . . . . . . . . . . . . . . . . . . . . . . . . . . . . . . . . . . . . . . . . . . . . . . 24
Quarterly information . . . . . . . . . . . . . . . . . . . . . . . . . . . . . . . . . . . . . . . . . . . . . . . . . . 26
Interim report 1–9/2019, Financial Report . . . . . . . . . . . . . . . . . . . . . . . . . . . . . . . . . . . . 28
Consolidated income statement . . . . . . . . . . . . . . . . . . . . . . . . . . . . . . . . . . . . . . . . . 28
Consolidated statement of comprehensive income . . . . . . . . . . . . . . . . . . . . . . . . . 29
Consolidated statement of financial position . . . . . . . . . . . . . . . . . . . . . . . . . . . . . . . 30
Consolidated statement of cash flows . . . . . . . . . . . . . . . . . . . . . . . . . . . . . . . . . . . . 31
Consolidated statement of changes in equity . . . . . . . . . . . . . . . . . . . . . . . . . . . . . . 32
Notes . . . . . . . . . . . . . . . . . . . . . . . . . . . . . . . . . . . . . . . . . . . . . . . . . . . . . . . . . . . . . . . . . . 33
3
DNA Plc's Interim Report 1–9 / 2019
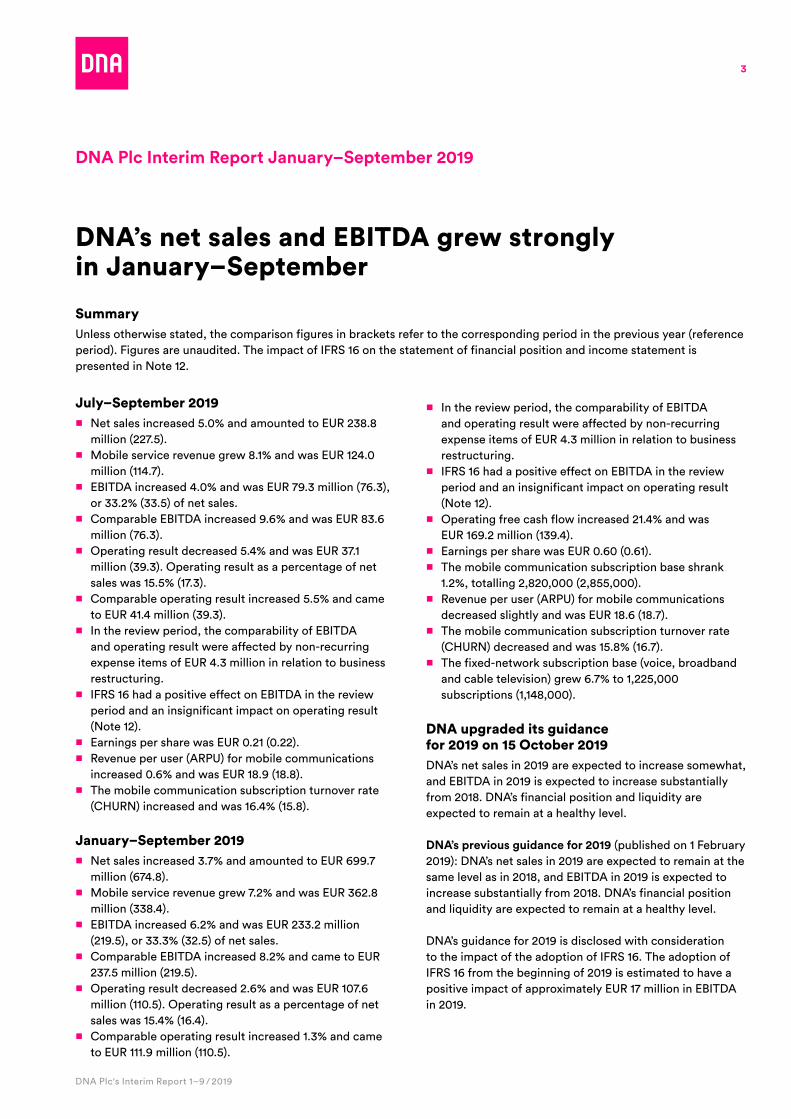
DNA’s net sales and EBITDA grew strongly in January–September
Summary
SummaryUnless otherwise stated, the comparison figures in brackets refer to the corresponding period in the previous year (reference period) . Figures are unaudited . The impact of IFRS 16 on the statement of financial position and income statement is presented in Note 12 .
DNA Plc Interim Report January–September 2019
July–September 2019 ■ Net sales increased 5 .0% and amounted to EUR 238 .8
million (227 .5) . ■ Mobile service revenue grew 8 .1% and was EUR 124 .0
million (114 .7) . ■ EBITDA increased 4 .0% and was EUR 79 .3 million (76 .3),
or 33 .2% (33 .5) of net sales . ■ Comparable EBITDA increased 9 .6% and was EUR 83 .6
million (76 .3) . ■ Operating result decreased 5 .4% and was EUR 37 .1
million (39 .3) . Operating result as a percentage of net sales was 15 .5% (17 .3) .
■ Comparable operating result increased 5 .5% and came to EUR 41 .4 million (39 .3) .
■ In the review period, the comparability of EBITDA and operating result were affected by non-recurring expense items of EUR 4 .3 million in relation to business restructuring .
■ IFRS 16 had a positive effect on EBITDA in the review period and an insignificant impact on operating result (Note 12) .
■ Earnings per share was EUR 0 .21 (0 .22) . ■ Revenue per user (ARPU) for mobile communications
increased 0 .6% and was EUR 18 .9 (18 .8) . ■ The mobile communication subscription turnover rate
(CHURN) increased and was 16 .4% (15 .8) .
January–September 2019 ■ Net sales increased 3 .7% and amounted to EUR 699 .7
million (674 .8) . ■ Mobile service revenue grew 7 .2% and was EUR 362 .8
million (338 .4) . ■ EBITDA increased 6 .2% and was EUR 233 .2 million
(219 .5), or 33 .3% (32 .5) of net sales . ■ Comparable EBITDA increased 8 .2% and came to EUR
237 .5 million (219 .5) . ■ Operating result decreased 2 .6% and was EUR 107 .6
million (110 .5) . Operating result as a percentage of net sales was 15 .4% (16 .4) .
■ Comparable operating result increased 1 .3% and came to EUR 111 .9 million (110 .5) .
■ In the review period, the comparability of EBITDA and operating result were affected by non-recurring expense items of EUR 4 .3 million in relation to business restructuring .
■ IFRS 16 had a positive effect on EBITDA in the review period and an insignificant impact on operating result (Note 12) .
■ Operating free cash flow increased 21 .4% and was EUR 169 .2 million (139 .4) .
■ Earnings per share was EUR 0 .60 (0 .61) . ■ The mobile communication subscription base shrank
1 .2%, totalling 2,820,000 (2,855,000) . ■ Revenue per user (ARPU) for mobile communications
decreased slightly and was EUR 18 .6 (18 .7) . ■ The mobile communication subscription turnover rate
(CHURN) decreased and was 15 .8% (16 .7) . ■ The fixed-network subscription base (voice, broadband
and cable television) grew 6 .7% to 1,225,000 subscriptions (1,148,000) .
DNA upgraded its guidance for 2019 on 15 October 2019DNA’s net sales in 2019 are expected to increase somewhat, and EBITDA in 2019 is expected to increase substantially from 2018 . DNA’s financial position and liquidity are expected to remain at a healthy level .
DNA’s previous guidance for 2019 (published on 1 February 2019): DNA’s net sales in 2019 are expected to remain at the same level as in 2018, and EBITDA in 2019 is expected to increase substantially from 2018 . DNA’s financial position and liquidity are expected to remain at a healthy level .
DNA’s guidance for 2019 is disclosed with consideration to the impact of the adoption of IFRS 16 . The adoption of IFRS 16 from the beginning of 2019 is estimated to have a positive impact of approximately EUR 17 million in EBITDA in 2019 .
4
DNA Plc's Interim Report 1–9 / 2019
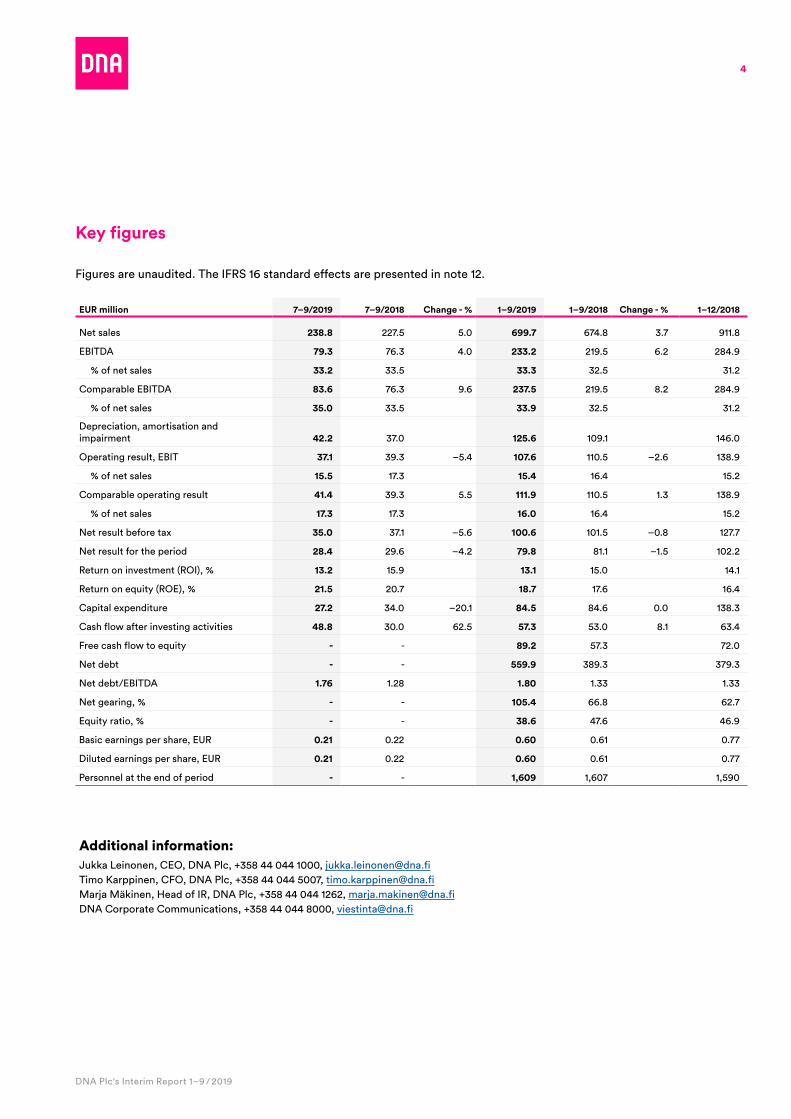
Key figures
Figures are unaudited . The IFRS 16 standard effects are presented in note 12 .
EUR million 7–9/2019 7–9/2018 Change - % 1–9/2019 1–9/2018 Change - % 1–12/2018
Net sales 238.8 227 .5 5 .0 699.7 674 .8 3 .7 911 .8
EBITDA 79.3 76 .3 4 .0 233.2 219 .5 6 .2 284 .9
% of net sales 33.2 33 .5 33.3 32 .5 31 .2
Comparable EBITDA 83.6 76 .3 9 .6 237.5 219 .5 8 .2 284 .9
% of net sales 35.0 33 .5 33.9 32 .5 31 .2
Depreciation, amortisation and impairment 42.2 37 .0 125.6 109 .1 146 .0
Operating result, EBIT 37.1 39 .3 –5 .4 107.6 110 .5 –2 .6 138 .9
% of net sales 15.5 17 .3 15.4 16 .4 15 .2
Comparable operating result 41.4 39 .3 5 .5 111.9 110 .5 1 .3 138 .9
% of net sales 17.3 17 .3 16.0 16 .4 15 .2
Net result before tax 35.0 37 .1 –5 .6 100.6 101 .5 –0 .8 127 .7
Net result for the period 28.4 29 .6 –4 .2 79.8 81 .1 –1 .5 102 .2
Return on investment (ROI), % 13.2 15 .9 13.1 15 .0 14 .1
Return on equity (ROE), % 21.5 20 .7 18.7 17 .6 16 .4
Capital expenditure 27.2 34 .0 –20 .1 84.5 84 .6 0 .0 138 .3
Cash flow after investing activities 48.8 30 .0 62 .5 57.3 53 .0 8 .1 63 .4
Free cash flow to equity - - 89.2 57 .3 72 .0
Net debt - - 559.9 389 .3 379 .3
Net debt/EBITDA 1.76 1 .28 1.80 1 .33 1 .33
Net gearing, % - - 105.4 66 .8 62 .7
Equity ratio, % - - 38.6 47 .6 46 .9
Basic earnings per share, EUR 0.21 0 .22 0.60 0 .61 0 .77
Diluted earnings per share, EUR 0.21 0 .22 0.60 0 .61 0 .77
Personnel at the end of period - - 1,609 1,607 1,590
Additional information:Jukka Leinonen, CEO, DNA Plc, +358 44 044 1000, jukka .leinonen@dna .fiTimo Karppinen, CFO, DNA Plc, +358 44 044 5007, timo .karppinen@dna .fiMarja Mäkinen, Head of IR, DNA Plc, +358 44 044 1262, marja .makinen@dna .fiDNA Corporate Communications, +358 44 044 8000, viestinta@dna .fi
5
DNA Plc's Interim Report 1–9 / 2019
CEO’s review
Once again, DNA has fared well despite a challenging market situation . Our net sales increased 3 .7% in the January-September period and came to EUR 699 .7 million . The positive development was fuelled in particular by our mobile service revenue, which grew 7 .2%, and by mobile device sales, which were up 13 .5% . In the first nine months of the year, comparable EBITDA developed strongly for both segments, growing 8 .2% from the reference period to EUR 237 .5 million, or 33 .9% of net sales .
Both growth and profitability showed a positive trend in the third quarter of 2019 . Our net sales increased 5 .0% year-on-year and came to EUR 238 .8 million . This increase was fuelled in particular by our strong mobile service revenue as well as robust mobile device sales . Mobile service revenue grew 8 .1% year-on-year, mostly due to the positive development of our postpaid subscription base . Mobile device sales were up 10 .5% . Comparable EBITDA improved 9 .6% in the third quarter and was EUR 83 .6 million, or 35 .0% of net sales .
Our mobile communication subscription base decreased by 35,000 in the review period, due to a decrease in prepaid subscriptions . Our postpaid subscription base increased by 59,000 from the reference period . Revenue per user (ARPU) for mobile communications increased in the July to September period and was EUR 18 .9 . Our customer CHURN rate was 16 .4% . Our fixed-network subscription base grew by 77,000, boosted by new broadband connections .
In September, we launched a new service that can help housing companies save up to 30% on the energy used in heating . Wattinen is a natural service for us to offer, as we are already providing digital services to housing companies and their residents . We believe this type of service will be in demand as climate awareness increases . The service is based on self-learning artificial intelligence . Wattinen decides how to adjust the heating in each room in order to optimise residents’ comfort and the property’s heating energy consumption .
According to the report* released by international telecom analysis provider Tefficient in September, DNA’s customers have the highest mobile data usage in the world . In the first half of 2019, DNA’s mobile data traffic usage per subscription was 23 .5 gigabytes per month, in comparison to 19 .8 gigabytes in the first half of 2018 . 5G technology and improved network services will accelerate the use of mobile data further . Thanks to our advanced network technologies, our relative electricity consumption reduced despite the continuous increase in the use of data . We place great emphasis on the energy efficiency of our networks, and all of our directly procured electricity is renewable .
We will begin the sale of our fixed 5G service based on 5G technology in December . The service will enable a fast and consistent broadband connection for households . To begin with, the service will become available for homes in the residential areas of the major cities, but the availability will be quickly extended to new areas .
In August, Norwegian telecommunications Group Telenor acquired a 54% stake in DNA and became the main shareholder after the completion of transactions with the two then largest owners of DNA, Finda and PHP . Completion of the transaction required Telenor to launch a mandatory public tender offer for all the remaining outstanding shares in DNA . Offer period ended on 10 October and together with the DNA shares acquired by Telenor before the tender offer, Telenor held 97 .87% of all shares in DNA . As a result, Telenor was obliged to make a redemption proceedings for the remaining shares .
We will continue the long-term development of our business, focusing on customer experience, personnel satisfaction and the resulting profitable growth . We have upgraded our guidance for DNA’s net sales in 2019, expecting net sales to increase somewhat . Our guidance for DNA’s EBITDA in 2019, with consideration to the impact of IFRS 16, is expected to increase substantially from 2018 . DNA’s financial position and liquidity are expected to remain at a healthy level .
Jukka LeinonenCEO
Toimitusjohtajan katsaus
DNA:n vuosi 2018 käynnistyi vahvasti. Liikevaihtomme kasvoi4,2 prosenttia 222,3 miljoonaan euroon ja liiketuloksemmekasvoi 23,3 prosenttia 35,6 miljoonaan euroon. Liikevaihtoonvaikutti myönteisesti palveluliikevaihdon kasvu, joka johtuierityisesti matkaviestinliittymien kannan kasvusta ja 4G-liittymien osuuden kasvusta liittymäkannassa. Myösalkuvuoden päätelaitemyynti oli hyvällä tasolla. Operatiivisetinvestoinnit olivat tyypillisesti alkuvuoden osalta matalat, jamyös hieman vertailukautta alhaisemmat.
Matkaviestinverkkomme liittymämäärät kasvoivatvertailukaudesta 79 000 liittymällä. Myös matkaviestinnänliittymäkohtainen liikevaihto (ARPU) kasvoi 19,0 euroonvertailukauden 17,8 eurosta. Liittymäkohtaista liikevaihtoakasvatti mm. asiakkaidemme siirtyminen 3G-liittymistänopeampiin 4G-liittymiin. Kilpailutilanne jatkui kireänä myösvuoden 2018 ensimmäisellä neljänneksellä. Matkaviestinnänasiakasvaihtuvuus (CHURN) oli vertailukautta alhaisemmallatasolla, mutta nousi hieman vuoden lopun tilanteesta.Kiinteiden laajakaista- ja kaapelitelevisioliittymien määräkasvoi vertailukauteen verrattuna 29 000 liittymällä.
Ensimmäisen neljänneksen aikana valokuitusaatavuutemmelaajenivat taloyhtiö- ja yritysasiakkaille Jyväskylään. Yhänopeammat yhteydet ovat jatkuvasti kysytympiänettiyhteyttä käyttävien laitteiden määrän kasvaessakodeissa.
Erinomaisen asiakaskokemuksen ja markkinoita nopeammankannattavan kasvun lisäksi keskeinen strateginentavoitteemme on olla erinomainen työpaikka. Tyytyväinen jamotivoitunut henkilöstö on olennaisen tärkeä perusta sille,että voimme jatkossakin tarjota erinomaisiaasiakaskokemuksia. Pitkään jatkunut työmme henkilöstömmetyytyväisyyden eteen sai helmikuussa 2018 myös ulkoistatunnustusta, kun menestyimme Great Place To Work -
instituutin tutkimuksessa erinomaisesti sijoittuen 2. sijalle suurten yhtiöiden sarjassa.
Arvioimme sekä liikevaihtomme että vertailukelpoisen liiketuloksemme pysyvän vuonna 2018 samalla tasolla kuin vuonna 2017. DNA:nrahoitusaseman ja maksuvalmiuden arvioidaan pysyvän hyvänä. Jatkamme vuonna 2018 toimenpiteitämme asiakaskokemuksenparantamiseksi edelleen ja tavoitteenamme on kehittää sekä monipuolistaa henkilöstömme osaamista entisestään.
Jukka Leinonentoimitusjohtaja
Toimitusjohtajan katsaus
DNA Oyj:n osavuosikatsaus 1-3/2018
3
*Tefficient’s report: https://tefficient .com/mobile-data-operators-1h-2019/
6
DNA Plc's Interim Report 1–9 / 2019
DNA Plc Interim Report 1–9/2019
Operating environment January–September 2019The Finnish economy has been on the growth path, but growth is hampered by the overall economic uncertainty . Both consumer and business confidence has weakened . Competition remained intense after the first half of the year, in mobile communication services in particular .
The use of mobile data continued to grow, boosted by increased adoption of smart phones, tablets and other Internet-connected devices as well as the growing demand for high-speed 4G subscriptions .
A clear trend in Finland right now is the migration of xDSL subscribers to considerably faster fixed cable or fibre optic broadband subscriptions or replacement of xDSL connections with 4G mobile data connections . In addition, a growing number of households uses both fixed-network and mobile broadband .
Use of TV and video services became more versatile . While traditional TV viewing minutes decreased, the use of streaming and on-demand video services continued to grow . More customers are watching HDTV broadcasts, and they also increasingly want to watch content conveniently at a time that works best for them .
Both private and public organisations revamped their operations by switching their voice communications and customer service to mobile solutions . The rising business use of cloud services increases the demand for network capacity and fast fibre optic connections .
Regulation
DNA’s 5G licence entered into force in early 2019 .
The Ministry of Transport and Communications has started the reform of the Act on Electronic Communication Services to implement the requirements of the EU Directive . The new package of directives will mostly be applied to national legislation by the end of 2020 . The cap on the cost of intra-EU mobile calls and texts was applied in the spring of 2019 .
The Ministry of Transport and Communications is preparing a market analysis on the wholesale markets for television and radio services (M18) .
The national data protection law related to personal data entered into force in the beginning of 2019 . EU institutions continued to process the draft ePrivacy regulation in the review period .
Changes related to regulation and decisions of authorities may have significant impacts on DNA’s business .
7
DNA Plc's Interim Report 1–9 / 2019
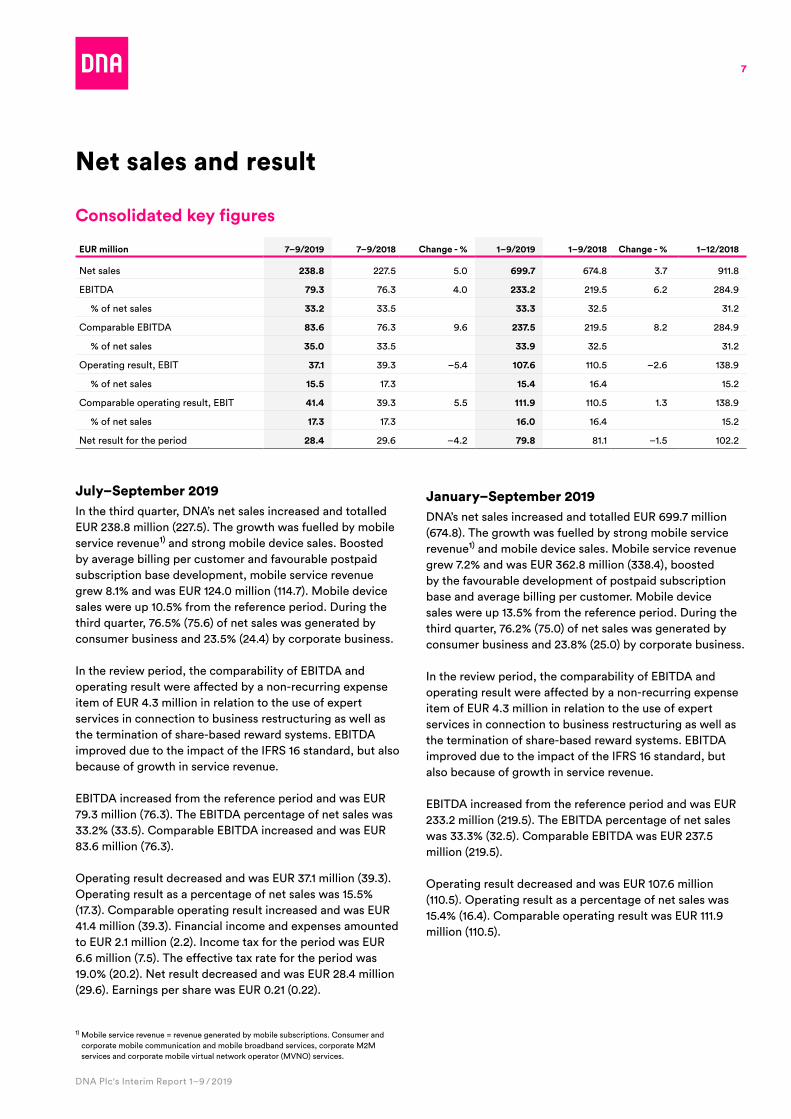
Consolidated key figures
EUR million 7–9/2019 7–9/2018 Change - % 1–9/2019 1–9/2018 Change - % 1–12/2018
Net sales 238.8 227 .5 5 .0 699.7 674 .8 3 .7 911 .8
EBITDA 79.3 76 .3 4 .0 233.2 219 .5 6 .2 284 .9
% of net sales 33.2 33 .5 33.3 32 .5 31 .2
Comparable EBITDA 83.6 76 .3 9 .6 237.5 219 .5 8 .2 284 .9
% of net sales 35.0 33 .5 33.9 32 .5 31 .2
Operating result, EBIT 37.1 39 .3 –5 .4 107.6 110 .5 –2 .6 138 .9
% of net sales 15.5 17 .3 15.4 16 .4 15 .2
Comparable operating result, EBIT 41.4 39 .3 5 .5 111.9 110 .5 1 .3 138 .9
% of net sales 17.3 17 .3 16.0 16 .4 15 .2
Net result for the period 28.4 29 .6 –4 .2 79.8 81 .1 –1 .5 102 .2
Net sales and result
July–September 2019In the third quarter, DNA’s net sales increased and totalled EUR 238 .8 million (227 .5) . The growth was fuelled by mobile service revenue1) and strong mobile device sales . Boosted by average billing per customer and favourable postpaid subscription base development, mobile service revenue grew 8 .1% and was EUR 124 .0 million (114 .7) . Mobile device sales were up 10 .5% from the reference period . During the third quarter, 76 .5% (75 .6) of net sales was generated by consumer business and 23 .5% (24 .4) by corporate business .
In the review period, the comparability of EBITDA and operating result were affected by a non-recurring expense item of EUR 4 .3 million in relation to the use of expert services in connection to business restructuring as well as the termination of share-based reward systems . EBITDA improved due to the impact of the IFRS 16 standard, but also because of growth in service revenue .
EBITDA increased from the reference period and was EUR 79 .3 million (76 .3) . The EBITDA percentage of net sales was 33 .2% (33 .5) . Comparable EBITDA increased and was EUR 83 .6 million (76 .3) .
Operating result decreased and was EUR 37 .1 million (39 .3) . Operating result as a percentage of net sales was 15 .5% (17 .3) . Comparable operating result increased and was EUR 41 .4 million (39 .3) . Financial income and expenses amounted to EUR 2 .1 million (2 .2) . Income tax for the period was EUR 6 .6 million (7 .5) . The effective tax rate for the period was 19 .0% (20 .2) . Net result decreased and was EUR 28 .4 million (29 .6) . Earnings per share was EUR 0 .21 (0 .22) .
1) Mobile service revenue = revenue generated by mobile subscriptions . Consumer and corporate mobile communication and mobile broadband services, corporate M2M services and corporate mobile virtual network operator (MVNO) services .
January–September 2019DNA’s net sales increased and totalled EUR 699 .7 million (674 .8) . The growth was fuelled by strong mobile service revenue1) and mobile device sales . Mobile service revenue grew 7 .2% and was EUR 362 .8 million (338 .4), boosted by the favourable development of postpaid subscription base and average billing per customer . Mobile device sales were up 13 .5% from the reference period . During the third quarter, 76 .2% (75 .0) of net sales was generated by consumer business and 23 .8% (25 .0) by corporate business .
In the review period, the comparability of EBITDA and operating result were affected by a non-recurring expense item of EUR 4 .3 million in relation to the use of expert services in connection to business restructuring as well as the termination of share-based reward systems . EBITDA improved due to the impact of the IFRS 16 standard, but also because of growth in service revenue .
EBITDA increased from the reference period and was EUR 233 .2 million (219 .5) . The EBITDA percentage of net sales was 33 .3% (32 .5) . Comparable EBITDA was EUR 237 .5 million (219 .5) .
Operating result decreased and was EUR 107 .6 million (110 .5) . Operating result as a percentage of net sales was 15 .4% (16 .4) . Comparable operating result was EUR 111 .9 million (110 .5) .
8
DNA Plc's Interim Report 1–9 / 2019
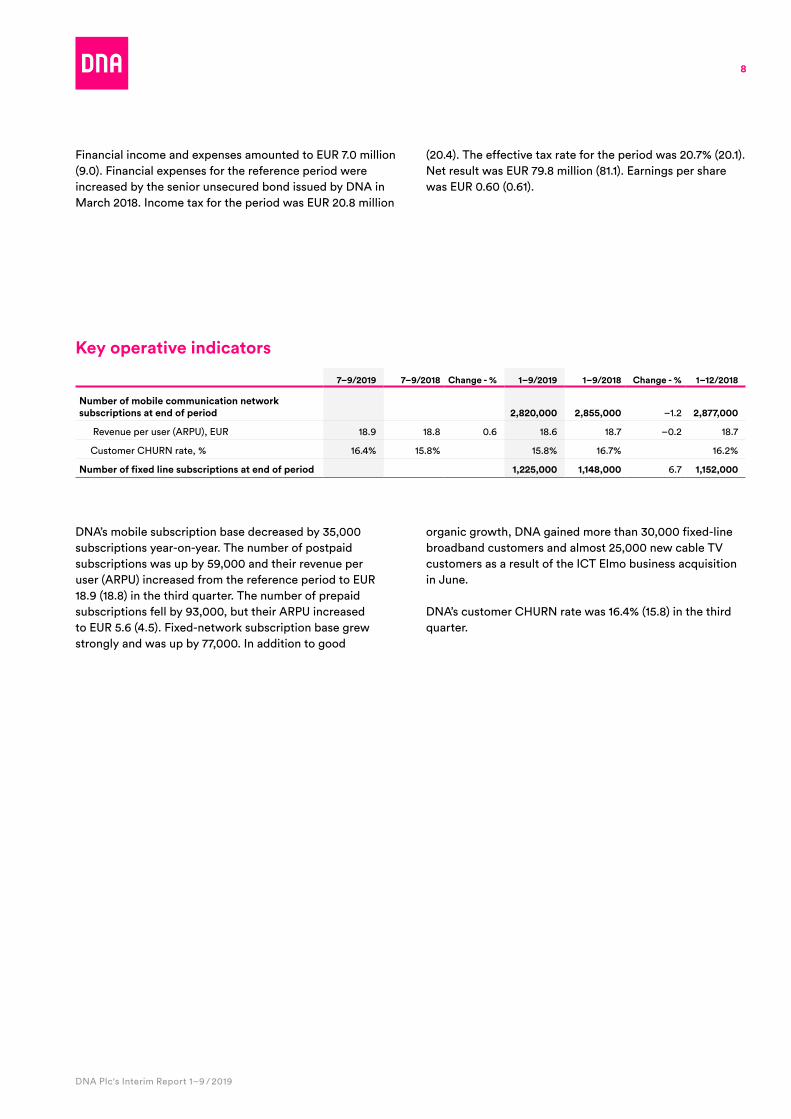
DNA’s mobile subscription base decreased by 35,000 subscriptions year-on-year . The number of postpaid subscriptions was up by 59,000 and their revenue per user (ARPU) increased from the reference period to EUR 18 .9 (18 .8) in the third quarter . The number of prepaid subscriptions fell by 93,000, but their ARPU increased to EUR 5 .6 (4 .5) . Fixed-network subscription base grew strongly and was up by 77,000 . In addition to good
organic growth, DNA gained more than 30,000 fixed-line broadband customers and almost 25,000 new cable TV customers as a result of the ICT Elmo business acquisition in June .
DNA’s customer CHURN rate was 16 .4% (15 .8) in the third quarter .
Key operative indicators
7–9/2019 7–9/2018 Change - % 1–9/2019 1–9/2018 Change - % 1–12/2018
Number of mobile communication network subscriptions at end of period 2,820,000 2,855,000 –1 .2 2,877,000
Revenue per user (ARPU), EUR 18 .9 18 .8 0 .6 18 .6 18 .7 –0 .2 18 .7
Customer CHURN rate, % 16 .4% 15 .8% 15 .8% 16 .7% 16 .2%
Number of fixed line subscriptions at end of period 1,225,000 1,148,000 6 .7 1,152,000
Financial income and expenses amounted to EUR 7 .0 million (9 .0) . Financial expenses for the reference period were increased by the senior unsecured bond issued by DNA in March 2018 . Income tax for the period was EUR 20 .8 million
(20 .4) . The effective tax rate for the period was 20 .7% (20 .1) . Net result was EUR 79 .8 million (81 .1) . Earnings per share was EUR 0 .60 (0 .61) .
9
DNA Plc's Interim Report 1–9 / 2019
Cash flow and financial key figures
EUR million 7–9/2019 7–9/2018 Change - % 1–9/2019 1–9/2018 Change - % 1–12/2018
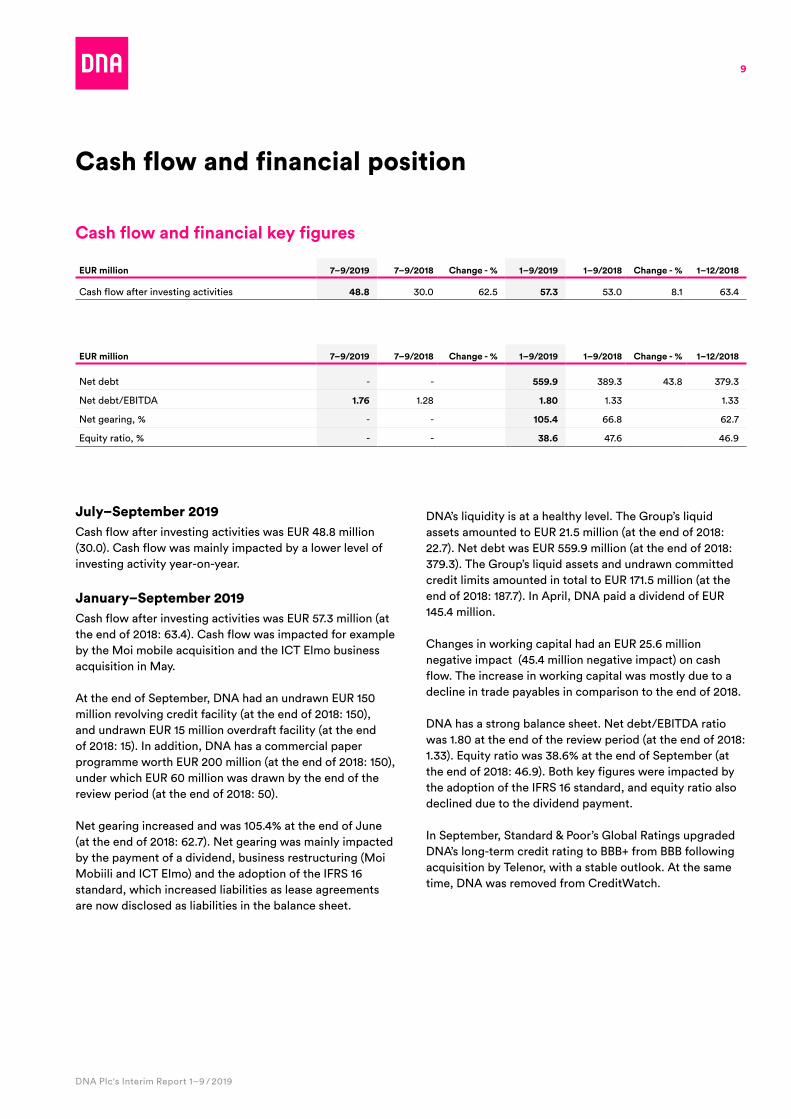
Cash flow after investing activities 48.8 30 .0 62 .5 57.3 53 .0 8 .1 63 .4
EUR million 7–9/2019 7–9/2018 Change - % 1–9/2019 1–9/2018 Change - % 1–12/2018
Net debt - - 559.9 389 .3 43 .8 379 .3
Net debt/EBITDA 1.76 1 .28 1.80 1 .33 1 .33
Net gearing, % - - 105.4 66 .8 62 .7
Equity ratio, % - - 38.6 47 .6 46 .9
July–September 2019Cash flow after investing activities was EUR 48 .8 million (30 .0) . Cash flow was mainly impacted by a lower level of investing activity year-on-year .
January–September 2019Cash flow after investing activities was EUR 57 .3 million (at the end of 2018: 63 .4) . Cash flow was impacted for example by the Moi mobile acquisition and the ICT Elmo business acquisition in May .
At the end of September, DNA had an undrawn EUR 150 million revolving credit facility (at the end of 2018: 150), and undrawn EUR 15 million overdraft facility (at the end of 2018: 15) . In addition, DNA has a commercial paper programme worth EUR 200 million (at the end of 2018: 150), under which EUR 60 million was drawn by the end of the review period (at the end of 2018: 50) . Net gearing increased and was 105 .4% at the end of June (at the end of 2018: 62 .7) . Net gearing was mainly impacted by the payment of a dividend, business restructuring (Moi Mobiili and ICT Elmo) and the adoption of the IFRS 16 standard, which increased liabilities as lease agreements are now disclosed as liabilities in the balance sheet .
Cash flow and financial position
DNA’s liquidity is at a healthy level . The Group’s liquid assets amounted to EUR 21 .5 million (at the end of 2018: 22 .7) . Net debt was EUR 559 .9 million (at the end of 2018: 379 .3) . The Group’s liquid assets and undrawn committed credit limits amounted in total to EUR 171 .5 million (at the end of 2018: 187 .7) . In April, DNA paid a dividend of EUR 145 .4 million .
Changes in working capital had an EUR 25 .6 million negative impact (45 .4 million negative impact) on cash flow . The increase in working capital was mostly due to a decline in trade payables in comparison to the end of 2018 .
DNA has a strong balance sheet . Net debt/EBITDA ratio was 1 .80 at the end of the review period (at the end of 2018: 1 .33) . Equity ratio was 38 .6% at the end of September (at the end of 2018: 46 .9) . Both key figures were impacted by the adoption of the IFRS 16 standard, and equity ratio also declined due to the dividend payment .
In September, Standard & Poor’s Global Ratings upgraded DNA’s long-term credit rating to BBB+ from BBB following acquisition by Telenor, with a stable outlook . At the same time, DNA was removed from CreditWatch .
10
DNA Plc's Interim Report 1–9 / 2019
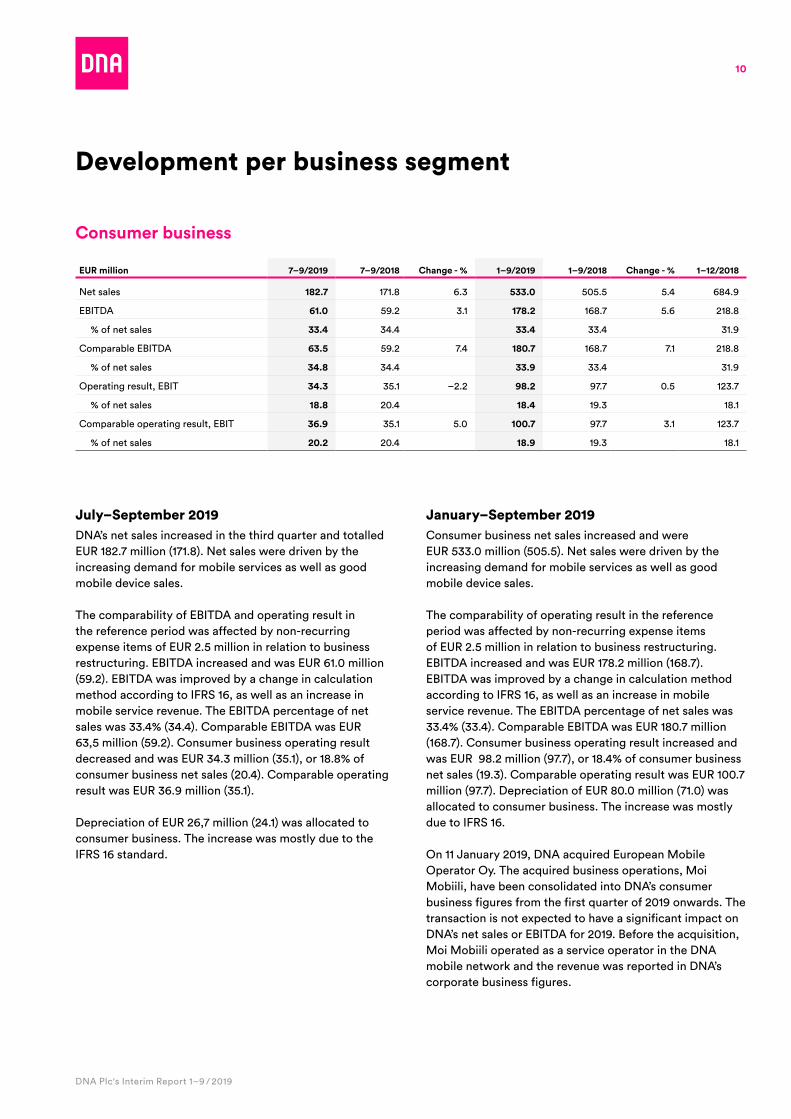
July–September 2019DNA’s net sales increased in the third quarter and totalled EUR 182 .7 million (171 .8) . Net sales were driven by the increasing demand for mobile services as well as good mobile device sales .
The comparability of EBITDA and operating result in the reference period was affected by non-recurring expense items of EUR 2 .5 million in relation to business restructuring . EBITDA increased and was EUR 61 .0 million (59 .2) . EBITDA was improved by a change in calculation method according to IFRS 16, as well as an increase in mobile service revenue . The EBITDA percentage of net sales was 33 .4% (34 .4) . Comparable EBITDA was EUR 63,5 million (59 .2) . Consumer business operating result decreased and was EUR 34 .3 million (35 .1), or 18 .8% of consumer business net sales (20 .4) . Comparable operating result was EUR 36 .9 million (35 .1) .
Depreciation of EUR 26,7 million (24 .1) was allocated to consumer business . The increase was mostly due to the IFRS 16 standard .
Consumer business
EUR million 7–9/2019 7–9/2018 Change - % 1–9/2019 1–9/2018 Change - % 1–12/2018
Net sales 182.7 171 .8 6 .3 533.0 505 .5 5 .4 684 .9
EBITDA 61.0 59 .2 3 .1 178.2 168 .7 5 .6 218 .8
% of net sales 33.4 34 .4 33.4 33 .4 31 .9
Comparable EBITDA 63.5 59 .2 7 .4 180.7 168 .7 7 .1 218 .8
% of net sales 34.8 34 .4 33.9 33 .4 31 .9
Operating result, EBIT 34.3 35 .1 –2 .2 98.2 97 .7 0 .5 123 .7
% of net sales 18.8 20 .4 18.4 19 .3 18 .1
Comparable operating result, EBIT 36.9 35 .1 5 .0 100.7 97 .7 3 .1 123 .7
% of net sales 20.2 20 .4 18.9 19 .3 18 .1
Development per business segment
January–September 2019Consumer business net sales increased and were EUR 533 .0 million (505 .5) . Net sales were driven by the increasing demand for mobile services as well as good mobile device sales .
The comparability of operating result in the reference period was affected by non-recurring expense items of EUR 2 .5 million in relation to business restructuring . EBITDA increased and was EUR 178 .2 million (168 .7) . EBITDA was improved by a change in calculation method according to IFRS 16, as well as an increase in mobile service revenue . The EBITDA percentage of net sales was 33 .4% (33 .4) . Comparable EBITDA was EUR 180 .7 million (168 .7) . Consumer business operating result increased and was EUR 98 .2 million (97 .7), or 18 .4% of consumer business net sales (19 .3) . Comparable operating result was EUR 100 .7 million (97 .7) . Depreciation of EUR 80 .0 million (71 .0) was allocated to consumer business . The increase was mostly due to IFRS 16 .
On 11 January 2019, DNA acquired European Mobile Operator Oy . The acquired business operations, Moi Mobiili, have been consolidated into DNA’s consumer business figures from the first quarter of 2019 onwards . The transaction is not expected to have a significant impact on DNA’s net sales or EBITDA for 2019 . Before the acquisition, Moi Mobiili operated as a service operator in the DNA mobile network and the revenue was reported in DNA’s corporate business figures .
11
DNA Plc's Interim Report 1–9 / 2019
Corporate business
EUR million 7–9/2019 7–9/2018 Change - % 1–9/2019 1–9/2018 Change - % 1–12/2018
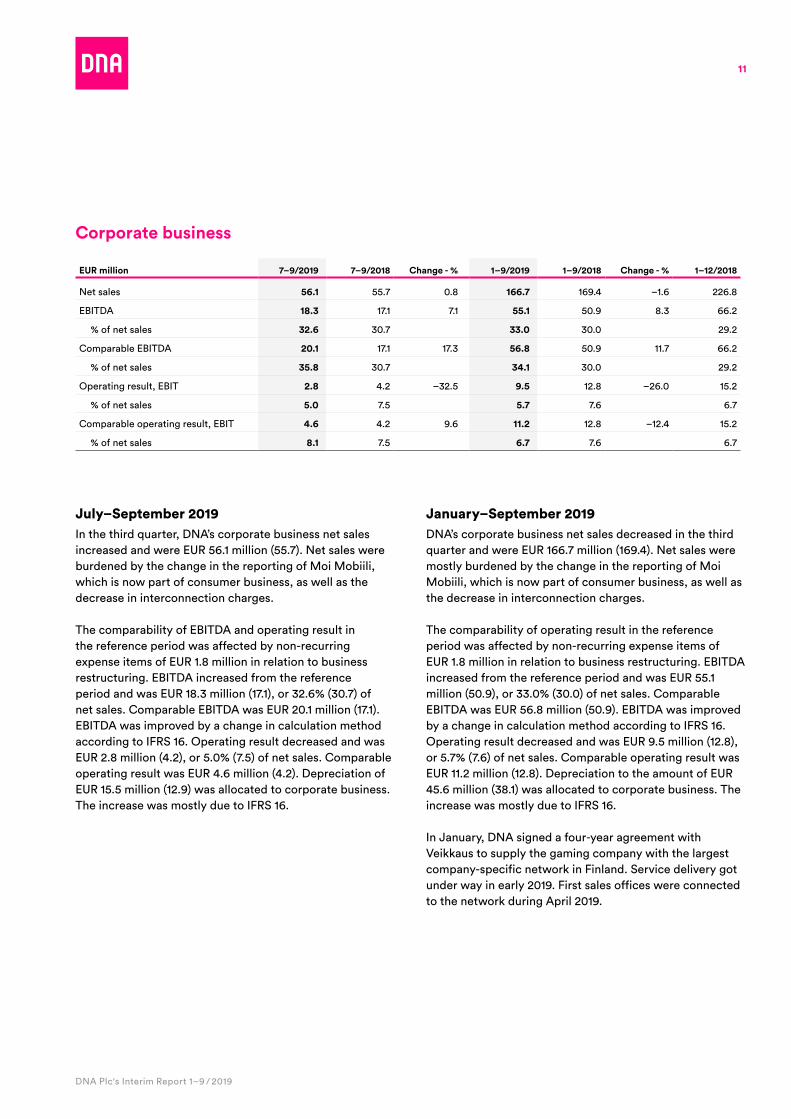
Net sales 56.1 55 .7 0 .8 166.7 169 .4 –1 .6 226 .8
EBITDA 18.3 17 .1 7 .1 55.1 50 .9 8 .3 66 .2
% of net sales 32.6 30 .7 33.0 30 .0 29 .2
Comparable EBITDA 20.1 17 .1 17 .3 56.8 50 .9 11 .7 66 .2
% of net sales 35.8 30 .7 34.1 30 .0 29 .2
Operating result, EBIT 2.8 4 .2 –32 .5 9.5 12 .8 –26 .0 15 .2
% of net sales 5.0 7 .5 5.7 7 .6 6 .7
Comparable operating result, EBIT 4.6 4 .2 9 .6 11.2 12 .8 –12 .4 15 .2
% of net sales 8.1 7 .5 6.7 7 .6 6 .7
July–September 2019In the third quarter, DNA’s corporate business net sales increased and were EUR 56 .1 million (55 .7) . Net sales were burdened by the change in the reporting of Moi Mobiili, which is now part of consumer business, as well as the decrease in interconnection charges .
The comparability of EBITDA and operating result in the reference period was affected by non-recurring expense items of EUR 1 .8 million in relation to business restructuring . EBITDA increased from the reference period and was EUR 18 .3 million (17 .1), or 32 .6% (30 .7) of net sales . Comparable EBITDA was EUR 20 .1 million (17 .1) . EBITDA was improved by a change in calculation method according to IFRS 16 . Operating result decreased and was EUR 2 .8 million (4 .2), or 5 .0% (7 .5) of net sales . Comparable operating result was EUR 4 .6 million (4 .2) . Depreciation of EUR 15 .5 million (12 .9) was allocated to corporate business . The increase was mostly due to IFRS 16 .
January–September 2019DNA’s corporate business net sales decreased in the third quarter and were EUR 166 .7 million (169 .4) . Net sales were mostly burdened by the change in the reporting of Moi Mobiili, which is now part of consumer business, as well as the decrease in interconnection charges .
The comparability of operating result in the reference period was affected by non-recurring expense items of EUR 1 .8 million in relation to business restructuring . EBITDA increased from the reference period and was EUR 55 .1 million (50 .9), or 33 .0% (30 .0) of net sales . Comparable EBITDA was EUR 56 .8 million (50 .9) . EBITDA was improved by a change in calculation method according to IFRS 16 . Operating result decreased and was EUR 9 .5 million (12 .8), or 5 .7% (7 .6) of net sales . Comparable operating result was EUR 11 .2 million (12 .8) . Depreciation to the amount of EUR 45 .6 million (38 .1) was allocated to corporate business . The increase was mostly due to IFRS 16 .
In January, DNA signed a four-year agreement with Veikkaus to supply the gaming company with the largest company-specific network in Finland . Service delivery got under way in early 2019 . First sales offices were connected to the network during April 2019 .
12
DNA Plc's Interim Report 1–9 / 2019
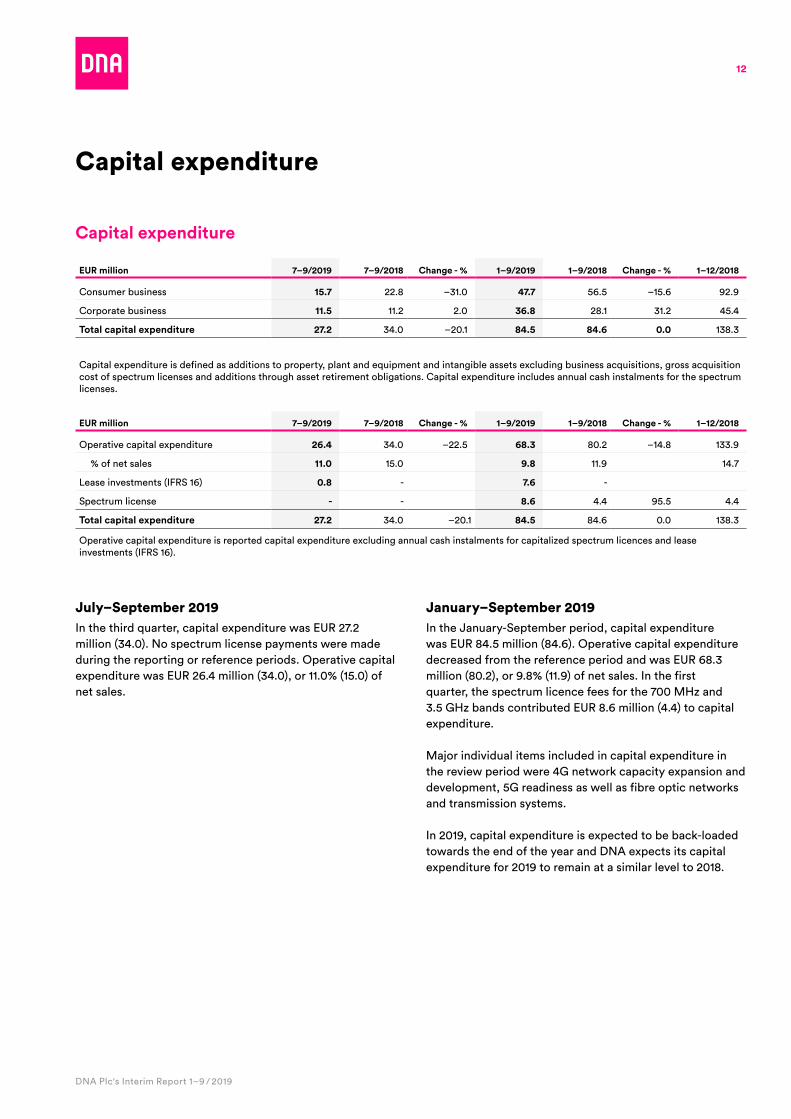
July–September 2019In the third quarter, capital expenditure was EUR 27 .2 million (34 .0) . No spectrum license payments were made during the reporting or reference periods . Operative capital expenditure was EUR 26 .4 million (34 .0), or 11 .0% (15 .0) of net sales .
January–September 2019In the January-September period, capital expenditure was EUR 84 .5 million (84 .6) . Operative capital expenditure decreased from the reference period and was EUR 68 .3 million (80 .2), or 9 .8% (11 .9) of net sales . In the first quarter, the spectrum licence fees for the 700 MHz and 3 .5 GHz bands contributed EUR 8 .6 million (4 .4) to capital expenditure .
Major individual items included in capital expenditure in the review period were 4G network capacity expansion and development, 5G readiness as well as fibre optic networks and transmission systems .
In 2019, capital expenditure is expected to be back-loaded towards the end of the year and DNA expects its capital expenditure for 2019 to remain at a similar level to 2018 .
Capital expenditure
EUR million 7–9/2019 7–9/2018 Change - % 1–9/2019 1–9/2018 Change - % 1–12/2018
Consumer business 15.7 22 .8 –31 .0 47.7 56 .5 –15 .6 92 .9
Corporate business 11.5 11 .2 2 .0 36.8 28 .1 31 .2 45 .4
Total capital expenditure 27.2 34 .0 –20 .1 84.5 84.6 0.0 138 .3
Capital expenditure is defined as additions to property, plant and equipment and intangible assets excluding business acquisitions, gross acquisition cost of spectrum licenses and additions through asset retirement obligations . Capital expenditure includes annual cash instalments for the spectrum licenses .
EUR million 7–9/2019 7–9/2018 Change - % 1–9/2019 1–9/2018 Change - % 1–12/2018
Operative capital expenditure 26.4 34 .0 –22 .5 68.3 80 .2 –14 .8 133 .9
% of net sales 11.0 15 .0 9.8 11 .9 14 .7
Lease investments (IFRS 16) 0.8 - 7.6 -
Spectrum license - - 8.6 4 .4 95 .5 4 .4
Total capital expenditure 27.2 34 .0 –20 .1 84.5 84 .6 0 .0 138 .3
Operative capital expenditure is reported capital expenditure excluding annual cash instalments for capitalized spectrum licences and lease investments (IFRS 16) .
Capital expenditure
13
DNA Plc's Interim Report 1–9 / 2019
DNA makes continuous investments in mobile and fixed networks to keep providing high-quality connections to support the growing use of devices and digital services . DNA’s 4G network reaches almost 100% of the population in mainland Finland . In the third quarter of 2019, mobile data volumes in DNA’s network were up 23% year-on-year .
DNA has been systematically preparing its mobile network for 5G with the introduction of 5G-capable technology and increased network capacity . As a result, data speeds in the 4G network have improved despite the growth of traffic volumes . DNA’s mobile network is NB-IoT and LTE-M ready . DNA’s M2M subscription base was boosted by building automation systems, the energy sector and the Internet of Things (IoT) .
DNA’s network was upgraded to higher performance and 5G deployment capability in several cities . DNA has been testing the fixed 5G comprehensively in both Vantaa and Hyvinkää and will now move from the testing stage to providing the service commercially . The sales of the fixed 5G service will begin in December . The service will enable a fast and consistent broadband connection for households . To begin with, the service will become available for homes in the residential areas of the major cities, but the availability will be quickly extended to new areas .
DNA was the first operator in Finland to introduce the Domain Name System Security Extensions (DNSSEC) feature, which significantly increases data security for customers . This feature ensures that, instead of a fraudulent copy of a website, the users of online services are directed to the genuine website of the service they want to use .
According to Tefficient’s latest report*, DNA’s customers have the highest mobile data usage in the world . DNA’s data usage per subscription continued to grow in the first quarter of 2019, averaging 23 .5 gigabytes per month . Most of the data transferred in the mobile network is from different video-based services, such as YouTube and Netflix . Thanks to DNA’s advanced network technologies, we can reduce the relative per-data consumption of electricity despite the continuous increase in the use of data .
*Tefficient’s report: https://tefficient .com/mobile-data-operators-1h-2019/ Tefficient is an international telecommunications specialist providing analysis, benchmarking and consulting services .
DNA acquired ICT Elmo Oy’s consumer business and extensive fibre optic network in the Tampere regionOn 31 May 2019, DNA announced the acquisition of ICT Elmo Oy’s consumer business and extensive fibre optic network . The net sales of the acquired business in 2018 was around EUR 8 million DNA has been a major customer of ICT Elmo’s operator business . The total acquisition price is EUR 27 .5 million, which equates to an EV/EBITDA of approximately 6 .1x with cost synergies considered . DNA will be taking over fewer than 20 members of ICT Elmo’s staff . The acquired business will not have a significant impact on DNA’s net sales or EBITDA in 2019 . The acquired business operations have been consolidated into DNA’s figures as of the beginning of June .
Competition authorities approved the sale of DNA’s terrestrial network pay-TV businessOn 12 September, Finnish competition authorities approved the sale of DNA’s terrestrial pay-television business to Digita, which was announced in July . The handover will take place on 1 January 2020 . DNA will continue its operations as the leading pay-TV operator in the cable and broadband networks . The parties will not be disclosing the sale price .
Network infrastructure and new technologies
14
DNA Plc's Interim Report 1–9 / 2019
Personnel by business segment
30 September
201930 September
2018 Change %31 December
2018
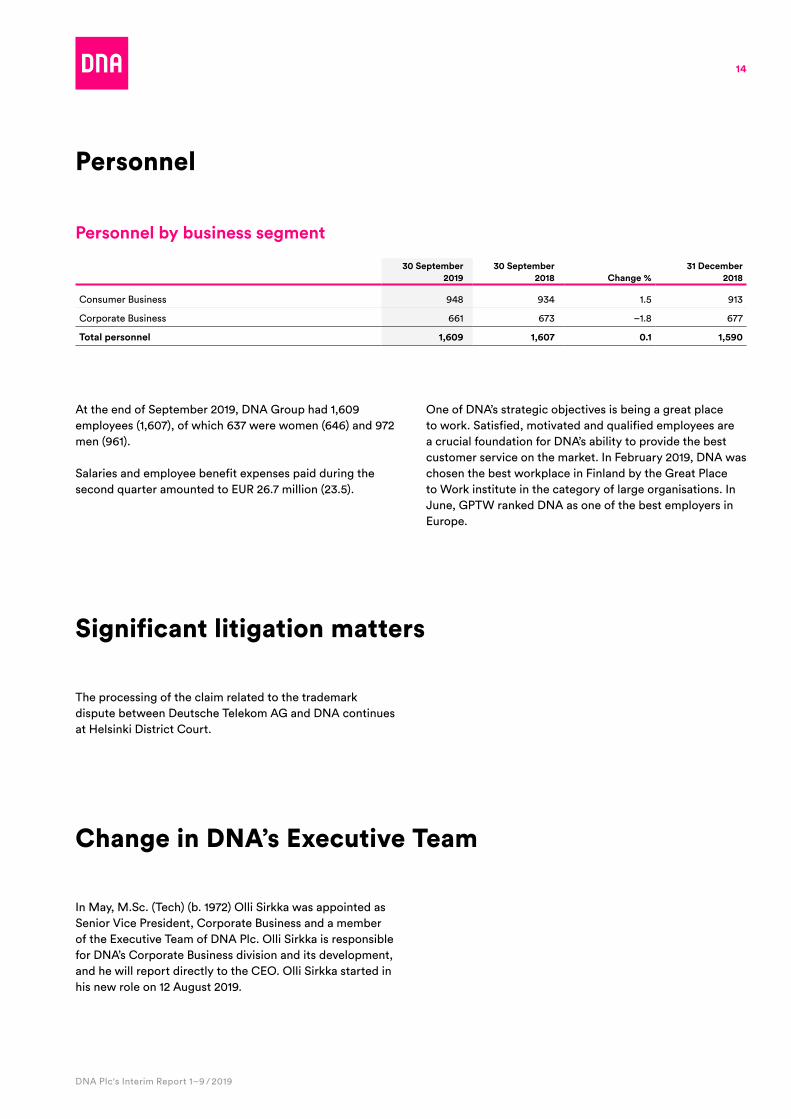
Consumer Business 948 934 1 .5 913
Corporate Business 661 673 –1 .8 677
Total personnel 1,609 1,607 0.1 1,590
At the end of September 2019, DNA Group had 1,609 employees (1,607), of which 637 were women (646) and 972 men (961) .
Salaries and employee benefit expenses paid during the second quarter amounted to EUR 26 .7 million (23 .5) .
One of DNA’s strategic objectives is being a great place to work . Satisfied, motivated and qualified employees are a crucial foundation for DNA’s ability to provide the best customer service on the market . In February 2019, DNA was chosen the best workplace in Finland by the Great Place to Work institute in the category of large organisations . In June, GPTW ranked DNA as one of the best employers in Europe .
Personnel
The processing of the claim related to the trademark dispute between Deutsche Telekom AG and DNA continues at Helsinki District Court .
Significant litigation matters
Change in DNA’s Executive Team
In May, M .Sc . (Tech) (b . 1972) Olli Sirkka was appointed as Senior Vice President, Corporate Business and a member of the Executive Team of DNA Plc . Olli Sirkka is responsible for DNA’s Corporate Business division and its development, and he will report directly to the CEO . Olli Sirkka started in his new role on 12 August 2019 .
15
DNA Plc's Interim Report 1–9 / 2019
DNA’s Annual General Meeting was held in Helsinki on 28 March 2019 . In total, 476 shareholders were present or represented at the meeting, representing 79% of the votes . The AGM adopted the financial statements and discharged the Board of Directors and the CEO from liability forthe financial period 2018 .
Dividend was confirmed to be EUR 0 .70 per share and additional dividend EUR 0 .40 per share, in total EUR 1 .10 per share . The dividend was paid on 10 April 2019 .
The AGM approved the Nomination Committee’s proposal of 21 January 2019 concerning the election and remuneration of Board members . The number of Board members was confirmed to be seven . Re-elected members include Pertti Korhonen, Anu Nissinen, Tero Ojanperä, Jukka Ottela and Kirsi Sormunen . Anni Ronkainen and Ted Roberts were elected as new board members . The term of office of the Board members will last until the end of the next Annual General Meeting .
The AGM decided not to change the remunerations paid to the members of the Board of Directors . The Chairman of the Board is paid an annual remuneration of EUR 144,000 and each Board member EUR 48,000 . Further, it was confirmed that the meeting fee per Board meeting will be EUR 1,050 . The meeting fees of permanent committees of the Board were confirmed to be EUR 1,050 per meeting to Committee Chairs and EUR 525 to committee members .
Authorised Public Accountants Ernst & Young was elected as the company’s auditor . APA Terhi Mäkinen acts as the principal auditor .
The AGM approved the proposal of the Board of Directors to authorise the Board to decide on the repurchase of own shares of the company, as well as to decide on a share issue, to dispose of own shares held by the company and an issue of special rights . The minutes of the General Meeting are available at https://corporate .dna .fi/investors/governance/general-meetings .
Decisions of Annual General Meeting
At the constitutive meeting of the Board of Directors held after the Annual General Meeting, Pertti Korhonen was elected Chairman, and members of the Audit Committee and the Personnel Committee were elected from among the Board members . Audit Committee members are Kirsi Sormunen (Chair), Jukka Ottela, Ted Roberts and Tero Ojanperä . Personnel Committee members are Pertti Korhonen (Chair), Anni Ronkainen, Anu Nissinen and Jukka Ottela .
Composition of the Shareholders’ Nomination CommitteeThe Shareholders’ Nomination Committee consists of three members appointed by the shareholders . The three shareholders whose portion of the votes conferred by all the shares in the company according to the shareholders’ register, maintained by Euroclear Finland Ltd, is the greatest on 1 September are entitled to appoint the committee members .
DNA’s three largest shareholders appointed the following representatives to the Shareholders’ Nomination Committee on 1 September 2019:
■ Gaute Simen Gravir, Director, Telenor Finland Holding Oy
■ Esko Torsti, Director, Ilmarinen Mutual Pension Insurance Company
■ Satu Huber, Chief Executive Officer, Elo Mutual Pension Insurance Company
In addition, Pertti Korhonen, Chairman of DNA’s Board of Directors, will serve as the Nomination Committee's expert member .
Gaute Simen Gravir was elected as the Committee Chair .
The Shareholders’ Nomination Committee is tasked with the preparation of proposals for the General Meeting regarding Board members’ election and compensation .
16
DNA Plc's Interim Report 1–9 / 2019
SharesDNA’s share is traded on Nasdaq Helsinki (the Helsinki Stock Exchange) . On 30 September 2019, DNA’s registered shares totalled 132,303,500 (132,303,500) and the share capital registered in the Finnish Trade Register amounted to EUR 72,702,225 .65 (EUR 72,702,225 .65) . At the end of September, the Group held 121,316 treasury shares . In March 2019, a total of 61,473 treasury shares were handed over to participants of the Group’s long-term share-based reward system (Bridge Plan 2018) .
In the January-September period, a total of 113,602,627 million DNA shares, totalling EUR 2,338 million, were traded on the Nasdaq Helsinki Stock Exchange . The highest quotation was EUR 21 .46 and the lowest EUR 16 .52 . The average rate was EUR 19 .64 and volume-weighted average rate EUR 18 .65 . The closing quotation on the last trading day of the review period, 30 September 2019, was EUR 20 .59 and the market capitalisation (without DNA’s holding of its own shares) was EUR 2 .759 billion (EUR 2 .257 billion at end of 2018) .
Shares and shareholders
Shareholders and flagging notificationsAt the end of September, the number of registered shareholders totalled 13,466, nominee registrations included (11) . The proportion of nominee registrations and direct foreign shareholders at the end of 2018 was 27 .65% .
On 30 September 2019, the largest shareholders of DNA Plc were Telenor Finland Holding Oy (54 .04), Ilmarinen Mutual Pension Insurance Company (2 .82) and Elo Mutual Pension Insurance Company (1 .72) . At the end of the review period, they held a total of 58 .58% of DNA’s shares and voting rights .
On 9 April 2019, the Norwegian Telenor Group announced that it had entered into separate agreements with Finda and PHP to acquire 54% of the shares in the Finnish telecom operator DNA for EUR 20 .90 per share in cash .
On 21 August 2019 Finda Telecoms and PHP Holding issued a flagging notice on the share transaction completed the same day, the completion bringing their share of ownership and votes in DNA to 0% . At the time of the transaction, Finda Telecoms held 37,385,454 shares in DNA, corresponding to 28 .3% of shares and votes . At the time of the transaction, PHP Holding Oy held 34,105,827 shares in DNA, corresponding to 25 .78% of shares and votes . The same day, Telenor Finland Oy (a wholly-owned subsidiary of Telenor ASA) issued a flagging notice of its share of ownership in DNA exceeding 50% .
Completion of the transaction required Telenor to launch a mandatory public tender offer for all the remaining DNA shares .
After the review period, on 2 October 2019, Telenor issued a notice after its holding of the shares exceeded 2/3 or 90% as a result of the transactions completed at the end of the initial offer period . According to the notice, Telenor holding was 94 .46% of shares and votes in DNA . On 16 October 2019, after the closing of offerperiod, Telenors’ holding in
DNA was 97,87%
17
DNA Plc's Interim Report 1–9 / 2019
Telenor’s tender offer for DNA sharesNorwegian telecommunications Group Telenor announced on 9 April 2019 that it will acquire the shares in DNA from the two largest shareholders, Finda Telecoms Oy and PHP Holding Oy, in total 54% of the shares . Completion of the agreements was subject to certain conditions, including approval by the general meetings of Finda Telecoms and PHP Holding, as well as approval by the European Commission and Finnish authorities . The transaction between DNA’s two largest shareholders and Telenor was carried out on 21 August and as a result, Telenor was obliged to launch a mandatory public tender offer for all the remaining outstanding shares in DNA . Telenor published and launched the tender offer on 29 August 2019, offering a cash consideration of EUR 20 .90 per share .
On 3 September 2019, DNA’s Board of Directors issued a statement regarding the mandatory tender offer by Telenor, stating that the consideration offered by Telenor is fair .
The offer period ended on 10 October 2019 . The shares tendered during the offer period represent 43,84% of all shares in DNA . Together with the DNA shares acquired by Telenor before the tender offer, Telenor holds 97,87% of all shares in DNA .
As Telenor’s holding in DNA after the tender offer period is more than nine-tenths of all DNA shares and votes, Telenor will commence mandatory redemption proceedings for the remaining shares in accordance with the Finnish Companies Act after the end of the offer period . DNA expects that Telenor will procure that DNA apply for the delisting of its shares from Nasdaq Helsinki following this .
Telenor may continue to acquire shares in DNA also in trading organised by Nasdaq Helsinki Ltd on a regulated market or otherwise at a price not exceeding the offer price of EUR 20 .90 per share .
Shares and shareholders
18
DNA Plc's Interim Report 1–9 / 2019
In February, DNA updated its medium-term objectives with respect to EBITDA margin and profit distribution policy . The new EBITDA margin goal was set with consideration to the impact of the adoption of the IFRS 16 standard from the beginning of 2019, which is estimated to have a positive impact of approximately EUR 17 million in EBITDA in 2019 . The impact of IFRS 16 on operating result (EBIT) is insignificant .
DNA’s medium-term financial objectives: ■ net sales growth faster than average market growth ■ EBITDA margin of at least 34% ■ operative capital expenditure less than 15% of net sales
(excluding capitalized spectrum licence payments and the effect of IFRS16)
■ net debt/EBITDA ratio of less than 2 .0 which may temporarily be exceeded if DNA finds attractive opportunities that allow the company to complement its offering in existing markets .
DNA’s dividend policy: DNA’s goal is to pay a growing dividend to its shareholders or by other means to return capital equalling 80–100% of the net profit for the period . In addition, the Board of Directors may consider the distribution of excess profit to shareholders for a specific financial period . When making the profit distribution decision, the Board of Directors will take into account the company’s financial status and financial position as well as future funding needs and financial objectives .
DNA continued to implement its updated corporate responsibility strategy in the third quarter of 2019 . DNA’s responsibility strategy has four key areas: digital inclusion, being a great place to work, climate-friendly operations and good governance .
DNA’s key climate objective is to reduce energy indirect greenhouse gas emissions (Scope 2) by 100% by 2023 from the level reported in 2014 . DNA continued the further development of emission calculations and reporting in the third quarter .
DNA also launched a responsibility programme to promote digital inclusion in Finland by supporting the work of SOS Children’s Villages Finland, HelsinkiMissio and Hope to prevent digital exclusion of children and the young, senior citizens as well as low-income families . To date, the programme has supported the inclusion of hundreds of people through donated devices and support for digital skills .
During the spring and early summer, practically all supervisors at DNA participated in training sessions on responsible decision-making, highlighting the principles of good governance according to DNA’s values .
DNA’s financial objectives and dividend policy
Corporate responsibility
19
DNA Plc's Interim Report 1–9 / 2019
DNA Shareholders’ Nomination Committee’s proposal for the Extraordinary General Meeting 2019On 1 October 2019, the Shareholders’ Nomination Committee submitted a proposal regarding Board members and their remuneration to DNA’s Extraordinary General Meeting . The Shareholders’ Nomination Committee proposed to the Extraordinary General Meeting that the number of Board members be seven and proposed re-election of current members Anni Ronkainen, Kirsi Sormunen and Tero Ojanperä . Furthermore, the Nomination Committee proposes the election of Jørgen Arentz-Rostrup, Ulrika Steg, Fredric Scott Brown and Nils Katla as new Board members . The new members are not independent of a major shareholder . All of the persons proposed to be nominated to the Board have given their consent to being nominated . The Shareholders’ Nomination Committee proposes that the remuneration of the Board of Directors remain unchanged and that those Board members who are non-independent of DNA Plc’s shareholders will resign their entitlement for the reward .
Notice of DNA Plc's Extraordinary General Meeting On 1 October 2019, the shareholders of DNA Plc were invited to an Extraordinary General Meeting, which will be held in Helsinki on 31 October 2019 . Main matters on the agenda include the Shareholders’ Nomination Committee’s proposal regarding the number of Board members, the composition of the Board and the members’ remuneration . A shareholder who is registered in the company’s shareholder register kept by Euroclear Finland Ltd on 21 October 2019 (the record date of the Extraordinary General Meeting), is entitled to attend the Extraordinary General Meeting and must register for the meeting no later than 10 .00am on 28 October 2019 .
A holder of nominee-registered shares must be temporarily entered in the shareholder register kept by Euroclear Finland Ltd no later than 10 .00am on 28 October 2019 . As regards nominee-registered shares, this is considered to constitute due registration to the Extraordinary General Meeting . The Extraordinary General Meeting will be held in Finnish with simultaneous interpretation provided into English .
DNA’s incentive schemes and matching shares plan terminatedOn 3 October 2019, DNA’s Board of Directors resolved to terminate DNA’s long-term share-based incentive schemes for senior executives and other key employees and the matching shares plan for its personnel . The Board of Directors also resolved on the payment of rewards thereunder in cash .
The Norwegian telecommunications company Telenor has gained control in DNA, which event constitutes grounds, pursuant to the terms and conditions of the long-term share-based incentive schemes and the matching shares plan, for the schemes’ and the plan’s accelerated termination and for the payment of any rewards thereunder in cash instead of shares . The cash reward amounts to approximately EUR 14 million in total . As a result of the cash reward, EUR 2 million is recognized as an expense in the income statement in September 2019 .
See note 10 for more information on DNA’s share-based incentive scheme .
Events after the review period
20
DNA Plc's Interim Report 1–9 / 2019
According to the company, there have been no significant changes in near-term risks and uncertainties in the review period .
Strategic and operative risks The Finnish telecommunications market is characterised by tough competition between established operators, and a high degree of penetration of telecommunications solutions . DNA mainly operates in Finland, a market where, for instance, the number of mobile phones per capita is among the highest in the world, which limits the prospects of future growth in the number of subscriptions .
DNA analyses changes in the operating environment and the resulting possible new business opportunities, which always involve higher risks than conventional and established business operations .
International players have a strong presence in the competitive environment of TV and entertainment services . DNA’s competitors include traditional operators, but increasingly also OTT (over-the-top) service providers that deliver content over the Internet to mobile devices . The role of media companies’ own distribution channels and services is also becoming more important .
The ongoing shift in media use will provide both new risks and opportunities, for example while content rights are being negotiated . DNA monitors the TV and entertainment service market intensively and continuously enhances its service offering to anticipate changes in the market .
The nature of DNA’s operations and customer requirements place high demands on DNA’s information systems and network infrastructure . DNA’s business is capital-intensive, and continuous maintenance and improvement of the Group’s network infrastructure is essentially linked to its success .
DNA makes significant investments in high-quality data systems and data analytics tools to deepen customer understanding and to create a good omnichannel customer experience . DNA’s business operations are dependent on information systems, which involve several interconnected risks but also provide business-critical opportunities for utilising data .
Use of mobile devices that have a constant network connection is increasing strongly among both business and private users . The Internet of Things (IoT) will further expand the volume of data traffic . As the IoT becomes more common, for example through the introduction of new kinds of smart devices, the role of good information security, data security and high operational network reliability gain in importance .
Global trade uncertainty may have an impact on DNA’s subcontractors and partners and their product availability, service quality and reliability as well as customer behaviour .
Regulatory risksBoth national and EU regulation have significant impact on the operation of the telecommunications market in Finland . Regulatory influence on the price level of DNA’s products and services as well as the wholesale products that DNA procures from other operators and the criteria used in distributing frequencies, may have a significant impact on DNA’s business .
Regulatory initiatives indicating significant risks to DNA include the national implementation of the new European Electronic Communications Code, EU regulation on the data protection of electronic communications and authority decisions on significant market power (SMP) .
Financing risksIn order to manage the interest rate risk, the Group’s borrowings have been spread between fixed- and variable-rate instruments . In order to manage liquidity risk, in addition to liquid assets the Group uses credit limits . To manage customer credit risk, the credit history of new customers is checked as part of the ordering process . The Group’s foreign interest risk is insignificant, since the majority of its cash flow is euro denominated .
Damage riskIn anticipation of possible unforeseen damage risks, DNA has continuous insurance policies covering aspects of its operations including personnel, property, business interruption, third-party liability and criminal action . There is a specific insurance in place for cyber damage risks . Damage risks are prevented and minimised by means such as security guidelines and personnel training .
Near-term risks and uncertainties
21
DNA Plc's Interim Report 1–9 / 2019
Market outlookAccording to the Bank of Finland, the Finnish economy will continue to expand, but growth has passed its cyclical peak . We expect the mobile network service market growth to slow down and competition to remain intense for mobile communication services .
Mobile data use will continue to grow as private and business users increase their use of digital servicesand OTT video services . This trend will expand the number of high-speed 4G subscriptions as well as mobile data usage per subscription . The share of 4G subscriptions in DNA’s mobile subscription base is expected to grow, but at a more moderate rate . We expect the sales of 5G subscriptions to start early 2020 in connection with more technically advanced devices available . Use of mobile devices that have a constant network connection and IP-based communication solutions is increasing strongly among both business and private users .
In the mobile communication network, the volume of SMS and voice traffic is expected to continue to fall . The decline of the market for fixed-network voice services is expected to continue .
In the consumer market, demand for fast broadband subscriptions and entertainment services is expected to increase, driven in particular by the popularity of streaming and on-demand video services . The demand for traditional pay-TV services is expected to decline further .
Fixed-network broadband customers are expected to continue to switch to housing association broadband subscriptions and faster speeds . The fixed-network broadband subscription base is expected to remain at its current level . Growing use of services such as cloud and entertainment services increases the demand for high-speed and high-performance networks .
Private and public-sector organisations are digitising their services and creating new digital business, which makes the availability of networks and services vital . More mobile and versatile ways of working will boost demand for services such as cloud and video conference services . Companies transfer their applications to the cloud to increase their operational efficiency, which will boost the demand for secure high-speed connections .
Outlook for 2019
The demand for Industrial Internet solutions and M2M (Machine to Machine) subscriptions is expected to grow . As the IoT becomes more common, the role of good information security, data security and high operational network reliability gain in importance .
DNA sees fixed wireless broadband access as one of the first applications to strongly benefit from 5G technology . This makes high-quality connections possible for buildings without ready access to a fibre optic connection or where acquiring a fibre optic connection would be prohibitively expensive . In the 2020s, 5G technology is likely to have a broad range of other applications in areas such as smart traffic and health care .
DNA’s guidance for 2019 DNA’s net sales in 2019 are expected to increase somewhat, and EBITDA in 2019 is expected to increase substantially from 2018 . DNA’s financial position and liquidity are expected to remain at a healthy level .
DNA’s guidance for 2019 is disclosed with consideration to the impact of the adoption of IFRS 16 . The adoption of IFRS 16 from the beginning of 2019 is estimated to have a positive impact of approximately EUR 17 million in EBITDA in 2019 . The impact of IFRS 16 on operating result (EBIT) is insignificant .
DNA Plc Board of Directors
22
DNA Plc's Interim Report 1–9 / 2019
Group key figures
1 Jul–30 Sep 2019
1 Jul–30 Sep 2018
1 Jan–30 Sep 2019
1 Jan–30 Sep 2018
1 Jan–31 Dec 2018
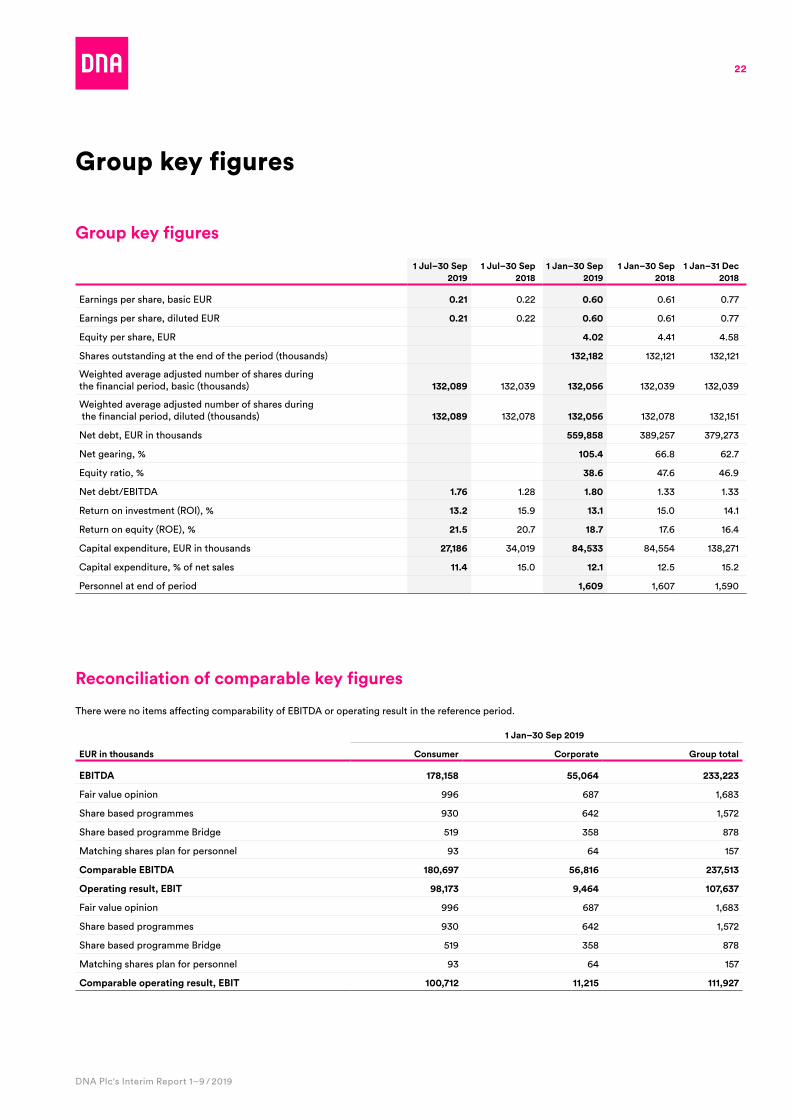
Earnings per share, basic EUR 0.21 0 .22 0.60 0 .61 0 .77
Earnings per share, diluted EUR 0.21 0 .22 0.60 0 .61 0 .77
Equity per share, EUR 4.02 4 .41 4 .58
Shares outstanding at the end of the period (thousands) 132,182 132,121 132,121
Weighted average adjusted number of shares during the financial period, basic (thousands) 132,089 132,039 132,056 132,039 132,039
Weighted average adjusted number of shares during the financial period, diluted (thousands) 132,089 132,078 132,056 132,078 132,151
Net debt, EUR in thousands 559,858 389,257 379,273
Net gearing, % 105.4 66 .8 62 .7
Equity ratio, % 38.6 47 .6 46 .9
Net debt/EBITDA 1.76 1 .28 1.80 1 .33 1 .33
Return on investment (ROI), % 13.2 15 .9 13.1 15 .0 14 .1
Return on equity (ROE), % 21.5 20 .7 18.7 17 .6 16 .4
Capital expenditure, EUR in thousands 27,186 34,019 84,533 84,554 138,271
Capital expenditure, % of net sales 11.4 15 .0 12.1 12 .5 15 .2
Personnel at end of period 1,609 1,607 1,590
Reconciliation of comparable key figures
There were no items affecting comparability of EBITDA or operating result in the reference period .
Group key figures
1 Jan–30 Sep 2019
EUR in thousands Consumer Corporate Group total
EBITDA 178,158 55,064 233,223
Fair value opinion 996 687 1,683
Share based programmes 930 642 1,572
Share based programme Bridge 519 358 878
Matching shares plan for personnel 93 64 157
Comparable EBITDA 180,697 56,816 237,513
Operating result, EBIT 98,173 9,464 107,637
Fair value opinion 996 687 1,683
Share based programmes 930 642 1,572
Share based programme Bridge 519 358 878
Matching shares plan for personnel 93 64 157
Comparable operating result, EBIT 100,712 11,215 111,927
23
DNA Plc's Interim Report 1–9 / 2019
Free cash flow to equity
EUR in thousands1 Jan–30 Sep
20191 Jan–30 Sep
20181 Jan–31 Dec
2018
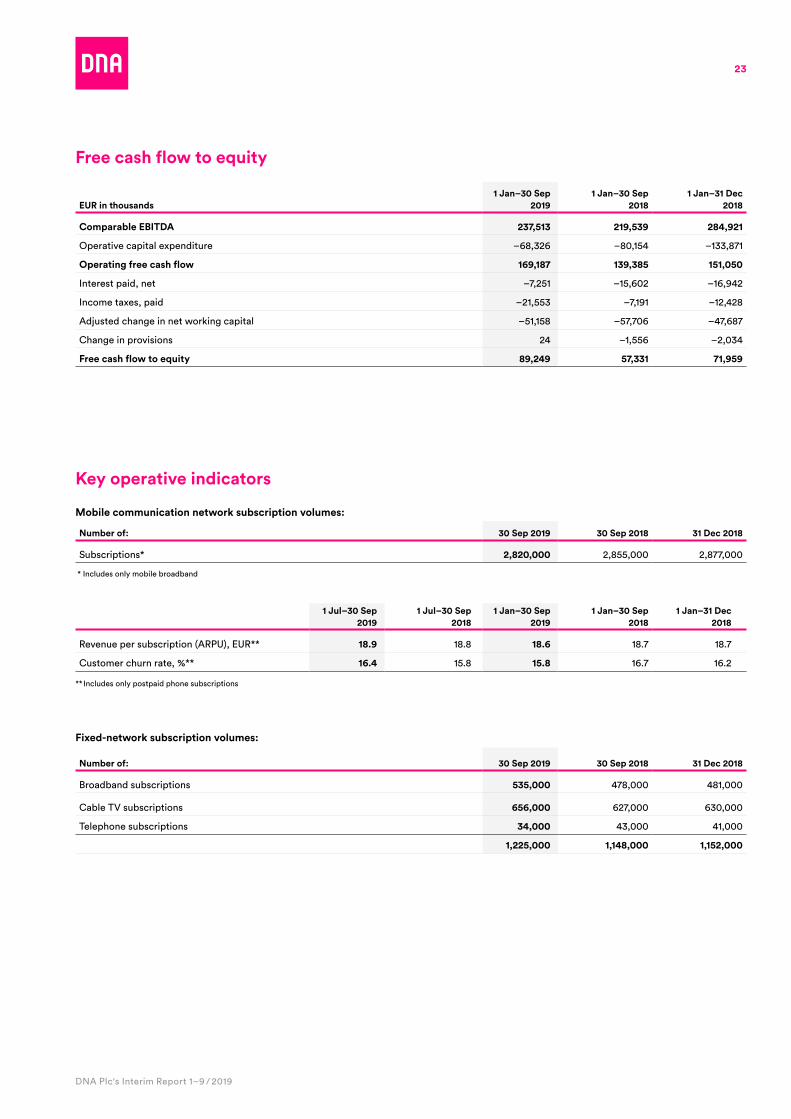
Comparable EBITDA 237,513 219,539 284,921
Operative capital expenditure –68,326 –80,154 –133,871
Operating free cash flow 169,187 139,385 151,050
Interest paid, net –7,251 –15,602 –16,942
Income taxes, paid –21,553 –7,191 –12,428
Adjusted change in net working capital –51,158 –57,706 –47,687
Change in provisions 24 –1,556 –2,034
Free cash flow to equity 89,249 57,331 71,959
Key operative indicators
Mobile communication network subscription volumes:
Number of: 30 Sep 2019 30 Sep 2018 31 Dec 2018
Subscriptions* 2,820,000 2,855,000 2,877,000
* Includes only mobile broadband
1 Jul–30 Sep 2019
1 Jul–30 Sep 2018
1 Jan–30 Sep 2019
1 Jan–30 Sep 2018
1 Jan–31 Dec 2018
Revenue per subscription (ARPU), EUR** 18.9 18 .8 18.6 18 .7 18 .7
Customer churn rate, %** 16.4 15 .8 15.8 16 .7 16 .2
** Includes only postpaid phone subscriptions
Fixed-network subscription volumes:
Number of: 30 Sep 2019 30 Sep 2018 31 Dec 2018
Broadband subscriptions 535,000 478,000 481,000
Cable TV subscriptions 656,000 627,000 630,000
Telephone subscriptions 34,000 43,000 41,000
1,225,000 1,148,000 1,152,000
24
DNA Plc's Interim Report 1–9 / 2019
Calculation of key figures
* 12-month adjusted
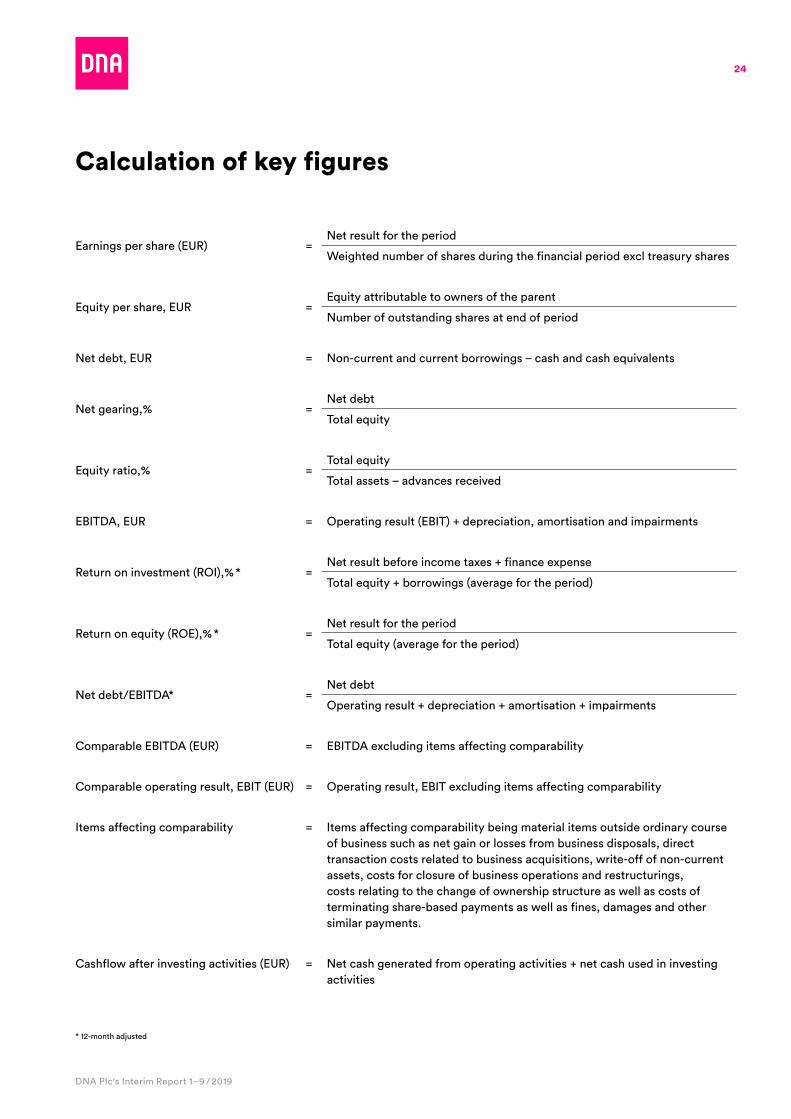
Earnings per share (EUR) =Net result for the period
Weighted number of shares during the financial period excl treasury shares
Equity per share, EUR =Equity attributable to owners of the parent
Number of outstanding shares at end of period
Net debt, EUR = Non-current and current borrowings – cash and cash equivalents
Net gearing,% =Net debt
Total equity
Equity ratio,% =Total equity
Total assets – advances received
EBITDA, EUR = Operating result (EBIT) + depreciation, amortisation and impairments
Return on investment (ROI),% * =Net result before income taxes + finance expense
Total equity + borrowings (average for the period)
Return on equity (ROE),% * =Net result for the period
Total equity (average for the period)
Net debt/EBITDA* =Net debt
Operating result + depreciation + amortisation + impairments
Comparable EBITDA (EUR) = EBITDA excluding items affecting comparability
Comparable operating result, EBIT (EUR) = Operating result, EBIT excluding items affecting comparability
Items affecting comparability = Items affecting comparability being material items outside ordinary course of business such as net gain or losses from business disposals, direct transaction costs related to business acquisitions, write-off of non-current assets, costs for closure of business operations and restructurings, costs relating to the change of ownership structure as well as costs of terminating share-based payments as well as fines, damages and other similar payments .
Cashflow after investing activities (EUR) = Net cash generated from operating activities + net cash used in investing activities
25
DNA Plc's Interim Report 1–9 / 2019
DNA presents alternative performance measures as additional information to financial measures presented in the consolidated income statement, consolidated statement of financial position and consolidated statement of cash flows prepared in accordance with IFRS . In DNA’s view, alternative performance measures provide significant additional information on DNA’s results of operations, financial position and cash flows and are widely used by analysts, investors and other parties .
DNA presents comparable EBITDA and comparable EBIT, which have been adjusted with material items outside of ordinary course of business to improve comparability between periods . EBITDA, comparable EBITDA and comparable EBIT are presented as complementing measures to the measures included in the consolidated income statement because, in DNA’s view, they increase
understanding of DNA’s results of operations . Net debt, ratio of net debt to EBITDA, net gearing, equity ratio, return on equity and return on investment are presented as complementing measures because, in DNA’s view, they are useful measures of DNA’s ability to obtain financing and service its debts . Capital expenditure, operative capital expenditure, cash flow after investing activities, operating free cash flow and free cash flow to equity provide also additional information of the cash flow needs of DNA’s operations .
Alternative performance measures should not be viewed in isolation or as a substitute to the IFRS financial measures . All companies do not calculate alternative performance measures in a uniform way, and therefore DNA’s alternative performance measures may not be comparable with similarly named measures presented by other companies .
Calculation of key figures
Capital expenditure (EUR) = Capital expenditure comprises additions to property, plant and equipment and intangible assets excluding business acquisitions, gross acquisition cost of spectrum license and additions through finance leases and asset retirement obligations and including annual cash instalments for the spectrum license .
Operative capital expenditure = Operative capital expenditure is reported capital expenditure without annual cash instalments for spectrum licenses and without lease investments (IFRS 16) .
Operating free cashflow = Comparable EBITDA – operative capital expenditure
Free Cash Flow to Equity (FCFE) = Comparable EBITDA – total capital expenditure excluding the annual cash instalment for spectrum licenses – change in net working capital including an adjustment between operative capex and cash-based capex in order to present FCFE on a cash basis, however excluding cash instalments for spectrum licenses and adjusted with the items affecting comparability – net interest paid – income taxes paid – change in provisions excluding items affecting comparability .
26
DNA Plc's Interim Report 1–9 / 2019
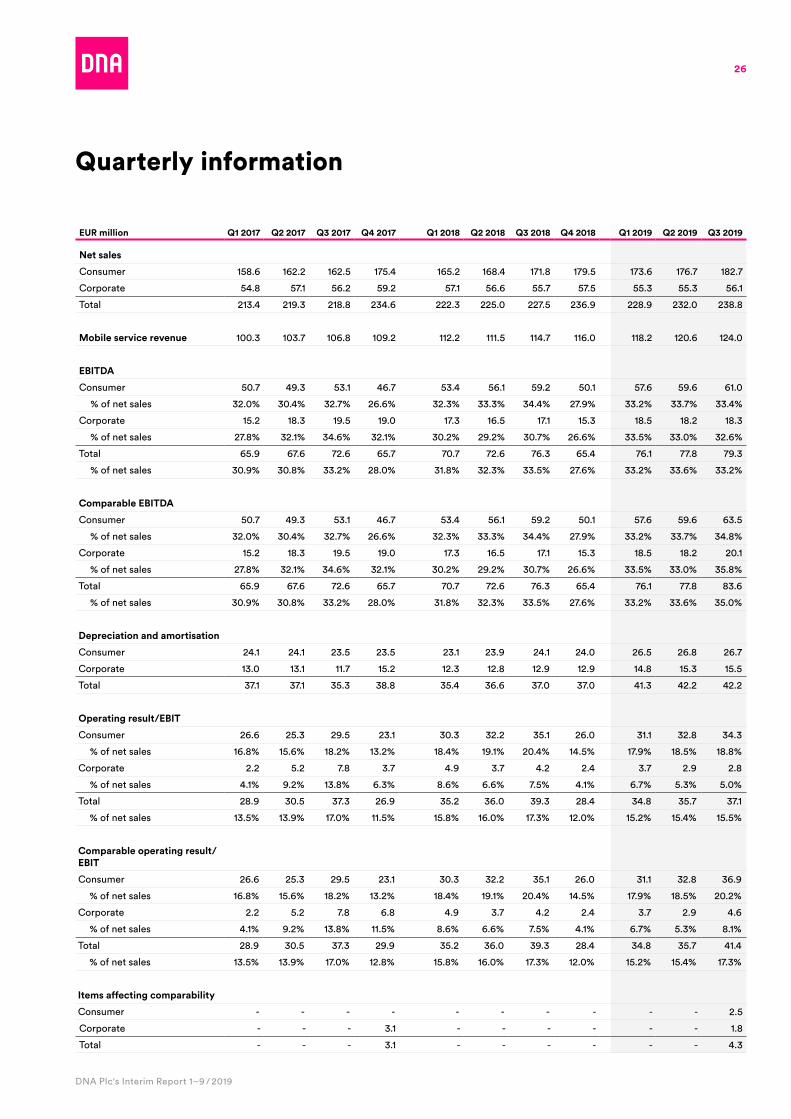
Quarterly information
EUR million Q1 2017 Q2 2017 Q3 2017 Q4 2017 Q1 2018 Q2 2018 Q3 2018 Q4 2018 Q1 2019 Q2 2019 Q3 2019
Net sales
Consumer 158 .6 162 .2 162 .5 175 .4 165 .2 168 .4 171 .8 179 .5 173 .6 176 .7 182 .7
Corporate 54 .8 57 .1 56 .2 59 .2 57 .1 56 .6 55 .7 57 .5 55 .3 55 .3 56 .1
Total 213 .4 219 .3 218 .8 234 .6 222 .3 225 .0 227 .5 236 .9 228 .9 232 .0 238 .8
Mobile service revenue 100 .3 103 .7 106 .8 109 .2 112 .2 111 .5 114 .7 116 .0 118 .2 120 .6 124 .0
EBITDA
Consumer 50 .7 49 .3 53 .1 46 .7 53 .4 56 .1 59 .2 50 .1 57 .6 59 .6 61 .0
% of net sales 32 .0% 30 .4% 32 .7% 26 .6% 32 .3% 33 .3% 34 .4% 27 .9% 33 .2% 33 .7% 33 .4%
Corporate 15 .2 18 .3 19 .5 19 .0 17 .3 16 .5 17 .1 15 .3 18 .5 18 .2 18 .3
% of net sales 27 .8% 32 .1% 34 .6% 32 .1% 30 .2% 29 .2% 30 .7% 26 .6% 33 .5% 33 .0% 32 .6%
Total 65 .9 67 .6 72 .6 65 .7 70 .7 72 .6 76 .3 65 .4 76 .1 77 .8 79 .3
% of net sales 30 .9% 30 .8% 33 .2% 28 .0% 31 .8% 32 .3% 33 .5% 27 .6% 33 .2% 33 .6% 33 .2%
Comparable EBITDA
Consumer 50 .7 49 .3 53 .1 46 .7 53 .4 56 .1 59 .2 50 .1 57 .6 59 .6 63 .5
% of net sales 32 .0% 30 .4% 32 .7% 26 .6% 32 .3% 33 .3% 34 .4% 27 .9% 33 .2% 33 .7% 34 .8%
Corporate 15 .2 18 .3 19 .5 19 .0 17 .3 16 .5 17 .1 15 .3 18 .5 18 .2 20 .1
% of net sales 27 .8% 32 .1% 34 .6% 32 .1% 30 .2% 29 .2% 30 .7% 26 .6% 33 .5% 33 .0% 35 .8%
Total 65 .9 67 .6 72 .6 65 .7 70 .7 72 .6 76 .3 65 .4 76 .1 77 .8 83 .6
% of net sales 30 .9% 30 .8% 33 .2% 28 .0% 31 .8% 32 .3% 33 .5% 27 .6% 33 .2% 33 .6% 35 .0%
Depreciation and amortisation
Consumer 24 .1 24 .1 23 .5 23 .5 23 .1 23 .9 24 .1 24 .0 26 .5 26 .8 26 .7
Corporate 13 .0 13 .1 11 .7 15 .2 12 .3 12 .8 12 .9 12 .9 14 .8 15 .3 15 .5
Total 37 .1 37 .1 35 .3 38 .8 35 .4 36 .6 37 .0 37 .0 41 .3 42 .2 42 .2
Operating result/EBIT
Consumer 26 .6 25 .3 29 .5 23 .1 30 .3 32 .2 35 .1 26 .0 31 .1 32 .8 34 .3
% of net sales 16 .8% 15 .6% 18 .2% 13 .2% 18 .4% 19 .1% 20 .4% 14 .5% 17 .9% 18 .5% 18 .8%
Corporate 2 .2 5 .2 7 .8 3 .7 4 .9 3 .7 4 .2 2 .4 3 .7 2 .9 2 .8
% of net sales 4 .1% 9 .2% 13 .8% 6 .3% 8 .6% 6 .6% 7 .5% 4 .1% 6 .7% 5 .3% 5 .0%
Total 28 .9 30 .5 37 .3 26 .9 35 .2 36 .0 39 .3 28 .4 34 .8 35 .7 37 .1
% of net sales 13 .5% 13 .9% 17 .0% 11 .5% 15 .8% 16 .0% 17 .3% 12 .0% 15 .2% 15 .4% 15 .5%
Comparable operating result/EBIT
Consumer 26 .6 25 .3 29 .5 23 .1 30 .3 32 .2 35 .1 26 .0 31 .1 32 .8 36 .9
% of net sales 16 .8% 15 .6% 18 .2% 13 .2% 18 .4% 19 .1% 20 .4% 14 .5% 17 .9% 18 .5% 20 .2%
Corporate 2 .2 5 .2 7 .8 6 .8 4 .9 3 .7 4 .2 2 .4 3 .7 2 .9 4 .6
% of net sales 4 .1% 9 .2% 13 .8% 11 .5% 8 .6% 6 .6% 7 .5% 4 .1% 6 .7% 5 .3% 8 .1%
Total 28 .9 30 .5 37 .3 29 .9 35 .2 36 .0 39 .3 28 .4 34 .8 35 .7 41 .4
% of net sales 13 .5% 13 .9% 17 .0% 12 .8% 15 .8% 16 .0% 17 .3% 12 .0% 15 .2% 15 .4% 17 .3%
Items affecting comparability
Consumer - - - - - - - - - - 2 .5
Corporate - - - 3 .1 - - - - - - 1 .8
Total - - - 3 .1 - - - - - - 4 .3
27
DNA Plc's Interim Report 1–9 / 2019
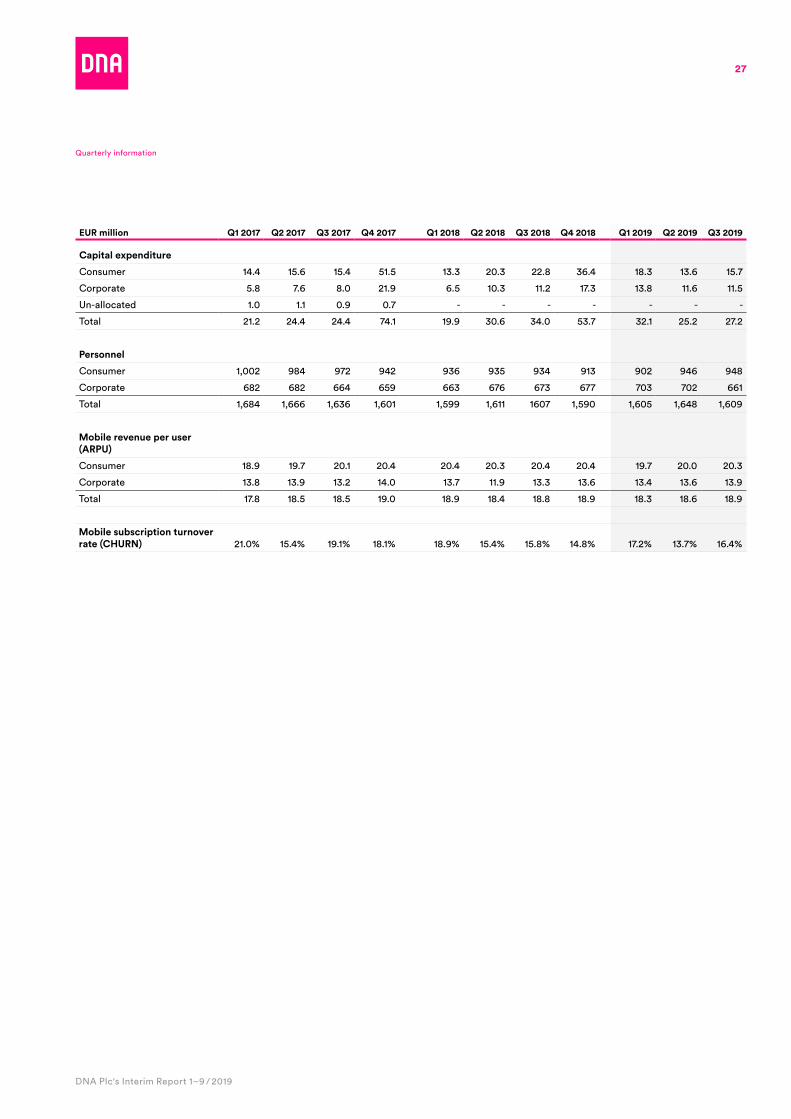
Quarterly information
EUR million Q1 2017 Q2 2017 Q3 2017 Q4 2017 Q1 2018 Q2 2018 Q3 2018 Q4 2018 Q1 2019 Q2 2019 Q3 2019
Capital expenditure
Consumer 14 .4 15 .6 15 .4 51 .5 13 .3 20 .3 22 .8 36 .4 18 .3 13 .6 15 .7
Corporate 5 .8 7 .6 8 .0 21 .9 6 .5 10 .3 11 .2 17 .3 13 .8 11 .6 11 .5
Un-allocated 1 .0 1 .1 0 .9 0 .7 - - - - - - -
Total 21 .2 24 .4 24 .4 74 .1 19 .9 30 .6 34 .0 53 .7 32 .1 25 .2 27 .2
Personnel
Consumer 1,002 984 972 942 936 935 934 913 902 946 948
Corporate 682 682 664 659 663 676 673 677 703 702 661
Total 1,684 1,666 1,636 1,601 1,599 1,611 1607 1,590 1,605 1,648 1,609
Mobile revenue per user (ARPU)
Consumer 18 .9 19 .7 20 .1 20 .4 20 .4 20 .3 20 .4 20 .4 19 .7 20 .0 20 .3
Corporate 13 .8 13 .9 13 .2 14 .0 13 .7 11 .9 13 .3 13 .6 13 .4 13 .6 13 .9
Total 17 .8 18 .5 18 .5 19 .0 18 .9 18 .4 18 .8 18 .9 18 .3 18 .6 18 .9
Mobile subscription turnover rate (CHURN) 21 .0% 15 .4% 19 .1% 18 .1% 18 .9% 15 .4% 15 .8% 14 .8% 17 .2% 13 .7% 16 .4%
28
DNA Plc's Interim Report 1–9 / 2019
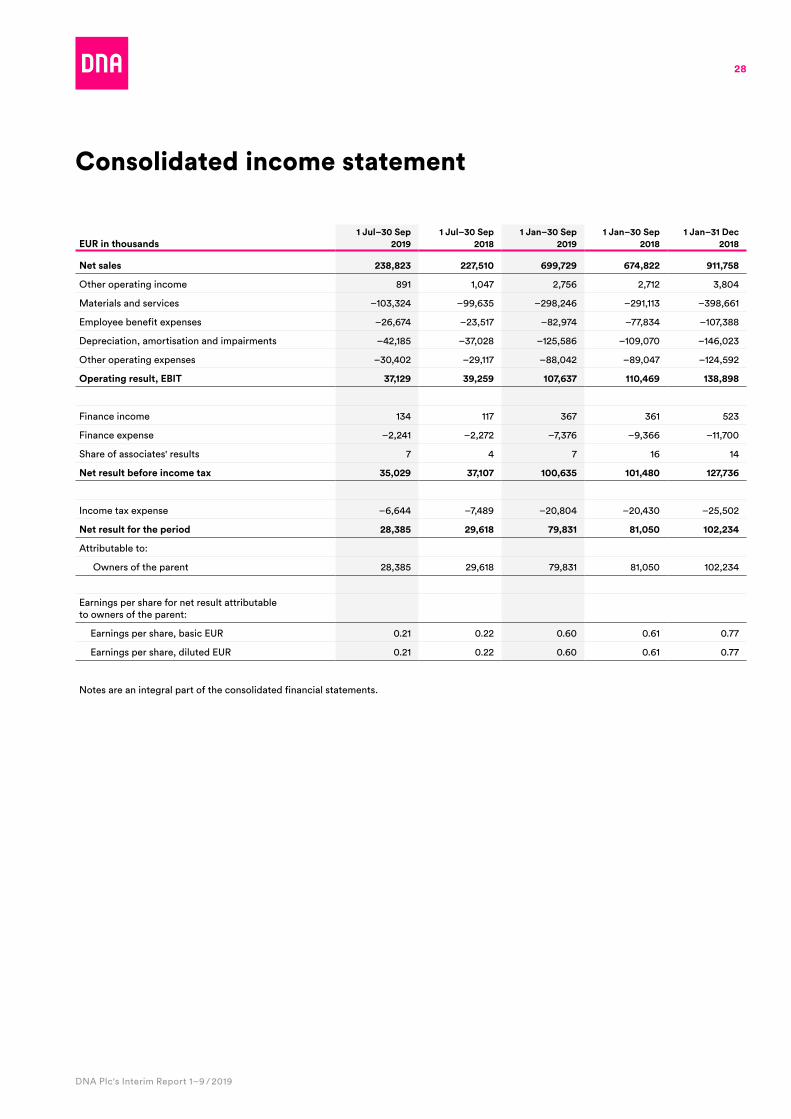
Consolidated income statement
Interim report 1–9/2019, Financial Report
EUR in thousands1 Jul–30 Sep
20191 Jul–30 Sep
20181 Jan–30 Sep
20191 Jan–30 Sep
20181 Jan–31 Dec
2018
Net sales 238,823 227,510 699,729 674,822 911,758
Other operating income 891 1,047 2,756 2,712 3,804
Materials and services –103,324 –99,635 –298,246 –291,113 –398,661
Employee benefit expenses –26,674 –23,517 –82,974 –77,834 –107,388
Depreciation, amortisation and impairments –42,185 –37,028 –125,586 –109,070 –146,023
Other operating expenses –30,402 –29,117 –88,042 –89,047 –124,592
Operating result, EBIT 37,129 39,259 107,637 110,469 138,898
Finance income 134 117 367 361 523
Finance expense –2,241 –2,272 –7,376 –9,366 –11,700
Share of associates' results 7 4 7 16 14
Net result before income tax 35,029 37,107 100,635 101,480 127,736
Income tax expense –6,644 –7,489 –20,804 –20,430 –25,502
Net result for the period 28,385 29,618 79,831 81,050 102,234
Attributable to:
Owners of the parent 28,385 29,618 79,831 81,050 102,234
Earnings per share for net result attributable to owners of the parent:
Earnings per share, basic EUR 0 .21 0 .22 0 .60 0 .61 0 .77
Earnings per share, diluted EUR 0 .21 0 .22 0 .60 0 .61 0 .77
Notes are an integral part of the consolidated financial statements .
29
DNA Plc's Interim Report 1–9 / 2019
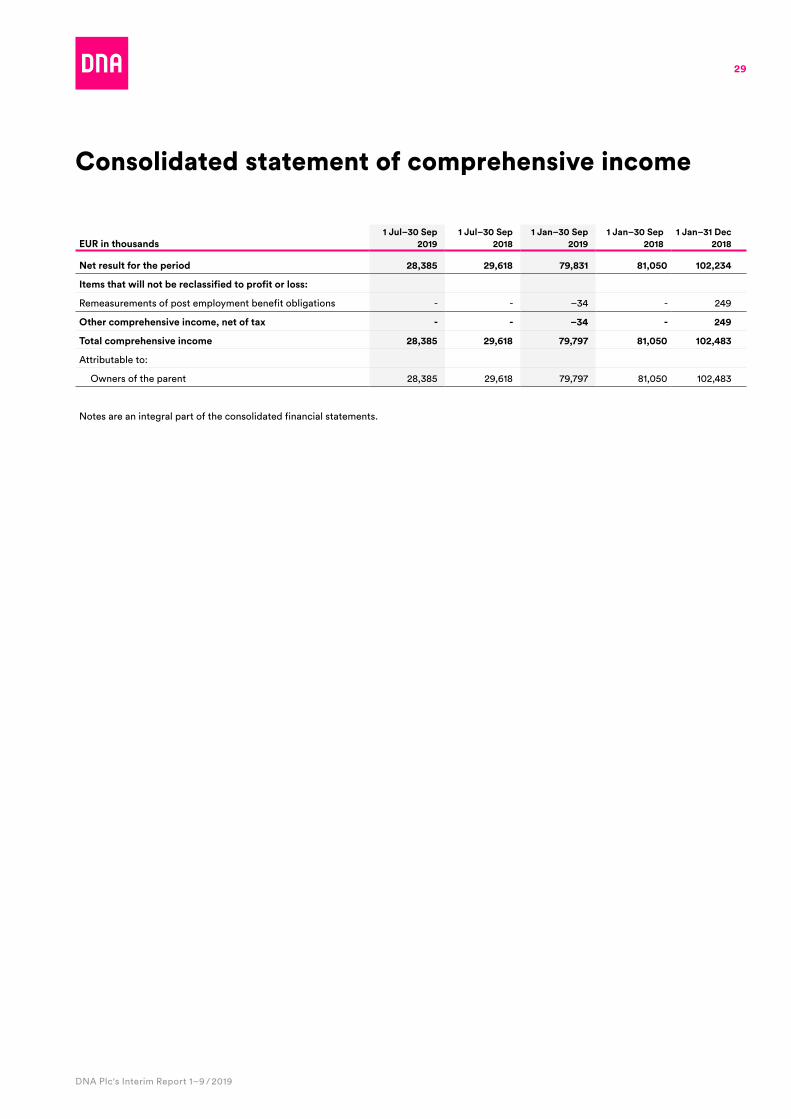
Consolidated statement of comprehensive income
EUR in thousands1 Jul–30 Sep
20191 Jul–30 Sep
20181 Jan–30 Sep
20191 Jan–30 Sep
20181 Jan–31 Dec
2018
Net result for the period 28,385 29,618 79,831 81,050 102,234
Items that will not be reclassified to profit or loss:
Remeasurements of post employment benefit obligations - - –34 - 249
Other comprehensive income, net of tax - - –34 - 249
Total comprehensive income 28,385 29,618 79,797 81,050 102,483
Attributable to:
Owners of the parent 28,385 29,618 79,797 81,050 102,483
Notes are an integral part of the consolidated financial statements .
30
DNA Plc's Interim Report 1–9 / 2019
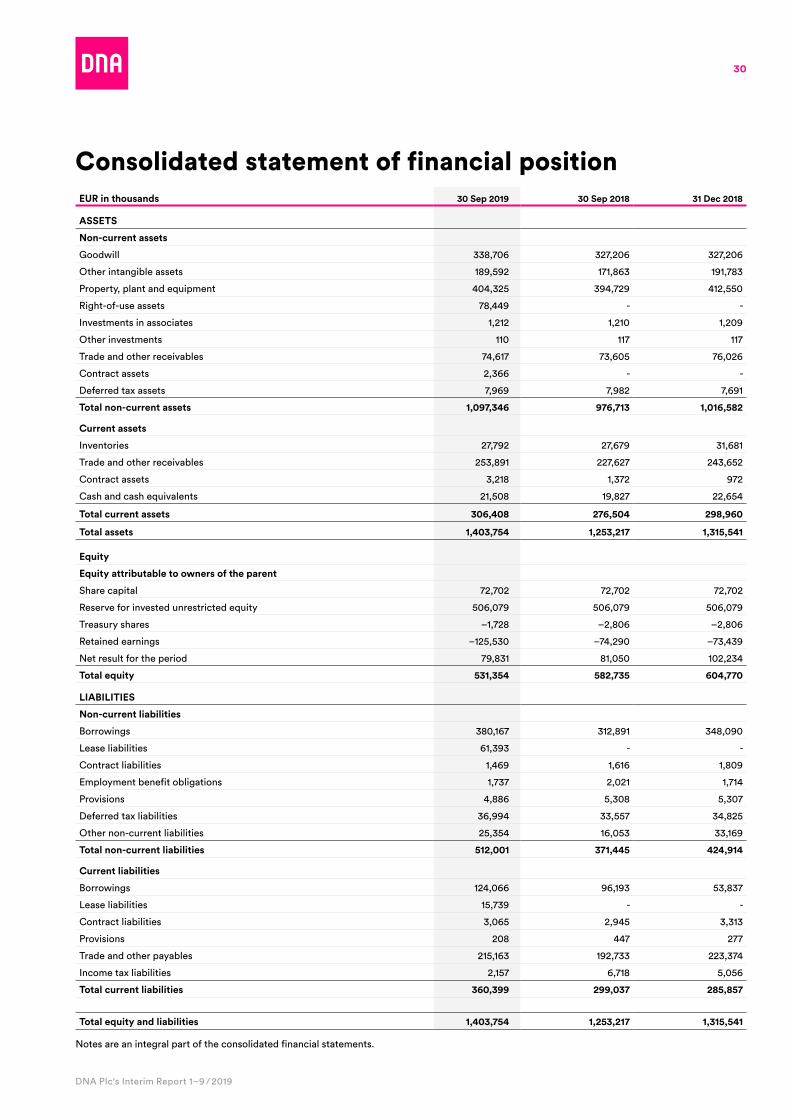
Consolidated statement of financial positionEUR in thousands 30 Sep 2019 30 Sep 2018 31 Dec 2018
ASSETS
Non-current assets
Goodwill 338,706 327,206 327,206
Other intangible assets 189,592 171,863 191,783
Property, plant and equipment 404,325 394,729 412,550
Right-of-use assets 78,449 - -
Investments in associates 1,212 1,210 1,209
Other investments 110 117 117
Trade and other receivables 74,617 73,605 76,026
Contract assets 2,366 - -
Deferred tax assets 7,969 7,982 7,691
Total non-current assets 1,097,346 976,713 1,016,582
Current assets
Inventories 27,792 27,679 31,681
Trade and other receivables 253,891 227,627 243,652
Contract assets 3,218 1,372 972
Cash and cash equivalents 21,508 19,827 22,654
Total current assets 306,408 276,504 298,960
Total assets 1,403,754 1,253,217 1,315,541
Equity
Equity attributable to owners of the parent
Share capital 72,702 72,702 72,702
Reserve for invested unrestricted equity 506,079 506,079 506,079
Treasury shares –1,728 –2,806 –2,806
Retained earnings –125,530 –74,290 –73,439
Net result for the period 79,831 81,050 102,234
Total equity 531,354 582,735 604,770
LIABILITIES
Non-current liabilities
Borrowings 380,167 312,891 348,090
Lease liabilities 61,393 - -
Contract liabilities 1,469 1,616 1,809
Employment benefit obligations 1,737 2,021 1,714
Provisions 4,886 5,308 5,307
Deferred tax liabilities 36,994 33,557 34,825
Other non-current liabilities 25,354 16,053 33,169
Total non-current liabilities 512,001 371,445 424,914
Current liabilities
Borrowings 124,066 96,193 53,837
Lease liabilities 15,739 - -
Contract liabilities 3,065 2,945 3,313
Provisions 208 447 277
Trade and other payables 215,163 192,733 223,374
Income tax liabilities 2,157 6,718 5,056
Total current liabilities 360,399 299,037 285,857
Total equity and liabilities 1,403,754 1,253,217 1,315,541
Notes are an integral part of the consolidated financial statements .
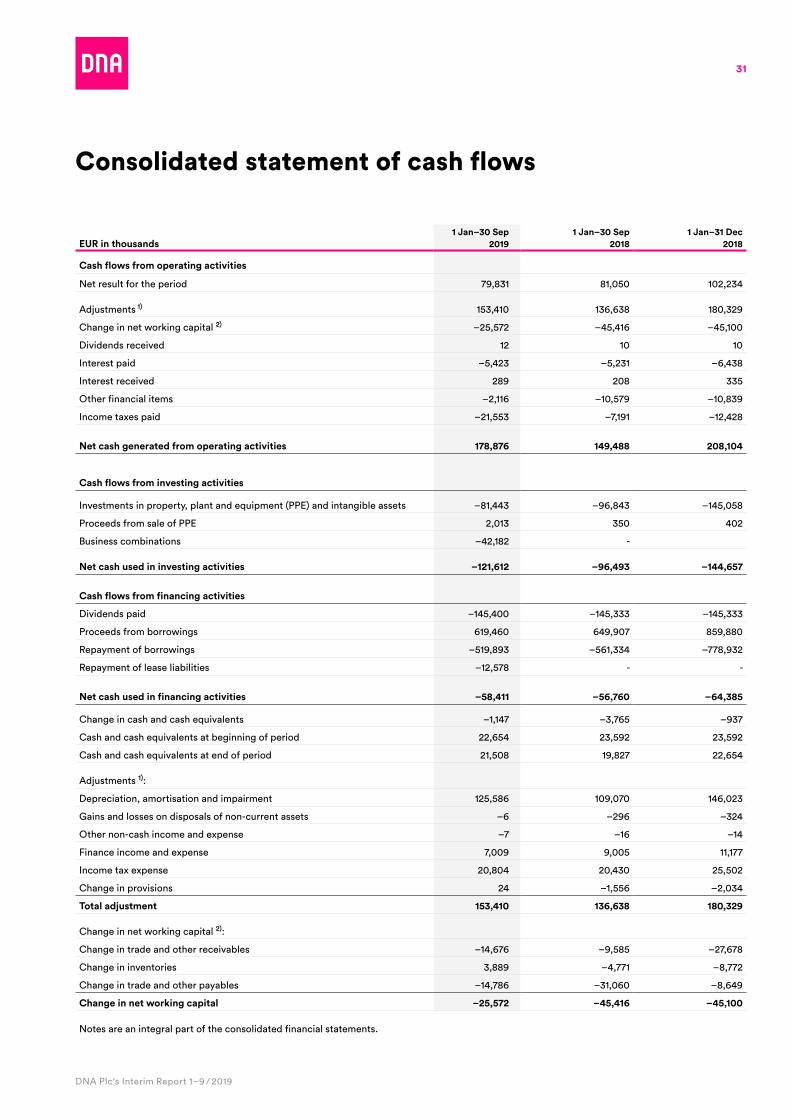
31
DNA Plc's Interim Report 1–9 / 2019
Consolidated statement of cash flows
EUR in thousands1 Jan–30 Sep
20191 Jan–30 Sep
20181 Jan–31 Dec
2018
Cash flows from operating activities
Net result for the period 79,831 81,050 102,234
Adjustments 1) 153,410 136,638 180,329
Change in net working capital 2) –25,572 –45,416 –45,100
Dividends received 12 10 10
Interest paid –5,423 –5,231 –6,438
Interest received 289 208 335
Other financial items –2,116 –10,579 –10,839
Income taxes paid –21,553 –7,191 –12,428
Net cash generated from operating activities 178,876 149,488 208,104
Cash flows from investing activities
Investments in property, plant and equipment (PPE) and intangible assets –81,443 –96,843 –145,058
Proceeds from sale of PPE 2,013 350 402
Business combinations –42,182 -
Net cash used in investing activities –121,612 –96,493 –144,657
Cash flows from financing activities
Dividends paid –145,400 –145,333 –145,333
Proceeds from borrowings 619,460 649,907 859,880
Repayment of borrowings –519,893 –561,334 –778,932
Repayment of lease liabilities –12,578 - -
Net cash used in financing activities –58,411 –56,760 –64,385
Change in cash and cash equivalents –1,147 –3,765 –937
Cash and cash equivalents at beginning of period 22,654 23,592 23,592
Cash and cash equivalents at end of period 21,508 19,827 22,654
Adjustments 1):
Depreciation, amortisation and impairment 125,586 109,070 146,023
Gains and losses on disposals of non-current assets –6 –296 –324
Other non-cash income and expense –7 –16 –14
Finance income and expense 7,009 9,005 11,177
Income tax expense 20,804 20,430 25,502
Change in provisions 24 –1,556 –2,034
Total adjustment 153,410 136,638 180,329
Change in net working capital 2):
Change in trade and other receivables –14,676 –9,585 –27,678
Change in inventories 3,889 –4,771 –8,772
Change in trade and other payables –14,786 –31,060 –8,649
Change in net working capital –25,572 –45,416 –45,100
Notes are an integral part of the consolidated financial statements .
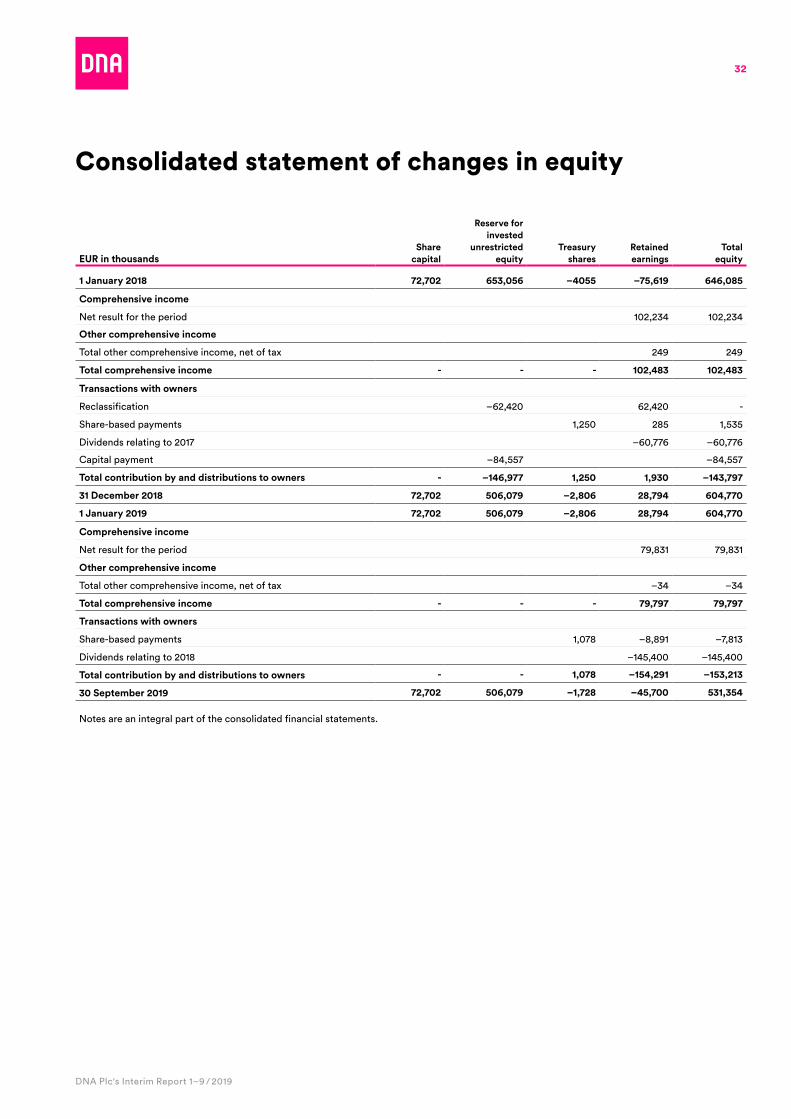
32
DNA Plc's Interim Report 1–9 / 2019
Consolidated statement of changes in equity
EUR in thousandsShare
capital
Reserve for invested
unrestricted equity
Treasury shares
Retained earnings
Total equity
1 January 2018 72,702 653,056 –4055 –75,619 646,085
Comprehensive income
Net result for the period 102,234 102,234
Other comprehensive income
Total other comprehensive income, net of tax 249 249
Total comprehensive income - - - 102,483 102,483
Transactions with owners
Reclassification –62,420 62,420 -
Share-based payments 1,250 285 1,535
Dividends relating to 2017 –60,776 –60,776
Capital payment –84,557 –84,557
Total contribution by and distributions to owners - –146,977 1,250 1,930 –143,797
31 December 2018 72,702 506,079 –2,806 28,794 604,770
1 January 2019 72,702 506,079 –2,806 28,794 604,770
Comprehensive income
Net result for the period 79,831 79,831
Other comprehensive income
Total other comprehensive income, net of tax –34 –34
Total comprehensive income - - - 79,797 79,797
Transactions with owners
Share-based payments 1,078 –8,891 –7,813
Dividends relating to 2018 –145,400 –145,400
Total contribution by and distributions to owners - - 1,078 –154,291 –153,213
30 September 2019 72,702 506,079 –1,728 –45,700 531,354
Notes are an integral part of the consolidated financial statements .
33
DNA Plc's Interim Report 1–9 / 2019
Notes
1 Accounting principles . . . . . . . . . . . . . . . . . . . . . . . . . . . . . . . . . . . . . . . . . . . . . . . . 34
2 Revenue . . . . . . . . . . . . . . . . . . . . . . . . . . . . . . . . . . . . . . . . . . . . . . . . . . . . . . . . . . . . 35
3 Segment information . . . . . . . . . . . . . . . . . . . . . . . . . . . . . . . . . . . . . . . . . . . . . . . . . 37
4 Capital expenditure . . . . . . . . . . . . . . . . . . . . . . . . . . . . . . . . . . . . . . . . . . . . . . . . . . 39
5 Equity . . . . . . . . . . . . . . . . . . . . . . . . . . . . . . . . . . . . . . . . . . . . . . . . . . . . . . . . . . . . . . 40
6 Borrowings . . . . . . . . . . . . . . . . . . . . . . . . . . . . . . . . . . . . . . . . . . . . . . . . . . . . . . . . . 41
7 Net debt . . . . . . . . . . . . . . . . . . . . . . . . . . . . . . . . . . . . . . . . . . . . . . . . . . . . . . . . . . . 42
8 Provisions . . . . . . . . . . . . . . . . . . . . . . . . . . . . . . . . . . . . . . . . . . . . . . . . . . . . . . . . . . 43
9 Related party transactions . . . . . . . . . . . . . . . . . . . . . . . . . . . . . . . . . . . . . . . . . . . . 44
10 Share-based payments . . . . . . . . . . . . . . . . . . . . . . . . . . . . . . . . . . . . . . . . . . . . . . . 45
11 Business combinations . . . . . . . . . . . . . . . . . . . . . . . . . . . . . . . . . . . . . . . . . . . . . . . 47
12 Changes in accounting policy IFRS 16 . . . . . . . . . . . . . . . . . . . . . . . . . . . . . . . . . 48
34
DNA Plc's Interim Report 1–9 / 2019
1 Accounting principles
This Interim Report has been prepared in accordance with IFRS regulations and measurement principles and complies with the requirements of the IAS 34 standard . The information has been prepared in accordance with International Financial Reporting Standards, as approved for application throughout the European Union . The accounting principles are identical to those applied to the Financial Statements of 31 December 2018 with the exception of new and amended standards effective as of 1 January 2019 . This report should be read in connection with the 2018 Financial Statements . The information presented in the report is unaudited .
The following new standard have been adopted as of 1 January 2019:On 13 January 2016, IASB published IFRS 16 Leases, effective for the financial period beginning on 1 January 2019 . The changes introduced by the standard to the recognition, valuation and presentation of leases mainly apply to accounting by lessees . For lessors, the accounting of leases remains mostly as is . The lessor continues to classify its leases as operating or finance leases in accordance with almost the same principles as in IAS 17 Leases .
DNA adopted IFRS 16 on the effective date of 1 January 2019 using the modified retrospective transition method, and in accordance with the IFRS 16 transition guidance, comparative information will not be restated . The changes in the reclassification and recognition of agreements resulting from the standard have been entered in the opening balance sheet of 1 January 2019 .
The standard is applied to leases previously identified as leases under IAS 17 Leases and IFRIC 4 Determining Whether an Arrangement Contains a Lease . In the adoption of IFRS 16, right-of-use assets have been recognised to reflect the amount corresponding to the discounted lease liability . The average weighted discount rate for lease liabilities was 2 .2% on 1 January 2019 .
The Group applies practical relief regarding short-term agreements . IFRS 16 is not applied to leases with a lease term of 12 months or less . Short-term agreements are recognised as an expense in the income statement and included in the notes to the financial statements .
DNA Plc mostly acts as a lessee . The Group enters into agreements to lease office premises, equipment facilities and aerial sites in particular . According to current accounting practices, they are classified as operating lease agreements . For office premises, the average lease period is 2 to 5 years and for equipment facilities 4 to 7 years . Due to the nature of leases, the Group currently estimates that the most essential impacts of the adoption of the IFRS 16 standard will be related to leased premises and equipment spaces . In addition, the Group has individual major agreements related to technology which have an essential impact on the assets and liabilities on the balance sheet .
The Group subleases some premises, the leases of which are reported as operating leases . The agreements are recognised as a right-of-use asset and lease liability in accordance with IFRS 16 . Proceeds from the leasing of the assets are presented in the notes to the financial statements . Impairment testing will be carried out where necessary if there is any indication in the reassessment of the agreements .
The relevant estimates and discretionary factors in the application of the standard are mainly related to the assessment of the lease period and to the determination of the discount rate used . The discount rate is determined by using the additional borrowing rate and adjusted quarterly . Leases may include options for continuation or termination . At the Group's discretion, options will not be taken into account in the assessment of the lease period unless the use of the option is reasonably certain . No residual value guarantees are included in the leases .
Maintenance rents or other use-based payments included in leases will be specified if they are relevant and can be reliably separated from the agreement . After consideration, DNA will not otherwise separate non-lease components from associated lease components and will report lease components and non-lease components as a single lease component .
Leases that do not meet the definition of IFRS 16 are recognised as an expense during the duration of the agreement .
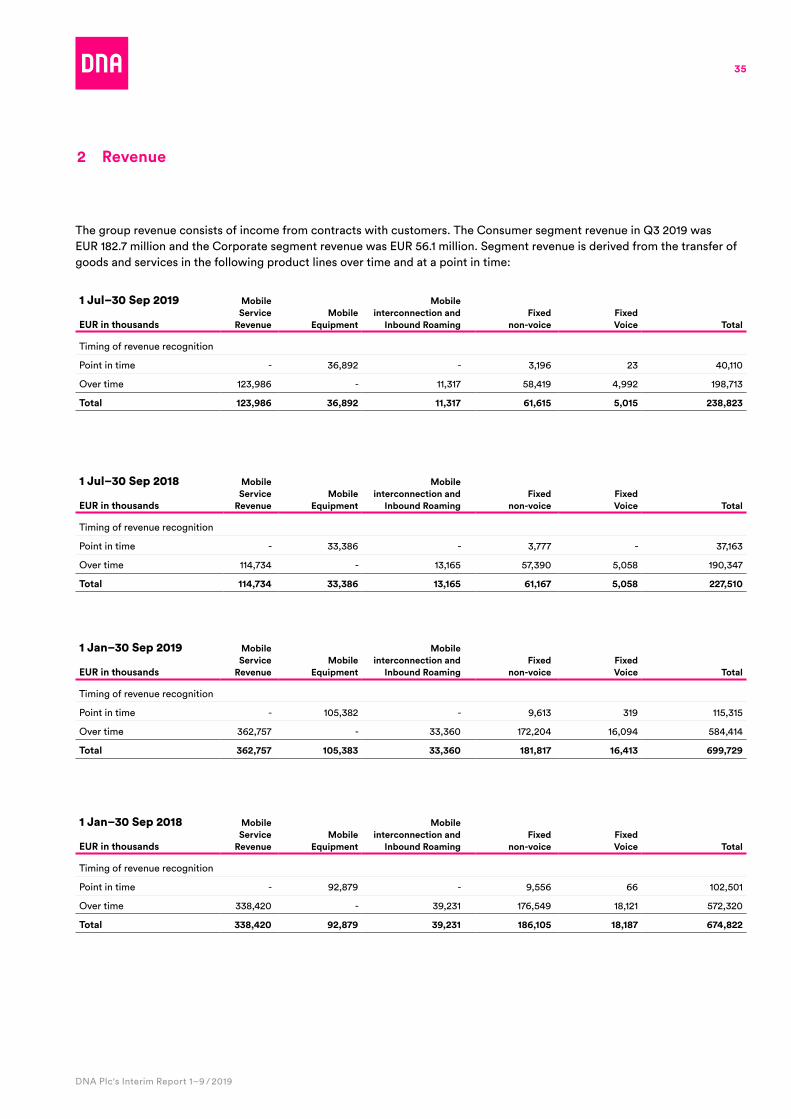
35
DNA Plc's Interim Report 1–9 / 2019
2 Revenue
1 Jul–30 Sep 2019
EUR in thousands
Mobile Service
RevenueMobile
Equipment
Mobile interconnection and
Inbound RoamingFixed
non-voiceFixed Voice Total
Timing of revenue recognition
Point in time - 36,892 - 3,196 23 40,110
Over time 123,986 - 11,317 58,419 4,992 198,713
Total 123,986 36,892 11,317 61,615 5,015 238,823
1 Jul–30 Sep 2018
EUR in thousands
Mobile Service
RevenueMobile
Equipment
Mobile interconnection and
Inbound RoamingFixed
non-voiceFixed Voice Total
Timing of revenue recognition
Point in time - 33,386 - 3,777 - 37,163
Over time 114,734 - 13,165 57,390 5,058 190,347
Total 114,734 33,386 13,165 61,167 5,058 227,510
1 Jan–30 Sep 2018
EUR in thousands
Mobile Service
RevenueMobile
Equipment
Mobile interconnection and
Inbound RoamingFixed
non-voiceFixed Voice Total
Timing of revenue recognition
Point in time - 92,879 - 9,556 66 102,501
Over time 338,420 - 39,231 176,549 18,121 572,320
Total 338,420 92,879 39,231 186,105 18,187 674,822
1 Jan–30 Sep 2019
EUR in thousands
Mobile Service
RevenueMobile
Equipment
Mobile interconnection and
Inbound RoamingFixed
non-voiceFixed Voice Total
Timing of revenue recognition
Point in time - 105,382 - 9,613 319 115,315
Over time 362,757 - 33,360 172,204 16,094 584,414
Total 362,757 105,383 33,360 181,817 16,413 699,729
The group revenue consists of income from contracts with customers . The Consumer segment revenue in Q3 2019 was EUR 182 .7 million and the Corporate segment revenue was EUR 56 .1 million . Segment revenue is derived from the transfer of goods and services in the following product lines over time and at a point in time:
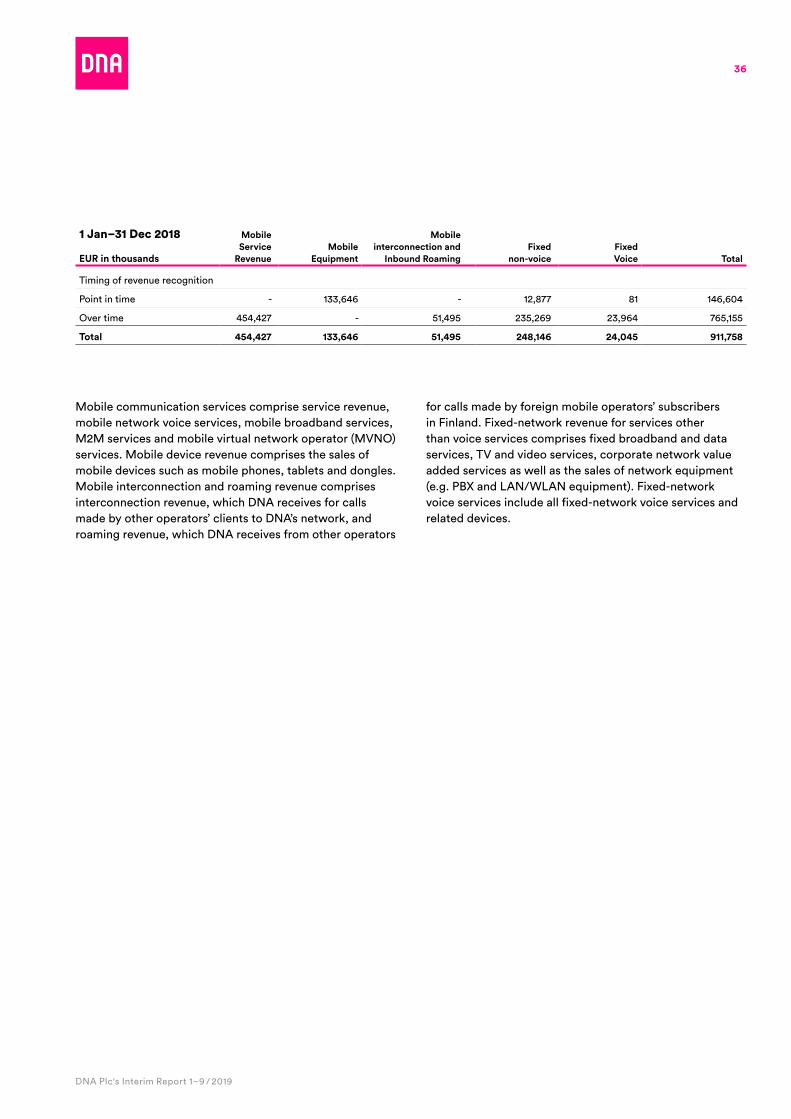
36
DNA Plc's Interim Report 1–9 / 2019
1 Jan–31 Dec 2018
EUR in thousands
Mobile Service
RevenueMobile
Equipment
Mobile interconnection and
Inbound RoamingFixed
non-voiceFixed Voice Total
Timing of revenue recognition
Point in time - 133,646 - 12,877 81 146,604
Over time 454,427 - 51,495 235,269 23,964 765,155
Total 454,427 133,646 51,495 248,146 24,045 911,758
Mobile communication services comprise service revenue, mobile network voice services, mobile broadband services, M2M services and mobile virtual network operator (MVNO) services . Mobile device revenue comprises the sales of mobile devices such as mobile phones, tablets and dongles . Mobile interconnection and roaming revenue comprises interconnection revenue, which DNA receives for calls made by other operators’ clients to DNA’s network, and roaming revenue, which DNA receives from other operators
for calls made by foreign mobile operators’ subscribers in Finland . Fixed-network revenue for services other than voice services comprises fixed broadband and data services, TV and video services, corporate network value added services as well as the sales of network equipment (e .g . PBX and LAN/WLAN equipment) . Fixed-network voice services include all fixed-network voice services and related devices .
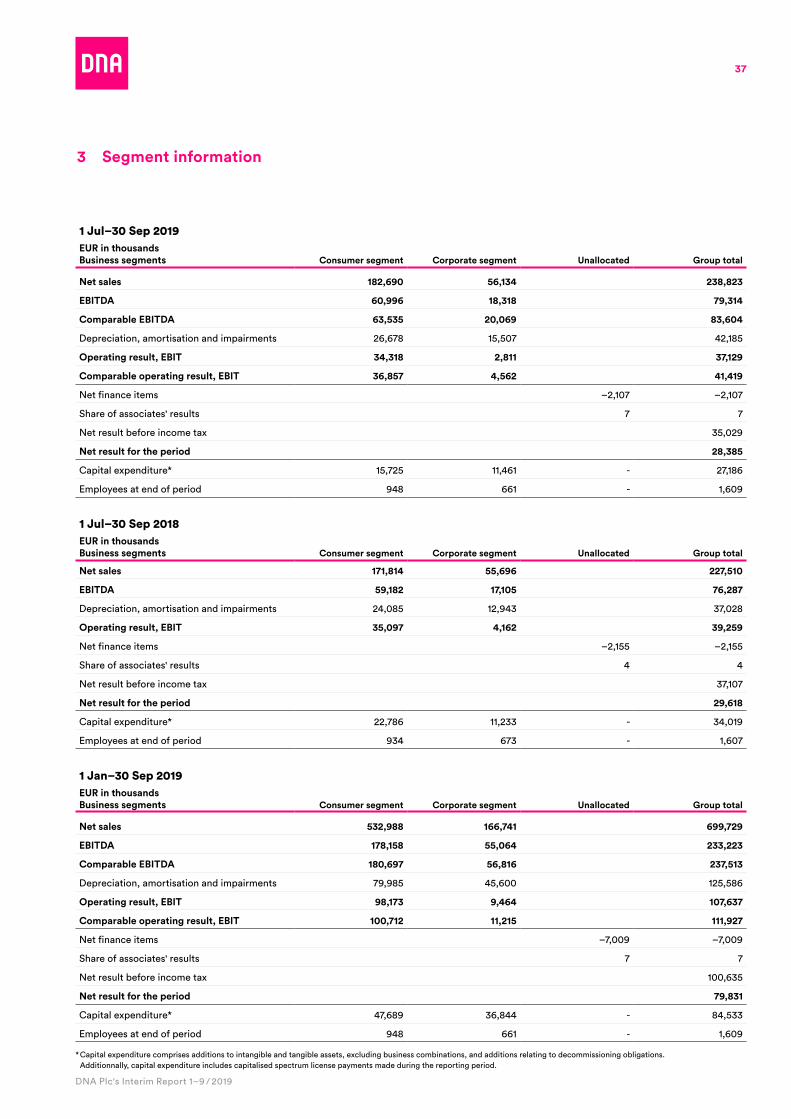
37
DNA Plc's Interim Report 1–9 / 2019
3 Segment information
1 Jul–30 Sep 2019 EUR in thousandsBusiness segments Consumer segment Corporate segment Unallocated Group total
Net sales 182,690 56,134 238,823
EBITDA 60,996 18,318 79,314
Comparable EBITDA 63,535 20,069 83,604
Depreciation, amortisation and impairments 26,678 15,507 42,185
Operating result, EBIT 34,318 2,811 37,129
Comparable operating result, EBIT 36,857 4,562 41,419
Net finance items –2,107 –2,107
Share of associates' results 7 7
Net result before income tax 35,029
Net result for the period 28,385
Capital expenditure* 15,725 11,461 - 27,186
Employees at end of period 948 661 - 1,609
1 Jul–30 Sep 2018 EUR in thousandsBusiness segments Consumer segment Corporate segment Unallocated Group total
Net sales 171,814 55,696 227,510
EBITDA 59,182 17,105 76,287
Depreciation, amortisation and impairments 24,085 12,943 37,028
Operating result, EBIT 35,097 4,162 39,259
Net finance items –2,155 –2,155
Share of associates' results 4 4
Net result before income tax 37,107
Net result for the period 29,618
Capital expenditure* 22,786 11,233 - 34,019
Employees at end of period 934 673 - 1,607
1 Jan–30 Sep 2019EUR in thousandsBusiness segments Consumer segment Corporate segment Unallocated Group total
Net sales 532,988 166,741 699,729
EBITDA 178,158 55,064 233,223
Comparable EBITDA 180,697 56,816 237,513
Depreciation, amortisation and impairments 79,985 45,600 125,586
Operating result, EBIT 98,173 9,464 107,637
Comparable operating result, EBIT 100,712 11,215 111,927
Net finance items –7,009 –7,009
Share of associates' results 7 7
Net result before income tax 100,635
Net result for the period 79,831
Capital expenditure* 47,689 36,844 - 84,533
Employees at end of period 948 661 - 1,609
* Capital expenditure comprises additions to intangible and tangible assets, excluding business combinations, and additions relating to decommissioning obligations . Additionnally, capital expenditure includes capitalised spectrum license payments made during the reporting period .
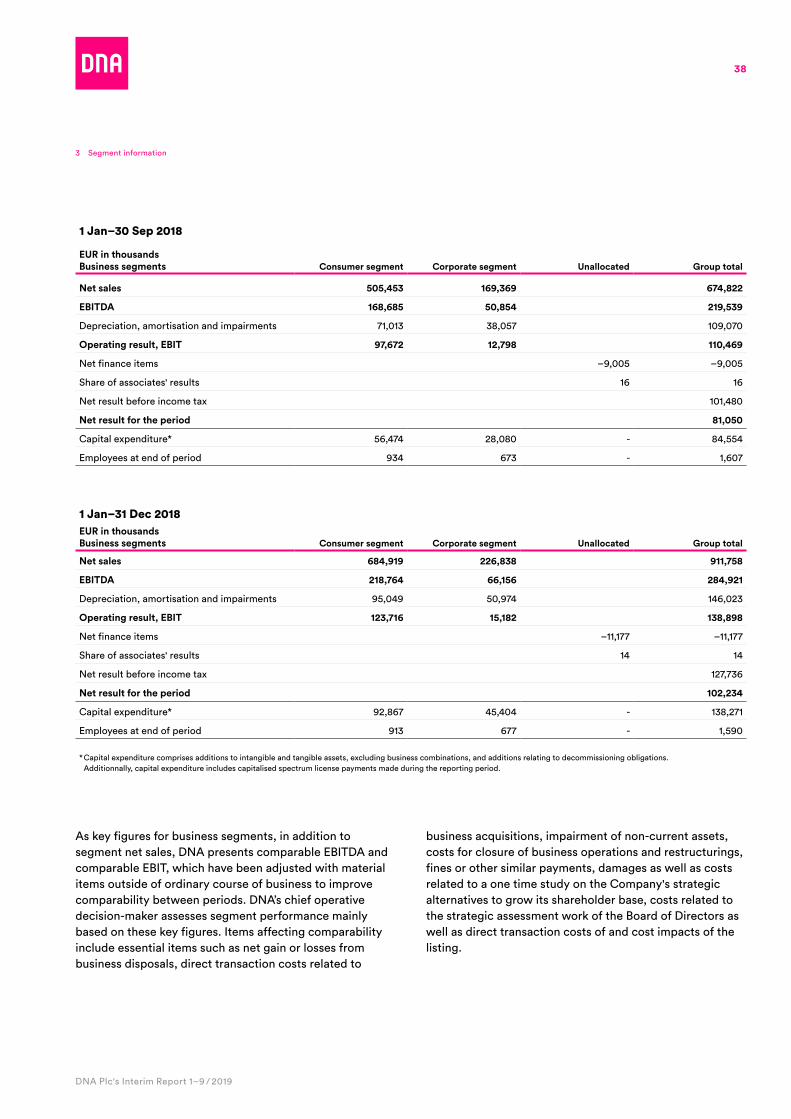
38
DNA Plc's Interim Report 1–9 / 2019
3 Segment information
1 Jan–31 Dec 2018 EUR in thousandsBusiness segments Consumer segment Corporate segment Unallocated Group total
Net sales 684,919 226,838 911,758
EBITDA 218,764 66,156 284,921
Depreciation, amortisation and impairments 95,049 50,974 146,023
Operating result, EBIT 123,716 15,182 138,898
Net finance items –11,177 –11,177
Share of associates' results 14 14
Net result before income tax 127,736
Net result for the period 102,234
Capital expenditure* 92,867 45,404 - 138,271
Employees at end of period 913 677 - 1,590
* Capital expenditure comprises additions to intangible and tangible assets, excluding business combinations, and additions relating to decommissioning obligations . Additionnally, capital expenditure includes capitalised spectrum license payments made during the reporting period .
As key figures for business segments, in addition to segment net sales, DNA presents comparable EBITDA and comparable EBIT, which have been adjusted with material items outside of ordinary course of business to improve comparability between periods . DNA’s chief operative decision-maker assesses segment performance mainly based on these key figures . Items affecting comparability include essential items such as net gain or losses from business disposals, direct transaction costs related to
business acquisitions, impairment of non-current assets, costs for closure of business operations and restructurings, fines or other similar payments, damages as well as costs related to a one time study on the Company's strategic alternatives to grow its shareholder base, costs related to the strategic assessment work of the Board of Directors as well as direct transaction costs of and cost impacts of the listing .
1 Jan–30 Sep 2018
EUR in thousandsBusiness segments Consumer segment Corporate segment Unallocated Group total
Net sales 505,453 169,369 674,822
EBITDA 168,685 50,854 219,539
Depreciation, amortisation and impairments 71,013 38,057 109,070
Operating result, EBIT 97,672 12,798 110,469
Net finance items –9,005 –9,005
Share of associates' results 16 16
Net result before income tax 101,480
Net result for the period 81,050
Capital expenditure* 56,474 28,080 - 84,554
Employees at end of period 934 673 - 1,607
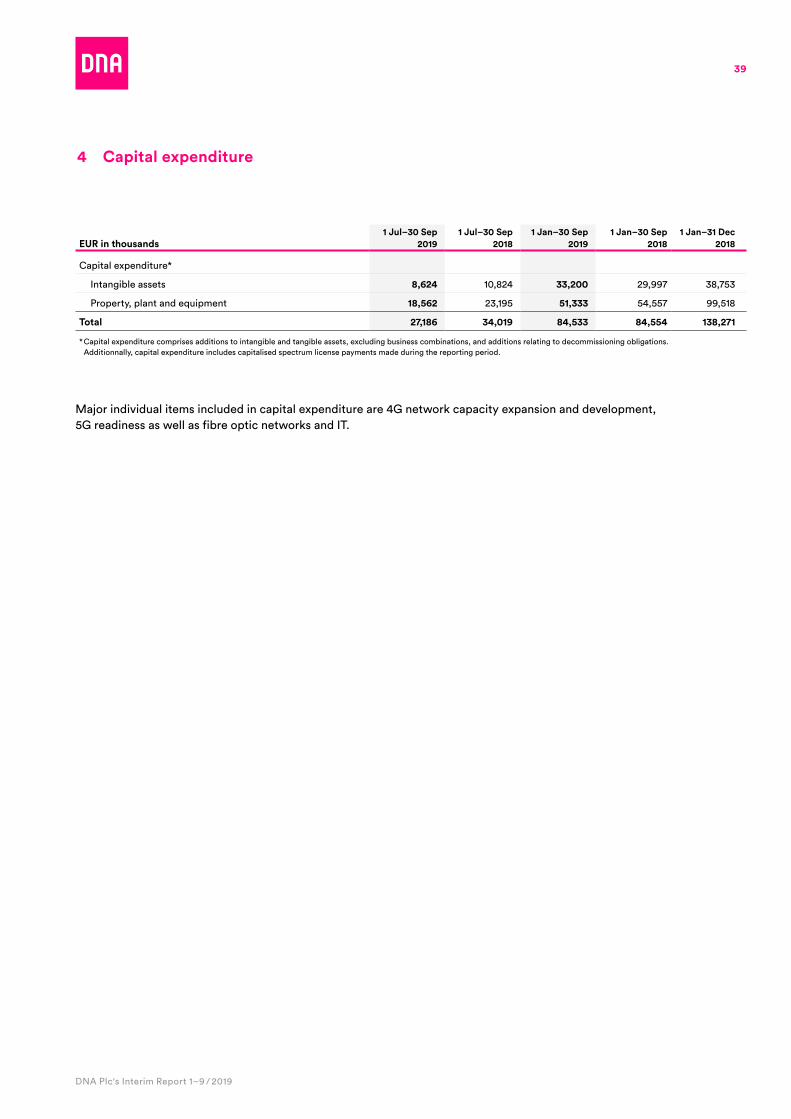
39
DNA Plc's Interim Report 1–9 / 2019
4 Capital expenditure
EUR in thousands1 Jul–30 Sep
20191 Jul–30 Sep
20181 Jan–30 Sep
20191 Jan–30 Sep
20181 Jan–31 Dec
2018
Capital expenditure*
Intangible assets 8,624 10,824 33,200 29,997 38,753
Property, plant and equipment 18,562 23,195 51,333 54,557 99,518
Total 27,186 34,019 84,533 84,554 138,271
* Capital expenditure comprises additions to intangible and tangible assets, excluding business combinations, and additions relating to decommissioning obligations . Additionnally, capital expenditure includes capitalised spectrum license payments made during the reporting period .
Major individual items included in capital expenditure are 4G network capacity expansion and development, 5G readiness as well as fibre optic networks and IT .
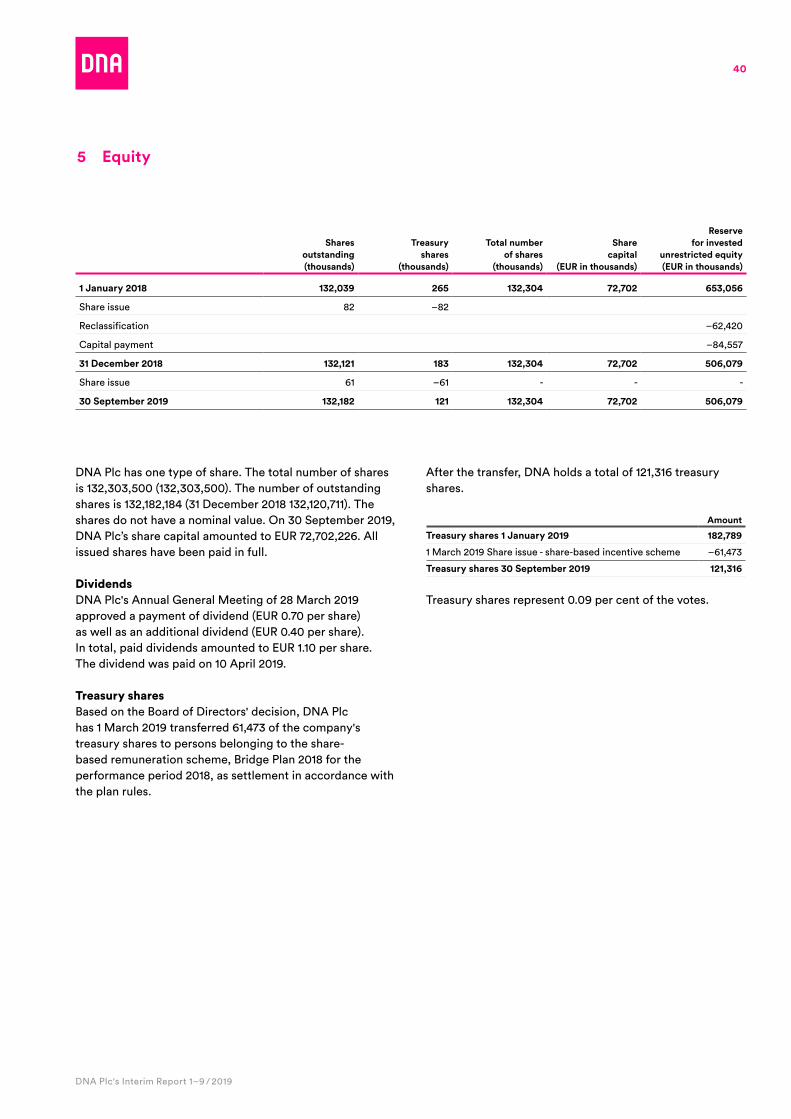
40
DNA Plc's Interim Report 1–9 / 2019
5 Equity
Shares outstanding (thousands)
Treasury shares
(thousands)
Total number of shares
(thousands)
Share capital
(EUR in thousands)
Reserve for invested
unrestricted equity (EUR in thousands)
1 January 2018 132,039 265 132,304 72,702 653,056
Share issue 82 –82
Reclassification –62,420
Capital payment –84,557
31 December 2018 132,121 183 132,304 72,702 506,079
Share issue 61 –61 - - -
30 September 2019 132,182 121 132,304 72,702 506,079
DNA Plc has one type of share . The total number of shares is 132,303,500 (132,303,500) . The number of outstanding shares is 132,182,184 (31 December 2018 132,120,711) . The shares do not have a nominal value . On 30 September 2019, DNA Plc’s share capital amounted to EUR 72,702,226 . All issued shares have been paid in full .
DividendsDNA Plc's Annual General Meeting of 28 March 2019 approved a payment of dividend (EUR 0 .70 per share) as well as an additional dividend (EUR 0 .40 per share) . In total, paid dividends amounted to EUR 1 .10 per share . The dividend was paid on 10 April 2019 .
Treasury sharesBased on the Board of Directors' decision, DNA Plc has 1 March 2019 transferred 61,473 of the company's treasury shares to persons belonging to the share-based remuneration scheme, Bridge Plan 2018 for the performance period 2018, as settlement in accordance with the plan rules .
After the transfer, DNA holds a total of 121,316 treasury shares .
Amount
Treasury shares 1 January 2019 182,789
1 March 2019 Share issue - share-based incentive scheme –61,473
Treasury shares 30 September 2019 121,316
Treasury shares represent 0 .09 per cent of the votes .
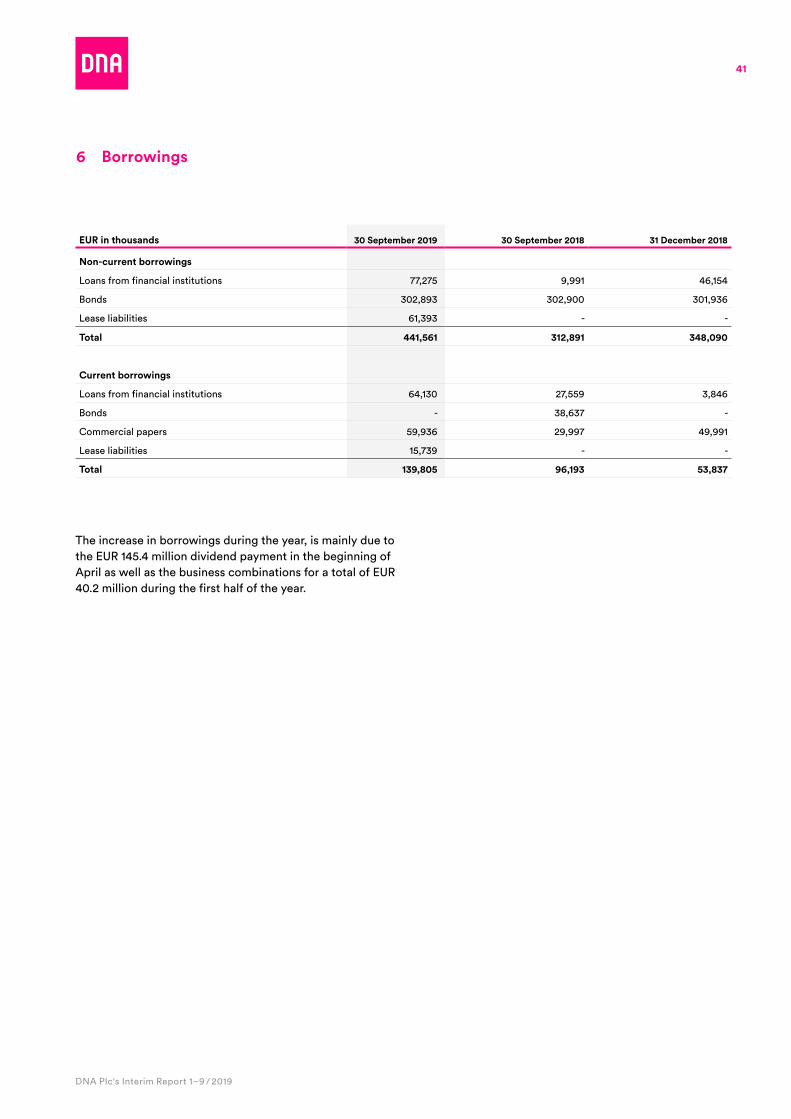
41
DNA Plc's Interim Report 1–9 / 2019
EUR in thousands 30 September 2019 30 September 2018 31 December 2018
Non-current borrowings
Loans from financial institutions 77,275 9,991 46,154
Bonds 302,893 302,900 301,936
Lease liabilities 61,393 - -
Total 441,561 312,891 348,090
Current borrowings
Loans from financial institutions 64,130 27,559 3,846
Bonds - 38,637 -
Commercial papers 59,936 29,997 49,991
Lease liabilities 15,739 - -
Total 139,805 96,193 53,837
The increase in borrowings during the year, is mainly due to the EUR 145 .4 million dividend payment in the beginning of April as well as the business combinations for a total of EUR 40 .2 million during the first half of the year .
6 Borrowings
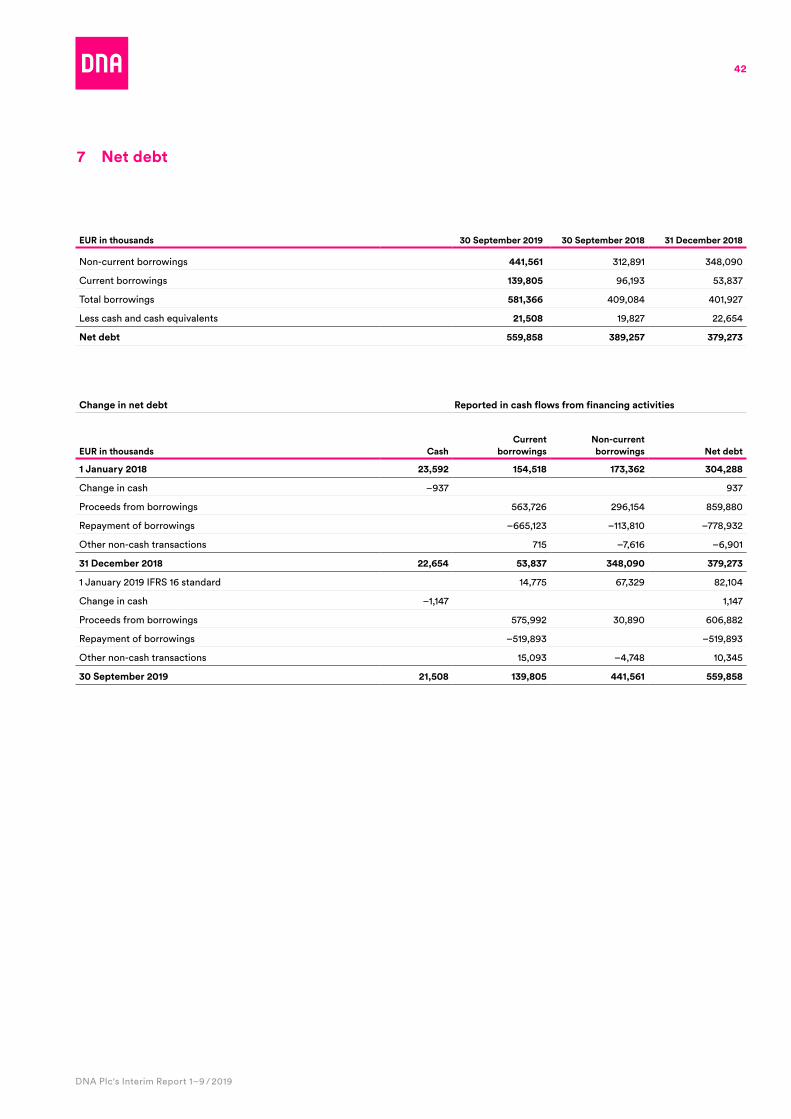
42
DNA Plc's Interim Report 1–9 / 2019
7 Net debt
EUR in thousands 30 September 2019 30 September 2018 31 December 2018
Non-current borrowings 441,561 312,891 348,090
Current borrowings 139,805 96,193 53,837
Total borrowings 581,366 409,084 401,927
Less cash and cash equivalents 21,508 19,827 22,654
Net debt 559,858 389,257 379,273
Change in net debt Reported in cash flows from financing activities
EUR in thousands CashCurrent
borrowingsNon-current borrowings Net debt
1 January 2018 23,592 154,518 173,362 304,288
Change in cash –937 937
Proceeds from borrowings 563,726 296,154 859,880
Repayment of borrowings –665,123 –113,810 –778,932
Other non-cash transactions 715 –7,616 –6,901
31 December 2018 22,654 53,837 348,090 379,273
1 January 2019 IFRS 16 standard 14,775 67,329 82,104
Change in cash –1,147 1,147
Proceeds from borrowings 575,992 30,890 606,882
Repayment of borrowings –519,893 –519,893
Other non-cash transactions 15,093 –4,748 10,345
30 September 2019 21,508 139,805 441,561 559,858
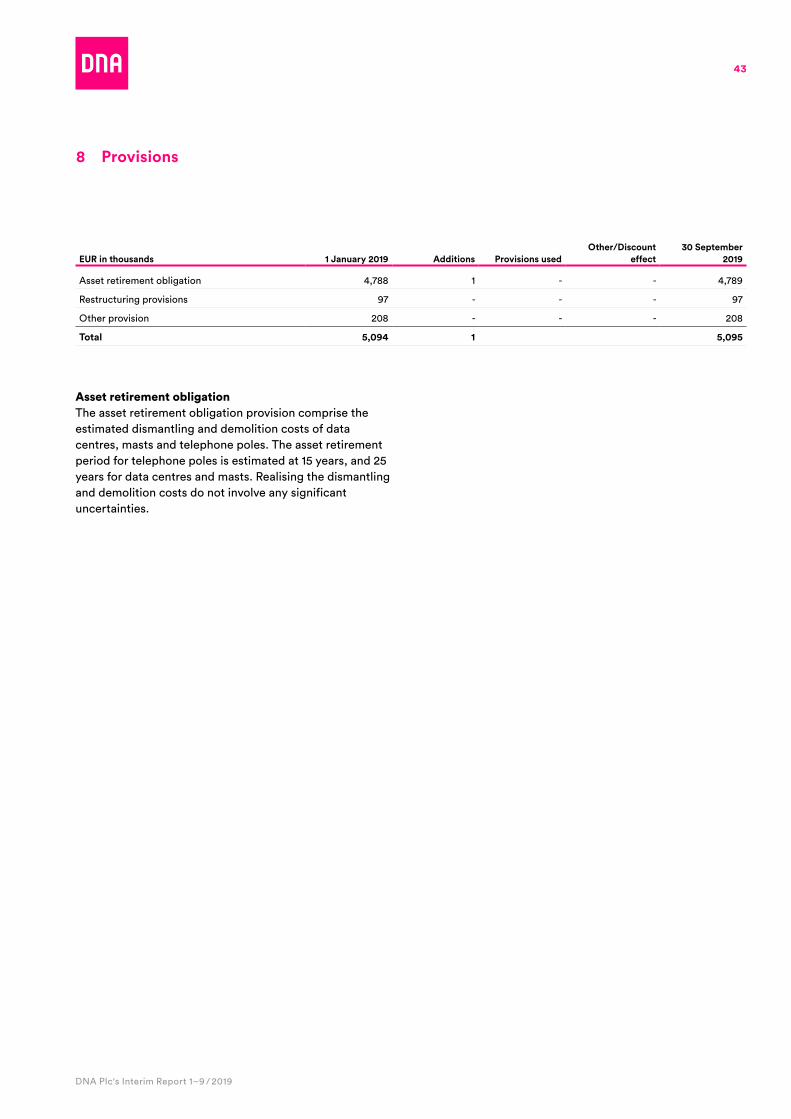
43
DNA Plc's Interim Report 1–9 / 2019
8 Provisions
EUR in thousands 1 January 2019 Additions Provisions usedOther/Discount
effect30 September
2019
Asset retirement obligation 4,788 1 - - 4,789
Restructuring provisions 97 - - - 97
Other provision 208 - - - 208
Total 5,094 1 5,095
Asset retirement obligationThe asset retirement obligation provision comprise the estimated dismantling and demolition costs of data centres, masts and telephone poles . The asset retirement period for telephone poles is estimated at 15 years, and 25 years for data centres and masts . Realising the dismantling and demolition costs do not involve any significant uncertainties .
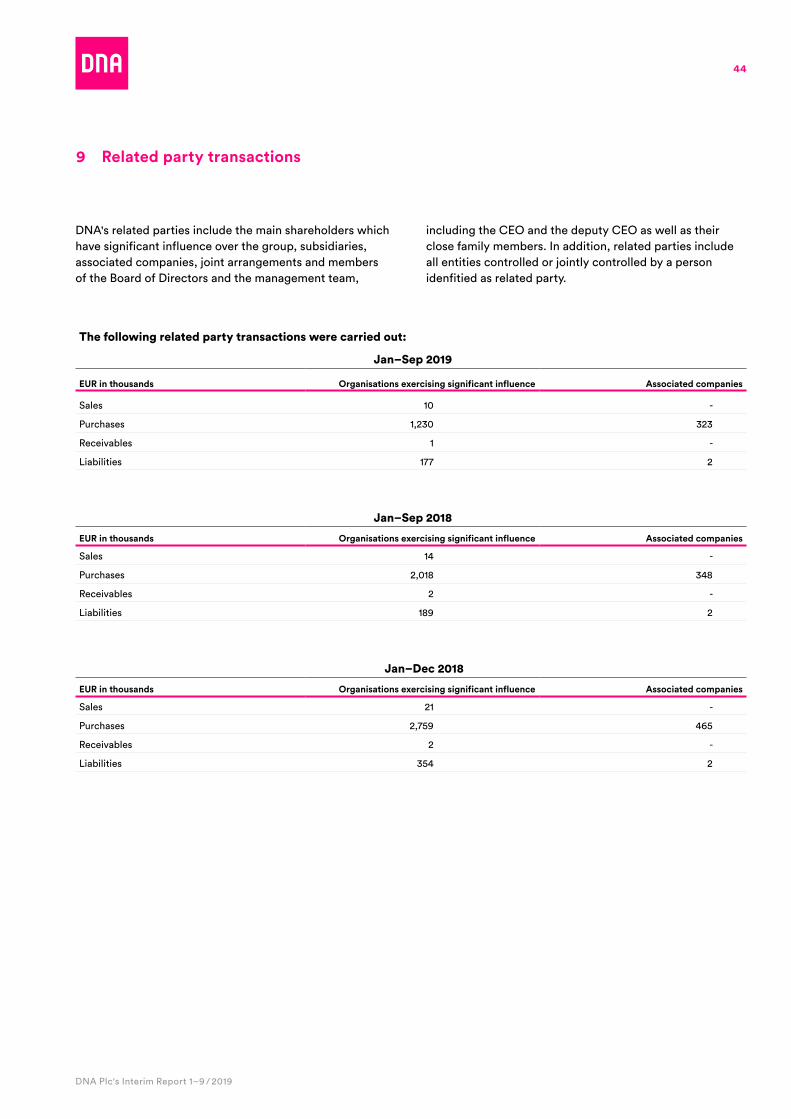
44
DNA Plc's Interim Report 1–9 / 2019
9 Related party transactions
DNA's related parties include the main shareholders which have significant influence over the group, subsidiaries, associated companies, joint arrangements and members of the Board of Directors and the management team,
including the CEO and the deputy CEO as well as their close family members . In addition, related parties include all entities controlled or jointly controlled by a person idenfitied as related party .
The following related party transactions were carried out:
Jan–Sep 2019
EUR in thousands Organisations exercising significant influence Associated companies
Sales 10 -
Purchases 1,230 323
Receivables 1 -
Liabilities 177 2
Jan–Sep 2018
EUR in thousands Organisations exercising significant influence Associated companies
Sales 14 -
Purchases 2,018 348
Receivables 2 -
Liabilities 189 2
Jan–Dec 2018
EUR in thousands Organisations exercising significant influence Associated companies
Sales 21 -
Purchases 2,759 465
Receivables 2 -
Liabilities 354 2
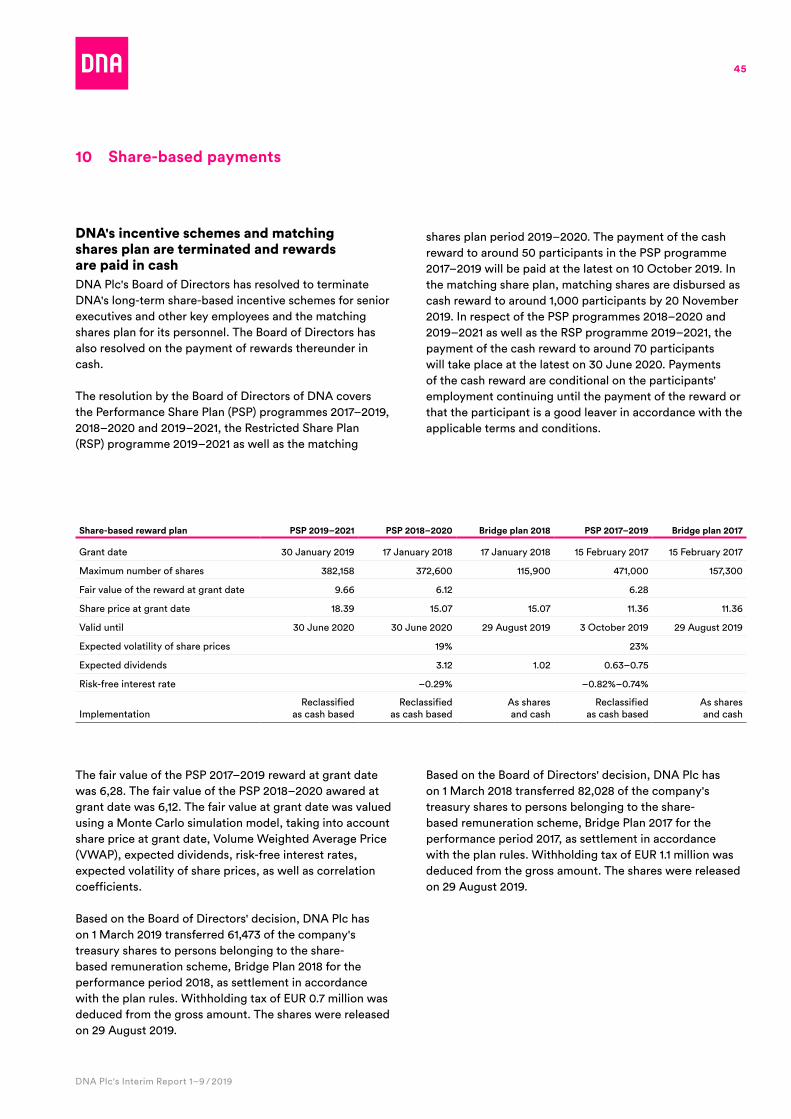
45
DNA Plc's Interim Report 1–9 / 2019
10 Share-based payments
DNA's incentive schemes and matching shares plan are terminated and rewards are paid in cashDNA Plc's Board of Directors has resolved to terminate DNA's long-term share-based incentive schemes for senior executives and other key employees and the matching shares plan for its personnel . The Board of Directors has also resolved on the payment of rewards thereunder in cash .
The resolution by the Board of Directors of DNA covers the Performance Share Plan (PSP) programmes 2017–2019, 2018–2020 and 2019–2021, the Restricted Share Plan (RSP) programme 2019–2021 as well as the matching
shares plan period 2019–2020 . The payment of the cash reward to around 50 participants in the PSP programme 2017–2019 will be paid at the latest on 10 October 2019 . In the matching share plan, matching shares are disbursed as cash reward to around 1,000 participants by 20 November 2019 . In respect of the PSP programmes 2018–2020 and 2019–2021 as well as the RSP programme 2019–2021, the payment of the cash reward to around 70 participants will take place at the latest on 30 June 2020 . Payments of the cash reward are conditional on the participants' employment continuing until the payment of the reward or that the participant is a good leaver in accordance with the applicable terms and conditions .
Share-based reward plan PSP 2019–2021 PSP 2018–2020 Bridge plan 2018 PSP 2017–2019 Bridge plan 2017
Grant date 30 January 2019 17 January 2018 17 January 2018 15 February 2017 15 February 2017
Maximum number of shares 382,158 372,600 115,900 471,000 157,300
Fair value of the reward at grant date 9 .66 6 .12 6 .28
Share price at grant date 18 .39 15 .07 15 .07 11 .36 11 .36
Valid until 30 June 2020 30 June 2020 29 August 2019 3 October 2019 29 August 2019
Expected volatility of share prices 19% 23%
Expected dividends 3 .12 1 .02 0 .63–0 .75
Risk-free interest rate –0 .29% –0 .82%–0 .74%
ImplementationReclassified
as cash basedReclassified
as cash basedAs shares and cash
Reclassified as cash based
As shares and cash
The fair value of the PSP 2017–2019 reward at grant date was 6,28 . The fair value of the PSP 2018–2020 awared at grant date was 6,12 . The fair value at grant date was valued using a Monte Carlo simulation model, taking into account share price at grant date, Volume Weighted Average Price (VWAP), expected dividends, risk-free interest rates, expected volatility of share prices, as well as correlation coefficients .
Based on the Board of Directors' decision, DNA Plc has on 1 March 2019 transferred 61,473 of the company's treasury shares to persons belonging to the share-based remuneration scheme, Bridge Plan 2018 for the performance period 2018, as settlement in accordance with the plan rules . Withholding tax of EUR 0 .7 million was deduced from the gross amount . The shares were released on 29 August 2019 .
Based on the Board of Directors' decision, DNA Plc has on 1 March 2018 transferred 82,028 of the company's treasury shares to persons belonging to the share-based remuneration scheme, Bridge Plan 2017 for the performance period 2017, as settlement in accordance with the plan rules . Withholding tax of EUR 1 .1 million was deduced from the gross amount . The shares were released on 29 August 2019 .
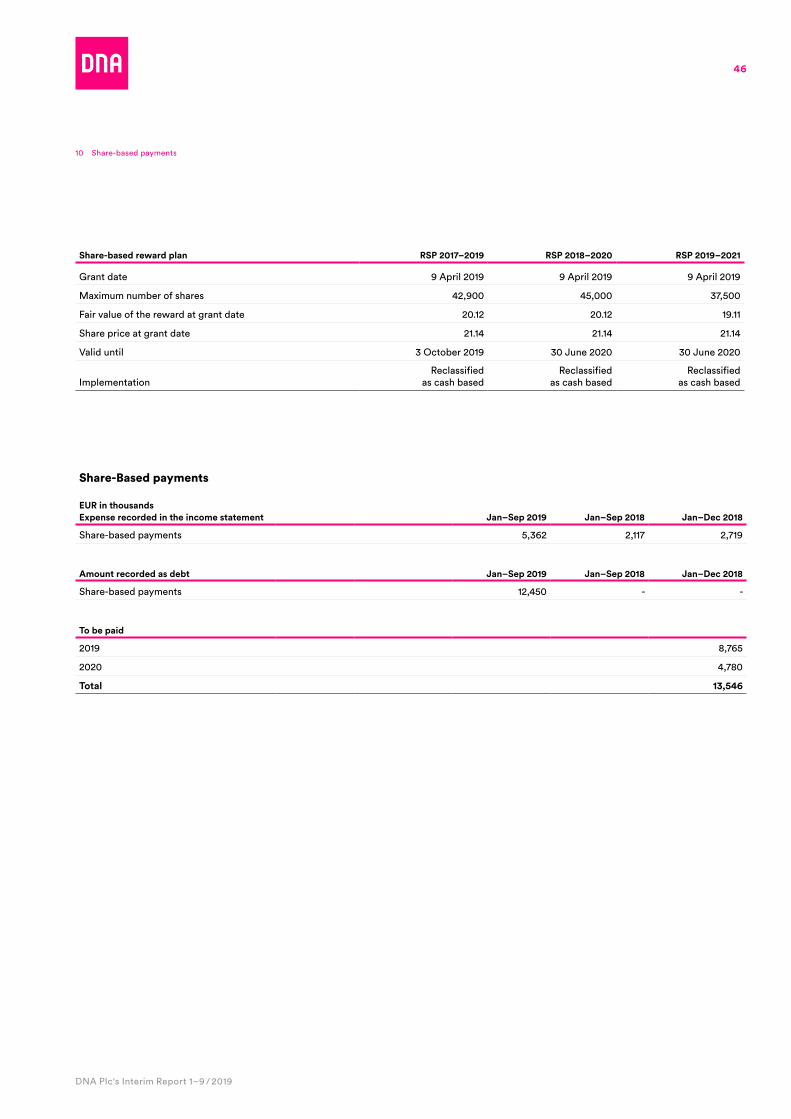
46
DNA Plc's Interim Report 1–9 / 2019
10 Share-based payments
Share-Based payments
EUR in thousandsExpense recorded in the income statement Jan–Sep 2019 Jan–Sep 2018 Jan–Dec 2018
Share-based payments 5,362 2,117 2,719
Amount recorded as debt Jan–Sep 2019 Jan–Sep 2018 Jan–Dec 2018
Share-based payments 12,450 - -
To be paid
2019 8,765
2020 4,780
Total 13,546
Share-based reward plan RSP 2017–2019 RSP 2018–2020 RSP 2019–2021
Grant date 9 April 2019 9 April 2019 9 April 2019
Maximum number of shares 42,900 45,000 37,500
Fair value of the reward at grant date 20 .12 20 .12 19 .11
Share price at grant date 21 .14 21 .14 21 .14
Valid until 3 October 2019 30 June 2020 30 June 2020
ImplementationReclassified
as cash basedReclassified
as cash basedReclassified
as cash based
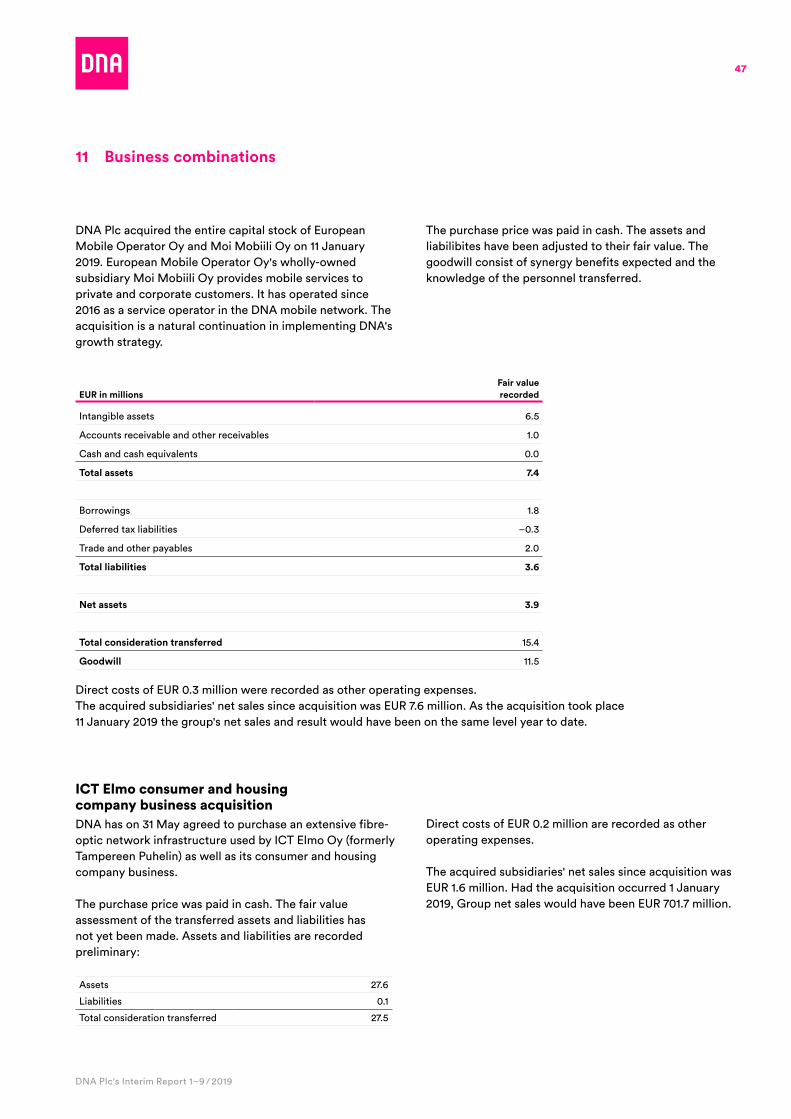
47
DNA Plc's Interim Report 1–9 / 2019
11 Business combinations
DNA Plc acquired the entire capital stock of European Mobile Operator Oy and Moi Mobiili Oy on 11 January 2019 . European Mobile Operator Oy's wholly-owned subsidiary Moi Mobiili Oy provides mobile services to private and corporate customers . It has operated since 2016 as a service operator in the DNA mobile network . The acquisition is a natural continuation in implementing DNA's growth strategy .
The purchase price was paid in cash . The assets and liabilibites have been adjusted to their fair value . The goodwill consist of synergy benefits expected and the knowledge of the personnel transferred .
EUR in millionsFair value recorded
Intangible assets 6 .5
Accounts receivable and other receivables 1 .0
Cash and cash equivalents 0 .0
Total assets 7.4
Borrowings 1 .8
Deferred tax liabilities –0 .3
Trade and other payables 2 .0
Total liabilities 3.6
Net assets 3.9
Total consideration transferred 15 .4
Goodwill 11 .5
Direct costs of EUR 0 .3 million were recorded as other operating expenses . The acquired subsidiaries' net sales since acquisition was EUR 7 .6 million . As the acquisition took place 11 January 2019 the group's net sales and result would have been on the same level year to date .
ICT Elmo consumer and housing company business acquisitionDNA has on 31 May agreed to purchase an extensive fibre-optic network infrastructure used by ICT Elmo Oy (formerly Tampereen Puhelin) as well as its consumer and housing company business .
The purchase price was paid in cash . The fair value assessment of the transferred assets and liabilities has not yet been made . Assets and liabilities are recorded preliminary:
Assets 27 .6
Liabilities 0 .1
Total consideration transferred 27 .5
Direct costs of EUR 0 .2 million are recorded as other operating expenses .
The acquired subsidiaries' net sales since acquisition was EUR 1 .6 million . Had the acquisition occurred 1 January 2019, Group net sales would have been EUR 701 .7 million .
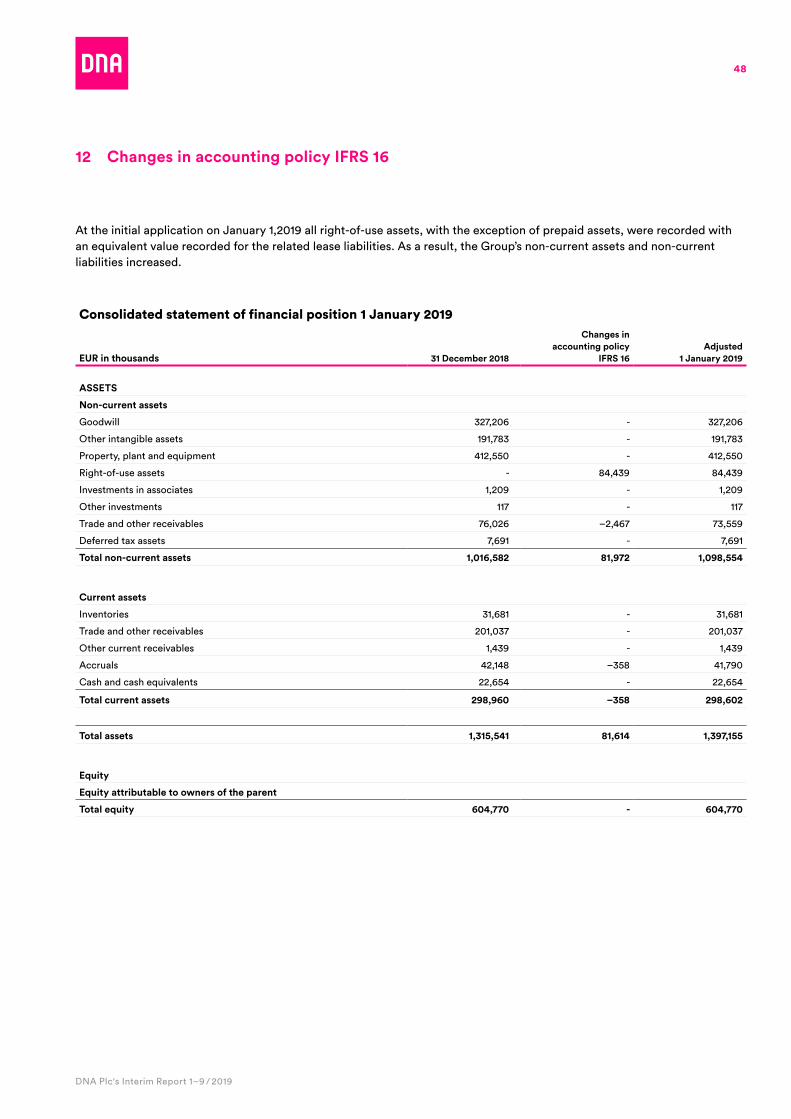
48
DNA Plc's Interim Report 1–9 / 2019
12 Changes in accounting policy IFRS 16
At the initial application on January 1,2019 all right-of-use assets, with the exception of prepaid assets, were recorded with an equivalent value recorded for the related lease liabilities . As a result, the Group’s non-current assets and non-current liabilities increased .
Consolidated statement of financial position 1 January 2019
EUR in thousands 31 December 2018
Changes in accounting policy
IFRS 16Adjusted
1 January 2019
ASSETS
Non-current assets
Goodwill 327,206 - 327,206
Other intangible assets 191,783 - 191,783
Property, plant and equipment 412,550 - 412,550
Right-of-use assets - 84,439 84,439
Investments in associates 1,209 - 1,209
Other investments 117 - 117
Trade and other receivables 76,026 –2,467 73,559
Deferred tax assets 7,691 - 7,691
Total non-current assets 1,016,582 81,972 1,098,554
Current assets
Inventories 31,681 - 31,681
Trade and other receivables 201,037 - 201,037
Other current receivables 1,439 - 1,439
Accruals 42,148 –358 41,790
Cash and cash equivalents 22,654 - 22,654
Total current assets 298,960 –358 298,602
Total assets 1,315,541 81,614 1,397,155
Equity
Equity attributable to owners of the parent
Total equity 604,770 - 604,770
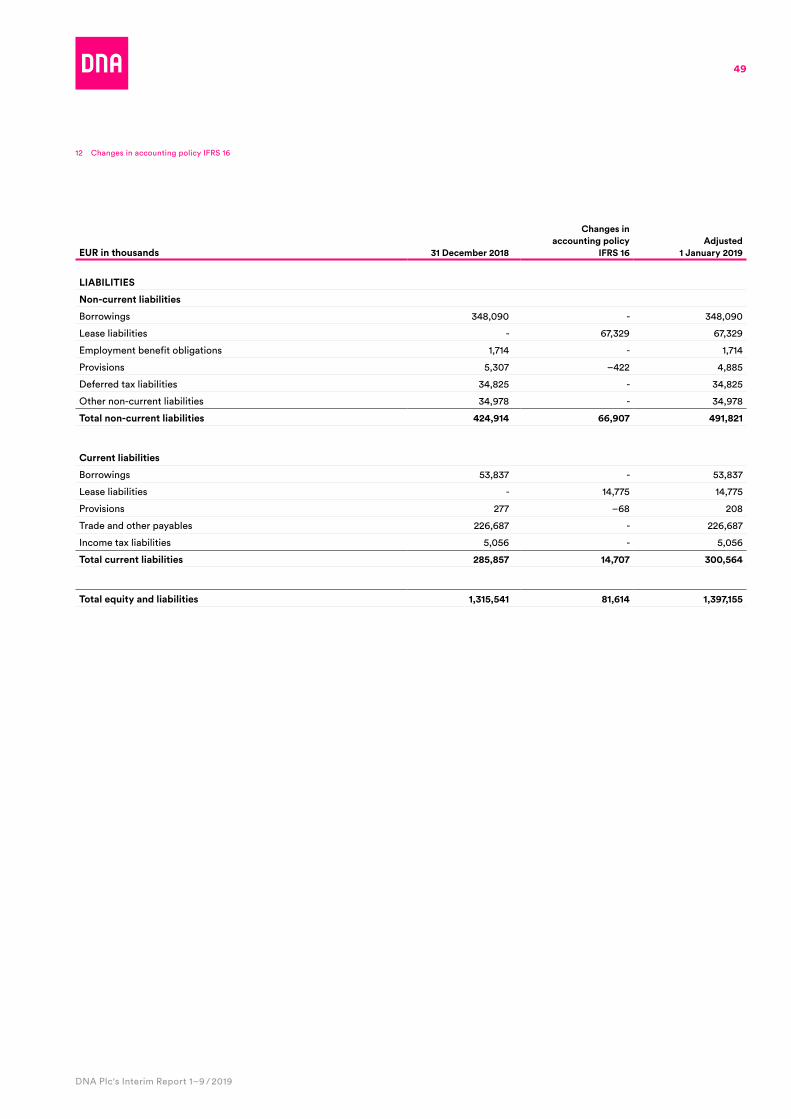
49
DNA Plc's Interim Report 1–9 / 2019
12 Changes in accounting policy IFRS 16
EUR in thousands 31 December 2018
Changes in accounting policy
IFRS 16Adjusted
1 January 2019
LIABILITIES
Non-current liabilities
Borrowings 348,090 - 348,090
Lease liabilities - 67,329 67,329
Employment benefit obligations 1,714 - 1,714
Provisions 5,307 –422 4,885
Deferred tax liabilities 34,825 - 34,825
Other non-current liabilities 34,978 - 34,978
Total non-current liabilities 424,914 66,907 491,821
Current liabilities
Borrowings 53,837 - 53,837
Lease liabilities - 14,775 14,775
Provisions 277 –68 208
Trade and other payables 226,687 - 226,687
Income tax liabilities 5,056 - 5,056
Total current liabilities 285,857 14,707 300,564
Total equity and liabilities 1,315,541 81,614 1,397,155
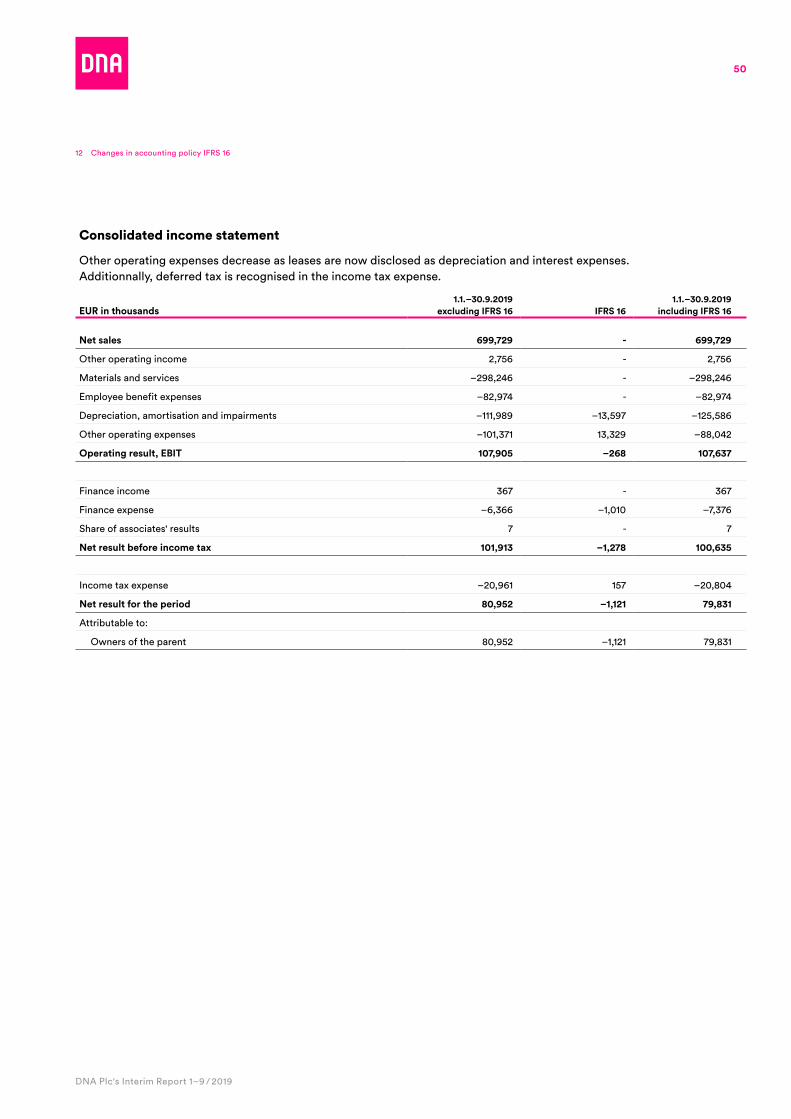
50
DNA Plc's Interim Report 1–9 / 2019
12 Changes in accounting policy IFRS 16
Consolidated income statement
Other operating expenses decrease as leases are now disclosed as depreciation and interest expenses . Additionnally, deferred tax is recognised in the income tax expense .
EUR in thousands1.1.–30.9.2019
excluding IFRS 16 IFRS 161.1.–30.9.2019
including IFRS 16
Net sales 699,729 - 699,729
Other operating income 2,756 - 2,756
Materials and services –298,246 - –298,246
Employee benefit expenses –82,974 - –82,974
Depreciation, amortisation and impairments –111,989 –13,597 –125,586
Other operating expenses –101,371 13,329 –88,042
Operating result, EBIT 107,905 –268 107,637
Finance income 367 - 367
Finance expense –6,366 –1,010 –7,376
Share of associates' results 7 - 7
Net result before income tax 101,913 –1,278 100,635
Income tax expense –20,961 157 –20,804
Net result for the period 80,952 –1,121 79,831
Attributable to:
Owners of the parent 80,952 –1,121 79,831

D N A P l c • L ä k k i s e p ä n t i e 2 1 , F I - 0 0 6 2 0 H e l s i n k i • w w w .d n a . f i / i n ve s t o r s