DNA damage and acute toxicity caused by the urban air pollutant 3-nitrobenzanthrone in rats;...
12
DNA Damage and Acute Toxicity Caused by the Urban Air Pollutant 3-Nitrobenzanthrone in Rats: Characterization of DNA Adducts in Eight Different Tissues and Organs With Synthesized Standards Eszter Nagy, 1 Shuichi Adachi, 2 Takeji Takamura-Enya, 3 Magnus Zeisig, 1 and Lennart M˛ller 1 * 1 Department of Biosciences and Nutrition at Novum, Karolinska Institutet, Huddinge, Sweden 2 Department of Public Health, Sagami Women’s University, Kanagawa, Sagamihara, Japan 3 National Cancer Center Research Institute, Chuo-ku, Tokyo, Japan 3-Nitrobenzanthrone (3-NBA) is an urban air pol- lutant and rat lung carcinogen that is among the most potent mutagens yet tested in the Salmonella reversion assay. In the present study, 1 mg 3-NBA was administered orally to female F344 rats and DNA adduct formation was examined in liver, lung, kidney and five sections of the gastrointesti- nal (GI) tract at 6 hr, and 1, 2, 3, 5, and 10 days after administration. The DNA adduct patterns, analyzed by 32 P-postlabelling followed by HPLC separation, were similar in all tissues and organs. Five of the adduct peaks cochromatographed with synthesized DNA adduct standards. Three of these unequivocally determined standards, dGp- C8-N-ABA, dGp-N2-C2-ABA, and dAp-N6-C2- ABA, were of the nonacetylated type, suggesting that at least part of the pathway for activation of 3-NBA proceeds through O-acetylation of the hy- droxylamine intermediate. The two other DNA adduct standards, dGp-C8-C2-N-Ac-ABA, and dGp-N2-C2-N-Ac-ABA, were of the acetylated type, but there was some ambiguity in the charac- terization of these DNA adducts, since they varied inconsistently between samples and they also aligned with peaks found in controls. At 6 hr after treatment, the level of DNA adducts was highest in glandular stomach (relative adduct labeling (RAL), *70 adducts/10 8 normal nucleotides (NN)); adduct levels in this organ decreased at 24 hr, but increased afterwards. DNA adduct lev- els in the majority of organs were characterized by an early increase (from 6 hr to 3 days), which was followed by a decrease at 5 days and a maximum level 10 days after administration (RAL *120 adducts/10 8 NN for the lung, kidney and glandular stomach, *80 adducts/10 8 NN for the forestomach and ceacum, and *40 adducts/10 8 NN for the liver, small intestine, and colon). This pattern was consistent with pathological observa- tions during autopsy showing high levels of tissue damage in the GI tract; the tissue damage included hemorrhages, loss of villous surface struc- ture in the small intestine, as well as intestine fra- gility and oedema of the adipose tissue around the GI-tract. Tissue damage decreased and DNA adduct levels increased at 10 days after adminis- tration. These observations suggest that 3-NBA not only exerts acute toxic effects, but that the bioa- vailability is affected by storage in tissues and later becomes available, resulting in the increased DNA adduct levels at the later time points of col- lection. Environ. Mol. Mutagen. 47:541–552, 2006. V V C 2006 Wiley-Liss, Inc. Key words: 3-nitrobenzanthrone; air pollutant; oral administration; acute toxicity; DNA adducts; F344 rats INTRODUCTION The combustion of diesel fuel produces polycyclic aro- matic hydrocarbons (PAHs) and their nitro-derivates [Wei- senberger, 1984], which are responsible for the mutagenic- ity of diesel engine exhaust [Salmeen et al., 1984; Arey et al., 1988; Hayakawa et al., 1997; Yamazaki et al., 2000]. One of the nitro-PAHs found in diesel exhaust and ambient air, 3-nitrobenzanthrone (3-nitro-7H-benz[de]an- *Correspondence to: Lennart Mo ¨ller, Department of Biosciences and Nutrition at Novum, Karolinska Institutet, S-141 57 Huddinge, Sweden. E-mail: [email protected] Grant sponsor: Swedish Environmental Protection Agency. Received 28 February 2006; provisionally accepted 5 April 2006; and in final form 5 May 2006 DOI 10.1002/em.20227 Published online 22 June 2006 in Wiley InterScience (www.interscience. wiley.com). V V C 2006 Wiley-Liss, Inc. Environmental and Molecular Mutagenesis 47:541^552 (2006)
-
Upload
eszter-nagy -
Category
Documents
-
view
213 -
download
1
Transcript of DNA damage and acute toxicity caused by the urban air pollutant 3-nitrobenzanthrone in rats;...

DNADamage and Acute Toxicity Caused by theUrban Air Pollutant 3-Nitrobenzanthronein Rats: Characterization of DNA Adductsin Eight Different Tissues andOrgans
With Synthesized Standards
Eszter Nagy,1 Shuichi Adachi,2 Takeji Takamura-Enya,3
Magnus Zeisig,1 and Lennart M˛ller1*1Department of Biosciences and Nutrition at Novum, Karolinska Institutet,
Huddinge, Sweden2Department of Public Health, Sagami Women’s University, Kanagawa,
Sagamihara, Japan3National Cancer Center Research Institute, Chuo-ku, Tokyo, Japan
3-Nitrobenzanthrone (3-NBA) is an urban air pol-lutant and rat lung carcinogen that is among themost potent mutagens yet tested in the Salmonellareversion assay. In the present study, 1 mg 3-NBAwas administered orally to female F344 rats andDNA adduct formation was examined in liver,lung, kidney and five sections of the gastrointesti-nal (GI) tract at 6 hr, and 1, 2, 3, 5, and 10 daysafter administration. The DNA adduct patterns,analyzed by 32P-postlabelling followed by HPLCseparation, were similar in all tissues and organs.Five of the adduct peaks cochromatographed withsynthesized DNA adduct standards. Three ofthese unequivocally determined standards, dGp-C8-N-ABA, dGp-N2-C2-ABA, and dAp-N6-C2-ABA, were of the nonacetylated type, suggestingthat at least part of the pathway for activation of3-NBA proceeds through O-acetylation of the hy-droxylamine intermediate. The two other DNAadduct standards, dGp-C8-C2-N-Ac-ABA, anddGp-N2-C2-N-Ac-ABA, were of the acetylatedtype, but there was some ambiguity in the charac-terization of these DNA adducts, since they variedinconsistently between samples and they alsoaligned with peaks found in controls. At 6 hr aftertreatment, the level of DNA adducts was highestin glandular stomach (relative adduct labeling
(RAL), *70 adducts/108 normal nucleotides(NN)); adduct levels in this organ decreased at24 hr, but increased afterwards. DNA adduct lev-els in the majority of organs were characterizedby an early increase (from 6 hr to 3 days), whichwas followed by a decrease at 5 days and amaximum level 10 days after administration (RAL*120 adducts/108 NN for the lung, kidney andglandular stomach, *80 adducts/108 NN for theforestomach and ceacum, and *40 adducts/108
NN for the liver, small intestine, and colon). Thispattern was consistent with pathological observa-tions during autopsy showing high levels of tissuedamage in the GI tract; the tissue damageincluded hemorrhages, loss of villous surface struc-ture in the small intestine, as well as intestine fra-gility and oedema of the adipose tissue aroundthe GI-tract. Tissue damage decreased and DNAadduct levels increased at 10 days after adminis-tration. These observations suggest that 3-NBA notonly exerts acute toxic effects, but that the bioa-vailability is affected by storage in tissues andlater becomes available, resulting in the increasedDNA adduct levels at the later time points of col-lection. Environ. Mol. Mutagen. 47:541–552,2006. VVC 2006 Wiley-Liss, Inc.
Key words: 3-nitrobenzanthrone; air pollutant; oral administration; acute toxicity; DNA adducts;F344 rats
INTRODUCTION
The combustion of diesel fuel produces polycyclic aro-
matic hydrocarbons (PAHs) and their nitro-derivates [Wei-
senberger, 1984], which are responsible for the mutagenic-
ity of diesel engine exhaust [Salmeen et al., 1984; Arey
et al., 1988; Hayakawa et al., 1997; Yamazaki et al.,
2000]. One of the nitro-PAHs found in diesel exhaust and
ambient air, 3-nitrobenzanthrone (3-nitro-7H-benz[de]an-
*Correspondence to: Lennart Moller, Department of Biosciences and
Nutrition at Novum, Karolinska Institutet, S-141 57 Huddinge, Sweden.
E-mail: [email protected]
Grant sponsor: Swedish Environmental Protection Agency.
Received 28 February 2006; provisionally accepted 5 April 2006; and in
final form 5 May 2006
DOI 10.1002/em.20227
Published online 22 June 2006 in Wiley InterScience (www.interscience.
wiley.com).
VVC 2006Wiley-Liss, Inc.
Environmental andMolecular Mutagenesis 47:541^552 (2006)
thracen-7-one; 3-NBA), is a ketone nitro-PAH derivative
that has profound effects on biological systems [Enya
et al., 1997; Enya et al., 1998]. The mutagenicity of 3-
NBA in the Salmonella reversion assay is comparable to
that of 1,8-dinitropyrene, which is considered the most
potent mutagenic substance tested so far in this assay. 3-
NBA induces several different types of mutations, such as
frameshifts, transversions, and transitions, and produces
high levels of DNA adducts in vivo [Arlt et al., 2001; Arlt
et al., 2004; Arlt et al., 2005], as well as tumors [Nagy
et al., 2005b] and oxidative damage [Nagy et al., 2005a].
Several studies have shown that 3-NBA is present ubiq-
uitously in the environment at concentrations well within
the range of 1-nitropyrene, the dinitropyrenes, and ben-
zo[a]pyrene, the most common markers of urban air pollu-
tion [Grynkiewicz et al., 2001; Kiss et al., 2001; Feilberg
et al., 2002; Murahashi et al., 2003; Phousongphouang and
Arey, 2003]. However, the concentration of 3-NBA is
highest near the source of emission and relatively low in
ambient air due to extensive rearrangement to 2-NBA in
the atmosphere [Phousongphouang and Arey, 2003; Lamy
et al., 2004]. Previously, we have shown that in human
cell models 2-NBA is about 1/3 as potent as 3-NBA in
terms of oxidative stress and DNA adduct formation
[Nagy et al., 2005a], but exists at 70-fold higher concen-
trations than 3-NBA in ambient air.
Studies on the pathways of 3-NBA metabolism indicate
that the metabolite, N-acetoxy-N-acetyl-aminobenzan-
throne [Kawanishi et al., 1998], induces DNA base substi-
tutions, similar to the mutations induced by aminofluorene
(2-AF), acetylaminofluorene (2-AAF), and nitro- and ni-
troso-PAHs [Shelton and DeMarini, 1995; Shibutani and
Grollman, 1997], suggesting that these compounds are
metabolized through similar pathways. In a chronic expo-
sure study of 2-nitrofluorene (2-NF) in rats, the tissue
DNA adduct formation during the first days of exposure
was correlated with tumor formation up to two years later
[Cui et al., 1995]. These observations are similar to the
results obtained in our previous study, in which treatment
of rats with 3-NBA gave rise to a rapid increase in DNA
adducts of the lung during the first few days after adminis-
tration, followed by the development of squamous cell car-
cinoma in the lungs within 18 months [Nagy et al.,
2005b].
In the present study, we have investigated the total
DNA adduct formation following a single oral dose of 3-
NBA to F344 female rats, the same animal model used
in our tumor study. The oral route of administration was
chosen since many substances that enter the lungs are
also transported up to the throat and consequently swal-
lowed. Authentic DNA adduct standards were used to
characterize the types of adducts formed in liver, lung,
kidney, and the gastrointestinal (GI) tract up to 10 days
after dosing.
MATERIALS ANDMETHODS
Reagents and Chemicals
The reagents and enzymes used in the study were purchased from the
following sources: Nuclease P1 and RNAse A (from bovine pancreas),
both from Roche (Mannheim, Germany), and Spleen Phosphodiestrase
type II (SPD; from calf spleen) from Calbiochem (Darmstadt, Germany);
RNAse T1 (from Aspergillus oryzae), Protease (from Streptomyces gri-seus) and Micrococcal Nuclease (MN) from Sigma (St. Louis, MO);
adenosine 50-[g-32P] triphosphate (32P-ATP; 3,000 Ci/mmol) from Amer-
sham International (Little Chalfont, UK); and Polynucleotide Kinase
(PNK) from USB (Cleveland, OH). All chemicals were of analytical
grade.
3-NBA was synthesized and kindly provided by Prof. Hitomi Suzuki,
Department of Chemistry, Kyoto University, Kyoto, Japan. The eight
synthesized DNA adduct standards described below were kindly pro-
vided by Dr. Takeji Takamura-Enya, Cancer Prevention Division,
National Cancer Center Research Institute, Tsukiji, Tokyo, Japan.
Warning: The substances, 3-NBA, 3-NBA-derived metabolites, phenol,
and 32P-ATP, that were used in the experimental procedures are
extremely hazardous and proper precautions and guidelines should be
followed when handling and discarding the chemicals.
DNA Adduct Standards
The standards of possible DNA adducts from 3-NBA (Fig. 1), N-acetyl-
3-amino-2-(20-deoxyguanosin-8-yl)-benzanthrone 30-phosphate (Std 1), 90-(2@-deoxyribofuranosyl)purino[60,10:2,3]imidazo[5,4-p]�1,11b-dihydro-N-acetyl-3-aminobenzanthrone 30-phosphate (Std 2), 3-amino-2-(20-deoxygua-nosin-8-yl)-benzanthrone 30-phosphate (Std 3), N-acetyl-3-amino-2-(20-deoxyguanosin-N2-yl)-benzanthrone 30-phosphate (Std 4), 3-amino-N-(20-deoxyguanosin-8-yl)-benzanthrone 30-phosphate (Std 5), 3-amino-2-(20-deoxyguanosin-N2-yl)-benzanthrone 30-phosphate (Std 6), 3-amino-2-(20-deoxyadenosin-N6-yl)-benzanthrone 30-phosphate (Std 7), and N-acetyl-3-
amino-N-(20-deoxyguanosin-8-yl)-benzanthrone 30-phosphate (Std 8), were
synthesized as previously described [Takamura et al., 2004]. In short, the
synthesis involved reaction of nucleotides and an ultimate reactive form of
3-NBA, followed by fractionation using a linear gradient of 3–40% acetoni-
trile in 0.25% triethylamine-acetate (pH 7) on a reverse-phase HPLC col-
umn. The standards were evaporated to dryness and stored at �808C. Theauthenticity of these DNA adducts with 30-phosphate was checked by MS
and UV analysis. Before the analyses, the standards were dissolved in Milli-
Q water at a concentration of 100 nM, and labeled with 32P-phosphate. The
standards were analyzed both separately and in conjunction with in vivo
samples.
Animal Treatment and Tissue Collection
The animal experiment was performed at the Animal Experiment Cen-
ter at Saitama Medical University (Saitama, Japan). Ethical permission,
No. 000135, was provided by the Animal Research Committee of Sai-
tama Medical University in Japan.
Six-week-old female Fischer F344 rats (*110 g) were administered a
single oral dose of 1 mg (9 mg/kg bw) 3-NBA suspended in 1.0 ml tri-
octanoine (1.0 mg/ml). Control animals were administered 1.0 ml vehi-
cle. The animals were sacrificed at 6 hr, and at 1, 2, 3, 5 days (N ¼ 3 at
each time point) and at 10 days (N ¼ 4) after administration. Control
animals were sacrificed after 10 days (N ¼ 5). Liver, lung, kidney, and
the entire digestive tract were collected and immediately frozen on dry
ice and stored at �808C until analysis.
Before DNA-extraction, the GI-tract was divided into five sections:
forestomach, glandular stomach, small intestine (20 cm), ceacum, and
colon (entire). Each GI-section was cut open and rinsed carefully with a
physiological saline solution. The soft tissue from the small intestine and
Environmental and Molecular Mutagenesis. DOI 10.1002/em
542 Nagy et al.

colon was scraped off using a regular microscope slide to obtain epithe-
lium-enriched fractions, which were used for DNA-extraction. The other
tissues were cut into small pieces before DNA-extraction.
Tissue damage in the GI-tract was observed during work up and noted
due to the pronounced nature of the damage compared to controls.
DNA Extraction and 32P-HPLC Analysis of DNA Adducts
DNA Extraction
DNA was obtained from 0.2 g pieces of liver, lung, kidney, and sec-
tions from the GI-tract by phenol-chloroform extraction. Briefly, the tis-
sues were suspended in 5 ml 1% SDS-EDTA buffer and 120 ll 1 M
Tris-HCl (pH 7.4). The tissues were homogenized and treated with
120 ll of 10 mg/ml RNAse A and 40 ll of 5 U/ll RNAse T1 for 1 hr at
378C. 300 ll of 10 mg/ml Protease were added and the mixture was
incubated for an additional 1 hr at 378C. The mixture was then extracted
with 1 vol of phenol and centrifuged at 2,800g for 10 min. The aqueous
phase was extracted with 1 vol of phenol:sevag (1:1) and centrifuged as
above. Following this, the aqueous phase was extracted again with 1 vol
of sevag and centrifuged. The DNA was precipitated using 1 vol ethanol
and 0.1 vol 5 M NaCl, and the DNA pellet was washed with 70% etha-
nol and centrifuged at 2,800g for 5 min. After the DNA pellet had dried,
it was redissolved in water. The DNA concentration and purity were
determined by UV spectrometry. Aliquots of 10 lg DNA were dried
through evaporation and stored at �808C for further analysis.
DNA Adduct Enrichment and 32P-Postlabeling
Briefly, 10 lg aliquots of DNA were dissolved in Milli-Q water and
digested by 4 ll each of 0.2 U/ll micrococcal nuclease and 1 mU/llSPD, with a total incubation time of 4 hr at 378C.
The hydrolyzed DNA and nucleotide samples were adduct-enriched by
butanol extraction. The phase transfer agent 10 mM tetrabutyl ammo-
nium chloride (TBA), together with 100 mM ammonium formate buffer
(pH 3.5), facilitated the transfer of lipophilic adducts to the organic
phase, while unmodified hydrophilic nucleotides remained in the water
phase. The organic phase was evaporated to dryness.
The butanol-enriched samples were redissolved in Milli-Q water. A
mixture of 0.25 ll 400 mM PNK buffer, 0.5 ll T4-PNK enzyme (0.5 U/
lg DNA) and 1.8 ll 32P-ATP (0.06 pmol/lg DNA) was added and the
samples were incubated 30 min at 378C. After incubation, the samples
were stored at �208C until analysis.
DNA Adduct Analysis
The 32P-HPLC system consisted of a Waters 600 E pump (Waters,
Milford, MA), a Hichrom, RP 5-C18, K-100 guard column (Hichrom,
Reading, UK), two serial reversed-phase DeltaPak C18 (150 3 3.9 mm
id), 5 lm (100 A) main columns (Waters), and a Packard 500 TR flow
scintillation detector (Packard Instruments, Meriden, CT). The labeled
samples were diluted with *150 ll of Milli-Q water immediately before
injection into the 32P-HPLC system.
Tissue DNAs were analyzed using a 70 min linear gradient of 0–40%
of 87.5% acetonitrile:water in 2 M ammonium formate and 0.4 M formic
acid (pH 4.5) at a flow rate of 0.5 ml/min.
A second gradient with a plateau was used for the analysis of stand-
ards with selected tissues: 0–19% of 87.5% acetonitrile:water for 0–
33 min in 2 M ammonium formate and 0.4 M formic acid (pH 4.5) at a
flow rate of 0.5 ml/min; followed by a 15-min plateau with the 19%
mixture. The amount of 87.5% acetonitrile:water then was increased to
40% during 48–90 min.
It should be pointed out that standards were analyzed using both gra-
dients. Most of the polar compounds in the samples were separated by
Environmental and Molecular Mutagenesis. DOI 10.1002/em
Fig. 1. Two-dimensional structures of the 3-NBA-derived DNA adduct standards: dGp-C8-C2-N-Ac-ABA
(Std 1), dAp-N-Ac-ABA (Std 2), dGp-C8-C2-ABA (Std 3), dGp-N2-C2-N-Ac-ABA (Std 4), dGp-C8-N-ABA
(Std 5), dGp-N2-C2-ABA (Std 6), dAp-N6-C2-ABA (Std 7), and dGp-C8-N-N-Ac-ABA (Std 8).
DNADamage and Acute Toxicity Caused by 3-NBA 543

the guard column and removed by a switch valve, which was open for
1 min after injection.
Recovery, involving both butanol extraction and labeling, was deter-
mined by using known concentrations of each synthesized standard. 1 llof 100 nM standard solution gave recoveries ranging from 4�55% (Std
1, 10%; Std 2, 10%; Std 3, 55%; Std 4, 4%; Std 5, 30%; Std 6, 30%;
Std 7, 40%; and Std 8, 10%). These calculations were based on cochro-
matography of DNA adduct standards. DNA adduct levels in tissues,
however, are presented as relative adduct labeling (RAL).
Statistical Analysis
Total DNA adduct levels were calculated as the sum of DNA adducts
between 50–70 min. For the figures, average values and standard devia-
tions were calculated according to normal procedures. Comparisons
between total DNA adduct levels were performed using the unpaired,
two-tailed Student’s t-test with unequal variance on individual values
grouped according to dose and time-point.
RESULTS
Observations Made During TissueWork-Up
Histopathology was not performed as part of this study;
however, there were indications of agent-related toxicity
during the necropsy performed for tissue collection. Tissue
damage was observed for all the 3-NBA-treated animals
between 1 and 3 days and in at least two out of three or four
animals at the other time points. The organs and tissues that
Environmental and Molecular Mutagenesis. DOI 10.1002/em
TABLE I. Observations in the GI-Tract of Treated Rats Made During Autopsy
0.25 days Hemorrhage
Loss of
tissueaTissue
frailtybAltered
appearancecSwelling of
adipose tissue
Total
scored
Forestomach 4
Glandular stomach X
Small intestine X X X
Ceacum
Colon
1 day
Forestomach X X 15
Glandular stomach X X
Small intestine X X X X
Ceacum X X
Colon X X X X X
2 days
Forestomach X X 15
Glandular stomach X X
Small intestine X X X X
Ceacum X X
Colon X X X X X
3 days
Forestomach X X 14
Glandular stomach X X
Small intestine X X X X
Ceacum X X
Colon X X X X
5 days
Forestomach X 7
Glandular stomach X
Small intestine X X
Ceacum X X
Colon X
10 days
Forestomach X 2
Glandular stomach
Small intestine X
Ceacum
Colon
Vehicle controls that were sacrificed 10 days after treatment are not presented in the Table, but they did not
show any of the pathological features observed in the treated rats.aMostly seen in small intestine and colon as loss of villous surface structure.bMostly seen in small intestine and colon where the intestinal wall tore very easily compared to controls
receiving only vehicle.cChange of color, undefined patches and spots.dA summary of lesions observed and marked as \X".
544 Nagy et al.
were affected are marked as \X" in Table I. No statistical
evaluations were performed on these observations.
Six hours after the administration of 3-NBA, small traces
of the substance were still present as bright yellow patches
in the forestomach and glandular stomach. The compound
was no longer observed after 1 day, but it was evident that
the animals sacrificed 1–3 days after administration were
the most affected by the treatment and displayed the most
tissue damage. Table I expresses the damage in terms of the
total number of clinical signs at each sacrifice time. The
altered appearance observed in the forestomach and glandu-
lar stomach was attributed to a change in color, from a
healthy pink as in the vehicle controls to grayish in the
treated animals. Also in the forestomach, tiny, undefined
dark spots appeared 2 days after administration.
Most of the treated animals displayed loss of the small
intestine villous surface structure, and severe cases had
only half of the soft tissue seen in controls that received ve-
Environmental and Molecular Mutagenesis. DOI 10.1002/em
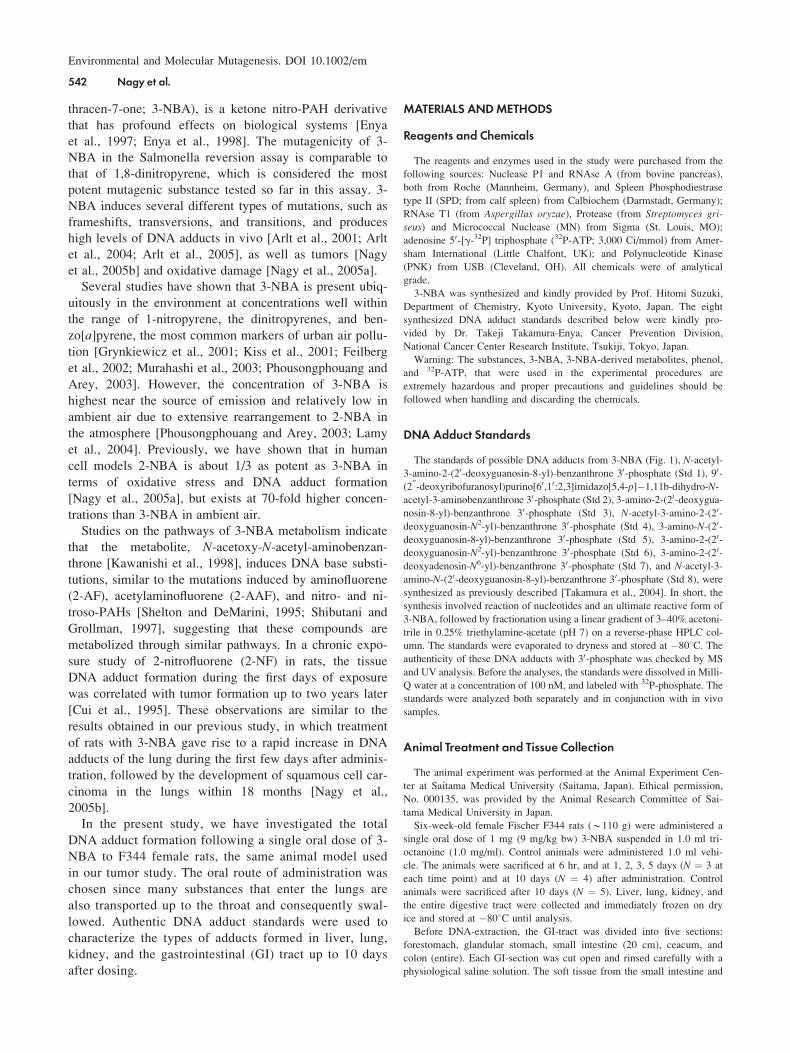
Fig. 2. DNA adduct formation over time in liver, lung and kidney (A)
and in the GI-tract (B). The bars represent mean adducts/108 normal
nucleotides (NN) 6 SD from analyses performed on three animals at
each time point, except at 10 days where four animals were analyzed.
Adduct levels significantly different in comparison to the control tissues
(*P < 0.05; **P < 0.01; ***P < 0.001).
DNADamage and Acute Toxicity Caused by 3-NBA 545

hicle only. During sample collection, the intestinal wall of
treated animals was very fragile compared to controls and
tore easily. Moreover, between 1 and 5 days after adminis-
tration of 3-NBA there was considerable swelling of the
adipose tissue in the GI-tract of the animals.
The ceacum of animals sacrificed between 1 and 3 days
after treatment displayed many minor hemorrhages,
whereas the colon seemed shorter compared to that of ani-
mals sacrificed 6 hr, and 5 and 10 days after administration,
and the controls. The shortening was around 2 cm. Note,
however, that this shortening was not analyzed statistically.
Finally, the GI-tract from the treated animals had a sharp
odor compared to the healthy controls. The vehicle controls
showed no tissue damage or alterations of the kind
observed in the treated rats.
32P-HPLC Analysis of DNA Adducts
Increased levels of DNA adducts were detected in differ-
ent tissues at 6 hr to 10 days after 3-NBA exposure (Figs.
2A and 2B). At 6 hr, significantly higher levels of DNA
adducts were observed only for the glandular stomach (P <0.05; Fig. 2A). At 3 days after administration, most tissues,
except for the small intestine, displayed significantly ele-
vated levels of DNA adducts (P < 0.05), whereas at 10
days after treatment, all tissues contained significantly
higher levels of DNA adducts (P < 0.05). The tissues that
were increasing in DNA adduct level almost through the
entire time span were forestomach and glandular stomach,
ceacum (Fig. 2B), and lung and kidney (Fig. 2A).
When the DNA adduct levels in treated animals were
compared at 6 hr and 3 days after administration, significant
increases (P < 0.05) were observed for all tissues, except
glandular stomach and small intestine. All tissues had sig-
nificantly increased DNA adduct levels when comparing
levels at 10 days after administration with those at 6 hr.
However, comparing 3 day and 10 day levels, significant
increases were observed only for glandular stomach, small
intestine, colon, lung, and kidney (P < 0.05).
Observations of tissue toxicity, expressed as clinical
scores in Table I, increased and reached a maximum more
quickly then the DNA adduct levels (Fig. 3). The highest
tissue toxicity scores were seen at 1 day and 3 days,
whereas DNA adduct levels continued to rise and reached
the maximum level at 10 days.
Characterization of In Vivo DNA Adducts
The DNA adduct standards eluted in the linear gradient at
the retention times given in Table II. Typical chromato-
graphic separations are shown in Figure 4A (for treated rats)
and Figure 4B (for controls). Slight retention time shifts
between samples were corrected by the alignment of refer-
ence peaks and specific peak-patterns. When the individual
standards were pooled with in vivo samples, cochromato-
graphic alignments were observed for five of the synthesized
standards. In all the tissue samples for the treated animals,
peaks were found that eluted with standards dGp-C8-C2-N-
Ac-ABA (Std 1), dAp-N-Ac-ABA (Std 2), dGp-N2-C2-N-
Ac-ABA (Std 4), dGp-C8-N-ABA (Std 5), dGp-N2-C2-
ABA (Std 6), and dAp-N6-C2-ABA (Std 7). Additional
peaks that did not align with any of the standards were desig-
nated A, B, C, D, E, F and G. In all the tissues, the most
prominent DNA adducts, which made up about 60–90% of
the total DNA adduct level, aligned with standards dGp-C8-
N-ABA (Std 5) and dGp-N2-C2-ABA (Std 6) (Fig. 4A).
dG-C8-C2-N-Ac-ABA (Std 1) varied inconsistently
between samples and also cochromatographed with a peak
present at a similar retention time in the control tissues
(Fig. 4B).
The small cluster of peaks designated A, which has a
retention time very similar to standards dAp-N-Ac-ABA
(Std 2) and dGp-C8-C2-ABA (Std 3), also was found to
varying degrees in controls. dGp-N2-C2-N-Ac-ABA (Std
4) was observed in all the tissues, and peaks with similar
retention times were seen in controls as well, but in rela-
tively small amounts.
The peak designated B was mainly found in liver, and in
only a few cases in minute amounts in the small intestine,
Environmental and Molecular Mutagenesis. DOI 10.1002/em
Fig. 3. Total DNA adduct levels in the GI-tract and the relative clinical
score of necropsy observations for the same tissues. The y-axis to the
left represents the relative clinical score, which is a summary of the
inflammatory response, whereas the y-axis on the right depicts the sum
of DNA adduct levels per 108 NN.
TABLE II. Retention Times in Minutes for the SynthesizedDNA Adduct Standards, Std 1–8, Analyzed Withthe Linear Gradient
Standard Retention time (min)
1 51.8
2 53.0
3 54.0
4 54.8
5 56.6
6 57.0
7 59.8
8 62.4
546 Nagy et al.

Environmental and Molecular Mutagenesis. DOI 10.1002/em
Fig. 4. (A) Representative 32P-HPLC chromatograms of the tissues that
were analyzed. The peaks designated by numbers (1–7) are those that
cochromatographed with DNA adduct standards in tissues from treated
rats. DNA adducts designated by letters (A–G) are those that did not
cochromatograph with standards; the chromatogram designated \mix"
depicts the retention time of the pure standards. Representative chroma-
tograms of control animals are shown in B. The y-axis label, 32P-actvity,
refers to the instrument output.

Environmental and Molecular Mutagenesis. DOI 10.1002/em
Fig. 4. (Continued)
548 Nagy et al.

ceacum and colon (Fig. 4A). In the case of the two latter tis-
sues it most often appeared as a shoulder to peak 5. It did
not align with any of the standards used in this characteriza-
tion and no interfering peaks with similar retentions times
were seen in the controls (Fig. 4B). The same was true for
the peaks designated C and D (Fig. 4A).
The peaks designated E, F and G were somewhat spor-
adically observed in the controls at rather variable levels.
None of the standards used in this study cochromato-
graphed with these peaks, although peak E aligned in the
close vicinity of dGp-C8-N-N-Ac-ABA (Std 8).
DISCUSSION
Tissue Damage and 32P-HPLC Analysis of DNA Adducts
Rats were treated orally in this study, since it is known
that many substances that are inhaled are transported up
from the lungs to the throat and consequently swallowed,
which gives rise to an exposure route via the GI-tract as
well as the lung [Dolovich et al., 1987]. In a previous study,
rats were administered 3-NBA orally and different tissues
were examined for DNA adduct patterns 4 hr after the treat-
ment [Arlt et al., 2001]. The level of DNA adducts detected
with butanol enrichment was highest in the small intestine
followed by the forestomach and glandular stomach, kid-
ney, liver and lung. In this present study, however, the only
tissue that displayed significant amounts of DNA adducts 6
hr after oral administration was glandular stomach (Figs.
2A and 2B).
The metabolism of 3-NBA has been evaluated in several
systems and the main conclusion is that the first step for acti-
vation involves nitroreduction, followed by further steps cat-
alyzed by phase II conjugative enzymes, such as acetyltrans-
ferases (NAT1/2) and sulfotransferases (SULT1A1/1A2),
which create reactive esters capable of binding to DNA [Arlt
et al., 2003a; Arlt et al., 2003b; Arlt et al., 2005; Watanabe
et al., 2005]. The efficiency of these phase II enzymes to
activate 3-NBA was quite similar to what has been observed
with 2-NF and its metabolite 2-AF, as well as 1,8-DNP. In
the case of these later compounds, NAT1 efficiently acti-
vates 2-NF and 2-AF, whereas NAT2 is the major phase II
enzyme involved in activating 1,8-DNP [Oda et al., 1999],
suggesting similarities with the pathways involved in activat-
ing 3-NBA. A possible alternative activation pathway for 3-
NBA involves its reduction to 3-aminobenzanthrone (3-
ABA) and further metabolism and activation by CYP450
enzymes and peroxidases [Arlt et al., 2006a].
Glandular stomach had the highest levels of DNA
adducts 6 hr after oral dosing with 3-NBA. This observation
corroborates previous findings to the extent that metabolism
appeared to occur at the site of application, with the early
appearance of DNA adducts [Arlt et al., 2001]. Following
this initial observation point, DNA adduct levels generally
increased with time, except for a slight decrease around
Day 5 (Figs. 2A and 2B). This decrease in binding may be
related to the observations made during autopsy where the
most tissue damage was observed among animals up to
Day 3. The extensive tissue damage observed in the GI-
tract was unexpected, since nitro-PAHs are usually not
acutely toxic at the dose range used in this study [Simmon
et al., 1979; Marshall et al., 1982]. In contrast to the obser-
vations made up to Day 3, animals sacrificed after Day 5
had less tissue damage, as well as less oedema in the adi-
pose tissue around the GI-tract (Table I and Fig. 3). This
increase, followed by a sudden drop in both tissue damage
and DNA adduct levels, could both be due to initial acute
toxic effects from the 3-NBA treatment. Early after expo-
sure the cells begin to metabolize 3-NBA and the metabo-
lites start forming DNA adducts; the metabolites and
adducts also result in severe tissue damage and cell death.
As this acute phase passes, the tissues start to recover, cells
begin to divide, and a \dilution" of DNA adducts occurs,
which is observed as a decrease in adduct levels at Day 5.
The new cells continue to metabolize 3-NBA, and its
metabolites produce DNA adducts, which results in the
increase in DNA adducts between Days 5 and 10 (Figs. 2A
and 2B). Very little damage was observed in the GI-tract at
Day 10 (Table I and Fig. 3), which supports the hypothesis
of acute toxicity followed by recovery.
One also could speculate that excess 3-NBA that was not
metabolized in the acute phase was stored in the adipose
tissue, intercellular compartments, or the liver, and later
became bioavailable. Storage or retention of lipophilic sub-
stances, such as 2-AAF, in the liver has been shown to be
partly due to binding to cytosolic proteins, although most
storage occurs in the body fat [Eriksson et al., 1989]. Lipo-
philic substances in the liver cells are mainly in biological
membranes as well as in other lipophilic compartments
such as the Golgi apparatus [Eriksson and Andersson,
1992]. Studies also have shown that 3-NBA can be acti-
vated through reduction by NAD(P)H:quinone oxidoreduc-
tase and then further metabolized through conjugation by
acetyltransferases and sulfotransferases in human hepatic
cytosols [Arlt et al., 2005]. In addition, bacterial flora not
only have been implicated in the activation of xenobiotic
chemicals, but also in converting conjugated metabolites to
free compounds that can be reabsorbed [Grantham et al.,
1970; Moller et al., 1988; Moller et al., 1994]. In a study of
the kinetics of 2-AAF excretion, reabsorbed metabolites
exposed the body a second time due to enterohepatic circu-
lation [Rinaudo et al., 1989].
In our previous study of rats treated intratracheally with
3-NBA [Nagy et al., 2005b], the DNA adduct levels
reached a maximum between one to three days and then
decreased with time, whereas after oral treatment, the DNA
adduct level was increased to Day 10 (Figs. 2A and 2B).
This suggests that after intratracheal administration, 3-NBA
is quickly distributed through the body, reaching excretory
organs such as the kidney in high levels where further me-
Environmental and Molecular Mutagenesis. DOI 10.1002/em
DNADamage and Acute Toxicity Caused by 3-NBA 549

tabolism can take place. This could partly be due to a more
extensive metabolism in the GI-tract by the intestinal
microflora. The lowest levels of DNA adducts in the three
organs examined (liver, lung, and kidney), was found in the
liver in both the previous [Nagy et al., 2005b] and the pres-
ent study, given enough time. This could be due to a differ-
ent or more rapid metabolism, detoxification by conjuga-
tion, and/or excretion in the liver compared to the other
organs.
Finally, the shortening of the colon, observed in the ani-
mals sacrificed 1 and 3 days after 3-NBA treatment, was
most likely due to acute toxicity and an inflammatory
response in the tissue. This conclusion is supported by stud-
ies in which mice developing ulcerative colitis showed a
significant reduction of the length of the colon due to the
inflammation [Arai et al., 1998; Axelsson et al., 1998].
Characterization of In Vivo DNA Adducts
We estimated the recovery of the DNA adduct standards
based on both butanol extraction and labeling efficiency.
An explanation for the observed variation in the recovery
of the adduct standards, is that the conformation of the
DNA adduct, in particular the adducted moiety, influences
labeling efficiency. Our recovery results were very repro-
ducible (small standard deviations), indicating that both bu-
tanol extraction and labeling efficiency had little effect on
the variation in DNA adduct levels. Hence animal-to-ani-
mal variation most likely accounts for most of the variabil-
ity in DNA adduct levels in Figure 2A.
A previous study, using 32P-TLC adduct analysis,
detected four major DNA adducts following oral dosing of
rats with 3-NBA, and two of these adducts were the pre-
dominant adducts in all tissues examined [Arlt et al., 2001].
These observations are consistent with our findings. As
depicted in Figure 4A, there are two prominent peaks at 56
and 57 min that are present in all the tissues that we exam-
ined. Using 32P-HPLC with a plateau gradient, we previ-
ously have shown that the main in vivo DNA adducts in
different tissues of rats administered 3-NBA intratracheally
correspond to dGp-C8-N-ABA (Std 5) and dGp-N2-C2-
ABA (Std 6) [Nagy et al., 2005b]. These observations are
consistent with other studies showing that 3-NBA gives rise
to the same DNA adducts in different organs regardless of
the route of exposure, although the levels of DNA adducts
differ [Arlt et al., 2001; Arlt et al., 2006b]. These observa-
tions indicate that there is a common activation pathway
that can be found in both lung and the GI-tract of rats.
As previously reported [Nagy et al., 2005b], the main
DNA adducts formed by 3-NBA in the tissues of rats all are
of the nonacetylated type. Variants of acetylated DNA
adducts (both dG and dA) derived from 3-NBA have been
synthesized and cochromatographed with DNA samples
from exposed rats [Osborne et al., 2005]. The presence of
these nonacetylated amine-DNA adducts indicates that the
activation of 3-NBA proceeds initially through reduction of
the nitro group to the hydroxylamine, rather than through
the oxidation of the amine group. This is because acetylated
amine-DNA adducts usually are formed through acetylation
of the amine rather than the hydroxylamine [Ritter et al.,
2000]. None of the acetylated DNA adducts aligned with
those found in vivo, and neither did the deacetylated dGp-
C8-C2-ABA (Std 3). These findings generally are consist-
ent with our previous study in which we showed that dGp-
C8-C2-ABA was outside the retention time window of the
major DNA adducts and that peak alignment for the pre-
dominant in vivo adducts indicated that they cochromato-
graphed with the two nonacetylated DNA adducts, dGp-
C8-N-ABA (Std 5) and dGp-N2-C2-ABA (Std 6) [Nagy
et al., 2005b].
In this present study, we cannot exclude the presence of
a DNA adduct aligning with dGp-C8-C2-ABA (Std 3),
since this standard migrates with a small cluster of peaks
designated A (Fig. 4). It could be the case that this DNA
adduct is present in minute amounts, and hidden in the
background of endogenous DNA adducts. The same could
be true for the standard with the unusual five-membered
imidazo ring structure, dAp-N-Ac-ABA (Std 2), which has
a retention time range within cluster A. However, a previ-
ous study concluded that this adduct was not present in
DNA from 3-NBA-exposed rats [Osborne et al., 2005].
dG-C8-C2-N-Ac-ABA (Std 1) is particularly prominent
in small intestine and colon (Fig. 4A), but since this DNA
adduct is also present in the control tissues (Fig. 4B), it is
impossible to say whether its detection in treated rats is a
consequence of 3-NBA exposure or a coincidence of peak-
alignment. It could be the case, as mentioned above, that
this DNA adduct is actually formed, but is obscured by an
endogenous peak that it aligns with. Hence one chromato-
graphic method may not be sufficient to prove the presence
of a given standard and further chromatographic separation
may be needed [Osborne et al., 2005].
The only dA adduct found in 3-NBA-treated rats cochro-
matographed with dAp-N6-C2-ABA (Std 7). It was clearly
present in treated animals and not in controls. Its presence
is supported by an oral exposure study, in which about 40%
of the total amount of 3-NBA-derived DNA adducts origi-
nated from reaction with dA [Arlt et al., 2001]. Because this
structure alone does not account for 40% of the total
amount of DNA adducts that we detected, it is likely that
there are several dA adduct structures not yet identified.
3-ABA and 3-acetylaminobenzanthrone (3-AABA) were
identified as 3-NBA metabolites in mammalian cells [Bor-
lak et al., 2000] and both are genotoxic in a number of in
vitro (Salmonella reversion assay) and in vivo (mouse)
assays [Watanabe et al., 2005]. The results from both the
Salmonella assay and the mouse model support observa-
tions that nitroreduction of 3-NBA, oxidation of the
reduced metabolites by cytochrome P450 enzymes, and O-acetylation are involved in multiple activation pathways
Environmental and Molecular Mutagenesis. DOI 10.1002/em
550 Nagy et al.
that potentially can lead to DNA damage [Arlt et al.,
2003a; Watanabe et al., 2005]. Also, DNA damage was
induced by intraperitoneal injection of 3-NBA, 3-ABA, and
3-AABA in mice, indicating that some of the DNA damage
in the present study could have occurred by the activation
of amine metabolites. Thus, even though we did not detect
the presence of acetylated DNA adducts, they still could be
present at low levels, or hidden by interfering peaks of en-
dogenous adducts. Further studies of acetylated 3-NBA
adducts and the mechanisms behind their formation should
be conducted.
In summary, we detected three prominent DNA adducts
after oral administration of 3-NBA in rats. These adducts
had chromatographic properties consistent with standards
dGp-C8-N-ABA (Std 5), dGp-N2-C2-ABA (Std 6), and
dAp-N6-C2-ABA (Std 7), which are of the nonacetylated
type. We were not able to definitively identify 3-NBA
adducts eluting with DNA adduct standards dGp-C8-C2-N-
Ac-ABA (Std 1), dAp-N-Ac-ABA (Std 2), dGp-C8-C2-
ABA (Std 3), or dGp-N2-C2-N-Ac-ABA (Std 4) because of
their chromatographic alignment with peaks also present in
controls.
The levels of DNA adducts after a single oral dose of 3-
NBA increased with time up to Day 3, decreased at Day 5,
and then increased again at Day 10. This trend corre-
sponded to the severity of tissue damage observed during
autopsy. The acute toxic effects of 3-NBA on the GI-tract
were seen mainly over the first five days after exposure as
hemorrhages, swelling of the adipose tissue, loss of the vil-
lous surface structure of the small intestine, and shortening
of the colon. The tissue damage seemed to regress between
Days 5 and 10. We hypothesize that tissue damage and the
resulting regenerative cell synthesis decreased adduct levels
at Day 5, while tissue stores of 3-NBA coupled with
reduced cellular toxicity were responsible for the increased
adduct levels at Day 10. The combination of extensive
DNA-adduct formation (initiation) and an inflammatory
response (promotion) may be involved in the potent tumor
forming capacity of 3-NBA.
ACKNOWLEDGMENTS
The authors of this paper would like to express their grati-
tude to Prof. Lennart C. Eriksson for his help in interpreting
histopathological features and Mary-Ann Zetterqvist for her
skilful technical assistance. The authors of this paper are
partners of the EU Network of Excellence ECNIS (Environ-
mental Cancer, Nutrition and Individual Susceptibility).
REFERENCES
Arai Y, Takanashi H, Kitagawa H, Okayasu I. 1998. Involvement of
interleukin-1 in the development of ulcerative colitis induced by
dextran sulfate sodium in mice. Cytokine 10:890–896.
Arey J, Zielinska B, Harger WP, Atkinson R, Winer AM. 1988. The
contribution of nitrofluoranthenes and nitropyrenes to the muta-
genic activity of ambient particulate organic matter collected in
southern California. Mutat Res 207:45–51.
Arlt VM, Bieler CA, Mier W, Wiessler M, Schmeiser HH. 2001. DNA
adduct formation by the ubiquitous environmental contaminant 3-
nitrobenzanthrone in rats determined by (32)P-postlabeling. Int J
Cancer 93:450–454.
Arlt VM, Glatt H, Muckel E, Pabel U, Sorg BL, Seidel A, Frank H,
Schmeiser HH, Phillips DH. 2003a. Activation of 3-nitrobenzan-
throne and its metabolites by human acetyltransferases, sulfo-
transferases and cytochrome P450 expressed in Chinese hamster
V79 cells. Int J Cancer 105:583–592.
Arlt VM, Sorg BL, Osborne M, Hewer A, Seidel A, Schmeiser HH,
Phillips DH. 2003b. DNA adduct formation by the ubiquitous
environmental pollutant 3-nitrobenzanthrone and its metabolites
in rats. Biochem Biophys Res Commun 300:107–114.
Arlt VM, Zhan L, Schmeiser HH, Honma M, Hayashi M, Phillips DH,
Suzuki T. 2004. DNA adducts and mutagenic specificity of the
ubiquitous environmental pollutant 3-nitrobenzanthrone in Muta
Mouse. Environ Mol Mutagen 43:186–195.
Arlt VM, Stiborova M, Henderson CJ, Osborne MR, Bieler CA, Frei E,
Martinek V, Sopko B, Wolf CR, Schmeiser HH, Phillips DH.
2005. Environmental pollutant and potent mutagen 3-nitrobenzan-
throne forms DNA adducts after reduction by NAD(P)H:Quinone
oxidoreductase and conjugation by acetyltransferases and sulfo-
transferases in human hepatic cytosols. Cancer Res 65:2644–
2652.
Arlt VM, Henderson CJ, Wolf CR, Schmeiser HH, Phillips DH, Sti-
borova M. 2006a. Bioactivation of 3-aminobenzanthrone, a
human metabolite of the environmental pollutant 3-nitrobenzan-
throne: Evidence for DNA adduct formation mediated by cyto-
chrome P450 enzymes and peroxidases. Cancer Lett 234:220–
231.
Arlt VM, Schmeiser HH, Osborne MR, Kawanishi M, Kanno T, Yagi T,
Phillips DH, Takamura-Enya T. 2006b. Identification of three
major DNA adducts formed by the carcinogenic air pollutant 3-
nitrobenzanthrone in rat lung at the C8 and N(2) position of gua-
nine and at the N(6) position of adenine. Int J Cancer 118:2139–
2146.
Axelsson LG, Landstrom E, Bylund-Fellenius AC. 1998. Experimental
colitis induced by dextran sulphate sodium in mice: Beneficial
effects of sulphasalazine and olsalazine. Aliment Pharmacol Ther
12:925–934.
Borlak J, Hansen T, Yuan Z, Sikka HC, Kumar S, Schmidbauer S, Frank
H, Jakob J, Seidel A. 2000. Metabolism and DNA-binding of 3-
nitrobenzanthrone in primary rat alveolar type II cells, in human
fetal bronchial, rat epithelial and mesenchymal cell lines. Polycy-
clic Aromat Compds 21:73–86.
Cui XS, Torndal UB, Eriksson LC, Moller L. 1995. Early formation of
DNA adducts compared with tumor formation in a long-term tu-
mor study in rats after administration of 2-nitrofluorene. Carcino-
genesis 16:2135–2141.
Dolovich MB, Jordana M, Newhouse MT. 1987. Methodologic consider-
ations in mucociliary clearance and lung epithelial absorption
measurements. Eur J Nucl Med 13:S45–S52.
Enya T, Suzuki H, Watanabe T, Hirayama T, Hisamatsu Y. 1997. 3-
Nitrobenzanthrone, a powerful bacterial mutagen and suspected
human carcinogen found in diesel exhaust and airborne particu-
lates. Environ Sci Technol 30:2772–2776.
Enya T, Kawanishi M, Suzuki H, Matsui S, Hisamatsu Y. 1998. An un-
usual DNA adduct derived from the powerfully mutagenic envi-
ronmental contaminant 3-nitrobenzanthrone. Chem Res Toxicol
11:1460–1467.
Eriksson LC, Andersson GN. 1992. Membrane biochemistry and chemi-
cal hepatocarcinogenesis. Crit Rev Biochem Mol Biol 27:1–55.
Environmental and Molecular Mutagenesis. DOI 10.1002/em
DNADamage and Acute Toxicity Caused by 3-NBA 551

Eriksson LC, Rinaudo JA, Farber E. 1989. Kinetics of interaction of 2-
acetylaminofluorene with normal liver and carcinogen-induced
hepatocyte nodules in vivo and. in vitro. Lab Invest 60:409–417.
Feilberg A, Ohura T, Nielsen T, West Bach Poulsen M, Amagai T.
2002. Occurrence and photostability of 3-nitrobenzanthrone asso-
ciated with atmospheric particles. Atmos Environ 36:3591–3600.
Grantham PH, Horton RE, Weisburger EK, Weisburger JH. 1970. Me-
tabolism of the carcinogen N-2-fluorenylacetamide in germ-free
and conventional rats. Biochem Pharmacol 19:163–171.
Grynkiewicz M, Polkowska Z, Gorecki T, Namiesnik J. 2001. Pesticides
in precipitation in the Gdansk region (Poland). Chemosphere
43:303–312.
Hayakawa K, Nakamura A, Terai N, Kizu R, Ando K. 1997. Nitroarene
concentrations and direct-acting mutagenicity of diesel exhaust
particulates fractionated by silica-gel column chromatography.
Chem Pharm Bull (Tokyo) 45:1820–1822.
Kawanishi M, Enya T, Suzuki H, Takebe H, Matsui S, Yagi T. 1998.
Mutagenic specificity of a derivative of 3-nitrobenzanthrone in
the supF shuttle vector plasmids. Chem Res Toxicol 11:1468–
1473.
Kiss G, Varga-Puchony Z, Tolnai B, Varga B, Gelencser A, Krivacsy Z,
Hlavay J. 2001. The seasonal changes in the concentration of poly-
cyclic aromatic hydrocarbons in precipitation and aerosol near
Lake Balaton, Hungary. Environ Pollut 114:55–61.
Lamy E, Kassie F, Gminski R, Schmeiser HH, Mersch-Sundermann V.
2004. 3-Nitrobenzanthrone (3-NBA) induced micronucleus forma-
tion and DNA damage in human hepatoma (HepG2) cells. Toxi-
col Lett 146:103–109.
Marshall TC, Royer RE, Li AP, Kusewitt DF, Brooks AL. 1982. Acute
and genetic toxicity of 1-nitropyrene and its fate after single oral
doses to rats. J Toxicol Environ Health 10:373–384.
Moller L, Corrie M, Midtvedt T, Rafter J, Gustafsson JA. 1988. The role
of the intestinal microflora in the formation of mutagenic metabo-
lites from the carcinogenic air pollutant 2-nitrofluorene. Carcino-
genesis 9:823–830.
Moller L, Zeisig M, Midtvedt T, Gustafsson JA. 1994. Intestinal micro-
flora enhances formation of DNA adducts following administra-
tion of 2-NF and 2-AAF. Carcinogenesis 15:857–861.
Murahashi T, Watanabe T, Otake S, Hattori Y, Takamura T, Wakabayashi
K, Hirayama T. 2003. Determination of 3-nitrobenzanthrone in sur-
face soil by normal-phase high-performance liquid chromatography
with fluorescence detection. J Chromatogr A 992:101–107.
Nagy E, Johansson C, Zeisig M, Moller L. 2005a. Oxidative stress and
DNA damage caused by the urban air pollutant 3-NBA and its
isomer 2-NBA in human lung cells analyzed with three independ-
ent methods. J Chromatogr B 827:94–103.
Nagy E, Zeisig M, Kawamura K, Hisamatsu Y, Sugeta A, Adachi S,
Moller L. 2005b. DNA-adduct and tumor formations in rats after
intratracheal administration of the urban air pollutant 3-nitroben-
zanthrone. Carcinogenesis 26:1821–1828.
Oda Y, Yamazaki H, Shimada T. 1999. Role of human N-acetyltransfer-ases, NAT1 or NAT2, in genotoxicity of nitroarenes and aromatic
amines in Salmonella typhimurium NM6001 and NM6002. Carci-
nogenesis 20:1079–1083.
Osborne MR, Arlt VM, Kliem C, Hull WE, Mirza A, Bieler CA, Schme-
iser HH, Phillips DH. 2005. Synthesis, characetrization, and 32P-
postlabeling analysis of DNA adducts derived from the environ-
mental contaminant 3-nitrobenzanthrone. Chem Res Toxicol 18:
1056–1070.
Phousongphouang PT, Arey J. 2003. Sources of the atmospheric contam-
inants, 2-nitrobenzanthrone and 3-nitrobenzanthrone. Atmos Envi-
ron 37:3189–3199.
Rinaudo JA, Eriksson LC, Roomi MW, Farber E. 1989. Kinetics of
excretion of 2-acetylaminofluorene in normal and xenobiotic-
treated rats and in rats with hepatocyte nodules. Lab Invest 60:
399–408.
Ritter CL, Decker RW, Malejka-Giganti D. 2000. Reductions of nitro
and 9-Oxo groups of environmental nitrofluorenes by the rat
mammary gland in vitro. Chem Res Toxicol 13:793–800.
Salmeen IT, Pero AM, Zator R, Schuetzle D, Riley TL. 1984. Ames
assay chromatograms and the identification of mutagens in diesel
particle extracts. Environ Sci Technol 18:375–382.
Shelton ML, DeMarini DM. 1995. Mutagenicity and mutation spectra of
2-acetylaminofluorene at frameshift and base-substitution alleles
in four DNA repair backgrounds of Salmonella. Mutat Res
327:75–86.
Shibutani S, Grollman AP. 1997. Molecular mechanisms of mutagenesis
by aromatic amines and amides. Mutat Res 376:71–78.
Simmon VF, Rosenkranz HS, Zeiger E, Poirier LA. 1979. Mutagenic
activity of chemical carcinogens and related compounds in the
intraperitoneal host-mediated assay. J Natl Cancer Inst 62:911–
918.
Takamura T, Kawanishi M, Nakagawa Y, Watanabe T, Hirayama T,
Wakabayashi K, Hisamatsu Y, Yagi T. Synthesis and characteri-
zation of DNA adducts from mutagenic 3-nitrobenzanthrone pres-
ent in atmospheric environment. In 34th Annual Meeting of Euro-
pean Environmental Mutagenesis Society, Maastricht, The Neth-
erlands, 2004.
Watanabe T, Tomiyama T, Nishijima S, Kanda Y, Murahashi T, Hirayama
T. 2005. Evaluation of genotoxicity of 3-amino-, 3-acetylamino- and
3-nitrobenzanthrone using the Ames/Salmonella assay and the comet
assay. J Health Sci 51:569–575.
Weisenberger BL. 1984. Health effects of diesel emissions–An update.
J Soc Occup Med 34:90–92.
Yamazaki H, Hatanaka N, Kizu R, Hayakawa K, Shimada N, Guenger-
ich FP, Nakajima M, Yokoi T. 2000. Bioactivation of diesel
exhaust particle extracts and their major nitrated polycyclic aro-
matic hydrocarbon components, 1-nitropyrene and dinitropyrenes,
by human cytochromes P450 1A1, 1A2, and 1B1. Mutat Res 472:
129–138.
Environmental and Molecular Mutagenesis. DOI 10.1002/em
552 Nagy et al.


![Welcome! [hesiglobal.org]hesiglobal.org/wp-content/uploads/sites/11/2016/06/HESI_ECETOC.pdf · •Biological significance of DNA adducts. ... ¾48 h embryo toxicity assay using Zebrafish,](https://static.fdocuments.in/doc/165x107/5a9d0b617f8b9a8a6a8b6809/welcome-biological-significance-of-dna-adducts-48-h-embryo-toxicity.jpg)