DNA Barcode Data Analysis: Boosting Assignment Accuracy by Combining Distance- and Character-Based...
29
DNA Barcode Data Analysis: Boosting Assignment Accuracy by Combining Distance- and Character- Based Classifiers Bogdan Paşaniuc, Sotirios Kentros and Ion Mândoiu Computer Science & Engineering Department, University of Connecticu
-
date post
20-Dec-2015 -
Category
Documents
-
view
222 -
download
1
Transcript of DNA Barcode Data Analysis: Boosting Assignment Accuracy by Combining Distance- and Character-Based...

DNA Barcode Data Analysis:Boosting Assignment Accuracy by
Combining Distance- and Character-Based Classifiers
Bogdan Paşaniuc, Sotirios Kentros and Ion Mândoiu
Computer Science & Engineering Department, University of Connecticut

2
Outline
Motivation & Problem Definition Methods used
Hamming Distance (MIN-HD and AVG-HD) Aminoacid Similarity (MAX-AA-SIM and AVG-AA-SIM) Convex-score similarity (MAX-CS-SIM) Trinucleotide frequency (MIN-3FREQ) Positional weight matrix (MAX-PWM) Character-based pairwise species discrimination (k-
BEST) Combining the Methods Results
Species Classification New Species Recognition
Future Work & Conclusions
3
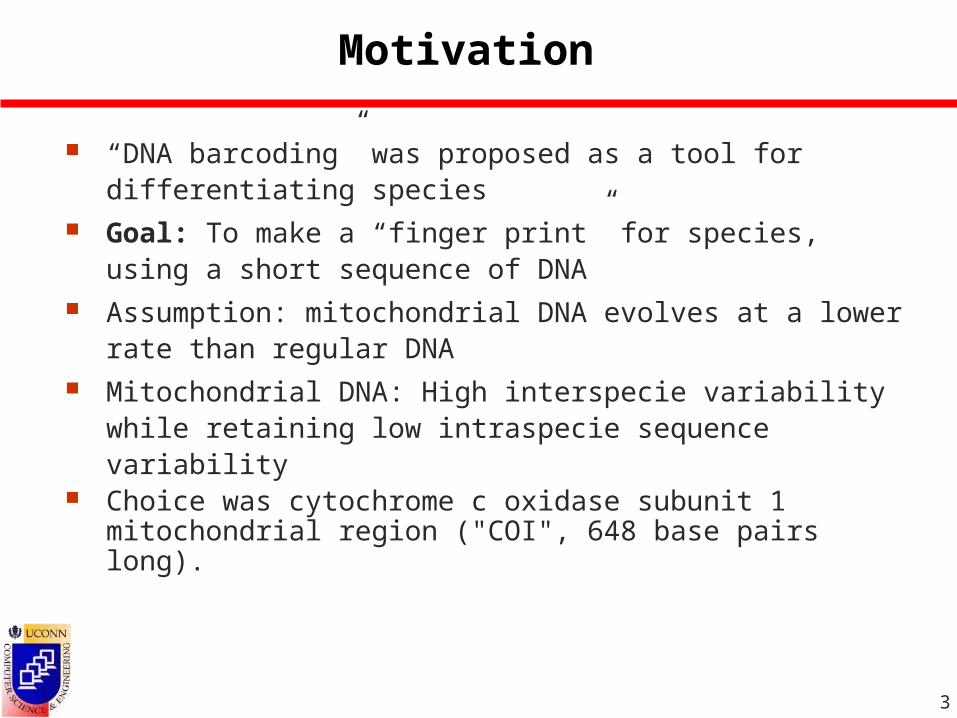
Motivation
“DNA barcoding” was proposed as a tool for differentiating species
Goal: To make a “finger print” for species, using a short sequence of DNA
Assumption: mitochondrial DNA evolves at a lower rate than regular DNA
Mitochondrial DNA: High interspecie variability while retaining low intraspecie sequence variability
Choice was cytochrome c oxidase subunit 1 mitochondrial region ("COI", 648 base pairs long).

4
Problem definition
The scope of our project was to explore if by combining simple classification methods one can increase the classification accuracy.
We address two problems: Classification of barcodes given a training
set of species. Identification of barcodes that belong in
new species. Assumption: All the barcode DNA sequences
are aligned

5
Problem definition(1)
Species Differentiation:
INPUT: a set S of barcodes for which the species is known and x a new barcode
OUTPUT: the species of x, given that there are barcodes S that have the same species as x
6
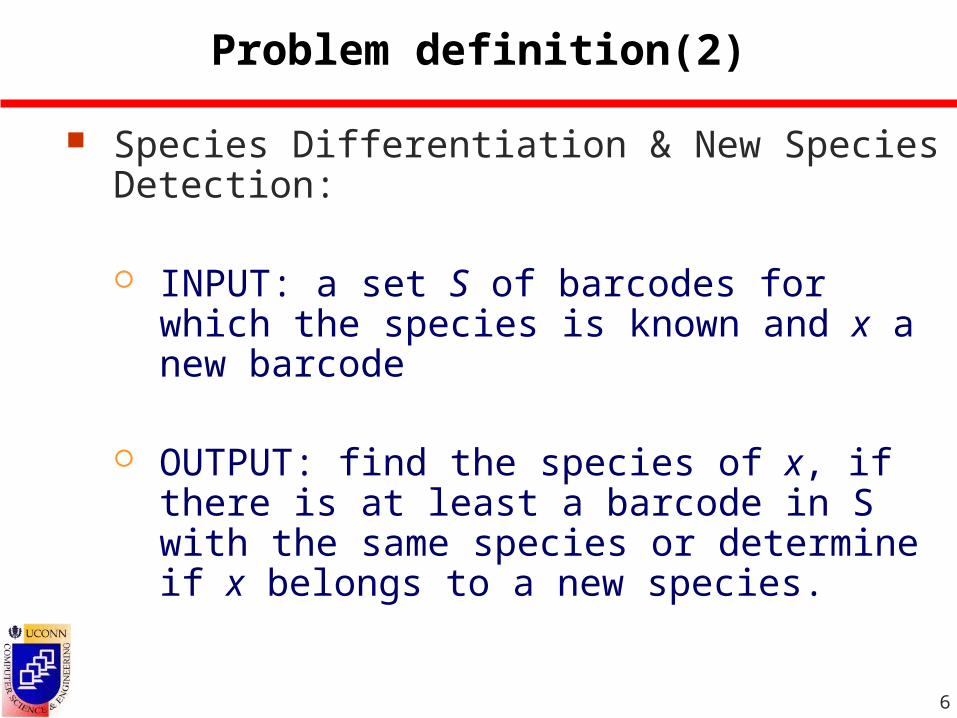
Problem definition(2)
Species Differentiation & New Species Detection:
INPUT: a set S of barcodes for which the species is known and x a new barcode
OUTPUT: find the species of x, if there is at least a barcode in S with the same species or determine if x belongs to a new species.
7
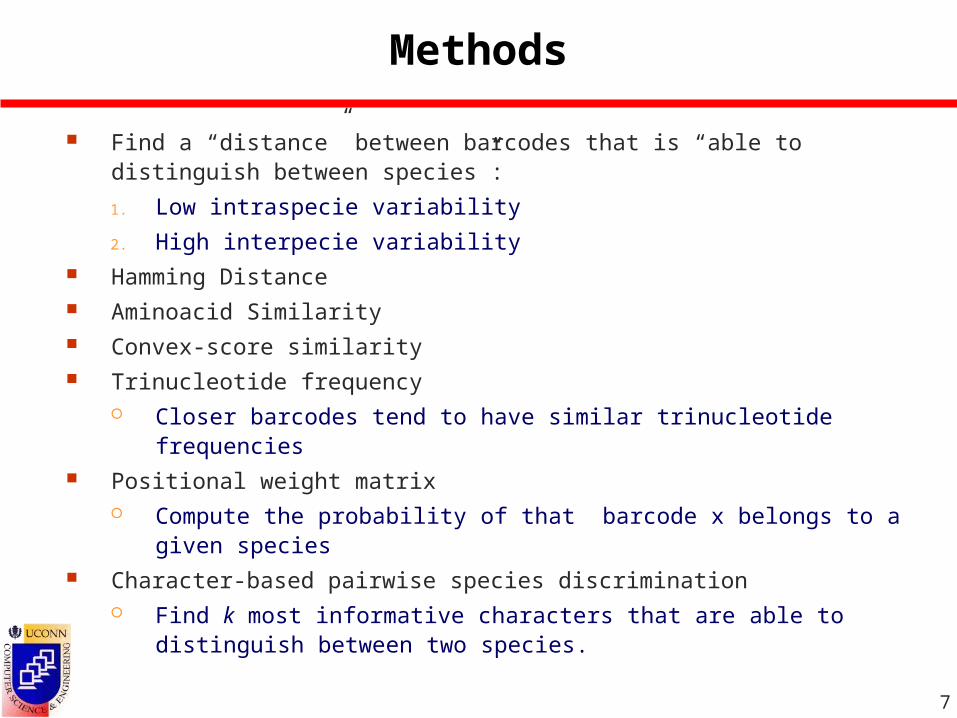
Methods
Find a “distance” between barcodes that is “able to distinguish between species”:
1. Low intraspecie variability
2. High interpecie variability Hamming Distance Aminoacid Similarity Convex-score similarity Trinucleotide frequency
Closer barcodes tend to have similar trinucleotide frequencies Positional weight matrix
Compute the probability of that barcode x belongs to a given species
Character-based pairwise species discrimination Find k most informative characters that are able to distinguish
between two species.
8
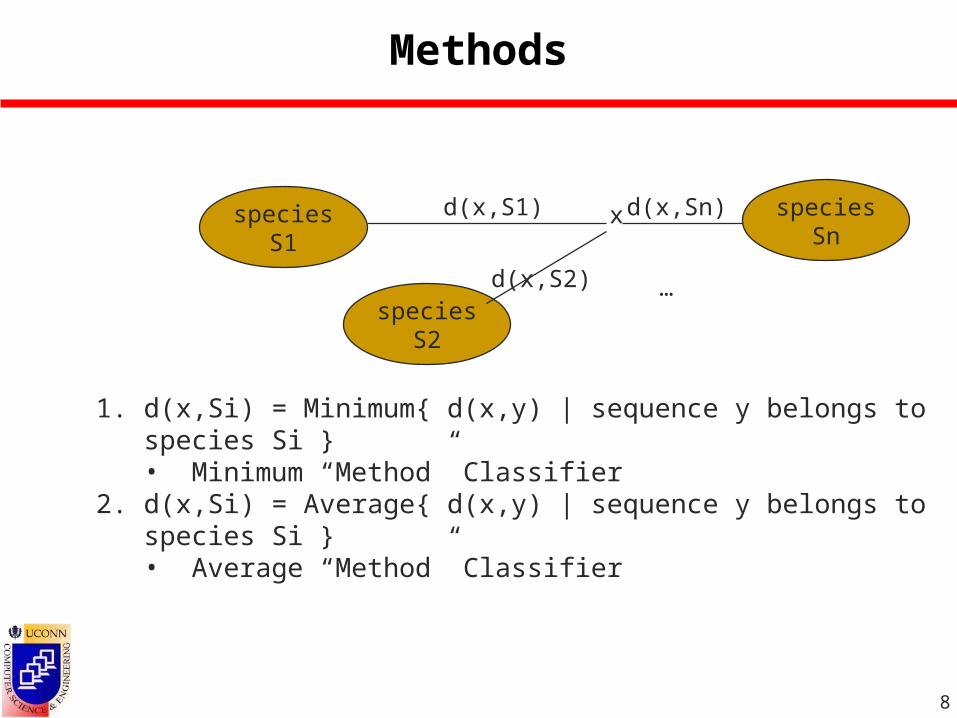
Methods
species S1xd(x,S1)
species S2
d(x,S2) …
species Snd(x,Sn)
1. d(x,Si) = Minimum{ d(x,y) | sequence y belongs to species Si }• Minimum “Method” Classifier
2. d(x,Si) = Average{ d(x,y) | sequence y belongs to species Si }• Average “Method” Classifier
9
Hamming Distance
Percent of basepair divergences Average:
Given barcode x find species S such that the minimum hamming distances on the average from x to y (y in S) is minimized
species(x)= S. Minimum:
Given barcode x find barcode y that minimizes the hamming distance from x to y
species(x) = species(y)
10
Aminoacid Similarity
Genetic code:
rules that map DNA sequences to proteins Codon: tri-nucleotide unit that encodes for one
aminoacid Divide DNA seq. into codons and substitute
each one by its corresp. aminoacid Blosum62 (BLOck SUbstitution Matrix)
20x20 matrix that gives score for each two aminoacids based on aminoacid properties
The higher the score the more likely no functional change in the protein

11
Aminoacid Similarity
Measures How similar the two aminoacid
sequences encoded by the barcodes are
Distance(x,y) barcodes x, y -> Aminoacid sequences x’ , y’
(using genetic code) Score of the aminoacid alignment using the
Blosum62 Average:
Find the species with maximum average similarity
Minimum: Find the barcode with max. similarity
12
Convex-score Similarity
“Long runs of consecutive basepair matches” indicate that the encoded aminoacid sequence plays an important role -> the two barcodes are “close” on the evolutionary distance
The longer the run of basepair matches, the higher the score
The contribution of a run is convexly increasing with its length
The new sequence is assigned to the species containing the highest scoring sequence

13
Trinucleotide Distance
For each species compute the vector of trinucleotide frequencies
For the new sequence x we compute the vector of trinucleotide frequencies
Find the closest species. To measure the distance between 2
vectors of frequencies we use Minimum Mean Square distance

14
Positional weight matrix
For each species we compute a positional weight matrix
For each locus the PWM gives the probability of seeing each nucleotide appear at that locus in that species
We assume independence of loci
For a barcode x we can compute the probability that x belongs to species S as the product of the probabilities of observing at every locus the respective nucleotide in x
Assign x to the specie that gives the highest probability
15
Character-based pairwise species discrimination
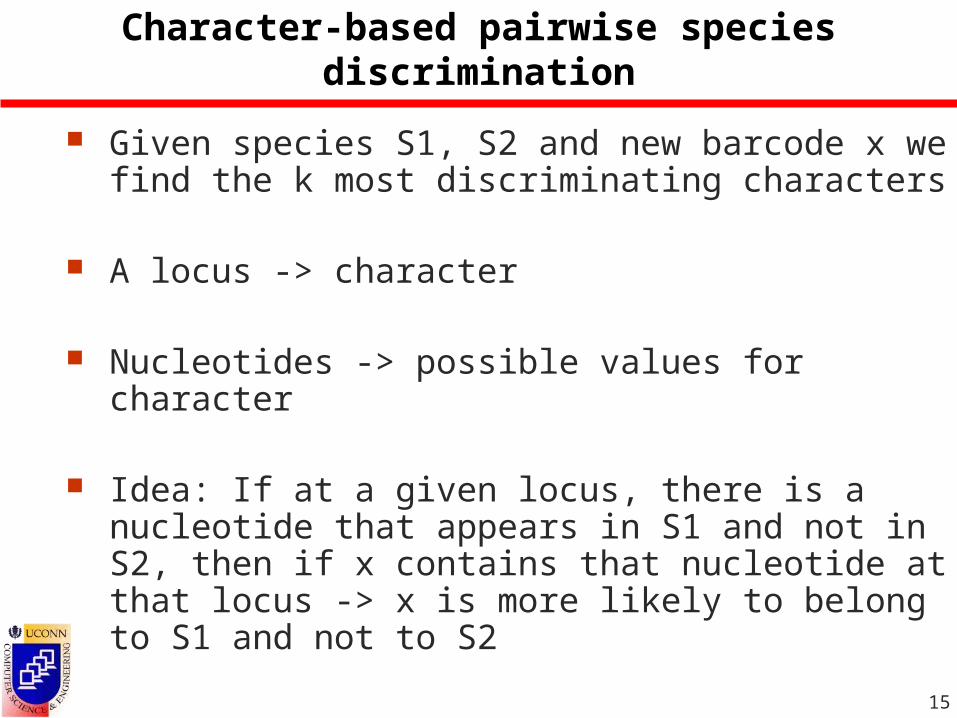
Given species S1, S2 and new barcode x we find the k most discriminating characters
A locus -> character
Nucleotides -> possible values for character
Idea: If at a given locus, there is a nucleotide that appears in S1 and not in S2, then if x contains that nucleotide at that locus -> x is more likely to belong to S1 and not to S2
16
Character-based pairwise species discrimination
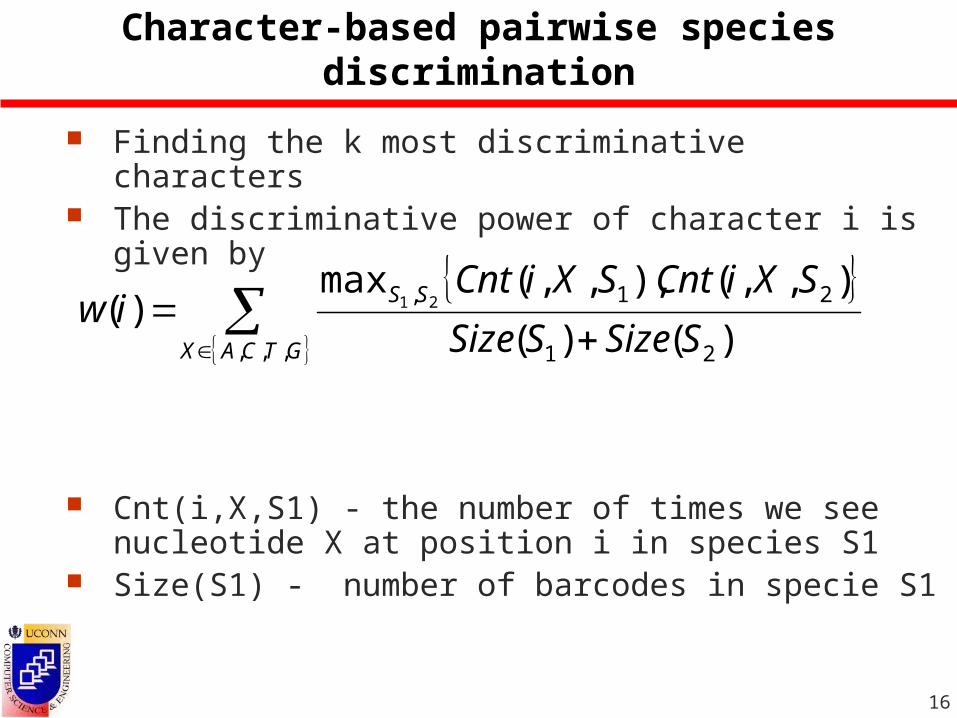
Finding the k most discriminative characters The discriminative power of character i is given by
Cnt(i,X,S1) - the number of times we see nucleotide X at position i in species S1
Size(S1) - number of barcodes in specie S1
GTCAX
SS
SSizeSSize
SXiCntSXiCntiw
,,, 21
21,
)()(
),,(),,,(max)( 21
17
Character-based pairwise species discrimination
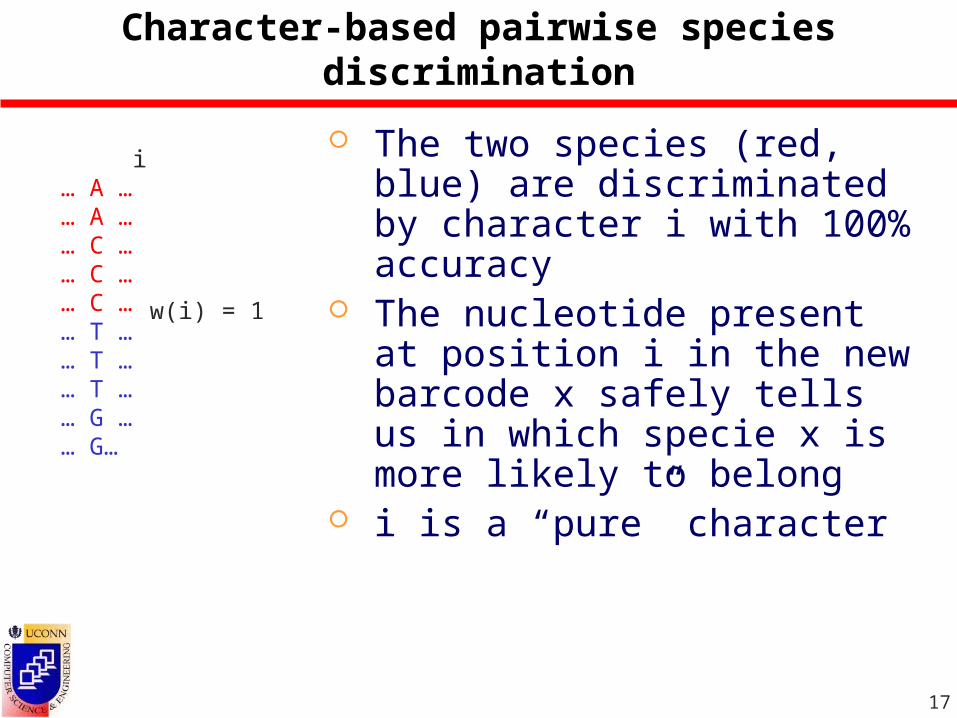
i… A …… A …… C …… C …… C …… T …… T …… T …… G …… G…
w(i) = 1
The two species (red, blue) are discriminated by character i with 100% accuracy
The nucleotide present at position i in the new barcode x safely tells us in which specie x is more likely to belong
i is a “pure” character
18
Character-based pairwise species discrimination
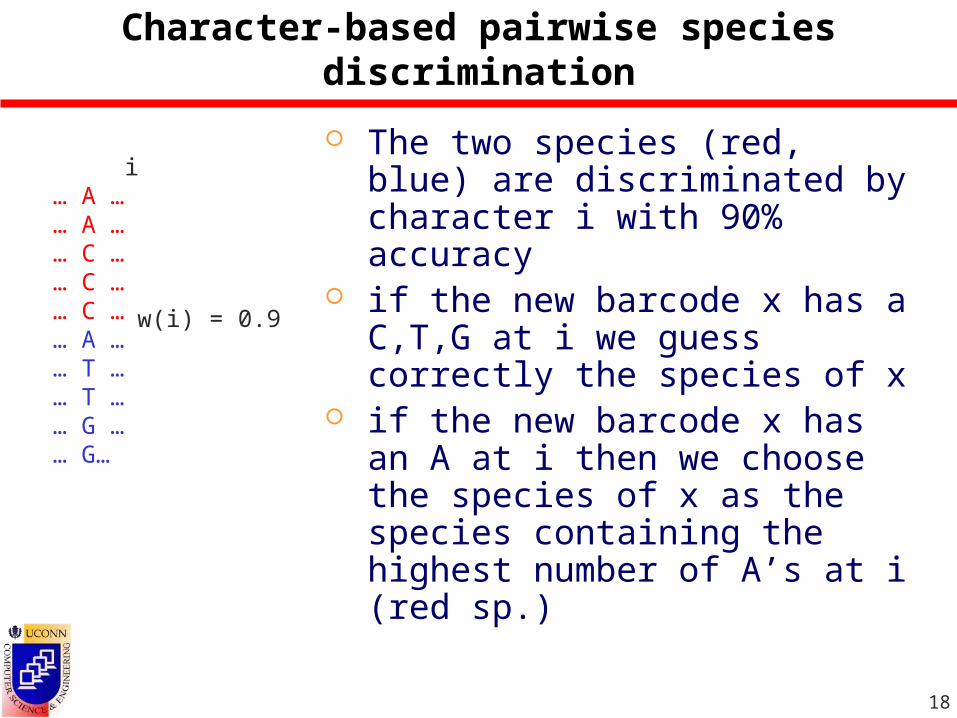
i… A …… A …… C …… C …… C …… A …… T …… T …… G …… G…
w(i) = 0.9
The two species (red, blue) are discriminated by character i with 90% accuracy
if the new barcode x has a C,T,G at i we guess correctly the species of x
if the new barcode x has an A at i then we choose the species of x as the species containing the highest number of A’s at i (red sp.)
19
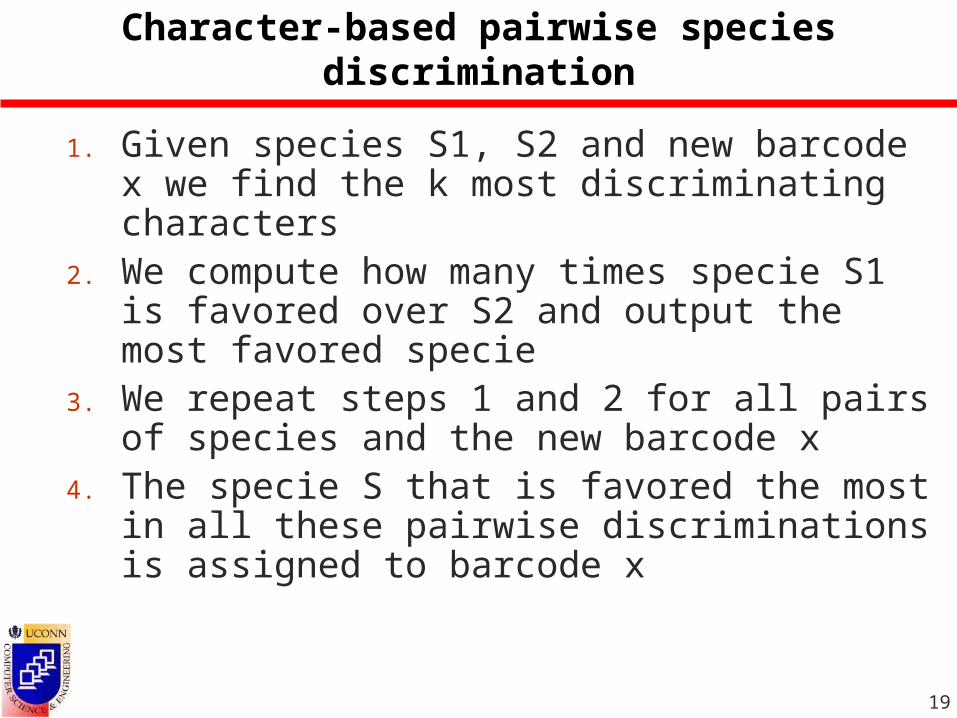
Character-based pairwise species discrimination
1. Given species S1, S2 and new barcode x we find the k most discriminating characters
2. We compute how many times specie S1 is favored over S2 and output the most favored specie
3. We repeat steps 1 and 2 for all pairs of species and the new barcode x
4. The specie S that is favored the most in all these pairwise discriminations is assigned to barcode x

20
Combining the Methods
Every classifier outputs the specie the new barcode is most likely to belong
Simple Voting: Every classifier’s returned species has
a weight of 1 Output the species with the most
votes

21
Datasets(1)
We used the dataset provided at http://dimacs.rutgers.edu/workshops/BarcodeResearchchallanges consisting of 1623 aligned sequences classified into 150 species with each sequence consisting of 590 nucleotides on the average.
We randomly deleted from each species 10 to 50 percent of the sequences Deleted seq -> test Remaining seq -> train
We made sure that in every species has a least one sequence

22
Species Recovering Accuracy(in %)(no new species - DAWG train dataset)
ClassifierPercentage of barcodes removed from each species and used
for testing10% 20% 30% 40% 50%
MIN-HD 98.8 98.0 97.8 97.2 96.0
AVG-HD 97.2 97.2 96.6 96.2 95.6
MAX-AA-SIM 99.0 99.0 99.2 98.4 96.8
AVG-AA-SIM 94.6 94.2 94.8 94.2 93.0
MAX-CS-SIM 98.2 98.2 98.6 97.6 97.4
MIN-3FREQ 94.6 93.8 94.2 92.0 92.4
MAX-PWM 98.0 98.6 97.8 95.4 94.6
10-BEST 98.6 97.0 97.6 96.2 96.2
COMBINED 99.4 99.4 99.6 98.6 98.0
23
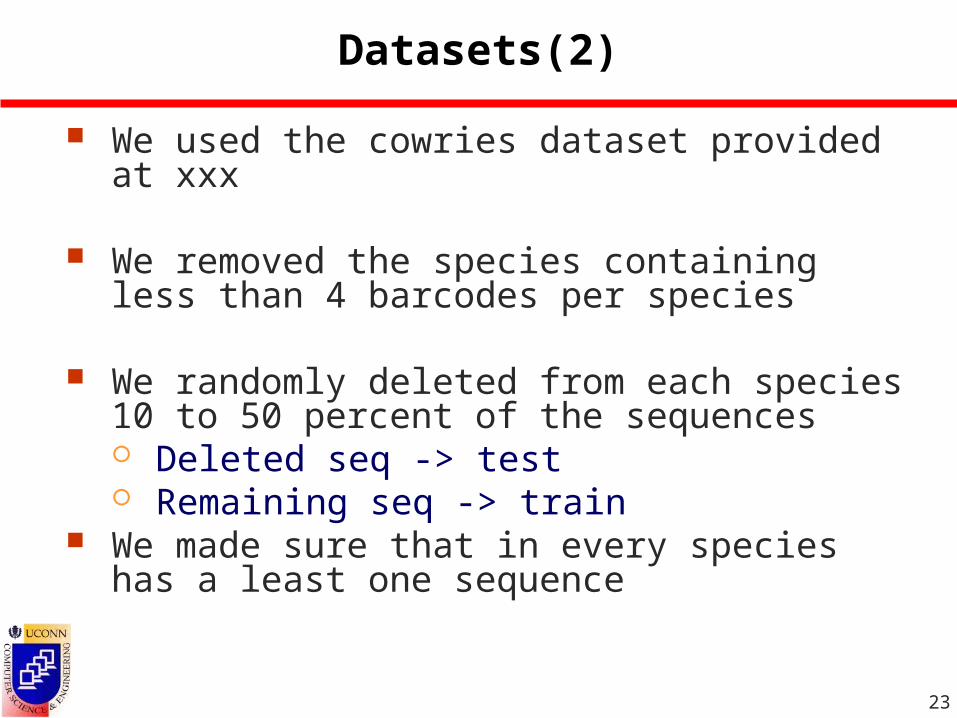
Datasets(2)
We used the cowries dataset provided at xxx
We removed the species containing less than 4 barcodes per species
We randomly deleted from each species 10 to 50 percent of the sequences Deleted seq -> test Remaining seq -> train
We made sure that in every species has a least one sequence
24
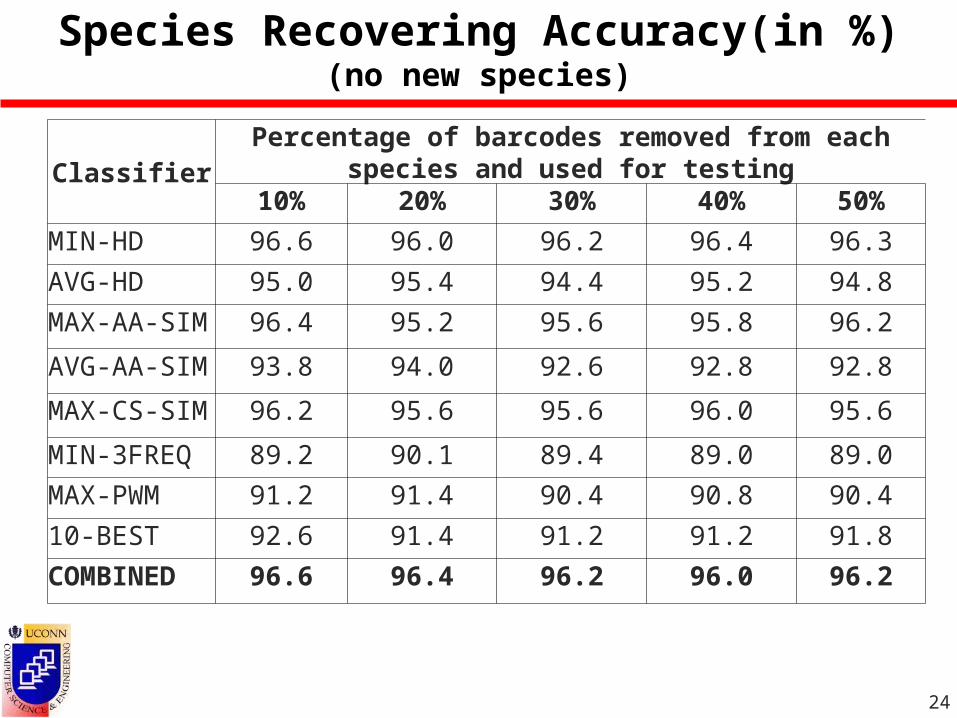
Species Recovering Accuracy(in %)(no new species)
ClassifierPercentage of barcodes removed from each species and used
for testing10% 20% 30% 40% 50%
MIN-HD 96.6 96.0 96.2 96.4 96.3
AVG-HD 95.0 95.4 94.4 95.2 94.8
MAX-AA-SIM 96.4 95.2 95.6 95.8 96.2
AVG-AA-SIM 93.8 94.0 92.6 92.8 92.8
MAX-CS-SIM 96.2 95.6 95.6 96.0 95.6
MIN-3FREQ 89.2 90.1 89.4 89.0 89.0
MAX-PWM 91.2 91.4 90.4 90.8 90.4
10-BEST 92.6 91.4 91.2 91.2 91.8
COMBINED 96.6 96.4 96.2 96.0 96.2

25
Datasets(3)
In order to test the accuracy of new species detection and classification we devised a regular leave one out procedure.
delete a whole species randomly delete from each remaining
species 0 to 50 percent of the sequences Deleted seq -> test Remaining seq -> train
The following table gives accuracy results on average for 150x6 different testcases

26
Leave one out Accuracy(in %)DAWG train dataset
Classifier
Percentage of additional barcodes removed from each species and used for testing
0% 10% 20% 30% 40% 50%MIN-HD 80.9 91.7 92.8 91.6 90.3 88.4AVG-HD 81.1 91.5 92.3 91.0 89.9 87.8
MAX-AA-SIM 83.4 82.7 82.9 80.2 78.4 74.8AVG-AA-SIM 83.1 89.5 89.3 88.8 88.3 88.2MAX-CS-SIM 94.3 94.4 94.0 92.9 91.7 89.7MIN-3FREQ 82.9 70.3 69.6 67.8 65.8 63.0MAX-PWM 91.2 91.7 91.6 89.8 88.0 85.410-BEST 93.3 94.7 93.8 92.6 91.6 89.6
COMBINED 93.7 97.6 97.8 97.8 97.4 97.0
27
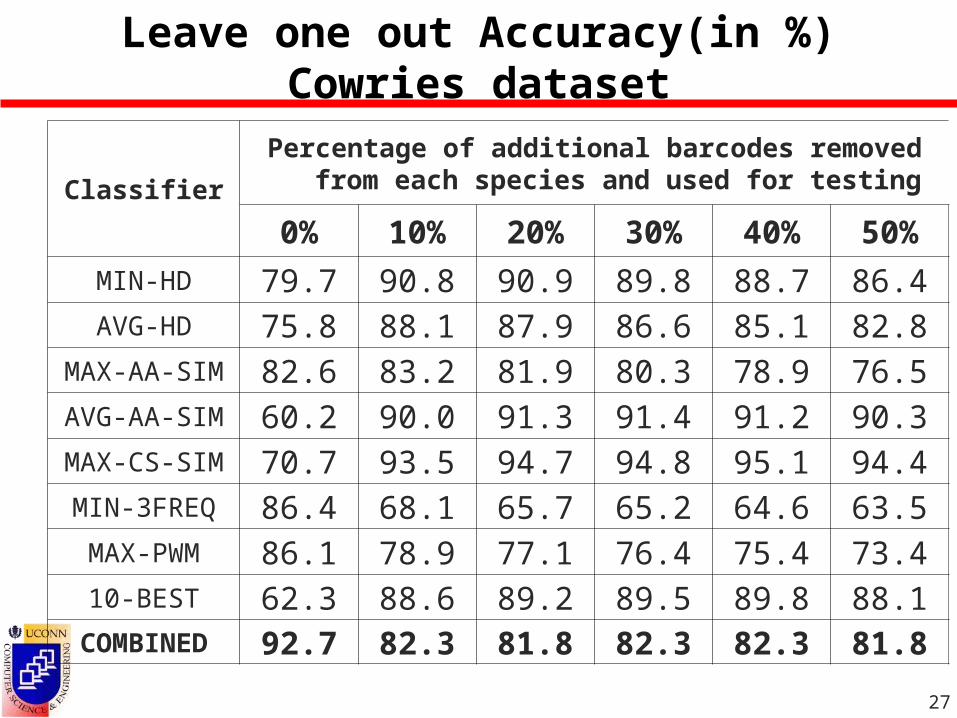
Leave one out Accuracy(in %)Cowries dataset
Classifier
Percentage of additional barcodes removed from each species and used for testing
0% 10% 20% 30% 40% 50%
MIN-HD 79.7 90.8 90.9 89.8 88.7 86.4AVG-HD 75.8 88.1 87.9 86.6 85.1 82.8
MAX-AA-SIM 82.6 83.2 81.9 80.3 78.9 76.5AVG-AA-SIM 60.2 90.0 91.3 91.4 91.2 90.3MAX-CS-SIM 70.7 93.5 94.7 94.8 95.1 94.4MIN-3FREQ 86.4 68.1 65.7 65.2 64.6 63.5MAX-PWM 86.1 78.9 77.1 76.4 75.4 73.410-BEST 62.3 88.6 89.2 89.5 89.8 88.1
COMBINED 92.7 82.3 81.8 82.3 82.3 81.8
28
Conclusions(1)
Every method shows a tradeoff between new species detection and classification accuracy
Hamming distance performs very good when no new species are present but the accuracy results are low for new species detection
The combined method yields better accuracy results both on new species detection and seq. classification.
The runtime of all methods is within the same order of magnitude
29
Future Work
New species clustering: determining the different new species present
Further investigate threshold selection and weighting schemes.
Possible ignoring parts of the given sequences could improve accuracy. Are there redundant/noisy regions?
Use independent weighting schemes for new species detection and classification into known species.