DLC Volume 2 - March 2021
104
Transcript of DLC Volume 2 - March 2021


01 Risk disclosures 1
Statement from the group chief risk officer 5
Salient features 9
Principal risks 10
Risk management approach and framework 22
Credit and counterparty risk and asset quality 24
Environmental, social and governance (ESG) risk and climate risk 56
Investment risk 57
Securitisation/structured credit 59
Market risk 61
Balance sheet risk and liquidity 67
Operational risk 79
Reputational, strategic and legal risk 83
Compliance 84
Recovery and resolution plan 87
Capital management and allocation 88
02 AnnexuresAlternative performance measures 98
Definitions 100
Glossary 101
Corporate information 102
Investec integrated annual report 2021
CONTENTS
3


A summary of the year in review from a risk perspectiveThe executive management is integrally involved in ensuring stringent management of risk, liquidity, capital and conduct through our risk appetite framework which is assessed with consideration of prevailing market conditions and overall Investec group strategy. The primary aim is to achieve a suitable balance between risk and reward in our business. Although the macro-environment during the year continued to present challenges due to the COVID-19 pandemic, the group was able to maintain sound asset performance and risk metrics throughout the year in review.
We are comfortable that we have strong balance sheets with high levels of liquidity, strong capital and low leverage as well as established risk management processes and systems in place to navigate through this period of uncertainty.
In the first quarter of 2020, the COVID-19 pandemic combined with an oil price shock stunned global markets resulting in extreme market dislocations. Since then we have seen multiple social containment measures in the UK, South Africa, as well as in many countries across the world and significant levels of uncertainty. Offset against this, there have been unprecedented levels of government support provided and a number of vaccines developed late in 2020 that are now being rolled out worldwide.
Additionally in the UK, the conclusion of Brexit late in December 2020 provided some certainty and we have sought to adapt to the new legal and regulatory landscape. Activity levels as a result have picked up, particularly in the second half of the financial year as clients have been in a position to make investment decisions given the greater macro-economic certainty that exists, albeit maintaining a cautious approach.
In the UK, IBP’s long-term Moody’s deposit rating is A1 (stable outlook) and Investec plc’s rating is Baa1 (stable outlook), in line with the prior year. IBP’s long-term Fitch rating is BBB+ (negative outlook). The negative outlook is improved from a Rating Watch Negative assigned by Fitch in April 2020 as a result of the heightened risk from the global COVID-19 pandemic. Following review by Fitch, the Rating Watch was removed and the BBB+ rating affirmed reflecting Fitch’s view that IBP’s ratings are not immediately at risk from the impact of the economic downturn given IBP’s sound underlying metrics.
On 20 November 2020, Fitch Ratings downgraded South Africa’s Long-Term Foreign-Currency Issuer Default Rating (IDR) to ‘BB-’ from ‘BB’ with a Negative outlook. On the same day, Moody’s downgraded the Government of South Africa’s long-term foreign-currency and local-currency issuer ratings to Ba2 from Ba1 and maintained the negative outlook in place since 1 November 2019. Also on 20 November 2020, S&P affirmed its ‘BB-/B’ long- and short-term foreign currency sovereign credit ratings and its ‘BB/B’ long- and short-term local currency sovereign credit ratings on South Africa with a stable outlook. Further, on 21 May 2021, both S&P and Fitch affirmed their long-term sovereign credit ratings and outlooks for South Africa. The downgrades, taken in isolation of any other matters, are expected to have an immaterial impact on Investec’s risk weighted assets (RWAs) and therefore the impact on regulatory capital is also expected to be immaterial. In addition, the downgrades are expected to have a small impact on cost of funds over time, as a result of IBL being predominantly domiciled in South Africa and raising most of its deposits and funding in the closed Rand system, with very little mismatch between foreign denominated funding and foreign denominated assets.
IBL’s ratings continued to track rating adjustments to the South African sovereign rating during the course of the year. IBL’s national long-term ratings remain sound at Aa1.za from Moody’s, AA+(zaf) from Fitch and za.AA from S&P.
The group’s net core loan book increased to £26.4 billion or 1.6% in neutral currency.
In the UK, growth in net core loans was driven by the residential mortgage portfolio and other high net worth lending as we gained good traction in our Private Banking strategy as well as selective lending collateralised by property. Corporate client lending portfolios saw good activity albeit limited net book growth and were impacted by the exit from Australia. On 8 December 2020 the group announced its exit from Australia to focus on building scale and relevance in its core market in the UK. The wind down of this business is underway and the sale of c.£400 million of the corporate lending portfolio took place in March 2021, which has substantially reduced the group’s remaining exposure to this geography. Further exits are anticipated in the coming months and all remaining exposures will form part of the UK managed portfolio going forward upon closure of the Australian branch.
In South Africa, the decline in net core loans was due to lower originations during the year under review coupled with repayments, mainly in the corporate portfolio.
Credit exposures are focused on secured lending to a select target market, comprising high-income and high net worth individuals, established corporates, and medium-sized enterprises. Our risk appetite continued to favour lower risk, income-based lending, with exposures well collateralised and with credit risk taken over a short to medium term. Our focus over the past few years to realign and rebalance our portfolios in line with our risk appetite framework is reflected in the movements in asset classes on our balance sheet; showing an increase in private client, mortgages and corporate and other lending, and maintaining lending collateralised by property as a proportion of net core loans.
At 31 March 2021 our exposure to sectors considered vulnerable to COVID-19 in the UK totalled £1.2 billion or 9.6% of gross core loans. This is predominantly through our global aviation finance business (3.1% of UK gross core loans) and the UK focused high volume small ticket asset finance business lending to SMEs and corporates (2.6% of UK gross core loans). These businesses have performed well to date considering the substantial economic disruption caused by the pandemic. In South Africa, at 31 March 2021, our exposure to sectors considered vulnerable to COVID-19 totalled R11.9 billion or 4.1% of gross core loans and include our aviation, trade finance, hotels, gaming and leisure businesses. We remain confident that we have a well-diversified portfolio across sectors. Government stimulus and support measures have mitigated the impact on vulnerable sectors to date but we continue to monitor these sectors closely for signs of stress.
Asset quality metrics reflect the solid performance of core loans to date. The group’s credit loss ratio was calculated at 0.35% at 31 March 2021 down from 0.52% at 31 March 2020 which took into account the initial impacts of COVID-19. The UK credit loss ratio was 0.56% at 31 March 2021, which remains elevated relative to pre-pandemic levels. The South African credit loss ratio improved to 0.18% at 31 March 2021 (31 March 2020: 0.38%) as the portfolio benefited from better than expected recoveries.
Stage 3 exposures totalled £697 million at 31 March 2021 or 2.7% of gross core loans subject to ECL (31 March 2020:
01 Risk disclosures Investec integrated annual report 2021
STATEMENT FROM THE GROUP CHIEF RISK OFFICER
5

2.4%). Stage 3 exposures are well covered by ECL provisions. The percentage of Stage 3 loans (net of ECL but before taking collateral into account) to net core loans and advances subject to ECL amounted to 2.1% (31 March 2020: 1.6%). In the UK, Stage 3 exposures in the Ongoing book (excluding Legacy) reduced to £231 million or 1.9% of gross core loans subject to ECL at 31 March 2021 (31 March 2020: 2.2%) due to a number of successful exits from existing Stage 3 positions offset by limited new defaults. These exposures are adequately provisioned. Legacy exposures have reduced by 24% since 31 March 2020 to £84 million (net of ECL) at 31 March 2021 and now comprise only 0.7% of UK net core loans and advances. These assets were substantially impaired and are largely reported under Stage 3.
In South Africa Stage 3 exposures increased to R7.4 billion or 2.6% of gross core loans subject to ECL (31 March 2020: 1.5%). The increase was mainly attributable to a few single name exposures that are adequately provided for.
In the UK, Stage 2 exposures increased to £1.2 billion or 10.4% as a proportion of gross core loans subject to ECL at 31 March 2021 (31 March 2020: 5.1%), as a result of the worsened economic environment resulting in an increased proportion of the portfolio that has been subject to a significant increase in credit risk since origination. There are currently no significant underlying credit concerns related to this increase and we continue to monitor these Stage 2 exposures closely. We anticipate that an improvement in economic conditions and increased certainty with respect to the pandemic would result in a reduction in Stage 2 exposures.
In South Africa Stage 2 exposures remain relatively flat at 5.2% of gross core loans subject to ECL at 31 March 2021 (31 March 2020: 5.3%), albeit reduced from 6.4% at 30 September 2020. For the first half of the year the increase was due to single name exposures particularly affected by COVID-19 and model-driven migrations from updated macro-economic scenarios, mainly in the residential mortgage portfolio. In the second half of the year, the decrease is predominantly due to certain transfers into Stage 3 as well as a limited number of exposures improving and, as a result, moving back into Stage 1.
The measurement of ECL under IFRS 9 has increased complexity and reliance on expert credit judgements. Key
judgemental areas under IFRS 9 are highlighted in this document and are subject to robust governance processes. Investec plc applies the IFRS 9 transitional arrangements (including COVID-19 ECL add-backs) to regulatory capital calculations to absorb the impact permissible of IFRS 9 over time. Investec Limited absorbed the full impact of IFRS 9 on 1 April 2019, on adoption of the Foundation Internal Ratings-Based approach (FIRB) for credit risk.
Assessing the forward-looking impact of COVID-19 as well as the offsetting effect of the unprecedented levels of government measures, particularly in the UK, required significant judgement. Management performed extensive benchmarking of credit loss ratios, macro-economic scenarios applied and the coverage ratios against UK and South African banks. It was concluded that the ECL position appeared reasonable in comparison to industry peers. In the UK, the extreme and unprecedented economic conditions identified limitations in aspects of our model design and calibration. The model methodology itself was therefore reviewed and adjusted to ensure the output of the models reflected the ongoing uncertainty in the economic environment whilst we continued to rely on the bank’s internal models where relevant. A £16 million ECL overlay was applied to the Stage 2 portfolio to capture latent risk in the portfolio not yet identified in the models. In South Africa, the forward-looking macro-economic scenarios used in the measurement of ECL were updated to capture the impacts of the sovereign downgrade by Moody’s to sub-investment grade as well as the impact of COVID-19. A management ECL overlay of R290 million (31 March 2020: R190 million) was raised for the Private Bank portfolio to account for the unique nature of the COVID-19 pandemic and the impact on the South African economy. Specifically, the management ECL overlay accounts for emerging risks identified for certain categories of borrowers within the commercial real estate and mortgage portfolios. Management believes that these risks are not adequately represented by the historic data used to populate the ECL models. In line with our previous approach Stage 3 ECLs continued to be assessed using expert credit judgement.
In line with regulatory and accounting bodies’ guidance, exposures that have been granted COVID-19 relief measures such as payment holidays are not automatically considered to have been subject to a significant increase in credit
risk and therefore do not alone result in a transfer across stages. We have structured different types of support to most appropriately suit diverse client needs. In the UK, COVID-19 relief measures currently in place have reduced substantially from a peak of 13.7% of gross core loans at end June 2020 to £342 million or 2.7% at 31 March 2021, of which £251 million are assets reported in Stage 1. In South Africa, COVID-19 relief measures currently in place have reduced from a cumulative relief of 23.0% of gross core loans since the onset of COVID-19 to 1.3% or R3.8 billion at 31 March 2021 of which R2.0 billion are reported in Stage 1.
Trading income continued to be negatively impacted by risk management and risk reduction costs in our structured product book of £93 million in the year to 31 March 2021. Extreme market movements, dividend cancellations and a lack of trading liquidity were the primary causes of these costs. Risk reduction trades combined with a reduction in the size of the structured products book substantially reduced risk management costs in the last quarter of the financial year. Furthermore, the implementation of a macro hedge has provided downside protection in the event of another extreme market dislocation. For the 2022 financial year we expect these costs to be approximately £30 million. This guidance is subject to various assumptions which, if altered, may result in a different outcome to management expectations. At 31 March 2021, the 95% one-day Value at Risk (VaR) measure has reduced to £0.5 million (31 March 2020: £1.5 million) and R5.5 million (31 March 2020: R6.9 million) in the UK and South Africa respectively.
We have reduced our investment portfolio exposure in line with our objective of optimising capital allocation, reducing income volatility, and aligning the business with our client franchises. The investment portfolio on the balance sheet reduced by 9.0% over the year under review to £909 million at 31 March 2021.
Investec continues to retain a 25.0% shareholding in Ninety One (previously known as Investec Asset Management) as a strategic investment.
The group continued to maintain a sound balance sheet with a low gearing ratio of 9.7 times and a core loans to equity ratio of 5.0 times at 31 March 2021. Our leverage ratios for Investec Limited and Investec plc were 7.6% and
01 Risk disclosures Investec integrated annual report 2021
STATEMENT FROM THE GROUP CHIEF RISK OFFICERCONTINUED
6

7.9% respectively, ahead of the group’s minimum 6% target level.
The group maintained a sound capital position with a Common Equity Tier 1 (CET1) ratio of 11.2% for Investec plc (standardised approach) and 12.2% for Investec Limited (FIRB approach) at 31 March 2021. The group is targeting a minimum CET1 ratio above 10%, a Tier 1 ratio above 11% and a total capital adequacy ratio range of 14% to 17% on a consolidated basis for Investec plc and Investec Limited respectively. We remain ahead of our group targets and well in excess of regulatory minimums.
In March 2021, the Bank of England (BoE) re-confirmed the preferred resolution strategy for the UK bank as ‘modified insolvency’. As the resolution strategy is ‘modified insolvency’, the BoE has set IBP’s minimum requirement for own funds and eligible liabilities (MREL) requirement as equal to its total regulatory capital requirements.
Investec plc’s Pillar 2A requirement expressed as a percentage of RWAs at 31 March 2021 reduced to 0.83% of RWAs (of which 0.47% has to be met with CET1 capital) down from 1.12% at 31 March 2020 as a result of a number of regulatory changes. The changes have resulted in a lower CET1 regulatory minimum for Investec plc and IBP, increasing our regulatory capital surplus.
Investec Limited received approval to report its corporate and SME portfolios from 1 April 2021 on the AIRB approach with a c. 60bps uplift to the CET1 ratio. Investec is working on migrating additional portfolios to the AIRB approach and if successful, is expected to result in a further 1.00%-1.50% uplift to the CET1 ratio. The negative impact on CET1 at 31 March 2020, as a result of the sudden movement in credit spreads on our High Quality Liquid Assets and credit investment portfolios held at fair value through equity, reversed during the financial year in review. The South African Prudential Authority (South African PA) indicated that the reduction in the Pillar 2a requirements effective 6 April 2020, will potentially be reinstated in 2022.
Holding a high level of readily available, high quality liquid assets remains paramount in the management of our balance sheet. We continued to maintain a low reliance on interbank wholesale funding to fund core lending asset growth. A strong liquidity position continued to be maintained throughout the year primarily supported by growth in retail customer deposits. Cash and near cash balances amounted to £13.2 billion at 31 March 2021 (31 March 2020:
£12.7 billion). Average cash balances remained high as we maintained a conservative position holding higher levels of group cash balances due to the onset of the COVID-19 pandemic.
Customer accounts (deposits) totalled £34.4 billion at 31 March 2021 (31 March 2020: £32.2 billion). In the UK, a new digital offering was successfully launched during the year with strong uptake from retail clients, which substantially reduces the operational cost of deposit raising for these products.
Loans and advances to customers as a percentage of customer deposits remained conservative at 75.6%. The group comfortably exceeds Basel liquidity requirements for the Liquidity Coverage Ratio (LCR) and Net Stable Funding Ratio (NSFR). IBL (solo basis) ended the year to 31 March 2021 with the three-month average of its LCR at 150.2% and NSFR of 112.8%. For Investec plc and IBP (solo basis) the LCR and NSFR are calculated using the relevant European Union (EU) regulation, applying our own interpretations where required. The LCR reported to the Prudential Regulatory Authority (PRA) at 31 March 2021 was 440% for Investec plc and 475% for IBP (solo basis). The UK LCR ratios reported at 31 March 2021 were elevated by the sale of the Australian corporate loans. Excluding the sale the LCR for IBP (solo basis) would be 330%. The internally calculated NSFR was 129% for Investec plc and 126% for IBP (solo basis) at 31 March 2021. These may change over time with regulatory developments and guidance.
Looking forward, the focus remains on having an optimised funding mix through the retail market, in line with the group’s strategic objectives as well as selectively using wholesale funding to lengthen the book. In the UK, we have access to the BoE Term Funding Scheme with additional incentives for Small and Medium Enterprises (TFSME).
We remain highly focused on managing conduct, reputational, operational, recovery and resolution risks across our banking and Wealth & Investment businesses. Countering financial and cyber crime are high priorities, and the group continually aims to strengthen and test systems and controls in order to manage cyber risk as well as meet regulatory obligations to combat money laundering, fraud and corruption. The operational response of our business to remote working continues to be effective and has enabled a seamless continuation of service to our clients.
The group operates in a legal and regulatory environment that exposes it to litigation risks. As a result, the group is involved in disputes and legal proceedings which arise in the ordinary course of business. The group evaluates all facts, the probability of the outcome of legal proceedings and advice from internal and external legal counsel when considering the accounting implications.
The group’s stress testing framework is well embedded in its operations and is designed to identify and regularly test the group’s key vulnerabilities under stress. A fundamental part of the stress testing process is a full and comprehensive analysis of the group’s material business activities, incorporating views from risk, the business units and the executive – a process called the ‘bottom-up’ analysis. Resulting from the ‘bottom-up’ analysis, the Investec-specific stress scenarios are designed to specifically test the unique attributes of the group’s portfolio. The key is to understand the potential threats to our sustainability and profitability and thus a number of risk scenarios are developed and assessed. These Investec-specific stress scenarios form an integral part of our capital planning process and IFRS 9 reporting. The stress testing process also informs the risk appetite review process and the management of risk appetite limits and is a key risk management tool of the group. This process allows the group to proactively identify underlying risks and manage them accordingly. During the year, a number of stress scenarios were considered and incorporated into our processes including for the assessment of the impact of COVID-19 and negative interest rates.
The board, through its respective risk and capital committees, continued to assess the impact of its principal risks and the above mentioned stress scenarios on its business. The board has concluded that the group has robust systems and processes in place to manage these risks and that, while under a severe stress scenario business activity would be very subdued, the group would continue to maintain adequate liquidity and capital balances to support the continued operation of the group.
Our viability statement is provided in volume one on pages 120 to 122
Conclusion Supported by a strong capital base and high levels of liquidity, the group has navigated the unusual and unprecedented economic and market conditions as a result of the COVID-19
01 Risk disclosures Investec integrated annual report 2021
STATEMENT FROM THE GROUP CHIEF RISK OFFICERCONTINUED
7

pandemic well. Profitability has been impacted; however, the fundamental risk performance remains strong, reflecting the sound underlying balance sheet going into the pandemic. The risk outlook remains uncertain, although we are comfortable that we are well placed to progress in the next financial year given the current levels of provisioning and management actions taken to reduce risks across the group in the year to 31 March 2021.
Management is focused on maintaining the integrity of our balance sheet through continuous oversight of credit, liquidity and capital risk with ongoing stress testing, scenario modelling and client engagement. We continue to support our clients during this ongoing period of uncertainty and, going forward, as the economic environment improves.
Signed on behalf of the board
Mark Currie Group chief risk officer22 June 2021
01 Risk disclosures Investec integrated annual report 2021
STATEMENT FROM THE GROUP CHIEF RISK OFFICERCONTINUED
8

Salient features
A summary of the key risk indicators are provided in the table below:
UK and Other^^ Southern Africa^^^ Total group2021 2020*** 2021 2020 2021 2020***
Year to 31 March £ £ R R £ £
Net core loans (million) 12 331 11 870 287 315 288 878 26 438 24 911Total assets (excluding assurance assets) (million) 24 604 24 647 548 673 574 607 51 460 50 523Total risk-weighted assets (million) 16 332 16 285 351 125 337 755 33 576^ 31 532^Total equity (million) 2 506 2 389 60 628 56 675 5 312 4 898Cash and near cash (million) 6 857 6 040 129 759 147 169 13 229 12 683Customer accounts (deposits) (million) 16 070 15 272 374 228 375 456 34 449 32 221Loans and advances to customers as a % of customer deposits 76.8% 77.7% 74.6% 75.0% 75.6% 76.3% Structured credit as a % of total assets* 2.3% 2.1% 0.5% 0.6% 1.4% 1.3% Banking book investment and equity risk exposures as a % of total assets* 2.5% 2.6% 3.8% 4.2% 3.2% 3.4% Traded market risk: 95% one-day value at risk (million) 0.5 1.5 5.5 6.9 n/a n/aCore loans to equity ratio 4.9x 5.0x 4.7x 5.1x 5.0x 5.1xTotal gearing ratio** 9.8x 10.3x 9.0x 10.1x 9.7x 10.3xReturn on average assets# 0.34% 0.79% 0.70% 0.95% 0.53% 0.88% Return on average risk-weighted assets# 0.52% 1.19% 1.13% 1.56% 0.82% 1.38% Stage 3 exposures as a % of gross core loans subject to ECL 2.8% 3.3% 2.6% 1.5% 2.7% 2.4% Stage 3 exposure net of ECL as a % of net core loans subject to ECL 2.0% 2.4% 2.1% 0.8% 2.1% 1.6% Credit loss ratio 0.56% 0.69% 0.18% 0.36% 0.35% 0.52% Level 3 (fair value assets) as a % of total assets 6.6% 6.9% 2.1% 2.1% 4.3% 4.4% Common Equity Tier 1 ratio## 11.2% 10.7% 12.2% 10.9% n/a n/aTier 1 ratio## 12.8% 12.4% 12.8% 11.5% n/a n/aTotal capital adequacy ratio## 15.1% 14.9% 16.0% 15.0% n/a n/aLeverage ratio 7.9% 7.8% 7.6% 6.4% n/a n/a
* Total assets excluding assurance assets.^ The group numbers have been ‘derived’ by adding Investec plc and Investec Limited (Rand converted into Pound Sterling) numbers together. # Where return represents adjusted earnings attributable to ordinary shareholders, as defined on page 98. Average balances are calculated on a straight-
line average.## The CET1, tier 1, total capital ratio and RWAs are calculated using IFRS 9 transitional arrangements.** Total assets excluding assurance assets to total equity. ^^ The capital adequacy disclosures follow Investec’s normal basis of presentation so as to show a consistent basis of calculation across the jurisdictions in
which the group operates. For Investec plc and IBP this does not include the deduction of foreseeable charges and dividends when calculating the CET1 ratio. The impact of this deduction totalling £25 million for Investec plc and £25 million for IBP would lower the CET 1 ratio by 17bps and 16bps respectively.
^^^ Investec Limited’s capital information includes unappropriated profits. If unappropriated profits are excluded from capital information, Investec Limited’s CET1 ratio would be 39bps lower (31 March 2020: 24bps lower).
*** Restated as detailed on page 141 of volume three.
Certain information is denoted as n/a as these statistics are not calculated at a consolidated group level and are best reflected per banking entity.
01 Risk disclosures Investec integrated annual report 2021
SALIENT FEATURES
9

An overview of the principal risks relating to our operationsThe most material and significant risks we face, which the board and senior management believe could have an impact on our operations, financial performance, viability and prospects are summarised below with further information pertaining to the management and monitoring of these principal risks shown in the references provided.
The board, through its various sub-committees, has performed a robust assessment of these principal risks and regular reporting of these risks is made to the board.
The board recognises that, even with sound appetite and judgement, extreme events can happen which are completely outside of the board’s control. It is, however, necessary to assess these events and their impact and how they may be mitigated by considering the risk appetite framework. It is the group’s policy to regularly carry out multiple stress testing scenarios which, in theory, test extreme but plausible events and from that, assess and plan what can be done to mitigate the potential outcome.
The group has a strong and embedded risk and capital management culture and
policies and processes in place to address these principal risks. Risk awareness, control and compliance are embedded in all our day-to-day activities through a levels of defence model.
The levels of defence model is applied as follows:
• Level 1 – Business line management: responsible for identifying and managing risks inherent in the products, activities, processes and systems for which it is accountable and escalating risk events where necessary
• Level 2 – Independent risk and compliance functions: responsible for building and embedding risk frameworks, challenging the business lines’ inputs to, and outputs from, the group’s risk management, risk measurement and reporting activities
• Level 3 – Independent internal audit: responsible for reviewing and testing the application and effectiveness of risk management procedures and practices.
Overall group risk appetiteThe group has a number of board-approved risk appetite statements and
policy documents covering our risk tolerance and approach to our principal aspects of risk. The risk appetite statements and frameworks for Investec plc and Investec Limited set out the board’s mandated risk appetite. The risk appetite frameworks act as a guide to determine the acceptable risk profile of the group. The risk appetite statements ensure that limits/targets are applied and monitored across all key operating jurisdictions and legal entities.
The risk appetite frameworks are a function of business strategy, budget and capital processes, our stress testing reviews and the regulatory and economic environment in which the group is operating. The risk appetite frameworks are reviewed (in light of the above aspects) and approved by the board at least annually or as business needs dictate.
A documented process exists where our risk profile is measured against our risk appetite and this positioning is presented to the board. In the section that follows, the group’s high-level summary of overall risk tolerance and positioning has been detailed against the respective principal risks.
01 Risk disclosures Investec integrated annual report 2021
PRINCIPAL RISKS
10

Credit and counterparty riskPrincipal risk description Risk management and key mitigating actions
Credit and counterparty risk is defined as the risk arising from an obligor’s (typically a client or counterparty) failure to meet the terms of any agreement thereby resulting in a loss to the group, arising when funds are extended, committed, invested, or otherwise exposed through contractual agreements, whether reflected on- or off-balance sheet
• Independent credit committees exist in the group’s main operating jurisdictions which also have oversight of regions where we assume credit risk. These committees operate under board-approved delegated limits, policies and procedures
• There is a high level of executive involvement in decision-making with non-executive review and oversight
• Our credit exposures are to a select target market comprising high-income and high net worth individuals, established corporates, small and medium-sized enterprises, financial institutions and sovereigns
• Our risk appetite continues to favour lower risk, income-based lending, with exposures well collateralised and credit risk taken over a short to medium term
• Investec has a limited appetite for unsecured debt, thus the credit risk mitigation technique most commonly used is the taking of collateral, with a strong preference for tangible assets
• Portfolio reviews (including stress testing analyses) are undertaken on all material businesses, where the portfolios are analysed to assess any migration in portfolio quality, highlight any vulnerabilities, identify portfolio concentrations and make appropriate recommendations, such as a reduction in risk appetite limits or specific exposures.
Link to strategy
Capital disciplineGrowth initiativesFurther information Risk appetite and tolerance metric Positioning at 31 March 2021
Read more on pages 24 to 51
We target a diversified loan portfolio, lending to clients we know and understand. We limit our exposure to a single/connected individual or company to £120 million for Investec plc and 7.5% of tier 1 capital for Investec Limited. We also have a number of risk tolerance limits and targets for specific asset classes.
We maintained this risk tolerance level throughout the year.
We target a credit loss ratio of less than 0.5% for both Investec Limited and Investec plc (less than 1.25% and 1.75% under a weak economic environment/stressed scenario for Investec Limited and Investec plc respectively). We target Stage 3 net of ECL as a % of net core loans subject to ECL to be less than 2% for Investec plc (excluding the legacy portfolio; less than 4% under a weak economic environment/stressed scenario) and less than 2% for Investec Limited.
We currently remain within all tolerance levels given the current weakened economic environment. The group credit loss ratio was calculated at 0.35% for 31 March 2021 (31 March 2020: 0.52%). Stage 3 net of ECL as a % of net core loans subject to ECL was 1.4% for Investec plc (excluding the Legacy portfolio) and 2.1% for Investec Limited.
01 Risk disclosures Investec integrated annual report 2021
PRINCIPAL RISKSCONTINUED
11

Country riskPrincipal risk description Risk management and key mitigating actions
Country risk refers to the risk of lending to a counterparty operating in a particular country or the risk inherent in a sovereign exposure, i.e. the risk of exposure to loss caused by events in that country. Country risk covers all forms of lending or investment activity whether to/with individuals, corporates, banks or governments
• Exposures are only to politically stable jurisdictions that we understand and have preferably operated in before
• The legal environment should be tested, have legal precedent in line with Organisation for Economic Co-operation and Development (OECD) standards and have good corporate governance
• In certain cases, we may make use of political risk insurance to mitigate exposure where deemed necessary.
Link to strategy Risk appetite and tolerance metric Positioning at 31 March 2021
Growth initiatives We have a preference for primary exposure in the group’s main operating geographies (i.e. South Africa and UK). We will accept exposures where we have a branch or local banking subsidiary and tolerate exposures to other countries where we have developed a local understanding and capability or we are facilitating a transaction for a client.
We maintained this risk tolerance level in place throughout the year.
Further informationRead more on page 25
Environmental, social and governance (ESG) risk and climate riskPrincipal risk description Risk management and key mitigating actions
The risk that our lending and investment activities give rise to unintended environmental (including climate change), social and economic consequences
• Investec has a holistic approach to sustainability, which runs beyond recognising our own footprint on the environment, includes our many community activities and is based on a broader responsibility to our environment and society
• Accordingly, sustainability risk considerations are considered by the relevant credit committee or investment committee when making lending or investment decisions
• There is also oversight by the group ESG Executive Committee and the Social and Ethics Committee on general ESG issues, including climate-related impacts
• The group ESG Executive Committee coordinates general ESG efforts, including climate-related risks and opportunities across geographies and businesses from both a strategy and policy perspective.
Link to strategy Risk appetite and tolerance metric Positioning at 31 March 2021
Growth initiativesGreater connectivity
We take a cautious approach with respect to industries that are known to damage the environment. We made our group fossil fuel policy public on 31 March 2020. Financial risk from climate change is a highly important topic which helps to inform decisions. We acknowledge that our approach is still work in progress and will continue to develop this over time.
We maintained this risk tolerance level in place throughout the year.
Further informationRead more on pages 25 and 56, pages 131 to 150 of volume one and refer to our 2021 group sustainability and ESG supplementary report on our website
01 Risk disclosures Investec integrated annual report 2021
PRINCIPAL RISKSCONTINUED
12
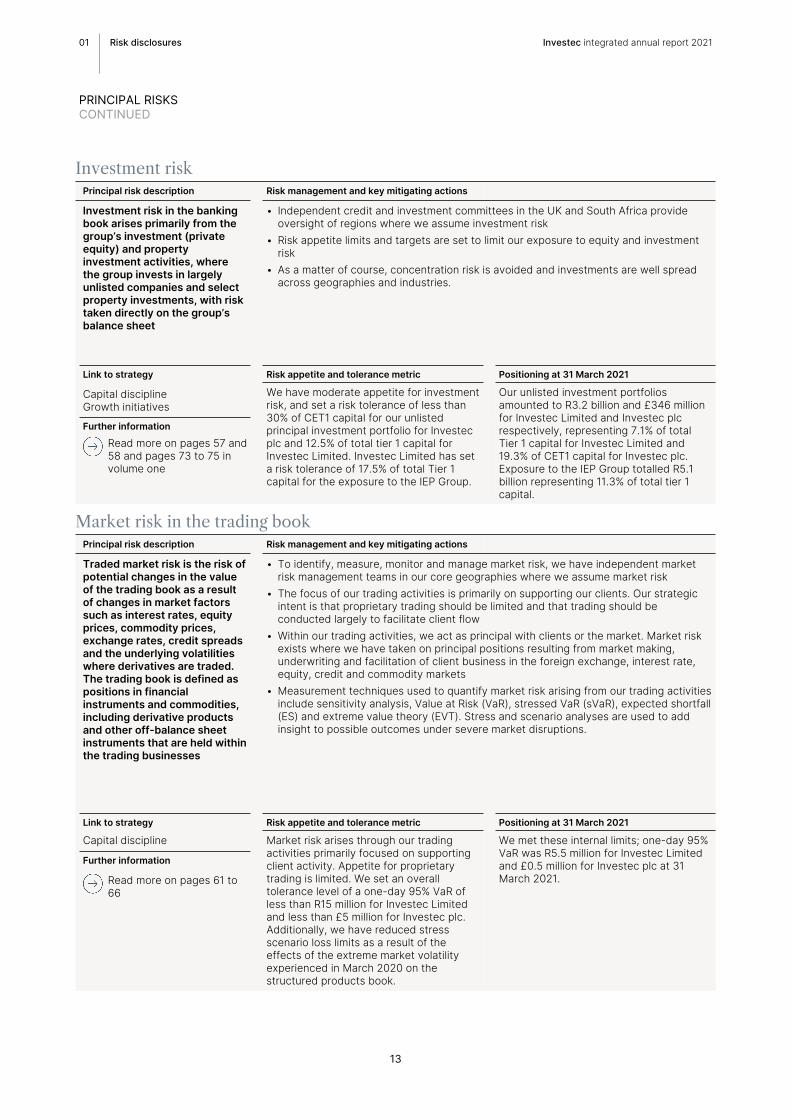
Investment riskPrincipal risk description Risk management and key mitigating actions
Investment risk in the banking book arises primarily from the group’s investment (private equity) and property investment activities, where the group invests in largely unlisted companies and select property investments, with risk taken directly on the group’s balance sheet
• Independent credit and investment committees in the UK and South Africa provide oversight of regions where we assume investment risk
• Risk appetite limits and targets are set to limit our exposure to equity and investment risk
• As a matter of course, concentration risk is avoided and investments are well spread across geographies and industries.
Link to strategy Risk appetite and tolerance metric Positioning at 31 March 2021
Capital disciplineGrowth initiatives
We have moderate appetite for investment risk, and set a risk tolerance of less than 30% of CET1 capital for our unlisted principal investment portfolio for Investec plc and 12.5% of total tier 1 capital for Investec Limited. Investec Limited has set a risk tolerance of 17.5% of total Tier 1 capital for the exposure to the IEP Group.
Our unlisted investment portfolios amounted to R3.2 billion and £346 million for Investec Limited and Investec plc respectively, representing 7.1% of total Tier 1 capital for Investec Limited and 19.3% of CET1 capital for Investec plc. Exposure to the IEP Group totalled R5.1 billion representing 11.3% of total tier 1 capital.
Further information
Read more on pages 57 and 58 and pages 73 to 75 in volume one
Market risk in the trading bookPrincipal risk description Risk management and key mitigating actions
Traded market risk is the risk of potential changes in the value of the trading book as a result of changes in market factors such as interest rates, equity prices, commodity prices, exchange rates, credit spreads and the underlying volatilities where derivatives are traded. The trading book is defined as positions in financial instruments and commodities, including derivative products and other off-balance sheet instruments that are held within the trading businesses
• To identify, measure, monitor and manage market risk, we have independent market risk management teams in our core geographies where we assume market risk
• The focus of our trading activities is primarily on supporting our clients. Our strategic intent is that proprietary trading should be limited and that trading should be conducted largely to facilitate client flow
• Within our trading activities, we act as principal with clients or the market. Market risk exists where we have taken on principal positions resulting from market making, underwriting and facilitation of client business in the foreign exchange, interest rate, equity, credit and commodity markets
• Measurement techniques used to quantify market risk arising from our trading activities include sensitivity analysis, Value at Risk (VaR), stressed VaR (sVaR), expected shortfall (ES) and extreme value theory (EVT). Stress and scenario analyses are used to add insight to possible outcomes under severe market disruptions.
Link to strategy Risk appetite and tolerance metric Positioning at 31 March 2021
Capital discipline Market risk arises through our trading activities primarily focused on supporting client activity. Appetite for proprietary trading is limited. We set an overall tolerance level of a one-day 95% VaR of less than R15 million for Investec Limited and less than £5 million for Investec plc. Additionally, we have reduced stress scenario loss limits as a result of the effects of the extreme market volatility experienced in March 2020 on the structured products book.
We met these internal limits; one-day 95% VaR was R5.5 million for Investec Limited and £0.5 million for Investec plc at 31 March 2021.
Further information
Read more on pages 61 to 66
01 Risk disclosures Investec integrated annual report 2021
PRINCIPAL RISKSCONTINUED
13
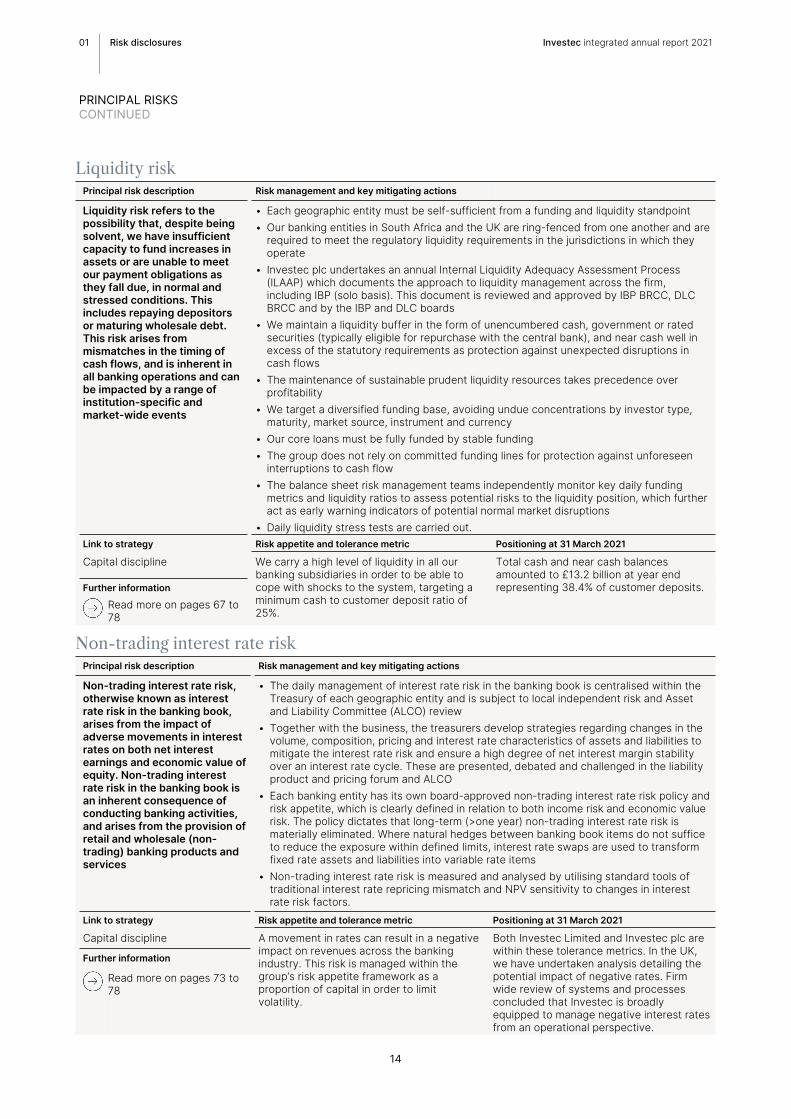
Liquidity riskPrincipal risk description Risk management and key mitigating actions
Liquidity risk refers to the possibility that, despite being solvent, we have insufficient capacity to fund increases in assets or are unable to meet our payment obligations as they fall due, in normal and stressed conditions. This includes repaying depositors or maturing wholesale debt. This risk arises from mismatches in the timing of cash flows, and is inherent in all banking operations and can be impacted by a range of institution-specific and market-wide events
• Each geographic entity must be self-sufficient from a funding and liquidity standpoint• Our banking entities in South Africa and the UK are ring-fenced from one another and are
required to meet the regulatory liquidity requirements in the jurisdictions in which they operate
• Investec plc undertakes an annual Internal Liquidity Adequacy Assessment Process (ILAAP) which documents the approach to liquidity management across the firm, including IBP (solo basis). This document is reviewed and approved by IBP BRCC, DLC BRCC and by the IBP and DLC boards
• We maintain a liquidity buffer in the form of unencumbered cash, government or rated securities (typically eligible for repurchase with the central bank), and near cash well in excess of the statutory requirements as protection against unexpected disruptions in cash flows
• The maintenance of sustainable prudent liquidity resources takes precedence over profitability
• We target a diversified funding base, avoiding undue concentrations by investor type, maturity, market source, instrument and currency
• Our core loans must be fully funded by stable funding• The group does not rely on committed funding lines for protection against unforeseen
interruptions to cash flow• The balance sheet risk management teams independently monitor key daily funding
metrics and liquidity ratios to assess potential risks to the liquidity position, which further act as early warning indicators of potential normal market disruptions
• Daily liquidity stress tests are carried out.Link to strategy Risk appetite and tolerance metric Positioning at 31 March 2021
Capital discipline We carry a high level of liquidity in all our banking subsidiaries in order to be able to cope with shocks to the system, targeting a minimum cash to customer deposit ratio of 25%.
Total cash and near cash balances amounted to £13.2 billion at year end representing 38.4% of customer deposits.Further information
Read more on pages 67 to 78
Non-trading interest rate riskPrincipal risk description Risk management and key mitigating actions
Non-trading interest rate risk, otherwise known as interest rate risk in the banking book, arises from the impact of adverse movements in interest rates on both net interest earnings and economic value of equity. Non-trading interest rate risk in the banking book is an inherent consequence of conducting banking activities, and arises from the provision of retail and wholesale (non-trading) banking products and services
• The daily management of interest rate risk in the banking book is centralised within the Treasury of each geographic entity and is subject to local independent risk and Asset and Liability Committee (ALCO) review
• Together with the business, the treasurers develop strategies regarding changes in the volume, composition, pricing and interest rate characteristics of assets and liabilities to mitigate the interest rate risk and ensure a high degree of net interest margin stability over an interest rate cycle. These are presented, debated and challenged in the liability product and pricing forum and ALCO
• Each banking entity has its own board-approved non-trading interest rate risk policy and risk appetite, which is clearly defined in relation to both income risk and economic value risk. The policy dictates that long-term (>one year) non-trading interest rate risk is materially eliminated. Where natural hedges between banking book items do not suffice to reduce the exposure within defined limits, interest rate swaps are used to transform fixed rate assets and liabilities into variable rate items
• Non-trading interest rate risk is measured and analysed by utilising standard tools of traditional interest rate repricing mismatch and NPV sensitivity to changes in interest rate risk factors.
Link to strategy Risk appetite and tolerance metric Positioning at 31 March 2021
Capital discipline A movement in rates can result in a negative impact on revenues across the banking industry. This risk is managed within the group’s risk appetite framework as a proportion of capital in order to limit volatility.
Both Investec Limited and Investec plc are within these tolerance metrics. In the UK, we have undertaken analysis detailing the potential impact of negative rates. Firm wide review of systems and processes concluded that Investec is broadly equipped to manage negative interest rates from an operational perspective.
Further information
Read more on pages 73 to 78
01 Risk disclosures Investec integrated annual report 2021
PRINCIPAL RISKSCONTINUED
14

Capital riskPrincipal risk description Risk management and key mitigating actions
The risk that we do not have sufficient capital to meet regulatory requirements or that capital is inefficiently deployed across the group
• Both the Investec Limited and Investec plc groups undertake an approach to capital management that utilises both regulatory capital as appropriate to that jurisdiction and internal capital, which is an internal risk-based assessment of capital requirements
• A detailed assessment of the regulatory and internal capital position of each group is undertaken on an annual basis and is documented in the Internal Capital Assessment Process (ICAAP). The ICAAP is reviewed and approved by DLC BRCC and the board
• The determination of target capital is driven by our risk profile, strategy and risk appetite, taking into account the regulatory and market factors applicable to the group
• At the most fundamental level, we seek to balance our capital consumption between prudent capitalisation in the context of the group’s risk profile and optimisation of shareholder returns
• Our internal capital framework is designed to manage and achieve this balance• The framework has been approved by the board and is managed by the DLC Capital
Committee, which is responsible for oversight of the management of capital on a regulatory and an internal capital basis.
Link to strategy Risk appetite and tolerance metric Positioning at 31 March 2021
Capital discipline We are a lowly leveraged firm and target a leverage ratio in all our banking subsidiaries in excess of 6%.
The leverage ratios were 7.9% and 7.6% for Investec plc and Investec Limited respectively.
Further information We intend to maintain a sufficient level of capital to satisfy regulatory requirements and our internal target ratios. We target a total capital adequacy ratio range of between 14% and 17% on a consolidated basis for Investec plc and Investec Limited and we target a minimum Tier 1 ratio of 11% and a CET1 ratio above 10%.
Investec plc and Investec Limited met all these targets. Capital has grown over the period.
Read more on pages 88 to 96
01 Risk disclosures Investec integrated annual report 2021
PRINCIPAL RISKSCONTINUED
15

Business riskPrincipal risk description Risk management and key mitigating actions
Business risk relates to external market factors that can create income volatility
• The risk of loss caused by income volatility is mitigated through diversification of income sources, reducing concentration of income from any one type of business or geography and maintaining a flexible cost base
• Group strategy is directed towards generating and sustaining a diversified income base for the group
• In the instance where income falls, we retain the flexibility to reduce costs (particularly variable remuneration), thereby maintaining a competitive cost to income ratio.
Link to strategy Risk appetite and tolerance metric Positioning at 31 March 2021
Improved cost managementGrowth initiativesGreater connectivity
We seek to maintain an appropriate balance between revenue earned from capital light and balance sheet driven activities. Ideally capital light revenue should exceed 50% of total operating income, dependent on prevailing market conditions.
For our continuing operations, capital light activities contributed 47.0% to total operating income and balance sheet driven activities contributed 53.0%.
Further information We have a solid annuity income base supported by diversified revenue streams, and target an annuity income ratio in excess of 65%.
Annuity income for our continuing operations amounted to 77.6% of total operating income.
Read more on pages 8 to 75 in volume one
We seek to maintain strict control over fixed costs. For the 2021 financial year the group had a cost to income ratio target of below 63%*.
The cost to income ratio amounted to 70.9%*.
We aim to build a sustainable business generating sufficient return to shareholders over the longer term, and target a long-term return on equity ratio range of between 12% and 16%, and a return on RWAs in excess of 1.2%*.
The return on equity amounted to 6.6% and our return on RWAs amounted to 0.82%*.
* These targets were initially set to be achieved by financial year 2022; however, in light of the prevailing macro-economic environment, the timeline for these targets to be met is currently under review.
Reputational and strategic riskPrincipal risk description Risk management and key mitigating actions
Reputational risk is damage to our reputation, name or brand. Reputational risk is often associated with strategic decisions made and also arises as a result of other risks manifesting and not being appropriately mitigated
• We have various policies and practices to mitigate reputational risk, including strong values that are regularly and proactively reinforced
• Strategic and reputational risk is mitigated as much as possible through detailed processes and governance/escalation procedures from business units to the board, and from regular, clear communication with shareholders, customers and all stakeholders
• The group has a disclosure and public communications policy which is reviewed annually by the board.
Link to strategy Risk appetite and tolerance metric Positioning at 31 March 2021
Greater connectivity We have a number of policies and practices in place to mitigate reputational risks.
We have continued to mitigate these risks where possible throughout the year.Further information
Read more on page 83
01 Risk disclosures Investec integrated annual report 2021
PRINCIPAL RISKSCONTINUED
16

Operational riskPrincipal risk description Risk management and key mitigating actions
Operational risk is defined as the potential or actual impact to the group as a result of failures relating to internal processes, people, systems or from external events. The impacts can be financial as well as non-financial such as customer detriment, reputational or regulatory consequences
• The operational risk management framework is embedded at all levels of the group, supported by the risk culture and enhanced on a continual basis in line with regulatory developments. Included in the framework are policies, practices and processes which facilitate the identification, assessment, mitigation, monitoring and reporting of operational risk
• The group’s approach to manage operational risk operates a three levels of defence model which reinforces accountability by allocating clear roles and responsibilities and first line ownership
• There are operational risk sub-types which are significant in nature and are managed by dedicated specialist teams within the group. These operational risk sub-types have individual detailed risk policies and procedures, but are included within the operational risk management framework and are reported and monitored within the operational risk appetite tolerance. These sub-types include:• Business disruption and operational resilience• Conduct risk• Cyber risk• Data risk• Financial crime risk• Fraud risk• Model risk• Physical security and safety risk• Process failure risk• Regulatory compliance risk• Tax risk• Technology risk• Third party risk.
Link to strategy Risk appetite and tolerance metric Positioning at 31 March 2021
DigitalisationGreater connectivity
We maintain sound operational risk practices to identify and manage operational risk. We monitor the level of acceptable operational risk exposure/loss through qualitative and quantitative measures.
We maintained operational risk losses within risk tolerance levels throughout the year.Further information
Read more on pages 79 to 82
01 Risk disclosures Investec integrated annual report 2021
PRINCIPAL RISKSCONTINUED
17

Conduct riskPrincipal risk description Risk management and key mitigating actions
Conduct risk is the risk that inappropriate behaviours or business activities may lead to client, counterparty or market detriment, erosion of Investec values, culture and ethical standards expected of its staff, or reputational and/or financial damage to the group
• Our approach to conduct risk is driven by our values and philosophies, ensuring that Investec operates with integrity and puts the wellbeing of its clients at the heart of how the business is run
• Products and services are scrutinised and regularly reviewed to identify any issues early on and to make sure they are escalated for appropriate resolution and, where necessary, remedial action
• Investec’s conduct risk policy aims to create an environment for consumer protection and market integrity within the business, supported with the right conduct risk management framework
• Customer and Market Conduct Committees exist in South Africa and the UK, with the objective of ensuring that Investec maintains a client-focused and fair outcomes-based culture.Link to strategy
Greater connectivityFurther information
Read more on page 84
Cyber riskPrincipal risk description Risk management and key mitigating actions
Risk associated with cyber-attacks which can result in data compromise, interruption to business processes or client services, material financial losses, or reputational harm
• Investec manages cyber risk through robust controls that are in place and regularly validated
• The group has a risk-based cyber strategy integrating prediction, prevention, detection and response
• Investec maintains security architecture, which is continually enhanced using advanced technology
• There are cyber controls which are regularly stress tested by internal teams and external specialists
• Coordinated security incident response and crisis management processes are in place• Ongoing security training takes place to ensure high levels of staff awareness and
vigilance• Investec has cyber insurance cover which includes incident response management,
third party liability (including data protection, transmission liabilities, intellectual property infringement, impaired client access), income loss from business disruption and cover for expenses incurred.
Link to strategy
DigitalisationGreater connectivityFurther information
Read more on pages 79 to 82
01 Risk disclosures Investec integrated annual report 2021
PRINCIPAL RISKSCONTINUED
18
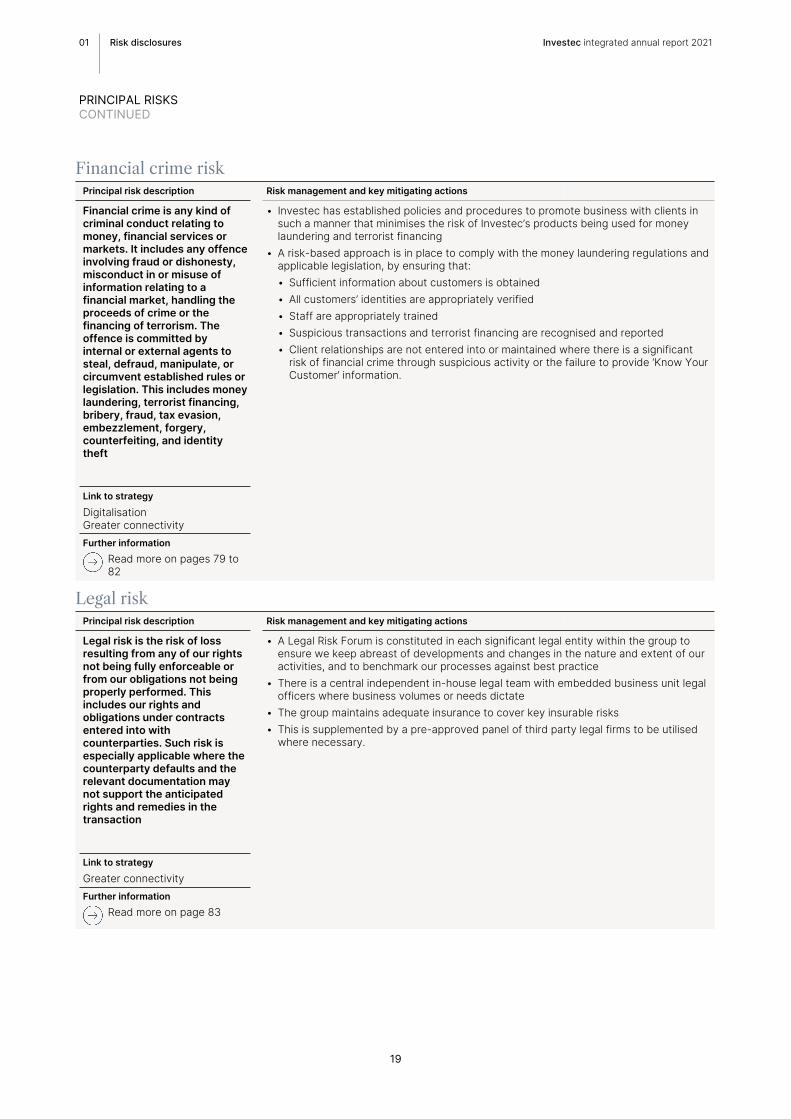
Financial crime riskPrincipal risk description Risk management and key mitigating actions
Financial crime is any kind of criminal conduct relating to money, financial services or markets. It includes any offence involving fraud or dishonesty, misconduct in or misuse of information relating to a financial market, handling the proceeds of crime or the financing of terrorism. The offence is committed by internal or external agents to steal, defraud, manipulate, or circumvent established rules or legislation. This includes money laundering, terrorist financing, bribery, fraud, tax evasion, embezzlement, forgery, counterfeiting, and identity theft
• Investec has established policies and procedures to promote business with clients in such a manner that minimises the risk of Investec’s products being used for money laundering and terrorist financing
• A risk-based approach is in place to comply with the money laundering regulations and applicable legislation, by ensuring that:• Sufficient information about customers is obtained• All customers’ identities are appropriately verified• Staff are appropriately trained• Suspicious transactions and terrorist financing are recognised and reported• Client relationships are not entered into or maintained where there is a significant
risk of financial crime through suspicious activity or the failure to provide ‘Know Your Customer’ information.
Link to strategy
DigitalisationGreater connectivityFurther information
Read more on pages 79 to 82
Legal riskPrincipal risk description Risk management and key mitigating actions
Legal risk is the risk of loss resulting from any of our rights not being fully enforceable or from our obligations not being properly performed. This includes our rights and obligations under contracts entered into with counterparties. Such risk isespecially applicable where the counterparty defaults and the relevant documentation may not support the anticipated rights and remedies in the transaction
• A Legal Risk Forum is constituted in each significant legal entity within the group to ensure we keep abreast of developments and changes in the nature and extent of our activities, and to benchmark our processes against best practice
• There is a central independent in-house legal team with embedded business unit legal officers where business volumes or needs dictate
• The group maintains adequate insurance to cover key insurable risks• This is supplemented by a pre-approved panel of third party legal firms to be utilised
where necessary.
Link to strategy
Greater connectivityFurther information
Read more on page 83
01 Risk disclosures Investec integrated annual report 2021
PRINCIPAL RISKSCONTINUED
19

Business disruption and operational resiliencePrincipal risk description Risk management and key mitigating actions
Risk associated with disruptive incidents which can impact premises, staff, equipment, systems, and key business processes
• Resilience strategies are continuously monitored and enhanced, including relocating impacted businesses to alternate processing sites where appropriate as well as working from home strategies; in addition to leveraging high availability technology solutions
• Implementation and execution of crisis management and crisis communication processes at group as well as business unit level
• Work is underway to analyse new regulatory operational resilience requirements to ensure existing strategies are further enhanced and aligned to regulatory expectations.
Link to strategy
Growth initiativesDigitalisationGreater connectivityFurther information
Read more on pages 79 to 82
People riskPrincipal risk description Risk management and key mitigating actions
The risk that we may be unable to recruit, retain and engage diverse talent across the organisation
• We focus on building a strong, diverse and capable workforce by providing a workplace that stimulates and rewards distinctive performance
• Investec invests significantly in opportunities for the development of all our employees, and in leadership programmes to enable current and future leaders of the group
• There are a number of graduate programmes operating across our organisation sourcing and developing our talent pipeline
• Internal mobility is a valued mechanism for the development and retention of people• Our people and organisation team plays a critical role in assisting the business to
achieve its strategic objectives, which are matched to learning strategies and market trends
• The people and organisation team is mandated to enable the attraction, development and retention of talent who can perform in a manner consistent with our culture and values. The people and organisation team also works with leadership to strengthen the culture of the business, ensure its values are lived, build capability and contribute to the long-term sustainability of the organisation.
Link to strategy
Growth initiativesGreater connectivityFurther information
Read more on pages 134 to 136 in volume one and refer to our 2021 group sustainability and ESG supplementary report on our website.
Regulatory compliance riskPrincipal risk description Risk management and key mitigating actions
The risks of changing legislation, regulation, policies, voluntary codes of practice and their interpretation in the markets in which we operate can have a significant impact on the group’s operations, business prospects, costs, liquidity and capital requirements
• Investec remains focused on achieving the highest levels of compliance to professional standards and integrity in each of our jurisdictions. Our culture is a major component of our compliance framework and is supported by robust policies, processes and talented professionals who ensure that the interests of our stakeholders remain at the forefront of everything we do
• There are independent compliance, legal and risk management functions in each of our core operating jurisdictions, which ensure that the group implements the required processes, practices and policies to adhere to applicable regulations and legislation.
Link to strategy
Greater connectivity Further information
Read more on pages 82 and 84 to 86
01 Risk disclosures Investec integrated annual report 2021
PRINCIPAL RISKSCONTINUED
20

Emerging and other risksIn addition to the principal risks outlined above, the risks below may have the potential to impact and/or influence our principal risks and consequently the operations, financial performance, viability and prospects of the group.
A number of these risks are beyond the group’s control and are considered in our capital plans, stress testing analyses and budget processes, where applicable.
These emerging risks are briefly highlighted below and should be read in the context of our approach to risk management and our overall group risk appetite framework.
Additional risks and uncertainties not presently known to us or that we currently deem immaterial may in the future also negatively impact our business operations.
Emerging and other risks as factored into the board’s viability assessment. Read more on pages 120 to 122 of our viability statement in volume one
Near-term Read morePandemics and widespread public health crises:Pandemics and widespread public health crises, may cause significant volatility in global financial markets, disruptions to commerce and reduced economic activity which could have a significant adverse effect on Investec’s results or operations, reputation and financial condition. There continues to be significant uncertainty resulting from the COVID-19 pandemic, including the depth of the downturn in activity as well as the duration and type of restrictive measures in place within the geographies in which we operate. At the present time it remains difficult to predict the full impact that the pandemic will have on the group. The board and management continue to meet regularly, on a virtual basis, to ensure that all aspects of the challenges posed by COVID-19 are given full attention.
pages 16 to 22 and page 140 in volume one
Fluctuations in exchange rates could have an adverse impact on the group’s results of operations:The group’s reporting currency is Pound Sterling. Certain of our operations are conducted by entities outside the UK. The results of operations and the financial position of individual companies are reported in the local currencies of the countries in which they are domiciled, including Rand, Australian Dollars, Euros and US Dollars. These results are then translated into Pound Sterling at the applicable foreign currency exchange rates for inclusion in the group’s financial statements.
In the case of the income statement, the weighted average rate for the relevant period is applied and, in the case of the balance sheet, the relevant closing rate is used. Exchange rates between local currencies and Pound Sterling have fluctuated substantially over the financial year.
pages 46 and 47 in volume one
IBOR reform:Following the decision by global regulators to phase out IBORs and replace them with alternative reference rates, the group has established a project team to manage the transition of all contracts that could be affected. The group has in place detailed plans, processes and procedures to support the transition in line with both the milestones set by the IBOR working groups in each jurisdiction and the timelines set out in the pre-cessation announcement of the IBOR benchmarks by the Financial Conduct Authority (FCA) in March 2021. During the financial year, the group has already successfully transitioned a portion of new business away from referencing IBOR to referencing alternative rates. Following the progress made to date, the group is confident that it has the operational capability to complete the transition to risk free or other alternative rates. IBOR reform exposes the group to various risks, which the project team is managing and monitoring closely.
pages 75 and 76
Medium-term Read moreMacro-economic and geopolitical risks:The group is subject to inherent risks arising from general macro-economic and geopolitical conditions in the countries in which it operates, including in particular the UK and South Africa, as well as global economic and geopolitical conditions.
pages 16 to 22 in volume one
The group’s borrowing costs and its access to debt capital markets depend significantly on its credit ratings:Rating agencies have, in the past, altered their ratings of all or a majority of the participants in a given industry as a result of the risks affecting that industry. The reduction in the group’s respective banking entities long- or short-term credit ratings could increase their borrowing costs and limit their access to capital markets.
page 14 in volume one
Long-term Read moreThe financial services industry in which the group operates is intensely competitive:The financial services industry is competitive and the group faces substantial competition in all aspects of its business. The group has developed leading positions in many of its core areas of activity, but does not take competition lightly, and our strategic objectives continue to focus on building business depth; providing the best integrated solution to our clients; and leveraging our digitalisation strategy in order to remain competitive.
pages 8 to 13 and pages 16 to 22 in volume one
South Africa’s political environment and outlook for sovereign’s ratings:On 20 November 2020, Moody’s downgraded South Africa’s sovereign rating to Ba2 from Ba1, and maintained the negative outlook. Fitch also downgraded South Africa’s rating, to BB- from BB, and also retained a negative outlook and on the same date S&P confirmed South Africa’s credit rating at BB-, with a stable outlook. Further, on 21 May 2021, both S&P and Fitch affirmed their long-term sovereign credit ratings and outlooks for South Africa. Further, on 21 May 2021, both S&P and Fitch affirmed their long-term sovereign credit ratings and outlooks for South Africa. While South Africa is not alone in having been severely affected by the pandemic, its capacity to mitigate the shock is lower given significant fiscal, economic and social constraints and rising borrowing costs.
pages 54 and 55 for more information on forward-looking macro-economic scenarios
01 Risk disclosures Investec integrated annual report 2021
PRINCIPAL RISKSCONTINUED
21

Investec’s philosophy and approach to risk managementThe group’s comprehensive risk management process involves identifying, quantifying, managing, monitoring, mitigating and reporting the risks associated with each of the businesses to ensure the risks remain within the stated risk appetite.
The board ensures that there are appropriate resources to manage the risks arising from running our businesses. The board has closely monitored developments as a result of the COVID-19 pandemic and receives regular updates. There has been enhanced governance and additional oversight of areas that have been most exposed to the pandemic to date.
The DLC Board Risk and Capital Committee (DLC BRCC) (comprising both executive and non-executive directors) is the board mandated committee to monitor and oversee risk. DLC BRCC meets at least six times per annum and recommends the overall risk appetite for the Investec group to the board for approval.
We monitor and control risk exposure through independent credit, market, liquidity, operational, legal risk, internal audit, capital and compliance teams. This approach is core to assuming a tolerable risk and reward profile, helping us to pursue controlled growth across our business.
Group risk management operates within an integrated geographical and divisional structure, in line with our management approach, ensuring that the appropriate processes are used to address all risks across the group. There are specialist divisions in the UK and Southern Africa and smaller risk divisions in other regions tasked with promoting sound risk management practices.
Risk management units are locally responsive yet globally aware. This helps to ensure that all initiatives and businesses operate within our defined risk parameters and objectives. We continually seek new ways to enhance risk management techniques.
We believe that the risk management systems and processes we have in place are adequate to support the group’s strategy and allow the group to operate within its risk appetite tolerance.
Group risk management objectives are to:• Ensure adherence to our risk management culture• Ensure the business operates within the board-approved
risk appetite• Support the long-term sustainability of the group by
providing an established, independent framework for identifying, evaluating, monitoring and mitigating risk with good customer outcomes
• Set, approve and monitor adherence to risk parameters and limits across the group and ensure they are implemented and adhered to consistently
• Aggregate and monitor our exposure across risk classes• Coordinate risk management activities across the
organisation, covering all legal entities and jurisdictions• Give the board reasonable assurance that the risks we are
exposed to are identified and appropriately managed and controlled
• Resource risk teams suitably and with appropriate expertise and facilitate operating independence
• Run appropriate risk committees, as mandated by the board• Maintain compliance in relation to regulatory requirements.
01 Risk disclosures Investec integrated annual report 2021
RISK MANAGEMENT APPROACH AND FRAMEWORK
22

Risk management framework, committees and forumsA number of committees and forums have oversight over or identify and manage risk at group level, as shown in the diagram below. These committees and forums, mandated by the board, operate together with group risk management, IBL and IBP board committees and sub committees within respective operating jurisdictions. The boards of IBP and IBL, the UK and South African regulated banking subsidiaries of the group respectively, and the boards of IW&I, our regulated wealth subsidiaries, are responsible for the statutory matters and corporate governance for the respective entities, and ensure compliance with the applicable legislation and governance requirements of the jurisdictions within which they operate. The boards and board committees of IBP, IBL and IW&I report to the board and the board committees of the group, with the interconnection between the respective board committees, supported by the membership or attendance of the chair of the group board committee at the respective subsidiary board committee.
Investec Limited and Investec plc board
DLC Audit Committee
DLC Remuneration
Committee
DLC Nominations and Directors
Affairs Committee
(DLC Nomdac)
DLC Board Risk and Capital Committee
(DLC BRCC)
DLC Social and Ethics
Committee (DLC SEC)
DLC Customer Market and
Conduct Committee
DLC IT Risk and Governance Committee
DLC Capital Committee
Group Executive Risk Committee
(Group ERC)
Group ESGExecutive
Committee
In addition to the board committees, highlighted in grey above, further group risk committees and forums exist to support them in their objectives. A summary of these board and group risk committees and forums are detailed below:
• DLC Audit Committee: detail on pages 100 to 110 in volume one• DLC Remuneration Committee: detail on page 159 in volume one• DLC Nominations and Directors Affairs Committee (DLC Nomdac): detail on pages 94 to 96 in volume one• DLC Board Risk and Capital Committee (DLC BRCC): detail on pages 111 to 116 in volume one• DLC Social and Ethics Committee (DLC SEC): detail on pages 97 to 99 in volume one• DLC Capital Committee: mandated and reporting into the DLC BRCC, assists with the management of capital allocation and
structuring, capital planning and models, performance measurement and capital-based incentivisation• DLC Customer Market and Conduct Committee: mandated by the DLC BRCC, ensures the best standards of market conduct
are applied• Group ESG Executive Committee: mandated by the group’s executive directors, reports any relevant matters to DLC SEC and
Group ERC. The main objectives of the committee are to ensure that Investec conducts its business in a responsible manner as well as to manage non-financial risks in relation to environmental, social and governance (ESG) matters incorporating considerations across philanthropy, corporate social investment (CSI), ESG screening, ESG investing, impact investing and the sustainable development goals (SDGs). The committee will review all ESG strategies, policies, management initiatives, targets and performance of Investec major subsidiaries, and the group in its entirety
• Group Executive Risk Forum (Group ERC): mandated and reporting into the DLC BRCC, assists in the review of risk management policies and practices to ensure the adherence to the group risk appetite and opines on matters escalated from IBP and IBL ERCs and IW&I
• DLC IT Risk and Governance Committee: mandated by the DLC BRCC to oversee the sound management of risk inherent in the use of IT, which includes ongoing oversight of technical, security, operational and cyber risks. The objective of the committee is to review, assess, prioritise the response to, and monitor current and emerging technology risk as well as to track the strategic alignment of IT and business.
01 Risk disclosures Investec integrated annual report 2021
RISK MANAGEMENT APPROACH AND FRAMEWORKCONTINUED
23

Credit and counterparty risk managementCredit and counterparty risk arises primarily from three types of transactions:
• Lending transactions, through loans and advances to clients and counterparties, creating the risk that an obligor will be unable or unwilling to repay capital and/or interest on loans and advances granted to them. This category includes bank placements, where we have placed funds with other financial institutions
• Financial instrument transactions, producing issuer risk where payments due from the issuer of a financial instrument may not be received
• Trading transactions, giving rise to settlement and replacement risk (collectively counterparty risk):– Settlement risk is the risk that the
settlement of a transaction does not take place as expected, with one party making required settlements as they fall due but not receiving the performance to which they are entitled
– Replacement risk is the risk following default by the original counterparty resulting in the contract holder having to enter into a replacement contract with a second counterparty in order to fulfil the transaction.
The relevant credit committees will also consider wrong-way risk at the time of granting credit limits to each counterparty. In the banking book environment, wrong-way risk occurs where the value of collateral to secure a transaction, or guarantor, is positively correlated with the probability of default of the borrower or counterparty. For counterparty credit risk resulting from transactions in traded products (such as OTC derivatives), wrong-way risk is defined as exposure to a counterparty that is adversely correlated with the credit quality of that counterparty. It arises when default risk and credit exposure increase together.
Credit and counterparty risk may also arise in other ways and it is the role of the risk management functions and the various independent credit committees to identify risks falling outside these definitions.
Credit and counterparty risk governance structure
To manage, measure, monitor and mitigate credit and counterparty risk, independent credit committees exist in the UK, South Africa as well as in other
relevant jurisdictions such as Mauritius. These committees also have oversight of regions where we assume credit risk and operate under board-approved delegated limits, policies and procedures. There is a high level of executive involvement and oversight in the credit decision-making forums depending on the size and complexity of the deal. It is our policy that all credit committees comprise voting members who are independent of the originating business unit. All decisions to enter into a transaction are based on unanimous consent.
In addition to the credit committees, the following processes assist in managing, measuring and monitoring credit and counterparty risk:
• Day-to-day arrears management and regular arrears reporting ensure that individual positions and any potential trends are dealt with in a timely manner
• Watchlist Forums in the UK and South Africa and additionally the Arrears, Default and Recovery Forum (ADR forum) in South Africa review the management of distressed loans, potential problem loans and exposures in arrears that require additional attention and supervision. These committees review ECL impairments and staging at an asset level as well as potential fair value adjustments to loans and advances to customers. They provide recommendations for the appropriate staging and level of ECL impairment where appropriate
• The Forbearance Forum in the UK reviews and monitors counterparties who have been granted forbearance measures
• Impairment Decision Committees in the UK and South Africa review recommendations from underlying Watchlist Forums and ADR Forums respectively and consider and approve the appropriate level of ECL impairments and staging
• The Models Forum in the UK and the Model Review Forum in South Africa provide an internal screening and validation process for credit models. We have established independent model validation teams who review the models and provide feedback on the accuracy and operation of the models and note items for further development through the forum.
Credit committees and the processes above have incorporated considerations and decisions with respect to the COVID-19 pandemic and resulting relief
measures, staging and ECL in line with the group’s existing governance.
Credit and counterparty risk appetiteThe board has set risk appetite limit frameworks which regulate the maximum exposures we would be comfortable to tolerate in order to diversify and mitigate risk. These limit frameworks, approved at least annually, are monitored on an ongoing basis by IBL BRCC, IBP BRCC, DLC BRCC and the respective boards. Should there be any breaches to limits, or where exposures are nearing limits, these exceptions are specifically highlighted for attention, with remedial actions agreed.
Our assessment of our clients and counterparties includes consideration of their character, integrity, core competencies, track record and financial strength. A strong emphasis is placed on the historic and ongoing stability of income and cash flow streams generated by the clients. Our primary assessment method is therefore the ability of the client to meet their payment obligations.
Target clients include high net worth and/or high-income individuals, professionally qualified individuals, established corporates, small and medium-sized enterprises, financial institutions and sovereigns. Corporates should demonstrate scale and relevance in their market, an experienced management team, able board members, strong earnings and cash flow. Direct exposures to cyclical industries and start-up ventures are generally avoided.
We are client-centric in our approach and originate loans mainly with the intent of holding these assets to maturity, thereby developing a ‘hands-on’ and long-standing relationship.
Interbank lending is largely reserved for those banks and institutions in the group’s core geographies of activity, which are systemic and highly rated.
01 Risk disclosures Investec integrated annual report 2021
CREDIT RISK MANAGEMENT
24

Concentration riskConcentration risk is when large exposures exist to a single client or counterparty, group of connected counterparties, or to a particular geography, asset class or industry. An example of this would be where a number of counterparties are affected by similar economic, legal, regulatory or other factors that could mean their ability to meet contractual obligations are correlated.
Credit and counterparty risk is always assessed with reference to the aggregate exposure to a single counterparty or group of related parties to manage concentration risk. In order to manage concentration, we will consider a sell-down of exposures to market participants.
Concentration risk can also exist where portfolio loan maturities are clustered to single periods in time. Loan maturities are monitored on a portfolio and a transaction level by group risk management, group lending operations as well as the originating business units.
Country riskCountry risk refers to the risk of lending to a counterparty operating in a particular country or the risk inherent in a sovereign exposure, i.e. the risk of exposure to loss caused by events in that country. Country risk covers all forms of lending or investment activity whether to/with individuals, corporates, banks or governments. This can include geopolitical risks, transfer and convertibility risks, and the impact on the borrower’s credit profile due to local economic and political conditions.
To mitigate country risk, there is a preference for primary exposure in the group’s main operating geographies. The group will accept exposures where we have a branch or local banking subsidiary, and tolerate exposures to other countries where we are facilitating a transaction for a client who requires facilities in a foreign geography and where we have developed a local understanding and capability.
The group’s credit risk appetite with regard to country risk is characterised by the following principles:
• Preference is to have exposure only to politically stable jurisdictions that we understand and have preferably operated in before
• There is little specific appetite for exposures outside of the group’s pre-existing core geographies or target markets
• The legal environment should be tested, have legal precedent in line with OECD standards and have good corporate governance
• In certain cases, country risk can be mitigated by taking out political risk insurance with suitable counterparties where deemed necessary and where considered economic.
While we do not have a separate country risk committee, the relevant credit committees as well as investment committees, IBL ERC, IBP ERC and where necessary, Group ERC will consider, analyse and assess the appropriate foreign jurisdiction limits.
Environmental, social and governance (ESG) risk and climate riskWe integrate ESG considerations into our day-to-day operations and credit decision-making. The greatest socio-economic and environmental impact we can have is to partner with our clients and stakeholders to accelerate a cleaner, more resilient and inclusive world.
We are committed to respecting human rights and support internationally recognised principles, guidelines and voluntary standards dealing with ESG.
We support the key provisions of the Equator Principles (EP). All transactions in non-designated countries are EP monitored and compliant. We report on these in our sustainability and ESG supplementary report on our website. We have a number of group policies that also guide credit decision-making from an ESG perspective and we made our group fossil fuel policy public on 31 March 2020. ESG considerations are considered by the credit committee or investment committee when making lending or investment decisions. Higher risk transactions are escalated for assessment by the group’s ESG specialists.
In particular, the following ESG factors are taken into account when assessing each transaction:
• Environmental considerations (including animal welfare and climate-related impacts)
• Social considerations (including human rights)
• Macro-economic considerations (including poverty, growth and unemployment).
Stress testing and portfolio managementThe Investec group’s stress testing framework is designed to identify and assess vulnerabilities under stress. The process comprises a bottom-up analysis of the group’s material business activities, incorporating views from risk management teams, business and the executive. Stress scenarios are designed based on findings from the bottom-up process, taking into consideration the broader macro-economic, political risk backdrop and impacts of COVID-19.
These Investec-specific stress scenarios form an integral part of our capital planning process and IFRS 9 reporting.The stress testing process also informs the risk appetite review process, and the management of risk appetite limits and is a key risk management tool of the group. This process allows the group to identify underlying risks and manage them accordingly.
The group also performs ad hoc stress tests and reverse stress testing. Ad hoc stress tests are conducted in response to any type of material and/or emerging risks, with reviews undertaken of impacted portfolios to assess any migration in quality and highlight any vulnerabilities, identify portfolio concentrations and make appropriate recommendations such as a reduction in risk appetite limits. Reverse stress tests are conducted to stress the group’s business plan to failure and consider a broad variety of extreme and remote events.
Reviews are also undertaken of all material businesses, where the portfolios are analysed to assess any migration in portfolio quality, highlight any vulnerabilities, identify portfolio concentrations and make appropriate recommendations, such as a reduction in risk appetite limits or specific exposures.
01 Risk disclosures Investec integrated annual report 2021
CREDIT RISK MANAGEMENTCONTINUED
25

Management and measurement of credit and counterparty risk
Fundamental principles employed in the management of credit and counterparty risk include:
• A clear definition of our target market• A quantitative and qualitative
assessment of the creditworthiness of our counterparties
• Analysis of risks, including concentration risk (concentration risk considerations include asset class, industry, counterparty and geographical concentration)
• Decisions being made with reference to risk appetite limits
• Prudential limits• Regular monitoring and review of
existing and potential exposures once facilities have been approved
• A high level of executive involvement in decision-making with non-executive review and oversight
• Portfolio reviews and stress testing.
Within the credit approval process, internal and external ratings are included in the assessment of client quality.
A large proportion of the group’s portfolio is not rated by external rating agencies. We place reliance upon internal consideration of counterparties and borrowers and use ratings prepared externally where available to support our decision-making process.
Regular reporting of credit and counterparty risk exposures within our operating units are made to management, the executives and the board through the DLC BRCC, IBP BRCC and IBL BRCC. The board reviews and approves the appetite for credit and counterparty risk, which is documented in risk appetite statements and policy documents. This is implemented and reviewed by the credit risk management teams in each jurisdiction.
Portfolio reviews and stress testing are undertaken on all material businesses, where the exposures are analysed to assess any migration in portfolio quality, highlight any vulnerabilities, identify portfolio concentrations and make appropriate recommendations, such as a reduction in risk appetite limits or specific exposures.
Credit and counterparty risk – nature of activitiesCredit and counterparty risk is assumed through a range of client-driven lending activities to private and corporate clients as well as other counterparties, such as financial institutions and sovereigns.
These activities are diversified across a number of business activities.
• Core loans and advances: the majority of credit and counterparty risk is through core loans and advances, which account for almost all ECL allowances across our portfolio, which are detailed on pages 28 to 40
• Treasury function: there are also certain exposures, outside of core loans and advances, where we assume credit and counterparty risk. These arise primarily from treasury placements where the treasury function, as part of the daily management of the group’s liquidity, places funds with central banks and other commercial banks and financial institutions. These transactions are typically short-term (less than one month) money market placements or secured repurchase agreements. These market counterparties are mainly investment grade rated entities that occupy dominant and systemic positions in their domestic banking markets and internationally. These counterparties are located mainly in the UK, Western Europe, Asia, North America, Southern Africa and Australia.
In addition, credit and counterparty risk arises through the following exposures:
• Customer trading activities to facilitate hedging of client risk positions: our customer trading portfolios consist of derivative contracts in interest rates, foreign exchange, commodities, credit derivatives and equities that are entered into, to facilitate a client’s hedging requirements. The counterparties to such transactions are typically corporates, in particular where they have an exposure to interest rates or foreign exchange due to operating in sectors that include imports and exports of goods and services. These positions are marked-to-market, typically with daily margin calls to mitigate credit exposure in the event of counterparty default
• Structured credit: these are bonds secured against a pool of assets, mainly UK residential mortgages or European or US corporate leverage loans. The bonds are typically highly rated (single ‘A’ and above), which benefit from a high level of credit subordination and can withstand a significant level of portfolio default
• Debt securities: from time to time we take on exposures by means of corporate debt securities rather than loan exposures. These transactions arise on the back of client
relationships or knowledge of the corporate market and are based on our analysis of the credit fundamentals
• Corporate advisory and investment banking activities: counterparty risk in this area is modest. The business also trades shares on an approved basis and, in the UK, makes markets in shares where we are appointed corporate broker under pre-agreed market risk limits. Settlement trades are largely on a delivery versus payment basis, through major stock exchanges. Credit risk only occurs in the event of counterparty failure and would be linked to any fair value losses on the underlying security
• Wealth & Investment: primarily an agency business with a limited amount of principal risk. Its core business is discretionary investment management services. Settlement risk can arise due to undertaking transactions in an agency capacity on behalf of clients. However, the risk is not considered to be material as most transactions are undertaken on recognised exchanges, with large institutional clients, monitored daily, with trades usually settled within two to three days.
Credit risk mitigation
Credit risk mitigation techniques can be defined as all methods by which the group seeks to decrease the credit risk associated with an exposure. The Investec group considers credit risk mitigation techniques as part of the credit assessment of a potential client or business proposal and not as a separate consideration of mitigation of risk. Credit risk mitigants can include any collateral item over which the group has a charge over assets, netting and margining agreements, covenants, or terms and conditions imposed on a borrower with the aim of reducing the credit risk inherent to that transaction.
As the group has limited appetite for unsecured debt, the credit risk mitigation technique most commonly used is the taking of collateral, with a strong preference for tangible assets. Collateral is assessed with reference to the sustainability of value and the likelihood of realisation.
Acceptable collateral generally exhibits characteristics that allow for it to be easily identified and appropriately valued and assists the group to recover outstanding exposures.
Where a transaction is supported by a mortgage or charge over property, the primary credit risk is still taken on the
01 Risk disclosures Investec integrated annual report 2021
CREDIT RISK MANAGEMENTCONTINUED
26

borrower. In addition, the relevant credit committee normally requires a suretyship or guarantee in support of a transaction in our private client business.
For property-backed lending we also consider the client’s overall balance sheet. The following characteristics of the property are also considered; the type of property; its location; and the ease with which the property could be relet and/or resold. Where the property is secured by lease agreements: the credit committee prefers not to lend for a term beyond the maximum term of the lease. Commercial real estate generally takes the form of good quality property often underpinned by strong third party leases. Residential property is also generally of a high quality and based in desirable locations. Residential and commercial property valuations will continue to form part of our ongoing focus on collateral assessment. It is our policy to obtain a formal valuation of every commercial property offered as collateral for a lending facility before advancing funds. Residential properties are valued by desktop valuation and/or approved valuers, where appropriate.
Other common forms of collateral in the retail asset class are motor vehicles, cash and share portfolios. Primary collateral in private client lending transactions can also include a high net worth individual’s share/investment portfolio. This is typically in the form of a diversified pool of equity, fixed income, managed funds and cash. Often these portfolios are managed by Investec Wealth & Investment. Lending against investment portfolios is typically geared at conservative loan-to-value (LTV) ratios, after considering the quality, diversification, risk profile and liquidity of the portfolio.
Our corporate, government and institutional clients provide a range of collateral including cash, corporate assets, debtors (accounts receivable), trading stock, debt securities (bonds), listed and unlisted shares and guarantees.
The majority of credit mitigation techniques linked to trading activity is in the form of netting agreements and daily margining. Primarily, the market standard legal documents that govern this include the International Swaps and Derivatives Association (ISDA) Master Agreements, Global Master Securities Lending Agreement (GMSLA) and Global Master Repurchase Agreement (GMRA). In addition to having ISDA documentation in place with market and trading counterparties in over-the-counter (OTC) derivatives, the credit
committee may require a Credit Support Annex (CSA) to ensure that mark-to-market credit exposure is mitigated daily through the calculation and placement/receiving of cash collateral. Where netting agreements have been signed, the enforceability is supported by an external legal opinion within the legal jurisdiction of the agreement.
Set-off is applied between assets, subject to credit risk and related liabilities in the annual financial statements, where:
• A legally enforceable right to set-off exists
• There is the intention to settle the asset and liability on a net basis, or to realise the asset and settle the liability simultaneously.
In addition to the above accounting set-off criteria, banking regulators impose the following additional criteria:
• Debit and credit balances relate to the same obligor/counterparty
• Debit and credit balances are denominated in the same currency and have identical maturities
• Exposures subject to set-off are risk-managed on a net basis
• Market practice considerations.
For this reason, there will be instances where credit and counterparty exposures are displayed on a net basis in these annual financial statements but reported on a gross basis to regulators.
The group places minimal reliance on credit derivatives in its credit risk mitigation techniques. Periodically the group will enter into Credit Default Swaps (CDS) in order to hedge a specific asset held or to create a more general or macro hedge against a group of exposures in one industry or geography. In these instances, the group is deemed to be ‘buying protection’ against the assets. Depending on the perceived risk, or ‘spread’, of the underlying exposure, the CDS will fluctuate in value; increasing in value when the asset has become more risky and decreasing when risk has reduced. Occasionally, the group will enter into trading/investment CDS positions where we buy protection or sell protection without owning the underlying asset. The total amount of net credit derivatives outstanding at 31 March 2021 amounts to -£0.8 million, of which all is used for credit mitigation purposes. Total protection bought amounts to -£0.6 million and total protection sold amounts to -£0.2 million relating to credit derivatives used in credit mitigation.
Further information on credit derivatives is provided on page 94 in volume three
The group implements robust processes to minimise the possibility of legal and/or operational risk through good quality tangible collateral. The legal risk function ensures the enforceability of credit risk mitigants within the laws applicable to the jurisdictions in which the group operates. When assessing the potential concentration risk in its credit portfolio, consideration is given to the types of collateral and credit protection that form part of the portfolio.
01 Risk disclosures Investec integrated annual report 2021
CREDIT RISK MANAGEMENTCONTINUED
27
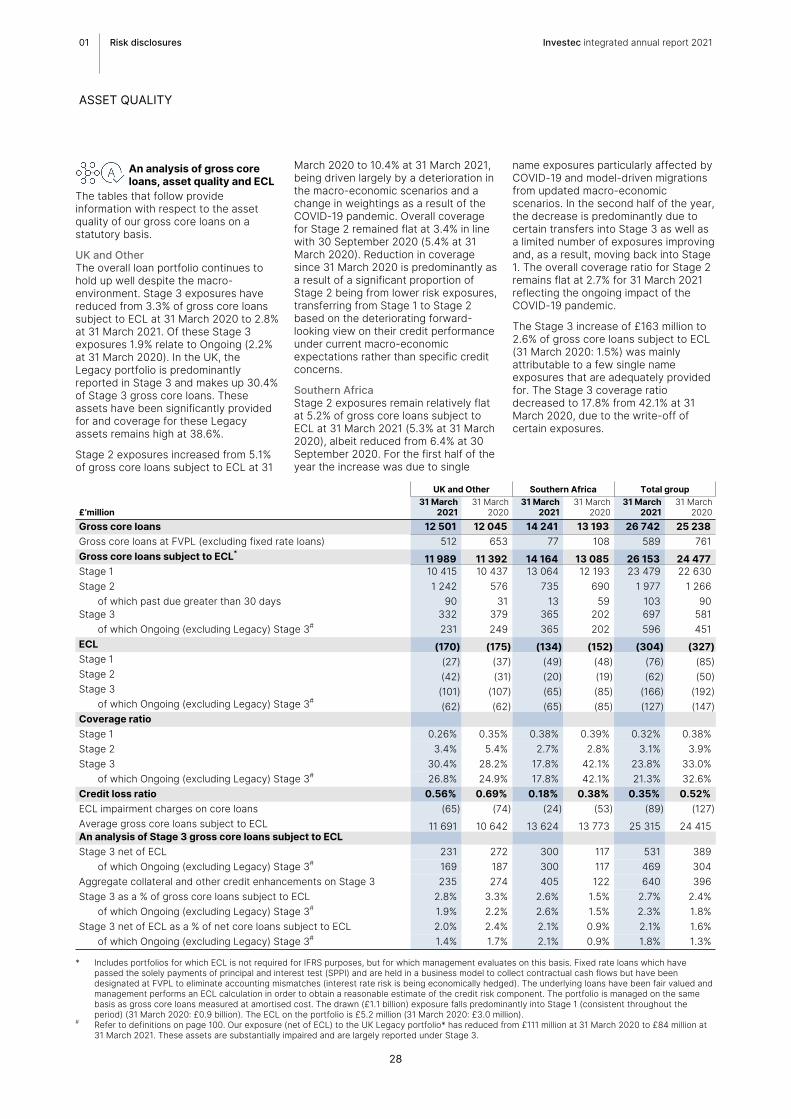
An analysis of gross core loans, asset quality and ECL
The tables that follow provide information with respect to the asset quality of our gross core loans on a statutory basis.
UK and Other The overall loan portfolio continues to hold up well despite the macro-environment. Stage 3 exposures have reduced from 3.3% of gross core loans subject to ECL at 31 March 2020 to 2.8% at 31 March 2021. Of these Stage 3 exposures 1.9% relate to Ongoing (2.2% at 31 March 2020). In the UK, the Legacy portfolio is predominantly reported in Stage 3 and makes up 30.4% of Stage 3 gross core loans. These assets have been significantly provided for and coverage for these Legacy assets remains high at 38.6%.
Stage 2 exposures increased from 5.1% of gross core loans subject to ECL at 31
March 2020 to 10.4% at 31 March 2021, being driven largely by a deterioration in the macro-economic scenarios and a change in weightings as a result of the COVID-19 pandemic. Overall coverage for Stage 2 remained flat at 3.4% in line with 30 September 2020 (5.4% at 31 March 2020). Reduction in coverage since 31 March 2020 is predominantly as a result of a significant proportion of Stage 2 being from lower risk exposures, transferring from Stage 1 to Stage 2 based on the deteriorating forward-looking view on their credit performance under current macro-economic expectations rather than specific credit concerns.
Southern AfricaStage 2 exposures remain relatively flat at 5.2% of gross core loans subject to ECL at 31 March 2021 (5.3% at 31 March 2020), albeit reduced from 6.4% at 30 September 2020. For the first half of the year the increase was due to single
name exposures particularly affected by COVID-19 and model-driven migrations from updated macro-economic scenarios. In the second half of the year, the decrease is predominantly due to certain transfers into Stage 3 as well as a limited number of exposures improving and, as a result, moving back into Stage 1. The overall coverage ratio for Stage 2 remains flat at 2.7% for 31 March 2021 reflecting the ongoing impact of the COVID-19 pandemic.
The Stage 3 increase of £163 million to 2.6% of gross core loans subject to ECL (31 March 2020: 1.5%) was mainly attributable to a few single name exposures that are adequately provided for. The Stage 3 coverage ratio decreased to 17.8% from 42.1% at 31 March 2020, due to the write-off of certain exposures.
UK and Other Southern Africa Total group
£’million31 March
202131 March
202031 March
202131 March
202031 March
202131 March
2020Gross core loans 12 501 12 045 14 241 13 193 26 742 25 238 Gross core loans at FVPL (excluding fixed rate loans) 512 653 77 108 589 761 Gross core loans subject to ECL*
11 989 11 392 14 164 13 085 26 153 24 477 Stage 1 10 415 10 437 13 064 12 193 23 479 22 630 Stage 2 1 242 576 735 690 1 977 1 266
of which past due greater than 30 days 90 31 13 59 103 90 Stage 3 332 379 365 202 697 581
of which Ongoing (excluding Legacy) Stage 3# 231 249 365 202 596 451 ECL (170) (175) (134) (152) (304) (327) Stage 1 (27) (37) (49) (48) (76) (85) Stage 2 (42) (31) (20) (19) (62) (50) Stage 3 (101) (107) (65) (85) (166) (192)
of which Ongoing (excluding Legacy) Stage 3# (62) (62) (65) (85) (127) (147)
Coverage ratioStage 1 0.26% 0.35% 0.38% 0.39% 0.32% 0.38% Stage 2 3.4% 5.4% 2.7% 2.8% 3.1% 3.9% Stage 3 30.4% 28.2% 17.8% 42.1% 23.8% 33.0%
of which Ongoing (excluding Legacy) Stage 3# 26.8% 24.9% 17.8% 42.1% 21.3% 32.6% Credit loss ratio 0.56% 0.69% 0.18% 0.38% 0.35% 0.52% ECL impairment charges on core loans (65) (74) (24) (53) (89) (127) Average gross core loans subject to ECL 11 691 10 642 13 624 13 773 25 315 24 415 An analysis of Stage 3 gross core loans subject to ECLStage 3 net of ECL 231 272 300 117 531 389
of which Ongoing (excluding Legacy) Stage 3# 169 187 300 117 469 304 Aggregate collateral and other credit enhancements on Stage 3 235 274 405 122 640 396 Stage 3 as a % of gross core loans subject to ECL 2.8% 3.3% 2.6% 1.5% 2.7% 2.4%
of which Ongoing (excluding Legacy) Stage 3# 1.9% 2.2% 2.6% 1.5% 2.3% 1.8% Stage 3 net of ECL as a % of net core loans subject to ECL 2.0% 2.4% 2.1% 0.9% 2.1% 1.6%
of which Ongoing (excluding Legacy) Stage 3# 1.4% 1.7% 2.1% 0.9% 1.8% 1.3%
* Includes portfolios for which ECL is not required for IFRS purposes, but for which management evaluates on this basis. Fixed rate loans which have passed the solely payments of principal and interest test (SPPI) and are held in a business model to collect contractual cash flows but have been designated at FVPL to eliminate accounting mismatches (interest rate risk is being economically hedged). The underlying loans have been fair valued and management performs an ECL calculation in order to obtain a reasonable estimate of the credit risk component. The portfolio is managed on the same basis as gross core loans measured at amortised cost. The drawn (£1.1 billion) exposure falls predominantly into Stage 1 (consistent throughout the period) (31 March 2020: £0.9 billion). The ECL on the portfolio is £5.2 million (31 March 2020: £3.0 million).
# Refer to definitions on page 100. Our exposure (net of ECL) to the UK Legacy portfolio* has reduced from £111 million at 31 March 2020 to £84 million at 31 March 2021. These assets are substantially impaired and are largely reported under Stage 3.
01 Risk disclosures Investec integrated annual report 2021
ASSET QUALITY
28

An analysis of staging and ECL movements for core loans subject to ECL
The table below indicates underlying movements in gross core loans subject to ECL from 31 March 2020 to 31 March 2021. The transfers between stages of gross core loans indicate the impact of stage transfers upon the gross exposure and associated opening ECL. The increase in transfers into Stage 2 was almost all driven by the deteriorated economic outlook and corresponding probability of default (PD) deterioration in the loan book resulting in a model-driven significant increase in credit risk (SICR) for these exposures. Transfers into Stage 3 relate to select single name exposures across varying sectors in the South African book. In the UK there was no uptick in transfers into Stage 3 as a proportion of the opening book, reflecting limited new defaults experienced to date supported in part by government measures in place.
The net remeasurement of ECL arising from stage transfers represents the (increase)/decrease in ECL due to these transfers. New lending net of repayments comprises new originations, further drawdowns, repayments and sell-downs as well as ECLs in Stage 3 that have been written off, typically when an asset has been sold. In South Africa, there have been a number of large repayments in Stage 1 which have been slightly offset by further advances and new lending with lower ECLs.
The ECL impact of changes to risk parameters and models during the year largely relates to the deterioration in the macro-economic scenarios and relative weightings as a result of the COVID-19 pandemic as well as certain overlays in the UK. The foreign exchange and other category largely comprises the impact on the closing balance as a result of movements and translations in foreign exchange rates since the opening date, 31 March 2020.
Stage 1 Stage 2 Stage 3 Total
£’millionGross
exposure ECLGross
exposure ECLGross
exposure ECLGross
exposure ECL
At 31 March 2019 22 683 (43) 1 149 (50) 521 (200) 24 353 (293) Transfer from Stage 1 (752) 1 622 (1) 130 — — — Transfer from Stage 2 266 (4) (359) 6 93 (2) — — Transfer from Stage 3 18 (2) 4 — (22) 2 — — ECL remeasurement arising from transfer of stage — 5 — 1 — (54) — (48) New lending net of repayments (includes assets written off) 2 417 (8) (67) 1 (111) 52 2 239 45 Changes to risk parameters and models — (38) — (9) — (4) — (51) Foreign exchange and other (2 002) 4 (83) 2 (30) 14 (2 115) 20 At 31 March 2020 22 630 (85) 1 266 (50) 581 (192) 24 477 (327) Transfer from Stage 1 (1 472) 6 1 374 (5) 98 (1) — — Transfer from Stage 2 360 (6) (591) 17 231 (11) — — Transfer from Stage 3 13 (2) 11 (1) (24) 3 — — ECL remeasurement arising from transfer of stage — 6 — (16) — (32) — (42) New lending net of repayments (includes assets written off) 1 075 (7) (110) 6 (200) 76 765 75 Changes to risk parameters and models — 15 — (12) — (4) — (1) Foreign exchange and other 873 (3) 27 (1) 11 (5) 911 (9) At 31 March 2021 23 479 (76) 1 977 (62) 697 (166) 26 153 (304)
01 Risk disclosures Investec integrated annual report 2021
ASSET QUALITYCONTINUED
29

An analysis of credit quality by internal rating grade
The group uses a 25-grade internal rating scale which measures the risk of default to an exposure without taking into account any credit mitigation, such as collateral. This internal rating scale allows the group to measure credit risk consistently across portfolios. The internal rating scale is derived from a mapping to PDs and can also be mapped to external rating agency scales.
PD range Investec internal rating scale Indicative external rating scale
less than 0.538% IB01 – IB12 AAA to BBB- 0.538% – 6.089% IB13 – IB19 BB+ to B-
greater than 6.089% IB20 – IB25 B- and belowStage 3 D
The internal credit rating distribution below is based on the 12-month PD at 31 March 2021 for gross core loans subject to ECL by stage. The staging classifications are not only driven by the absolute PD, but on factors that determine a significant increase in credit risk, including relative movement in PD since origination. There is therefore no direct correlation between the credit quality of an exposure and its stage classification as shown in the table below:
At 31 March 2021
£’million IB01-IB12 IB13-IB19 IB20-IB25 Stage 3 Total
Gross core loans subject to ECL 12 192 12 385 879 697 26 153 Stage 1 12 002 10 847 630 — 23 479 Stage 2 190 1 538 249 — 1 977 Stage 3 — — — 697 697 ECL (13) (94) (31) (166) (304) Stage 1 (8) (55) (13) — (76) Stage 2 (5) (39) (18) — (62) Stage 3 — — — (166) (166) Coverage ratio 0.1% 0.8% 3.5% 23.8% 1.2%
At 31 March 2020
£’million IB01-IB12 IB13-IB19 IB20-IB25 Stage 3 Total
Gross core loans subject to ECL 10 988 11 930 979 581 24 477 Stage 1 10 853 11 067 711 — 22 630 Stage 2 135 864 268 — 1 266 Stage 3 — — — 581 581 ECL (23) (81) (31) (192) (327) Stage 1 (19) (56) (10) — (85) Stage 2 (4) (25) (21) — (50) Stage 3 — — — (192) (192) Coverage ratio 0.2% 0.7% 3.2% 33.0% 1.3%
In the prior year, the disclosure of the exposure by stage and rating bucket was done by using the one-year point-in-time PDs and converted to ratings by mapping from a PD master scale. This application resulted in the following disclosure at 31 March 2020:
At 31 March 2020
£’million IB01-IB12 IB13-IB19 IB20-IB25 Stage 3 Total
Gross core loans subject to ECL 11 570 11 623 703 581 24 477 Stage 1 11 212 10 832 586 — 22 630 Stage 2 358 791 117 — 1 266 Stage 3 — — — 581 581 ECL (17) (95) (23) (192) (327) Stage 1 (9) (68) (8) — (85) Stage 2 (8) (27) (15) — (50) Stage 3 — — — (192) (192) Coverage ratio 0.1% 0.8% 3.3% 33.0% 1.3%
01 Risk disclosures Investec integrated annual report 2021
ASSET QUALITYCONTINUED
30

An analysis of total gross core loans by country of exposure31 March 2021 31 March 2020£26 742 million £25 238 million
n South Africa 48.3% n South Africa 46.8%
n United Kingdom 39.9% n United Kingdom 38.2%
n Europe (excluding UK) 4.1% n Europe (excluding UK) 4.9%
n North America 3.0% n North America 3.0%
n Africa (excluding RSA) 1.4% n Africa (excluding RSA) 1.5%
n Asia 1.1% n Asia 1.0%
n Australia 1.0% n Australia 2.7%
n Europe (Non-EU) 0.8% n Europe (Non-EU) 0.7%
n Other 0.4% n Other 1.2%
An analysis of core loans by risk category – Lending collateralised by property
Client quality and expertise are at the core of our credit philosophy. We provide senior debt and other funding for property transactions, with a strong preference for income producing assets supported by an experienced sponsor providing a material level of cash equity investment into the asset. Our exposure to the property market is well diversified with strong bias towards prime locations for residential exposure and focus on tenant quality and income diversity for commercial assets. Debt service cover ratios are a key consideration in the lending process supported by reasonable loan-to-security value ratios.
Year in reviewIn the UK, lending collateralised by property totalled £2.1 billion or 16.8% of
UK net core loans at 31 March 2021, which remains in line with the group’s risk appetite to maintain a reduced proportion of net core loan exposures in property related lending.
New lending is largely against income-producing commercial and residential properties at conservative LTVs. The bulk of property collateralised assets are located in the UK. The Ongoing portfolio has performed well despite COVID-19 and we have continued to see good activity from our existing clients particularly in the second half of the year, supported in part by stamp duty changes in the UK.
The portfolio has diverse underlying assets, limited direct exposure to retail and hotel and leisure properties and experienced sponsors behind the exposures. Underwriting criteria remains conservative and we are committed to
following a client-centric approach to lending, only supporting counterparties with strong balance sheets and requisite expertise.
In South Africa, the majority of the property assets are commercial investment properties and are located in South Africa. This portfolio grew by 1.7% to R46.6 billion at 31 March 2021 and is in line with our risk appetite. As a result of the COVID-19 pandemic, we continue to proactively engage with clients and monitor the effects on our portfolio closely, particularly in the sub-sectors most affected to date which include hotels due the temporary closure of businesses in the hospitality industry and hotels not functioning at full capacity. LTVs remain conservative in this portfolio and transactions are generally supported by strong cash flows.
01 Risk disclosures Investec integrated annual report 2021
ASSET QUALITYCONTINUED
31

Lending collateralised by property – Total group
Gross core loans at amortised cost, FVOCI and FVPL (subject to ECL)
Gross coreloans at
FVPL (notsubject to
ECL)
Grosscore
loans
Stage 1 Stage 2 Stage 3 Total
£’millionGross
exposure ECLGross
exposure ECLGross
exposure ECLGross
exposure ECL
At 31 March 2021Commercial real estate 3 403 (11) 273 (7) 245 (38) 3 921 (56) 19 3 940 Commercial real estate – investment 2 986 (10) 251 (6) 237 (34) 3 474 (50) 15 3 489 Commercial real estate – development 378 (1) 13 — 1 (1) 392 (2) 4 396 Commercial vacant land and planning 39 — 9 (1) 7 (3) 55 (4) — 55 Residential real estate 991 (2) 23 — 78 (30) 1 092 (32) 11 1 103 Residential real estate – investment 501 (1) 3 — 24 (7) 528 (8) 9 537 Residential real estate – development 443 (1) 20 — 23 (5) 486 (6) — 486 Residential vacant land and planning 47 — — — 31 (18) 78 (18) 2 80 Total lending collateralised by property 4 394 (13) 296 (7) 323 (68) 5 013 (88) 30 5 043 Coverage ratio 0.30% 2.4% 21.1% 1.8% At 31 March 2020*Commercial real estate 3 223 (16) 164 (12) 150 (17) 3 537 (45) 42 3 579 Commercial real estate – investment 2 808 (15) 158 (11) 147 (17) 3 113 (43) 38 3 151 Commercial real estate – development 377 (1) — — 3 — 380 (1) 4 384 Commercial vacant land and planning 38 — 6 (1) — — 44 (1) — 44 Residential real estate 927 (2) 15 — 109 (39) 1 051 (41) 30 1 081 Residential real estate – investment 393 (1) 8 — 36 (12) 437 (13) 28 465 Residential real estate – development 506 (1) 5 — 38 (8) 549 (9) — 549 Residential vacant land and planning 28 — 2 — 35 (19) 65 (19) 2 67 Total lending collateralised by property 4 150 (18) 179 (12) 259 (56) 4 588 (86) 72 4 660 Coverage ratio 0.43% 6.7% 21.6% 1.9%
* During the current financial year, the risk appetite classifications were reviewed and, where necessary, amended to ensure that the classifications align with how the underlying portfolios and associated credit risk is managed and that they are consistent with the risk appetite framework and the internal risk management approach of the bank.
01 Risk disclosures Investec integrated annual report 2021
ASSET QUALITYCONTINUED
32

Lending collateralised by property – UK and Other
Gross core loans at amortised cost and FVOCI
Gross coreloans at
FVPL
Grosscore
loans
Stage 1 Stage 2 Stage 3 Total
£’millionGross
exposure ECLGross
exposure ECLGross
exposure ECLGross
exposure ECL
At 31 March 2021Commercial real estate 1 126 — 134 (4) 137 (25) 1 397 (29) 19 1 416 Commercial real estate – investment 910 — 118 (3) 130 (21) 1 158 (24) 15 1 173 Commercial real estate – development 211 — 10 — 1 (1) 222 (1) 4 226 Commercial vacant land and planning 5 — 6 (1) 6 (3) 17 (4) — 17 Residential real estate 614 — 12 — 73 (29) 699 (29) 11 710 Residential real estate – investment 315 — 3 — 19 (6) 337 (6) 9 346 Residential real estate – development 287 — 9 — 23 (5) 319 (5) — 319 Residential vacant land and planning 12 — — — 31 (18) 43 (18) 2 45 Total lending collateralised by property 1 740 — 146 (4) 210 (54) 2 096 (58) 30 2 126 Coverage ratio 0.00% 2.7% 25.7% 2.8% At 31 March 2020Commercial real estate 983 (1) 105 (12) 125 (12) 1 213 (25) 42 1 255 Commercial real estate – investment 803 (1) 99 (11) 122 (12) 1 024 (24) 38 1 062 Commercial real estate – development 180 — — — 3 — 183 — 4 187 Commercial vacant land and planning — — 6 (1) — — 6 (1) — 6 Residential real estate 607 — 12 — 108 (39) 727 (39) 30 757 Residential real estate – investment 253 — 8 — 36 (12) 297 (12) 28 325 Residential real estate – development 354 — 3 — 38 (8) 395 (8) — 395 Residential vacant land and planning — — 1 — 34 (19) 35 (19) 2 37 Total lending collateralised by property 1 590 (1) 117 (12) 233 (51) 1 940 (64) 72 2 012 Coverage ratio 0.06% 10.3% 21.9% 3.3%
01 Risk disclosures Investec integrated annual report 2021
ASSET QUALITYCONTINUED
33

Lending collateralised by property – Southern Africa
Gross core loansat amortised cost and FVPL (subject to ECL)
Gross coreloans at
FVPL (notsubject to
ECL)
Grosscore
loans
Stage 1 Stage 2 Stage 3 Total
£’millionGross
exposure ECLGross
exposure ECLGross
exposure ECLGross
exposure ECL
At 31 March 2021Commercial real estate 2 277 (11) 139 (3) 108 (13) 2 524 (27) — 2 524 Commercial real estate – investment 2 076 (10) 133 (3) 107 (13) 2 316 (26) — 2 316 Commercial real estate – development 167 (1) 3 — — — 170 (1) — 170 Commercial vacant land and planning 34 — 3 — 1 — 38 — — 38 Residential real estate 377 (2) 11 — 5 (1) 393 (3) — 393 Residential real estate – investment 186 (1) — — 5 (1) 191 (2) — 191 Residential real estate – development 156 (1) 11 — — — 167 (1) — 167 Residential vacant land and planning 35 — — — — — 35 — — 35 Total lending collateralised by property 2 654 (13) 150 (3) 113 (14) 2 917 (30) — 2 917 Coverage ratio 0.49% 2.0% 12.4% 1.0% At 31 March 2020*Commercial real estate 2 240 (15) 59 — 25 (5) 2 324 (20) — 2 324 Commercial real estate – investment 2 005 (14) 59 — 25 (5) 2 089 (19) — 2 089 Commercial real estate – development 197 (1) — — — — 197 (1) — 197 Commercial vacant land and planning 38 — — — — — 38 — — 38 Residential real estate 320 (2) 3 — 1 — 324 (2) — 324 Residential real estate – investment 140 (1) — — — — 140 (1) — 140 Residential real estate – development 152 (1) 2 — — — 154 (1) — 154 Residential vacant land and planning 28 — 1 — 1 — 30 — — 30 Total lending collateralised by property 2 560 (17) 62 — 26 (5) 2 648 (22) — 2 648 Coverage ratio 0.66% 0.0% 19.2% 0.8%
* During the current financial year, the risk appetite classifications were reviewed and, where necessary, amended to ensure that the classifications align with how the underlying portfolios and associated credit risk is managed and that they are consistent with the risk appetite framework and the internal risk management approach of the bank.
01 Risk disclosures Investec integrated annual report 2021
ASSET QUALITYCONTINUED
34

An analysis of core loans by risk category – High net worth and other private client lending
Our private banking activities target high net worth individuals, active wealthy entrepreneurs, high-income professionals, newly qualified professionals with high-income earning potential, self-employed entrepreneurs, owner managers in small to mid-cap corporates and sophisticated investors.
Lending products are tailored to meet the requirements of our clients and deliver solutions to enable target clients to create and manage their wealth. Central to our credit philosophy is ensuring the sustainability of cash flow and income throughout the cycle. As such, the client base has been defined to include high net worth clients (who, through diversification of income streams, should reduce income volatility) and individuals in defined professions which have historically supported a sustainable income base, irrespective of the stage in the economic cycle.
Credit risk arises from the following activities:
• Mortgages: provides residential mortgage loan facilities to high-income professionals and high net worth individuals
• High net worth and specialised lending: provides credit facilities to high net worth individuals and their controlled entities as well as portfolio loans to high net worth clients against their investment portfolios typically managed by Investec Wealth & Investment.
Year in reviewIn the UK, high net worth and other private client lending increased by 29.8% year-on-year, driven by strong targeted growth in mortgages for the group’s high net worth target market clients as we further leverage our UK private banking platform and franchise. Growth in this area has been achieved with strong adherence to our conservative lending criteria. Weighted average LTVs on mortgages remain conservative at 60%.
In South Africa, we have seen continued growth in our high net worth and other private client portfolio and client base as
we actively focus on our business strategy to increase our positioning in this space. The high net worth client portfolio and residential mortgage book grew by 2.5% to R148.3 billion at 31 March 2021. Growth in both of these areas has been achieved with strong adherence to our risk appetite.
The forward-looking macro-economic scenarios used in the measurement of ECL were updated to capture the wide-reaching impacts of the sovereign downgrade by Moody’s to sub-investment grade as well as the impact of COVID-19. A further management ECL overlay of R100 million was raised for the Private Bank mortgage portfolio to account for the unique nature of the COVID-19 pandemic and the impact on the South African economy. Specifically, the management ECL overlay accounts for emerging risks identified for certain categories of borrowers within the mortgage portfolios. The high net worth client portfolio continues to demonstrate resilience under COVID-19 conditions, accessing financial resources at their disposal where appropriate.
High net worth and other private client lending – Total group
Gross core loans at amortised cost, FVOCI and FVPL (subject to ECL)
Gross coreloans at
FVPL (notsubject to
ECL)
Grosscore
loans
Stage 1 Stage 2 Stage 3 Total
£’millionGross
exposure ECLGross
exposure ECLGross
exposure ECLGross
exposure ECL
At 31 March 2021
Mortgages 6 865 (7) 252 (7) 84 (17) 7 201 (31) — 7 201
High net worth and specialised lending 4 039 (14) 83 (2) 74 (17) 4 196 (33) 7 4 203
Total high net worth and other private client lending 10 904 (21) 335 (9) 158 (34) 11 397 (64) 7 11 404
Coverage ratio 0.19% 2.7% 21.5% 0.6%
At 31 March 2020*
Mortgages 5 780 (5) 130 (3) 82 (14) 5 992 (22) — 5 992
High net worth and specialised lending 3 585 (12) 104 (7) 27 (22) 3 716 (41) 14 3 730
Total high net worth and other private client lending 9 365 (17) 234 (10) 109 (36) 9 708 (63) 14 9 722
Coverage ratio 0.2% 4.3% 33.0% 0.6%
* During the current financial year, the risk appetite classifications were reviewed and, where necessary, amended to ensure that the classifications align with how the underlying portfolios and associated credit risk is managed and that they are consistent with the risk appetite framework and the internal risk management approach of the bank.
01 Risk disclosures Investec integrated annual report 2021
ASSET QUALITYCONTINUED
35

High net worth and other private client lending – UK and Other
Gross core loans at amortised cost and FVOCI
Gross coreloans at
FVPL
Grosscore
loansStage 1 Stage 2 Stage 3 Total
£’millionGross
exposure ECLGross
exposure ECLGross
exposure ECLGross
exposure ECL
At 31 March 2021
Mortgages 3 103 (1) 74 — 16 (2) 3 193 (3) — 3 193
High net worth and specialised lending 832 (1) 31 (1) 2 (1) 865 (3) 7 872
Total high net worth and other private client lending 3 935 (2) 105 (1) 18 (3) 4 058 (6) 7 4 065
Coverage ratio 0.05% 1.0% 16.7% 0.1%
At 31 March 2020
Mortgages 2 438 (2) 19 — 28 (1) 2 485 (3) — 2 485
High net worth and specialised lending 620 — 11 (1) 4 (3) 635 (4) 14 649
Total high net worth and other private client lending 3 058 (2) 30 (1) 32 (4) 3 120 (7) 14 3 134
Coverage ratio 0.07% 3.3% 12.5% 0.2%
High net worth and other private client lending – Southern Africa
Gross core loans at amortised cost and FVPL (subject to ECL)
Gross coreloans at
FVPL (notsubject to
ECL)
Grosscore
loans
Stage 1 Stage 2 Stage 3 Total
£’millionGross
exposure ECLGross
exposure ECLGross
exposure ECLGross
exposure ECL
At 31 March 2021
Mortgages 3 762 (6) 178 (7) 68 (15) 4 008 (28) — 4 008
High net worth and specialised lending 3 207 (13) 52 (1) 72 (16) 3 331 (30) — 3 331
Total high net worth and other private client lending 6 969 (19) 230 (8) 140 (31) 7 339 (58) — 7 339
Coverage ratio 0.27% 3.5% 22.1% 0.8%
At 31 March 2020*
Mortgages 3 342 (3) 111 (3) 54 (13) 3 507 (19) — 3 507
High net worth and specialised lending 2 965 (12) 93 (6) 23 (19) 3 081 (37) — 3 081
Total high net worth and other private client lending 6 307 (15) 204 (9) 77 (32) 6 588 (56) — 6 588
Coverage ratio 0.24% 4.4% 41.6% 0.9%
* During the current financial year, the risk appetite classifications were reviewed and, where necessary, amended, to ensure that the classifications align with how the underlying portfolios and associated credit risk is managed and that they are consistent with the risk appetite framework and the internal risk management approach of the bank.
01 Risk disclosures Investec integrated annual report 2021
ASSET QUALITYCONTINUED
36

An analysis of core loans by risk category – Corporate and other lending
We focus on traditional client-driven corporate lending activities. The credit risk management functions approve specific credit and counterparty limits that govern the maximum credit exposure to each individual counterparty. In addition, further risk management limits exist through industry and country limits to manage concentration risk. The credit appetite for each counterparty is based on the financial strength of the principal borrower, its business model and market positioning, the underlying cash flow to the transaction, the substance and track record of management, and the security package. Political risk insurance, and other insurance is taken where deemed appropriate.
The group has limited appetite for unsecured credit risk and facilities are typically secured on the assets of the underlying borrower as well as shares in the borrower.
A summary of the nature of the lending and/or credit risk assumed within some of the key areas within our corporate lending business is provided below:
• Corporate and acquisition finance: provides senior secured loans to proven management teams and sponsors running mid-cap, as well as some large-cap companies. Credit risk is assessed against debt serviceability based upon robust cash generation of the business demonstrated by both historical and forecast information. We typically act as transaction lead arranger or on a club or bi-lateral basis, and have a close relationship with management and sponsors
• Asset-based lending: provides working capital and secured corporate loans to mid-caps. These loans are secured by the assets of the business, for example, the accounts receivable, inventory and plant and machinery. In common with our corporate lending activities, strong emphasis is placed on supporting companies with scale and relevance in their industry, stability of cash flow, and experienced management
• Fund finance: provides debt facilities to asset managers and fund vehicles, principally in private equity. The geographical focus is the UK, Western Europe, North America and Southern Africa where the group can support experienced asset managers and their funds which show strong, long-term value creation and good custodianship of investors’ money. Debt facilities are
typically to a fund entity and secured against undrawn limited partner commitments and/or the funds underlying assets
• Other corporate and financial institutions and governments: provides senior secured loans to mid-large cap companies where credit risk is typically considered with regard to robust cash generation from an underlying asset and supported by performance of the overall business based on both historical and forecast information
• Small ticket asset finance: provides funding to small- and medium-sized corporates to support asset purchases and other business requirements. The portfolio is highly diversified by industry and number of clients and is secured against the asset being financed
• Motor finance: provides specialised motor vehicle financing in the UK, originated through Mann Island Finance Limited (MIVF). The portfolio is composed predominantly of private motor vehicles to individuals attributing to a granular book with low concentration risk
• Large ticket asset finance: provides the finance and structuring expertise for aircraft and larger lease assets, the majority of which are senior secured loans with a combination of corporate, cash flow and asset-backed collateral against the exposure
• Power and infrastructure finance: arranges and provides typically long-term financing for power and infrastructure assets, in particular renewable and traditional power projects as well as transportation assets, typically against contracted future cash flows of the project(s) from well-established and financially sound off-take counterparties. There is a requirement for a strong upfront equity contribution from an experienced sponsor
• Resource finance: arranges debt and underwriting together with structured hedging solutions mainly within the mining sectors. The underlying commodities are mainly precious and base metals. Our clients in this sector are established mining companies which are typically domiciled and publicly listed in the UK, Canada or Australia. All facilities are secured by the borrower’s assets and repaid from mining cash flows.
Year in reviewIn the UK, corporate and other lending decreased by 8.7% from £6.8 billion at 31 March 2020 to £6.2 billion at 31
March 2021. This has been impacted by the wind down of the Australia business, including the sale of c.£400 million of the corporate lending portfolio in March 2021, which has substantially reduced our remaining exposure to this geography. Excluding the impact of the exit from Australia, the ongoing portfolio reduced by 2.3% in the year to 31 March 2021. Activity in the second half of the year increased across several asset classes and industries including Motor finance, Power and infrastructure finance, Corporate and acquisition finance as well as Fund finance. This has been offset by redemptions particularly in the first half of the year. We continue to remain client-focused in our approach, with good quality corporates exhibiting strong cash flows and balance sheets. We continue to monitor performance closely as a result of the COVID-19 pandemic, in particular in the subsectors most affected to date which includes the aviation portfolio, due to the temporary shutdown of this industry, and small ticket asset finance due to the nature of the underlying borrower. The government measures and support that have been in place over the year to 31 March 2021 have provided direct support to the clients within these sectors as well as in other areas of corporate and other lending.
The aviation portfolio, reported under both ‘large ticket asset finance’ and ‘other corporate and financial institutions and governments’, totalled £393 million of gross core loans at 31 March 2021 (31 March 2020: £483 million). A large portion of this portfolio is reported under FVPL. There is no unsecured corporate exposure to the airline industry. The majority of the exposure is either senior secured on aircraft with conservative LTVs, to flag carriers who are likely to be supported by their respective governments during this period or to lessors, rather than direct to airlines, where these companies have substantial balance sheets which are continuing to support debt service. We have seen very limited defaults in the portfolio as a result of COVID-19 and continue to work closely with our clients given the significant disruption to this industry as a result of COVID-19. The underlying transactions remain well structured and underpinned by good assets.
Stage 3 exposures total 1.8% of total Corporate and other lending, in line with the previous year, reflecting the solid asset quality of the portfolio to date. Stage 2 exposures have increased in line with industry norms to 17.0% of total Corporate and other lending; however, this is predominantly due to the
01 Risk disclosures Investec integrated annual report 2021
ASSET QUALITYCONTINUED
37

deteriorating forward-looking view on their credit performance under current macro-economic expectations rather than specific credit concerns.
In South Africa, corporate and other lending decreased by 6.8% to R80.2 billion as at 31 March 2021 as a result of lower originations during the year under review, coupled with repayments. Our State-Owned Enterprise (SOE) exposure
is predominantly backed by government support. As a result of the COVID-19 pandemic, we continue to proactively engage with clients and monitor developments closely, particularly in the sub-sectors most affected to date which include the aviation portfolio due to reduced economic activity. The aviation portfolio, reported under both ‘large ticket asset finance’ and ‘corporate and acquisition finance’, totals R3.6 billion of
gross core loans at 31 March 2021 (31 March 2020: R4.2 billion).There is no unsecured corporate exposure to the airline industry. The majority of the exposure is senior secured on aircraft with conservative loan to value ratios. The majority of the exposures are largely secured and covered by credit guarantees.
Corporate and other lending – Total group
Gross core loans at amortised cost, FVOCI and FVPL (subject to ECL)
Gross core
loans atFVPL (notsubject to
ECL)
Grosscore
loans
Stage 1 Stage 2 Stage 3 Total
£’millionGross
exposure ECLGross
exposure ECLGross
exposure ECLGross
exposure ECL
At 31 March 2021Corporate and acquisition finance 3 280 (18) 651 (25) 97 (21) 4 028 (64) 164 4 192 Asset-based lending 206 (2) 119 (3) — — 325 (5) 14 339 Fund finance 1 551 (4) 57 — — — 1 608 (4) 48 1 656 Other corporate and financial institutions and governments 617 (2) 121 (2) 9 (3) 747 (7) 144 891 Asset finance 1 841 (13) 295 (12) 85 (39) 2 221 (64) 135 2 356
Small ticket asset finance 1 263 (11) 213 (11) 54 (18) 1 530 (40) — 1 530 Motor finance 467 (1) 82 (1) 6 (2) 555 (4) — 555 Large ticket asset finance 111 (1) — — 25 (19) 136 (20) 135 271
Power and infrastructure finance 658 (3) 103 (4) 25 (1) 786 (8) 47 833
Resource finance 28 — — — — — 28 — — 28 Total corporate and other lending 8 181 (42) 1 346 (46) 216 (64) 9 743 (152) 552 10 295
Coverage ratio 0.51% 3.4% 29.6% 1.6%
At 31 March 2020*Corporate and acquisition finance 3 587 (29) 482 (15) 123 (45) 4 192 (89) 171 4 363 Asset-based lending 405 (2) 36 (1) — — 441 (3) 20 461 Fund finance 1 672 (3) — — — — 1 672 (3) 21 1 693 Other corporate and financial institutions and governments 849 (2) 13 (1) 13 (1) 875 (4) 170 1 045 Asset finance 1 965 (13) 174 (8) 69 (54) 2 208 (75) 213 2 421
Small ticket asset finance 1 465 (11) 108 (6) 41 (38) 1 614 (55) 28 1 642 Motor finance 332 (1) 44 (1) 3 (1) 379 (3) — 379 Large ticket asset finance 168 (1) 22 (1) 25 (15) 215 (17) 185 400
Power and infrastructure finance 584 (1) 144 (3) 8 — 736 (4) 80 816
Resource finance 53 — 4 — — — 57 — — 57 Total corporate and other lending 9 115 (50) 853 (28) 213 (100) 10 181 (178) 675 10 856
Coverage ratio 0.55% 3.3% 46.9% 1.7%
* During the current financial year, the risk appetite classifications were reviewed and, where necessary, amended, to ensure that the classifications align with how the underlying portfolios and associated credit risk is managed and that they are consistent with the risk appetite framework and the internal risk management approach of the bank.
01 Risk disclosures Investec integrated annual report 2021
ASSET QUALITYCONTINUED
38

Corporate and other lending – UK and Other
Gross core loans at amortised cost and FVOCI
Gross core
loans atFVPL
Grosscore
loans
Stage 1 Stage 2 Stage 3 Total
£’millionGross
exposure ECLGross
exposure ECLGross
exposure ECLGross
exposure ECL
At 31 March 2021
Corporate and acquisition finance 1 000 (7) 336 (17) 12 (4) 1 348 (28) 87 1 435
Asset-based lending 206 (2) 119 (3) — — 325 (5) 14 339
Fund finance 1 176 (2) 57 — — — 1 233 (2) 48 1 281
Other corporate and financial institutions and governments 452 (2) 113 (2) 9 (3) 574 (7) 144 718
Asset finance 1 527 (10) 284 (11) 58 (36) 1 869 (57) 135 2 004
Small ticket asset finance 1 060 (9) 202 (10) 29 (16) 1 291 (35) — 1 291
Motor finance 467 (1) 82 (1) 6 (2) 555 (4) — 555
Large ticket asset finance — — — — 23 (18) 23 (18) 135 158
Power and infrastructure finance 351 (2) 82 (4) 25 (1) 458 (7) 47 505
Resource finance 28 — — — — — 28 — — 28
Total corporate and other lending 4 740 (25) 991 (37) 104 (44) 5 835 (106) 475 6 310
Coverage ratio 0.53% 3.7% 42.3% 1.8%
At 31 March 2020
Corporate and acquisition finance 1 524 (17) 147 (6) 40 (21) 1 711 (44) 91 1 802
Asset-based lending 405 (2) 36 (1) — — 441 (3) 20 461
Fund finance 1 293 (2) — — — — 1 293 (2) 21 1 314
Other corporate and financial institutions and governments 574 (2) 4 — 13 (1) 591 (3) 170 761
Asset finance 1 603 (11) 165 (8) 53 (30) 1 821 (49) 185 2 006
Small ticket asset finance 1 246 (10) 99 (6) 25 (14) 1 370 (30) — 1 370
Motor finance 332 (1) 44 (1) 3 (1) 379 (3) — 379
Large ticket asset finance 25 — 22 (1) 25 (15) 72 (16) 185 257
Power and infrastructure finance 339 — 77 (3) 8 — 424 (3) 80 504
Resource finance 51 — — — — — 51 — — 51
Total corporate and other lending 5 789 (34) 429 (18) 114 (52) 6 332 (104) 567 6 899
Coverage ratio 0.59% 4.2% 45.6% 1.6%
01 Risk disclosures Investec integrated annual report 2021
ASSET QUALITYCONTINUED
39

Corporate and other lending – Southern Africa
Gross core loans at amortised cost and FVPL (subject to ECL)
Gross coreloans at
FVPL (notsubject to
ECL)
Grosscore
loans
Stage 1 Stage 2 Stage 3 Total
£’millionGross
exposure ECLGross
exposure ECLGross
exposure ECLGross
exposure ECL
At 31 March 2021
Corporate and acquisition finance 2 280 (11) 315 (8) 85 (17) 2 680 (36) 77 2 757
Fund finance 375 (2) — — — — 375 (2) — 375
Financial institutions and governments 165 — 8 — — — 173 — — 173
Asset finance 314 (3) 11 (1) 27 (3) 352 (7) — 352
Small ticket asset finance 203 (2) 11 (1) 25 (2) 239 (5) — 239
Large ticket asset finance 111 (1) — — 2 (1) 113 (2) — 113
Power and infrastructure finance 307 (1) 21 — — — 328 (1) — 328
Resource finance — — — — — — — — — —
Total corporate and other lending 3 441 (17) 355 (9) 112 (20) 3 908 (46) 77 3 985
Coverage ratio 0.49% 2.5% 17.9% 1.2%
At 31 March 2020*
Corporate and acquisition finance 2 063 (12) 335 (9) 83 (24) 2 481 (45) 80 2 561
Fund finance 379 (1) — — — — 379 (1) — 379
Financial institutions and governments 275 — 9 (1) — — 284 (1) — 284
Asset finance 362 (2) 9 — 16 (24) 387 (26) 28 415
Small ticket asset finance 219 (1) 9 — 16 (24) 244 (25) 28 272
Large ticket asset finance 143 (1) — — — — 143 (1) — 143
Power and infrastructure finance 245 (1) 67 — — — 312 (1) — 312
Resource finance 2 — 4 — — — 6 — — 6
Total corporate and other lending 3 326 (16) 424 (10) 99 (48) 3 849 (74) 108 3 957
Coverage ratio 0.48% 2.4% 48.5% 1.9%
* During the current financial year, the risk appetite classifications were reviewed and, where necessary, amended, to ensure that the classifications align with how the underlying portfolios and associated credit risk is managed and that they are consistent with the risk appetite framework and the internal risk management approach of the bank.
01 Risk disclosures Investec integrated annual report 2021
ASSET QUALITYCONTINUED
40

An analysis of COVID-19 relief measures and vulnerable sectors Government schemesIn the UK, we have offered additional support to our clients, including UK SME businesses. We became accredited to lend under the various schemes introduced by the UK Government, including the Coronavirus Business Interruption Loan Scheme (CBILS), the Coronavirus Large Business Interruption Loan Scheme (CLBILS) and the Bounce Back Loan Scheme (BBLS). As at 31 March 2021 we have approved loans totalling £213 million under these schemes. The BBLS, CBILS and CLBILS schemes closed for new applications on 31 March 2021 and are being replaced by the Recovery Loan Scheme (RLS) which came into use on 6 April until 31 December 2021. The RLS, under which we became accredited to lend, will in effect replace the three prior schemes providing maximum finance of up to £10 million under the scheme, with the government providing an 80% guarantee. We are well placed to further support our clients with this scheme where required and appropriate.
In South Africa, on 21 April 2020, a R200 billion COVID-19 government loan guarantee scheme in partnership with the major banks, National Treasury and the South African Prudential Authority (South African PA) was announced. This COVID-19 loan guarantee scheme has been operating since 12 May 2020. Investec actively participated in the programme and has approved a total amount of R690 million as at 31 March 2021. There were material conditions imposed in relation to the credit approval of these COVID-19 loans, such as the qualification, repayment terms, interest conditions, utilisation and disbursements. This, combined with the proactive relief offered by the banking sector to their clients in the form of interest and/or capital repayment holidays, meant that the take up of the loan guarantee scheme was much lower than the potential R200 billion maximum value.
An analysis of COVID-19 relief measures by geographyWe have sought to help our clients wherever possible, including small and medium-sized enterprises (SMEs), our banking clients, corporates and others, providing payment holidays and other forms of COVID-19 relief measures including covenant waivers, interest-only and capital deferrals to assist clients in difficulty due to COVID-19 induced lockdowns and the significant slowdown in economic activity. We have structured different types of support to suit diverse client needs. We remain in close contact with each of these clients, and are constantly monitoring the situation. In the UK, COVID-19 relief measures currently in place have reduced substantially from a peak of 13.7% of gross core loans at end June 2020 to 2.7% at 31 March 2021. In South Africa, as lockdown restrictions have eased, we have seen an overall slowdown in new relief requests as well as improved performance reducing the net amount of active relief. COVID-19 relief measures currently in place have reduced from a cumulative relief of 23.0% of gross core loans since the onset of COVID-19 to 1.3% at 31 March 2021. Exposures that have been granted COVID-19 relief measures such as payment holidays are not automatically considered to have been subject to a significant increase in credit risk and therefore do not alone result in a transfer across stages.
UK and Other31 March 2021
£’millionTotal grosscore loans
Exposurewith active
COVID-19relief
COVID-19relief as a
% of grosscore loans
bycategory
Lending collateralised by property 2 126 42 2.0%
High net worth and other private client lending 4 065 51 1.3%
Corporate and other lending 6 310 249 3.9%
Total 12 501 342 2.7%
Southern Africa31 March 2021
R’millionTotal grosscore loans
Exposurewith active
COVID-19relief
COVID-19relief as a
% of grosscore loans
bycategory
Lending collateralised by property 59 440 367 0.6%
High net worth and other private client lending 149 456 947 0.6%
Corporate and other lending 81 148 2 439 3.0%
Total 290 044 3 753 1.3%
01 Risk disclosures Investec integrated annual report 2021
ASSET QUALITYCONTINUED
41

An analysis of COVID-19 vulnerable sectors by geography
UK and Other31 March 2021 31 March 2020
£’million Stage 1 Stage 2 Stage 3 FVPL
Totalgross
coreloans Stage 1 Stage 2 Stage 3 FVPL
Totalgross
coreloans
Aviation 30 95 6 262 393 142 — — 341 483
Transport (excluding aviation) 29 99 31 — 159 153 26 25 1 205
Retail, hotel and leisure properties^ 109 14 66 11 200 82 13 64 27 186
Leisure, entertainment and tourism 22 27 — — 49 103 — — — 103
Retailers 55 7 8 — 70 60 41 — 5 106
Vulnerable sectors within small ticket asset finance* 265 50 11 — 326 609 61 12 — 682
Total 510 292 122 273 1 197 1 149 141 101 374 1 765
Coverage ratio 0.59% 3.1% 33.6% — 4.4% 0.52% 3.5% 26.7% — 2.2%
^ Retail properties which have no underlying tenants that are either food retailers or other essential goods and services.* Note that at 31 March 2020 motor finance was reported within small ticket asset finance as a vulnerable sector. Following internal review, at 31 March
2021, motor finance is now reported separately and no longer reported as a vulnerable sector given the underlying performance of the portfolio over the past 12 months.
Southern Africa31 March 2021 31 March 2020*
R’million Stage 1 Stage 2 Stage 3 FVPL
Totalgross
coreloans Stage 1 Stage 2 Stage 3 FVPL
Totalgross
coreloans
Aviation 2 592 487 537 20 3 636 3 275 537 359 — 4 171
Hotel 2 170 97 103 — 2 370 1 785 76 104 — 1 965
Gaming and leisure 25 2 977 — — 3 002 2 703 — 274 — 2 977
Trade finance 2 502 208 192 — 2 902 2 396 455 493 — 3 344
Total 7 289 3 769 832 20 11 910 10 159 1 068 1 230 — 12 457
Coverage ratio 0.92% 1.1% 29.2% — 2.9% 0.33% 2.4% 13.9% — 1.9%
* As at 31 March 2020, Clothing retailers (R609 million) and Automotive manufacturing and suppliers (R149 million) were reported as vulnerable sectors. Following internal review, at 31 March 2021 these two sectors are no longer reported as vulnerable given the alleviated pressure on these sectors following the lifting of social containment measures.
01 Risk disclosures Investec integrated annual report 2021
ASSET QUALITYCONTINUED
42

The tables that follow provide further analysis of the group’s gross credit and counterparty exposures.
An analysis of gross credit and counterparty exposuresGross credit and counterparty exposure totalled £51.8 billion at 31 March 2021. Cash and near cash balances amounted to £13.2 billion and are largely reflected in the following line items in the table below: cash and balances at central banks, loans and advances to banks, non-sovereign and non-bank cash placements and sovereign debt securities. These exposures are all Stage 1. There are immaterial Stage 2 and Stage 3 exposures outside of loans and advances to customers which are small relative to the balance sheet, where loans and advances to customers (including committed facilities) account for greater than 97% of overall ECLs.
An analysis of gross credit and counterparty exposures by geography
UK and Other Southern Africa Total
£’million31 March
202131 March
2020*31 March
202131 March
202031 March
202131 March
2020*
Cash and balances at central banks 3 043 2 277 456 1 643 3 499 3 920
Loans and advances to banks 1 374 1 785 1 325 882 2 699 2 667
Non-sovereign and non-bank cash placements — — 442 634 442 634
Reverse repurchase agreements and cash collateral on securities borrowed 2 065 2 459 1 511 1 338 3 576 3 797
Sovereign debt securities 1 108 1 085 2 604 2 905 3 712 3 990
Bank debt securities 48 51 1 074 554 1 122 605
Other debt securities 672 649 694 783 1 366 1 432
Derivative financial instruments 729 1 002 760 734 1 489 1 736
Securities arising from trading activities 28 172 139 67 167 239
Loans and advances to customers 12 501 12 045 13 838 12 867 26 339 24 912
Own originated loans and advances to customers securitised — — 403 326 403 326
Other loans and advances 93 122 10 11 103 133
Other securitised assets 6 8 — — 6 8
Other assets 451 92 — 80 451 172
Total on-balance sheet exposures 22 118 21 747 23 256 22 824 45 374 44 571
Guarantees 145 77 732 781 877 858
Committed facilities related to loans and advances to customers 1 805 1 318 3 160 2 529 4 965 3 847
Contingent liabilities, letters of credit and other 253 270 370 424 623 694
Total off-balance sheet exposures 2 203 1 665 4 262 3 734 6 465 5 399
Total gross credit and counterparty exposures 24 321 23 412 27 518 26 558 51 839 49 970 * Restated as detailed on page 141 of volume three.
31 March 2021 31 March 2020£51 839 million £49 970 million
n Southern Africa 53.1% n Southern Africa 53.1%
n UK and Other 46.9% n UK and Other 46.9%
01 Risk disclosures Investec integrated annual report 2021
CREDIT AND COUNTERPARTY RISK
43

A further analysis of gross credit and counterparty exposures
The table below indicates in which class of asset (on the face of the consolidated balance sheet) credit and counterparty exposures are reflected. Not all assets included in the balance sheet bear credit and counterparty risk.
At 31 March 2021Total grosscredit and
counterpartyexposure
of which FVPL
of whichamortised
cost andFVOCI ECL#
Assets thatwe deem
to have nolegal credit
exposureTotal
assets£’million
Cash and balances at central banks 3 499 — 3 499 — 18 3 517 Loans and advances to banks 2 699 — 2 699 — — 2 699 Non-sovereign and non-bank cash placements 442 1 441 (2) — 440 Reverse repurchase agreements and cash collateral on securities borrowed 3 576 1 288 2 288 — — 3 576 Sovereign debt securities 3 712 197 3 515 (3) — 3 709 Bank debt securities 1 122 14 1 108 — — 1 122 Other debt securities 1 366 206 1 160 (3) — 1 363 Derivative financial instruments 1 489 1 489 — — 226 1 715 Securities arising from trading activities 167 167 — — 858 1 025 Investment portfolio — — — — 909* 909 Loans and advances to customers 26 339 1 689 24 650 (303) — 26 036 Own originated loans and advances to customers securitised 403 — 403 (1) — 402 Other loans and advances 103 — 103 (1) — 102 Other securitised assets 6 6 — — 134ˆ 140 Interest in associated undertakings and joint venture holdings — — — — 679* 679 Deferred taxation assets — — — — 247 247 Other assets 451 — 451 — 1 775** 2 226 Property and equipment — — — — 330 330 Investment properties — — — — 832 832 Goodwill — — — — 260 260 Other acquired intangible assets — — — — 59 59 Software — — — — 13 13 Other financial instruments at fair value through profit or loss in respect of liabilities to customers — — — — 52 52 Non-current assets classified as held for sale — — — — 52 52Total on-balance sheet exposures 45 374 5 057 40 317 (313) 6 444 51 505 Guarantees 877 — 877 (1) 50 926 Committed facilities related to loans and advances to customers 4 965 83 4 882 (12) — 4 953 Contingent liabilities, letters of credit and other 623 173 450 — 1 337 1 960 Total off-balance sheet exposures 6 465 256 6 209 (13) 1 387 7 839 Total exposures 51 839 5 313 46 526 (326) 7 831 59 344
# Includes £9.6 million of ECL held against financial assets held at FVOCI (fair value through other comprehensive income), which is reported on the balance sheet within the fair value reserves. This will result in minor differences between certain balance sheet lines reported above (largely loans and advances to customers and sovereign debt securities) and the statutory balance sheet.
* Largely relates to exposures that are classified as investment risk in the banking book.^ While the group manages all risks (including credit risk) from a day-to-day operational perspective, certain assets are within special purpose vehicles that
ring-fence the assets to specific credit providers and limit security to the assets in the vehicle. This balance reflects the credit exposure to credit providers external to the group. The net credit exposure that the group has in the vehicles is reflected in the ‘total credit and counterparty exposure’.
** Other assets include settlement debtors which we deem to have no credit risk exposure as they are settled on a delivery against payment basis.
01 Risk disclosures Investec integrated annual report 2021
CREDIT AND COUNTERPARTY RISKCONTINUED
44

A further analysis of gross credit and counterparty exposures (continued)
At 31 March 2020Total grosscredit and
counterpartyexposure
of whichFVPL
of whichamortised
cost andFVOCI ECL#
Assets thatwe deem
to have nolegal credit
exposureTotal
assets##£’million
Cash and balances at central banks 3 920 — 3 920 — 12 3 932 Loans and advances to banks 2 667 — 2 667 — — 2 667 Non-sovereign and non-bank cash placements 634 25 609 (1) — 633 Reverse repurchase agreements and cash collateral on securities borrowed 3 797 1 740 2 057 — — 3 797 Sovereign debt securities 3 990 310 3 680 (2) — 3 988 Bank debt securities 605 64 541 — — 605 Other debt securities 1 432 386 1 046 (2) — 1 430 Derivative financial instruments 1 736 1 736 — — 298 2 034 Securities arising from trading activities 239 239 — — 479 718 Investment portfolio — — — — 999* 999 Loans and advances to customers 24 912 1 698 23 214 (326) — 24 586 Own originated loans and advances to customers securitised 326 — 326 (1) — 325 Other loans and advances 133 — 133 (1) — 132 Other securitised assets 8 8 — — 127ˆ 135 Interest in associated undertakings and joint venture holdings
— — — — 701* 701
Deferred taxation assets — — — — 266 266 Other assets 172 — 172 — 1 762** 1 934 Property and equipment — — — — 357 357 Investment properties — — — — 864 864 Goodwill — — — — 271 271 Intangible assets — — — — 86 86 Other financial instruments at fair value through profit or loss in respect of liabilities to customers — — — — 35 35 Non-current assets classified as held for sale — — — — 59 59 Total on-balance sheet exposures 44 571 6 206 38 365 (333) 6 316 50 554 Guarantees 858 — 858 — 44 902 Committed facilities related to loans and advances to customers 3 847 48 3 799 (6) — 3 841 Contingent liabilities, letters of credit and other 694 210 484 — 917 1 611Total off-balance sheet exposures 5 399 258 5 141 (6) 961 6 354 Total exposures 49 970 6 464 43 506 (339) 7 277 56 908
# Includes £4.7 million of ECL held against financial assets held at FVOCI, which is reported on the balance sheet within the fair value reserves. This will result in minor differences between certain balance sheet lines reported above (largely loans and advances to customers and sovereign debt securities) and the statutory balance sheet.
* Largely relates to exposures that are classified as investment risk in the banking book.^ While the group manages all risks (including credit risk) from a day-to-day operational perspective, certain assets are within special purpose vehicles that
ring-fence the assets to specific credit providers and limit security to the assets in the vehicle. This balance reflects the credit exposure to credit providers external to the group. The net credit exposure that the group has in the vehicles is reflected in the ‘total credit and counterparty exposure’.
** Other assets include settlement debtors which we deem to have no credit risk exposure as they are settled on a delivery against payment basis.## Restated as detailed on page 141 of volume three.
01 Risk disclosures Investec integrated annual report 2021
CREDIT AND COUNTERPARTY RISKCONTINUED
45

Detailed analysis of gross credit and counterparty exposures by industry
At 31 March 2021
High networth
and otherprofessional
individuals
Lendingcollateralised
by property– largely to
privateclients Agriculture
Electricity,gas and
water (utilityservices)
Public andnon-business
servicesBusinessservices
Finance andinsurance£’million
Cash and balances at central banks — — — — 3 499 — — Loans and advances to banks — — — — — — 2 699 Non-sovereign and non-bank cash placements — — 53 — — 93 102 Reverse repurchase agreements and cash collateral on securities borrowed 1 — — — 634 2 2 874 Sovereign debt securities — — — — 3 665 — 47 Bank debt securities — — — — — — 1 122 Other debt securities — — — 118 6 46 655 Derivative financial instruments — 5 4 120 64 46 1 007 Securities arising from trading activities — — — 4 71 2 85 Loans and advances to customers 11 001 5 043 147 985 403 1 549 2 416 Own originated loans and advances to customers securitised 403 — — — — — — Other loans and advances — — — — — — 75 Other securitised assets — — — — — — — Other assets — — — 9 — — 441 Total on-balance sheet exposures 11 405 5 048 204 1 236 8 342 1 738 11 523 Guarantees 302 80 1 79 — 7 266 Committed facilities related to loans and advances to customers 2 128 638 54 332 59 356 644 Contingent liabilities, letters of credit and other 122 54 — 146 58 — 128 Total off-balance sheet exposures 2 552 772 55 557 117 363 1 038 Total gross credit and counterparty exposures 13 957 5 820 259 1 793 8 459 2 101 12 561
01 Risk disclosures Investec integrated annual report 2021
CREDIT AND COUNTERPARTY RISKCONTINUED
46

Retailersand
wholesalers
Manufacturingand
commerce Construction
Corporatecommercialreal estate
Otherresidentialmortgages
Mining andresources
Leisure,entertainment
and tourism Transport Motor finance Communication Total
— — — — — — — — — — 3 499 — — — — — — — — — — 2 699
85 16 1 28 — 8 1 22 — 33 442
1 — — 13 — 9 — 42 — — 3 576 — — — — — — — — — — 3 712 — — — — — — — — — — 1 122 — 50 — 54 238 16 — 115 — 68 1 366 39 34 2 69 — 23 6 62 — 8 1 489 — — — — 2 — — 3 — — 167
462 1 117 176 359 — 263 272 1 044 555 547 26 339
— — — — — — — — — — 403 — 2 — — 26 — — — — — 103 — — — — 6 — — — — — 6 — 1 — — — — — — — — 451
587 1 220 179 523 272 319 279 1 288 555 656 45 374 7 102 8 9 — 5 1 6 — 4 877
101 155 20 35 — 173 1 78 — 191 4 965
14 1 — 7 — 24 — 1 — 68 623 122 258 28 51 — 202 2 85 — 263 6 465
709 1 478 207 574 272 521 281 1 373 555 919 51 839
01 Risk disclosures Investec integrated annual report 2021
CREDIT AND COUNTERPARTY RISKCONTINUED
47
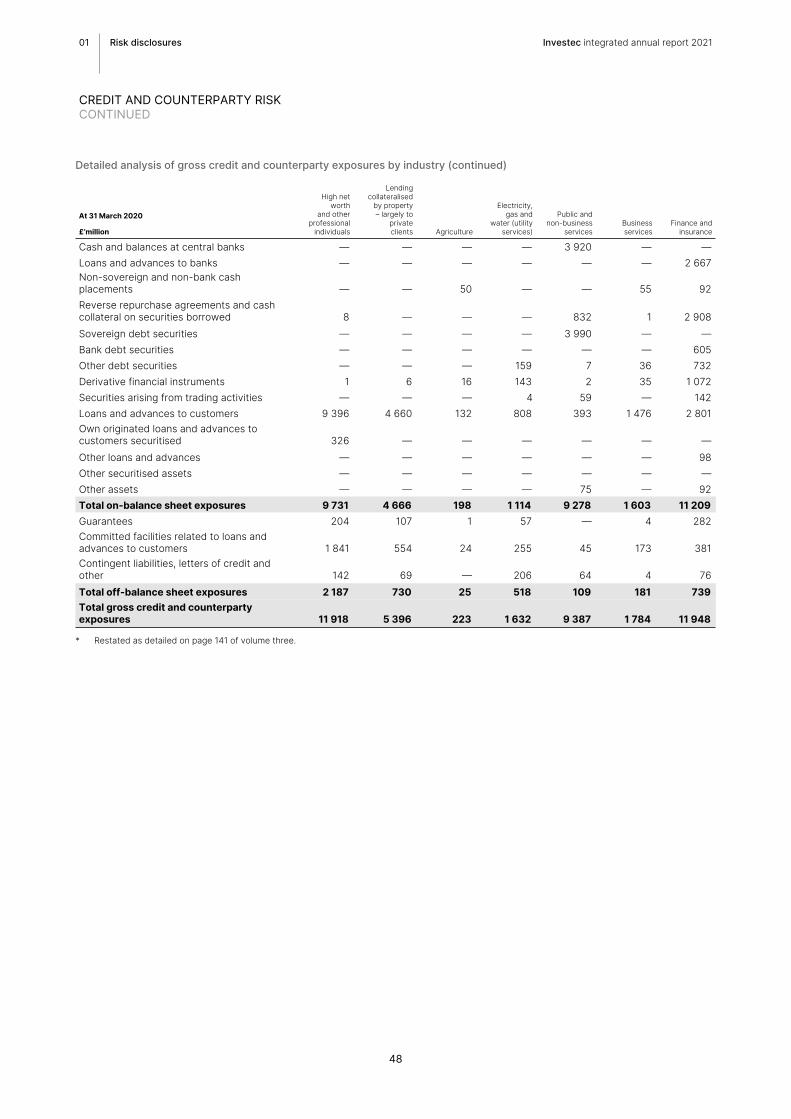
Detailed analysis of gross credit and counterparty exposures by industry (continued)
At 31 March 2020
High networth
and otherprofessional
individuals
Lendingcollateralised
by property– largely to
privateclients Agriculture
Electricity,gas and
water (utilityservices)
Public andnon-business
servicesBusinessservices
Finance andinsurance£’million
Cash and balances at central banks — — — — 3 920 — — Loans and advances to banks — — — — — — 2 667 Non-sovereign and non-bank cash placements — — 50 — — 55 92 Reverse repurchase agreements and cash collateral on securities borrowed 8 — — — 832 1 2 908 Sovereign debt securities — — — — 3 990 — — Bank debt securities — — — — — — 605 Other debt securities — — — 159 7 36 732 Derivative financial instruments 1 6 16 143 2 35 1 072 Securities arising from trading activities — — — 4 59 — 142 Loans and advances to customers 9 396 4 660 132 808 393 1 476 2 801 Own originated loans and advances to customers securitised 326 — — — — — — Other loans and advances — — — — — — 98 Other securitised assets — — — — — — — Other assets — — — — 75 — 92 Total on-balance sheet exposures 9 731 4 666 198 1 114 9 278 1 603 11 209 Guarantees 204 107 1 57 — 4 282 Committed facilities related to loans and advances to customers 1 841 554 24 255 45 173 381 Contingent liabilities, letters of credit and other 142 69 — 206 64 4 76 Total off-balance sheet exposures 2 187 730 25 518 109 181 739 Total gross credit and counterparty exposures 11 918 5 396 223 1 632 9 387 1 784 11 948
* Restated as detailed on page 141 of volume three.
01 Risk disclosures Investec integrated annual report 2021
CREDIT AND COUNTERPARTY RISKCONTINUED
48

Retailersand
wholesalers
Manufacturingand
commerce Construction
Corporatecommercialreal estate
Otherresidentialmortgages
Mining andresources
Leisure, entertainment
and tourism Transport Motor finance Communication Total*
— — — — — — — — — — 3 920 — — — — — — — — — — 2 667
150 113 15 38 — 21 1 55 — 44 634
— — — 10 — 4 — 34 — — 3 797 — — — — — — — — — — 3 990 — — — — — — — — — — 605 1 68 — 73 163 — — 125 — 68 1 432 24 43 1 81 — 89 6 209 — 8 1 736 5 17 — — — 3 — 3 — 6 239 563 1 251 159 444 — 350 329 1 239 379 532 24 912
— — — — — — — — — — 326 — 3 — — 32 — — — — — 133 — — — — 8 — — — — — 8 5 — — — — — — — — — 172 748 1 495 175 646 203 467 336 1 665 379 658 44 571 60 107 1 4 — 7 14 6 — 4 858
66 92 14 70 — 186 9 63 — 74 3 847
7 6 — — — 42 — 1 — 77 694 133 205 15 74 — 235 23 70 — 155 5 399
881 1 700 190 720 203 702 359 1 735 379 813 49 970
01 Risk disclosures Investec integrated annual report 2021
CREDIT AND COUNTERPARTY RISKCONTINUED
49

Gross credit and counterparty exposures by residual contractual maturity
At 31 March 2021 Up to three months
Threeto six
months
Six months to
one year
One to five years
Five to 10 years >10 years Total£’million
Cash and balances at central banks 3 499 — — — — — 3 499 Loans and advances to banks 2 587 — 74 38 — — 2 699 Non-sovereign and non-bank cash placements 389 — — 53 — — 442 Reverse repurchase agreements and cash collateral on securities borrowed 2 467 161 93 220 60 575 3 576 Sovereign debt securities 699 432 818 611 1 023 129 3 712 Bank debt securities 79 239 244 314 246 — 1 122 Other debt securities 78 96 82 402 236 472 1 366 Derivative financial instruments 516 250 230 364 95 34 1 489 Securities arising from trading activities 25 35 3 43 18 43 167 Loans and advances to customers 2 368 1 751 2 850 14 446 3 106 1 818 26 339 Own originated loans and advances to customers securitised — — 2 101 43 257 403 Other loans and advances 5 — — 22 58 18 103 Other securitised assets — — — — — 6 6 Other assets 451 — — — — — 451 Total on-balance sheet exposures 13 163 2 964 4 396 16 614 4 885 3 352 45 374 Guarantees 140 51 302 374 — 10 877 Committed facilities related to loans and advances to customers 1 103 186 226 1 704 617 1 129 4 965 Contingent liabilities, letters of credit and other 57 28 56 375 53 54 623 Total off-balance sheet exposures 1 300 265 584 2 453 670 1 193 6 465 Total gross credit and counterparty exposures 14 463 3 229 4 980 19 067 5 555 4 545 51 839
01 Risk disclosures Investec integrated annual report 2021
CREDIT AND COUNTERPARTY RISKCONTINUED
50

Additional credit and counterparty risk information
Credit risk classification and provisioning policy
IFRS 9 requirements have been embedded into our group credit risk classification and provisioning policy. A framework has been established to incorporate both quantitative and qualitative measures.
For further detail please refer to pages 38 and 39 in volume three
Internal credit rating models and ECL methodology
Internal credit rating models cover all material asset classes. These internal credit rating models are also used for IFRS 9 modelling after adjusting for key differences. Internal credit models calculate through the economic cycle losses whereas IFRS 9 requires 12-month or lifetime point-in-time losses based on conditions at the reporting date and multiple economic scenario forecasts of the future conditions over the expected lives.
Further detail on internal credit ratings is provided on page 30
Key judgementsThe measurement of ECL has reliance on expert credit judgement. Key judgemental areas are highlighted below and are subject to robust governance processes. Key drivers of measurement uncertainty include:
• The assessment of a significant increase in credit risk
• A range of forward-looking probability weighted macro-economic scenarios
• Estimations of probabilities of default, loss given default and exposures at default using models.
For further detail on our process for determining ECL please refer to pages 39 in volume three
Key judgements at 31 March 2021UK and OtherCOVID-19 has had a substantial impact on the macro-economic scenarios required under IFRS 9. Since the implementation of IFRS 9, we have seen changes to underlying macro-economic factors, scenarios and weightings. However, in the period since 31 March 2020, the actual movements experienced under the base case have been of a scale and speed which has not previously been experienced in the bank’s models given the nature of the stress caused by the COVID-19 pandemic. In the period since 30 September 2020, we have seen a
substantial ‘bounce back’ in economic conditions that has also resulted in extreme actual movements well beyond that previously experienced in the bank’s models. As a result, these extreme and unprecedented economic conditions have identified limitations in aspects of our model design and calibration. Unresolved, this aspect of the models would have resulted in a substantial over-prediction of default rates in the period to 30 September 2020 and a significant under-prediction of default rates at 31 March 2021.
The model methodology itself was therefore reviewed. Reliance was still placed on the bank’s internal models where relevant, but, where necessary, adjustments were made to reflect the ongoing uncertainty in the economic environment whilst still relying on the bank’s internal models where relevant. To address the model’s limitations, mitigation measures have been utilised to floor the ‘point in time’ probability of default at the ‘through the cycle’ long run probability of default. This suppresses the ‘bounce-back’ experienced in the macro-economic scenarios and allows the models to output ECL impairments in a reliable and unbiased way whilst still observing the economic trends being experienced and reflecting the fundamental credit strength of the underlying exposures.
The assessment of the impact from COVID-19 as well as the offsetting effect of the unprecedented levels of government measures required significant judgement. To ensure that the overall level of ECL was reasonable and that the judgements applied had been suitably tested, management reviewed the overall output of ECLs and considered a number of alternative assumptions. Based on the outcome of this review an ECL overlay amounting to £16 million has been considered appropriate to account for latent risk in the performing portfolio as well as to capture the significant level of judgement required in the application of the macro-economic scenarios at 31 March 2021. This overlay has been applied to gross core loans in Stage 2.
At 31 March 2020 the models did not reflect the onset of the pandemic and therefore overlays totalling £27 million (of which £26 million was against gross core loans) were allocated across Stage 1 and 2. The £19 million ECL overlay from 31 March 2020, which had been held across the performing portfolio to capture risks not yet identified in the models due to COVID-19, has now been incorporated within the updated macro-economic scenarios applied.
Additionally, a management overlay of £8 million at 31 March 2020, which had been considered appropriate in addition to the bank’s calculated model-driven ECL due to uncertainty over the models’ predictive capabilities, has been released due to the methodology implemented to account for over-prediction of default rates. A portion of this management overlay has been re-introduced to support the methodology applied to the IFRS 9 models (£2 million included within the £16 million overlay referred to above). The UK bank will continue to assess the appropriateness of this management overlay and expects that it could be re-introduced if economic forecasts revert to historical levels and there remain specific areas of model uncertainty at that time.
South AfricaIn South Africa the expected impact from COVID-19, as well as the offsetting effect of government relief measures, has required significant judgement. Regulatory bodies provided guidance on expectations around provisioning and staging treatment of exposures. The forward-looking macro-economic scenarios used in the measurement of ECL were updated to capture the impacts of the sovereign downgrade by Moody’s to sub-investment grade as well as the impact of COVID-19. A management ECL overlay of R290 million (31 March 2020: R190 million) was raised for the Private Bank portfolio to account for the unique nature of the COVID-19 pandemic and the impact on the South African economy. Specifically, the management ECL overlay accounts for emerging risks identified for certain categories of borrowers within the commercial real estate and mortgage portfolios. Management believes that these risks are not adequately represented by the historic data used to populate the ECL models. The management ECL overlay was calculated with reference to published market data that best represents the possible exposure to these emerging risks. The management ECL overlay was estimated after stressing the PD and loss given default (LGD) of the relevant credit exposures. In line with our previous approach Stage 3 ECLs continued to be assessed using expert credit judgement.
Given the fast-changing nature of the COVID-19 pandemic and the government measures announced, we will continue to review and refine our approach to calculate the overlay given the evolving situation and significant uncertainty faced with respect to the economic outlook.
01 Risk disclosures Investec integrated annual report 2021
ADDITIONAL POLICY INFORMATION
51

Forward-looking macro-economic scenarios
The measurement of ECL also requires the use of multiple economic scenarios to calculate a probability weighted forward-looking estimate. These scenarios are updated at least twice a year, or more frequently if there is a macro-economic shock or significant shift in expectations. The weighting of these scenarios for IFRS 9 as well as the scenarios themselves are discussed and presented at the relevant BRCCs as well as the relevant capital committees for approval, which form part of the principal governance framework for macro-economic scenarios.
A number of forecast economic scenarios are considered for capital planning, stress testing (including Investec-specific stress scenarios) and IFRS 9.
UK and OtherFor Investec plc, four macro-economic scenarios were used in the measurement of ECL. These scenarios incorporate a base case, an upside case and two downside cases.
As at 31 March 2021 the base case was updated to represent the latest economic outlook that reflected the forecasted recovery from the COVID-19 pandemic. At 31 March 2020 the downside scenarios consisted of a global asset price shock and one depicting economic stagnation. These were replaced at 30 September 2020 to better reflect the balance of risks, with an L-shape scenario and a No-FTA Brexit scenario. At 31 March 2021, the L-shape scenario remained, but was updated to reflect the latest economic data. However, given the UK-EU trade deal, the No-FTA Brexit scenario was replaced with a Fiscal crisis scenario.
In addition to a reassessment of the macro-economic scenarios, a review of the weightings also took place to take into account the latest economic developments and the changes to the scenarios. On this basis, the weightings stood at 10% upside, 55% base case, 30% L-shape and 5% Fiscal crisis. On balance, the skew of risks remained to the downside.
COVID-19 considerations remain a key feature of the base case with a predominant assumption of an economic rebound through the course of the 2021 calendar year as UK lockdowns end and vaccine roll out allows a return to normality. Pre-pandemic level of gross domestic product (GDP) is assumed to be recovered by the end of the 2021 calendar year. Fiscal and monetary policies provide key support for the economy with labour market schemes having limited the rise in unemployment, although the end of these schemes will likely result in unemployment rising. Unemployment is expected to decline in the medium term. Monetary policy is envisaged to remain accommodative, with no rise in bank rate expected until 2023. Beyond the near-term, COVID-19 pandemic influenced outlook, UK economic activity is expected to return to trend growth levels, with GDP assumed to return to annual growth rates of around 1.7%. Globally, the situation is assumed to be similar to that of the UK with economies in the major advanced countries recovering throughout the 2021 calendar year, although the pace of recovery is expected to vary, depending on the pandemic and differing levels of fiscal stimulus. Monetary policy is expected to remain exceptionally accommodative for a prolonged period of time. Despite the expectation of a global recovery, downside risks related to COVID-19 remain.
Downside 1 - L-shape assumes a weaker than expected recovery from the COVID-19 pandemic and a degree of permanent economic scarring, contributing to a period of protracted economic stagnation. In the UK this is embodied in a GDP growth averaging 0.1% a quarter. Further, the BoE is expected to introduce a negative interest rate policy, with bank rate expected to be lowered to -0.40%.
Downside 2 - Fiscal crisis is based on the scenario that emerges in the UK and certain Euro area countries as investors begin to question the sustainability of the public finances given the deterioration in debt to GDP ratios. Sovereign yields rise and financial conditions deteriorate. Fiscal policy is tightened in response to market pressures. Domestically the economy falls into a three quarter recession and whilst there is a cyclical recovery in the medium term, this is subdued. The BoE eases monetary policy via asset purchases and a cut in bank rate, to a low of -0.90%. There is generally a weaker global growth backdrop. However, the world’s largest economies, the US and China, avoid seeing a contraction in economic activity.
The down case scenarios are severe but plausible scenarios created based on Investec specific bottom-up stress tests, whilst also considering IFRS 9 specific sensitivities and non-linearity.
In the upside case, a quicker recovery is experienced, triggered by a successful vaccine roll out campaign and an end to social restrictions. Ultimately, there is a stronger rebound in productivity, which helps to support a faster pace of GDP growth, which over the medium term averages 2% per annum. This stronger than expected rebound is seen globally, which leads to an earlier tightening in monetary policy.
The graph below shows the forecasted UK GDP under each macro-economic scenario applied at 31 March 2021.
£’billionUK GDP forecast
Upside Base caseDownside 1 - L-shape Downside 2 - Fiscal crisis
2021 2022 2023 2024 2025 2026400
450500
550600
650700
01 Risk disclosures Investec integrated annual report 2021
MACRO-ECONOMICS
52

The table that follows shows the key factors that form part of the UK and Other macro-economic scenarios and their relative applied weightings. The comparative data shows the key macro-economic factors used at 31 March 2020 including pre-COVID-19 scenarios and the relative weightings applied to each scenario as well as the COVID-19 scenarios, taking into account government intervention, which were used to apply an ECL overlay.
At 31 March 2021 average 2021 – 2026
At 31 March 2020average 2020 – 2025
Macro-economic scenarios
UpsideBasecase
Downside 1L-shape
Downside 2Fiscal crisis Upside
Basecase
Downside 1Global
Downside 2Stagnation
COVID-19short
scenario
COVID-19long
scenario
% % % % % % % % % %
UKGDP growth 5.4 4.2 1.3 0.9 2.7 1.5 0.2 0.4 1.0 0.1 Unemployment rate 4.3 4.7 6.9 7.8 4.2 4.1 6.3 5.2 6.5 7.9 House price growth 3.7 1.6 0.7 (0.9) 2.8 2.5 (2.1) (1.7) 0.5 (1.9) BoE – Bank rate (end year) 1.0 0.6 (0.4) (0.7) 2.3 1.2 0.2 0.0 0.1 0.1 Euro areaGDP growth 4.4 3.1 1.0 0.9 2.7 1.4 0.3 0.2 n/a n/aUSGDP growth 6.5 3.4 1.4 1.2 2.7 1.8 0.2 0.6 n/a n/aScenario weightings 10 55 30 5 10 55 15 20 75 25
The following table shows annual averages of economic factors for the base case over a five-year period based on the economic forecasts in place as at 31 March 2021.
Base case %
Financial years
2021/2022 2022/2023 2023/2024 2024/2025 2025/2026
UKGDP growth 12.2 3.5 1.9 1.6 1.6 Unemployment rate 6.1 4.8 4.2 4.2 4.2 House price growth 1.9 0.8 1.2 2.0 2.3 BoE – Bank rate (end year) 0.1 0.1 0.5 1.0 1.5 Euro areaGDP growth 6.7 3.8 1.9 1.6 1.6 USGDP growth 7.7 3.8 2.0 1.8 1.8
The following table shows percentage change in forecast economic factors for the two downside scenarios from the end of the fourth quarter 2020 based on the economic forecasts in place as at 31 March 2021.
% change since Q4 2020
Financial years
2021/2022 2022/2023 2023/2024 2024/2025 2025/2026
GDPDownside 1 L-shape 0.7 1.1 1.5 1.9 2.3 Downside 2 Fiscal crisis (2.8) (2.2) (1.0) (0.5) (0.1) Residential property pricesDownside 1 L-shape (1.2) (0.8) 0.0 0.8 1.6 Downside 2 Fiscal crisis (5.8) (9.4) (7.2) (6.7) (6.3) Commercial property pricesDownside 1 L-shape (2.8) (1.9) (1.3) (0.7) 0.1 Downside 2 Fiscal crisis (6.6) (7.4) (4.3) (3.1) (2.8)
01 Risk disclosures Investec integrated annual report 2021
MACRO-ECONOMICSCONTINUED
53

South AfricaFor Investec Limited, five macro-economic scenarios were used in the measurement of ECL. These scenarios incorporate a base case, two upside cases and two downside cases. The aim of this economic scenario generation process was to provide a view of the current and projected state of the South African economy and the different economic scenarios that could occur in various stressed or improved environments over the next five years for a number of identified variables/risk drivers.
As at 31 March 2021 all five scenarios were updated to incorporate the latest available data, although it should be noted that the impact of the COVID-19 pandemic has been severe and unprecedented and South Africa’s economy has still not recovered to its production levels pre-pandemic. The deep scarring is likely to be persistent until 2024 in real terms.
The base case is characterised by the view that South Africa’s economic recovery continues out to 2024 (in real terms) in order to reach pre-pandemic levels of production, as COVID-19 is overcome at a modest pace. Underpinning this view is that the global economic recovery continues over the period, supported by sufficient monetary and other policy supports in key advanced economies and market risk sentiment is neutral to somewhat risk on. However, the sharp deterioration last year in South Africa’s government finances has resulted in further credit rating downgrades, although a degree of fiscal consolidation is expected over the medium term. As a consequence, the base case sees South Africa retain a country rating from Moody’s that is one of the three grades in the BB (Ba) category – currently Moody’s rates South Africa Ba2 (BB-). Expropriation of private sector property without compensation is expected to be limited and not have a negative impact on the economy or on market sentiment. As at 31 March 2020, the weighting of the base case was 43%, but at 31 March 2021 the scenario weighting of the base case was revised up to 48% due to the improved outlook caused by the strength of economic recoveries underway globally and domestically.
The lite down case has the same expected international environment (including risk sentiment) as the base case, but the domestic environment differs. Under this scenario South Africa fails to stabilise its debt and falls into the single B credit ratings bracket from all three agencies while the effects from COVID-19 are slow to overcome. Expropriation of some private sector property without compensation occurs, with a moderate, negative impact on the economy. Business confidence is depressed with weak investment growth, while significant load shedding occurs, and the country falls into recession. A substantial degree of fiscal consolidation ultimately occurs, preventing South Africa’s credit ratings from falling through the C credit rating grades. As at 31 March 2020 the weighting of the lite down case was 42%, but by 31 March 2021 it was revised to 44% due to marked deterioration in South Africa’s government finances.
The severe down case is characterised by a lengthy global recession and/or global financial crisis (which could be caused or exacerbated by the failure to overcome the COVID-19 pandemic but is not limited to this), with insufficient monetary and other policy supports. A depression occurs in the South African economy, with extreme Rand weakness. South Africa’s credit ratings from all three key agencies drop below the single B categories, then fall through the C grade categories eventually to D grade (default) as government borrows from increasingly wider sources and sinks deeper into a debt trap, and then defaults. Eventually widespread load shedding and civil unrest occur. Nationalisation of private sector property
under expropriation without compensation occurs with severe negative impacts for the economy. At 31 March 2020 the scenario weighting of the severe down case was 10%, while at 31 March 2021 the weighting was 5% as the global economy has seen strong progress in recovery, while there is now evidence that government is working towards fiscal consolidation.
The up case is depicted by a relatively quick rebound from the COVID-19 pandemic globally and domestically, with rising confidence and investment levels. The South African economy’s structural problems are worked down quickly and no further credit rating downgrades occur. The rating outlooks eventually become positive, as strong fiscal consolidation sees government debt projections stabilise then fall in the near term. Global risk-on and strong global growth occurs in this scenario. There are no negative impacts from expropriation without compensation on the economy. As at 31 March 2020 the scenario weighting was 4%, but on 31 March 2021 was revised down to 2% as the economy saw a much weaker performance than was initially envisioned over 2020 causing its recovery to come off a much lower base and so is expected to take longer to occur, while economic reforms to quicken growth are still outstanding.
The extreme up case is a scenario which is an acceleration of the up case, where the COVID-19 pandemic is resolved very rapidly globally and domestically. Very strong global growth and a commodity boom occur while domestically, good governance and substantial growth-creating reforms see very strong, sustained economic growth. Very strong fiscal consolidation also occurs and sees government debt drop to low ratios of the 2000s. A high level of business confidence and fixed investment growth ensues, with substantial foreign direct investment inflows as property rights are strengthened and no nationalisation occurs. Domestic economic growth of 3-5%, then 5-7%, is achieved under this scenario and credit rating upgrades occur. This scenario retains a weighting of 1% as the exact domestic characterisations currently retain a very low probability.
The graph below depicts South African GDP growth forecast under the macro-economic scenarios applied at 31 March 2021.
R’billionSouth African GDP forecast
Extreme up case Up caseBase case Lite down caseSevere down case
2021 2022 2023 2024 2025 20262 500
3 000
3 500
4 000
01 Risk disclosures Investec integrated annual report 2021
MACRO-ECONOMICSCONTINUED
54
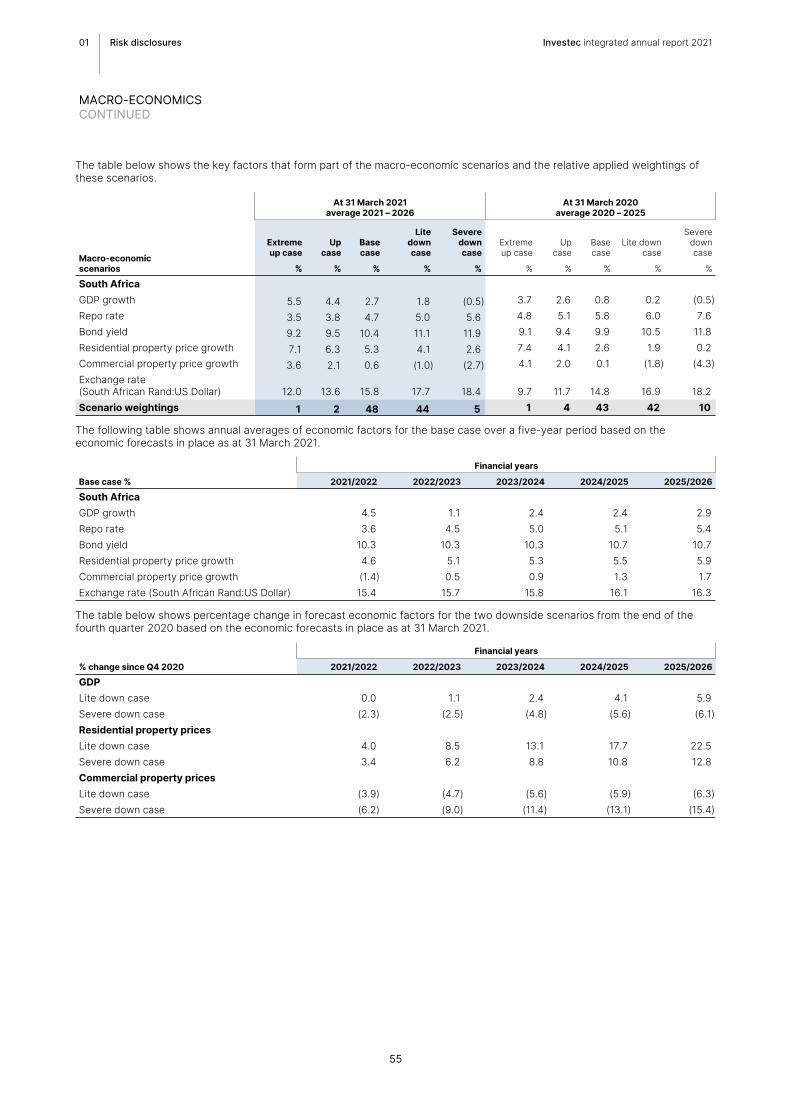
The table below shows the key factors that form part of the macro-economic scenarios and the relative applied weightings of these scenarios.
Macro-economic scenarios
At 31 March 2021average 2021 – 2026
At 31 March 2020average 2020 – 2025
Extremeup case
Upcase
Basecase
Litedowncase
Severedowncase
Extremeup case
Upcase
Basecase
Lite downcase
Severedowncase
% % % % % % % % % %
South AfricaGDP growth 5.5 4.4 2.7 1.8 (0.5) 3.7 2.6 0.8 0.2 (0.5) Repo rate 3.5 3.8 4.7 5.0 5.6 4.8 5.1 5.8 6.0 7.6 Bond yield 9.2 9.5 10.4 11.1 11.9 9.1 9.4 9.9 10.5 11.8 Residential property price growth 7.1 6.3 5.3 4.1 2.6 7.4 4.1 2.6 1.9 0.2 Commercial property price growth 3.6 2.1 0.6 (1.0) (2.7) 4.1 2.0 0.1 (1.8) (4.3) Exchange rate(South African Rand:US Dollar) 12.0 13.6 15.8 17.7 18.4 9.7 11.7 14.8 16.9 18.2 Scenario weightings 1 2 48 44 5 1 4 43 42 10
The following table shows annual averages of economic factors for the base case over a five-year period based on the economic forecasts in place as at 31 March 2021.
Base case %
Financial years
2021/2022 2022/2023 2023/2024 2024/2025 2025/2026
South AfricaGDP growth 4.5 1.1 2.4 2.4 2.9 Repo rate 3.6 4.5 5.0 5.1 5.4 Bond yield 10.3 10.3 10.3 10.7 10.7 Residential property price growth 4.6 5.1 5.3 5.5 5.9 Commercial property price growth (1.4) 0.5 0.9 1.3 1.7 Exchange rate (South African Rand:US Dollar) 15.4 15.7 15.8 16.1 16.3
The table below shows percentage change in forecast economic factors for the two downside scenarios from the end of the fourth quarter 2020 based on the economic forecasts in place as at 31 March 2021.
% change since Q4 2020
Financial years
2021/2022 2022/2023 2023/2024 2024/2025 2025/2026
GDPLite down case 0.0 1.1 2.4 4.1 5.9 Severe down case (2.3) (2.5) (4.8) (5.6) (6.1) Residential property pricesLite down case 4.0 8.5 13.1 17.7 22.5 Severe down case 3.4 6.2 8.8 10.8 12.8 Commercial property pricesLite down case (3.9) (4.7) (5.6) (5.9) (6.3) Severe down case (6.2) (9.0) (11.4) (13.1) (15.4)
01 Risk disclosures Investec integrated annual report 2021
MACRO-ECONOMICSCONTINUED
55

Climate risk and opportunitiesOur position on climate changeWe recognise the complexity and urgency of climate change. The group environmental policy and climate change statement considers the risks and opportunities that climate change presents to the global economy. We believe that as a specialised financial services organisation and given our positioning in the developed and emerging worlds, we can make a meaningful impact in addressing climate change. We support the Paris Agreement aims of holding the increase in global average temperature to well below 2°C above pre-industrial levels and continue to pursue efforts towards limiting it to 1.5°C. We also recognise the urgency and need to accelerate action which has been incorporated into our approach.
Our approach to net-zeroWe embrace our responsibility to understand and manage our own carbon footprint. We upheld our commitment and maintained net-zero direct operational carbon emissions status for the third financial year by sourcing almost 100% of our electricity consumption from renewable energy through the purchase of Renewable Energy Certificates and offsetting the remaining 10% of emissions through the purchase of verified and high quality carbon credits.
We acknowledge that the widest and most impactful influence we can have is to manage and reduce our carbon emissions in the business we conduct and more specifically in our lending and investing portfolios (Scope 3 financed activities). As such, we are working together with the Partnership for Carbon Accounting Financials (PCAF) to
measure our financed emissions and to establish a base line towards a net-zero path.
We are building capacity within our specialist skills in advisory, lending and investing to support our clients and stakeholders to move as quickly and smoothly as possible towards a zero-carbon economy.
Climate-related financial disclosures (TCFD)We publish a separate TCFD report that aligns with the Financial Stability Board Taskforce recommendations. The table below illustrates a summary of our progress in terms of the TCFDs.
Refer to detailed information in our 2021 TCFD report on our website
Pre financial year end March 2021 Financial year end March 2021 Looking forwardGovernance • Strengthened the group environmental
policy and climate change statement • Established an ESG Executive
Committee • Released a group fossil fuel policy• Assigned board responsibility and
oversight for climate-related risks and opportunities
• Assigned senior management responsibility for climate-related risks and opportunities
• Deepened the ESG skills of the DLC SEC • Extensive engagement with executive and
senior leadership on the responsibility, risk and business opportunities related to sustainability
• Strengthened our framework to link executive directors’ remuneration to ESG KPIs
• 84% of our board members participated in climate-related workshops
• Identify skills gaps within the board and management with regards to climate risks
• Build capacity through directed climate education where gaps exist within the board and management
Strategy • We support the Paris Agreement’s aim of holding the increase in the global average temperature to well below 2°C above pre-industrial levels and of pursuing efforts towards limiting it to 1.5°C
• Committed to ongoing carbon neutral emissions across all operations (Scope 1 and 2)
• Created a Sustainable Finance Framework• Arranged and participated in one of the
first European mid-market ESG-linked loans to the value of €600 million
• Received shareholder support for climate commitments and published our first TCFD report
• Strengthened our supply chain monitoring • Started engaging with clients on their
climate aspirations • Conducted a qualitative assessment of
climate risk in our own operations
• Assess financed emissions in our lending and investing portfolios to understand their net-zero alignment in accordance with the trajectories of the countries net-zero commitments where we operate in
• Assess impact of climate-related risks and opportunities in our business
• Collaborate on climate-related disclosures with stakeholders, for example, through PCAF
Risk management
• Evaluated lending and investment portfolios for ESG risks
• Evaluated lending and investment portfolios for climate-related risks and opportunities
• Evaluated lending and investment portfolios for general ESG risks
• Evaluated lending and investment portfolios for climate-related risks and opportunities
• Automated ESG screening incorporated into the Investec plc risk management process
• Implement automated ESG screening, measurement and reporting within our South African operations
• Participate in the SARB climate-related stress tests for capital and follow the BoE stress test guidelines
Metrics and targets
• Included non-financial and ESG related targets within executive remuneration with a total weighting of 20% of short-term incentives and 25% of long-term incentives
• Committed to ongoing carbon neutral emissions across all operations
• Achieved carbon neutral status across our global operations for direct emissions
• Disclosed our fossil fuel exposure and ESG risk exposure
• Achieved net-zero direct emissions for the third financial year as part of our commitment to ongoing carbon neutrality in our Scope 1, 2 and operational Scope 3 emissions
• 100% of operational energy requirements (Scope 2) sourced from renewable energy through renewable energy certificates
• Joined the Partnership for Carbon Accounting Financials (PCAF) to collaborate with peers measuring Scope 3 emissions
• Measurement of carbon intensity within our Scope 3 lending and investment portfolios using the PCAF methodologies with an initial focus on our lending collateralised by property and mortgage portfolio’s
• Continue to assess viable scenarios in line with industry recommendations
• Assess viability of net-zero commitments within our investment and lending portfolios
01 Risk disclosures Investec integrated annual report 2021
ENVIRONMENTAL, SOCIAL AND GOVERNANCE (ESG) RISK AND CLIMATE RISK
56

Investment risk in the banking bookInvestment risk in the banking book comprised 3.2% of total assets at 31 March 2021. We have refocused our principal investment activities on clients where we have and can build a broader relationship through other areas of activity in the group.
We partner with management and other co-investors by bringing capital raising expertise, working capital management, merger and acquisition and investment experience into client-driven private equity transactions as well as leveraging third party capital into funds that are relevant to the group’s client base. Investments are selected based on:
– The track record of management– Attractiveness of the industry and the positioning therein– Valuation/pricing fundamentals– Environmental and sustainability analyses– Exit possibilities and timing thereof– The ability to build value by implementing an agreed
strategy.
Investments in listed shares may arise on an IPO, or sale of an investment to a listed company. There is limited appetite for listed investments.
IBL holds a 47.4% stake in the IEP Group alongside third party investors and senior management of the business who collectively hold the remaining 52.6%. The investment in the IEP Group is reflected as an investment in an associate.
Additionally, from time to time, the manner in which certain lending transactions are structured results in equity, warrants or profit shares being held, predominantly in unlisted companies. We also source development, investment and trading opportunities to create value within agreed risk parameters.
Investec has a 25.0% shareholding in Ninety One (previously known as Investec Asset Management).
Management of investment riskAs investment risk arises from a variety of activities conducted by the group, the monitoring and measurement thereof varies across transactions and/or type of activity. Independent investment committees exist in the UK and South Africa and provide oversight of the regions where we assume investment risk.
Nature of investment risk Management of riskPrincipal Investments Investment committees, IBL, IBP
and DLC BRCCs
Listed equities Investment committees, market risk management, IBL, IBP and DLC BRCCs
Profit shares and investments arising from lending transactions
Investment committees, credit risk management committees, IBL, IBP and DLC BRCCs
Investment and trading properties
Investment committees, Investec Property Group Investment Committee, IBL, IBP and DLC BRCCs
IEP Group A number of our executives are on the board of the IEP Group, IBL BRCC and DLC BRCC
Risk appetite limits and targets are set to manage our exposure to equity and investment risk. An assessment of exposures against limits and targets as well as stress testing scenario analyses are performed and reported to IBL, IBP and DLC BRCCs. As a matter of course, concentration risk is avoided and investments are spread across geographies and industries.
Valuation and accounting methodologiesFor a description of our valuation principles and methodologies refer to pages 39 to 42 in volume three and pages 78 to 86 in volume three for factors taken into consideration in determining fair value
Capital requirementsIn terms of Basel III capital requirements for Investec Limited, unlisted and listed equities within the banking book are represented under the category of equity risk and investment properties and profit shares are considered in the calculation of capital required for credit risk. Investec plc include these positions in the credit risk calculations (the equity risk category is an exposure category within credit risk).
Refer to page 94 for further detail
01 Risk disclosures Investec integrated annual report 2021
INVESTMENT RISK
57
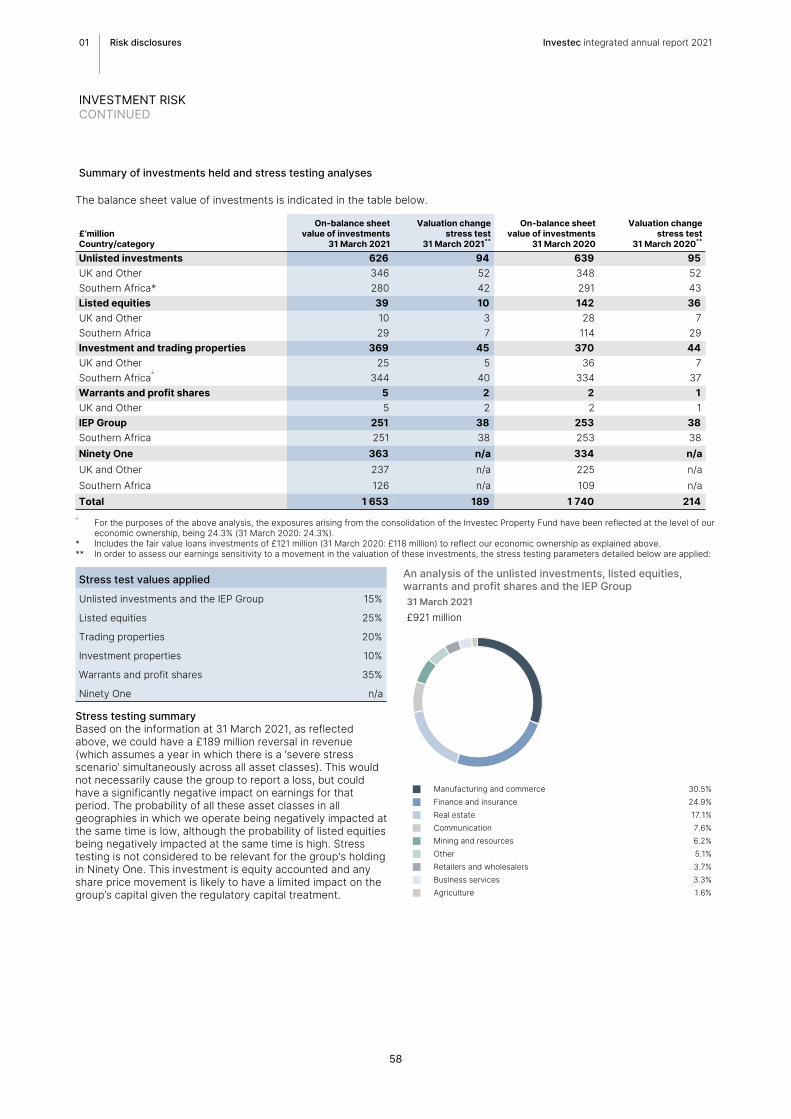
Summary of investments held and stress testing analyses
The balance sheet value of investments is indicated in the table below.
£’million Country/category
On-balance sheet value of investments
31 March 2021
Valuation change stress test
31 March 2021**
On-balance sheet value of investments
31 March 2020
Valuation change stress test
31 March 2020**
Unlisted investments 626 94 639 95 UK and Other 346 52 348 52 Southern Africa* 280 42 291 43 Listed equities 39 10 142 36 UK and Other 10 3 28 7 Southern Africa 29 7 114 29 Investment and trading properties 369 45 370 44 UK and Other 25 5 36 7 Southern Africa^ 344 40 334 37 Warrants and profit shares 5 2 2 1 UK and Other 5 2 2 1 IEP Group 251 38 253 38 Southern Africa 251 38 253 38 Ninety One 363 n/a 334 n/aUK and Other 237 n/a 225 n/aSouthern Africa 126 n/a 109 n/aTotal 1 653 189 1 740 214
^ For the purposes of the above analysis, the exposures arising from the consolidation of the Investec Property Fund have been reflected at the level of our economic ownership, being 24.3% (31 March 2020: 24.3%).
* Includes the fair value loans investments of £121 million (31 March 2020: £118 million) to reflect our economic ownership as explained above.** In order to assess our earnings sensitivity to a movement in the valuation of these investments, the stress testing parameters detailed below are applied:
Stress test values applied
Unlisted investments and the IEP Group 15%
Listed equities 25%
Trading properties 20%
Investment properties 10%
Warrants and profit shares 35%
Ninety One n/a
Stress testing summaryBased on the information at 31 March 2021, as reflected above, we could have a £189 million reversal in revenue (which assumes a year in which there is a ‘severe stress scenario’ simultaneously across all asset classes). This would not necessarily cause the group to report a loss, but could have a significantly negative impact on earnings for that period. The probability of all these asset classes in all geographies in which we operate being negatively impacted at the same time is low, although the probability of listed equities being negatively impacted at the same time is high. Stress testing is not considered to be relevant for the group's holding in Ninety One. This investment is equity accounted and any share price movement is likely to have a limited impact on the group’s capital given the regulatory capital treatment.
An analysis of the unlisted investments, listed equities, warrants and profit shares and the IEP Group31 March 2021£921 million
n Manufacturing and commerce 30.5%
n Finance and insurance 24.9%
n Real estate 17.1%
n Communication 7.6%
n Mining and resources 6.2%
n Other 5.1%
n Retailers and wholesalers 3.7%
n Business services 3.3%
n Agriculture 1.6%
01 Risk disclosures Investec integrated annual report 2021
INVESTMENT RISKCONTINUED
58

Securitisation/structured credit activities exposuresOverviewThe group’s definition of securitisation/structured credit activities is wider than the definition applied for regulatory capital purposes. The regulatory capital definition focuses largely on positions we hold in an investor capacity and includes securitisation positions we have retained in transactions in which the group has achieved significant risk transfer. We believe, however, that the information provided below is meaningful in that it groups all these related activities in order for a reviewer to obtain a full picture of the activities that we have conducted in this space. Some of the information provided below overlaps with the group’s credit and counterparty exposure information.
UK and Other The new securitisation framework, which came into force in January 2020, is followed when calculating capital requirements for securitisation positions. Given risk-weightings under this new framework are no longer reliant on ratings, a breakdown by risk-weighting has also been provided in the analysis that follows.
Securitisation transactions provide the bank with a cost effective, alternative source of financing either through sale to the market or through use of the notes issued as collateral for other funding mechanisms. During the year we completed a £400 million securitisation of auto loans and leases originated by MI Vehicle Finance Limited. All the notes were retained by IBP or its subsidiaries with the senior notes used as collateral to support our participation in the BoE funding schemes. The group does not apply the securitisation rules to the above originated transactions when calculating risk-weighted assets. For regulatory capital purposes, the group continues to recognise the underlying securitised assets in the consolidated regulatory balance sheet and applies the standardised credit risk rules.
We hold rated structured credit instruments. These are UK and US exposures and amounted to £557 million at 31 March 2021 (31 March 2020: £522 million) with 99% being AAA and AA rated. 96% of all these exposures have a risk weighting of less than 40%.
South AfricaIn South Africa we engage in transactions that involve the use of both special purpose entities and asset securitisation structures. Securitisation represents a small proportion of our current funding profile, but provides
additional flexibility and a source of liquidity. We do not depend on special purpose vehicles for funding in the normal course of business. These entities form part of the consolidated group balance sheet as reported.
We have securitised assets originated by our Private Client business in South Africa. The primary motivations for the securitisation of these assets are to:
• Provide an alternative source of funding
• Act as a mechanism to transfer risk• Leverage returns through the
retention of equity tranches in low default rate portfolios
• Continue to create marketable instruments through self securitisation.
Total assets that have been originated and securitised by the Private Client division amount to R8.2 billion at 31 March 2021 (31 March 2020: R7.2 billion) and consist mainly of residential mortgages.
Further details of our various securitisation vehicles are highlighted below:
• Fox Street 1: R0.2 billion notes of the original R1.5 billion are still in issue. All notes are held internally
• Fox Street 2: R0.3 billion notes of the original R1.5 billion are still in issue. All notes are held internally
• Fox Street 3: R0.6 billion notes of the original R2.0 billion are still in issue. All notes are held internally
• Fox Street 4: R1.1 billion notes of the original R3.7 billion are still in issue. All notes are held internally
• Fox Street 5: R1.4 billion notes of the original R2.9 billion are still in issue. All notes are held internally
• Fox Street 6: R0.9 billion notes of the original R1.3 billion are still in issue. R342 million of the notes are held internally
• Fox Street 7: R0.9 billion notes of the original R1.1 billion are still in issue. R7 million of the notes are held internally
• Grayston Drive Autos: R2.4 billion notes of the original R2.4 billion are still in issue. R325 million of the notes are held internally.
There is a clean-up call option that can be exercised at 10% of original notes issued. The margin on the notes increases at pre-specified intervals and coincides with the originator call option dates.
Refer to page 60
We have also sought out select opportunities in the credit/debt markets and traded in and purchased structured credit. These have largely been rated UK residential mortgage backed securities (RMBS), totalling R0.4 billion at 31 March 2021 (31 March 2020: R0.8 billion), unrated South African RMBS totalling R1.2 billion at 31 March 2021 (31 March 2020: R1.6 billion), rated US corporate loans R0.8 billion (31 March 2020: R1.0 billion) and unrated South African auto loans totalling R75 million (31 March 2020: R241 million).
Accounting policies
Refer to page 39 in volume three
Risk managementAll existing or proposed exposures to a securitisation are analysed on a case-by-case basis, with approval required from credit. The analysis looks through to the historical and expected future performance of the underlying assets, the position of the relevant tranche in the capital structure as well as analysis of the cash flow waterfall under a variety of stress scenarios. External ratings and risk-weightings are presented, but only for information purposes since the group principally relies on its own internal risk assessment. Overarching these transaction level principles is the board-approved risk appetite policy, which details the group’s appetite for such exposures, and each exposure is considered relative to the group’s overall risk appetite. We can use explicit credit risk mitigation techniques where required; however, the group prefers to address and manage these risks by only approving exposures to which the group has explicit appetite through the constant and consistent application of the risk appetite policy.
In addition, securitisations of Investec own originated assets are assessed in terms of the credit risk management philosophies and principles as set out above
01 Risk disclosures Investec integrated annual report 2021
SECURITISATION
59

Credit analysisIn terms of our analysis of our credit and counterparty risk, exposures arising from securitisation/structured credit activities reflect only those exposures to which we consider ourselves to be at risk. Assets that have been securitised by our private client division in Southern Africa are reflected as
part of our core lending exposures and not our securitisation/structured credit exposures as we believe this reflects the true nature and intent of these exposures and activities. These assets are reflected on the balance sheet line item ‘own originated loans and advances to customers’ totalling £402 million at 31 March 2021 (31 March 2020: £325 million).
Nature of exposure/activity
31 March 2021
31 March 2020 Balance sheet and credit risk
classification Asset quality – relevant comments£’million £’million
Structured credit (gross exposure) 698 681 Other debt securities and other loans and advances<40% RWA 673 648
>40% RWA 25 33 Loans and advances to customers and third party intermediary originating platforms (mortgage loans) (net exposure)
7 8 Other loans and advances
Private client division assets which have been securitised
402 325 Own originated loans and advances to customers
Analysed as part of the group’s overall asset quality on core loans as reflected on pages 28 to 40
Analysis of gross structured credit exposure
£’million AAA AA A BBB BBB andbelow
Totalrated
Totalunrated Total
US corporate loans 240 95 6 — — — 341 12 353 UK RMBS 136 139 1 1 — — 277 6 283 South African RMBS — — — — — — — 58 58 South African auto loans — — — — — — — 4 4 Total at 31 March 2021 376 234 7 1 — — 618 80 698 Investec plc 376 173 7 1 — — 557 18 575
<40% RWA 376 159 7 — — — 542 12 554 >40% RWA — 14 — 1 — — 15 6 21
Investec Limited — 61 — — — — 61 62 123 <40% RWA — 61 — — — — 61 58 119 >40% RWA — — — — — — — 4 4
Total at 31 March 2020 375 218 6 1 — — 600 81 681 Investec plc 375 140 6 1 — — 522 6 528 Investec Limited — 78 — — — — 78 75 153
01 Risk disclosures Investec integrated annual report 2021
SECURITISATIONCONTINUED
60

Market risk in the trading book
Traded market risk profile
The focus of our trading activities is primarily on supporting our clients. Our strategic intent is that proprietary trading should be limited and that trading should be conducted largely to facilitate client flow. Within our trading activities, we act as principal with clients or the market. Market risk exists where we have taken on principal positions resulting from market making, underwriting and facilitation of client business in the foreign exchange, interest rate, equity, credit and commodity markets.
Traded market risk year in reviewGlobally, the onset of the COVID-19 pandemic triggered extreme market movements, along with a lack of trading liquidity in certain markets. This resulted in a challenging risk management environment across the trading businesses.
In the UK, trading income continued to be negatively impacted by risk management and risk reduction costs in our structured product book of £93 million in the year to 31 March 2021 (31 March 2020: £29 million). Extreme market movements, dividend cancellations and a lack of trading liquidity were the primary causes of these costs. Risk reduction trades combined with a reduction in the size of the structured products book substantially reduced risk management costs in the last quarter of the financial year. Furthermore, the implementation of a macro hedge has provided downside protection in the event of another extreme market dislocation. The book is being run down and its size has materially reduced through a combination of active trade unwinds and natural run-off with the recovery in equity markets. For the 2022 financial year we expect these costs to be approximately £30 million. This guidance is subject to various assumptions which, if altered, may result in a different outcome to management expectations. Market risk across the other trading desks remains limited with the primary focus continuing to be on managing and hedging the market risk arising from client related activity.
The UK bank has been winding down its Financial Products business during the year and also took the decision to discontinue these structured products in the UK as a method of raising liabilities. There continues to be daily close monitoring of the remaining substantially reduced book from IBP executive
management, risk management and the business. Regular meetings were held during the year to review and refine the risk management processes related to this book and the remaining risk on the book is regularly reported to IBP and DLC BRCCs and the respective boards. The accounting treatment was also considered by the Audit Committee through regular management feedback and technical accounting memorandums to understand the subjectivity surrounding the inputs to their valuations.
Additionally, in South Africa, trading conditions remained challenging, initially dominated by COVID-19 related uncertainty and then the slow market recoveries as economies around the world began to re-open.The JSE was up 52% year on year, while the Rand appreciated by 19% year on year against the US Dollar. Against this challenging economic backdrop, the trading desks have performed well, primarily focusing on client facilitation whilst maintaining low levels of open risk.
Utilisation of risk limits have remained moderate and the desks have remained prudent during the year.
Traded market risk governance structure
Traded market risk is governed by policies that cover the management, identification, measurement and monitoring of market risk. We have independent market risk teams in the UK and South Africa. These teams report into risk management in either the UK or South Africa where limits are approved, managed and monitored.
The market risk teams have reporting lines that are separate from the trading function, thereby ensuring independent oversight. The Market Risk Forum, mandated by the IBP and IBL BRCC, manages market risk in accordance with approved principles, policies and risk appetite. Trading desk risk limits are reviewed by the Market Risk Forum and approved by IBL Review ERRF or IBL ERC in South Africa and at IBP ERC in the UK in accordance with the risk appetite defined by the board. Any significant changes in risk limits would then be taken to Group ERC for review and approval. The appropriateness of limits is continually re-assessed, with limits reviewed at least annually, or in the event of a significant market event or at the discretion of senior management.
Measurement of traded market risk
A number of quantitative measures are used to monitor and limit exposure to traded market risk. These measures include:
• Value at Risk (VaR) and Expected Shortfall (ES) as portfolio measures of market risk exposure
• Scenario analysis, stress tests and tools based on extreme value theory (EVT) that measure the potential impact on portfolio values of extreme moves in markets
• Sensitivity analysis that measures the impact of individual market risk factor movements on specific instruments or portfolios, including interest rates, foreign exchange rates, equity prices, credit spreads and commodity prices. We use sensitivity measures to monitor and limit exposure across portfolios, products and risk types.
Stress and scenario analyses are used to add insight into the possible outcomes under severe market disruptions. The stress‑testing methodology assumes that all market factors move adversely at the same time and that no actions are taken during the stress events to mitigate risk. Stress scenarios based on historical experience as well as hypothetical scenarios are considered and are reviewed regularly for relevance in ever-changing market environments. Stress scenarios are run daily with analysis presented to IBL and IBP Review ERRF weekly as well as IBL BRCC and IBP BRCC when the committees meet or more often should market conditions require this.
Traded market risk management, monitoring and controlMarket risk limits are set according to guidelines set out in our risk appetite policy. Limits are set at trading desk level with aggregate risk across all desks also monitored against overall market risk appetite limits. Current market conditions as well as stressed market conditions are taken into account when setting and reviewing these limits.
Market risk teams review the market risks in the trading book with detailed risk reports produced daily for each trading desk and for the aggregate risk of the trading book. The material risks identified are summarised in daily reports that are distributed to, and discussed with senior management when required. The production of risk reports allows for the monitoring of all positions in the trading book against prescribed limits. Documented policies and procedures are in place to ensure
01 Risk disclosures Investec integrated annual report 2021
MARKET RISK
61

there is a formal process for recognition and authorisation for risk excesses incurred.
The risk management software is fully integrated with source trading systems, allowing valuation in risk and trading systems to be fully aligned. All valuation models are subject to independent validation by market risk ensuring models used for valuation and risk are validated independently of the front office.
Value at Risk
VaR is a technique that estimates the potential losses as a result of movements in market rates and prices over a specified time horizon at a given
level of confidence. The VaR model derives future scenarios from past time series of market rates and prices, taking into account inter-relationships between the different markets such as interest rates and foreign exchange rates. The VaR model used is based on full revaluation historical simulation and incorporates the following features:
• Two-year historical period based on an unweighted time series
• Daily movements in each risk factor e.g. foreign exchange rates, interest rates, equity prices, credit spreads and associated volatilities are simulated with reference to historical market rates and prices, with proxies only used when no or limited historical market data is available. In South
Africa, the resultant one-day VaR is scaled up using the square root of time for regulatory purposes
• Risk factor movements are based on both absolute and relative returns as appropriate for the different types of risk factors.
VaR numbers using a one-day holding period are monitored daily at the 95% and 99% confidence intervals, with limits set at the 95% confidence interval. Expected shortfalls are also monitored daily at the 95% and 99% levels as it is the worst case loss in the VaR distribution.
The table below contains the 95% one-day VaR figures for the trading businesses.
31 March 2021 31 March 202095% one-day VaR Year end Average High Low Year end Average High LowUK and OtherEquities (£’000) 435 828 2 021 302 1 549 571 1 549 286 Foreign exchange (£’000) 10 11 47 1 33 11 68 1 Interest rates (£’000) 42 52 94 17 82 107 132 67 Credit (£’000) 62 213 455 42 438 32 509 1 Consolidated (£’000)* 456 896 2 155 289 1 478 574 1 478 301 South AfricaCommodities (R’million) 0.4 0.2 0.7 — 0.1 0.1 0.3 — Equities (R’million) 5.1 5.9 10.2 3.4 5.8 4.2 8.1 3.0 Foreign exchange (R’million) 0.3 0.8 8.4 0.1 1.3 2.2 6.5 0.7 Interest rates (R’million) 1.8 3.9 7.7 1.8 2.9 2.3 5.4 0.8 Consolidated (R’million)* 5.5 7.6 12.8 4.9 6.9 5.3 10.0 3.4
* The consolidated VaR for each entity is lower than the sum of the individual VaRs. This arises from the correlation offset between various asset classes (diversification).
Expected shortfall
The ES measure overcomes some of VaR’s shortcomings. ES seeks to quantify losses encountered in the tail beyond the VaR level. The 95% one-day ES is the average loss given that the 95% one-day VaR level has been exceeded. The table below contains the 95% one-day ES figures.
95% one-day ES 31 March 2021 31 March 2020UK and OtherEquities (£’000) 901 1 966 Foreign exchange (£’000) 20 47 Interest rates (£’000) 66 107 Credit (£’000) 102 723 Consolidated (£’000)* 941 1 837 South AfricaCommodities (R’million) 0.9 0.1 Equities (R’million) 8.3 8.4 Foreign exchange (R’million) 0.5 1.6 Interest rates (R’million) 4.4 5.9 Consolidated (R’million)* 9.7 10.8
* The consolidated ES for each entity is lower than the sum of the individual ESs. This arises from the correlation offset between various asset classes.
01 Risk disclosures Investec integrated annual report 2021
MARKET RISKCONTINUED
62

Stressed VaR
Stressed VaR (sVaR) is calculated using the VaR model but based on a one-year period through which the relevant market factors experienced stress. The information in the table below contains the 99% one-day sVaR.
99% one-day sVaR 31 March 2021 31 March 2020
UK and Other (£’000) 722 2 878 South Africa (R’million) 12.5 24.9
Backtesting
The performance of the VaR model is regularly monitored through backtesting. This is done by comparing daily clean profit and loss against one-day VaR based on a 99% confidence level. Clean profit and loss excludes items such as intra-day transactions, valuation adjustments, provisions, recoveries, commission, fees and hedge costs included in the new trade revenue. If a loss exceeds the one-day VaR, a backtesting exception is considered to have occurred. Over time we expect the average rate of observed backtesting exceptions to be consistent with the percentile of the VaR statistic being tested. This is conducted at an aggregate and desk level on a daily basis. The graphs that follow show the result of backtesting the total daily 99% one-day VaR against the clean profit and loss data for our trading activities over the reporting period. Based on these graphs, we can gauge the accuracy of the VaR figures i.e. 99% of the time, losses are not expected to exceed the 99% one-day VaR.
UK and OtherThe average VaR for the year ended 31 March 2021 was higher than for the year ended 31 March 2020. Using clean profit and loss data for backtesting resulted in four exceptions over the year at the 99% confidence level, i.e. where the loss was greater than the 99% one-day VaR. This is slightly more than expected at this confidence level and is mainly due to the lingering volatility in equity markets, induced by the COVID-19 pandemic.
99% one-day VaR backtesting (£)
Clean P/L 99% one-day VaR
April2020
May2020
June2020
July2020
August2020
September2020
October2020
November2020
December2020
January2021
February2021
March2021
(6 000 000)
(5 000 000)
(4 000 000)
(3 000 000)
(2 000 000)
(1 000 000)
0
1 000 000
2 000 000
01 Risk disclosures Investec integrated annual report 2021
MARKET RISKCONTINUED
63

South AfricaThe average VaR for the year ended 31 March 2021 in the trading book was higher than for the year ended 31 March 2020 due to increased volatility throughout the year. Using clean profit and loss data for backtesting resulted in no exceptions over the year (as shown in the graph below), which is below the expected number of exceptions of two to three exceptions per annum that a 99% VaR model implies.
99% one-day VaR backtesting (Rand)
Clean P/L 99% one-day VaR
April2020
May2020
June2020
July2020
August2020
September2020
October2020
November2020
December2020
January2021
February2021
March2021
(60 000 000)
(50 000 000)
(40 000 000)
(30 000 000)
(20 000 000)
(10 000 000)
0
10 000 000
20 000 000
30 000 000
Stress testing
The table below indicates the potential losses that could arise in the trading book portfolio per EVT at the 99% confidence level. EVT is a methodology widely used to estimate tail-event losses beyond the 95% one-day VaR. These numbers do not assume normality but rather rely on fitting a distribution to the tails of the VaR distribution.
99% EVT 31 March 2021 31 March 2020
UK and OtherEquities (£’000) 5 315 3 433 Foreign exchange (£’000) 79 133 Interest rates (£’000) 134 201 Credit (£’000) 366 2 359 Consolidated (£’000)# 5 335 3 235 South AfricaCommodities (R’million) 5.0 0.6 Equities (R’million) 26.4 31.7 Foreign exchange (R’million) 2.0 3.4 Interest rates (R’million) 22.8 25.8 Consolidated (R’million)# 27.6 40.6
# The consolidated stress testing for each entity is lower than the sum of the individual stress test numbers. This arises from the correlation offset between various asset classes.
CapitalIn the UK, the market risk capital requirement is calculated using the standardised approach. For certain options, the group has an article 329 permission from the PRA to use an internal model to calculate the delta for these positions. In addition, the group has an article 331 permission which allows sensitivity models to be used when calculating the market risk position for certain instruments. In South Africa, we have internal model approval from the South African PA for general market risk for the majority of the trading desks and accordingly trading capital is calculated as a function of the 99% 10-day VaR as well as the 99% 10-day sVaR together with standardised specific risk capital for issuer risk.
01 Risk disclosures Investec integrated annual report 2021
MARKET RISKCONTINUED
64

Clean profit and loss histogramsUK and OtherThe histogram below illustrates the distribution of clean profit and loss during the financial year for our trading businesses. The graph shows that a clean profit was realised on 130 days out of a total of 253 days in the trading business. The average daily clean profit and loss generated for the year to 31 March 2021 was £446 (year to 31 March 2020: -£75 809).
Clean profit and loss (excluding fees and hedge costs included in new trade revenue)Frequency: Days in the year
52 4 3
7
14 16
28
44 46
29
21
4
10 11
2 2 2 3
Clean profit/loss earned per day (£’million)
<-1.8 -1.6 -1.4 -1.2 -1.0 -0.8 -0.6 -0.4 -0.2 0.0 0.2 0.4 0.6 0.8 1.0 1.2 1.4 1.6 >1.80
10
20
30
40
50
South AfricaThe histogram below illustrates the distribution of clean profit and loss during the financial year for our trading businesses. The distribution is skewed to the profit side and the graph shows that a clean profit was realised on 128 days out of a total of 250 days in the trading business. The average daily clean profit and loss generated for the year to 31 March 2021 was R0.5 million (year to 31 March 2020: R2.4 million).
Clean profit and loss (excluding fees and hedge costs included in new trade revenue)Frequency: Days in the year
813
20
40 41 43
34
23
13
69
Clean profit/loss earned per day (R’million)
<-12.5 -10.0 -7.5 -5.0 -2.5 0 2.5 5.0 7.5 10.0 >12.50
10
20
30
40
50
Revenue arising from customer flow trading activities
£’m
illion
51.0
12.3
63.3
-11.0
46.6
35.6
31 March 2020 31 March 2021
UK and Other Southern Africa Total-20.0
0.0
20.0
40.0
60.0
80.0
100.0
01 Risk disclosures Investec integrated annual report 2021
MARKET RISKCONTINUED
65

Market risk – derivativesThe group enters into various derivatives contracts, largely on the back of customer flow for hedging foreign exchange, interest rates, commodity, equity and credit exposures and to a small extent as principal for trading purposes. These include financial futures, options, swaps and forward rate agreements.
Information showing our derivative trading portfolio over the reporting period on the basis of the notional principal and the fair value of all derivatives can be found on page 94 in volume three.
The notional principal indicates our activity in the derivatives market and represents the aggregate size of total outstanding contracts at year end. The fair value of a derivative financial instrument represents the present value of the positive or negative cash flows which would have occurred had we closed out the rights and obligations arising from that instrument in an orderly market transaction at year end. Both these amounts reflect only derivatives exposure and exclude the value of the physical financial instruments used to hedge these positions.
01 Risk disclosures Investec integrated annual report 2021
MARKET RISKCONTINUED
66

Balance sheet risk managementBalance sheet risk encompasses the financial risks relating to our asset and liability portfolios, comprising liquidity, funding, concentration, encumbrance and non-trading interest rate risk.
Balance sheet risk governance structure and risk mitigationInvestec plc (and its subsidiaries) are ring-fenced from Investec Limited (and its subsidiaries), and vice versa. Both legal entities (and their subsidiaries) are therefore required to be self-funded, and manage their funding and liquidity as separate entities.
Risk appetite limits are set at the relevant board level and reviewed at least on an annual basis. The size, materiality, complexity, maturity and depth of the market as well as access to stable funds are all inputs considered when establishing the liquidity and non-trading interest rate risk appetite for each relevant region. Specific regulatory requirements may further dictate additional restrictions to be adopted in a region.
Under delegated authority of the respective boards, the group has established ALCOs within each banking entity, using regional expertise and local market access as appropriate. The ALCOs are mandated to ensure independent supervision of liquidity risk and non-trading interest rate risk within the risk appetite.
ALCOs meet on at least a monthly basis to review the exposures that lie within the balance sheet together with market conditions, and decide on strategies to mitigate any undesirable liquidity and interest rate risk. The Treasury function within each banking entity is mandated to holistically manage the liquidity mismatch and non-trading interest rate risk arising from our asset and liability portfolios on a day-to-day basis.
The Treasury function, by banking entity, is required to exercise tight control of liquidity, funding, concentration, encumbrance and non-trading interest rate risk within the board-approved risk appetite limits. Non-trading interest rate risk and asset funding requirements are transferred from the originating business to the Treasury function.
The Treasury function, by banking entity, directs pricing for all deposit products, establishes and maintains access to stable funds with the appropriate tenor and pricing characteristics, and manages liquid securities and collateral, thus providing
prudential management and a flexible response to volatile market conditions.
We maintain an internal funds transfer pricing system based on prevailing market rates. Our funds transfer pricing system charges the businesses the price of liquidity taking into account the behavioural duration of the asset. The costs and risks of liquidity are clearly and transparently attributed to business lines thereby ensuring that price of liquidity is integrated into business level decision-making and drives the appropriate mix of sources and uses of funds.
Balance sheet risk management teams are based within group risk management in their relevant regions and are responsible for identifying, quantifying and monitoring risks; providing daily independent governance and oversight of the treasury activities and the execution of the group’s policies.
There is a regular audit of the balance sheet risk management function, the frequency of which is determined by the relevant audit committees.
Daily, weekly and monthly reports are independently produced highlighting group activity, exposures and key measures against thresholds and limits and are distributed to management, ALCO, Treasury, IBL Review ERRF, IBP Review ERRF, IBL ERC, IBP ERC, IBL BRCC, IBP BRCC, and DLC BRCC as well as summarised reports for board meetings.
Liquidity riskLiquidity risk is further broken down into:
• Funding liquidity: this relates to the risk that the group will be unable to meet current and/or future cash flows or collateral requirements in the normal course of business, without adversely affecting its solvency, financial position or its reputation
• Market liquidity: this relates to the risk that the group may be unable to trade in specific markets or that it may only be able to do so with difficulty due to market disruptions or a lack of market liquidity.
Management and measurement of liquidity riskCohesive liquidity management is vital for protecting our depositors, preserving market confidence, safeguarding our reputation and ensuring sustainable growth with established funding sources. Through active liquidity management, we seek to preserve stable, reliable and cost-effective sources of funding. As such, the group considers ongoing access to appropriate
liquidity for all its operations to be of paramount importance, and our core liquidity philosophy is reflected in day-to-day practices which encompass the following robust and comprehensive set of policies and procedures for assessing, measuring and controlling liquidity risk:
• Our liquidity management processes encompass requirements set out within Basel Committee on Banking Supervision (BCBS) guidelines and by the regulatory authorities in each jurisdiction, namely the PRA, EBA, South African PA, BOM, GFSC and FINMA
• The risk appetite is clearly defined by the board and each geographic entity must have its own board-approved policies with respect to liquidity risk management
• We maintain a liquidity buffer in the form of unencumbered cash, government or rated securities (typically eligible for repurchase with the central bank), and near cash well in excess of the regulatory requirements as protection against unexpected disruptions in cash flows
• Funding is diversified with respect to currency, term, product, client type and counterparty to ensure a varied overall funding mix
• We monitor and evaluate each banking entity’s maturity ladder and funding gap (cash flow maturity mismatch) on a ‘liquidation’, ‘going concern’ and ‘stress’ basis
• The balance sheet risk management team independently monitors key daily funding metrics and liquidity ratios to assess potential risks to the liquidity position, which further act as early warning indicators of potential market disruptions
• The maintenance of sustainable prudent liquidity resources takes precedence over profitability
• The group maintains contingency funding plans designed to protect depositors, creditors and shareholders and maintain market confidence during adverse liquidity conditions.
We measure liquidity risk by quantifying and calculating various liquidity risk metrics and ratios to assess potential risks to the liquidity position. These include:
• Internal ‘survival horizon’ metric which models how many days it takes before the group’s cash position is depleted under an internally defined worst-case liquidity stress
• Regulatory metrics for liquidity measurement:
01 Risk disclosures Investec integrated annual report 2021
BALANCE SHEET RISK
67

– Liquidity Coverage Ratio (LCR)– Net Stable Funding Ratio (NSFR)
• Modelling a ‘business as usual’ environment where we apply rollover and reinvestment assumptions under benign market conditions
• An array of further liquidity stress tests, based on a range of scenarios and using historical analysis, documented experience and prudent judgement to model the impact on the group’s balance sheet
• Contractual run-off based actual cash flows with no modelling adjustments;
• Additional internally defined funding and balance sheet ratios
• Any other local regulatory requirements.
This suite of metrics ensures the smooth management of the day-to-day liquidity position within conservative parameters and further validates that we are able to generate sufficient liquidity to withstand a range of liquidity stresses or market disruptions.
The parameters used in stress scenarios are reviewed at least annually, taking into account changes in the business environments and input from business units. The objective is to analyse the possible impact of an economic event on the group’s balance sheet, so as to maintain sufficient liquidity and to continue to operate for a minimum period as detailed in the board-approved risk appetite.
We further carry out reverse stress tests to identify business model vulnerabilities which tests ‘tail risks’ that can be missed in normal stress tests. The group has calculated the severity of stress required to breach the liquidity requirements. This scenario is considered highly
unlikely given the group’s strong liquidity position, as it requires an extreme withdrawal of deposits combined with the inability to take any management actions to breach liquidity minima that threatens the group’s liquidity position.
The group operates an industry-recognised third party risk modelling system in addition to custom-built management information systems designed to measure and monitor liquidity risk on both a current and forward-looking basis.
Funding strategy We maintain a funding structure of stable customer deposits and long-term wholesale funding well in excess of funded assets. We target a diversified funding base, avoiding undue concentrations by investor type, maturity, market source, instrument and currency. As a result, we are able to generate funding from a broad range of sources in each geographic location, which ensures a varied overall funding mix to support loan growth.
We acknowledge the importance of our retail deposit client base as the principal source of stable and well diversified funding. We continue to develop products to attract and service the investment needs of our client base in line with our risk appetite.
Entities within the group actively participate in global financial markets and our relationship is continuously enhanced through regular investor presentations internationally. Entities are only allowed to have funding exposure to wholesale markets where they can demonstrate that the market is sufficiently deep and liquid, and then only relative to the size and complexity of their business as part of a diversified funding mix.
The group’s ability to access funding at cost-effective levels is influenced by maintaining or improving the entity’s credit rating. A reduction in these ratings could have an adverse effect on the group’s funding costs, and access to wholesale term funding. Credit ratings are dependent on multiple factors, including operating environment, business model, strategy, capital adequacy levels, quality of earnings, risk appetite and exposure, and control framework.
We remain confident in our ability to raise funding appropriate to our needs.
Liquidity bufferTo protect against potential shocks, we hold a liquidity buffer in the form of cash, unencumbered high quality liquid assets (typically in the form of government or rated securities eligible for repurchase with the central bank), and near cash, well in excess of the regulatory requirements as protection against disruptions in cash flows. These portfolios are managed within board-approved targets, and as well as providing a buffer under going concern conditions, also form an integral part of the broader liquidity generation strategy. The group remains a net liquidity provider to the interbank market, placing significantly more funds with other banks than our short-term interbank borrowings. We do not rely on overnight interbank deposits to fund term lending.
From 1 April 2020 to 31 March 2021 average cash and near cash balances over the period amounted to £13.4 billion (£6.6 billion in UK and Other; R143.5 billion in South Africa).
01 Risk disclosures Investec integrated annual report 2021
BALANCE SHEET RISKCONTINUED
68

Investec group cash and near cash trend£’million
Central Bank cash placements and guaranteed liquidity Cash Near cash (other 'monetisable' assets)
Apr2020
May2020
Jun2020
Jul2020
Aug2020
Sep2020
Oct2020
Nov2020
Dec2020
Jan2021
Feb2021
Mar2021
0
2 000
4 000
6 000
8 000
10 000
12 000
14 000
16 000
An analysis of cash and near cash at 31 March 2021
Total group Investec plc Investec Limited
£13 229 million £6 857 million R129 759 million
n Central Bank cash placements
and guaranteed liquidity 57.6% n Central Bank cash placements
and guaranteed liquidity 62.1% n Central Bank cash placements
and guaranteed liquidity 52.7%
n Cash 30.8% n Cash 30.5% n Cash 31.1%
n Near cash (other ‘monetisable’ assets)
11.6% n Near cash (other ‘monetisable’ assets)
7.4% n Near cash (other ‘monetisable’ assets)
16.2%
Bank and non-bank depositor concentration by type at 31 March 2021
UK and Other South Africa£17 431 million R396 280 million
n Individuals 62.6% n Non-bank financials 46.3%
n Other financial institutions and corporates 26.3% n Individuals 21.2%
n Banks 7.8% n Non-financial corporates 15.6%
n Small business 3.3% n Banks 5.6%
n Small business 5.2%
n Public sector 6.1%
01 Risk disclosures Investec integrated annual report 2021
BALANCE SHEET RISKCONTINUED
69

Contingency planningThe group maintains contingency funding plans which detail the course of actions that can be taken in the event of a liquidity stress. The plans help to ensure that cash flow estimates and commitments can be met in the event of general market disruption or adverse bank-specific events, while minimising detrimental long-term implications for the business. The plans include:
• Details on the required daily monitoring of the liquidity position
• Description of the early warning indicators to be monitored, and process of escalation if required
• Liquidity stress scenarios to be modelled for Contingency Funding Plan (CFP) purposes (over and above daily stress testing scenarios)
• Funding and management actions available for use in a stress situation
• Roles and responsibilities• Details of specific escalation bodies and key contacts• Internal and external communication plans.
The plans have been tested within our core jurisdictions via externally facilitated liquidity crisis simulation exercises which assess the group’s sustainability and ability to adequately contain a liquidity stress.
Asset encumbranceAn asset is defined as encumbered if it has been pledged as collateral against an existing liability and, as a result, is no longer available to the group to secure funding, satisfy collateral needs or be sold to reduce the funding requirement.
Within the UK, risk management monitors and manages total balance sheet encumbrance within a board-approved risk appetite limit. Asset encumbrance is one of the factors considered in the discussion of new products or new funding structures, and the impact on risk appetite is assessed.
The group uses secured transactions to manage short-term cash and collateral needs, and utilises securitisations in order to raise external term funding as part of its diversified liability base. Securitisation notes issued are also retained by the group which are eligible for the Bank of England’s Single Collateral Pool to support central bank liquidity facilities.
Encumbered assets are identified in accordance with the definitions under European Capital Requirements Regulation (CRR), and regular reporting is provided to the EBA and PRA. Further disclosures on encumbered and unencumbered assets can be found within the Investec plc Pillar III document.
On page 91 in volume three we disclose further details of assets that have been received as collateral under reverse repurchase agreements and securities borrowing transactions where the assets are allowed to be resold or pledged
01 Risk disclosures Investec integrated annual report 2021
BALANCE SHEET RISKCONTINUED
70

Liquidity mismatchThe tables that follow show the contractual and behavioural liquidity mismatch across our core geographies.
With respect to the contractual liquidity tables that follow, we record all assets and liabilities with the underlying contractual maturity as determined by the cash flow profile for each deal.
With respect to the behavioural liquidity gap, we adjust the contractual profile of certain assets and liabilities:
• Liquidity buffer: the actual contractual profile of the assets in the liquidity
buffer is of little consequence, as practically the group would meet any unexpected net cash outflows by repo’ing or selling these highly liquid securities. Consequently, for the liquidity buffer:– The time horizon to monetise our
regulatory liquid assets which are guaranteed by the central bank has been adjusted to ‘on demand
– The time horizon for the cash and near cash portfolio of discretionary treasury assets has been set to one month where there are deep secondary markets for this elective asset class
• Customer deposits: the contractual repayments of many deposits are on demand, or at notice, but in reality withdrawals vary significantly from this. Historical observations of the products are used to model the behavioural lives, and this analysis has identified significant additional sources of structural liquidity in the form of core deposits that exhibit stable behaviour.
UK and OtherContractual liquidity at 31 March 2021
£’million DemandUp to one
month
One tothree
monthsThree to
six months
Sixmonths to
one year
Oneto fiveyears
> Fiveyears Total
Cash and short-term funds – banks 4 255 115 — — 39 20 — 4 429 Investment/trading assets 996 663 358 534 401 1 323 1 473 5 748 Securitised assets — — — 2 1 9 95 107 Advances 84 444 671 740 1 353 6 642 2 525 12 459 Other assets 203 794 48 13 65 386 550 2 059 Assets 5 538 2 016 1 077 1 289 1 859 8 380 4 643 24 802 Deposits – banks (256) (56) — — (714) (327) — (1 353) Deposits – non-banks (6 163) (896) (2 717) (3 220) (991) (1 804) (287) (16 078) Negotiable paper (31) (4) (30) (7) (20) (1 218) (293) (1 603) Securitised liabilities — — (2) (2) (3) (33) (68) (108) Investment/trading liabilities (315) (143) (115) (73) (110) (365) — (1 121) Subordinated liabilities — — — — (334) — (437) (771) Other liabilities (140) (446) (68) (85) (123) (323) (76) (1 261) Liabilities (6 905) (1 545) (2 932) (3 387) (2 295) (4 070) (1 161) (22 295) Total equity — — — — — — (2 507) (2 507) Contractual liquidity gap (1 367) 471 (1 855) (2 098) (436) 4 310 975 — Cumulative liquidity gap (1 367) (896) (2 751) (4 849) (5 285) (975) —
Behavioural liquidity at 31 March 2021As discussed above.
£’million DemandUp to one
month
Oneto threemonths
Three tosix months
Sixmonths
to one year
Oneto fiveyears
> Fiveyears Total
Behavioural liquidity gap 3 381 267 (722) (1 256) (467) (2 012) 809 — Cumulative 3 381 3 648 2 926 1 670 1 203 (809) —
01 Risk disclosures Investec integrated annual report 2021
BALANCE SHEET RISKCONTINUED
71

Southern AfricaContractual liquidity at 31 March 2021
R’million DemandUp to one
month
One tothree
monthsThree to
six months
Sixmonths to
one year
Oneto fiveyears
> Fiveyears Total
Cash and short-term funds – banks 31 298 3 100 1 480 — — — — 35 878 Cash and short-term funds – non-banks 7 151 2 — — 184 1 103 516 8 956 Investment/trading assets and statutory liquids 33 741 48 768 11 020 6 794 6 482 45 914 38 732 191 451 Securitised assets 578 — — — — 4 092 4 092 8 762 Advances 4 563 7 005 8 295 11 094 21 014 114 008 114 091 280 070 Other assets 2 422 6 789 9 419 12 615 (216) 3 401 (10 874) 23 556 Assets 79 753 65 664 30 214 30 503 27 464 168 518 146 557 548 673 Deposits – banks (624) 9 740 (54) (191) (3 149) (27 774) — (22 052) Deposits – non-banks (167 552) (21 856) (79 585) (25 340) (36 707) (40 334) (2 854) (374 228) Negotiable paper — (281) (6) (682) (928) (4 167) (429) (6 493) Securitised liabilities — — — — — (1 830) (1 441) (3 271) Investment/trading liabilities (2 178) (16 538) (5 887) (4 474) (6 012) (12 386) (1 920) (49 395) Subordinated liabilities — (6) — (1 161) (4 330) (8 948) — (14 445) Other liabilities (2 889) (5 009) (1 498) (554) (385) (493) (7 333) (18 161) Liabilities (173 243) (33 950) (87 030) (32 402) (51 511) (95 932) (13 977) (488 045) Total equity — — — — — — (60 628) (60 628) Contractual liquidity gap (93 490) 31 714 (56 816) (1 899) (24 047) 72 586 71 952 — Cumulative liquidity gap (93 490) (61 776) (118 592) (120 491) (144 538) (71 952) —
Behavioural liquidity at 31 March 2021As discussed on page 71.
R’million DemandUp to one
month
Oneto threemonths
Three tosix months
Sixmonths to
one year
Oneto fiveyears
> Fiveyears Total
Behavioural liquidity gap 51 810 19 412 663 13 957 (7 611) (163 832) 85 601 — Cumulative 51 810 71 222 71 885 85 842 78 231 (85 601) —
01 Risk disclosures Investec integrated annual report 2021
BALANCE SHEET RISKCONTINUED
72

Non-trading interest rate risk Sources of interest rate risk in the banking book include:
• Repricing risk: arises from the timing differences in the fixed rate maturity and floating rate repricing of group assets, liabilities and off-balance sheet derivative positions. This affects the interest rate margin realised between lending income and borrowing costs when applied to our rate sensitive portfolios
• Yield curve risk: repricing mismatches also expose the group to changes in the slope and shape of the yield curve
• Basis risk: arises from imperfect correlation in the adjustments of the rates earned and paid on different instruments with otherwise similar repricing characteristics
• Embedded option risk: arises from optional elements embedded in items where the group or its customers can alter the level and timing of their cash flows
• Endowment risk: refers to the interest rate risk exposure arising from the net differential between interest rate insensitive assets, interest rate insensitive liabilities and capital.
The above sources of interest rate risk affect the interest rate margin realised between lending income and borrowing costs when applied to our rate sensitive asset and liability portfolios, which has a direct effect on future net interest earnings and the economic value of equity.
Measurement and management of non-trading interest rate riskNon-trading interest rate risk is an inherent consequence of conducting banking activities, and arises from the provision of non-trading banking products and services. The group considers the management of banking
margin of vital importance, and our non-trading interest rate risk philosophy is reflected in our day-to-day practices.
The aim of non-trading interest rate risk management is to protect and enhance net interest income and economic value of equity in accordance with the board-approved risk appetite, and to ensure a high degree of stability of the net interest margin over an interest rate cycle. Non-trading interest rate risk is measured and analysed by utilising standard tools of traditional interest rate repricing mismatch and net present value (NPV) sensitivity to changes in interest rate risk factors:
• Income metrics capture the change in accruals expected over a specified time horizon in response to a change in interest rates
• Economic value metrics capture all future cash flows in order to calculate the group’s net worth and therefore can highlight risks beyond the short-term earnings time horizon.
These metrics are used to assess and to communicate to senior management the financial impact of possible future interest rate scenarios, covering:
• Interest rate expectations and perceived risks to the central view
• Standard shocks to levels and shapes of interest rates and yield curves
• Historically-based yield curve changes.
The repricing gap provides a simple representation of the balance sheet, with the sensitivity of fair values and earnings to changes to interest rates calculated off the repricing gap. This also allows for the detection of interest rate risk concentration in specific repricing buckets. Net interest income sensitivity measures the change in accruals expected over the specified horizon in response to a shift in the yield
curve, while economic value sensitivity and stress testing to macro-economic movement or changes to the yield curve measures the interest risk implicit change in net worth as a result of a change in interest rates on the current values of financial assets and liabilities. Economic value measures have the advantage that all future cash flows are considered and therefore assess the risk beyond the earnings horizon.
Each banking entity has its own board-approved non-trading interest rate risk appetite, which is clearly defined in relation to both income risk and economic value risk. The group has limited appetite for non-trading interest rate risk.
Operationally, daily management of interest rate risk is centralised within the Treasury of each banking entity and is subject to local independent risk and ALCO review. Treasury mitigates any residual undesirable risk where possible, by changing the duration of the banking book’s discretionary liquid asset portfolio, or through derivative transactions. The Treasury mandate allows for a tactical response to market volatility which may arise during changing interest rate cycles, in order to hedge residual exposures. Any resultant interest rate position is managed under the market risk limits. Balance sheet risk management independently monitors a broad range of interest rate risk metrics to changes in interest rate risk factors, detailing the sources of interest rate exposure.
Automatic optionality arising from variable rate products with an embedded minimum lending rate serves as an income protection mechanism for the group against falling interest rates, while behavioural optionality risk from customers of fixed rate products is mitigated by early repayment charges.
01 Risk disclosures Investec integrated annual report 2021
BALANCE SHEET RISKCONTINUED
73

The tables that follow show our non-trading interest rate mismatch assuming no management intervention.
UK and OtherInterest rate sensitivity gap at 31 March 2021
£’million
Not> threemonths
> Threemonths
but < sixmonths
> Sixmonths
but < oneyear
> One yearbut < five
years> Fiveyears Non-rate
Total non-trading
Cash and short-term funds – banks 4 429 — — — — — 4 429 Investment/trading assets 3 124 227 208 136 49 703 4 447 Securitised assets 107 — — — — — 107 Advances 8 617 589 553 2 481 219 — 12 459 Other assets — — — — — 1 811 1 811 Assets 16 277 816 761 2 617 268 2 514 23 253 Deposits – banks (1 353) — — — — — (1 353) Deposits – non-banks (14 128) (464) (935) (546) (5) — (16 078) Negotiable paper (1 046) — — (400) — — (1 446) Securitised liabilities (108) — — — — — (108) Investment/trading liabilities (120) — — — — — (120) Subordinated liabilities (43) — — (728) — — (771) Other liabilities — — — — — (870) (870) Liabilities (16 798) (464) (935) (1 674) (5) (870) (20 746) Total equity — — — — — (2 507) (2 507) Balance sheet (521) 352 (174) 943 263 (863) — Off-balance sheet 1 174 (104) (7) (858) (205) — — Repricing gap 653 248 (181) 85 58 (863) — Cumulative repricing gap 653 901 720 805 863 —
Southern AfricaInterest rate sensitivity gap at 31 March 2021
R’million
Not> threemonths
> Threemonths
but < sixmonths
> Sixmonths
but < oneyear
> One yearbut < five
years> Five years Non-rate
Total non-trading
Cash and short-term funds – banks 25 206 — — — — 8 914 34 120 Cash and short-term funds – non-banks 8 753 — 180 — — — 8 933 Investment/trading assets and statutory liquids 53 342 8 438 11 444 29 084 8 204 51 376 161 888 Securitised assets 8 762 — — — — — 8 762 Advances 252 084 2 730 2 047 19 190 502 3 467 280 020 Other assets 5 031 (1 580) (4 349) 7 207 (447) 14 435 20 297 Assets 353 178 9 588 9 322 55 481 8 259 78 192 514 020 Deposits – banks (17 144) — — (4 908) — — (22 052) Deposits – non-banks (320 022) (14 018) (15 359) (8 361) (70) (16 364) (374 194) Negotiable paper (860) (255) (924) (4 119) (257) (78) (6 493) Securitised liabilities (3 271) — — — — — (3 271) Investment/trading liabilities (2 208) — — (1 316) — (5 397) (8 921) Subordinated liabilities (8 276) (190) (1 903) (4 069) — (7) (14 445) Other liabilities (3 789) — — — — (12 518) (16 307) Liabilities (355 570) (14 463) (18 186) (22 773) (327) (34 364) (445 683) Total equity (6 300) — — — — (54 328) (60 628) Balance sheet (8 692) (4 875) (8 864) 32 708 7 932 (10 500) 7 709 Off-balance sheet 18 960 3 263 7 964 (30 072) (7 824) — (7 709) Repricing gap 10 268 (1 612) (900) 2 636 108 (10 500) — Cumulative repricing gap 10 268 8 656 7 756 10 392 10 500 —
01 Risk disclosures Investec integrated annual report 2021
BALANCE SHEET RISKCONTINUED
74

Economic value sensitivity at 31 March 2021As outlined, non-trading interest rate risk is measured and monitored using an economic value sensitivity approach. The tables below reflect our economic value sensitivity to a 2% parallel shift in interest rates assuming no management intervention. This sensitivity effect would only have a negligible direct impact on our equity.
UK and Other
Sensitivity to the following interest rates (expressed in original currencies)
million GBP USD EUR AUD ZAROther (GBP) All (GBP)
200bps down 4.5 15.0 1.7 (2.7) (0.7) 0.1 15.4 200bps up (3.8) (12.6) (1.4) 2.3 0.6 — (12.9)
Southern Africa
Sensitivity to the following interest rates (expressed in original currencies)
million ZAR GBP USD EUR AUDOther (ZAR) All (ZAR)
200bps down (199.1) 0.7 (0.3) 0.5 — — (179.1) 200bps up 123.6 (1.8) 0.7 (1.1) (0.1) (6.5) 70.7
Interest rate risk - IBOR reform
Following the decision by global regulators to phase out IBORs and replace them with alternative reference rates, the group has established a project team to manage the transition of all contracts that could be affected. The project is being led by senior representatives from functions across the group including the client facing teams, Treasury, legal, finance, operations, risk and technology. The project team provides regular progress updates to the board and DLC BRCC. The group has in place detailed plans, processes and procedures to support the transition in line with both the milestones set by the IBOR working groups in each jurisdiction and the timelines set out in the pre-cessation announcement of the IBOR benchmarks by the FCA in March 2021.
During the financial year, the group has already successfully transitioned a portion of new business away from referencing IBOR to referencing alternative rates. Following the progress made to date, the group is confident that it has the operational capability to complete the transition to risk-free or other alternative rates. For other benchmark interest rates such as EURIBOR that have been reformed and can therefore continue,
financial instruments referencing those rates will not need to transition.
IBOR reform exposes the group to various risks, which the project is managing and monitoring closely.
These risks include but are not limited to the following:
• Conduct risk arising from discussions with clients and market counterparties due to the amendments required to existing contracts necessary to effect IBOR reform
• Business risk to the group and its clients that markets are disrupted due to IBOR reform giving rise to financial losses
• Pricing risk from the potential lack of market information if liquidity in IBORs reduces and risk-free rates are illiquid and unobservable
• Operational risk arising from changes to the group’s IT systems and processes, also the risk of payments being disrupted if an IBOR ceases to be available
• Accounting risk if the group’s hedging relationships fail and from unrepresentative income statement volatility as financial instruments transition to risk-free rates.
01 Risk disclosures Investec integrated annual report 2021
BALANCE SHEET RISKCONTINUED
75

The tables that follow summarise the significant exposures impacted by interest rate benchmark reform as at 31 March 2021:
UK and Other
GBPIBOR - no. of trades
GBP - Notional value (£’million)
OtherIBOR - no. of trades
Other - Notional value (£’million)
Pre-2022 dated instrumentsDerivatives 126 2 663 113 3 746 Sovereign debt securities — — 1 11 Other debt securities — — — — Reverse repurchase agreements and cash collateral on securities borrowed — — 1 73 Loans and advances to customers 491 982 104 196
Of which undrawn — 178 — 57 Customer accounts (deposits) 43 44 32 31 Post-2022 dated instrumentsDerivatives 613 11 054 769 20 681 Other debt securities 51 256 69 306 Reverse repurchase agreements and cash collateral on securities borrowed — — — — Loans and advances to customers 897 3 363 257 1 694
Of which undrawn — 590 — 295 Other loans and advances 7 17 21 103 Customer accounts (deposits) 21 30 12 449
South Africa
GBPIBOR - no. of trades
GBP - Notional value (R’million)
OtherIBOR - no. of trades
Other - Notional value (R’million)
Pre-2022 dated instrumentsDerivatives 26 8 158 109 31 291 Other debt securities — — 1 111 Reverse repurchase agreements and cash collateral on securities borrowed — — 18 2 637 Loans and advances to banks — — 2 519 Loans and advances to customers 33 1 556 118 9 570
Of which undrawn 4 177 12 1 388 Customer accounts (deposits) 427 1 269 2 451 12 898 Post-2022 dated instrumentsDerivatives 45 8 030 399 64 910 Bank debt securities — — 17 496 Other debt securities 2 931 4 2 256 Reverse repurchase agreements and cash collateral on securities borrowed — — 11 2 266 Loans and advances to customers 154 7 396 162 11 728
Of which undrawn 7 1 608 13 1 784 Customer accounts (deposits) 6 30 89 15 812
In March 2021, the ICE Benchmark Administration (the administrator of LIBOR), in conjunction with the UK’s Financial Conduct Authority (FCA) announced that it will stop publishing the following LIBOR settings based on submissions from panel banks, after 31 December 2021: all GBP, EUR, CHF and JPY LIBOR settings and the one-week and two-month USD LIBOR settings. All remaining USD LIBOR settings (i.e., the overnight and the one-, three-, six- and 12-month settings) will cease to be published based on panel bank submissions after 30 June 2023.
01 Risk disclosures Investec integrated annual report 2021
BALANCE SHEET RISKCONTINUED
76

Regulatory requirementsLiquidity riskIn response to the 2008/09 global financial crisis, the BCBS introduced a series of reforms designed to both strengthen and harmonise global liquidity standards to ensure strong financial risk management and a safer global economy.
Two minimum standards for funding liquidity were introduced:
• The liquidity coverage ratio (LCR) is designed to ensure that banks have sufficient high quality liquid assets to meet their liquidity needs throughout a 30-calendar day severe stress
• The net stable funding ratio (NSFR) is designed to capture structural issues over a longer time horizon by requiring banks to have a sustainable maturity structure of assets and liabilities.
UK and OtherFollowing the UK’s departure from the EU, the PRA have exercised temporary transitional powers (TTP), meaning that EU regulation in place prior to the end of the transition period largely remains valid in the UK until 31 March 2022.
As such, the Investec plc and IBP (solo basis) LCRs are calculated following the EU Delegated Act and our own interpretations where the regulation calls for it. Banks are required to maintain a minimum LCR of 100%. As at 31 March 2021 the LCR reported to the PRA was 440% for Investec plc and 475% for IBP (solo basis).
Within the UK, the NSFR will be onshored by the PRA and expected to become a binding requirement for banks in January 2022. Banks will be required to maintain a minimum NSFR of 100%. In the meantime, our internally calculated NSFR is based on the version published in the EU Official Journal in June 2019, and our own interpretations where required. The NSFR at 31 March 2021 was 129% for Investec plc and 126% for IBP (solo basis).
Both the LCR and NSFR may change over time with updates to our methodologies and interpretations, and following any clarifications of guidelines.
Investec plc undertakes an annual ILAAP which documents the approach to liquidity management across the firm, including IBP (solo basis). This document is reviewed and approved by IBP BRCC, DLC BRCC and by the IBP and DLC
boards before being provided to the PRA for use, alongside the Liquidity Supervisory Review and Evaluation Process, to determine the bank’s Individual Liquidity Guidance, also known as a Pillar II requirement.
Southern AfricaSouth Africa, a member of the G20, has adopted the published BCBS guidelines for ‘liquidity risk measurement standards and monitoring’.
There are certain shortcomings and constraints in the South African environment and the banking sector in Southern Africa is characterised by certain structural features such as:
• A low discretionary savings rate and a higher degree of contractual savings that are captured by institutions such as pension funds, provident funds and providers of asset management services
• There is currently no ‘deposit protection scheme’ in South Africa. However, the regulators plan to incorporate a deposit protection scheme within the broader amendments to the recovery and resolution framework.
There are various regulatory and economic barriers that prevent liquidity from flowing out of the domestic economy. Namely, the South African exchange control regulations that limits capital flows, along with prudential requirements on financial corporates.
A positive consequence of the above is that the Rand funding that the South African banks use is contained within the financial system and therefore the Rand is unlikely to be drained by currency withdrawal from offshore sources, or placements in offshore accounts.
To address this systemic challenge, the South African PA exercised national discretion and has announced a change to the available stable funding factor to include 35% of financial sector deposits that are less than six months in tenor. This, in turn, would reduce the amount of term deposits greater than six months in tenor, currently required by local banks to meet the NSFR, mitigating any increases in the overall cost of funds.
Despite the above constraints, IBL comfortably exceeds the LCR and NSFR liquidity ratio requirements, having embedded these ratios into our processes. The minimum requirement
for LCR is 80%, reduced from 100% until such time as the South African PA is of the view that the financial markets have normalised. The minimum requirement for NSFR is 100%.
The South African PA noted that the South African HQLA shortage has continued to decrease such that the continued provision of the Committed Liquidity Facility (CLF) was unlikely to meet the qualifying criteria set out in the Basel III Framework and subsequently announced it would phase out the CLF over a period of three years by December 2021. IBL does not currently make use of the CLF.
Non-trading interest rate riskIn 2016, the BCBS finalised their standards for non-trading interest rate risk which recommended the risk is assessed as part of the bank’s capital requirements, outlined six prescribed shock scenarios, and recommended enhanced disclosure requirements for supervisors to implement.
UK and OtherWithin the UK, the PRA have published new binding rules on interest rate risk arising from non-trading activities, which will become effective on 31 December 2021. In the meantime, banks are expected to continue to be compliant with EBA guidelines.
The regulatory framework requires banks to assess their Pillar II requirements, including those related to non-trading interest rate risk, as part of their ICAAP. This is reviewed on at least an annual basis and reviewed and approved by IBP BRCC, DLC BRCC and by the IBP and DLC boards.
Southern AfricaThe South African PA has announced that it will adopt the new Interest Rate Risk in the Banking Book (IRRBB) regulatory reforms as outlined in BCBS 368. Implementation of new IRRBB standards is scheduled for June 2021 allowing for a year parallel run, with the regulatory compliance deadline and public IRRBB disclosure following in June 2022. IBL currently submits relevant regulatory output to the South African PA on a monthly basis and aims to be compliant with all aspects of the new IRRBB regulatory reforms when formally adopted by the South African PA.
01 Risk disclosures Investec integrated annual report 2021
BALANCE SHEET RISKCONTINUED
77

Balance sheet risk year in reviewThe group maintained its strong liquidity position and continues to hold high levels of surplus liquid assets. Our liquidity risk management process remains robust and comprehensive.
UK and OtherFunding continues to be raised through a diverse mix of customer liabilities by customer type, currency, channel and tenor, avoiding reliance on any particular channel and ensuring continued access to a wide range of deposits. Throughout the past year, the group has proven capable of raising funding from a broad range of sources, despite the impact of the COVID-19 pandemic. We have launched a new digital retail product offering, Online Flexisaver, which has delivered strong growth. Additionally, the group has made the decision to cease issuance of new structured deposits and notes.
The cost of raising customer deposits has decreased in line with trends in the market in the months following the cut in bank rate by the BoE in March 2020 but we also remain focused on reducing our cost of raising those customer deposits by migrating to a lower cost digital product base. Overall liability growth is still managed in line to support asset growth.
We have limited reliance on wholesale funding, but we continue to pursue strategic opportunities to raise low cost, term currency funding where appropriate and refinance any maturing funds ahead of contractual requirements.
During the year, IBP became eligible to participate in the BoE Term Funding Scheme with additional incentives for Small and Medium Enterprises (TFSME) albeit no drawings have been made to date. An inaugural Euro-denominated senior unsecured issuance was also successfully priced, broadening the debt capital markets investor base and providing an additional source of non-Sterling currency.
This overall approach has enabled the group to still maintain a strong liquidity position at the year-end across a range of metrics in line with our conservative approach to balance sheet risk management.
Cash and near cash balances at 31 March 2021 amounted to £6.9 billion (31 March 2020: £6.0 billion). Total UK and Other customer deposits was £16.1 billion at 31 March 2021 (31 March 2020: £15.3 billion).
Looking forward, the focus remains on maintaining a strong liquidity position. Funding continues to be actively raised, focused on the strategy to reduce the overall cost of the liability base supported by stable credit ratings.
Refer to page 5 for further detail on credit ratings
Southern AfricaThe financial year started with South Africa entering strict social containment measures. We comfortably navigated thin markets characterised by periods of elevated illiquidity. In a coordinated effort with other central banks, the SARB moved quickly to restore liquidity in the markets by aggressively cutting interest rates, offering unlimited purchases of South African bonds in secondary market and providing term secured funding facilities to banks. In addition the South African Government launched a COVID-19 Loan Scheme of R200 billion to support South African business. These actions brought certainty back to the markets and restored investor confidence.
Funding continues to be raised through a diverse mix of customer liabilities by customer type, currency, channel and tenor, the focus remains strengthening the group’s structural funding profile through growing the retail deposit base and introducing a transactional deposit offering. Activity in the wholesale markets over the financial year has been limited but we continue to look for opportunities to raise low-cost funding where appropriate and carefully manage maturity profiles across all major currencies. Investec closely monitors its cost of funding as this has a direct impact on the ability to write assets at competitive levels.
We maintained $1.9 billion of strategic long-term non-ZAR funding from diversified sources across the globe and took advantage of dislocations in the swap market to boost cheap term Dollar holdings via cross currency swaps. IBL customer deposits totalled R374.4 billion as of 31 March 2021. Our private client funding initiatives had a pleasing year in the face of increased competition for retail deposits and uncertainty brought about by the COVID-19 pandemic, delivering 4.6% growth to close the year at R158.5 billion in line with strategic funding objectives. We continue to see deposit growth in our Private Banking franchise.
Cash and near cash balances on 31 March 2021 amounted to R129.8 billion (31 March 2020: R147.2 billion). This enabled Investec to comfortably navigate the COVID-19 crisis and stand ready to grow core advances.
Consistent with our liquidity management philosophy, we delivered liquidity ratios well above the regulatory requirements. For IBL (solo), the 90-day simple average LCR ended the financial year at 150.2%. The structural funding ratio represented by the NSFR ended the year at 112.8% as at 31 March 2021.
01 Risk disclosures Investec integrated annual report 2021
BALANCE SHEET RISKCONTINUED
78

Operational riskOperational risk is an inherent risk in the ordinary course of business activity. The group aims to appropriately identify and manage operational risk within acceptable levels by adopting sound operational risk management practices which are fit for purpose.
Risk appetiteOperational risk appetite is defined as the level of risk exposure that is acceptable to the board in order to achieve its business and strategic objectives. The board is responsible for setting and regularly reviewing the risk appetite. The operational risk appetite policy defines the amount of operational risk exposure, or potential adverse impact of a risk event, that the group is willing to accept.
Operational risks are managed in accordance with the approved risk appetite. Any breaches of limits are escalated via subsidiary board risk committees to the DLC BRCC on a regular basis.
Management and measurement of operational riskRegulatory capitalThe group applies the standardised approach (TSA) for the assessment of regulatory capital.
As part of the Basel III Reforms in 2014, the BCBS announced revisions to the calculations of capital requirements for operational risk. A single standardised approach was proposed to replace all existing approaches for the calculation of regulatory capital. The final implementation date has been postponed to 2023. The group will continue to work closely with regulators and industry bodies on the implementation of the revisions.
Operational risk management framework and governanceIn line with regulatory developments, the operational risk management framework is embedded at all levels of the group, supported by the risk culture and enhanced on an ongoing basis. Policies, practices and processes that facilitate operational risk identification, assessment, mitigation, monitoring and reporting of operational risk are included in the framework.
Operational risk is managed in line with the group’s levels of defence approach which reinforces accountability by allocating roles and responsibilities.
The group’s operational risk profile is reported on a regular basis to various operational risk forums and governance committees responsible for oversight.
Risk reports are used to monitor the operational risk profile on an ongoing basis, which contributes to sound risk management and decision-making by the board and management.
The operational risk framework is continually enhanced in line with regulatory developments and sound practices. Interactions with regulators promote an understanding of expectations and informs the approach to regulatory developments and requirements. The awareness of sound practice is achieved through interaction with industry counterparts at formal industry forums.
Operational risk practices consist of the following:
Risk and control assessments Internal risk events External risk events Key risk indicators
Scenario analysis and capital calculation
DescriptionForward-looking qualitative assessments performed on key business processes. These assessments enable business units to identify, manage and monitor operational risks and controls
Internal risk events are analysed to enable business to identify and monitor trends in addition to addressing control weaknesses
An external data service is used to provide operational risk events from other organisations. These events are analysed to enhance our control environment. The external risk events also inform operational risk scenarios
Indicators are used to monitor risk exposures against identified thresholds. The output provides predictive capability in assessing the risk profile of the business
Extreme, unexpected, but plausible scenarios are assessed to identify and manage significant operational risk exposures. The results of this evaluation provide input to determine internal operational risk capital requirements
Operational risk year in reviewIn response to the global COVID-19 pandemic, our priority was the safety of our staff and the continuous servicing of our clients, whilst remaining fully operational with business-as-usual processes and controls. To this end, the group upgraded and improved the robustness of its technology infrastructure through increased capacity and security measures so as to facilitate a safe and durable global working environment for all staff.
Operational risk eventsThe group continued to manage risk events within the agreed board-approved operational risk appetite statement. The ‘execution delivery and process management failures’ (EDPM) and ‘external fraud’ Basel categories are the drivers of risk events from a count and value perspective. There have been no marked increase in EDPM or fraud losses directly attributable to the pandemic. However, various costs such as travel cancellation fees, marketing event cancellation costs and costs associated with the ability to continue to operate as an organisation under lockdown conditions attributed to COVID-19, were considered as operational risk losses given their unexpected nature. It should be noted that Investec made significant cost
savings from reduced travel, marketing events and closure of offices which offset these costs, but these were not recognised in operational risk losses in accordance with regulatory requirements. Overall causal analysis is performed on risk events to determine the reason for their occurrence and to identify and implement appropriate actions required to strengthen the associated control environment.
01 Risk disclosures Investec integrated annual report 2021
OPERATIONAL RISK
79

Looking forwardKey operational risk priorities for the year ahead:
DEFINITION OF RISK MANAGEMENT AND MITIGATION APPROACHES
Business disruption and operational resilienceRisk associated with disruptive incidents which can impact premises, staff, equipment, systems, and key business processes
• Effectively responding to significant business disruptions based on commitment and support of senior management and a dedicated team with robust governance processes
• Understanding and mitigating risk to lessen the impact of disruptions• Establishing ‘fit for purpose’ and practical plans that include assurances of third party continued
support under distressed situations• Regularly reviewing, validating and updating of business continuity plans and strategies• Embedding business continuity practices through awareness training and validations• Applying effective policy and programme management principles• Adhering to defined legal and regulatory requirements• Participating in regulatory and financial industry resilience activities to collaboratively minimise
national systemic community risk
ConductRisk that inappropriate behaviours or business activities may lead to client, counterparty or market detriment and/ or reputational and/or financial damage to the group and/or erosion of Investec values, culture and ethical standards expected of its staff
• Strong organisational culture and values, which form the cornerstone of Investec’s behaviour towards all stakeholders
• Appropriate controls and processes that deliver fair customer outcomes are in place• Monitoring of the group’s delivery of fair customer outcomes through conduct governance
structures• Surveillance arrangements are in place across all trading activity and related communications• Continued cooperation with regulatory authorities and other stakeholders which include industry
bodies on conduct risk issues• Promoting awareness of conduct related matters across the group through appropriate employee
training and communication to drive responsible behaviour
Cyber securityRisk associated with cyber-attacks which can result in data compromise, interruption to business processes or client services, financial losses, or reputational harm
• Maintaining a risk-based strategy integrating prediction, prevention, detection and response capabilities
• Continually enhancing the security architecture using advanced technology, research and threat intelligence, to protect against evolving threats and sophisticated attacks
• Improving cyber resilience through ongoing coordination across cyber, incident response, operational resilience and crisis management processes
• Stress testing of cyber controls through security assessments, red team exercises and attack simulations, run both internally and in conjunction with independent external specialists
• Embedding secure software development to ensure IT systems are secure by design• Provision of ongoing security training to staff to ensure high levels of awareness and vigilance
Data managementRisk associated with poor governance in acquiring, processing, storing, and protecting data
• Establishing consistent mechanisms for unified data consolidation, storage and reporting• Enhancing system integration and automating feeds to reduce the need for manual tasks, minimise
data processing delays and eliminate single points of failure• Monitoring, reporting on, and enhancing data quality and aggregation, in line with business needs
and regulatory principles• Safeguarding internal and external information flows to preserve data completeness and integrity• Obtaining predictive intelligence through data analytics to support proactive risk management• Maintaining data retention and destruction processes to meet business needs• Comply with applicable legal obligations
01 Risk disclosures Investec integrated annual report 2021
OPERATIONAL RISKCONTINUED
80

DEFINITION OF RISK MANAGEMENT AND MITIGATION APPROACHES
Financial crimeRisk associated with money laundering, terrorist financing, bribery and corruption
• Implementing and continuously enhancing our anti-money laundering (AML) controls and combating the financing of terrorism (CFT), sanctions, anti-bribery and corruption (ABC) policies and control mechanisms
• Ongoing sophistication of risk management methodologies to optimally allocate resources toward higher risk areas
• Continuously enhancing and further automating our transaction monitoring capabilities, increasing detection and prevention of money laundering, terrorist financing and proliferation financing
• Monitoring local and international legislative and best-practice developments and assimilate into Investec’s controls
• Mandatory training for all staff and specialist training for anti-financial crime roles• Industry participation to manage legislative requirements through engagement with regulators
FraudRisk associated with fraud, corruption, theft, forgery and integrity misconduct by staff, clients, suppliers and other stakeholders
• Evolving the group’s global approach to fraud management through a holistic framework and consistent policies, standards and methodologies, while acknowledging there will always be geographical and cultural impacts that need to be considered
• Utilising third party vendors to help in the systematic, real time identification of potential fraud and reaching out to our clients where appropriate to validate or discuss concerns
• Maintaining an independent integrity (whistleblowing) line to ensure staff can report regulatory breaches, allegations of fraud, bribery and corruption, and non-compliance with policies
• Conducting of fraud risk assessments to proactively identify and map existing preventative and detective controls to the relevant fraud risks, and evaluate whether the identified controls are operating effectively
• Enhancing fraud detection and prevention controls in response to the continued upward trend in fraud and operational losses due to fraud attempts
• Maintaining relevance of all aspects of the group’s fraud prevention framework in light of the changing risks and remote working environment caused by the global COVID-19 pandemic
• Maintaining collaboration with other financial institutions in fraud prevention to recover funds that have been paid away
• Proactive monitoring of adherence to fraud prevention policies and embedding of practices which comply with updated regulations, industry guidance and best practice
• Continuing to create awareness of existing and horizon fraud threats by focusing on training staff, educating clients and intermediaries on fraud prevention and detection
• Participating in industry working groups to gain an understanding of current trends in order to enhance the control environment
Information securityRisk associated with the unauthorised access, use, disclosure, modification or destruction of data, which can impact their confidentiality, integrity, or availability
• Protecting high value information assets based on confidentiality and business criticality• Implementing intelligent data loss prevention controls to protect against unauthorised access or
disclosure of information• Managing role-based access to systems and data and controlled privileged IT access, supported by
risk-aligned access and activity monitoring• Ensuring the secure configuration of systems in line with internal policies and standards to protect
against compromise and unauthorised access• Maintaining safeguards to protect confidential physical documents and facilitate secure destruction• Continually improving data breach monitoring and response in line with relevant privacy laws
01 Risk disclosures Investec integrated annual report 2021
OPERATIONAL RISKCONTINUED
81

DEFINITION OF RISK MANAGEMENT AND MITIGATION APPROACHES
ModelRisk associated with the adverse consequences from decisions based on incorrect or misused model outputs and reports. Risk may be due to errors in the model, implementation of the model, use of the model or inherent limitations of the model
• Embedding appropriate governance and oversight of the development, validation and approval of key risk and financial models
• Maintaining regular review cycles of key risk and financial models; the frequency and scale of which is determined by their assessed risk
• Driving automation of models testing to validate model outputs • Further enhancements of exception reporting to proactively identify potential data errors feeding
into the risk and financial models thereby providing assurance on data integrity
Process failureRisk associated with inadequate internal processes, including human error and control failure within the business. This includes process origination, execution and operations
• Proactive assessment relating to new products and projects to identify and implement adequate and effective controls including the management of change
• Addressing human errors through training, improvement of processes and controls, including automation of processes where possible
• Segregation of duties and appropriate authorisation controls• Causal analysis is used to identify weaknesses in controls following the occurrence of risk events• Risk and performance indicators are used to monitor the effectiveness of controls across business
units• Thematic reviews across business units to ensure consistent and efficient application of controls
Regulatory complianceRisk associated with identification, implementation and monitoring of compliance with regulations
• Group compliance and group legal assist in the management of regulatory and compliance risk which includes the identification and adherence to legal and regulatory requirements
• Aligning and effecting regulatory and compliance approach to reflect new regulatory landscapes particularly the change of regulatory structures (e.g: transitioning from IBOR to risk-free rates)
• Managing business impact and implementation challenges as a result of significant volumes of statutory and regulatory changes and developments
• Monitoring remains focused appropriately as areas of conduct and regulatory risk develop• Ensuring that the business is appropriately positioned to cope with the regulatory changes resulting
from geopolitical riskTechnologyRisk associated with disruption to the IT systems which underpin our critical business processes and client services
• Implementing strategic roadmaps that leverage new technologies and reduce reliance on legacy IT systems
• Leveraging cloud based and cloud native services to drive innovation while enhancing capacity, scalability, security and resilience
• Driving automation to reduce human error whilst enhancing efficiency• Continuing to align technology standards across the group, to reduce complexity and leverage
common functions and services• Maintaining proactive monitoring of the IT environment, for continual visibility of health and
performance• Continuously improving IT resilience capabilities to withstand failure and minimise service disruption
Third partyRisk associated with the reliance on, and use of a service provider to provide services to the group
• Appropriate due diligence is in place to assess and approve third party arrangements• Policies and practices include adequate guidance over the assessment, selection, suitability and
oversight of third party service providers• Continuing to strengthen governance processes and relevant policies relating to how to identify,
assess, mitigate and manage risks across the range of third party service providers• Repeatable processes to facilitate both upfront and periodic evaluation based on the size,
materiality, security and service provision of the third party
InsuranceThe group maintains adequate insurance to cover key insurable risks. The insurance process and requirements are managed by the group insurance risk manager. Regular interaction between operational risk management and insurance risk management ensures that there is an exchange of information in order to enhance the mitigation of operational risk.
01 Risk disclosures Investec integrated annual report 2021
OPERATIONAL RISKCONTINUED
82

Reputational and strategic riskThe group aspires to maintain an excellent reputation for entrepreneurship, strong risk management discipline, a client-centric approach and an ability to be flexible and innovative. The group recognises the serious consequences of any adverse publicity or damage to reputation, whatever the underlying cause.
We have various policies and practices to mitigate reputational risk, including strong values that are regularly and proactively reinforced. We also subscribe to sound corporate governance practices, which require that activities, processes and decisions are based on carefully considered principles. We are aware of the impact of practices that may result in a breakdown of trust and confidence in the organisation. The group’s policies and practices are regularly reinforced through transparent communication, accurate reporting, continuous group culture and values assessment, internal audit and regulatory compliance review, and risk management practices. As one of our core values and philosophies, we demand cast iron integrity in all internal and external dealings, consistently and uncompromisingly displaying moral strength and behaviour which promotes trust. Strategic and reputational risk is mitigated as much as possible through these detailed processes and governance/escalation procedures from business units to the board, and from regular, clear communication with shareholders, customers and all
stakeholders. In addition, the group’s policy is to avoid any transaction, service or association which may bring with it the risk of potential damage to our reputation. Transaction approval governance structures such as credit and new product committees have therefore been tasked with this responsibility in relation to all new business undertaken. The group also has a disclosure and public communications policy which is reviewed annually by the board.
Legal riskOur objective is to identify, manage, monitor and mitigate legal risks throughout the group. We seek to actively mitigate these risks by identifying them, setting minimum standards for their management and allocating clear responsibility for such management to legal risk managers, as well as ensuring compliance through proactive monitoring.
The scope of our activities is continuously reviewed and includes, among other things, the following areas:
• Commercial contracts with service providers
• Legislation/governance• Litigation• Corporate events• Incident or crisis management• Ongoing quality control.
Overall responsibility for this policy rests with the board. The board delegates responsibility for implementation of the policy to the South African and UK head of legal risk respectively.
The legal risk policy is implemented through:
• Identification and ongoing review of areas where legal risk is found to be present
• Allocation of responsibility for the development of procedures for management and mitigation of these risks
• Installation of appropriate segregation of duties, so that legal documentation is reviewed and executed with the appropriate level of independence from the persons involved in proposing or promoting the transaction
• Ongoing examination of the inter-relationship between legal risk and other areas of risk management, so as to ensure that there are no ‘gaps’ in the risk management process
• Establishing minimum standards for mitigating and controlling each risk. This is the nature and extent of work to be undertaken by our internal and external legal resources
• Establishing procedures to monitor compliance, taking into account the required minimum standards
• Establishing legal risk forums (bringing together the various legal risk managers) to ensure we keep abreast of developments and changes in the nature and extent of our activities, and to benchmark our processes against best practice.
01 Risk disclosures Investec integrated annual report 2021
REPUTATIONAL, STRATEGIC AND LEGAL RISK
83

ComplianceRegulatory change continues to be a key feature in the financial sector with ongoing global political events adding uncertainty as to the shape of financial services regulation going forward. Technological risk and social concerns, including environmental sustainability, are increasingly being addressed through regulation.
Global regulators expect financial services institutions to implement robust governance arrangements to enhance stability and ensure financial services are delivered in an appropriate manner. Regulators continue to focus on promoting resilience in financial markets, with sustained emphasis on recovery and resolution plans and structural enhancements to the banking sector as well as customer and market conduct related reforms.
Non-financial risks such as cyber security breaches and employee misconduct are a focus for regulators to ensure that consumers are appropriately protected and that stakeholders are treated appropriately. The maintenance of data quality and security remains a high priority for the banking industry and its regulators, in order to increase the efficiency of delivery and strengthen oversight.
In 2017 the FCA announced that it will no longer compel panel banks to submit the rates required to calculate London Interbank-Offered Rate (LIBOR) after the end of 2021. The FCA has subsequently clarified that all market participants are required to have removed dependencies on LIBOR, by the end of 2021 and that market participants should start transitioning from the use of LIBOR to alternative benchmark rates. Investec has established a group-wide project to manage this transition focusing on a number of key work streams including the management of conduct, legal and commercial risks that arise from this transition as well as to ensure adequate and appropriate communications with our clients in order to help them manage the impact this may have on their business with us. Investec has contacted all existing clients with LIBOR products, amended sales and other processes as regards the continued sale of LIBOR linked products and has commenced due diligence of existing contracts with a view to remediating such contracts as soon as practical.
The group remains focused on maintaining the highest levels of compliance in relation to regulatory requirements and integrity in all of our jurisdictions. Our culture is central to our
compliance framework and is supported by robust policies, processes and talented professionals who ensure that the interests of our customers and shareholders remain at the forefront of everything we do.
UK and OtherConduct risk and consumer protectionThe FCA has maintained its focus and approach to managing conduct risk across the financial services industry. During the period, the FCA has continued to focus on advancing its three operational objectives: securing an appropriate degree of protection for consumers; protecting and enhancing the integrity of the UK financial system; and promoting effective competition in the interest of consumers. Since the beginning of the pandemic, the FCA’s main priority was to protect vulnerable customers by raising awareness of the increased risk of financial scams, ensuring that customers maintain access to financial services, and continue to be treated fairly. The FCA has issued a range of forbearance measures such as mortgage repayment holiday, capital payment and interest freezes on certain type of lending facilities, and a temporary ban on repossessions to support customers through the pandemic. Another key area of focus was ensuring appropriate management of conduct risks arising from LIBOR transition and Brexit. The FCA has also re-iterated the importance of ensuring that firms’ systems and controls continue to prevent market abuse in remote working environments. In terms of enforcement actions, the FCA imposed a number of fines for unfair treatment of customers in arrears, breaches of client assets rules and market abuse.
The FCA expects all institutions to have a robust conduct risk management framework in place to facilitate a culture that delivers good outcomes for clients, counterparties and the markets and holds their staff and senior management to appropriate standards of competence, integrity and ethical behaviour. Specifically, UK institutions are expected to be able to demonstrate that their culture, governance and approach to rewarding and managing staff, are at all times aligned to the interests of customers and the institutions’ other stakeholders.
As a result, institutions are expected to look across their business models and strategies and assess how to balance the pursuit of profits with good outcomes for clients and proper standards of market conduct. Institutions are also required to have
appropriate policies and frameworks in place to manage non-financial misconduct such as discrimination, bullying, harassment, sexual misconduct or victimisation. Institutions are required to create an environment in which it is safe to speak up, the best talent is retained and the best risk decisions are taken.
Culture, conduct and good governance are ongoing themes which underline much of the FCA’s approach with focus on the role of the individual as well as the institution. The FCA has considered the role of leaders, incentives and capabilities and governance of decision-making.
The board, along with senior management, are ultimately responsible for Investec’s culture and conduct risk frameworks. Investec has continued over the period to focus on enhancements to our conduct risk management framework to ensure consistent delivery of good customer outcomes and effective management of conduct risk throughout our business. This has included strengthening business-led identification and management of conduct risk, improvements to the product review and approval process, robust processes for dealing with regulatory and conduct breaches and a sustained focus on maintaining the highest levels of regulatory compliance throughout our business. Investec’s conduct risk management in the UK is underpinned by the Senior Manager and Certification Regime which strengthens individual accountability and sets minimum standards of individual behaviour in financial services.
Financial crimeFinancial crime continues to be an increasing regulatory focus, with regulators globally encouraging firms to adopt a dynamic approach to the management of risk and to increase efforts around systems and controls to combat money laundering, tax evasion and bribery and corruption. The FCA Business Plan also highlights financial crime (frauds and scams) and AML as one of their key cross-sector priorities with a particular focus on the harm caused by money laundering within capital markets. The group maintains robust due diligence with relevant policies, procedures and training, in order to guard against the risks of financial crime.
BrexitThe Brexit transition period ended on 31 December 2020 with no deal on financial services. As of 1 January 2021,
01 Risk disclosures Investec integrated annual report 2021
COMPLIANCE
84

UK firms lost their passporting rights to provide banking and investment services to clients based in the EU. In line with external legal advice, Investec has exited a number of clients in EU jurisdictions where it was no longer possible to continue providing banking or investment services. Investec Europe Limited (IEL), a fully licensed Irish MiFID firm, provides a range of MiFID services to new and existing EU clients that can no longer be serviced by Investec Bank plc. Investec is able to offer corporate lending in a small number of EU countries subject to local exemptions. Investec is monitoring further EU developments, most notably any potential decision about regulatory equivalence of the UK financial services regime which would allow the UK bank wider access to EU clients.
Tax reporting (FATCA, CRS, MDR and DAC6)The Foreign Account Tax Compliance Act (FATCA) aims to promote cross-border tax compliance by implementing an international standard for the automatic exchange of tax information relating to US investors. The provisions call on tax authorities worldwide, to obtain on an annual basis, detailed account information from financial institutions relating to US investors and exchange that information automatically, with the United States Internal Revenue Service.
The OECD took further steps to improve global cross-border tax compliance by releasing the Common Reporting Standard (CRS). The CRS is a set of global standards for the annual exchange of financial information by financial institutions pertaining to customers, ultimately to the tax authorities of the jurisdictions in which those customers are resident for tax purposes. Investec plc is compliant with obligations under FATCA and CRS in all relevant jurisdictions.
The OECD published Mandatory Disclosure Rules that aim to provide tax administrations with information on CRS avoidance arrangements and opaque offshore structures, including the users of those arrangements and structures and those involved with facilitation. Many CRS jurisdictions such as the Channel Islands have now incorporated this into domestic law. Following suit, the EU introduced its own Mandatory Disclosure Regime in relation to cross-border tax arrangements, commonly known as DAC6. This regime applies to cross-border tax arrangements, which meet one or more specified characteristics (Hallmarks) and which concern either more than one EU
country, or an EU country and a non-EU country.
On 4 January 2021, the UK Tax Authorities (HMRC) confirmed that the UK will no longer apply DAC6 reporting in its entirety following the conclusion of the Free Trade Agreement with the EU. Only arrangements that would be within the scope of CRS will now need to be reported which is in line with the OECD’s Mandatory Disclosure Rules.
South AfricaConduct risk and consumer protectionThe South African regulators have renewed and refocused efforts to ensure that the South African financial sector provides clients with good-value products in order to receive and make payments, save, borrow and insure against daily risks. To this end, a strong market conduct policy is a critical pillar in building a financial sector that delivers these outcomes. The required structural regulatory reform has progressed, with the Financial Sector Regulation Act 9 of 2017 (FSR Act) which came into effect in April 2018, with the established two new authorities, namely the South African PA and a dedicated market conduct authority, the Financial Sector Conduct Authority (FSCA). The South African PA continues with its mandate to prudentially regulate financial institutions by supervising the financial safety and soundness of financial institutions. The regulatory reform will continue for at least the next couple of years.
The FSCA is responsible for the regulation and supervision of financial institution that provide financial products and financial services i.e. financial institutions that are licensed in terms of a financial sector law. The FSCA’s key objective is to enhance and support the efficiency and integrity of financial markets, to protect financial customers by promoting their fair treatment by financial institutions and financial inclusion. The FSCA expects all licensed financial institutions to act with integrity and to treat their customers fairly. Furthermore, the FSCA expects financial institutions to have a culture that is conducive to consumer protection and market integrity, supported by a conduct risk framework.
The second draft Conduct of the Financial Institutions Bill (COFI Bill) was published for comment in September 2020. It is envisaged that the COFI Bill, once enacted, will consolidate and strengthen conduct laws and further ensure financial inclusion and transformation of the financial sector. The Bill further establishes binding principles that reflect the outcomes that
the financial sector will be expected to meet.
Culture and governance are some of the underlying themes of the COFI Bill and the FSCA’s expectation is that financial institutions have good governance frameworks. The FSCA places ultimate responsibility on Investec’s board for its corporate culture, governance arrangements and conduct risk framework.
As part of the FSCA’s rolling out of conduct legislation, particularly for the banking sector, the FSCA finalised and enacted the Conduct Standard for Banks. The main objective of the Conduct Standard is to introduce requirements ensuring the fair treatment of customers of banks, in relation to the provision of financial products and financial services. The Conduct Standard for Banks is based on the principles of treating customers fairly (TCF) outcomes and it requires banks to conduct its business in a manner that prioritises the fair treatment of financial customers.
Investec remains highly focused on managing conduct risk across the organisation. Investec’s approach to conduct risk is driven by its values and philosophies, which include ‘client focus’ and ‘cast iron integrity’. The implementation of appropriate standards of conduct enables Investec and its subsidiaries to operate responsibly, appropriately and with integrity in the wholesale and retail markets with the fair treatment of customers being the highest priority. The group ensures that its products and services are scrutinised and regularly reviewed to ensure that they continue to deliver value and perform as expected. In addition, a conducive business environment has been created to enable client protection and market integrity within the financial markets that we operate in. This environment is supported with the appropriate conduct risk management framework and governance arrangements such as the DLC Customer Market and Conduct Committee that is mandated by the board to continuously review the conduct risk management of Investec to ensure that the best standards of market conduct, in its broadest form, are applied across the business.
Other significant, relevant regulatory developments impacting Investec include updates regarding the Code of Banking Practice, Retail Banking Diagnostic; Banking Ombudsman Vulnerable Consumers Policy; Declaration of crypto assets as a
01 Risk disclosures Investec integrated annual report 2021
COMPLIANCECONTINUED
85

financial product under the Financial and Intermediary Services Act; the Regulating Open Finance Consultation and Research paper and the consultation paper on Open Banking.
The Information Regulator welcomed the issuing of the Proclamation by the President for the commencement of certain sections of the Protection of Personal Information Act (POPIA). In terms of the Proclamation, the main sections of POPIA came into effect on the 1 July 2020, with POPIA granting public and private bodies a grace period of a year up to 1 July 2021 in which to comply. The remaining sections relating to the transfer of the enforcement of the Promotion of Access to Information Act (PAIA) from the South African Human Rights Commission (SAHRC) to the Regulator will come into effect on 30 June 2021. In addition, the Regulator has published Guidelines for the development of a Code of Conduct as well as a Guidance Note on applications for prior authorisation.
Risks related to data protection remain a key concern for Investec and a comprehensive privacy programme is in place to ensure compliance with regulatory requirements.
Financial crimeFinancial crime remains a key regulatory focus for the group. The economic and social impact of financial crime within South Africa, especially corruption, has led us to continuously monitor local and global developments and assimilate these into our AML, CFT, Sanctions and anti-bribery and corruption practices.
We continue to enhance our risk-based response to ever-evolving criminal typologies. Changes introduced by the Financial Intelligence Centre Amendment Act, 2017 (Act No 1 of 2017) placed more ownership on financial institutions to design control mechanisms commensurate to its risks, which in turn enabled efforts to be focused on perceived higher risks. We have embraced the use of technology to aid in understanding our client risk profiles and improve our ability to monitor client transactions and behaviour.
At the end of 2019, the South-African Anti-Money Laundering Integrated Taskforce (SAMLIT), a public-private partnership whose membership includes certain banks, the Financial Intelligence Centre and other law-enforcement agencies, was formed. Investec is an active participant in the structures and steering committee of SAMLIT, which has already made great strides in combatting corruption in 2020.
Tax reporting (FATCA/CRS)South Africa and Mauritius have inter-governmental agreements in place with the USA and each have enacted local law/regulation to implement FATCA. This allows South Africa and Mauritius to be treated as participating countries. This means that financial institutions in these countries report information annually on US clients (or non-compliant clients) to the South African Revenue Services (SARS) and the local Mauritian authority respectively. These authorities in turn exchange information with the USA which reciprocates with similar information (on South African and Mauritian tax residents respectively who hold financial accounts in the US). Both South Africa and Mauritius are in the process of preparing their annual FATCA reports.
The OECD took further steps to improve global cross-border tax compliance by releasing the Common Reporting Standard (CRS). The CRS is a set of global standards for the annual exchange of financial information by financial institutions pertaining to customers, ultimately to the tax authorities of the jurisdictions in which those customers are resident for tax purposes. Both South Africa and Mauritius have opted to comply with the CRS, however South Africa opted for the ‘wider-wider approach’ which means that South African reporting financial institutions are required to collect tax-related information on all clients, rather than only in respect of the 102 countries which have currently opted into CRS. Both South Africa and Mauritius are in the process of preparing their annual CRS reports.
The OECD recently published Mandatory Disclosure Rules (MDR) that aim to provide tax administrations with information on CRS avoidance arrangements and opaque offshore structures, including the users of those arrangement and structures and those involved with facilitation. South Africa has incorporated the MDR into revised CRS Regulations which reporting provisions come into effect on 1 March 2023.
01 Risk disclosures Investec integrated annual report 2021
COMPLIANCECONTINUED
86

Recovery and resolution planningThe purpose of the recovery plans are to document how the board and management will plan for recovery from extreme financial stress to avoid liquidity and capital difficulties in Investec plc and Investec Limited. The plans are reviewed and approved by the board on an annual basis.
The recovery plans for Investec plc and Investec Limited:
• Integrate with existing contingency planning
• Identify roles and responsibilities• Identify early warning indicators and
trigger levels• Analyse how the group could be
affected by the stresses under various scenarios
• Include potential recovery actions available to the board and management to respond to the situation, including immediate, intermediate and strategic actions
• Analyses the recovery potential as a result of these actions to avoid resolution.
UKThe Bank Recovery and Resolution Directive (BRRD) was implemented in the UK via the UK Banking Act 2009. It was recently amended by the BRRD (Amendment) (EU Exit) Regulation 2020, which implemented into UK law certain amendments to the BRRD which were required to be implemented prior to the UK leaving the EU.
The BoE, the UK resolution authority, has the power to intervene in and resolve a financial institution that is no longer viable. This is achieved through the use of various resolution tools, including the transfer of business and creditor financed recapitalisation (bail-in within resolution) that allocates losses to shareholders and unsecured and uninsured creditors in their order of seniority, at a regulator determined point of non-viability that may precede insolvency.
The PRA has made rules that require authorised institutions to draw up recovery plans and resolution packs. Recovery plans are designed to outline credible recovery options that authorised institutions could implement in the event of severe stress in order to restore their business to a stable and sustainable condition. The resolution pack contains detailed information on the services provided, as well as the structure and operation of the authorised institution in question which will be used by the BoE to develop resolution strategies for that specific institution, assess its current level of resolvability against the strategy, and to inform work on identifying barriers to the implementation of operational resolution plans.
In line with PRA and onshored EU requirements, Investec plc maintains a resolution pack and a recovery plan. Even though the recovery plan is framed at Investec plc level, given that IBP constitutes over 73% Investec plc’s balance sheet, the focus of this document is the recovery of IBP and the protection of its depositors and other clients.
Similarly, the resolution pack is drafted for Investec plc. As Investec plc is a financial holding company and IBP is its most significant entity, the Investec plc resolution strategy is expected to be driven and determined by the resolution strategy for IBP.
The BoE confirmed in March 2021 the preferred resolution strategy for IBP remains Modified Insolvency and the Minimum Requirement for own funds and Eligible Liabilities (MREL) requirement is set as equal to IBP’s Total Capital Requirement (Pillar 1 plus Pillar 2A).
Southern AfricaFinancial Stability Board member countries are required to have recovery and resolution plans in place for all systemically significant financial institutions. The South African PA has adopted this requirement and has to date required South African domestically significant banking institutions to develop recovery plans. Guidance issued by the Financial Stability Board and the South African PA has been incorporated into the group’s recovery plan. The Financial Sector Laws Amendment Bill (FSLAB) was recently tabled in Parliament. The bill is part of the Twin Peaks reforms of the South African financial sector regulatory system and intends on reinforcing and strengthening financial stability in South Africa. The underlying policy’s approach
to resolution is contained in two policy papers, namely ‘Strengthening South Africa’s Resolution Framework for Financial Institutions’ and ‘Designing a Deposit Insurance Scheme for South Africa’. The group continues to participate in banking sector discussions relating to the new bill. We will be subject to this legislation once it is adopted.
01 Risk disclosures Investec integrated annual report 2021
RECOVERY AND RESOLUTION PLANNING
87

Capital management and allocation Investec Limited (and its subsidiaries) and Investec plc (and its subsidiaries) are managed independently and have their respective capital bases ring-fenced, however, the governance of capital management is consistent across the two groups. The DLC structure requires the two groups to independently manage each group’s balance sheet and capital is managed on this basis.
This approach is overseen by the DLC BRCC (via the Investec DLC capital committee) which is a board sub-committee with ultimate responsibility for the capital adequacy of both Investec Limited and Investec plc.
A summary of capital adequacy and leverage ratios
Standardised FIRBIncreased AIRB
scopeºº Standardised FIRB
Investecplcº * IBPº *
InvestecLimited* ^ IBL* ^
InvestecLimited* ^ IBL* ^
Investecplcº * # IBPº * #
InvestecLimited* ^ IBL* ^
31 March 2021 31 March 2020
Common Equity Tier 1 ratio** 11.2% 12.0% 12.2% 13.3% 12.8% 14.0% 10.7% 11.5% 10.9% 12.1% Common Equity Tier 1 ratio (fully loaded)*** 10.7% 11.5% 12.2% 13.3% 12.8% 14.0% 10.3% 11.1% 10.9% 12.1% Tier 1 ratio** 12.8% 13.6% 12.8% 13.7% 13.4% 14.4% 12.4% 13.1% 11.5% 12.3% Total capital ratio** 15.1% 16.6% 16.0% 17.8% 16.6% 18.6% 14.9% 16.5% 15.0% 16.4% Risk-weighted assets (million)** 16 332 15 789 351 125 329 366 336 629 314 843 16 285 15 808 337 755 319 090Leverage exposure measure (million) 26 675 26 351 593 944 555 992 594 059 556 110 25 869 25 719 604 762 571 144Leverage ratio^^ 7.9% 8.1% 7.6% 8.1% 7.6% 8.1% 7.8% 8.0% 6.4% 6.9% Leverage ratio (fully loaded)*** 7.5% 7.8% 7.5% 8.1% 7.5% 8.1% 7.4% 7.8% 6.3% 6.8% Leverage ratio (UK leverage ratio framework)^^^ 9.2% 9.5% n/a n/a n/a n/a 8.9% 9.2% n/a n/a
* Where: IBP is Investec Bank plc consolidated and IBL is Investec Bank Limited. The information for Investec plc includes the information for IBP. The information for Investec Limited includes the information for IBL.
** The CET1, Tier 1 and total capital adequacy ratios and RWAs are calculated applying the IFRS 9 transitional arrangements.*** The CET1 ratio (fully loaded) and the leverage ratio (fully loaded) assumes full adoption of IFRS 9 and full adoption of all CRD IV rules of South African
Prudential Authority regulations. As a result of the adoption of IFRS 9, Investec plc elected to designate its subordinated fixed rate medium-term notes due in 2022 at fair value. By the time of full adoption of IFRS 9 in 2023, these subordinated liabilities will have reached final maturity and will be redeemed at par value. The remaining interest rate portion of the fair value adjustment at 30 September 2020 of £3 million (post-taxation), has therefore been excluded from the fully loaded ratios as it will be released into profit and loss over the remaining life of the instrument.
º The capital adequacy disclosures follow Investec’s normal basis of presentation so as to show a consistent basis of calculation across the jurisdictions in which the group operates. For Investec plc and Investec Bank plc this does not include the deduction of foreseeable charges and dividends when calculating the CET1 ratio as required under the Capital Requirements Regulation. The impact of this deduction totalling £25 million (31 March 2020: £0 million) for Investec plc and £25 million (31 March 2020: £0 million) for IBP would lower the CET1 ratio by 17bps (31 March 2020: 0bps) and 16bps(31 March 2020: 0bps) respectively.
ºº Investec Limited received approval to adopt the AIRB approach for the SME and Corporate models, effective 1 April 2021. We present numbers on a pro-forma basis for 31 March 2021.
# Where applicable, the 31 March 2020 comparatives for leverage have been restated to account for the reclassification of gilts and total return swaps. The restatements are detailed on page 141 of volume 3.
^ Investec Limited’s and IBL’s capital information includes unappropriated profits. If unappropriated profits are excluded from capital information, Investec Limited’s and IBL’s CET1 ratio would be 39bps (31 March 2020: 24bps) and 48bps (31 March 2020: 15bps) lower.
^^ The leverage ratios are calculated on an end-quarter basis.^^^ Investec plc is not subject to the UK leverage ratio framework; however, for comparative purposes this ratio has been disclosed. This framework excludes
qualifying central bank balances from the calculation of the leverage exposure measure. Investec LimitedCurrent regulatory frameworkInvestec Limited applies the Basel Framework, as published in December 2019 and updated on 22 January 2021, at every tier within the banking group and also on a fully consolidated basis. Investec Limited is regulated by the South African Prudential Authority (PA) in terms of the Banks Act, 1990 (Act No. 94 of 1990) and the Regulations relating to Banks (the Regulations), as published on 12 December 2012 with subsequent amendments in 27 March 2015 and 18 December 2020.
Investec Limited is designated by the South African PA, as a Systemically Important Financial Institution as well as a Domestically Significant Important Bank (D-SIB) in South Africa. However,
Investec Limited and its subsidiaries has not been designated as a Financial Conglomerate in terms of the FSR Act.
Regulated subsidiaries of Investec Limited may be subject to additional regulations as implemented by local regulators in their respective jurisdictions. Where capital is a relevant consideration, management within each regulated entity pays close attention to prevailing local regulatory rules as determined by their respective regulators.
For the year ended 31 March 2021, Investec calculated its minimum capital requirements in respect of:
• Credit risk for the retail portfolios using the Advanced Internal Ratings-
• Based (AIRB) Approach, and wholesale portfolios using the FIRB approach
• Credit risk for Investec Bank Mauritius and non-bank subsidiaries using the standardised approach
• Counterparty credit risk exposure using SA-CCR
• Operational risk capital requirement is calculated on the standardised approach
• Equity risk is calculated using the Internal Ratings-based approach by applying the simple risk-weight method
• Market risk using an internal risk management model, approved by the South African PA.
01 Risk disclosures Investec integrated annual report 2021
CAPITAL MANAGEMENT AND ALLOCATION
88

Year under review At 31 March 2021, the CET1 ratio increased to 12.2% from 10.9% at 31 March 2020. CET1 capital increased by R6.1 billion to R43 billion, largely affected by:
• Positive attributable earnings post-taxation and minorities of R3.9 billion
• Recovery of available for Sale Reserve of R2.9 billion, mainly as a result of the revaluation of OCI.
The increases were partially offset by:
• Total ordinary dividends paid to Ltd shareholders of R747 million
• R213 million increase in the PVA haircut due to implementation of new methodology in September 2020.
Risk-weighted assets (RWAs) increased by 4% from R337.8 billion (March 2020) to R351.1 billion (March 2021) predominantly within credit risk RWAs.
Credit risk RWAs, which include equity risk, increased by 4.7% or R14.5 billion. The increase is largely as a result of book growth, credit rating deterioration and valuing derivatives on the new regulatory methodology (SA-CCR) across counterparty credit risk and credit valuation adjustment (CVA). A portion of our investment in Ninety One plc is deducted from CET1 capital and the balance included in equity risk, risk-weighted at 318%.
Market risk RWAs decreased by 3.7% or R175 million. Initially market risk capital increased at the start of the 12 months under review due to more volatile historical data being included in the VaR scenarios since the COVID-19 pandemic hit in March 2020. A decrease was seen in the last quarter of 2021 as lower VaR figures entered the 60-day averaging period.
Operational risk for Investec Limited decreased by 3.4% or R945 million. This calculation is updated bi-annually and is based on a three-year rolling gross income before impairments average balance.
The group’s leverage ratio increased to 7.6% (March 2021) from 6.4% (March 2020).
Minimum capital requirementInvestec Limited’s minimum CET1 requirement at 31 March 2021 is 7.25% comprising a 4.5% Pillar 1 minimum requirement, a 2.5% Capital Conservation Buffer (CCB), a 0.25% Domestically Significant Import (D-SIB) Buffer and a 0% Countercyclical Capital Buffer (CCyB), but excludes the Bank-specific ICR add-on (Pillar 2B). South
Africa has not announced any CCyB requirements for 2021. As at 31 March 2021, Investec Limited is holding an institution specific CCyB, held for purposes of the reciprocity requirement, of 0% of risk-weighted exposures. From April 2020, the South African Prudential Authority announced that with immediate effect the SA Pillar 2A rate be reduced to 0% in response to the economic shock arising from COVID-19. At 31 March 2021 the SA Pillar 2A rate has remained at 0%, however it is expected to be fully reinstated to 1% by 1 January 2022.
Significant regulatory developments in the periodIn response to pressures on banks’ capital supply brought about by the COVID-19 pandemic, the South African PA implemented specific measures during 2020, to provide temporary capital relief to enable banks to counter economic risks to the financial system as a whole. Most notably, the Pillar 2A capital requirement was reduced to 0% and banks were requested to conserve capital by considering the adequacy of their current and projected capital and profitability levels, internal capital targets and risk appetite, as well as current and potential future risks of the global pandemic when making distributions of dividends on ordinary shares and payments of cash bonuses to executive officers and material risk takers in 2021.
Furthermore, Banks Act Directive 5 of 2021, sets out the capital framework for South Africa banks based on Basel III, was amended to reinstate the full Pillar 2A requirement, and also requires the D-SIB capital add-on to be fully met with CET1 capital and be disclosed as part of the composition of regulatory capital disclosures, from 1 January 2022.
The Regulations were amended, effective 1 January 2021, to incorporate the new standards for measuring capital requirements for Counterparty Credit Risk exposures (SA-CCR), Equity investment in funds, Bank Exposures to Central Clearing Counterparties and the calculation of the derivative exposure amount for the purposes of determining the leverage ratio.
Further amendments to the Regulations are expected in June/July 2021, related to the revised securitisation framework, the Large Exposure framework and Total Loss Absorption Capacity requirements.
The Financial Sector Laws Amendment Bill (FSLAB) is expected be enacted into law in South Africa during Q2/3 of 2021 that will impact the way in which Investec will conduct an open-bank
resolution approach and measure total loss absorbency requirements. It is also expected that the FSLAB provide clarity regarding the treatment of perpetual preference shares for purposes of regulatory capital.
Investec Limited continues to assess and monitor the impact of new regulations and regulatory reforms through participation in industry Quantitative Impact Studies submissions to the PA, contributing to industry consultations and discussions at the Banking Association of South Africa and quantifying the impact of the reforms and presenting the impact on Investec Limited at Capital Committees and to the Board.
Investec plcCurrent regulatory frameworkInvestec plc is authorised by the PRA and is regulated by the FCA and the PRA on a consolidated basis. Investec plc calculates capital resources and requirements using the Basel III framework, as implemented in the European Union through the Capital Requirements Regulation (CRR) and the Capital Requirements Directive IV (CRD IV), as amended by CRR II and CRD V. Following the end of the Brexit transitional period, the EU rules (including binding technical standards) have been onshored and now form part of domestic law in the UK by virtue of the European Union (Withdrawal) Act 2018. The PRA confirmed it would make use of temporary transitional powers at the end of the Brexit transitional period, which allows UK regulators to phase-in changes to UK regulatory requirements, enabling firms to adjust to the UK’s post-transition period regime in an orderly way. The relief will be available for a period of 15 months from the end of the transitional period until 31 March 2022.
Investec plc applies the standardised approach to calculate credit risk and counterparty credit risk, securitisation risk, operational risk and market risk capital requirements. Subsidiaries of Investec plc may be subject to additional regulations as implemented by local regulators in their respective jurisdictions. Where capital is a relevant consideration, management within each regulated entity pays close attention to prevailing local regulatory rules as determined by their respective regulators.
01 Risk disclosures Investec integrated annual report 2021
CAPITAL MANAGEMENT AND ALLOCATIONCONTINUED
89
Year under review During the year under review, Investec plc complied with the capital adequacy requirements imposed on it by the PRA. Investec plc continues to hold capital in excess of all the capital and buffer requirements. At 31 March 2021, the CET1 ratio increased to 11.2% from 10.7% at 31 March 2020. CET1 capital increased by £79 million to £1.8 billion, mainly as a result of:
• CET1 generation through net profit and loss of £70 million
• An increase in other comprehensive income of £95 million (including the fair value uplift on our investment in Ninety One plc), partially offset by an £85 million increase in the deduction applied to financial sector entities which exceed the 10% threshold
• An increase of £6 million in the IFRS 9 transitional add-back adjustment as a result of the adoption of the quick fix amendments to the CRR in June 2020. The amended regulations allowed new provisions recognised in 2020 and 2021 for financial assets that are not credit-impaired to be added back to CET1 capital
• A decrease of £19 million in the goodwill and intangible assets net of deferred taxation deduction, primarily driven by the impairment of goodwill of £11 million relating to Investec Ireland. The goodwill has been written off as a result of the change in business following the Brexit impact and as such there is limited linkage remaining between the business acquisition which gave rise to the goodwill and the ongoing business in Ireland.
The increases were partially offset by:
• Dividends paid to ordinary shareholders and Additional Tier 1 security holders of £35 million
• An increase in treasury shares of £8 million.
RWAs increased by 0.3% or £47million to £16.3 billion over the period, predominantly within credit risk RWAs.
Credit risk RWAs, which include equity risk, increased by £315 million. The increase in mainly driven by growth in private client lending, predominately HNW mortgages and other HNW lending. In addition, the portion of our Investment in Ninety One plc, which is not deducted from CET1 capital, is risk-weighted at 250% and is included in equity risk.
Counterparty credit risk decreased by £230 million driven by a reduction in the volume of commodity swaps traded
during the year and further reduction in counterparty credit risk exposures due to the recovery in interest rates and commodity prices, relative to 31 March 2020.
Market risk RWAs increased by £44 million, mainly due to an increase in collective investment undertaking risk due to a change in the capital treatment applied to these positions, partially offset by a decrease in foreign exchange risk due to the strengthening of GBP against the EUR and USD and a decrease in equity and interest rate risk due to market normalisation and risk reduction.
Operational risk RWAs decreased by £82 million, due to a reduction in the three-year average operating income used to determine the capital requirement.
The group's leverage ratio remained relatively flat at 7.9%.
Minimum capital requirementInvestec plc’s minimum CET1 requirement at 31 March 2021 is 7.5% comprising a 4.5% Pillar 1 minimum requirement, a 2.5% CCB, a 0.47% Pillar 2A requirement and a 0.03% CCyB. The group’s institution specific CCyB requirement is calculated based on the relevant exposures held in jurisdictions in which a buffer rate has been set. On 11 March 2020, the Financial Policy Committee (FPC) announced that with immediate effect the UK CCyB rate be reduced to 0% in response to the economic shock arising from COVID-19. At 31 March 2021 the UK CCyB rate has remained at 0%.
In response to the economic shock from COVID-19, the PRA announced in May 2020 that firms subject to a Supervisory Review and Evaluation Process (SREP) in 2020 and 2021 would have their Pillar 2A capital requirements set as a nominal amount, instead of a percentage of risk-weighted assets (RWAs). Firms not subject to a SREP in 2020 may apply for a conversion of their current Pillar 2A requirement into a nominal amount using RWAs as of end-December 2019. This change would apply until the next regulatory-scheduled SREP. Investec plc’s Pillar 2A capital requirement has been converted into a nominal capital amount. In addition, on 16 December 2020, the PRA confirmed that it would reduce the group’s Pillar 2A minimum requirement to reflect the FPC’s decision from December 2019 to increase the CCyB in a standard risk environment (even though the FPC’s decision was subsequently revoked, in light of the COVID-19 pandemic). The group’s Pillar 2A requirement expressed as a percentage of RWAs at 31 March 2021
amounted to 0.83% of RWAs, of which 0.47% has to be met with CET1 capital.
Significant regulatory developments in the periodOn 27 June 2020, the ‘quick fix’ amendments were adopted in Europe, which resulted in the accelerated implementation of certain CRR II rules, which were only due to take effect in June 2021. Notably, the IFRS 9 transitional arrangements were amended to allow institutions to fully add back to their CET1 capital any increase in new provisions recognised in 2020 and 2021 for their financial assets that are not credit-impaired and it allowed the application of the revised supporting factor for exposures to small and medium-sized enterprises and the new supporting factor applicable to infrastructure finance exposures, to be advanced by one year.
On 12 February 2021, the PRA launched a new consultation, which sets out the proposed rules in respect of the implementation of international standards through a new PRA CRR rule instrument. The purpose of these rules is to implement some of the Basel III standards that were not implemented in the EU before the end of the Brexit transitional period and therefore remain to be implemented in the UK. This includes the new standardised approach for calculating counterparty credit risk, the revised large exposures framework and the changes to the market risk framework under the fundamental review of the trading book. These standards are expected to apply in the UK from 1 January 2022.
Philosophy and approachBoth the Investec Limited and Investec plc groups’ approach to capital management utilises both regulatory capital as appropriate to that jurisdiction and internal capital, which is an internal risk-based assessment of capital requirements. Capital management primarily relates to management of the interaction of both, with the emphasis on regulatory capital for managing portfolio level capital sufficiency and on internal capital for ensuring that returns are appropriate given the level of risk taken at an individual transaction or business unit level.
We intend to maintain a sufficient level of capital to satisfy regulatory requirements and our internal target ratios. On a consolidated basis for Investec plc and Investec Limited, we target a total capital adequacy ratio range of between 14% and 17%, and we target a minimum Tier 1 ratio of 11% and a CET1 ratio above 10%.
01 Risk disclosures Investec integrated annual report 2021
CAPITAL MANAGEMENT AND ALLOCATIONCONTINUED
90

The determination of target capital is driven by our risk profile, strategy and risk appetite, taking into account the regulatory and market factors applicable to the group. At the most fundamental level, we seek to balance our capital consumption between prudent capitalisation in the context of the group’s risk profile and optimisation of shareholder returns. Our internal capital framework is designed to manage and achieve this balance.
The internal capital framework is based on the group’s risk identification, review and assessment processes and is used to provide a risk-based approach to capital allocation, performance and structuring of our balance sheet. The objectives of the internal capital framework are to quantify the minimum capital required to:
• Maintain sufficient capital to satisfy the DLC board’s risk appetite across all risks faced by the group
• Provide protection to depositors against losses arising from risks inherent in the business
• Provide sufficient capital surplus to ensure that the group is able to retain its going concern basis under relatively severe operating conditions
• Inform the setting of minimum regulatory capital through the ICAAP
and subsequent SREP review. The ICAAP documents the approach to capital management, including the assessment of the regulatory and internal capital position of each group. The ICAAP is reviewed and approved by DLC BRCC and the board.
The framework has been approved by the DLC board and is managed by the DLC Capital Committee, which is responsible for oversight of the management of capital on a regulatory and an internal capital basis.
Capital planning and stress/scenario testingA capital plan is prepared for each of the silos, Investec plc and Investec Limited, and maintained to facilitate discussion of the impact of business strategy and market conditions on capital adequacy. This plan is designed to assess capital adequacy under a range of economic and internal conditions over the medium term (three years), with the impact on earnings, asset growth, risk appetite and liquidity considered. The plan provides the DLC board with an input into strategy and the setting of risk appetite by considering business risks and potential vulnerabilities, capital usage and funding requirements given constraints where these exist.
Three-month capital plans are prepared monthly, with regulatory capital being the key driver of decision-making.
The goal of capital planning is to provide insight into potential sources of vulnerability of capital adequacy by way of market, economic or internal events. As such, the three-year capital plans are stressed based on conditions most likely to cause Investec plc or Investec Limited duress. The conditions are agreed by the DLC Capital Committee after the key vulnerabilities have been determined through the stress testing workshops. Such plans are used by management to formulate balance sheet strategy and agree management actions, trigger points and influence the determination of our risk appetite. At a minimum level, each capital plan assesses the impact on our capital adequacy in an expected case and in downturn scenarios. On the basis of the results of this analysis, the DLC Capital Committee and DLC BRCC are presented with the potential variability in capital adequacy and are responsible, in consultation with the DLC board, for considering the appropriate response.
01 Risk disclosures Investec integrated annual report 2021
CAPITAL MANAGEMENT AND ALLOCATIONCONTINUED
91

Capital structure and capital adequacy
Standardised FIRB Increased AIRB Scope**
At 31 March 2021
Investecplc* º ^
£’millionIBP* º ^
£’million
InvestecLimited* ^^
R’millionIBL* ^^
R’million
InvestecLimited* ^^
R’millionIBL* ^^
R’million
Shareholders’ equity 2 223 2 106 44 292 43 881 44 292 43 881 Shareholders’ equity excluding non-controlling interests 2 256 2 114 47 331 45 362 47 331 45 362 Perpetual preference share capital and share premium (25) — (3 039) (1 481) (3 039) (1 481) Deconsolidation of special purpose entities (8) (8) — — — — Non-controlling interests — — — — — — Non-controlling interests per balance sheet — — 10 083 — 10 083 — Non-controlling interests excluded for regulatory purposes — — (10 083) — (10 083) — Regulatory adjustments to the accounting basis 99 99 1 308 1 337 1 308 1 337 Additional value adjustments (6) (6) (219) (190) (219) (190) Gains or losses on liabilities at fair value resulting from changes in our credit standing 12 12 (12) (12) (12) (12) Cash flow hedging reserve — — 1 539 1 539 1 539 1 539 Adjustment under IFRS 9 transitional arrangements 93 93 — — — — Deductions (498) (312) (2 665) (1 401) (2 539) (1 283) Goodwill and intangible assets net of deferred tax (307) (298) (425) (388) (425) (388) Investment in financial entity — — (749) (667) (737) (656) Deferred tax assets that rely on future profitability excluding those arising from temporary differences (12) (12) — — — — Shortfall of eligible provisions compared to expected loss — — (346) (346) (239) (239) Investment in capital of financial entities above 10% threshold (177) — (990) — (983) — Amount of deductions exceeding 15% threshold — — — — — — Other regulatory adjustments — — (155) — (155) — Securitisation positions which can alternatively be subject to a 1 250% risk weight (2) (2) — — — — Common Equity Tier 1 capital 1 824 1 893 42 935 43 817 43 061 43 935 Additional Tier 1 capital 274 250 2 142 1 336 2 131 1 336 Additional Tier 1 instruments 274 250 6 253 2 664 6 253 2 664 Phase out of non-qualifying Additional Tier 1 instruments — — (4 048) (1 328) (4 048) (1 328) Non-qualifying surplus capital attributable to non-controlling interest — — (63) — (74) — Tier 1 capital 2 098 2 143 45 077 45 153 45 192 45 271 Tier 2 capital 366 473 10 956 13 370 10 559 13 370 Collective impairment allowances — — 435 434 435 434 Tier 2 instruments 473 473 14 445 12 936 14 445 12 936 Non-qualifying surplus capital attributable to non-controlling interests (107) — (3 378) — (3 779) — Investment in capital of financial entities above 10% threshold — — (546) — (542) — Total regulatory capital 2 464 2 616 56 033 58 523 55 751 58 641 Risk-weighted assets 16 332 15 789 351 125 329 366 336 629 314 843
* Where: IBP is Investec Bank plc consolidated. IBL is Investec Bank Limited. The information for Investec plc includes the information for IBP. The information for Investec Limited includes the information for IBL.
** Investec Limited received approval to adopt the AIRB approach for the SME and Corporate models, effective 1 April 2021. We present numbers on a pro-forma basis for 31 March 2021.
º The capital adequacy disclosures follow Investec’s normal basis of presentation so as to show a consistent basis of calculation across the jurisdictions in which the group operates. For Investec plc and IBP this does not include the deduction of foreseeable charges and dividends when calculating CET1 capital. The impact of this deduction totalling £25 million for Investec plc and £25 million for IBP would lower the CET1 ratio by 17bps and 16bps respectively.
^ The CET1, Tier 1, total capital ratios and RWAs are calculated applying the IFRS 9 transitional arrangements (including the CRR II changes introduced by the ‘quick fix’ regulation adopted in June 2020).
^^ Investec Limited’s and IBL’s capital information includes unappropriated profits. If unappropriated profits are excluded from capital information, Investec Limited’s and IBL’s CET1 ratio would be 39bps and 48bps lower respectively.
01 Risk disclosures Investec integrated annual report 2021
CAPITAL MANAGEMENT AND ALLOCATIONCONTINUED
92

Capital structure and capital adequacy
Standardised FIRB
At 31 March 2020
Investecplc* º ^
£’millionIBP* º ^
£’million
InvestecLimited** ^^
R’millionIBL** ^^R’million
Shareholders’ equity 2 090 2 061 39 903 39 754 Shareholders’ equity excluding non-controlling interests 2 135 2 078 43 086 41 288 Perpetual preference share capital and share premium (25) — (3 183) (1 534) Deconsolidation of special purpose entities (20) (17) — — Non-controlling interests — — — — Non-controlling interests per balance sheet 3 3 11 045 — Non-controlling interests excluded for regulatory purposes (3) (3) (11 045) — Regulatory adjustments to the accounting basis 91 91 1 518 1 518 Additional value adjustments (8) (7) (6) (6) Gains or losses on liabilities at fair value resulting from changes in our credit standing 12 12 (26) (26) Cash flow hedging reserve — — 1 550 1 550 Adjustment under IFRS 9 transitional arrangements 87 86 — — Deductions (436) (333) (4 554) (2 721) Goodwill and intangible assets net of deferred tax (326) (315) (537) (496) Investment in financial entity — — (1 662) (1 596) Deferred tax assets that rely on future profitability excluding those arising from temporary differences (18) (18) — — Shortfall of eligible provisions compared to expected loss — — (629) (629) Investment in capital of financial entities above 10% threshold (92) — (692) — Amount of deductions exceeding 15% threshold — — (961) — Other regulatory adjustments — — (73) — Common Equity Tier 1 capital 1 745 1 819 36 867 38 551 Additional Tier 1 capital 274 250 1 902 751 Additional Tier 1 instruments 274 250 5 727 1 994 Phase out of non-qualifying Additional Tier 1 instruments — — (3 774) (1 227) Non-qualifying surplus capital attributable to non-controlling interest — — (51) — Non-controlling interest in non-banking entities — — — (16) Tier 1 capital 2 019 2 069 38 769 39 302 Tier 2 capital 414 533 11 885 12 905 Collective impairment allowances — — 896 895 Tier 2 instruments 533 533 14 383 12 037 Non-qualifying surplus capital attributable to non-controlling interests (119) — (2 747) — Investment in capital of financial entities above 10% threshold — — (647) (27) Total regulatory capital 2 433 2 602 50 654 52 207 Risk-weighted assets 16 285 15 808 337 755 319 090
* Where: IBP is Investec Bank plc consolidated. IBL is Investec Bank Limited. The information for Investec plc includes the information for IBP. The information for Investec Limited includes the information for IBL.
º The capital adequacy disclosures follow Investec’s normal basis of presentation so as to show a consistent basis of calculation across the jurisdictions in which the group operates. For Investec plc and IBP this does not include the deduction of foreseeable charges and dividends when calculating CET1 capital. The impact of this deduction totalling £0 million for Investec plc and £0 million for IBP would lower the CET1 ratio by 0bps and 0bps respectively.
^ CET1, Tier 1, total capital ratios and RWAs are calculated applying the IFRS 9 transitional arrangements.^^ Investec Limited’s and IBL’s capital information includes unappropriated profits. If unappropriated profits are excluded from capital information, Investec
Limited’s and IBL’s CET1 ratio would be 24bps and 15bps lower respectively.
01 Risk disclosures Investec integrated annual report 2021
CAPITAL MANAGEMENT AND ALLOCATIONCONTINUED
93

Risk-weighted assets
Standardised FIRB Standardised FIRB
Investecplc*
£’millionIBP*
£’million
InvestecLimited*R’million
IBL*R’million
Investecplc*
£’millionIBP*
£’million
InvestecLimited*R’million
IBL*R’million
At 31 March 2021 At 31 March 2020
Risk-weighted assets 16 332 15 789 351 125 329 366 16 285 15 808 337 755 319 090 Credit risk 12 497 12 413 278 692 277 679 12 183 12 145 263 690 266 552 Equity risk 581 117 25 427 9 959 580 125 30 428 15 010 Counterparty credit risk 691 691 9 756 9 756 921 922 8 796 8 837 Credit valuation adjustment risk 59 59 5 892 5 892 59 59 2 363 2 371 Market risk 778 778 4 526 3 887 734 726 4 701 4 158 Operational risk 1 726 1 731 26 832 22 193 1 808 1 831 27 777 22 162
Capital requirements
Standardised FIRB Standardised FIRB
Investecplc*
£’millionIBP*
£’million
InvestecLimited*R’million
IBL*R’million
Investecplc*
£’millionIBP*
£’million
InvestecLimited*R’million
IBL*R’million
At 31 March 2021 At 31 March 2020
Capital requirements 1 307 1 263 36 868 34 583 1 303 1 265 38 842 36 695 Credit risk 1 000 992 29 263 29 156 974 972 30 324 30 653 Equity risk 46 10 2 670 1 046 46 10 3 499 1 726 Counterparty credit risk 55 55 1 024 1 024 74 74 1 012 1 016 Credit valuation adjustment risk 5 5 619 619 5 5 272 273 Market risk 63 63 475 408 59 58 541 478 Operational risk 138 138 2 817 2 330 145 146 3 194 2 549
Leverage ratios
Investecplcº *
£’millionIBP* º
£’million
InvestecLimited
R’million* ^IBL
R’million* ^
Investecplcº * #
£’millionIBPº * #
£’million
InvestecLimited
R’million* ^IBL
R’million* ^
At 31 March 2021 At 31 March 2020
Total exposure measure 26 675 26 351 593 944 555 992 25 869 25 719 604 762 571 144 Tier 1 capital** 2 098 2 143 45 077 45 153 2 019 2 069 38 769 39 302 Leverage ratio^^ 7.9% 8.1% 7.6% 8.1% 7.8% 8.0% 6.4% 6.9% Total exposure measure (fully loaded) 26 582 26 258 593 981 555 992 25 764 25 614 604 762 571 144 Tier 1 capital (fully loaded) 1 984 2 054 44 641 44 999 1 918 1 992 37 866 38 995 Leverage ratio (fully loaded)*** ^^ 7.5% 7.8% 7.5% 8.1% 7.4% 7.8% 6.3% 6.8% Leverage ratio (UK leverage ratio framework)^^ ^^^ 9.2% 9.5% n/a n/a 8.9% 9.2% n/a n/a
* Where: IBP is Investec Bank plc consolidated and IBL is Investec Bank Limited. The information for Investec plc includes the information for IBP. The information for Investec Limited includes the information for IBL.
** The CET1, Tier 1 and total capital adequacy ratios and RWAs are calculated applying the IFRS 9 transitional arrangements.*** The CET1 ratio (fully loaded) and the leverage ratio (fully loaded) assumes full adoption of IFRS 9 and full adoption of all CRD IV rules of South African
Prudential Authority regulations. As a result of the adoption of IFRS 9, Investec plc elected to designate its subordinated fixed rate medium-term notes due in 2022 at fair value. By the time of full adoption of IFRS 9 in 2023, these subordinated liabilities will have reached final maturity and will be redeemed at par value. The remaining interest rate portion of the fair value adjustment at 30 September 2020 of £3 million (post-taxation), has therefore been excluded from the fully loaded ratios as it will be released into profit and loss over the remaining life of the instrument.
º The capital adequacy disclosures follow Investec’s normal basis of presentation so as to show a consistent basis of calculation across the jurisdictions in which the group operates. For Investec plc and Investec Bank plc this does not include the deduction of foreseeable charges and dividends when calculating the CET1 ratio as required under the Capital Requirements Regulation. The impact of this deduction totalling £25 million (31 March 2020: £0 million) for Investec plc and £25 million (31 March 2020: £0 million) for IBP would lower the CET1 ratio by 17bps (31 March 2020: 0bps) and 16bps (31 March 2020: 0bps) respectively.
# Where applicable, the 31 March 2020 comparatives for leverage have been restated to account for the reclassification of gilts and total return swaps. The restatements are detailed on page 141.
^ Investec Limited’s and IBL’s capital information includes unappropriated profits. If unappropriated profits are excluded from capital information, Investec Limited’s and IBL’s CET1 ratio would be 39bps (31 March 2020: 24bps) and 48bps (31 March 2020: 15bps) lower.
^^ The leverage ratios are calculated on an end-quarter basis.^^^ Investec plc is not subject to the UK leverage ratio framework; however, for comparative purposes this ratio has been disclosed. This framework excludes
qualifying central bank balances from the calculation of the leverage exposure measure.
01 Risk disclosures Investec integrated annual report 2021
CAPITAL MANAGEMENT AND ALLOCATIONCONTINUED
94

Total regulatory capital flow statement
At 31 March 2021
Investecplc*
£’millionIBP*
£’million
InvestecLimited*R’million
IBL*R’million
Opening Common Equity Tier 1 capital 1 745 1 819 36 867 38 551 Dividends paid to ordinary shareholders and Additional Tier 1 security holders (35) (28) (1 142) (645) Profit after taxation 70 64 3 859 3 997 Treasury shares (8) — (50) — Share-based payment adjustments (1) — 436 — Net equity movement in interests in associated undertakings — — (406) (406) Movement in other comprehensive income 95 (3) 1 636 1 194 Investment in financial entity — — 913 927 Investment in capital of financial entities above 10% threshold (85) — (298) — 15% limit deduction — — 961 — Shortfall of eligible provisions compared to expected loss — — 283 283 Goodwill and intangible assets (deduction net of related taxation liability) 19 17 112 107 Deferred tax that relies on future profitability (excluding those arising from temporary differences) 6 6 — — Deconsolidation of special purpose entities 13 9 — — Gains or losses on liabilities at fair value resulting from changes in own credit standing 1 — (14) (14) IFRS 9 transitional arrangements 6 6 — — Other, including regulatory adjustments and other transitional arrangements (2) 3 (222) (177) Closing Common Equity Tier 1 capital 1 824 1 893 42 935 43 817 Opening Additional Tier 1 capital 274 250 1 902 751 Issued capital — — 723 723 Redeemed capital — — (198) (54) Other, including regulatory adjustments and transitional arrangements — — (285) (100) Investment in capital of financial entities above 10% threshold — — — 16 Movement in minority interest in non-banking entities — — — — Closing Additional Tier 1 capital 274 250 2 142 1 336 Closing Tier 1 capital 2 098 2 143 45 077 45 153 Opening Tier 2 capital 414 533 11 885 12 905 Redeemed capital — — (885) (260) Issued capital — — 1 636 1 636 Collective impairment allowances — — (461) (461) Investment in capital of financial entities above 10% threshold — — 101 28 Other, including regulatory adjustments and other transitional arrangements (48) (60) (1 320) (478) Closing Tier 2 capital 366 473 10 956 13 370 Closing total regulatory capital 2 464 2 616 56 033 58 523
* Where: IBP is Investec Bank plc consolidated and IBL is Investec Bank Limited. The information for Investec plc includes the information for IBP. The information for Investec Limited includes the information for IBL.
01 Risk disclosures Investec integrated annual report 2021
CAPITAL MANAGEMENT AND ALLOCATIONCONTINUED
95

Total regulatory capital flow statement
At 31 March 2020
Investecplc*
£’millionIBP*
£’million
InvestecLimited*R’million
IBL*R’million
Opening Common Equity Tier 1 capital 1 651 1 662 38 150 38 151 New capital issues 65 150 — 899 Dividends paid to ordinary shareholders and Additional Tier 1 security holders (114) (52) (3 257) (1 236) Profit after taxation 646 58 9 710 3 090 Treasury shares (46) — (1 460) — Distribution to shareholders (489) — (4 280) — Share-based payment adjustments 8 (7) 436 — Net equity impact on non-controlling interest movement (1) 8 — — Movement in other comprehensive income 45 9 (1 077) (2 502) Investment in financial entity (92) — 476 557 Investment in capital of financial entities above 10% threshold — — (692) — 15% limit deduction — — (789) — Shortfall of eligible provisions compared to expected loss — — (629) (629) Goodwill and intangible assets (deduction net of related taxation liability) 107 20 92 92 Deferred tax that relies on future profitability (excluding those arising from temporary differences) (5) (5) — — Deconsolidation of special purpose entities (4) (3) — — Gains or losses on liabilities at fair value resulting from changes in own credit standing (9) (9) (1) (1) IFRS 9 transitional arrangements (7) (8) (225) (225) Other, including regulatory adjustments and other transitional arrangements (10) (4) 413 355 Closing Common Equity Tier 1 capital 1 745 1 819 36 867 38 551Opening Additional Tier 1 capital 274 250 2 432 920 Other, including regulatory adjustments and transitional arrangements — — (445) (153) Investment in capital of financial entities above 10% threshold — — — (16) Movement in minority interest in non-banking entities — — (85) — Closing Additional Tier 1 capital 274 250 1 902 751 Closing Tier 1 capital 2 019 2 069 38 769 39 302 Opening Tier 2 capital 485 596 13 165 14 795 Redeemed capital — — (3 175) (3 175) Collective impairment allowances — — 20 18 Investment in capital of financial entities above 10% threshold — — (647) (27) Other, including regulatory adjustments and other transitional arrangements (71) (63) 2 522 1 294 Closing Tier 2 capital 414 533 11 885 12 905 Closing total regulatory capital 2 433 2 602 50 654 52 207
* Where: IBP is Investec Bank plc consolidated and IBL is Investec Bank Limited. The information for Investec plc includes the information for IBP. The information for Investec Limited includes the information for IBL.
01 Risk disclosures Investec integrated annual report 2021
CAPITAL MANAGEMENT AND ALLOCATIONCONTINUED
96


We supplement our IFRS figures with alternative performance measures used by management internally and which provide valuable, relevant information to readers. These measures are used to align internal and external reporting, identify items management believes are not representative of the underlying performance of the business and provide insight into how management assesses period on period performance. A description of the group’s alternative performance measures and their calculation, where relevant, is set out below.Alternative performance measures are not measures within the scope of IFRS and are not a substitute for IFRS financial measures. Alternative performance measures constitute pro forma financial information. The pro forma financial information is the responsibility of the board of directors and is presented for illustrative purposes only and because of its nature may not fairly present the group’s financial position, changes in equity, and results in operations or cash flows. External auditors Ernst & Young Inc. performed a review of the pro-forma financial information and the opinion is available for inspection at the registered office of Investec upon request.
Adjusted earnings attributable to ordinary shareholders
Earnings attributable to shareholders adjusted to remove goodwill, acquired intangibles, strategic actions, and earnings attributable to perpetual preference shareholders and Other Additional Tier 1 security holders
Refer to pages 67 to 69 of volume three for the reconciliation of earnings attributable to shareholders to adjusted earnings attributable to ordinary shareholders
Adjusted earnings per share Adjusted earnings attributable to ordinary shareholders divided by the weighted average number of ordinary shares in issue during the year
Refer to pages 67 to 69 of volume three for calculation
Adjusted operating profit Refer to the calculation in the table below:
£’000 31 March 2021 31 March 2020
Operating profit before goodwill, acquired intangibles and strategic actions 377 110 487 111 Loss/(Profit) attributable to other non-controlling interests 472 (67 952) Adjusted operating profit 377 582 419 159
Adjusted operating profit per employee Adjusted operating profit divided by average total employees including permanent and temporary employees
Refer to page 48 of volume one for calculation
Annuity income Net interest income plus net annuity fees and commissions
Refer to pages 55 to 57 of volume three
Core loans The table below describes the differences between ‘loans and advances to customers’ as per the balance sheet and gross core loans
UK and Other Southern Africa Total group
£’million31 March
202131 March
202031 March
202131 March
202031 March
202131 March
2020
Loans and advances to customers per the balance sheet 12 336 11 872 13 705 12 716 26 041 24 588 Add: Own originated loans and advances to customers per the balance sheet — — 402 325 402 325 Add: ECL held against FVOCI loans reported on the balance sheet within reserves (5) (2) — — (5) (2) Net core loans 12 331 11 870 14 107 13 041 26 438 24 911
of which subject to ECL* 11 819 11 217 14 030 12 933 25 849 24 150 Net core loans at amortised cost and FVOCI 11 819 11 217 12 935 11 998 24 754 23 215 Net fixed rate loans designated at FVPL (on which ECL is calculated for management purposes)^ — — 1 095 935 1 095 935 of which FVPL (excluding fixed rate loans above) 512 653 77 108 589 761 Add: ECL 170 175 134 152 304 327
Gross core loans 12 501 12 045 14 241 13 193 26 742 25 238 of which subject to ECL* 11 989 11 392 14 164 13 085 26 153 24 477 of which FVPL (excluding fixed rate loans above) 512 653 77 108 589 761
^ Fixed rate loans which have passed the solely payments of principal and interest test (SPPI) and are held in a business model to collect contractual cash flows but have been designated at FVPL to eliminate accounting mismatches (interest rate risk is being economically hedged). The underlying loans have been fair valued and management performs an ECL calculation in order to obtain a reasonable estimate of the credit risk component. The portfolio is managed on the same basis as gross core loans measured at amortised cost. The drawn (£1.1 billion) exposure falls predominantly into Stage 1 (consistent throughout the period) (31 March 2020: £0.9 billion). The ECL on the portfolio is £5.2 million (31 March 2020: £3.0 million).
* Includes portfolios for which ECL is not required for IFRS purposes, but for which management evaluates on this basis.
02 Annexures Investec integrated annual report 2021
ALTERNATIVE PERFORMANCE MEASURES
98

Core loans to equity ratio Net core loans divided by total shareholders’ equity per the balance sheet
Cost to income ratio Refer to calculation in the table below:
£’000 31 March 2021 31 March 2020
Operating costs (A)^ 1 164 513 1 186 427 Total operating income before expected credit losses 1 641 061 1 806 839 Less: Profit/loss attributable to other non-controlling interests 472 (67 952) Total (B) 1 641 533 1 738 887 Cost to income ratio (A/B) 70.9% 68.2%
Coverage ratio ECL as a percentage of gross core loans subject to ECLCredit loss ratio ECL impairment charges on core loans as a percentage of average gross core
loans subject to ECLDividend payout ratio Ordinary dividend per share divided by adjusted earnings per share Gearing ratio Total assets excluding assurance assets divided by total equityLoans and advances to customers as a % of customer deposits
Loans and advances to customers as a percentage of customer accounts (deposits)
Net tangible asset value per share Refer to calculation on page 48 of volume one
Net interest margin Interest income net of interest expense, divided by average interest-earning assets
Refer to calculation on page 55 of volume three
Return on average assets Adjusted earnings attributable to ordinary shareholders divided by average total assets excluding assurance assets
Return on average ordinary shareholders’ equity (ROE) Refer to calculations on pages 43 to 45 of volume one
Return on average tangible ordinary shareholders’ equity Refer to calculations on pages 43 to 45 of volume one
Return on risk-weighted assets Adjusted earnings attributable to ordinary shareholders divided by average risk-weighted assets, where risk-weighted assets is calculated as the sum of risk-weighted assets for Investec plc and Investec Limited (converted into Pound Sterling)
As reflected on page 48 of volume one
Staff compensation to operating income ratio All staff compensation costs expressed as a percentage of operating income before ECL (net of operating profits or losses attributable to other non-controlling interests)
^ Restated as detailed on pages 141 and 142 of volume three.
02 Annexures Investec integrated annual report 2021
ALTERNATIVE PERFORMANCE MEASURESCONTINUED
99

Cash and near cashIncludes cash, near cash (other ‘monetisable assets’) and Central Bank cash placements and guaranteed liquidity.
Diluted earnings per shareDiluted earnings per share is calculated by dividing the earnings attributable to the ordinary shareholders of Investec plc and Investec Limited, adjusted for the effects of dilutive ordinary potential shares, by the weighted average number of shares in issue during the period plus the weighted average number of ordinary shares that would be issued on conversion of the dilutive ordinary potential shares during the year.
Refer to pages 67 to 69 of volume three for the calculation of diluted earnings per share.
Earnings per shareBasic earnings per share is calculated by dividing the earnings attributable to the ordinary shareholders in Investec plc and Investec Limited by the weighted average number of ordinary shares in issue during the year.
Refer to pages 67 to 69 of volume three for the calculation of earnings per share.
Effective operational tax rateTax on profit on ordinary activities (excluding non-operating items) divided by operating profit before goodwill and acquired intangibles and excluding share of post-taxation profit of associates and joint venture holdings.
Funds under managementConsists of funds managed by the Wealth & Investment business and by the Property business (which forms part of the Specialist Bank).
Headline earnings per shareHeadline earnings is calculated in accordance with the JSE listing requirements and in terms of circular 1/2019 issued by the South African Institute of Chartered Accountants. Headline earnings per share calculated by dividing the group’s headline earnings by the average number of shares which it had in issue during the accounting period.
Refer to pages 67 to 69 of volume three for the calculation of headline earnings per share.
Interest-bearing liabilitiesDeposits by banks, debt securities in issue, repurchase agreements and cash collateral on securities lent, customer accounts (deposits), subordinated liabilities, liabilities arising on securitisation of own originated loans and advances, and finance lease liabilities. Refer to page 55 of volume three for calculation.
Interest-earning assetsCash and near cash, bank debt securities, sovereign debt securities, core loans, other debt securities, other loans and advances, other securitised assets, and finance lease receivables. Refer to page 55 of volume three for calculation.
Legacy business in the UK Specialist Bank (‘Legacy’)Legacy, as separately disclosed from 2014 to 2018, comprises pre-2008 assets held on the UK bank’s balance sheet, that had very low/negative margins and assets relating to business we are no longer undertaking.
Market capitalisationTotal number of shares in issue (including Investec plc and Investec Limited) excluding treasury shares, multiplied by the closing share price of Investec plc on the London Stock Exchange.
Net-zeroBalancing the amount of emitted greenhouse gases with equivalent emissions that are either offset or sequestered.
Ninety One and Ninety One groupAll references to Ninety One and Ninety One group refer to Ninety One plc and its subsidiaries plus Ninety One Limited and its subsidiaries.
Ongoing basisOngoing information, as separately disclosed from 2014 to 2018, excludes Legacy assets (refer to definition), as well as the following businesses sold in previous years: Investec Bank (Australia) Limited, Kensington Group plc and Start Mortgage Holdings Limited.
Strategic actionsComprises the closure and rundown of the Hong Kong direct investments business, the demerger of the asset management business and the financial impact of group restructures.
Structured creditReflects the gross exposure of rated and unrated structured credit classified within other debt securities and other loans and advances on the balance sheet. Refer to page 59 for detail.
Subject to ECLIncludes financial assets held at amortised cost and FVOCI as well as designated at FVPL loan portfolios for which ECL is not required for IFRS purposes, but for which management evaluates on this basis.
Total groupTotal group represents the group’s results including the results of discontinued operations in the prior period.
Weighted number of ordinary shares in issueThe number of ordinary shares in issue at the beginning of the year increased by shares issued during the year, weighted on a time basis for the period during which they have participated in the income of the group less treasury shares. Refer to calculation on pages 67 to 69 of volume three.
02 Annexures Investec integrated annual report 2021
DEFINITIONS
100

ABC Anti-bribery and corruption GDP Gross domestic productADR Forum Arrears, Default and Recovery Forum Group ERC Group Executive Risk CommitteeAFS Available for sale GFSC Guernsey Financial Services CommissionAIRB Advanced Internal Ratings-Based GMRA Global Master Repurchase AgreementALCO Asset and Liability Committee GMSLA Global Master Securities Lending AgreementAML Anti-money laundering HNW High net worthAPRA Australian Prudential Regulation Authority HQLA High quality liquid assetsAT1 Additional Tier 1 IAPF Investec Australia Property FundBASA Banking Association of South Africa IBL Investec Bank Limited BBLS Bounce Back Loan Scheme IBL BRCC IBL Board Risk and Capital CommitteeBCBS Basel Committee of Banking Supervision IBL ERC IBL Executive Risk CommitteeBIS Bank for International Settlements IBL Review ERRF IBL Review Executive Risk Review ForumBoE Bank of England IBOR Interbank offered rateBOM Bank of Mauritius IBP Investec Bank plcBRCC Board Risk and Capital Committee IBP BRCC IBP Board Risk and Capital CommitteeBRRD Bank Recovery and Resolution Directive IBP ERC IBP Executive Risk CommitteeCBILS Coronavirus Business Interruption Loan Scheme IBP Review ERRF IBP Review Executive Risk Review ForumCCB Capital conservation buffer ICAAP Internal Capital Adequacy Assessment Process CCR Counterparty credit risk IEP IEP GroupCCyB Countercyclical capital buffer IFRS International Financial Reporting StandardCDS Credit default swap ILAAP Internal Liquidity Adequacy Assessment ProcessCET1 Common Equity Tier 1 IRRBB Interest Rate Risk in the Banking BookCFP Contingency funding plan ISDA International Swaps and Derivatives AssociationCFT Combating the financing of terrorism IW&I Investec Wealth & InvestmentCLBILS Coronavirus Large Business Interruption Loan Scheme JSE Johannesburg Stock ExchangeCLF Committed liquidity facility LCR Liquidity coverage ratioCOFI Bill Conduct of Financial Institutions Bill LGD Loss given defaultCOVID Corona Virus Disease LIBOR London Inter-bank Offered RateCRD IV Capital Requirements Directive IV MDR Mandatory Disclosure RulesCRR Capital Requirements Regulation MiFID Markets in Financial Instruments DirectiveCRS Common Reporting Standard MREL Minimum Requirements for Own Funds and Eligible LiabilitiesCSA Credit Support Annex NSFR Net stable funding ratioCVA Credit valuation adjustment OCI Other comprehensive income D-SIB Domestic systemically important bank OECD Organisation for Economic Co-operation and DevelopmentDLC Dual listed company OTC Over the counterDLC BRCC DLC Board Risk and Capital Committee PCAF Partnership for Carbon Accounting Financials
DLC Nomdac DLC Nominations and Directors Affairs Committee PD Probability of defaultDLC SEC DLC Social and Ethics Committee PRA Prudential Regulation AuthorityDLC Remco DLC Remuneration Committee RLS Recovery Loan SchemeEBA European Banking Authority RWA Risk-weighted assetECL Expected credit loss S&P Standard & Poor’sEP Equator Principles SA-CCR Standardised Approach to Counterparty Credit Risk ES Expected shortfall SARS South African Revenue ServiceESG Environmental, social and governance SICR Significant increase in credit riskEU European Union SME Small and Medium-sized EnterprisesEuribor rate Euro interbank offered rate SOE State-owned Enterprise
EVT Extreme value theory South African PA South African Prudential Authority (previously known as the Banking Supervision Division of the South African Reserve Bank)
FATCA Foreign Account Tax Compliance Act SPPI Solely payments of principal and interestFCA Financial Conduct Authority SREP Supervisory Review and Evaluation ProcessFINMA Swiss Financial Market Supervisory Authority sVaR Stressed VaRFIRB Foundation Internal Ratings Based TCFD Task Force on Climate-related Financial Disclosures
FPC Financial Policy Committee TFSME Bank of England Term Funding Scheme for Small and Medium Enterprises
FSLAB Financial Sector Laws Amendment Bill TTP Temporary transitional powersFSR Act Financial Sector Regulation Act 9 of 2017 UK United KingdomFVOCI Fair value through other comprehensive income VaR Value at RiskFVPL Fair value through profit and loss
02 Annexures Investec integrated annual report 2021
GLOSSARY
101

Investec plc and Investec LimitedSecretary and registered officeInvestec plcDavid Miller30 Gresham Street London EC2V 7QP United KingdomTelephone (44) 20 7597 4000Facsimile (44) 20 7597 4491
Investec LimitedNiki van Wyk100 Grayston DriveSandown Sandton 2196PO Box 785700 Sandton 2146Telephone (27) 11 286 7000Facsimile (27) 11 286 7966
Websitewww.investec.com
Registration numberInvestec plcRegistration number 3633621
Investec LimitedRegistration number 1925/002833/06
AuditorsErnst & Young LLP Ernst & Young Inc.
Registrars in the UKComputershare Investor Services PLC The PavilionsBridgwater Road Bristol BS99 6ZZ United KingdomTelephone (44) 370 707 1077
Transfer secretaries in South AfricaComputershare Investor Services (Pty) Ltd Rosebank Towers15 Biermann AvenueRosebank 2196PO Box 61051Marshalltown 2107Telephone (27) 11 370 5000
Directorate as at 22 June 2021
Executive directorsFani Titi (Chief Executive)Nishlan Samujh (Group Finance Director) Richard Wainwright (Executive director)Ciaran Whelan (Executive director)
Non-executive directorsPerry Crosthwaite (Chair)Zarina Bassa (Senior independent director) Henrietta BaldockDavid Friedland Philip Hourquebie Charles JacobsStephen KoseffLord Malloch-Brown KCMGNicky Newton-KingJasandra NykerPhilisiwe SibiyaKhumo ShuenyaneBrian Stevenson
For queries regarding information in this documentInvestor RelationsTelephone (27) 11 286 7070
(44) 20 7597 5546Email [email protected] www.investec.com/en_za/#home/investor-relations.html
02 Annexures Investec integrated annual report 2021
CORPORATE INFORMATION
102