Divorce-Risk Patterns in Same-Sex „Marriages“ in Norway ... · Divorce-Risk Patterns in...
30
Divorce-Risk Patterns in Same-Sex „Marriages“ in Norway and Sweden by Gunnar Andersson 1 , Turid Noack 2 , Ane Seierstad 2 , and Harald Weedon-Fekjær 3 November, 2004 Abstract: The present study provides an investigation into patterns in divorce risks of partners in same-sex marriages, or registered partnerships, in Norway and Sweden. A comparison with patterns in divorce risks in heterosexual marriages is provided. Our study is based on longitudinal information from the population registers of the two countries, covering all persons in partnerships. Our demographic analyses involve information on the characteristics such as age, sex, geographical background, experience of previous opposite-sex marriage, biological parenthood, and educational attainment of the partners involved. We find that in many respects patterns in divorce are quite similar in same-sex and opposite-sex marriages. If we only compare levels in union dissolution, divorce risks are considerably higher in same-sex than in opposite- sex marriages. The divorce risk for female partnerships is practically double that of the risk for male partnerships. 1 Max Planck Institute for Demographic Research, Konrad-Zuse-Str. 1, 18057 Rostock, Germany. E-mail: [email protected] 2 Statistics Norway, POB 8131 Dep, 0033 Oslo, Norway. E-mail: [email protected] and [email protected] 3 Section of Medical Statistics, University of Oslo, Norway. E-mail: [email protected]
Transcript of Divorce-Risk Patterns in Same-Sex „Marriages“ in Norway ... · Divorce-Risk Patterns in...

Divorce-Risk Patterns in Same-Sex „Marriages“
in Norway and Sweden by Gunnar Andersson 1, Turid Noack 2, Ane Seierstad 2, and Harald Weedon-Fekjær 3
November, 2004 Abstract: The present study provides an investigation into patterns in divorce risks of partners in same-sex marriages, or registered partnerships, in Norway and Sweden. A comparison with patterns in divorce risks in heterosexual marriages is provided. Our study is based on longitudinal information from the population registers of the two countries, covering all persons in partnerships. Our demographic analyses involve information on the characteristics such as age, sex, geographical background, experience of previous opposite-sex marriage, biological parenthood, and educational attainment of the partners involved. We find that in many respects patterns in divorce are quite similar in same-sex and opposite-sex marriages. If we only compare levels in union dissolution, divorce risks are considerably higher in same-sex than in opposite-sex marriages. The divorce risk for female partnerships is practically double that of the risk for male partnerships. 1 Max Planck Institute for Demographic Research, Konrad-Zuse-Str. 1, 18057 Rostock, Germany. E-mail: [email protected] 2 Statistics Norway, POB 8131 Dep, 0033 Oslo, Norway. E-mail: [email protected] and [email protected] 3 Section of Medical Statistics, University of Oslo, Norway. E-mail: [email protected]

2
1. Registered partnerships: A new family type
At present, the issue of granting legal recognition to same-sex couples is high on the
political agenda in a large number of countries. Where this family type is not legally
recognized, the debate tends to be intensifying. In many European states, this recognition
is already well established, and the discussion more often concerns various amendments
to existing rules. The first country to introduce legal recognition of same-sex unions was
Denmark in 1989, and the term “registered partnership” was invented for that purpose.
In all Nordic countries, same-sex couples today have the legal right to registered
partnership, a civil status that in practice hardly deviate from the concept of marriage.
Norway was the second country to introduce this family type (1993), followed by
Sweden (1995), Iceland (1996), and finally Finland (2002). By 2003, same-sex unions
had been given legal recognition in one form or another in Germany, France,
Hungary, Portugal, Belgium, and the Netherlands, too1. In 2001, the latter country
became the first in the world to amend its marriage act to grant same-sex couples a
marriage status equal to that of opposite-sex couples.
In terms of innovation in family-demographic behavior, the Scandinavian
countries are often singled out as forerunners, with other countries tending to follow suit.
It may be debatable whether this statement is generally true or not, but applied to same-
sex partnerships it certainly seems to be a correct description. Consequently, it is
worthwhile to have a closer look at the Nordic experience of same-sex family life.
Several studies deal with various political and legal aspects of the introduction of same-
sex partnerships in Europe2. Knowledge about the demographic behavior related to this
new family type, however, is still sparse. The purpose of our study is to provide some
knowledge of that kind.
1 In some other countries, such as the USA, Canada, and Spain, same-sex unions have sometimes been legalized at the level of states and regions.
2 For a discussion on the passage of partnership legislation in Denmark, see Søland (1998). Nielsen (1990) provides further evidence of legal aspects of the new family type. Noack (2000) discusses the introduction of registered partnerships in Norway, and Agell (1998) refers to the debate about the introduction of partnerships in Sweden. Martin and Théry (2001) discuss the introduction of another related family form, Pacte de solidarité civile (PACS), in France, which is open for same-sex and opposite-sex couples alike. For an overview of the way in which same-sex marriage was paved in the Netherlands, see Waaldijk (2001).
3
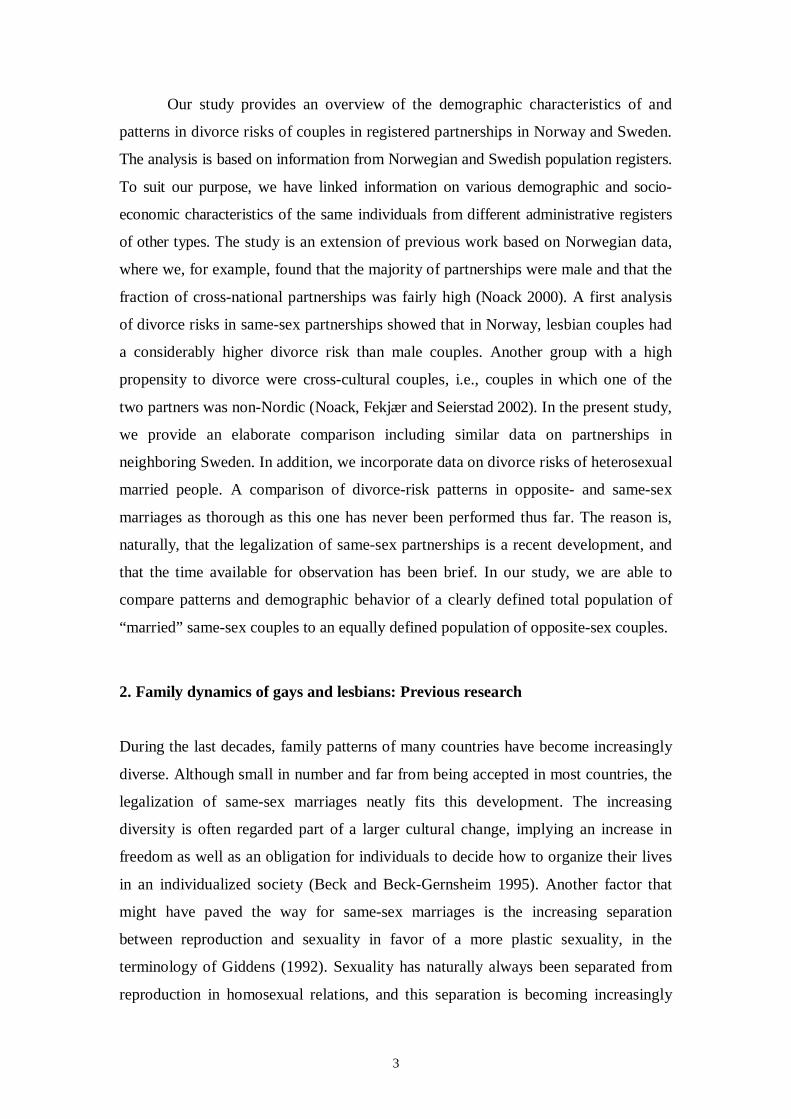
Our study provides an overview of the demographic characteristics of and
patterns in divorce risks of couples in registered partnerships in Norway and Sweden.
The analysis is based on information from Norwegian and Swedish population registers.
To suit our purpose, we have linked information on various demographic and socio-
economic characteristics of the same individuals from different administrative registers
of other types. The study is an extension of previous work based on Norwegian data,
where we, for example, found that the majority of partnerships were male and that the
fraction of cross-national partnerships was fairly high (Noack 2000). A first analysis
of divorce risks in same-sex partnerships showed that in Norway, lesbian couples had
a considerably higher divorce risk than male couples. Another group with a high
propensity to divorce were cross-cultural couples, i.e., couples in which one of the
two partners was non-Nordic (Noack, Fekjær and Seierstad 2002). In the present study,
we provide an elaborate comparison including similar data on partnerships in
neighboring Sweden. In addition, we incorporate data on divorce risks of heterosexual
married people. A comparison of divorce-risk patterns in opposite- and same-sex
marriages as thorough as this one has never been performed thus far. The reason is,
naturally, that the legalization of same-sex partnerships is a recent development, and
that the time available for observation has been brief. In our study, we are able to
compare patterns and demographic behavior of a clearly defined total population of
“married” same-sex couples to an equally defined population of opposite-sex couples.
2. Family dynamics of gays and lesbians: Previous research
During the last decades, family patterns of many countries have become increasingly
diverse. Although small in number and far from being accepted in most countries, the
legalization of same-sex marriages neatly fits this development. The increasing
diversity is often regarded part of a larger cultural change, implying an increase in
freedom as well as an obligation for individuals to decide how to organize their lives
in an individualized society (Beck and Beck-Gernsheim 1995). Another factor that
might have paved the way for same-sex marriages is the increasing separation
between reproduction and sexuality in favor of a more plastic sexuality, in the
terminology of Giddens (1992). Sexuality has naturally always been separated from
reproduction in homosexual relations, and this separation is becoming increasingly

4
dominant also in heterosexual relationships. Thus, the disparity between homo- and
heterosexual relationships is diminishing. The increasing acceptance and legal
legitimacy of homosexual practice may be the most important change regarding
sexuality in the last decades, or as Giddens (1992:33) expressed it “... sexual diversity,
although still regarded by many hostile groups as perversion, has moved out of
Freud’s case-history notebooks into the everyday social world”. Moxnes (1993), a
Norwegian sociologist, has argued that same-sex marriages have become legalized not
so much because homosexuality has become more accepted, but because marriage has
become an increasingly empty institution and no longer is seen a mandatory entrance
to adult life, sexual life, and parenthood.
New patterns of family life call for new research topics, and recent years have
witnessed an increase in research on lesbian and gay lifestyles, and same-sex families.
Although the literature on same-sex relationships is abundant, most of it does not allow
for the deduction of any firm demographic hypotheses. Many studies are based on small
numbers of individuals. They have given interesting but often anecdotal information.
Large-scale quantitative studies are rare. Many studies face serious problems related to
sampling or representativeness. In recent years, there has been an increasing recognition
of the need to deal with these problems. As a result, more solid demographic studies
have indeed appeared (Black et al. 2000).
2a. General problems in studying gays and lesbians
The lack of representative samples is the most fundamental problem in quantitative
studies on gays and lesbians. Self-recruited samples from an unknown population have
been and still are very common in studies of homosexuals. Respondents are, for
example, recruited by snowball methods, from the readers of particular magazines, from
members of organizations for gays and lesbians, or more recently from persons who are
willing to fill in Internet questionnaires. Critical voices have also pointed out that much
of the research on the family life of gays and lesbians is based on white, well-educated
middle-class Americans (Patterson 2000).
In addition to these sampling problems, the question of how to identify
homosexual people has increasingly become the focus of debate. Should respondents be
asked to identify themselves, or is it better to measure sexual practice instead, i.e., to ask
them about the number of life-time same-sex partners, any such partner within a certain

5
time period, the sex of the majority of partners, and so on? (Black et al. 2000).
According to large-scale population studies carried out in the US, the proportion of men
who had a male sex partner in the previous year is about 1-3 percent, as compared to 4-9
percent who had at least one male partner during the life span (Lauman et al. 1994). The
proportions of women who had a partner of the same sex are somewhat lower, well over
1 percent and about 4 percent, respectively. A different pattern has been reported from a
Norwegian study. Here, the proportion of respondents aged 19-26 was slightly higher for
women than for men when it concerns same-sex experiences during the last 12 months
as well as during the life span (Pedersen and Kristiansen 2003:11). All estimates referred
to above are well below the frequently cited 10 percent benchmark of Alfred C. Kinsey’s
famous report. This estimate, however, seems to be a misinterpretation of what Kinsey in
fact had said (Lauman et al. 1994). Kinsey’s study was based on information about life-
time homosexual activity as well as homosexual desire, resulting in different levels of
estimates. Notwithstanding, Kinsey’s sampling procedure also had its weaknesses.
Not only the methodology, but also the view that individuals can be categorized
as gays, lesbians, bisexuals, and heterosexuals has met increasing criticism. The
possibility that sexual identities may shift over time has attracted increasing attention
(Patterson 2000). So far, little research has documented such contentions. A recently
published study of younger Norwegians, however, finds some evidence of a confluent
sexual culture, and more so among women than men (Pedersen and Kristiansen 2003).
To paint a statistical portrait of any gay and lesbian populations using traditional
population surveys has also been considered difficult because of the mere size of the
target groups. Or put another way, in standard demographic data sources, it may seem
like looking for the needle in the haystack. In addition, the underlying assumption of
most demographic surveys is that the respondents are heterosexual, and respondents
often have no possibility to report other types of family behavior than those suggested by
the survey designers (Hoem et al. 2000: 87). The seemingly sensitive character of the
topic has probably also made it difficult to include it in questionnaires where it otherwise
might have appeared natural. Nevertheless, a number of existing data sources today
allow for research on same-sex couples as defined by any co-residence of two persons of
the same sex.
6
2b. Same-sex couples and same-sex co-residence
For the United States, Black et al. (2000) have made a critical review and comparison of
three sources available for systematic studies of gay and lesbian populations: The
General Social Survey, the National Health and Social Life Survey, and the 1990 U.S.
Census. Although documenting a number of measurement-error problems in the surveys
and a considerable underreporting of same-sex couples in the census, they conclude that
the data sets seem good enough to allow for credible analyses of gays and lesbians in the
US. Based on these data, they compare partnered gays and lesbians with the general
population and find that lesbians as well as gays have attained a higher education level
than married and non-married heterosexual partnered women and men. Partnered gays,
however, earn less than men living in opposite-sex marriages. For women, the opposite
is the case, partnered lesbians earn more than married women. These results stem from
comparisons between persons within similar age and educational categories. They
conform to a related study by Black et al. (2001) that also include non-partnered
individuals. A related study for the Netherlands, however, shows only negligible effects
of sexual orientation on earnings (Plug and Berkhout 2004). For further research on the
economic lives of lesbians and gay men, see Badgett (1997, 2001).
In addition, the US Census data indicates that 5 percent of male couples and
nearly 22 percent of female couples have children living in the household. Although the
media frequently writes about adoption and artificial insemination for lesbians and gays,
Black et al. (2000) conclude that most of the children of partnered gays and lesbians
recorded in the census probably have been born while the parents lived in a previous
opposite-sex marriage. 20 percent of partnered gays and 30 percent of partnered lesbians
were previously married. The data also gives information on patterns concerning
geographical settlement. Gay men seem to be concentrated to a selected number of urban
areas, preferably large cities. Lesbians are less concentrated, and more often live in
smaller metropolitan areas. For a further discussion on the reason behind the
geographical concentration of gay men, see Black et al. (2002).
Conventional demographic data have also been used to study the matching
behavior of same-sex couples. Based on the 1990 US Census, Jepsen and Jepsen (2002)
find positive assortative mating in four types of couples: married and cohabiting
opposite-sex couples and male and female same-sex couples. Same-sex couples were

7
more alike as to their labor-market characteristics than opposite-sex couples, while the
opposite was the case for various non-labor-market traits.
Evidently, census data that include information on household characteristics of
surveyed individuals allow for the study of co-residing couples of the same sex.
However, these data are not unproblematic as same-sex co-residential individuals are not
necessarily synonymous with gay and lesbian couples3 (Voon Chin Phua and Kaufman
1999). These problems with data ambiguity also arise when studying heterosexual
cohabitation. Co-residing persons of the opposite sex are not necessarily sexual partners
(Baughman et al. 2002).
2c. Family dynamics in same-sex marriages as compared to opposite-sex marriages
The main purpose of our study is to provide information on the family dynamics in
same-sex marriages as it can be measured by partnership-dissolution risks. In this
respect, we do not have a large body of previous research that we can draw from. An
overview of recent research on family relationships of gays and lesbians by Patterson
(2000) gives some information on the stability of gay and lesbian relationships. The
study of relationship duration typically requires a panel design or highly reliable
retrospective data. So far, such data have been hard to establish for an appropriate study
of couple dynamics of gays and lesbians4. Patterson (2000) concludes, however, that it
seems reasonable to believe that some of the problems in homosexual relationships stem
from the same roots as problems experienced by opposite-sex couples. A recent study by
Kurdeck (2004) supports this assumption. The literature on divorce of heterosexual
married couples is abundant, by contrast. Considering the impact of various
demographic variables, studies of such couples indicate that pairing at a very young age,
3 A recent German large-scale data source that includes information on same-sex as well as opposite-sex couples exemplifies this. The German Mikrozensus includes information on co-residence and also asks respondents to specify if they consider themselves as living in a “Gleichgeschlechtliche Lebensgemeinschaft” (same-sex union) or any other type of family. The self-identified same-sex couples are much fewer than the total of co-residing same-sex couples. Eggen (2002) suspects that problems connected with self-identification results in underreporting, and assumes that any “true” level of same-sex cohabitation in Germany would lie somewhere between the numbers arising from the two possible definitions.
4 Kurdeck (1992, 1995) provides a study on the stability of childless gay and lesbian couples in the US. However, his work was based on such small data that it hardly offers a possibility to make generalizations about a wider population of gays and lesbians.

8
a low socio-economic status, low education, a considerable age difference between the
spouses as well as socio-cultural differences are important risk factors for divorce
(Clarke and Berrington 1999; Sayer and Bianchi 2000). For some of these factors,
however, such as a high risk for spouses with little formal education and for those with
manual-worker occupations, the elevated divorce risk might decrease with marriage
duration (Jalovaara 2002).
3. Registered partnerships: Definitions, data, and methods
The object of our study is registered partnerships in Norway and Sweden. This type of
civil-status has nearly the same legal consequences as marriage does. This means that
registered partners have the same rights and duties as married heterosexual couples in
relation to each other and society. The legislation is very much the same in all Nordic
countries, but differs as to the adoption of children, artificial insemination, and the
solemnization of the partnership5. This being said, the legal rights and duties connected
to marriage are less decisive in Scandinavia than in other countries (for an overview of
family law and the consequences of marriage in other European countries, see Hamilton
and Perry, 2002). In the context of the Nordic welfare state, social rights are largely
based on individuals, regardless of their family status. Economic motives that may be
an important factor leading to marriage in the US, such as joint health-insurance
coverage, are virtually non-existent in the universalistic welfare state.
The data for our calculations on partnership dynamics are derived from the
population-register systems of Norway and Sweden. They cover the populations of
the two countries and their recordable vital events with a high degree of accuracy.
Each change in civil status is recorded, and since each individual living in one of the
two countries has a unique personal identity code we have derived longitudinal
histories of the family dynamics of each person who has ever registered a partnership
formation in any of the two countries. Similar event histories can be collected for
individuals who have entered a heterosexual marriage, and we were able to include
5 Churches do not conduct ceremonies of partnership formation. In Norway the act of registration is performed by a Notarius Publicus, in Sweden by a court or a private person with special authorization. Medically assisted insemination is not available to women in registered partnerships both in Norway and Sweden. Since 2003 registered partners in Sweden are jointly allowed to adopt children. This permission includes international adoption. Legal provision is made for the adoption of the partner's child only in Norway (Waaldijk 2003).
9
such data for Sweden6. This allows for an appropriate comparison of our populations
of same-sex partnerships with that of an equally defined population of opposite-sex
marriages. The populations are defined by their civil status; there is no ambiguity in
the categories we use. Individuals who have never lived in either of the two countries
cannot be traced directly in the registers and some partnerships that involve persons
living abroad cannot be incorporated properly into our analyses. In the case of
Sweden, we had to exclude 100 same-sex couples from our analyses since we had no
information at all on one of the two partners involved.
The first part of our analysis is a descriptive one. Here we mention various
demographic characteristics of individuals who have formed a partnership in Norway
or Sweden. The characteristics are derived from various administrative registers and
measured at the time of partnership formation. We have defined our variables so that
they give the characteristics at the couple level. Our demographic description involves
information on characteristics such as age, sex, geographical background, experience
of previous opposite-sex marriage, parenthood, and educational attainment of the
partners involved. Our variables are defined as follows.
We depict the age composition of persons registering a partnership by giving
the mean age of the two partners at the time of registration. The distribution is
provided by the categories “mean age 30 or less”, “mean age 31-40”, and “mean age
41 or above”. In addition, we give the distribution over various categories of age
difference between the two partners involved.
For both countries, we describe the fraction of partnerships that involve at
least one person living in the capital area at the time of partnership formation7. For
Norway, this is the City of Oslo, while for Sweden, we use the Greater Stockholm
Metropolitan Area as our geographical demarcation. We further describe the
geographical background of the partners by giving the distribution over various
national origins. In Norway, national origin is measured by citizenship at the time of
partnership formation. In Sweden, by contrast, it is measured by country of birth. A
6 The data cover marriages contracted 1993-1999, Swedish partnerships entered 1995-2002, and Norwegian partnerships formed 1993-2001. The minor discrepancy in the observation period of marriages as compared to that of registered partnerships in Sweden is due to data availability.
7 Most partners are likely to live together at the time of partnership formation, but need not necessarily be registered (yet) as living at the same address. In our data for Sweden, we found that about half of the

10
distinction is made between couples where both partners are local residents, and
couples where at least one of the partners comes from abroad. We report on couples
where at least one partner comes from another Nordic country, another European
country (including the Anglo-Saxon countries overseas), a non-European country, or
where the national origin is not known. If both partners are foreigners and from
different categories of countries, they are allocated to the most “distant” category of
our country scale.
We further describe the partners by their previous experiences of registered
heterosexual family life. We give the percentage of unions where at least one of the
two partners previously has been heterosexually married, and where at least one of
the two is a parent. Where this applies, we need to be aware that these figures cover
events only that are registered in the local country. We have no information about
possible previous marriages of immigrants contracted abroad or children of
immigrants that have never lived in Sweden or Norway.
Finally, we provide a description of the partners’ educational characteristics.
We report on the highest educational level at the time of partnership formation, as
summarized at the couple level. In addition, we provide information on the various
fields of education that the partners had at that time. The data on educational
orientation contain nine categories, and we provide them as summaries on individuals
rather than couples.
When examining divorce patterns, the fixed characteristics described above
are used as determinants of divorce. In addition, a further covariate is added in order
to account for if a couple belonged to the pioneers of same-sex marriages of the first
twelve months during which it was possible to register a partnership in the country
considered. A relatively large number of partnerships were entered in the first year
and we may suspect that these pioneers differ somewhat in their behavior from those
who registered in subsequent years.
Our study is a longitudinal event-history analysis of divorce risks. We
calculate the relative risks of divorce by the various categories of our variables at
hand. We follow each couple from the month of partnership formation to any
registration of divorce or to censoring due to the death of one of the partners,
emigration of both partners, or the end of the last year for which we have data,
partners involved had been registered as living together at the same address for a period of at least two years prior to partnership registration.

11
whichever comes first. The registration of partnership dissolution follows the same
legal procedures as those of marriage dissolution in Norway and Sweden. The
procedures differ between the two countries, however, and this affects the timing of
the divorce registration. In Norway, as a main rule partners and spouses are required
to register as being legally separated during a period of one year before being granted
a divorce. In Sweden, there is no such prerequisite, but if one of the partners disagrees
on the divorce he or she may ask for a six-month waiting period before the divorce is
legalized and registered8.
Technically, we estimate proportional-hazards (intensity-regression) models of
the divorce process. Such models are a standard tool for the analysis of time-
dependent data like ours. In the Swedish analyses, we have incorporated the basic
time variable duration of partnership as a piece-wise constant covariate. As for
Norway, we have estimated models that are based on a non-parametric time factor.
These differences in modeling are due to the different software that we have used: S-
PLUS for Norway and RocaNova for the Swedish analyses. They have no impact on
the relative risks that we present.
With our data on couples in different types of unions, we are able to compare
the characteristics and patterns of behavior in male partnerships with those in female
partnerships. Similarly, we can compare patterns in unions in Norway with those in
Sweden, and, finally, patterns in same-sex marriages with those in opposite-sex
partnerships.
4. The populations of registered partners in Norway and Sweden
Our first observation is that the incidence of same-sex marriage in Norway and
Sweden is not particularly impressive in terms of numbers. Our data for Norway
consist of 1,293 partnerships contracted 1993-20019. During the same calendar period,
8 The legal differences in the timing of divorce in Norway and Sweden would have caused problems if we had estimated joint divorce models based on the combined data of the two countries. However, we aimed at estimating separate models for Norway and Sweden, and therefore have no problems in identifying the accurate divorce-risk patterns of each country considered.
9 The number of partnerships included in our study is slightly larger than that found in official statistics on partnership formation in Norway and Sweden, the reason being that official statistics only report events of individuals living in the country (at the time of partnership formation). Norwegian statistics report new partnerships if the oldest partner lived in Norway, while Swedish statistics are
12
190,000 heterosexual marriages were entered, which gives a ratio of around 7 new
same-sex marriages to every 1000 new opposite-sex marriages. For Sweden our data
comprise 1,526 partnerships entered 1995-20029. Related to the corresponding
280,000 heterosexual marriages registered during the same calendar period, we get a
ratio of 5 new partnerships to every 1000 new opposite-sex marriages. The ratios of
partnerships to marriages are thus considerably lower than the various estimates of
fractions of homosexuals that we referred to in Section 2. The incidence of
partnership formation in the two countries also appears relatively low when compared
to the levels of partnership formation in Denmark and the Netherlands (Waaldijk
2001: 463; Noack et al. 2002: Figure 1; Eggen 2002: 229; Digoix et al. 2004).
Trends in partnership formation by country and sex (Figure 1) reveal that the
developments in annual numbers of new partnerships have been quite similar in the
two countries. Both countries exhibited a particularly high level of partnership
formation immediately after the legislation on registered partnerships came into force.
In both countries, the number of partnerships of men has been about 60 percent higher
than that of women: 62 percent of all partnerships have been male. The initial spurt in
partnership formation was followed by a few years of stable trends at a lower level,
and a subsequent increase in registration during the most recent years. The recent
increase has been stronger for women than for men so that the sex gap in partnership
formation has narrowed.
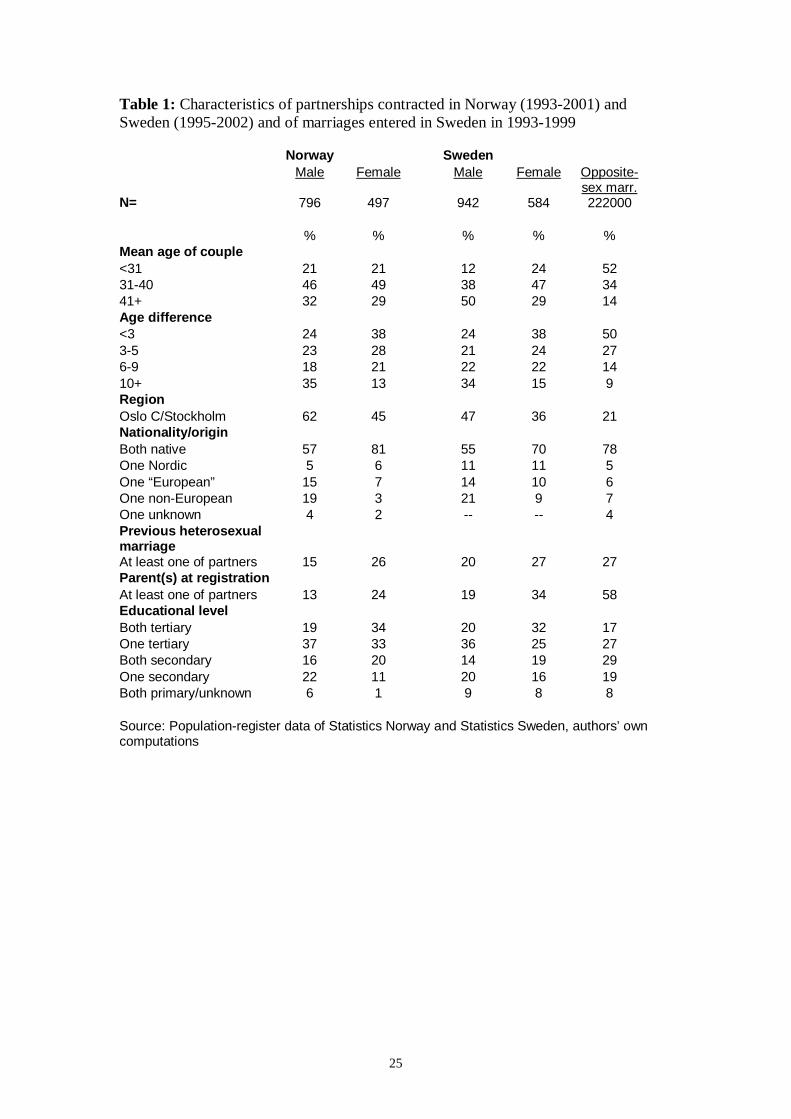
Table 1 gives a more detailed description of partnership composition. It also
draws a comparison with couples of newly contracted opposite-sex marriages in
Sweden. The table shows that new same-sex partners on average are considerably
older than corresponding opposite-sex spouses10. About one third of all partnerships
were contracted by partners at ages 41 and above. In Sweden, half of all new male
partnerships involved partners with a couple mean age above 40. By contrast, only 14
percent of heterosexual marriages belonged to this category. The relatively high ages
also account for substantial age differences between same-sex partners, which are
more common than in opposite-sex marriages. By the same token, they are more
frequent in partnerships between men than in those between women: Around one third
entirely based on individuals and thus report new registered partners living in Sweden. In our research, we have been able to retrieve information also on partners who subsequently moved to the country of partnership registration.
13
of all male partnerships are formed by men with an age difference between them
amounting to ten years or more.
In both countries, same-sex couples tend to be concentrated to the
metropolitan areas: Oslo and Stockholm. This tendency is stronger in Norway than in
Sweden, and in both countries it is stronger for men than for women. In Norway, 62
percent of male partnerships and 45 percent of female partnerships involved a partner
living in the city of Oslo. This compares to a mere 11 percent of the total Norwegian
population living in Oslo. In Sweden, 47 percent of male new partnerships and 36
percent of female partnerships involved a partner living in the Stockholm region, as
compared to 21 percent of registered heterosexual marriages.
Same-sex partnerships also differ from opposite-sex marriages in that one of
the partners is more often foreign-born. This is particularly the case for partnerships
between men. In Norway, 43 percent of male partnerships include a non-Norwegian
citizen. In Sweden, 45 percent of gay partnerships involve at least one foreign-born
partner. In the latter country, 22 percent of newly contracted heterosexual marriages
also have at least one partner of foreign origin. This figure does not necessarily
suggest that Swedes tend to marry foreigners: The 22 percent correspond rather well
with the total share of foreign-born people living in Sweden at the ages when people
marry.
It is not uncommon that partners in same-sex unions have experience of
previous heterosexual family life. In our summary, we find that a fourth of lesbian
partnerships include at least one partner who has been married to a man previously.
This fraction happens to be exactly the same as that of newly contracted heterosexual
marriages: one fourth of such unions involve at least one previously married spouse.
Evidently, lesbian women are somewhat older at partnership formation and have had
more time for previous marital life than their heterosexual counterparts. The
corresponding numbers for male partnerships are somewhat lower.
The experience of previous heterosexual marital life corresponds well with the
fractions of partnerships that involve a partner who is a parent. Female partners tend
to be parents more often than male partners. Parenthood is also more common in
partnerships in Sweden than in Norway. One third of lesbian partnerships in Sweden
10 The mean age of newly married heterosexual spouses was close to 30 years while that of all newly registered homosexual partners was close to 40.

14
have a least one parent. For newly contracted heterosexual marriages, the
corresponding fraction is 58 percent. In Scandinavia, it is more common to marry
after entry into parenthood than before having a first child, if at all.
When it comes to socio-economic characteristics, we find that same-sex
partners have a relatively high educational attainment. In between 56 and 67 percent
of homosexual partnerships at least one partner has a tertiary education. The
corresponding fraction for new heterosexual marriages is 44 percent. The difference
would have been even larger if we had accounted for the fact that educational
attainment typically is higher for persons of younger cohorts and that same-sex
partners more often than others belong to somewhat older cohorts.
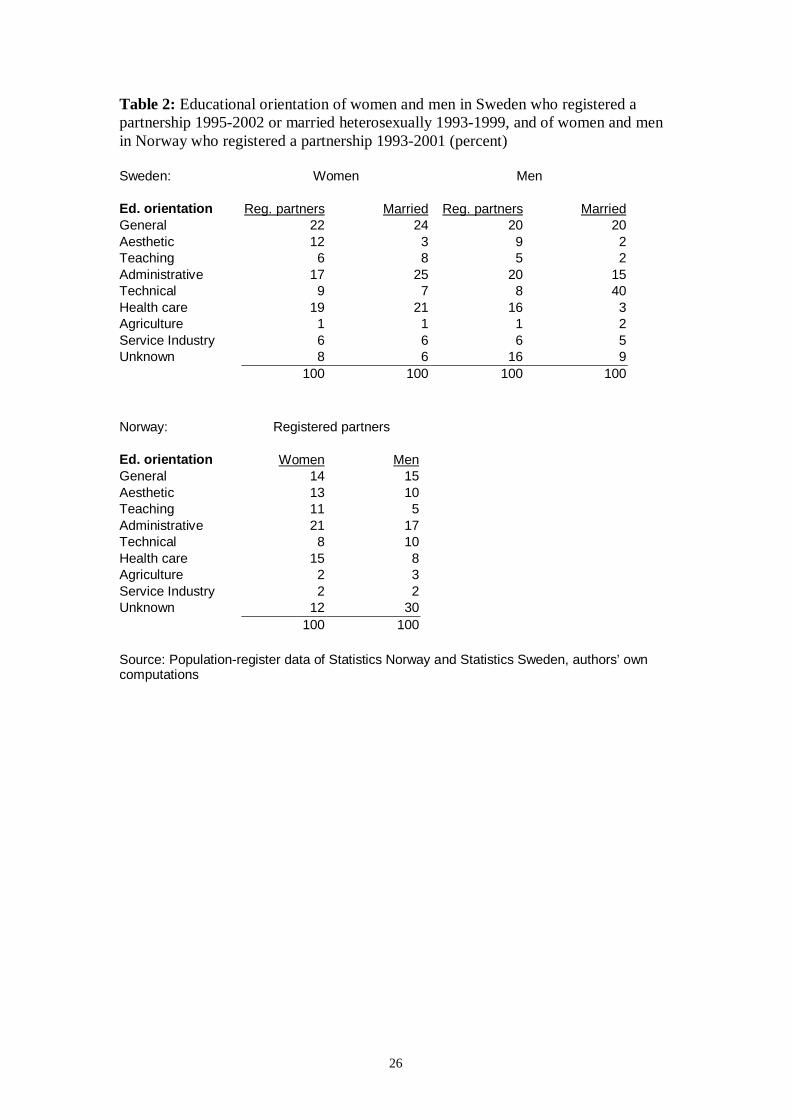
We conclude our description by providing an overview of the educational
orientation of individuals in our study populations (Table 2). Since the educational
registers of Sweden and Norway also contain information on the type of education a
person has attained, we are in a position to examine the extent to which we can find
any systematic differences in characteristics as regards this dimension of individual
educational capital, too. A comparison of the groups of married women reveals that
the differences are not that dramatic, and that lesbians to a larger extent than their
heterosexual equivalents have an education with an aesthetic orientation. Gay men
who enter partnerships have a similarly high fraction of individuals with an aesthetic
education (by around 10 percent), and do otherwise not differ largely from the
populations of married women as concerns their field of education. They differ from
heterosexual married men in that a much lower fraction of individuals has a
technically oriented education. Heterosexual married men have a very low fraction of
individuals with an education oriented towards health care.
5. Patterns of divorce in same-sex “marriages” in Norway and Sweden
In Table 3, we display the relative divorce risks of couples in registered partnerships
for each sex and country separately. For comparison, we provide the corresponding
risks for heterosexual marriages in Sweden. They are calculated for each of the
variables described above, except for educational orientation. They give the effects of
any level of a certain covariate relative to a baseline category of the same covariate. A
risk of say 1.20 indicates that the risk of divorce is 20 percent higher for couples of
15
the relevant category than for couples belonging to the reference category of the same
variable. The risks are derived from a multivariate model, which means that the
effects of any variable hold when we control, or standardize (Hoem 1993), for the
simultaneous effects of the other variables included in the model.
The general impression of the results of our calculation is that divorce patterns
in partnerships and in marriages are remarkably similar when it comes to the effects
of the covariates. The results can be summarized as follows11. We find no systematic
or important difference in divorce propensities between the pioneering partners of the
first year of partnership registration and subsequently registered partners. For both
heterosexual spouses and registered partners, there is a clear age gradient in divorce
risks in that persons who contract a marriage or register a partnership at young ages
have much higher divorce risks than persons who do this at more mature ages. In most
cases, a relatively large age difference between the two partners is related to an
elevated propensity for divorce. Divorce risks do not largely differ between couples of
the capital region and couples registered elsewhere in the two countries. In contrast,
the stability of unions is negatively affected by the involvement of at least one foreign
partner. The destabilizing effect of any previous experience of a heterosexual
marriage is not at all as apparent for same-sex couples as it is for heterosexually
married couples. The effect of premarital parenthood seems to differ somewhat
between male and female couples, but patterns appear quite irregular and should not
be given too much attention. Concerning a couple’s educational characteristics, we
mainly find that a high educational attainment is related to lower divorce risks. For
Sweden, there is a very clear gradient in the effects of partners’ educational levels.
For Norway, it is more irregular. Finally, the profile of divorce risks by time since
marriage formation is practically the same for same-sex partnerships and opposite-sex
marriages.
Next, we examine the extent to which propensity to divorce differs by the sex
of the partnership, and whether it differs between registered partnerships and
11 Statistical testing reveals that not all variables appear significant at a 5-percent level. For Sweden, it is only “age”, “educational level”, and “duration of partnership” that has a significant effect. For Norway, only “age” is significant in all models. As to heterosexual marriages, however, each single effect is significant at the 5-percent level. Note that most of the risk patterns we observe are very stable across the various sub-populations of married people. Regardless of significance, this stability in patterns reassures us that we in general can trust our findings, but that we should not take every single deviation in divorce risk as an established fact.

16
opposite-sex marriages or not. This is done by estimating common models for
partnerships of women and men, and in the case of Sweden, for partnerships and
marriages. A covariate for type of union gives information on divorce risks by the
different family types. Tables 4 and 5 contain the relative risks for Norway and
Sweden respectively. For Norway, an introductory model that only includes type of
union as a covariate (Raw Model) first indicates that divorce risks are 77 percent
higher in lesbian partnerships than in those of gay men. To some extent, this could
have been the result of various differences in the composition of gay and lesbian
partnerships over different demographic characteristics. However, a model that
controls for the effect of such covariates (Extended Model) instead reveals that the
excess risk of divorce in female partnerships actually is more than twice that of the
risk in male unions.
For Sweden, we find the same relation between the divorce risks of lesbian
and gay partnerships. In addition, we provide a comparison with the divorce-risk level
of opposite-sex marriages (Table 5). An introductory model without further
explanatory variables (Raw Model) shows that the divorce risk in partnerships of men
is 50 percent higher than the corresponding risk in heterosexual marriages, and that
the divorce risk in female partnerships is about double that of men. Again, such
differences in risk levels could partly be the result of differences in the composition of
the different groups under study. We know, for example, that same-sex partnerships
relatively often involve a non-native partner and that such characteristics are related to
higher divorce risks. On the other hand, registered same-sex partners are often older
than corresponding opposite-sex spouses, which is a feature related to a lower
propensity for divorce. It turns out that a control for the demographic characteristics at
hand12 (Extended Model) does not alter the basic relation we found between divorce
risks in different types of families.
One basic difference between same-sex partnerships and opposite-sex
marriages is that most often the former family type does not produce children.
Possibly the relatively lower divorce risk of heterosexual marriages is to some extent
related to parenting. In order to test this hypothesis we have estimated two additional
models that are based on childless couples only. We have thus excluded all

17
partnerships and marriages where at least one of the two partners was a parent at the
time of registration. In addition, we have censored each childless heterosexual
marriage at the time of any first birth. A crude model without further demographic
covariates (Raw Model C) indicates that the excess risk of divorce of gay partnerships
tends to disappear when the comparison is based on childless couples. Nevertheless,
an appropriate control for relevant covariates (Extended Model C) leaves patterns
more or less as we first found them. This result does not preclude that there is an
effect of parenthood in reducing the divorce risks in heterosexual marriages. To some
extent, the disruption risks of childless heterosexual spouses may be reduced in
anticipation of childbearing, i.e., when spouses stay together in order to fulfill their
parenthood plans.
6. Reflections: The demographics of same-sex “marriages” in Norway and
Sweden
In our study, we have provided an overview of the demographic characteristics and
patterns in the union dynamics of the first cohorts of registered partnerships in
Norway and Sweden. The data on these pioneering cohorts of same-sex spouses
provide information on a family type that at present is introduced in a wider circle of
countries. Since this still is a recent family type, we are in no position to say much
about any long-term patterns or developments. However, our cross-country
comparison still allows us to draw at least some conclusions about the dynamics of
registered partnerships.
One finding is that male partners formed the majority of registered
partnerships. To some extent, this may reflect a larger fraction of gays than lesbians in
the total population. Most studies indicate that this indeed is the case. However, we
know nothing about differences in the motivation for partnership registration between
women and men. As a result we cannot readily translate it into an explanation for our
finding. To some extent, however, it could reflect the relative importance of some
instrumental motives that appear to be relevant for partnership registration. Two such
12 In the common model of registered partnerships and heterosexual marriages we exclude variables for partnership cohort, previous marriage, and parenthood. The meaning of these variables differs between the populations and the relative risks of Table 3 show that the effects on divorce differ as well.
18
motives are more often likely to be relevant for groups of gay men than for others.
The first is the need for legal protection of common assets in the face of the
anticipated mortality of the partner13. The second is related to the migration of a
foreign partner. Our data show that a very large fraction of male partnerships involve
a foreign partner. In many such cases, a migration to Norway or Sweden and,
consequently, co-residence may simply not be possible without the legal intervention
of a partnership registration.
In many aspects, the different populations of partners and spouses are distinct
in terms of their various demographic and socioeconomic characteristics. Note the
interesting contrast in terms of educational achievement: Registered same-sex partners
have achieved a considerably higher level of such individual investment than have
opposite-sex partners who marry. This suggests that a high level of certain types of
human capital often is needed in order to manifest a minority family status of the kind
we study. It is interesting that such an effect appears so prominently even in an
equality-oriented society such as in Scandinavia.
Our population of same-sex couples is defined by their change in civil status to
that of a registered partnership. Such an unambiguously defined population of gay and
lesbian couples has never been studied before. Nevertheless, we find that many of the
various demographic characteristics of our Scandinavian couples resemble those
found for other populations of same-sex couples, such as co-residing people of the
same sex in the US (Black et al. 2000). Evidently, some aspects of gay and lesbian
lifestyles seem to be of such a common nature that they appear regardless of the type
of data at hand.
Finally, we provided a divorce-risk study. We found that divorce risks are
higher in same-sex partnerships than opposite-sex marriages, and that unions of
lesbians are considerably less stable, or more dynamic, than unions of gay men. In
Norway as well as in Sweden, the divorce risk in female partnerships is practically
double that of the risk in partnerships of men. Our data is based on legal unions of
short durations only, so we can say nothing about the fraction of unions that
13 This motive for partnership registration could also affect the structure of the divorce risks we estimate. However, an evaluation of mortality patterns in the different study populations reassures us that differences in mortality are unlikely to affect divorce risks.

19
eventually will end in disruption14. Nevertheless, a higher propensity for divorce in
same-sex couples is not very surprising given this group’s relative non-involvement in
joint parenthood and its lower exposure to normative pressure as to the necessity of
life-long unions. The difference in divorce behavior between women and men appears
somewhat more intriguing. It cannot be explained by differences in the composition of
couples by our explanatory factors at hand. Nevertheless, some of these differences
provide some insights into possible unobservable characteristics that may be relevant
as well. We find that partnerships of women are demographically homogamous to a
much larger extent than partnerships of men: Lesbian partners often have relatively
similar characteristics while gay spouses more often differ in terms of age, nationality,
education, and income etc.15. The similarity in characteristics may also reflect a
deeper feeling of sameness in lesbian couples. This sameness and a corresponding
lack of clear power structures may be inducive to a high level of dynamism in the
relationship, but perhaps not to the kind of inertia that is related to marital stability.
Differences in divorce risks may also appear from differences in the motives of
lesbians and gays for entering a registered partnership in the first place. With our type
of data, we are in no position to explore qualitative aspects of that kind, but have to
leave this to colleagues in other scientific disciplines.
Acknowledgements
This paper is a joint work of the four co-authors. Our project was initiated by Turid
Noack. Gunnar Andersson has contributed to the paper with the Swedish part of our
study while the Norwegian analyses were performed by Turid Noack, Ane Seierstad,
and Harald Weedon-Fekjær. We are grateful to Karin Wahlbin of Statistics Sweden
for having prepared the individual-partnership data on Sweden. In addition, we extend
14 We applied life-table techniques to our data in order to estimate the fraction of partnerships that end in divorce within the time span that we can cover: In Norway, 16 percent of partnerships are likely to end in divorce within six years from partnership registration. A quarter of Swedish partnerships end that way.
15 For Sweden, we have also had access to data on the income of the partners. The data reveal that on average, the distribution of income between partners in gay couples is about as unequal as that of heterosexual spouses, while lesbian partners tend to have a similar earnings level.

20
our gratitude to Lee Badgett, Patrick Festy, Gerda Neyer, and Jens Rydström for their
valuable comments. Finally, we thank Susann Backer for language editing.
21
References
Agell, A., 1998. Alternative legal policies: A comparative view from a Swedish
observer. Pp. 31-38 in Vaskovics, L., and Schattovits, H. (eds), Living
Arrangements and Family Structures - Facts and Norms. Vienna: Austrian
Institute for Family Studies.
Badgett, L., 1997. Beyond biased samples: Challenging the myths on the economic
status of lesbians and gay men. Pp. 65-71 in: Gluckman, A., and Reed, B.
(eds), Homo Economics: Capitalism, Community, and Lesbian and Gay Life.
New York: Routledge.
Badgett, L., 2001. Money, Myths, and Change. The Economic Lives of Lesbians and
Gay Men. Chicago: University of Chicago Press.
Baughman, R., Dickert-Conlin, S., and Houser, S., 2002. How well can we track
cohabitation using the SIPP? A consideration of direct and indirect measures.
Demography 39: 455-465.
Beck, U., and Beck-Gernsheim, E., 1995. The Normal Chaos of Love. Cambridge:
Polity Press.
Black, D., Gates, G., Sanders, S., and Taylor, L., 2000. Demographics of the gay and
lesbian population in the United States: Evidence from available systematic
data sources. Demography 37: 139-154.
Black, D., Gates, G., Sanders, S., and Taylor, L., 2002. Why do gay men live in San
Francisco? Journal of Urban Economics 51: 54-76.
Black, D., Makar, S., Sanders, S., and Taylor, L., 2001. The effects of sexual
orientation on earnings. Syracuse University Economics Department Working
Paper 2001-4.
Clarke, L., and Berrington, A., 1999. Socio-demographic predictors of divorce. Paper
1 in: Simons (ed.), High Divorce Rates: The State of the Evidence on Reasons
and Remedies. London: Lord Chancellor’s Department.
Digoix, M., Festy, P., and Waaldijk, K., 2004. Same-sex couples and
heteronormativity. Paper presented at the PAA 2004 Annual Meeting, Boston,
April 1-3, 2004.
22
Eggen, B., 2002. Gleichgeschlechtliche Lebensgemeinschaften: Erste Ergebnisse
einer Untersuchung im Rahmen des Mikrozensus. Pp. 215-234 in: Schneider,
N., and Matthias-Bleck, H. (eds), Elternschaft Heute. Opladen:
Leske+Budrich.
Giddens, A., 1992. The Transformation of Intimacy. Oxford: Polity Press.
Hamilton, C., and Perry, A., 2002. Family law in Europe. Butterworths LexisNexis.
Hoem, J.M., 1993. Classical demographic methods of analysis and modern event-
history techniques. IUSSP: 22nd International Population Conference,
Montreal, Canada, Volume 3: 281-291.
Hoem, J.M., Aassve, A., Andersson, G., Baizán, P., Billari, F., Engelhardt, H.,
Fürnkrantz-Prskawetz, A., Hank, K., Huinink, J., Kohler, H-P., Kohlmann, A.,
Kreyenfeld, M., Neyer, G., and Vikat, A., 2000. Concepts for a second round
of Fertility and Family Surveys in Europe with particular attention paid to
persons of reproductive/working age. In: United Nations Economic
Commission for Europe/United Nations Population Fund (eds), Generations
and Gender Programme: Exploring Future Research and Data Collection
Options. Geneva: United Nations.
Jalovaara, M., 2002. Socioeconomic differentials in divorce risk by duration of
marriage. Demographic Research 7(16). Available online www.demographic-
research.org.
Jepsen, L., and Jepsen, C., 2002. An empirical analysis of the matching patterns of
same-sex and opposite-sex couples. Demography 39: 435-453.
Kurdeck, L., 1992. Relationship stability and relationship satisfaction in cohabiting
gay and lesbian couples: A prospective longitudinal test of the contextual and
interdependence models. Journal of Social and Personal Relationships 9: 125-
142.
Kurdeck, L., 1995. Lesbian and gay couples. Pp. 243-261 in D’Augelli, A., and
Patterson, C., (eds), Lesbian, Gay and Bisexual Identities over the Lifespan:
Psychological Perspectives. New York: Oxford University Press.
Kurdeck, L., 2004. Are gay and lesbian cohabiting couples really different from
heterosexual married couples? Journal of Marriage and Family 66: 880-900.
Lauman, E., Gagnon, J.M., Michael, R.T., and Michaels, S., 1994. The Social
Organization of Sexuality: Sexual Practices in the United States. Chicago:
University of Chicago Press.
23
Martin, C., and Théry, I., 2001. The PACS and marriage and cohabitation in France.
International Journal of Law, Policy and the Family 15: 135-158.
Moxnes, K., 1993. Partnerskapsloven - et uttrykk for parforholdets endrede karakter.
Løvetann 3: 30-31.
Nielsen, L., 1990. Family rights and the ‘registered partnership’ in Denmark.
International Journal of Law, Policy and the Family 4: 297-307.
Noack, T., 2000. Registrerte partnerskap: 1993-1998. Samfunnsspeilet, No. 3/2000:
24-29.
Noack, T., Fekjær, H., and Seierstad, A., 2002. Skilsmisser blant lesbiske og homofile
partnere - hvem er mest stabile? Samfunnsspeilet, No. 3/2002: 19-27.
Patterson, C., 2000. Family relationships of lesbians and gay men. Journal of
Marriage and the Family 62: 1052-1069.
Pedersen, W., and Kristiansen, H.W., 2003. Å gjøre det, å føle det og å være det.
Homoseksualitet i det seinmoderne. Tidsskrift for samfunnsforskning 44: 3-37.
Plug, E., and Berkhout, P., 2004. Effects of sexual preferences on earnings in the
Netherlands. Journal of Population Economics 17: 117-131.
Sayer, L., and Bianchi, S., 2000. Women’s economic independence and the
probability of divorce: A review and reexamination. Journal of Family Issues
21: 906-943.
Søland, B., 1998. A queer nation? The passage of the gay and lesbian partnership
legislation in Denmark, 1989. Social Politics, Spring 1998: 48-69.
Voon Chin Phua, and Kaufman, G., 1999. Using the census to profile same-sex
cohabitation: A research note. Population Research and Policy Review 18:
373-386.
Waaldijk, K., 2001. Small change: How the road to same-sex marriage got paved in
The Netherlands. Pp. 437-464 in Wintemute, R., and Andenæs, M. (eds), Legal
Recognition of Same-Sex Partnerships: A Study of National, European and
International Law. Oxford: Hart Publishing.
Waaldijk, K., 2003. Major legal consequences and procedures of civil marriage,
registered partnership and informal cohabitation for different-sex and same-sex
partners in nine European countries. Work in progress, version 17 September
2003. Leiden: E.M. Meijers Institute of Legal Studies, Universiteit Leiden.

24
Figure 1: Partnerships contracted in Norway and Sweden, 1993-2002
Note: The Norwegian partnership law became effective August 1, 1993. The Swedish law came into force January 1, 1995.
0
50
100
150
200
250
300
1993 1994 1995 1996 1997 1998 1999 2000 2001 2002
Male Norway
Female Norway
Male Sweden
Female Sweden
25
Table 1: Characteristics of partnerships contracted in Norway (1993-2001) and Sweden (1995-2002) and of marriages entered in Sweden in 1993-1999
Norway Sweden Male Female Male Female Opposite-
sex marr. N= 796 497 942 584 222000
% % % % %
Mean age of couple <31 21 21 12 24 52 31-40 46 49 38 47 34 41+ 32 29 50 29 14 Age difference <3 24 38 24 38 50 3-5 23 28 21 24 27 6-9 18 21 22 22 14 10+ 35 13 34 15 9 Region Oslo C/Stockholm 62 45 47 36 21 Nationality/origin Both native 57 81 55 70 78 One Nordic 5 6 11 11 5 One “European” 15 7 14 10 6 One non-European 19 3 21 9 7 One unknown 4 2 -- -- 4 Previous heterosexual marriage
At least one of partners 15 26 20 27 27 Parent(s) at registration At least one of partners 13 24 19 34 58 Educational level Both tertiary 19 34 20 32 17 One tertiary 37 33 36 25 27 Both secondary 16 20 14 19 29 One secondary 22 11 20 16 19 Both primary/unknown 6 1 9 8 8
Source: Population-register data of Statistics Norway and Statistics Sweden, authors’ own computations
26
Table 2: Educational orientation of women and men in Sweden who registered a partnership 1995-2002 or married heterosexually 1993-1999, and of women and men in Norway who registered a partnership 1993-2001 (percent) Sweden: Women Men
Ed. orientation Reg. partners Married Reg. partners Married General 22 24 20 20 Aesthetic 12 3 9 2 Teaching 6 8 5 2 Administrative 17 25 20 15 Technical 9 7 8 40 Health care 19 21 16 3 Agriculture 1 1 1 2 Service Industry 6 6 6 5 Unknown 8 6 16 9 100 100 100 100 Norway: Registered partners
Ed. orientation Women Men General 14 15 Aesthetic 13 10 Teaching 11 5 Administrative 21 17 Technical 8 10 Health care 15 8 Agriculture 2 3 Service Industry 2 2 Unknown 12 30 100 100 Source: Population-register data of Statistics Norway and Statistics Sweden, authors’ own computations
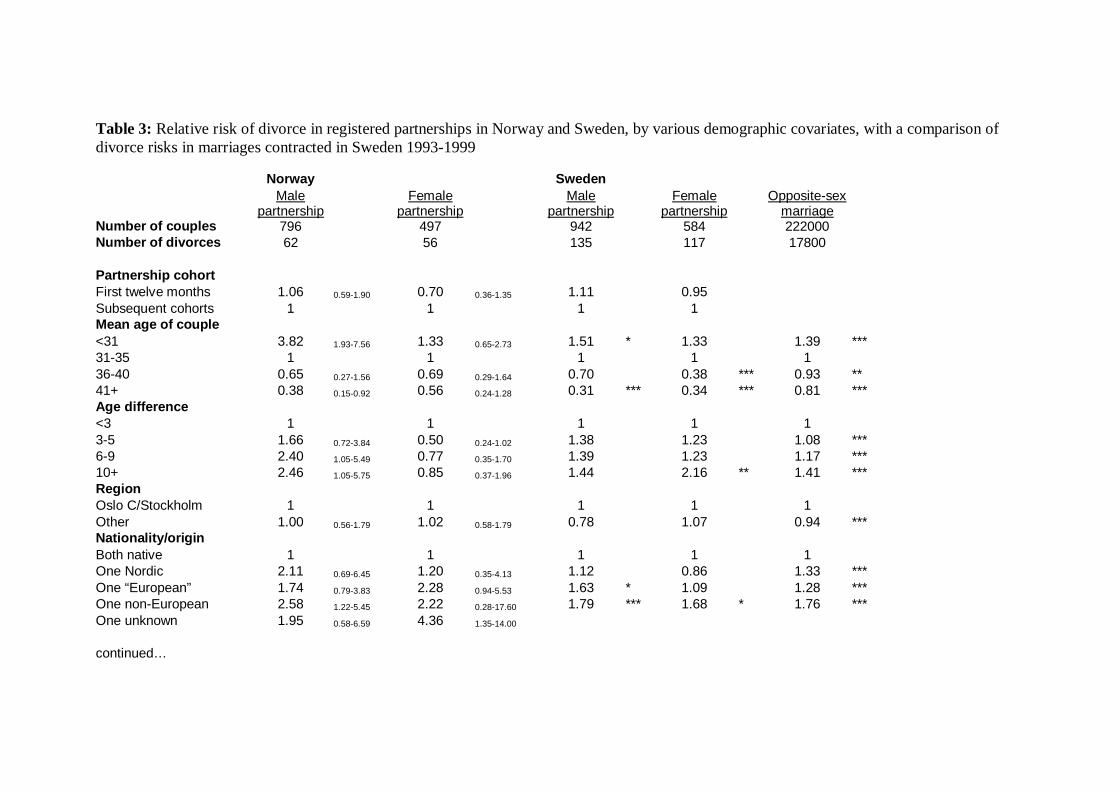
Table 3: Relative risk of divorce in registered partnerships in Norway and Sweden, by various demographic covariates, with a comparison of divorce risks in marriages contracted in Sweden 1993-1999
Norway Sweden Male
partnership Female
partnership Male
partnership Female
partnership Opposite-sex
marriage
Number of couples 796 497 942 584 222000 Number of divorces 62 56 135 117 17800 Partnership cohort First twelve months 1.06 0.59-1.90 0.70 0.36-1.35 1.11 0.95 Subsequent cohorts 1 1 1 1 Mean age of couple <31 3.82 1.93-7.56 1.33 0.65-2.73 1.51 * 1.33 1.39 *** 31-35 1 1 1 1 1 36-40 0.65 0.27-1.56 0.69 0.29-1.64 0.70 0.38 *** 0.93 ** 41+ 0.38 0.15-0.92 0.56 0.24-1.28 0.31 *** 0.34 *** 0.81 *** Age difference <3 1 1 1 1 1 3-5 1.66 0.72-3.84 0.50 0.24-1.02 1.38 1.23 1.08 *** 6-9 2.40 1.05-5.49 0.77 0.35-1.70 1.39 1.23 1.17 *** 10+ 2.46 1.05-5.75 0.85 0.37-1.96 1.44 2.16 ** 1.41 *** Region Oslo C/Stockholm 1 1 1 1 1 Other 1.00 0.56-1.79 1.02 0.58-1.79 0.78 1.07 0.94 *** Nationality/origin Both native 1 1 1 1 1 One Nordic 2.11 0.69-6.45 1.20 0.35-4.13 1.12 0.86 1.33 *** One “European” 1.74 0.79-3.83 2.28 0.94-5.53 1.63 * 1.09 1.28 *** One non-European 2.58 1.22-5.45 2.22 0.28-17.60 1.79 *** 1.68 * 1.76 *** One unknown 1.95 0.58-6.59 4.36 1.35-14.00 continued…

28
Previous heterosexual marriage
None 1 1 1 1 1 At least one of partners 0.95 0.36-2.53 1.35 0.60-3.06 1.19 1.14 1.77 *** Parent(s) at registration None 1 1 1 1 1 At least one of partners 2.41 0.99-5.87 0.95 0.39-2.34 1.19 0.82 1.33 *** Educational level Both tertiary 1 1 1 1 1 One tertiary 1.13 0.52-2.46 1.38 0.65-2.93 5.36 *** 1.80 * 1.58 *** Both secondary 1.89 0.75-4.75 2.45 1.10-5.48 8.05 *** 2.07 ** 2.03 *** One secondary 0.90 0.38-2.17 1.12 0.40-3.09 9.50 *** 3.18 *** 3.13 *** Both primary/unknown 0.86 0.25-2.93 0.02 0.00-- 10.37 *** 3.71 *** 3.69 *** Duration 1st year [1] [1] [1] 2nd year Non-param. baseline 1.33 1.86 ** 2.42 *** 3rd year 2.66 *** 2.32 *** 3.05 *** 4-5th years 3.58 *** 3.15 *** 3.43 *** 6-8th years 1.81 2.84 *** 3.29 *** Notes: For Norway, relative risks are given with 95% confidence intervals; for Sweden significance of effects are indicated by stars: *** = significant at 1% level, ** = significant at 5% level, * = significant at 10% level Source: Population-register data of Statistics Norway and Statistics Sweden, authors’ own computations

Table 4: Relative risk of divorce in registered partnerships in Norway, by sex Raw Model Extended Type of union Male partnership 1 1 Female partnership 1.77 1.23-2.54 2.32 1.51-3.54
Partnership cohort
First twelve months 0.84 0.55-1.28
Subsequent cohorts 1
Mean age of couple
<31 2.37 1.48-3.79
31-35 1
36-40 0.64 0.35-1.18
41+ 0.45 0.25-0.81
Age difference
<3 1
3-5 0.85 0.51-1.41
6-9 1.36 0.80-2.30
10+ 1.43 0.83-2.46
Region
Oslo 1
Other 0.95 0.65-1.41
Citizenship
Both Norwegian 1
One Nordic 1.64 0.73-3.68
One “European” 2.20 1.24-3.90
One non-European 3.04 1.62-5.69
Unknown 3.56 1.58-8.04
Previous heterosexual marriage
None 1
At least one of partners 1.10 0.60-2.02
Parent(s) at registration
None 1.00
At least one of partners 1.57 0.85-2.89
Educational level
Both tertiary 1
One tertiary 1.12 0.66-1.91
Both secondary 1.90 1.06-3.42
One secondary 0.93 0.49-1.77
Both primary/unknown 0.70 0.23-2.15
Duration Non-param. baseline Note: Relative risks are given with 95% confidence intervals Source: Population-register data of Statistics Norway, authors’ own computations

30
Table 5: Relative risk of divorce in registered partnerships and marriages in Sweden, by type of union All couples Childless couples Raw Model Extended Raw Model C Extended C Type of union Male partnership 1.50*** 1.35*** 1.04 1.49*** Female partnership 2.67*** 3.03*** 1.96*** 3.00*** Heterosexual marriage 1 1 1 1 Mean age of couple <31 1.15*** 1.31*** 31-35 1 1 36-40 1.08*** 0.69*** 41+ 1.03 0.43*** Age difference <3 1 1 3-5 1.11*** 1.10*** 6-9 1.23*** 1.16*** 10+ 1.50*** 1.48*** Region Stockholm 1 1 Other 0.95*** 0.85*** Country of birth Both Swedish-born 1 1 One Nordic 1.35*** 1.01 One “European” 1.24*** 1.21*** One non-European 1.96*** 1.71*** Educational level Both tertiary 1 1 One tertiary 1.70*** 1.36*** Both secondary 2.27*** 1.61*** One secondary 3.71*** 2.31*** Both primary/unknown 4.46*** 3.01*** Duration 1st year [1] [1] [1] [1] 2nd year 2.40*** 2.40*** 2.62*** 2.59*** 3rd year 3.02*** 3.04*** 3.82*** 3.78*** 4-5th years 3.32*** 3.40*** 4.91*** 4.94*** 6-8th years 3.07*** 3.21*** 4.00*** 4.25*** Notes: *** = significant at 1% level, ** = significant at 5% level, * = significant at 10% level Source: Population-register data of Statistics Sweden, authors’ own computations