Division of Maternal and Child Health - Ky CHFS Sheets/Lake Cumberland.pdfDivision of Maternal and...
18
Division of Maternal and Child Health For questions or inquiries, please contact the Kentucky Division of Maternal and Child Health (502)564-2154 chfs.ky.gov Lake Cumberland Area Development District 2017 Fact Sheets Table of Contents Pages Births………………………………………………………….…1-2 Breastfeeding…………………………………………………..3-4 Infant Mortality………………………………………………..5-6 Low Birth Weight……………………………………………...7-8 Medicaid Enrolled…………………………………………...9-10 Prenatal Care……….……………………………………….11-12 Prenatal Smoking………………………………….……….13-14 Preterm Birth………………………………….…………….15-16
Transcript of Division of Maternal and Child Health - Ky CHFS Sheets/Lake Cumberland.pdfDivision of Maternal and...
Division of Maternal and Child Health
For questions or inquiries, please contact the Kentucky Division of Maternal and Child Health
(502)564-2154
chfs.ky.gov
Lake Cumberland Area Development District
2017 Fact Sheets
Table of Contents Pages
Births………………………………………………………….…1-2
Breastfeeding…………………………………………………..3-4
Infant Mortality………………………………………………..5-6
Low Birth Weight……………………………………………...7-8
Medicaid Enrolled…………………………………………...9-10
Prenatal Care……….……………………………………….11-12
Prenatal Smoking………………………………….……….13-14
Preterm Birth………………………………….…………….15-16

1
Live Birth Rate by Region, 2013-2017*
*Note: 2017 data are preliminary and are subject to change. °Births before 28 weeks of gestation account for less than or equal to 1 percent of births and have been excluded.
^Other Payer Source: Includes insurance for members and family members of the United States armed forces. Kentucky military bases are present within Christian, Hardin and Madison Counties.
Division of Maternal and Child Health
Birth Fact Sheet, 2017 Lake Cumberland Area Development District Green, Taylor, Adair, Cumberland, Russell, Casey, Pulaski, Clinton, Wayne and McCreary counties
Percent of Lake Cumberland Births by Race, 2017*
Percent of Lake Cumberland Births by Gestational Weeks°, 2017*
Live Births in Kentucky
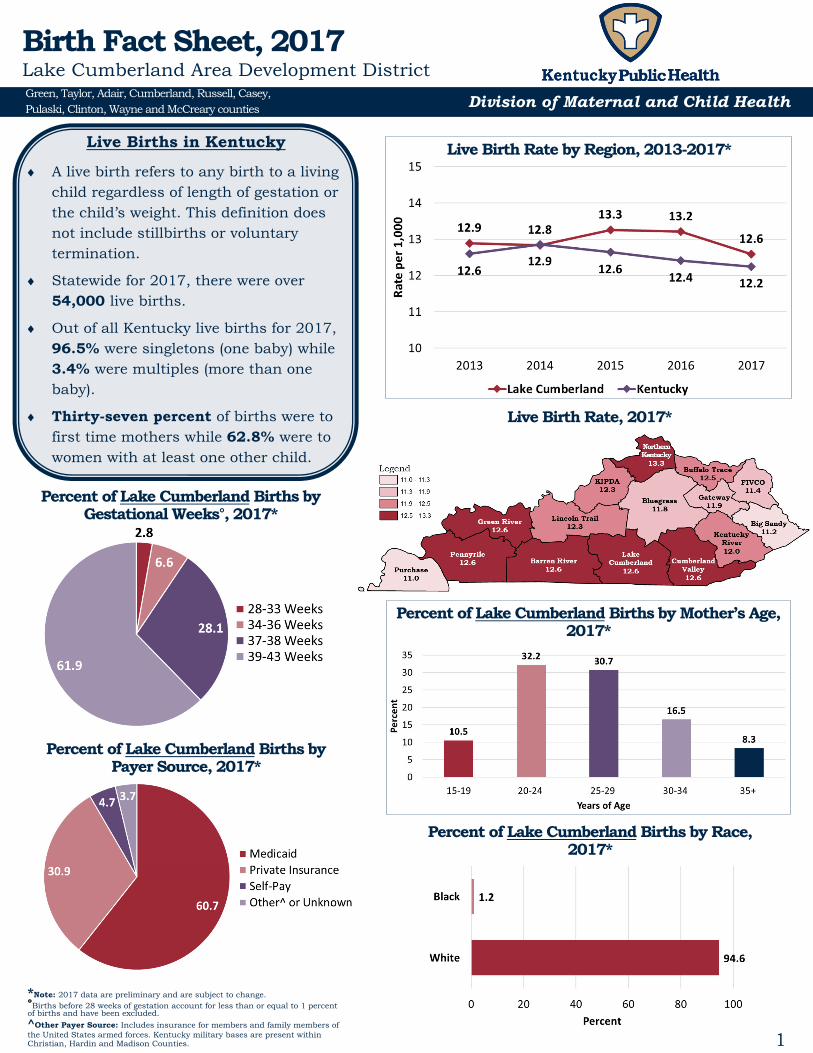
A live birth refers to any birth to a living child regardless of length of gestation or the child’s weight. This definition does not include stillbirths or voluntary termination.
Statewide for 2017, there were over 54,000 live births.
Out of all Kentucky live births for 2017, 96.5% were singletons (one baby) while 3.4% were multiples (more than one baby).
Thirty-seven percent of births were to first time mothers while 62.8% were to women with at least one other child.
Live Birth Rate, 2017*
Percent of Lake Cumberland Births by Payer Source, 2017*
Percent of Lake Cumberland Births by Mother’s Age, 2017*

2
Birth Fact Sheet, 2017 Lake Cumberland Area Development District
Division of Maternal and Child Health
Percent of Lake Cumberland Births by Education, 2017*
Green, Taylor, Adair, Cumberland, Russell, Casey, Pulaski, Clinton, Wayne and McCreary counties
Eighty-three percent of births statewide were to white mothers while only 9.1% were to black mothers.
KIPDA had the highest percentage of births to black mothers at 21.2%
Of all Kentucky live births for of 2017, 64.6% were delivered vaginally and 35.4% were delivered through cesarean.
Purchase had the highest percentage of cesarean deliveries at 40.7%.
Area Development
District
Low Birth Weight
(<2,500 grams)
Preterm Births (<37 weeks gestation)
Early Prenatal Care (during the first
trimester)
Smoking During
Pregnancy
Breastfeeding Initiated
Medicaid Enrollment (Enrolled at
birth)
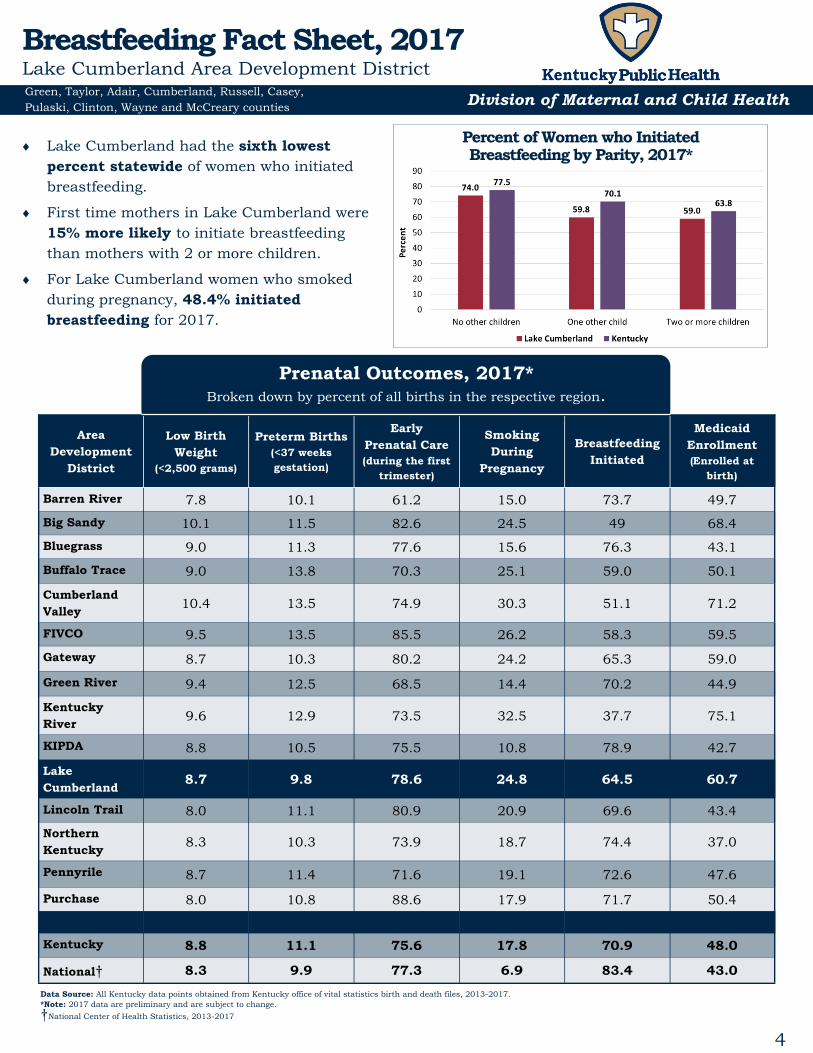
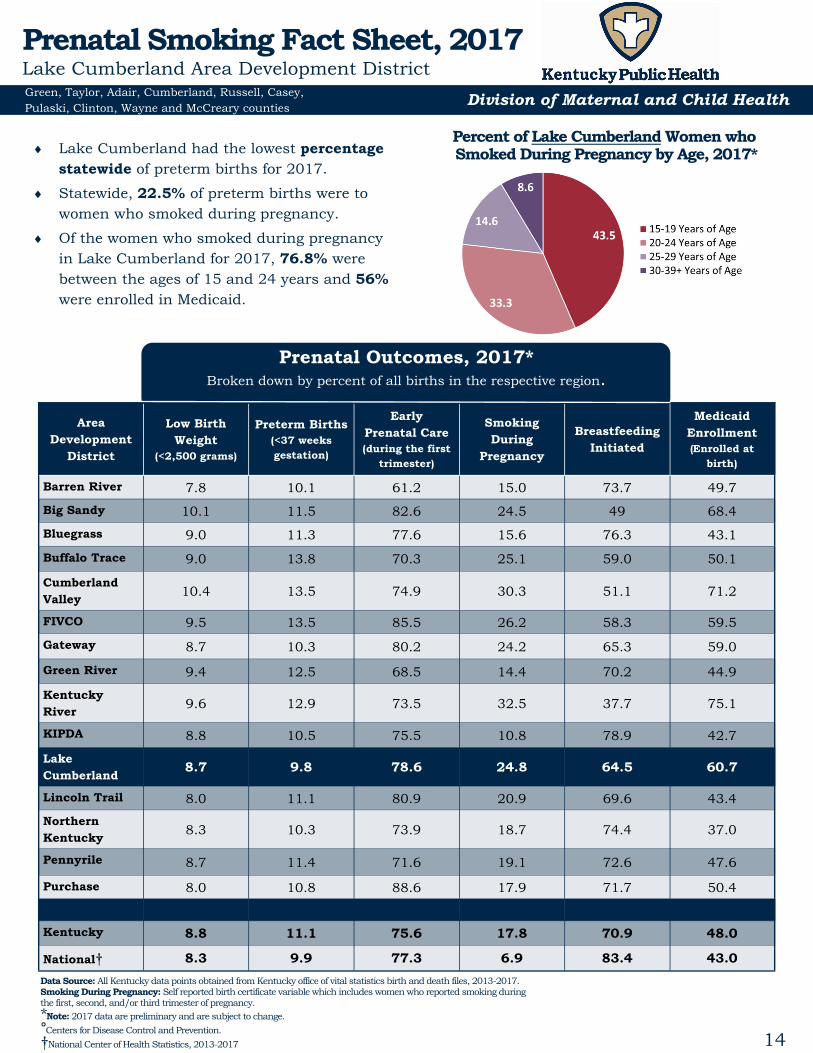
Barren River 7.8 10.1 61.2 15.0 73.7 49.7
Big Sandy 10.1 11.5 82.6 24.5 49 68.4
Bluegrass 9.0 11.3 77.6 15.6 76.3 43.1
Buffalo Trace 9.0 13.8 70.3 25.1 59.0 50.1
Cumberland Valley
10.4 13.5 74.9 30.3 51.1 71.2
FIVCO 9.5 13.5 85.5 26.2 58.3 59.5
Gateway 8.7 10.3 80.2 24.2 65.3 59.0
Green River 9.4 12.5 68.5 14.4 70.2 44.9
Kentucky River
9.6 12.9 73.5 32.5 37.7 75.1
KIPDA 8.8 10.5 75.5 10.8 78.9 42.7
Lake Cumberland
8.7 9.8 78.6 24.8 64.5 60.7
Lincoln Trail 8.0 11.1 80.9 20.9 69.6 43.4
Northern Kentucky
8.3 10.3 73.9 18.7 74.4 37.0
Pennyrile 8.7 11.4 71.6 19.1 72.6 47.6
Purchase 8.0 10.8 88.6 17.9 71.7 50.4
Kentucky 8.8 11.1 75.6 17.8 70.9 48.0
National† 8.3 9.9 77.3 6.9 83.4 43.0
Data Source: All Kentucky data points obtained from Kentucky office of vital statistics birth and death files, 2013-2017. *Note: 2017 data are preliminary and are subject to change.
†National Center of Health Statistics, 2013-2017
Prenatal Outcomes, 2017* Broken down by percent of all births in the respective region.
3
Percent of Breastfeeding Initiation by Region, 2013-2017*
Breastfeeding in Kentucky
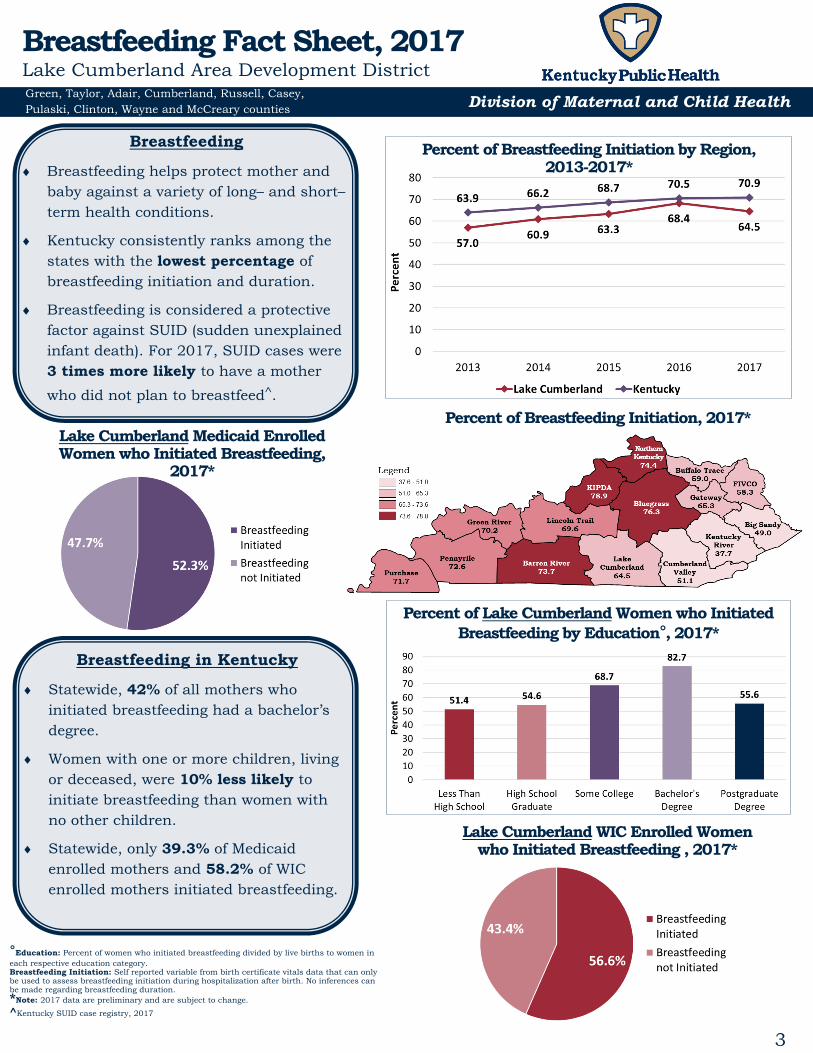
Statewide, 42% of all mothers who initiated breastfeeding had a bachelor’s degree.
Women with one or more children, living or deceased, were 10% less likely to initiate breastfeeding than women with no other children.
Statewide, only 39.3% of Medicaid enrolled mothers and 58.2% of WIC enrolled mothers initiated breastfeeding.
Percent of Breastfeeding Initiation, 2017*
°Education: Percent of women who initiated breastfeeding divided by live births to women in each respective education category. Breastfeeding Initiation: Self reported variable from birth certificate vitals data that can only be used to assess breastfeeding initiation during hospitalization after birth. No inferences can be made regarding breastfeeding duration. *Note: 2017 data are preliminary and are subject to change. ^Kentucky SUID case registry, 2017
Division of Maternal and Child Health Green, Taylor, Adair, Cumberland, Russell, Casey, Pulaski, Clinton, Wayne and McCreary counties
Breastfeeding
Breastfeeding helps protect mother and baby against a variety of long– and short–term health conditions.
Kentucky consistently ranks among the states with the lowest percentage of breastfeeding initiation and duration.
Breastfeeding is considered a protective factor against SUID (sudden unexplained infant death). For 2017, SUID cases were 3 times more likely to have a mother
who did not plan to breastfeed^.
Breastfeeding Fact Sheet, 2017 Lake Cumberland Area Development District
Percent of Lake Cumberland Women who Initiated Breastfeeding by Education°, 2017*
Lake Cumberland Medicaid Enrolled Women who Initiated Breastfeeding,
2017*
Lake Cumberland WIC Enrolled Women who Initiated Breastfeeding , 2017*
4
Breastfeeding Fact Sheet, 2017 Lake Cumberland Area Development District
Division of Maternal and Child Health
Percent of Women who Initiated Breastfeeding by Parity, 2017*
Green, Taylor, Adair, Cumberland, Russell, Casey, Pulaski, Clinton, Wayne and McCreary counties
Prenatal Outcomes, 2017* Broken down by percent of all births in the respective region.
Area Development
District
Low Birth Weight
(<2,500 grams)
Preterm Births (<37 weeks gestation)
Early Prenatal Care (during the first
trimester)
Smoking During
Pregnancy
Breastfeeding Initiated
Medicaid Enrollment (Enrolled at
birth)
Barren River 7.8 10.1 61.2 15.0 73.7 49.7
Big Sandy 10.1 11.5 82.6 24.5 49 68.4
Bluegrass 9.0 11.3 77.6 15.6 76.3 43.1
Buffalo Trace 9.0 13.8 70.3 25.1 59.0 50.1
Cumberland Valley
10.4 13.5 74.9 30.3 51.1 71.2
FIVCO 9.5 13.5 85.5 26.2 58.3 59.5
Gateway 8.7 10.3 80.2 24.2 65.3 59.0
Green River 9.4 12.5 68.5 14.4 70.2 44.9
Kentucky River
9.6 12.9 73.5 32.5 37.7 75.1
KIPDA 8.8 10.5 75.5 10.8 78.9 42.7
Lake Cumberland
8.7 9.8 78.6 24.8 64.5 60.7
Lincoln Trail 8.0 11.1 80.9 20.9 69.6 43.4
Northern Kentucky
8.3 10.3 73.9 18.7 74.4 37.0
Pennyrile 8.7 11.4 71.6 19.1 72.6 47.6
Purchase 8.0 10.8 88.6 17.9 71.7 50.4
Kentucky 8.8 11.1 75.6 17.8 70.9 48.0
National† 8.3 9.9 77.3 6.9 83.4 43.0
Data Source: All Kentucky data points obtained from Kentucky office of vital statistics birth and death files, 2013-2017. *Note: 2017 data are preliminary and are subject to change.
†National Center of Health Statistics, 2013-2017
Lake Cumberland had the sixth lowest percent statewide of women who initiated breastfeeding.
First time mothers in Lake Cumberland were 15% more likely to initiate breastfeeding than mothers with 2 or more children.
For Lake Cumberland women who smoked during pregnancy, 48.4% initiated breastfeeding for 2017.
5
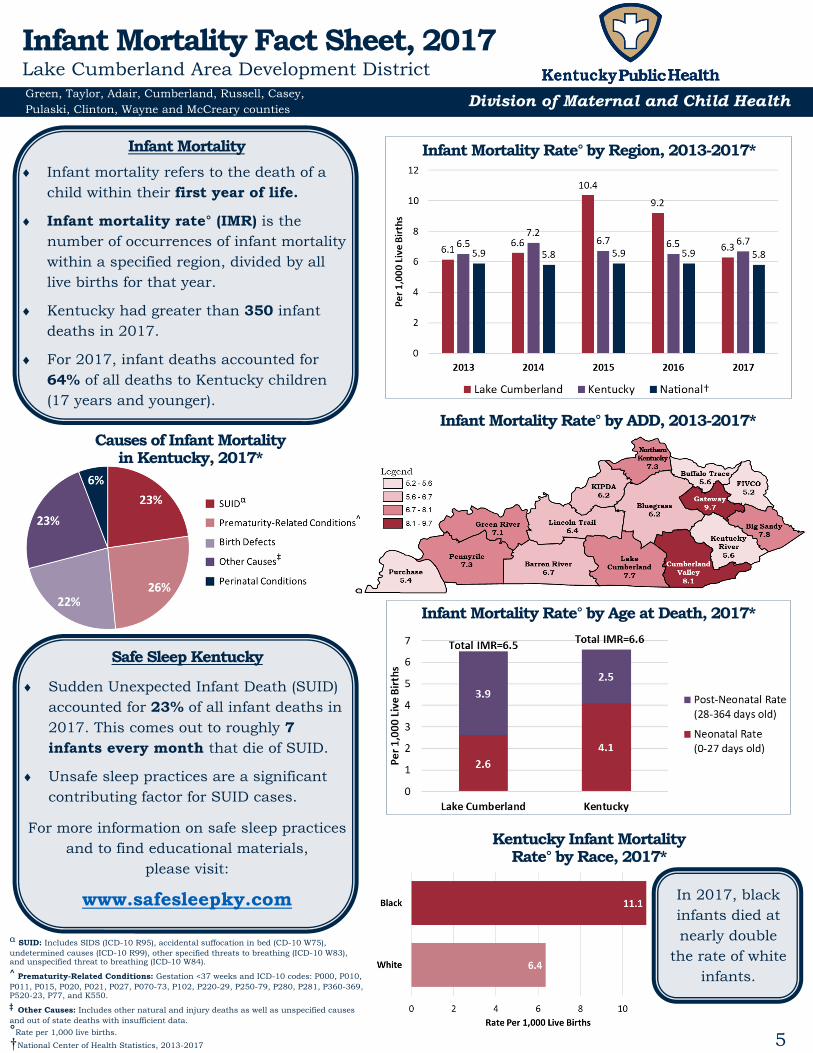
Infant Mortality
Infant mortality refers to the death of a child within their first year of life.
Infant mortality rate° (IMR) is the number of occurrences of infant mortality within a specified region, divided by all live births for that year.
Kentucky had greater than 350 infant deaths in 2017.
For 2017, infant deaths accounted for 64% of all deaths to Kentucky children (17 years and younger).
Safe Sleep Kentucky
Sudden Unexpected Infant Death (SUID) accounted for 23% of all infant deaths in 2017. This comes out to roughly 7 infants every month that die of SUID.
Unsafe sleep practices are a significant contributing factor for SUID cases.
For more information on safe sleep practices and to find educational materials,
please visit:
www.safesleepky.com
Infant Mortality Rate° by ADD, 2013-2017*
In 2017, black infants died at nearly double
the rate of white infants.
α SUID: Includes SIDS (ICD-10 R95), accidental suffocation in bed (CD-10 W75), undetermined causes (ICD-10 R99), other specified threats to breathing (ICD-10 W83), and unspecified threat to breathing (ICD-10 W84). ^ Prematurity-Related Conditions: Gestation <37 weeks and ICD-10 codes: P000, P010, P011, P015, P020, P021, P027, P070-73, P102, P220-29, P250-79, P280, P281, P360-369, P520-23, P77, and K550. ‡ Other Causes: Includes other natural and injury deaths as well as unspecified causes and out of state deaths with insufficient data.
°Rate per 1,000 live births.
†National Center of Health Statistics, 2013-2017
Causes of Infant Mortality in Kentucky, 2017*
Kentucky Infant Mortality Rate° by Race, 2017*
Division of Maternal and Child Health
Infant Mortality Fact Sheet, 2017 Lake Cumberland Area Development District Green, Taylor, Adair, Cumberland, Russell, Casey, Pulaski, Clinton, Wayne and McCreary counties
Infant Mortality Rate° by Age at Death, 2017*
Infant Mortality Rate° by Region, 2013-2017*
6
†National Center of Health Statistics, 2013-2017
°Rate per 1,000 live births.
*Note: 2017 data are preliminary and are subject to change.
Infant Mortality Fact Sheet, 2017 Lake Cumberland Area Development District
Division of Maternal and Child Health Green, Taylor, Adair, Cumberland, Russell, Casey, Pulaski, Clinton, Wayne and McCreary counties
Area Development
District
Low Birth Weight
(<2,500 grams)
Preterm Births (<37 weeks gestation)
Early Prenatal Care (during the first
trimester)
Smoking During
Pregnancy
Breastfeeding Initiated
Medicaid Enrollment (Enrolled at
birth)
Barren River 7.8 10.1 61.2 15.0 73.7 49.7
Big Sandy 10.1 11.5 82.6 24.5 49 68.4
Bluegrass 9.0 11.3 77.6 15.6 76.3 43.1
Buffalo Trace 9.0 13.8 70.3 25.1 59.0 50.1
Cumberland Valley
10.4 13.5 74.9 30.3 51.1 71.2
FIVCO 9.5 13.5 85.5 26.2 58.3 59.5
Gateway 8.7 10.3 80.2 24.2 65.3 59.0
Green River 9.4 12.5 68.5 14.4 70.2 44.9
Kentucky River
9.6 12.9 73.5 32.5 37.7 75.1
KIPDA 8.8 10.5 75.5 10.8 78.9 42.7
Lake Cumberland
8.7 9.8 78.6 24.8 64.5 60.7
Lincoln Trail 8.0 11.1 80.9 20.9 69.6 43.4
Northern Kentucky
8.3 10.3 73.9 18.7 74.4 37.0
Pennyrile 8.7 11.4 71.6 19.1 72.6 47.6
Purchase 8.0 10.8 88.6 17.9 71.7 50.4
Kentucky 8.8 11.1 75.6 17.8 70.9 48.0
National† 8.3 9.9 77.3 6.9 83.4 43.0
Data Source: All Kentucky data points obtained from Kentucky office of vital statistics birth and death files, 2013-2017.
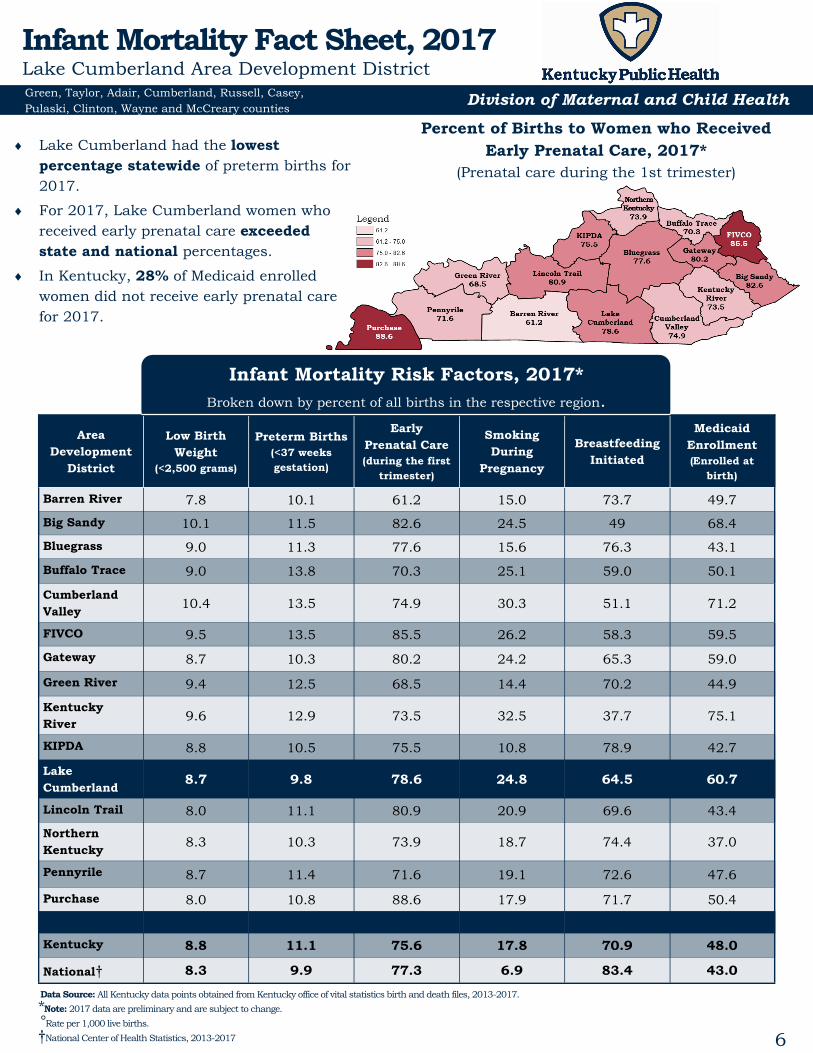
Infant Mortality Risk Factors, 2017* Broken down by percent of all births in the respective region.
Lake Cumberland had the lowest percentage statewide of preterm births for 2017.
For 2017, Lake Cumberland women who received early prenatal care exceeded state and national percentages.
In Kentucky, 28% of Medicaid enrolled women did not receive early prenatal care for 2017.
Percent of Births to Women who Received Early Prenatal Care, 2017*
(Prenatal care during the 1st trimester)
7
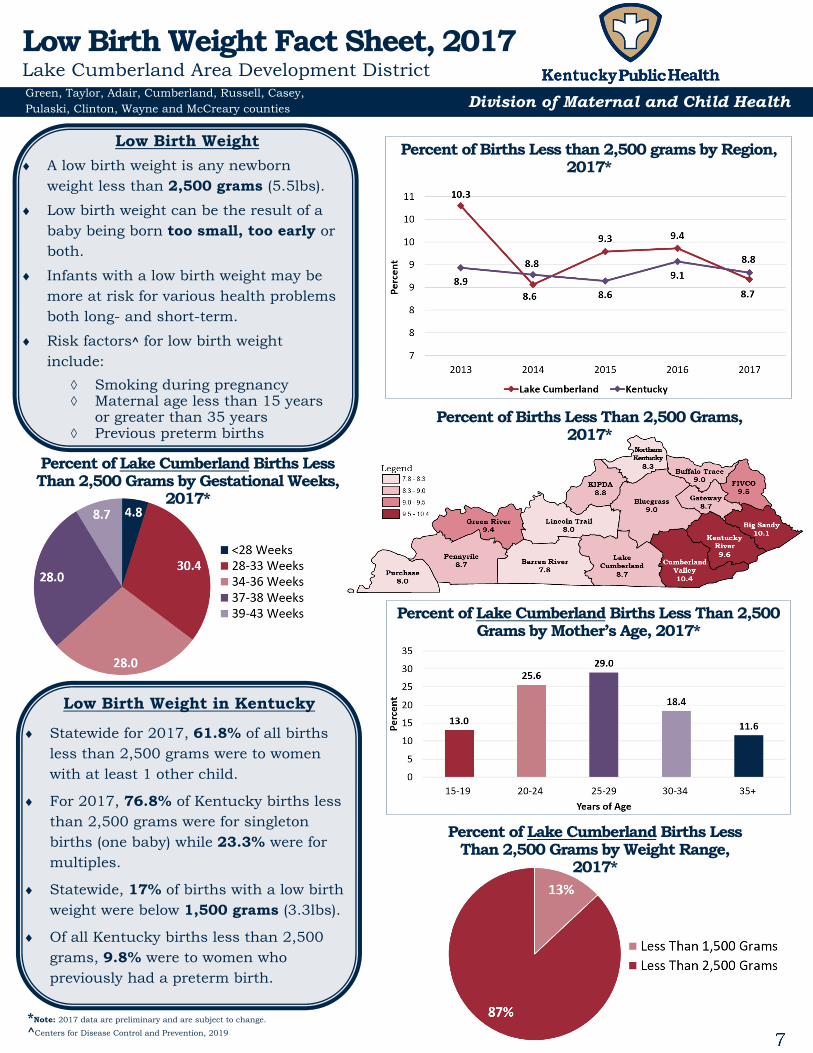
Percent of Lake Cumberland Births Less Than 2,500 Grams by Mother’s Age, 2017*
Percent of Births Less than 2,500 grams by Region, 2017*
*Note: 2017 data are preliminary and are subject to change. ^Centers for Disease Control and Prevention, 2019
Low Birth Weight in Kentucky
Statewide for 2017, 61.8% of all births less than 2,500 grams were to women with at least 1 other child.
For 2017, 76.8% of Kentucky births less than 2,500 grams were for singleton births (one baby) while 23.3% were for multiples.
Statewide, 17% of births with a low birth weight were below 1,500 grams (3.3lbs).
Of all Kentucky births less than 2,500 grams, 9.8% were to women who previously had a preterm birth.
Division of Maternal and Child Health
Low Birth Weight Fact Sheet, 2017 Lake Cumberland Area Development District Green, Taylor, Adair, Cumberland, Russell, Casey, Pulaski, Clinton, Wayne and McCreary counties
Percent of Lake Cumberland Births Less Than 2,500 Grams by Weight Range,
2017*
Low Birth Weight
A low birth weight is any newborn weight less than 2,500 grams (5.5lbs).
Low birth weight can be the result of a baby being born too small, too early or both.
Infants with a low birth weight may be more at risk for various health problems both long- and short-term.
Risk factors^ for low birth weight include:
Smoking during pregnancy Maternal age less than 15 years
or greater than 35 years Previous preterm births
Percent of Lake Cumberland Births Less Than 2,500 Grams by Gestational Weeks,
2017*
Percent of Births Less Than 2,500 Grams, 2017*
8
Low Birth Weight Fact Sheet, 2017 Lake Cumberland Area Development District
Division of Maternal and Child Health
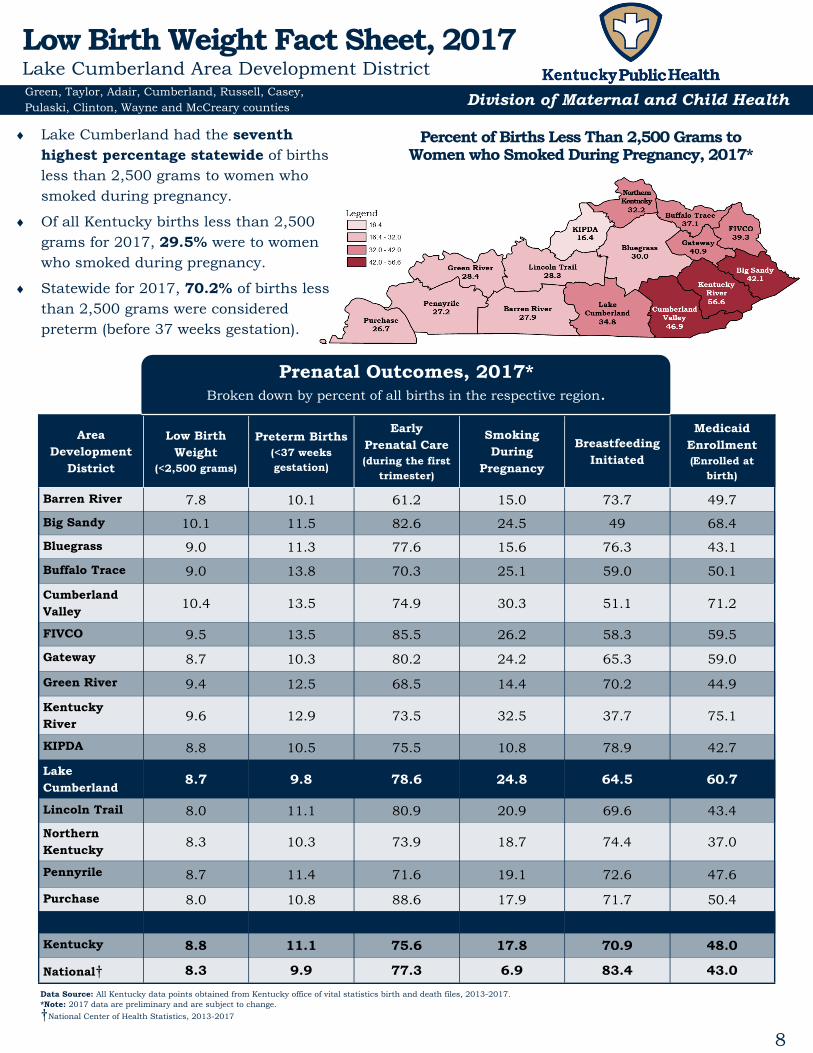
Lake Cumberland had the seventh highest percentage statewide of births less than 2,500 grams to women who smoked during pregnancy.
Of all Kentucky births less than 2,500 grams for 2017, 29.5% were to women who smoked during pregnancy.
Statewide for 2017, 70.2% of births less than 2,500 grams were considered preterm (before 37 weeks gestation).
Percent of Births Less Than 2,500 Grams to Women who Smoked During Pregnancy, 2017*
Green, Taylor, Adair, Cumberland, Russell, Casey, Pulaski, Clinton, Wayne and McCreary counties
Area Development
District
Low Birth Weight
(<2,500 grams)
Preterm Births (<37 weeks gestation)
Early Prenatal Care (during the first
trimester)
Smoking During
Pregnancy
Breastfeeding Initiated
Medicaid Enrollment (Enrolled at
birth)
Barren River 7.8 10.1 61.2 15.0 73.7 49.7
Big Sandy 10.1 11.5 82.6 24.5 49 68.4
Bluegrass 9.0 11.3 77.6 15.6 76.3 43.1
Buffalo Trace 9.0 13.8 70.3 25.1 59.0 50.1
Cumberland Valley
10.4 13.5 74.9 30.3 51.1 71.2
FIVCO 9.5 13.5 85.5 26.2 58.3 59.5
Gateway 8.7 10.3 80.2 24.2 65.3 59.0
Green River 9.4 12.5 68.5 14.4 70.2 44.9
Kentucky River
9.6 12.9 73.5 32.5 37.7 75.1
KIPDA 8.8 10.5 75.5 10.8 78.9 42.7
Lake Cumberland
8.7 9.8 78.6 24.8 64.5 60.7
Lincoln Trail 8.0 11.1 80.9 20.9 69.6 43.4
Northern Kentucky
8.3 10.3 73.9 18.7 74.4 37.0
Pennyrile 8.7 11.4 71.6 19.1 72.6 47.6
Purchase 8.0 10.8 88.6 17.9 71.7 50.4
Kentucky 8.8 11.1 75.6 17.8 70.9 48.0
National† 8.3 9.9 77.3 6.9 83.4 43.0
Data Source: All Kentucky data points obtained from Kentucky office of vital statistics birth and death files, 2013-2017. *Note: 2017 data are preliminary and are subject to change.
†National Center of Health Statistics, 2013-2017
Prenatal Outcomes, 2017* Broken down by percent of all births in the respective region.
9
Percent of Medicaid-Enrolled Births in Lake Cumberland by Mother’s Age, 2017*
Percent of Medicaid-Enrolled Births by Region, 2013-2017*
*Note: 2017 data are preliminary and are subject to change.
Division of Maternal and Child Health Green, Taylor, Adair, Cumberland, Russell, Casey, Pulaski, Clinton, Wayne and McCreary counties
Medicaid Births Fact Sheet, 2017 Lake Cumberland Area Development District
Percent of Medicaid-Enrolled Births in Lake Cumberland by Race, 2017*
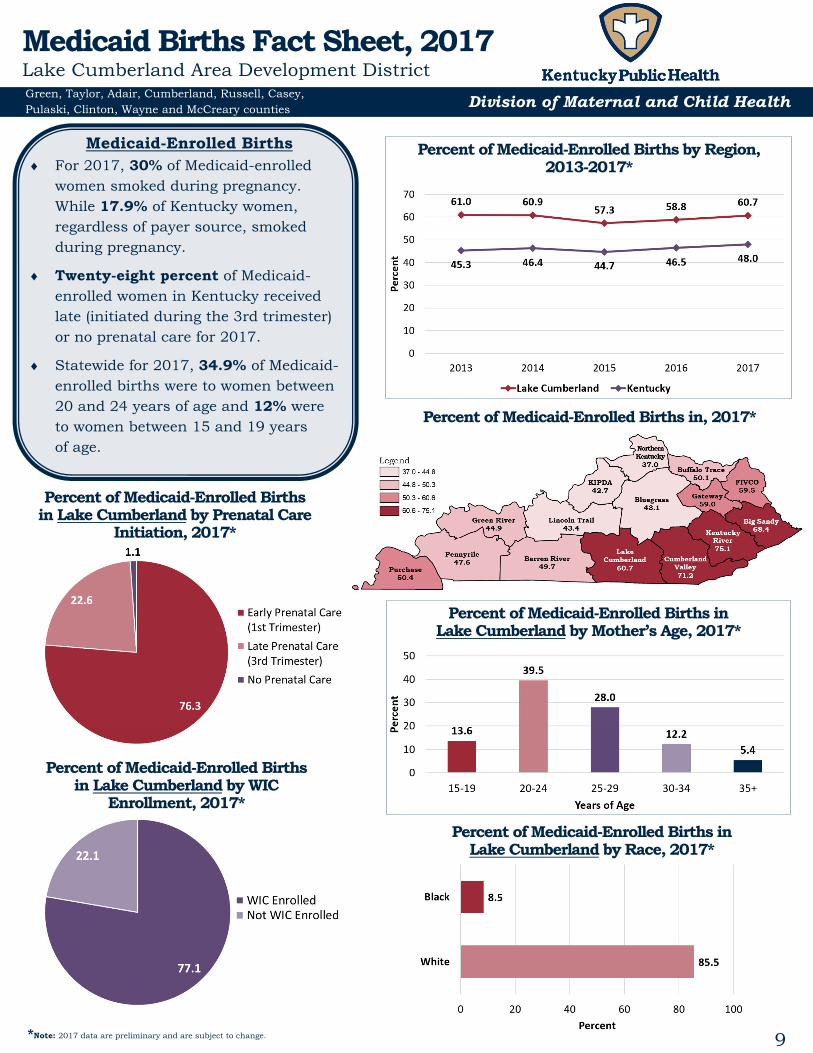
Medicaid-Enrolled Births For 2017, 30% of Medicaid-enrolled
women smoked during pregnancy. While 17.9% of Kentucky women, regardless of payer source, smoked during pregnancy.
Twenty-eight percent of Medicaid-enrolled women in Kentucky received late (initiated during the 3rd trimester) or no prenatal care for 2017.
Statewide for 2017, 34.9% of Medicaid-enrolled births were to women between 20 and 24 years of age and 12% were to women between 15 and 19 years of age.
Percent of Medicaid-Enrolled Births in, 2017*
Percent of Medicaid-Enrolled Births in Lake Cumberland by Prenatal Care
Initiation, 2017*
Percent of Medicaid-Enrolled Births in Lake Cumberland by WIC
Enrollment, 2017*
10
Medicaid Births Fact Sheet, 2017 Lake Cumberland Area Development District
Division of Maternal and Child Health
Percent of Medicaid-Enrolled Births in Lake Cumberland by Education, 2017*
Green, Taylor, Adair, Cumberland, Russell, Casey, Pulaski, Clinton, Wayne and McCreary counties
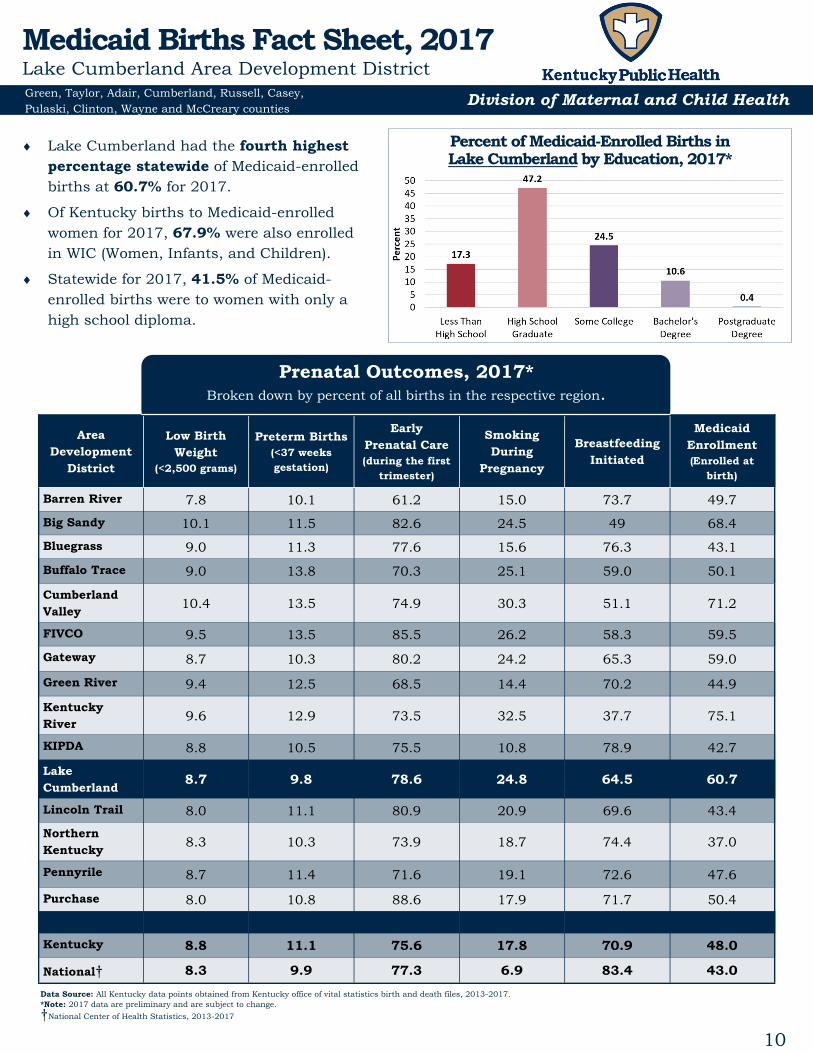
Lake Cumberland had the fourth highest percentage statewide of Medicaid-enrolled births at 60.7% for 2017.
Of Kentucky births to Medicaid-enrolled women for 2017, 67.9% were also enrolled in WIC (Women, Infants, and Children).
Statewide for 2017, 41.5% of Medicaid-enrolled births were to women with only a high school diploma.
Area Development
District
Low Birth Weight
(<2,500 grams)
Preterm Births (<37 weeks gestation)
Early Prenatal Care (during the first
trimester)
Smoking During
Pregnancy
Breastfeeding Initiated
Medicaid Enrollment (Enrolled at
birth)
Barren River 7.8 10.1 61.2 15.0 73.7 49.7
Big Sandy 10.1 11.5 82.6 24.5 49 68.4
Bluegrass 9.0 11.3 77.6 15.6 76.3 43.1
Buffalo Trace 9.0 13.8 70.3 25.1 59.0 50.1
Cumberland Valley
10.4 13.5 74.9 30.3 51.1 71.2
FIVCO 9.5 13.5 85.5 26.2 58.3 59.5
Gateway 8.7 10.3 80.2 24.2 65.3 59.0
Green River 9.4 12.5 68.5 14.4 70.2 44.9
Kentucky River
9.6 12.9 73.5 32.5 37.7 75.1
KIPDA 8.8 10.5 75.5 10.8 78.9 42.7
Lake Cumberland
8.7 9.8 78.6 24.8 64.5 60.7
Lincoln Trail 8.0 11.1 80.9 20.9 69.6 43.4
Northern Kentucky
8.3 10.3 73.9 18.7 74.4 37.0
Pennyrile 8.7 11.4 71.6 19.1 72.6 47.6
Purchase 8.0 10.8 88.6 17.9 71.7 50.4
Kentucky 8.8 11.1 75.6 17.8 70.9 48.0
National† 8.3 9.9 77.3 6.9 83.4 43.0
Data Source: All Kentucky data points obtained from Kentucky office of vital statistics birth and death files, 2013-2017. *Note: 2017 data are preliminary and are subject to change.
†National Center of Health Statistics, 2013-2017
Prenatal Outcomes, 2017* Broken down by percent of all births in the respective region.
11
Percent of Lake Cumberland Births Receiving Early Prenatal Care by Mother’s Age, 2017*
*Note: 2017 data are preliminary and are subject to change. ^US Department of Health and Human Services, 2019
Division of Maternal and Child Health
Percent of Births Receiving Early Prenatal Care by Region, 2017*
Green, Taylor, Adair, Cumberland, Russell, Casey, Pulaski, Clinton, Wayne and McCreary counties
Prenatal Care Fact Sheet, 2017 Lake Cumberland Area Development District
Percent of Kentucky Births by Prenatal Care Received and Race, 2017*
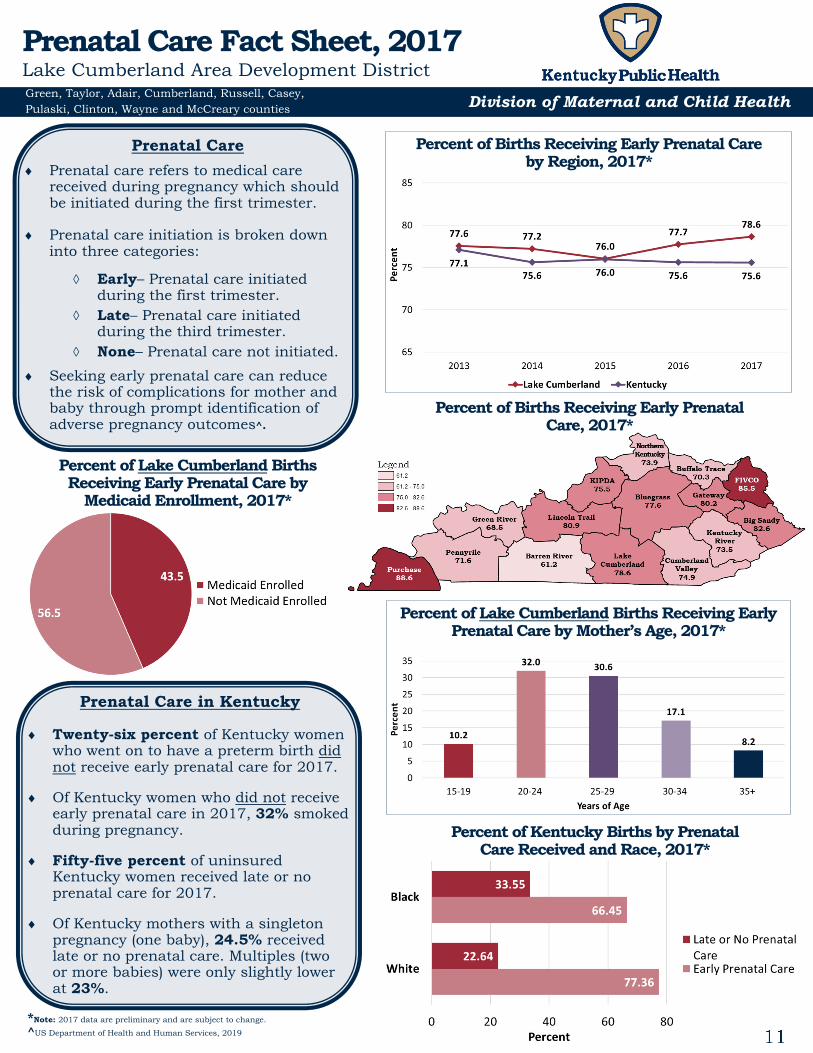
Prenatal Care
Prenatal care refers to medical care received during pregnancy which should be initiated during the first trimester.
Prenatal care initiation is broken down into three categories:
Early– Prenatal care initiated during the first trimester.
Late– Prenatal care initiated during the third trimester.
None– Prenatal care not initiated.
Seeking early prenatal care can reduce the risk of complications for mother and baby through prompt identification of adverse pregnancy outcomes^.
Percent of Lake Cumberland Births Receiving Early Prenatal Care by
Medicaid Enrollment, 2017*
Prenatal Care in Kentucky
Twenty-six percent of Kentucky women who went on to have a preterm birth did not receive early prenatal care for 2017.
Of Kentucky women who did not receive early prenatal care in 2017, 32% smoked during pregnancy.
Fifty-five percent of uninsured Kentucky women received late or no prenatal care for 2017.
Of Kentucky mothers with a singleton pregnancy (one baby), 24.5% received late or no prenatal care. Multiples (two or more babies) were only slightly lower at 23%.
Percent of Births Receiving Early Prenatal Care, 2017*
12
Prenatal Care Fact Sheet, 2017 Lake Cumberland Area Development District
Division of Maternal and Child Health
Percent of Lake Cumberland Births Receiving Early Prenatal Care by Education, 2017*
Green, Taylor, Adair, Cumberland, Russell, Casey, Pulaski, Clinton, Wayne and McCreary counties
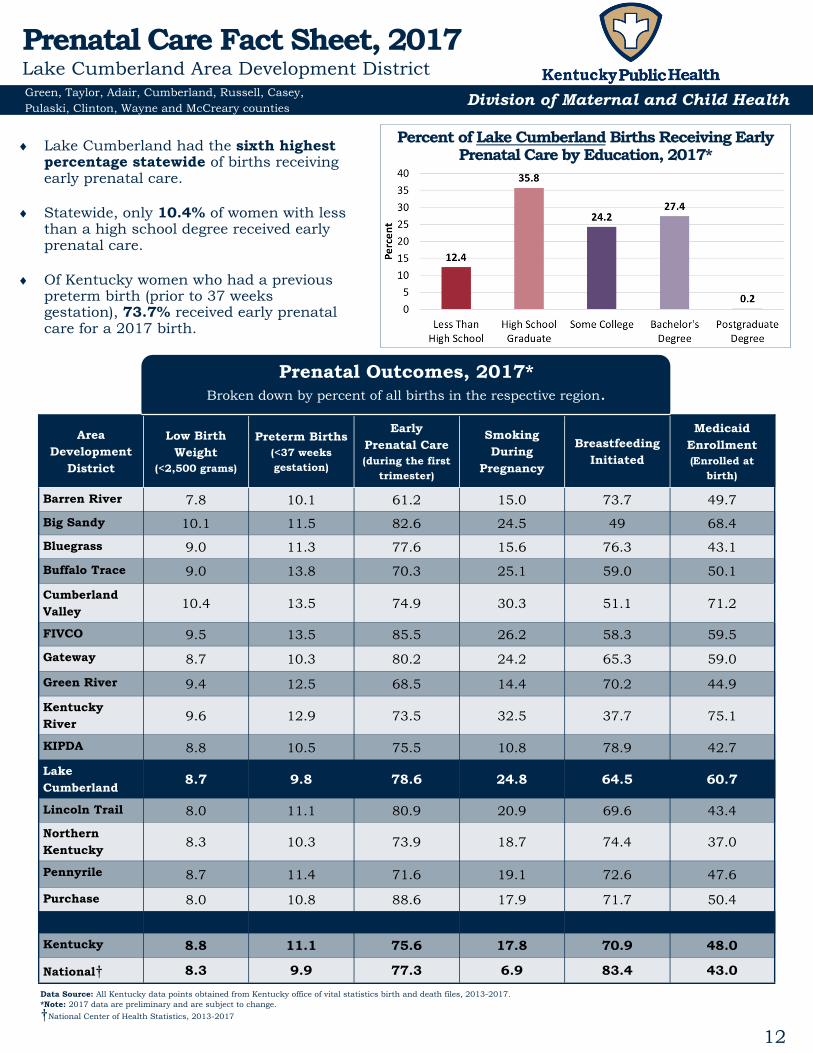
Lake Cumberland had the sixth highest percentage statewide of births receiving early prenatal care.
Statewide, only 10.4% of women with less than a high school degree received early prenatal care.
Of Kentucky women who had a previous preterm birth (prior to 37 weeks gestation), 73.7% received early prenatal care for a 2017 birth.
Area Development
District
Low Birth Weight
(<2,500 grams)
Preterm Births (<37 weeks gestation)
Early Prenatal Care (during the first
trimester)
Smoking During
Pregnancy
Breastfeeding Initiated
Medicaid Enrollment (Enrolled at
birth)
Barren River 7.8 10.1 61.2 15.0 73.7 49.7
Big Sandy 10.1 11.5 82.6 24.5 49 68.4
Bluegrass 9.0 11.3 77.6 15.6 76.3 43.1
Buffalo Trace 9.0 13.8 70.3 25.1 59.0 50.1
Cumberland Valley
10.4 13.5 74.9 30.3 51.1 71.2
FIVCO 9.5 13.5 85.5 26.2 58.3 59.5
Gateway 8.7 10.3 80.2 24.2 65.3 59.0
Green River 9.4 12.5 68.5 14.4 70.2 44.9
Kentucky River
9.6 12.9 73.5 32.5 37.7 75.1
KIPDA 8.8 10.5 75.5 10.8 78.9 42.7
Lake Cumberland
8.7 9.8 78.6 24.8 64.5 60.7
Lincoln Trail 8.0 11.1 80.9 20.9 69.6 43.4
Northern Kentucky
8.3 10.3 73.9 18.7 74.4 37.0
Pennyrile 8.7 11.4 71.6 19.1 72.6 47.6
Purchase 8.0 10.8 88.6 17.9 71.7 50.4
Kentucky 8.8 11.1 75.6 17.8 70.9 48.0
National† 8.3 9.9 77.3 6.9 83.4 43.0
Data Source: All Kentucky data points obtained from Kentucky office of vital statistics birth and death files, 2013-2017. *Note: 2017 data are preliminary and are subject to change.
†National Center of Health Statistics, 2013-2017
Prenatal Outcomes, 2017* Broken down by percent of all births in the respective region.
13
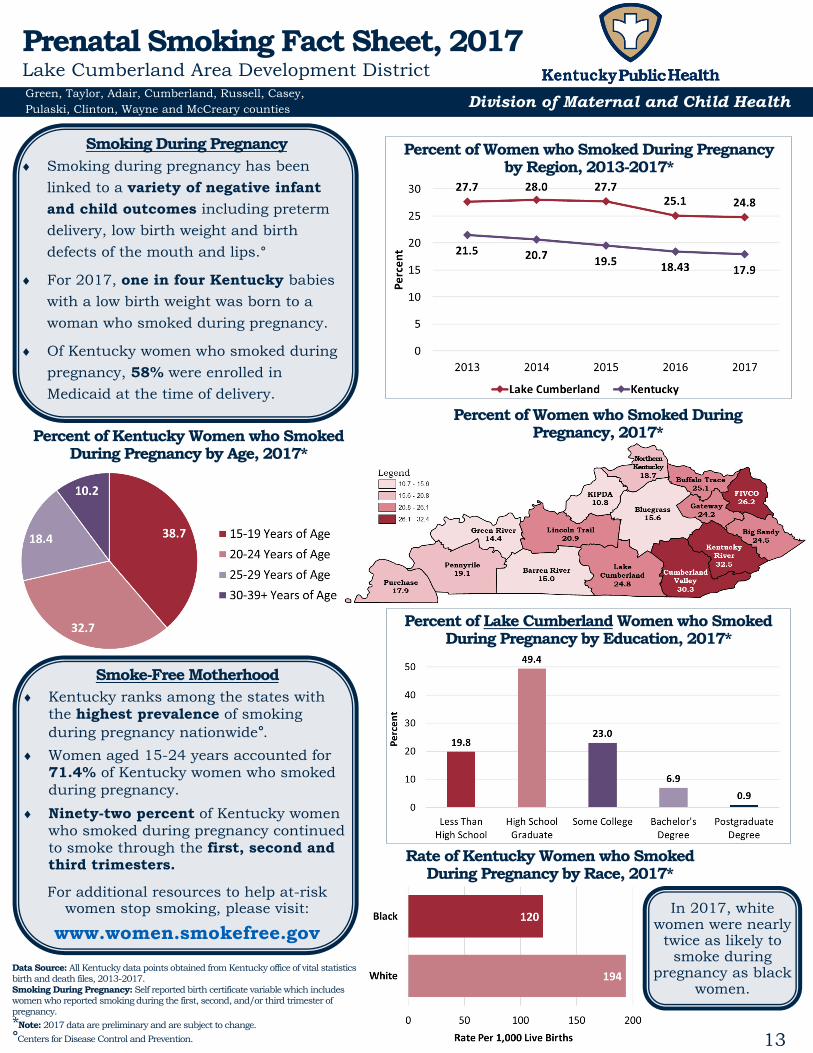
Smoking During Pregnancy Smoking during pregnancy has been
linked to a variety of negative infant
and child outcomes including preterm
delivery, low birth weight and birth
defects of the mouth and lips.°
For 2017, one in four Kentucky babies
with a low birth weight was born to a
woman who smoked during pregnancy.
Of Kentucky women who smoked during
pregnancy, 58% were enrolled in
Medicaid at the time of delivery.
Smoke-Free Motherhood Kentucky ranks among the states with
the highest prevalence of smoking during pregnancy nationwide°.
Women aged 15-24 years accounted for 71.4% of Kentucky women who smoked during pregnancy.
Ninety-two percent of Kentucky women who smoked during pregnancy continued to smoke through the first, second and third trimesters.
For additional resources to help at-risk women stop smoking, please visit:
www.women.smokefree.gov
Data Source: All Kentucky data points obtained from Kentucky office of vital statistics birth and death files, 2013-2017. Smoking During Pregnancy: Self reported birth certificate variable which includes women who reported smoking during the first, second, and/or third trimester of pregnancy. *Note: 2017 data are preliminary and are subject to change.
°Centers for Disease Control and Prevention.
Percent of Kentucky Women who Smoked During Pregnancy by Age, 2017*
Division of Maternal and Child Health Green, Taylor, Adair, Cumberland, Russell, Casey, Pulaski, Clinton, Wayne and McCreary counties
Prenatal Smoking Fact Sheet, 2017 Lake Cumberland Area Development District
Percent of Women who Smoked During Pregnancy by Region, 2013-2017*
Percent of Women who Smoked During Pregnancy, 2017*
Rate of Kentucky Women who Smoked During Pregnancy by Race, 2017*
In 2017, white women were nearly
twice as likely to smoke during
pregnancy as black women.
Percent of Lake Cumberland Women who Smoked During Pregnancy by Education, 2017*
14
Prenatal Smoking Fact Sheet, 2017 Lake Cumberland Area Development District
Division of Maternal and Child Health Green, Taylor, Adair, Cumberland, Russell, Casey, Pulaski, Clinton, Wayne and McCreary counties
Area Development
District
Low Birth Weight
(<2,500 grams)
Preterm Births (<37 weeks gestation)
Early Prenatal Care (during the first
trimester)
Smoking During
Pregnancy
Breastfeeding Initiated
Medicaid Enrollment (Enrolled at
birth)
Barren River 7.8 10.1 61.2 15.0 73.7 49.7
Big Sandy 10.1 11.5 82.6 24.5 49 68.4
Bluegrass 9.0 11.3 77.6 15.6 76.3 43.1
Buffalo Trace 9.0 13.8 70.3 25.1 59.0 50.1
Cumberland Valley
10.4 13.5 74.9 30.3 51.1 71.2
FIVCO 9.5 13.5 85.5 26.2 58.3 59.5
Gateway 8.7 10.3 80.2 24.2 65.3 59.0
Green River 9.4 12.5 68.5 14.4 70.2 44.9
Kentucky River
9.6 12.9 73.5 32.5 37.7 75.1
KIPDA 8.8 10.5 75.5 10.8 78.9 42.7
Lake Cumberland
8.7 9.8 78.6 24.8 64.5 60.7
Lincoln Trail 8.0 11.1 80.9 20.9 69.6 43.4
Northern Kentucky
8.3 10.3 73.9 18.7 74.4 37.0
Pennyrile 8.7 11.4 71.6 19.1 72.6 47.6
Purchase 8.0 10.8 88.6 17.9 71.7 50.4
Kentucky 8.8 11.1 75.6 17.8 70.9 48.0
National† 8.3 9.9 77.3 6.9 83.4 43.0
Data Source: All Kentucky data points obtained from Kentucky office of vital statistics birth and death files, 2013-2017. Smoking During Pregnancy: Self reported birth certificate variable which includes women who reported smoking during the first, second, and/or third trimester of pregnancy. *Note: 2017 data are preliminary and are subject to change.
°Centers for Disease Control and Prevention.
†National Center of Health Statistics, 2013-2017
Prenatal Outcomes, 2017*
Broken down by percent of all births in the respective region.
Lake Cumberland had the lowest percentage statewide of preterm births for 2017.
Statewide, 22.5% of preterm births were to women who smoked during pregnancy.
Of the women who smoked during pregnancy in Lake Cumberland for 2017, 76.8% were between the ages of 15 and 24 years and 56% were enrolled in Medicaid.
Percent of Lake Cumberland Women who Smoked During Pregnancy by Age, 2017*
15
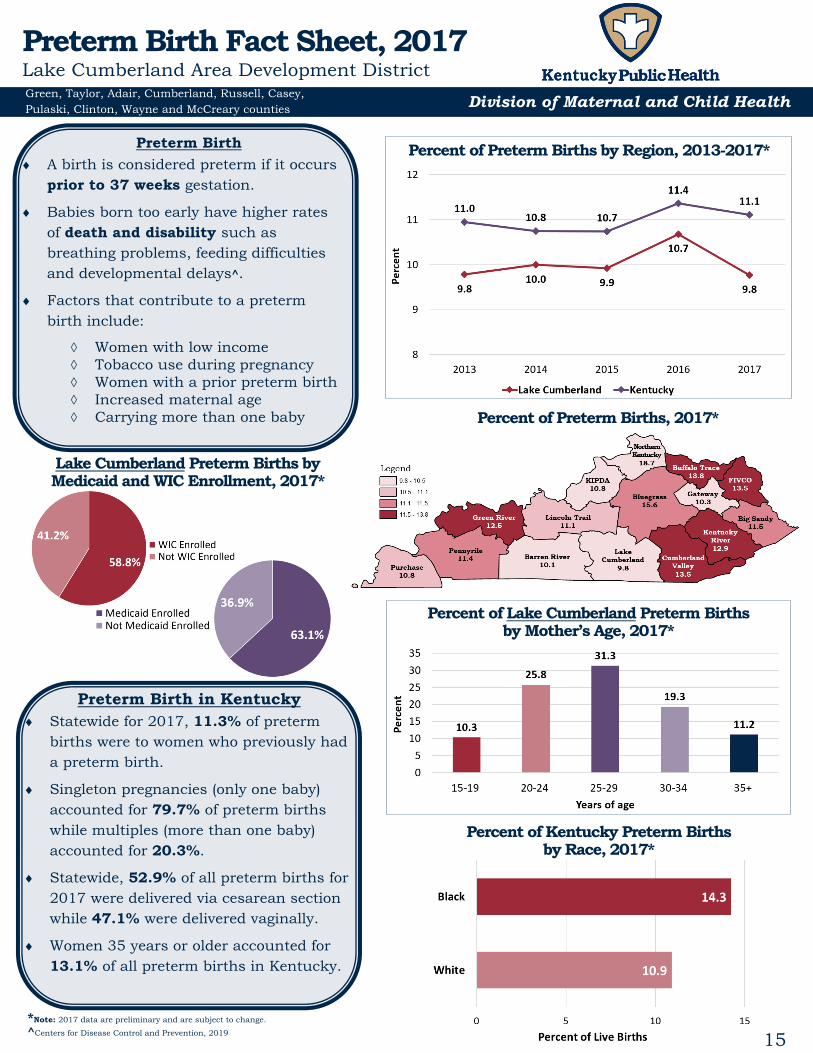
Percent of Preterm Births by Region, 2013-2017*
Percent of Lake Cumberland Preterm Births by Mother’s Age, 2017*
*Note: 2017 data are preliminary and are subject to change. ^Centers for Disease Control and Prevention, 2019
Division of Maternal and Child Health Green, Taylor, Adair, Cumberland, Russell, Casey, Pulaski, Clinton, Wayne and McCreary counties
Preterm Birth
A birth is considered preterm if it occurs prior to 37 weeks gestation.
Babies born too early have higher rates of death and disability such as breathing problems, feeding difficulties and developmental delays^.
Factors that contribute to a preterm birth include:
Women with low income Tobacco use during pregnancy Women with a prior preterm birth Increased maternal age Carrying more than one baby
Preterm Birth Fact Sheet, 2017 Lake Cumberland Area Development District
Percent of Preterm Births, 2017*
Percent of Kentucky Preterm Births by Race, 2017*
Lake Cumberland Preterm Births by Medicaid and WIC Enrollment, 2017*
Preterm Birth in Kentucky Statewide for 2017, 11.3% of preterm
births were to women who previously had a preterm birth.
Singleton pregnancies (only one baby) accounted for 79.7% of preterm births while multiples (more than one baby) accounted for 20.3%.
Statewide, 52.9% of all preterm births for 2017 were delivered via cesarean section while 47.1% were delivered vaginally.
Women 35 years or older accounted for 13.1% of all preterm births in Kentucky.
16
Preterm Birth Fact Sheet, 2017 Lake Cumberland Area Development District
Division of Maternal and Child Health
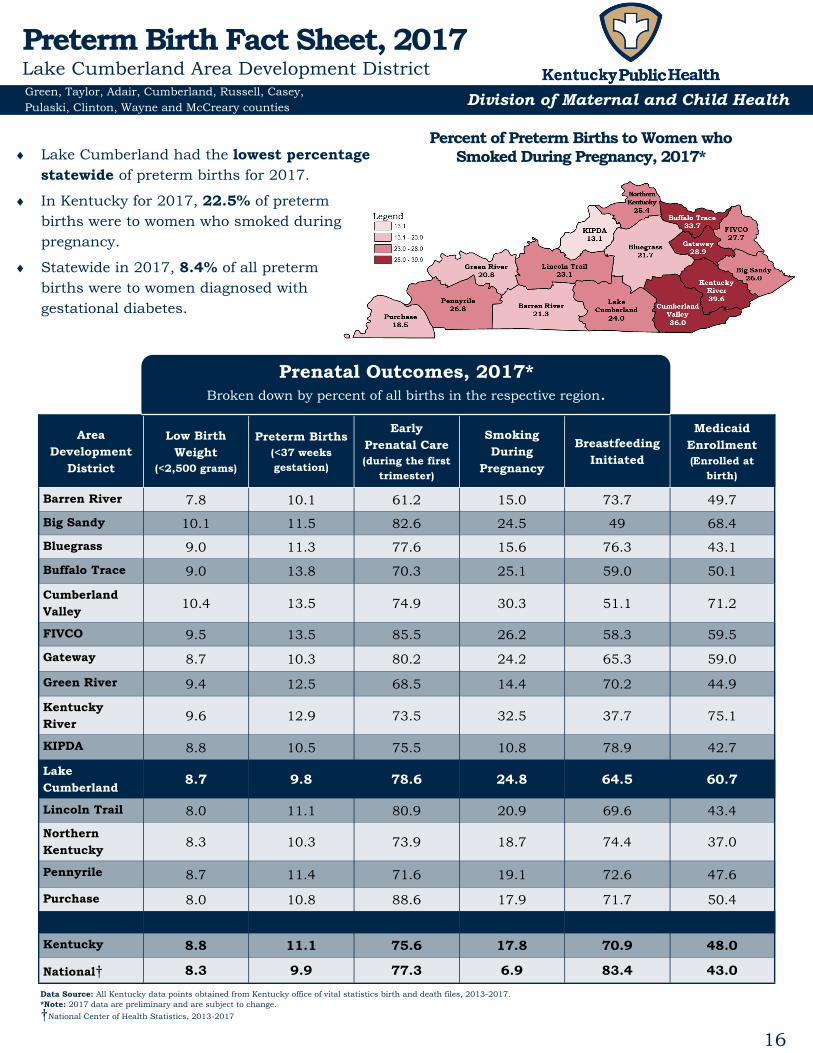
Percent of Preterm Births to Women who Smoked During Pregnancy, 2017*
Green, Taylor, Adair, Cumberland, Russell, Casey, Pulaski, Clinton, Wayne and McCreary counties
Lake Cumberland had the lowest percentage statewide of preterm births for 2017.
In Kentucky for 2017, 22.5% of preterm births were to women who smoked during pregnancy.
Statewide in 2017, 8.4% of all preterm births were to women diagnosed with gestational diabetes.
Area Development
District
Low Birth Weight
(<2,500 grams)
Preterm Births (<37 weeks gestation)
Early Prenatal Care (during the first
trimester)
Smoking During
Pregnancy
Breastfeeding Initiated
Medicaid Enrollment (Enrolled at
birth)
Barren River 7.8 10.1 61.2 15.0 73.7 49.7
Big Sandy 10.1 11.5 82.6 24.5 49 68.4
Bluegrass 9.0 11.3 77.6 15.6 76.3 43.1
Buffalo Trace 9.0 13.8 70.3 25.1 59.0 50.1
Cumberland Valley
10.4 13.5 74.9 30.3 51.1 71.2
FIVCO 9.5 13.5 85.5 26.2 58.3 59.5
Gateway 8.7 10.3 80.2 24.2 65.3 59.0
Green River 9.4 12.5 68.5 14.4 70.2 44.9
Kentucky River
9.6 12.9 73.5 32.5 37.7 75.1
KIPDA 8.8 10.5 75.5 10.8 78.9 42.7
Lake Cumberland
8.7 9.8 78.6 24.8 64.5 60.7
Lincoln Trail 8.0 11.1 80.9 20.9 69.6 43.4
Northern Kentucky
8.3 10.3 73.9 18.7 74.4 37.0
Pennyrile 8.7 11.4 71.6 19.1 72.6 47.6
Purchase 8.0 10.8 88.6 17.9 71.7 50.4
Kentucky 8.8 11.1 75.6 17.8 70.9 48.0
National† 8.3 9.9 77.3 6.9 83.4 43.0
Data Source: All Kentucky data points obtained from Kentucky office of vital statistics birth and death files, 2013-2017. *Note: 2017 data are preliminary and are subject to change.
†National Center of Health Statistics, 2013-2017
Prenatal Outcomes, 2017* Broken down by percent of all births in the respective region.