Diving For Science 2011 - American Academy of … · Diving For Science 2011 ... support of the...
167
Diving For Science 2011 Proceeding of the American Academy of Underwater Sciences 30th Scientific Symposium
-
Upload
nguyendang -
Category
Documents
-
view
215 -
download
0
Transcript of Diving For Science 2011 - American Academy of … · Diving For Science 2011 ... support of the...
Diving For Science 2011
Proceeding of the American Academy of Underwater Sciences
30th Scientific Symposium
PRO
CE
ED
ING
S
DIV
ING
FOR
SCIE
NC
E
2011 A
AU
S
Pollock
i
Diving For Science 2011 Proceeding of the
American Academy of Underwater Sciences 30th Scientific Symposium
Neal W. Pollock Editor
Portland, ME October 14–15, 2011
ii
The American Academy of Underwater Sciences (AAUS) was formed in 1977 and incorporated in the State of California in 1983 as a 501c6 nonprofit corporation. Visit: www.aaus.org. The mission of AAUS is to facilitate the development of safe and productive scientific divers through education, research, advocacy, and the advancement of standards for scientific diving practices, certifications, and operations. Acknowledgments Thanks to Heather Fletcher from the AAUS main office for her organizational efforts and Chris Rigaud and the team from the University of Maine Darling Marine Center who hosted many events for the 2011 American Academy of Underwater Sciences scientific symposium. Financial and additional support was provided by the following:
Maine Sea Grant The University of Maine Department of Safety and Environmental Management UMaine, School of Marine Sciences, College of Natural Science, Forestry and Agriculture UMaine Darling Marine Center Diving Unlimited International Ocean Enterprises, Inc. CIEE Bonaire Bret Gilliam, Oceans Media Inc. Aqua Diving Academy
Special thanks to Kathy Johnston for her original artwork donations (www.kathyjohnston.com) and Kevin Gurr (http://technologyindepth.com) for his dive computer donations. Both provide continued support of the AAUS scholarship program. Cover art by Kathy Johnston. Thanks to Mitchell Mackey and Jenna Wiley for proof-reading and formatting assistance. ISBN 978-0-9800423-5-1 Copyright © 2011 * by the American Academy of Underwater Sciences Dauphin Island Sea Lab, 101 Bienville Boulevard, Dauphin Island, AL 36528

iii
Table of Contents Habitat structure influences survival and predator-prey interactions of early juvenile Red King Crab, Paralithodes camtschaticus
Jodi L. Pirtle, Ginny L. Eckert...................................................................................................1 Effects of the red sea urchin on benthic invertebrate communities: a link to spatial subsidies
Ross Whippo, Alex Lowe, Kevin Britton-Simmons..................................................................5 A visual profile of the vertical mesophotic coral ecosystem of the tongue of the ocean (TOTO), Andros, Bahamas to 100 meters
Michael Lombardi......................................................................................................................9 In-water strategies for scientific diver based examinations of the vertical mesophotic coral ecosystem (vMCE) from 50 to 150 meters
Michael Lombardi, Jeff Godfrey..............................................................................................13 Survey of Previously Outplanted Pinto (Northern) Abalone (Haliotis kamtschatkana) in the San Juan Island Archipelago, Washington State
Jeffrey B. Hester, Jenna M. Walker, Paul A. Dinnel, Nathan T. Schwarck.............................22 Reproduction of red tree corals in the southeastern Alaskan fjords: implications for conservation and population turnover
Rhian G. Waller, Robert P. Stone, Jennifer Mondragon, Christian E. Clark...........................29 Toxic caviar: using fish embryos to monitor contaminant impacts
Lisa Kerr Lobel........................................................................................................................33 2011 American Academy of Underwater Sciences/Our World Underwater Scholarship Society internship report: Shannon Point Marine Center
Jenna M. Walker, Nathan T. Schwarck....................................................................................40 Use of tethered scuba for scientific diving
Sean Sheldrake, Rob Pedersen, Chad Schulze, Steven Donohue, Alan Humphrey................44 Use of surface-supplied gas for scientific diving
Alan Humphrey, Scott Grossman, Jonathan McBurney, Sean Sheldrake...............................58 Atmospheric diving suits – new technology may provide ADS systems that are practical and cost-effective tools for conducting safe scientific diving, exploration and undersea research
Douglas E. Kesling..................................................................................................................74 Belize barrier reef transect: how far do coral reef fish larvae travel in marine currents?
Oscar Puebla, Edgardo Ochoa, Owen McMillan, Eldredge Bermingham..............................77 Spectral reflectance as a method to identify the invasive tunicate Didemnum vexillum
Thomas Leeuw, Emmanuel S. Boss, H. Wayne Slade............................................................80
iv
Milestones in underwater ichthyology: a historical perspective Phillip S. Lobel........................................................................................................................87
Discoveries of new marine species of the Aleutian Islands
Stephen C. Jewett, Roger N. Clark..........................................................................................91 Population density and choice of den and food made by Octopus rubescens collected from Admiralty Bay, Washington, in July 2011
Elizabeth R. Chase.................................................................................................................110 Scuba diving surveys used to estimate Pacific herring egg deposition in Southeastern Alaska
Kyle P. Hebert.......................................................................................................................117 An assessment of growout strategies for the green sea urchin (Strongylocentrotus droebachiensis)
Pamelia E. Fraungruber, Nick P. Brown...............................................................................123 A 'BLAGRRA' assessment of coral bleaching and disease in Bonaire
Phoebe Jekielek.....................................................................................................................126 Freediving for science: the study of coral overgrowth by an encrusting red alga (Ramicrusta sp.) in a shallow reef environment
Caren E. Eckrich, M. Sabine Engel......................................................................................129 Phylogenetic order differentiates fatty acid composition of 40 Northeast Pacific macrophytes
Aaron W. E. Galloway, Kevin H. Britton-Simmons, Michael T. Brett................................133 Variability in antibacterial activity in Hawaiian corals
Deborah J. Gochfeld, Katerina E. Pappas, Sylvester Lee, Greta S. Aeby............................137 Fertilization success of the circumpolar Antarctic seastar Odontaster validus (Koehler, 1906): a diver-collected study
Laura J. Grange, Paul A. Tyler, Lloyd S. Peck....................................................................140 CCR validation protocol and associate training
Gregg R. Stanton, Joerg Hess...............................................................................................152 Symposium Speaker Schedule .........................................................................................................159
1
Habitat Structure Influences Survival and Predator-Prey Interactions of Early Juvenile Red King Crab, Paralithodes camtschaticus Jodi L. Pirtle1,2*, Ginny L. Eckert2
1 University of New Hampshire, Center for Coastal and Ocean Mapping, NOAA/UNH Joint Hydrographic Center, 24 Colovos Road, Durham, NH 03824, USA [email protected] 2 School of Fisheries and Ocean Sciences, Juneau Center, University of Alaska Fairbanks, 17101 Point Lena Loop Road, Juneau, AK 99801, USA [email protected] *corresponding author Abstract
We demonstrate that nursery habitat structure affects survival and predator-prey interactions of red king crab. Tethering experiments were conducted in the field near Juneau, Alaska. Juvenile crabs, age 0 and 1 y, were tethered individually in habitat treatments with complex vertical structure, no structure, or a mesh-covered control with no structure. Divers using scuba deployed experimental treatments and determined crab survival in the field every 24 h. Remote video captured predation events, predator-prey interactions, and crab behavior. Unsheltered juvenile crab survival for age 0 and age 1 crabs was higher in the presence of complex structural habitat with fish and invertebrate predators in the field. Crab activity and refuge response behavior varied with crab stage and habitat. Age 0 crabs were cryptic and avoided predators by associating with habitat structure or remaining motionless in the absence of structure and were less likely to respond to an attack. In contrast, age 1 crabs were likely to flee or directly fight an attacking predator and less likely to remain motionless in the absence of structural refuge. Complex habitat, cryptic behavior, and direct defense improve juvenile red king crab survival against certain predators in situ. Keywords: habitat complexity, nursery habitat, refuge
Introduction Red king crab (Paralithodes camtschaticus) is a large, commercially important anomuran crab (Lithodidae) distributed throughout the North Pacific. Red king crab populations in Alaska declined in the late 1960s followed by large-scale collapse in the early 1980s (Orensanz et al., 1998) with little recovery to date (Woodby et al., 2005). Understanding conditions that contribute to early life stage success will advance understanding of population fluctuation for this depressed fishery resource species. Larval red king crab settle to nearshore habitats where crabs in the early juvenile stage (0–2 y; 2–25 mm carapace length (CL)) (Donaldson et al., 1992) are solitary and cryptic, and live in a habitat different from older juveniles and adults (Karinen, 1985). This life stage is most abundant in complex habitats including fractured rock, cobbles, bivalve shells, macroalgae, and structural invertebrates (Loher and Armstrong, 2000). Habitat choice is influenced by foraging opportunities, in particular when biogenic habitats are present (Pirtle and Stoner, 2010). Associating with complex habitats also reduced predation of the early juvenile stage by groundfish predators in laboratory experiments (Stoner, 2009; Pirtle, 2010). Whether or not complex habitat structure mediates crab survival with
In: Pollock NW, ed. Diving for Science 2011. Proceedings of the American Academy of Underwater Sciences 30th Symposium. Dauphin Island, AL: AAUS; 2011.
2
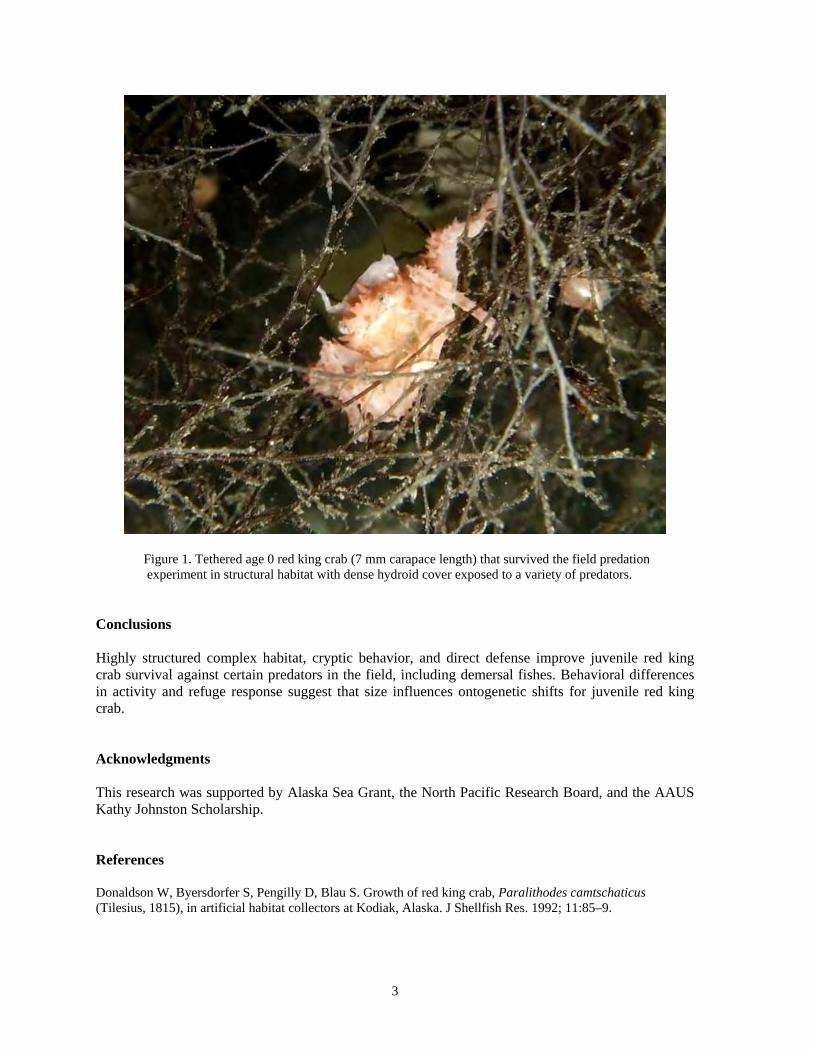
predators in situ is not presently known. Also unknown is how crab refuge response behavior may change with ontogeny, and how early juvenile stage crabs respond to predators. In this study, we examined the effects of habitat structure on survival and refuge response behavior of early juvenile red king crab (age 0 and 1 y). We tested crab survival in nearshore habitats with and without structure and identified predators and crab refuge response behavior. We investigated the following two hypotheses: 1) survival is greatest within habitats of complex structure; and 2) refuge response behavior is different between habitats with and without structure and with crab size or age. Methods Tethering experiments were conducted at a nearshore location near Juneau, Alaska. Divers using scuba conducted surveys to identify potential predators of juvenile crabs at the study site. Juvenile crabs, age 0 (CL) and 1 y (CL), were tethered individually in habitat treatments that included complex vertical structure (hydroids with crushed shell and gravel), no structure (crushed shell and gravel), or a mesh-covered control with no structure. Divers deployed experimental treatments and crabs. Divers determined crab survival in the field every 24 h and deployed new habitat treatments and crabs. A total of 6 replicates were conducted for each crab stage and habitat. Predation events, predator-prey interactions, and crab behavior were captured by remote video that was analyzed in the laboratory following field experiments. Results Unsheltered juvenile crab survival for age 0 and age 1 crabs was higher in the presence of complex structural habitat with fish and invertebrate predators in the field (GLM, α = 0.05, F = 26.80, p < 0.0001). Predators that consumed three age 0 crabs were small sculpin (Cottidae) (Genus Artedius, Clinocottus, or Oligocottus), Alaska ronquil (Bathymaster caeruleofasciatus), and sunflower star (Pycnopodia helianthoides). All unsheltered age 1 crabs were consumed by sunflower stars. Crab activity (ANOVA, α = 0.05, F = 4.88, p = 0.01) and refuge response behavior (ANOVA, α = 0.05; Attacked F = 5.76, p < 0.01; Approached F = 40.04, p < 0.0001) varied with crab stage and habitat. Age 0 crabs were cryptic and avoided predators by associating with habitat structure or remaining motionless in the absence of structure and were less likely to respond to an attack (Figure 1). In contrast, age 1 crabs were likely to flee or directly fight an attacking predator and less likely to remain motionless in the absence of structural refuge.
3
Figure 1. Tethered age 0 red king crab (7 mm carapace length) that survived the field predation experiment in structural habitat with dense hydroid cover exposed to a variety of predators.
Conclusions Highly structured complex habitat, cryptic behavior, and direct defense improve juvenile red king crab survival against certain predators in the field, including demersal fishes. Behavioral differences in activity and refuge response suggest that size influences ontogenetic shifts for juvenile red king crab. Acknowledgments This research was supported by Alaska Sea Grant, the North Pacific Research Board, and the AAUS Kathy Johnston Scholarship. References Donaldson W, Byersdorfer S, Pengilly D, Blau S. Growth of red king crab, Paralithodes camtschaticus (Tilesius, 1815), in artificial habitat collectors at Kodiak, Alaska. J Shellfish Res. 1992; 11:85–9.
4
Karinen JF. Occurence of juvenile king crab, Paralithodes camtschatica (Tilesius), in Auke Bay, Alaska, on sediments with relatively high concentrations of aromatic hydrocarbons. In: Melteff BR, ed. Proceedings of the International King Crab Symposium, University of Alaska, Anchorage. 1985. Orensanz JM, Armstrong J, Armstrong D, Hilborn R. Crustacean resources are vulnerable to serial depletion – the multifaceted decline of crab and shrimp fisheries in the Greater Gulf of Alaska. Rev Fish Biol Fisher. 1998; 8: 117–76. Loher T, Armstrong DA. Effects of habitat complexity and relative larval supply on the establishment of early benthic phase red king crab (Paralithodes camtschaticus Tilesius, 1815) populations in Auke Bay, Alaska. J Exp Mar Biol Ecol. 2000; 245: 83–109. Pirtle JL. Habitat function in Alaska nearshore marine ecosystems. PhD dissertation, University of Alaska Fairbanks, Fairbanks, Alaska, 2010: 207 pp. Pirtle JL, Stoner AW. Red king crab (Paralithodes camtschaticus) early post-settlement habitat choice: structure, food, and ontogeny. J Exp Mar Biol Ecol. 2010; 393: 130–7. Stoner AW. Habitat-mediated survival of newly settled red king crab in the presence of a predatory fish: Role of habitat complexity and heterogeneity. J Exp Mar Biol Ecol. 2009; 382: 54–60. Woodby D, Carlile D, Siddeek S, Funk F, Clark JH, Hulbert L. Commercial Fisheries of Alaska. Special Publication No. 05–09, Alaska Department of Fish and Game, Anchorage. 2005.
5
Effects of the Red Sea Urchin on Benthic Invertebrate Communities: A Link to Spatial Subsidies Ross Whippo1, Alex Lowe2, Kevin Britton-Simmons2 1 University of British Columbia, Department of Zoology, #2370–6270 University Blvd., Vancouver, BC V6T 1Z4 Canada [email protected] 2 Friday Harbor Laboratories, University of Washington, 620 University Road, Friday Harbor, WA 98250, USA Abstract
The red urchin (Strongylocentrotus franciscanus) is a ubiquitous member of the San Juan Archipelago (SJA) marine ecosystem ranging from the shallow subtidal to depths greater than 100 m. Despite the absence of attached algae on which to feed in the deep subtidal, red urchins are quite common in these ecosystems. They are able to subsist primarily on detrital seaweeds produced in the shallow photic zone, capturing these fluxes of organic material from the water column using their spines. Red urchins are known to regulate community structure in shallow algal habitats, but very little is known about interactions between urchins and the surrounding community in the deep subtidal. This study tested the hypothesis that red sea urchins alter benthic invertebrate community structure and abundance patterns in the deep subtidal zone. This was accomplished through the use of underwater photography across two sites in the San Juan Channel. Analysis revealed that sea urchins are significantly altering abundance patterns of sessile fauna in the subtidal, while effects on mobile fauna were present but less clear. Keywords: sea urchin, spatial subsidy, subtidal ecology
Introduction In the San Juan Archipelago of Washington State red sea urchins are primary grazers and can be found at depths of a few meters to over 100m (D. Duggins, pers. comm.). This distribution represents a broad diversity of habitat which has been shown in similar systems to be strongly stratified by depth in terms of benthic community richness and abundance (Konar et al., 2009). These urchins are unique from many other communities of sea urchins as they are able to live a primarily sedentary lifestyle due to the heavy flow of detrital seaweeds present in the San Juan Channel and other nearby environments. This flow of detached algae has been described as the San Juan algal spatial subsidy (Britton-Simmons et al. 2009) in which kelp and other macrophytes produced in the shallow photic zone (less than 20m depth) are transported to deeper subtidal habitats. These fluxes of material provide the primary energy input for recipient species including the red urchin. It is possible that red urchins are altering deep subtidal invertebrate communities as a result of this sedentary lifestyle made possible by the macroalgal subsidy. The purpose of this study was to answer the following questions: 1) Does richness and abundance of invertebrate organisms differ below and immediately adjacent to red sea urchins compared to similar substrate free of urchins? 2) Does invertebrate richness and abundance differ by depth in the deep subtidal?
In: Pollock NW, ed. Diving for Science 2011. Proceedings of the American Academy of Underwater Sciences 30th Symposium. Dauphin Island, AL: AAUS; 2011.

6
Methods Sites Two sites were chosen in the San Juan Channel for photo sampling. Criteria for selection included presence of primarily bedrock substrate as well as horizontal habitat and red urchins in sufficient density for ease of sampling. Roddy's Reach (RR, 48˚33'09.05"N, 122˚58'45.62"W) is oriented on the west side of Shaw Island at Point George and is subject to heavy tidal flow. Neck Point (NP, 48˚34'49.31"N, 123˚01'01.78W) is situated on the northwest corner of Shaw Island with a southern exposed, and northern semi-protected beach head (Figure 1).
Figure 1. Representation of sampling regime at each of two sites. Transects laid at 23 m and 30 m below mean lower low water (MLLW) and paired photos taken along length for a total of 8 photos per transect (4 urchin, 4 control).
Sampling Regime Two depths (23 m and 30 m below MLLW) were sampled at each site between 27 February 2011 and 30 April 2011. At each depth a 30–60 m transect was laid along the given depth contour and photos were taken in pairs in a 5 m stratified convenience sampling design. The first urchin encountered in the given sampling unit was removed and a photo was taken of the area underneath. An area at least 1.5 m but no more than 2 m distant devoid of urchins was randomly selected as the control photo. This was repeated until at least four pairs of photos across each depth were taken at each site, or until maximum bottom time was approached. All photos were taken with a Cannon PowerShot G7 digital camera in a Cannon WP–DC11 waterproof case with two Cool Flash Nano digital slave strobes mounted on a metal framer (quadrat) with 24.6cm x 30cm inner dimensions. A total of 32 photos were taken; RR 23m (n=8), RR 30m (n=8), NP 23m (n=8), NP 30m (n=8). Photo Analysis All photos were color corrected in a GNU Image Manipulation Program (GIMP 2.6.11, Free Software Foundation, Inc.), and imported to image analyzing software (Image J 1.44p, National Institutes of
7
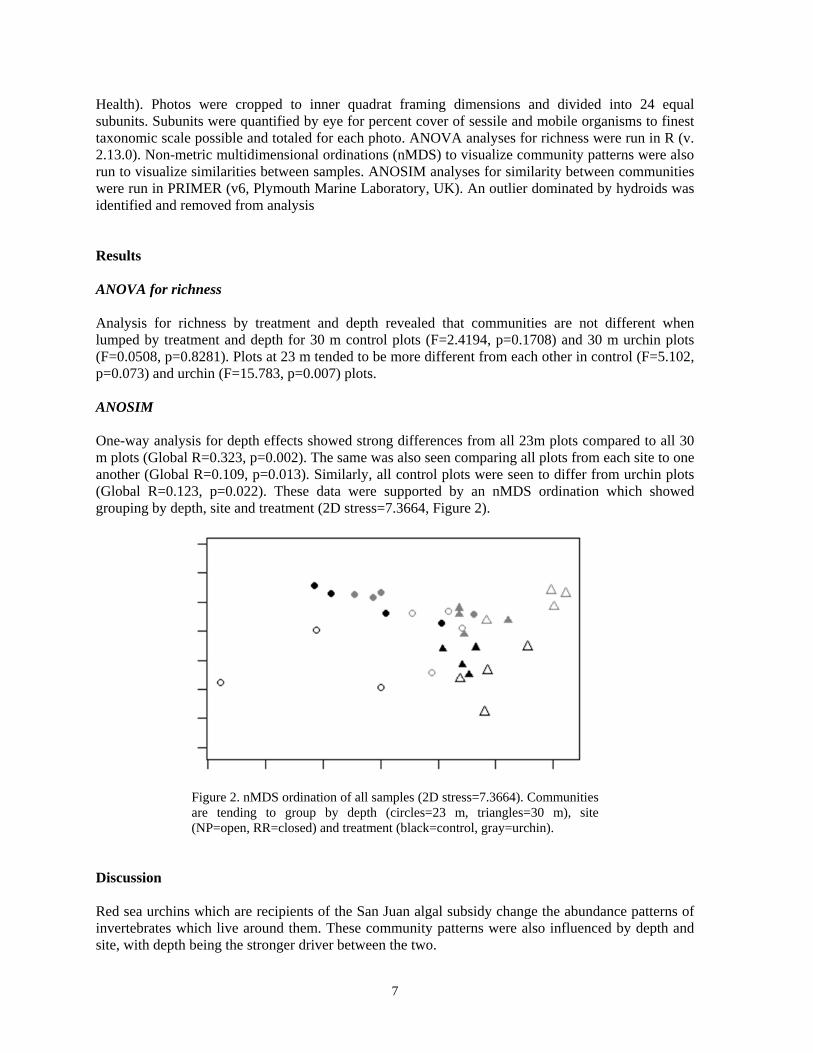
Health). Photos were cropped to inner quadrat framing dimensions and divided into 24 equal subunits. Subunits were quantified by eye for percent cover of sessile and mobile organisms to finest taxonomic scale possible and totaled for each photo. ANOVA analyses for richness were run in R (v. 2.13.0). Non-metric multidimensional ordinations (nMDS) to visualize community patterns were also run to visualize similarities between samples. ANOSIM analyses for similarity between communities were run in PRIMER (v6, Plymouth Marine Laboratory, UK). An outlier dominated by hydroids was identified and removed from analysis Results ANOVA for richness Analysis for richness by treatment and depth revealed that communities are not different when lumped by treatment and depth for 30 m control plots (F=2.4194, p=0.1708) and 30 m urchin plots (F=0.0508, p=0.8281). Plots at 23 m tended to be more different from each other in control (F=5.102, p=0.073) and urchin (F=15.783, p=0.007) plots. ANOSIM One-way analysis for depth effects showed strong differences from all 23m plots compared to all 30 m plots (Global R=0.323, p=0.002). The same was also seen comparing all plots from each site to one another (Global R=0.109, p=0.013). Similarly, all control plots were seen to differ from urchin plots (Global R=0.123, p=0.022). These data were supported by an nMDS ordination which showed grouping by depth, site and treatment (2D stress=7.3664, Figure 2).
Figure 2. nMDS ordination of all samples (2D stress=7.3664). Communities are tending to group by depth (circles=23 m, triangles=30 m), site (NP=open, RR=closed) and treatment (black=control, gray=urchin).
Discussion Red sea urchins which are recipients of the San Juan algal subsidy change the abundance patterns of invertebrates which live around them. These community patterns were also influenced by depth and site, with depth being the stronger driver between the two.
8
Sea urchins can have a far reaching influence on the surrounding community, and play an important role in structuring community abundance patterns in deep subtidal environments of the San Juan Channel. The question remains precisely how they are altering these communities. Future work should attempt to determine the mechanism by which urchins change the abundance patterns of associated fauna. References Britton-Simmons KH, Foley G, Okamoto D. Spatial subsidy in the subtidal zone: utilization of drift algae by a deep subtidal sea urchin. Aquatic Biol. 2009; 5: 233–43. Konar B, Iken K, Edwards M. Depth-stratified community zonation patterns on Gulf of Alaska rocky shores. Mar Ecol. 2009; 30: 63–73.
9
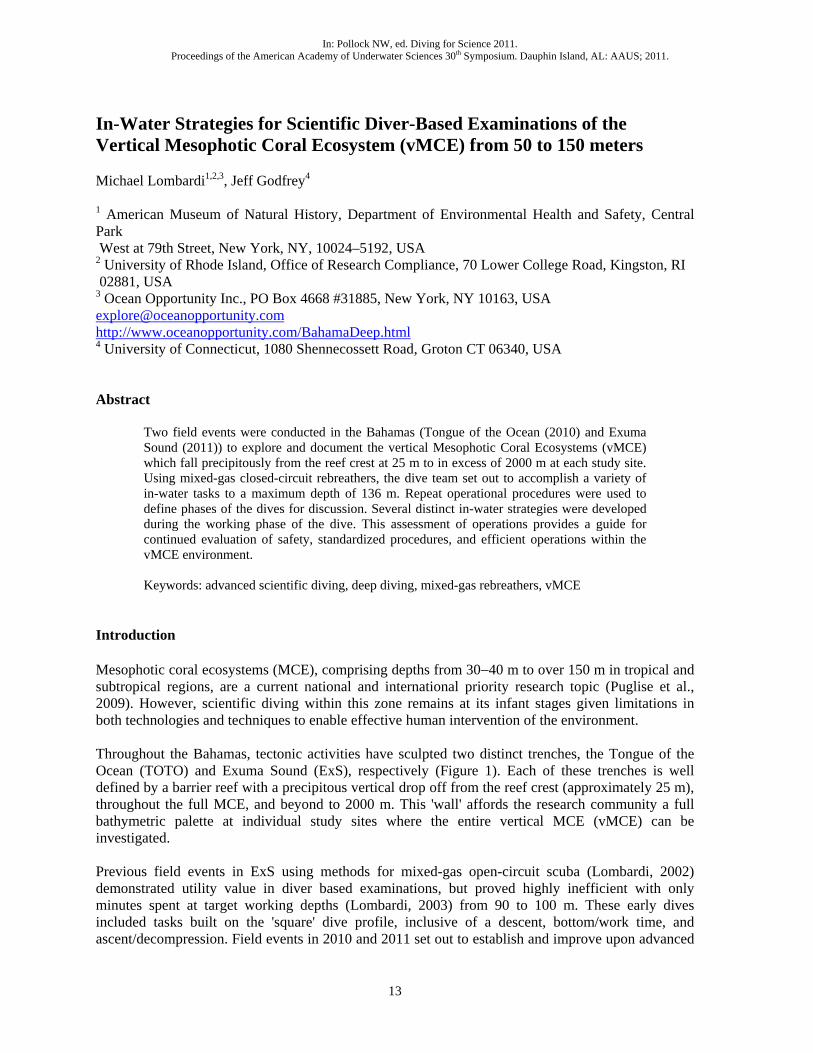
A Visual Profile of the Vertical Mesophotic Coral Ecosystem of the Tongue of the Ocean (TOTO), Andros, Bahamas to 100 meters Michael Lombardi1,2,3 1 American Museum of Natural History, Department of Environmental Health and Safety, Central Park West at 79th Street, New York, NY, 10024–5192, USA 2 University of Rhode Island, Office of Research Compliance, 70 Lower College Road, Kingston, RI 02881, USA 3 Ocean Opportunity Inc., PO Box 4668 #31885, New York, NY 10163, USA [email protected] http://www.oceanopportunity.com/BahamaDeep.html Abstract
A scientific diver based survey was carried out to explore and document the Mesophotic Coral Ecosystem along the Tongue of the Ocean, Bahamas. One dive was dedicated to acquiring imagery for the construction of a to-scale vertical mosaic image product to provide a visual reference point to catalyze further scientific investigations. The final image product reveals visually distinct zonation of both the benthic community and geological structure of the MCE at the study site. Keywords: advanced scientific diving, mixed-gas rebreather, mosaic imaging, vMCE
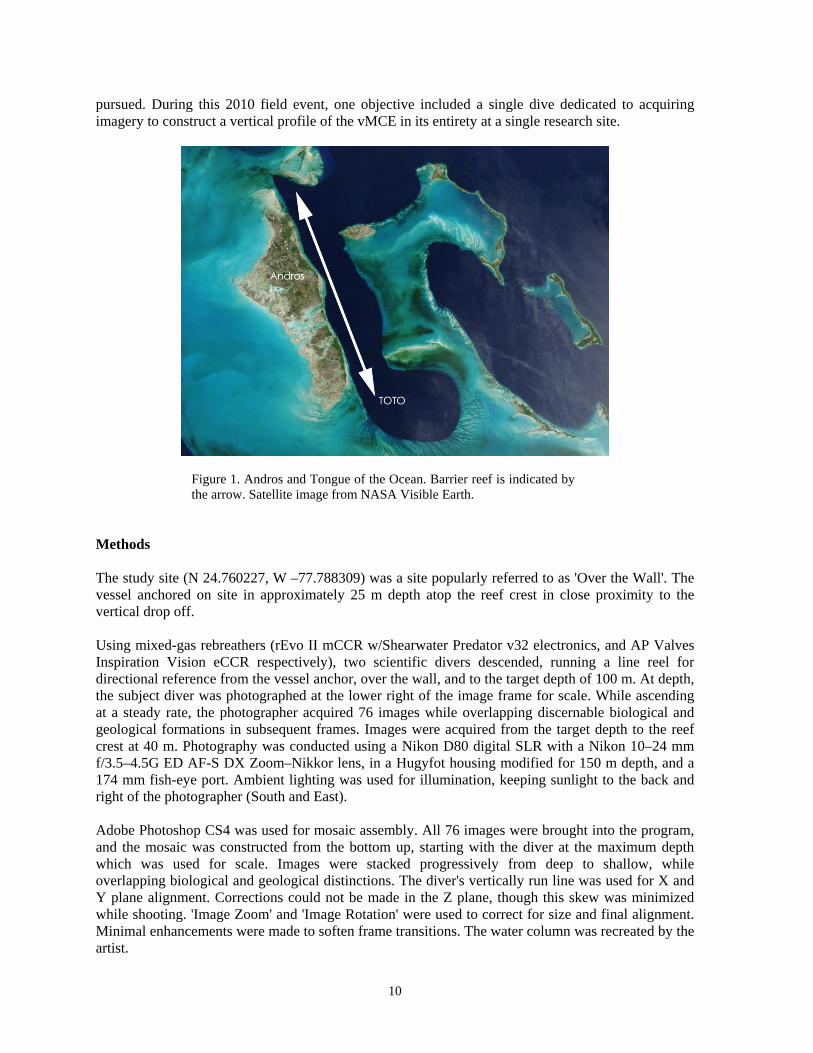
Introduction Mesophotic coral ecosystems (MCE), comprising depths from 30−40 m to over 150 m in tropical and subtropical regions, encompass highly variable topographies which present challenges for research sampling (Puglise et al., 2009). Conventional mapping strategies within MCEs have been discussed (Locker, 2010) and implemented, though groundtruthing by scientific divers remains a challenge given restrictions in working time spent at these depths. However, benefits of conducting diver based photo surveys and groundtruthing are widely accepted and recognized given a long and productive history in the scientific diving community. A 2010 field event set out to improve upon existing advanced scientific diving methodologies for exploring and documenting the vertical MCE (vMCE), with work carried out along the Tongue of the Ocean (TOTO), Earth's third largest barrier reef system. TOTO is well defined by a flanking barrier reef in excess of 100 miles to the relative North and South along the East coast of Andros, Bahamas (Figure 1). TOTO's western margin is a vertical wall which drops precipitously from the shallow (20−40 m) reef crest through the full MCE, and beyond to 2000 m. Few diver based scientific explorations have been conducted in the Bahamas MCE, especially in TOTO, since its natural history was exposed more popularly by Starck (1972) due to logistics constraints in the region. Critical to advancing scientific exploration of the vMCE is providing a visual reference of this environment for researchers from which new hypotheses can be derived and subsequent research
In: Pollock NW, ed. Diving for Science 2011. Proceedings of the American Academy of Underwater Sciences 30th Symposium. Dauphin Island, AL: AAUS; 2011.
10
pursued. During this 2010 field event, one objective included a single dive dedicated to acquiring imagery to construct a vertical profile of the vMCE in its entirety at a single research site.
Figure 1. Andros and Tongue of the Ocean. Barrier reef is indicated by the arrow. Satellite image from NASA Visible Earth.
Methods The study site (N 24.760227, W –77.788309) was a site popularly referred to as 'Over the Wall'. The vessel anchored on site in approximately 25 m depth atop the reef crest in close proximity to the vertical drop off. Using mixed-gas rebreathers (rEvo II mCCR w/Shearwater Predator v32 electronics, and AP Valves Inspiration Vision eCCR respectively), two scientific divers descended, running a line reel for directional reference from the vessel anchor, over the wall, and to the target depth of 100 m. At depth, the subject diver was photographed at the lower right of the image frame for scale. While ascending at a steady rate, the photographer acquired 76 images while overlapping discernable biological and geological formations in subsequent frames. Images were acquired from the target depth to the reef crest at 40 m. Photography was conducted using a Nikon D80 digital SLR with a Nikon 10–24 mm f/3.5–4.5G ED AF-S DX Zoom–Nikkor lens, in a Hugyfot housing modified for 150 m depth, and a 174 mm fish-eye port. Ambient lighting was used for illumination, keeping sunlight to the back and right of the photographer (South and East). Adobe Photoshop CS4 was used for mosaic assembly. All 76 images were brought into the program, and the mosaic was constructed from the bottom up, starting with the diver at the maximum depth which was used for scale. Images were stacked progressively from deep to shallow, while overlapping biological and geological distinctions. The diver's vertically run line was used for X and Y plane alignment. Corrections could not be made in the Z plane, though this skew was minimized while shooting. 'Image Zoom' and 'Image Rotation' were used to correct for size and final alignment. Minimal enhancements were made to soften frame transitions. The water column was recreated by the artist.

11
Dive profile data was recorded on the onboard CCR computers. Results The final mosaic product provides a to-scale, wide-angle perspective of the vMCE to 100 m (Figure 2), composed with imagery from a single bounce dive, followed by a working ascent inclusive of 30 minutes of image/data gathering time of a 118 minutes total runtime (Figure 3). Ascent rate remained consistent at approximately 3 msw⋅minute-1 until decompression stops were required near the reef crest. A depth scale was added to the image noting 10 m depth increments, and individual tick marks were included to highlight visual geological distinctions at 55 and 79 m.
Figure 3. 100 m dive profile downloaded from Shearwater Predator v32. Consistent ascent rate is highlighted. Discussion Working along a vertical transect at a consistent ascent rate proved productive, providing the means to acquire images to construct a visual mosaic product suitable for scientific analysis. The final product is at 1/30th scale, or 10 m tall. Viewed in this large format, zonation of ecological and geological features can be clearly discerned. Such images, coupled with diver observations, may provide a useful compliment to optical, acoustic, and laser imaging techniques within MCEs. Further, visual reference of the vMCE provides a tool for dive operations strategies and planning in staging efficient work procedures along the entire wall face, or at specific contours or zones during any given dive. This vertical habitat offers a comprehensive benthic palette for investigation during a single dive as ascent and decompression phases of the dive are conducted along the vMCE reef face, and can
Figure 2. To-scale mosaic profile of the MCE to 100 m.
depth (meters)
30
38
40
50
55
60
70
7980
90
100
12
serve as highly functional work times. Thus, this vertical environment may serve as a model for refining deep scientific diving procedures while simultaneously gathering data across a full bathymetric spectrum within the MCE. Acknowledgments Fieldwork was made possible by the National Geographic Society/Waitt Grants Program (Award #W140-10), and funds from Ocean Opportunity Inc. Field support provided by Jeff Godfrey, University of Connecticut. Mosaic image assembled by Amanda McCorkle, Color Quarry Designs. References Locker SD, Armstrong RA, Battista TA, Rooney JJ, Sherman C, Zawada DG. Geomorphology of mesophotic coral ecosystems: current perspectives on morphology, distribution, and mapping strategies. Coral Reefs. 2010; 29: 329–45. Puglise KA, Hinderstein LM, Marr JCA, Dowgiallo MJ, Martinez FA. Mesophotic Coral Ecosystems Research Strategy: International Workshop to Prioritize Research and Management Needs for Mesophotic Coral Ecosystems. NOAA Technical Memorandum NOS NCCOS 98 and OAR OER 2, 2009; 24 pp. NASA Visible Earth image and maps collection. http://visibleearth.nasa.gov/view_rec.php?id=5403. Accessed January 9, 2011. Starck W. Probing the Deep Reef's Hidden Realm. National Geographic Magazine. 1972; Dec.
13
In-Water Strategies for Scientific Diver-Based Examinations of the Vertical Mesophotic Coral Ecosystem (vMCE) from 50 to 150 meters Michael Lombardi1,2,3, Jeff Godfrey4 1 American Museum of Natural History, Department of Environmental Health and Safety, Central Park West at 79th Street, New York, NY, 10024–5192, USA 2 University of Rhode Island, Office of Research Compliance, 70 Lower College Road, Kingston, RI 02881, USA 3 Ocean Opportunity Inc., PO Box 4668 #31885, New York, NY 10163, USA [email protected] http://www.oceanopportunity.com/BahamaDeep.html 4 University of Connecticut, 1080 Shennecossett Road, Groton CT 06340, USA Abstract
Two field events were conducted in the Bahamas (Tongue of the Ocean (2010) and Exuma Sound (2011)) to explore and document the vertical Mesophotic Coral Ecosystems (vMCE) which fall precipitously from the reef crest at 25 m to in excess of 2000 m at each study site. Using mixed-gas closed-circuit rebreathers, the dive team set out to accomplish a variety of in-water tasks to a maximum depth of 136 m. Repeat operational procedures were used to define phases of the dives for discussion. Several distinct in-water strategies were developed during the working phase of the dive. This assessment of operations provides a guide for continued evaluation of safety, standardized procedures, and efficient operations within the vMCE environment.
Keywords: advanced scientific diving, deep diving, mixed-gas rebreathers, vMCE
Introduction Mesophotic coral ecosystems (MCE), comprising depths from 30−40 m to over 150 m in tropical and subtropical regions, are a current national and international priority research topic (Puglise et al., 2009). However, scientific diving within this zone remains at its infant stages given limitations in both technologies and techniques to enable effective human intervention of the environment. Throughout the Bahamas, tectonic activities have sculpted two distinct trenches, the Tongue of the Ocean (TOTO) and Exuma Sound (ExS), respectively (Figure 1). Each of these trenches is well defined by a barrier reef with a precipitous vertical drop off from the reef crest (approximately 25 m), throughout the full MCE, and beyond to 2000 m. This 'wall' affords the research community a full bathymetric palette at individual study sites where the entire vertical MCE (vMCE) can be investigated. Previous field events in ExS using methods for mixed-gas open-circuit scuba (Lombardi, 2002) demonstrated utility value in diver based examinations, but proved highly inefficient with only minutes spent at target working depths (Lombardi, 2003) from 90 to 100 m. These early dives included tasks built on the 'square' dive profile, inclusive of a descent, bottom/work time, and ascent/decompression. Field events in 2010 and 2011 set out to establish and improve upon advanced
In: Pollock NW, ed. Diving for Science 2011. Proceedings of the American Academy of Underwater Sciences 30th Symposium. Dauphin Island, AL: AAUS; 2011.
14
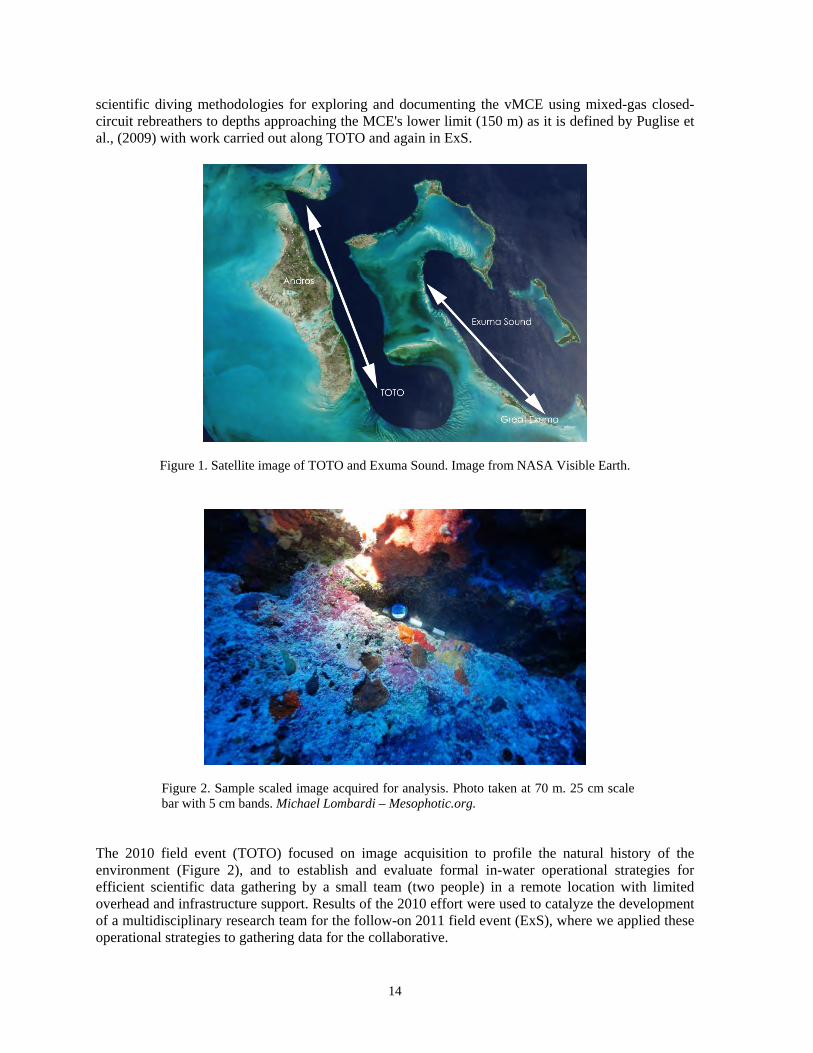
scientific diving methodologies for exploring and documenting the vMCE using mixed-gas closed-circuit rebreathers to depths approaching the MCE's lower limit (150 m) as it is defined by Puglise et al., (2009) with work carried out along TOTO and again in ExS.
Figure 1. Satellite image of TOTO and Exuma Sound. Image from NASA Visible Earth.
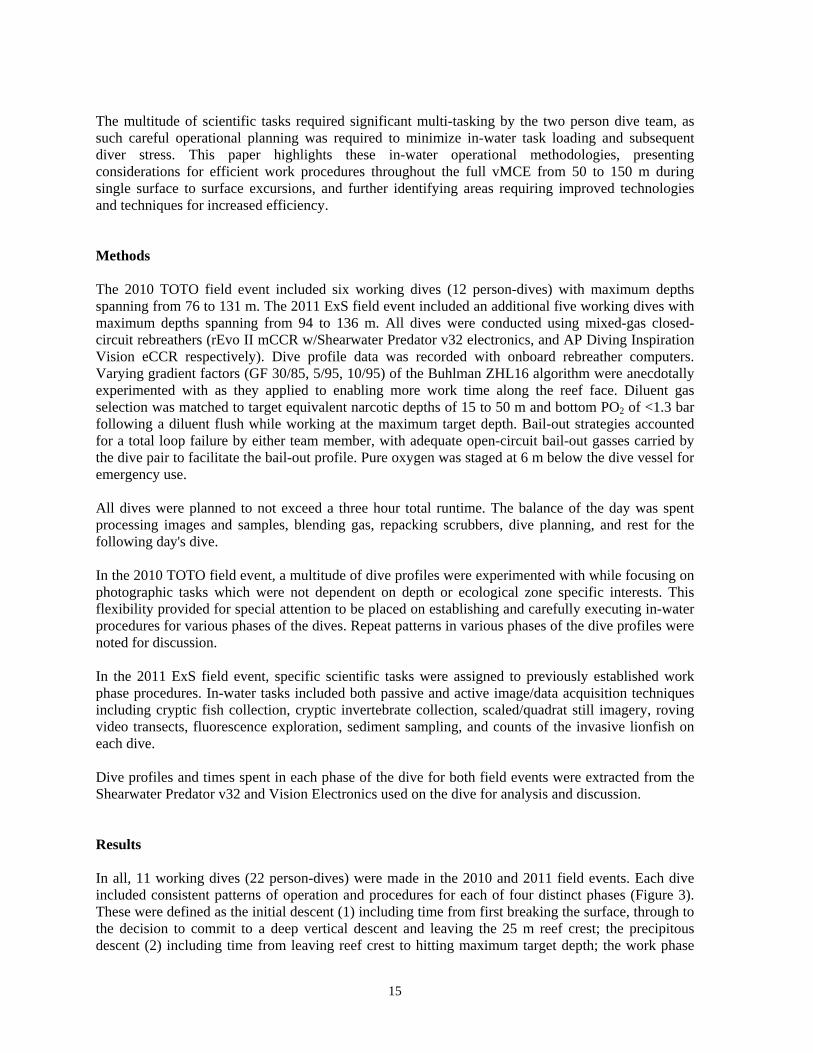
Figure 2. Sample scaled image acquired for analysis. Photo taken at 70 m. 25 cm scale bar with 5 cm bands. Michael Lombardi – Mesophotic.org.
The 2010 field event (TOTO) focused on image acquisition to profile the natural history of the environment (Figure 2), and to establish and evaluate formal in-water operational strategies for efficient scientific data gathering by a small team (two people) in a remote location with limited overhead and infrastructure support. Results of the 2010 effort were used to catalyze the development of a multidisciplinary research team for the follow-on 2011 field event (ExS), where we applied these operational strategies to gathering data for the collaborative.
15
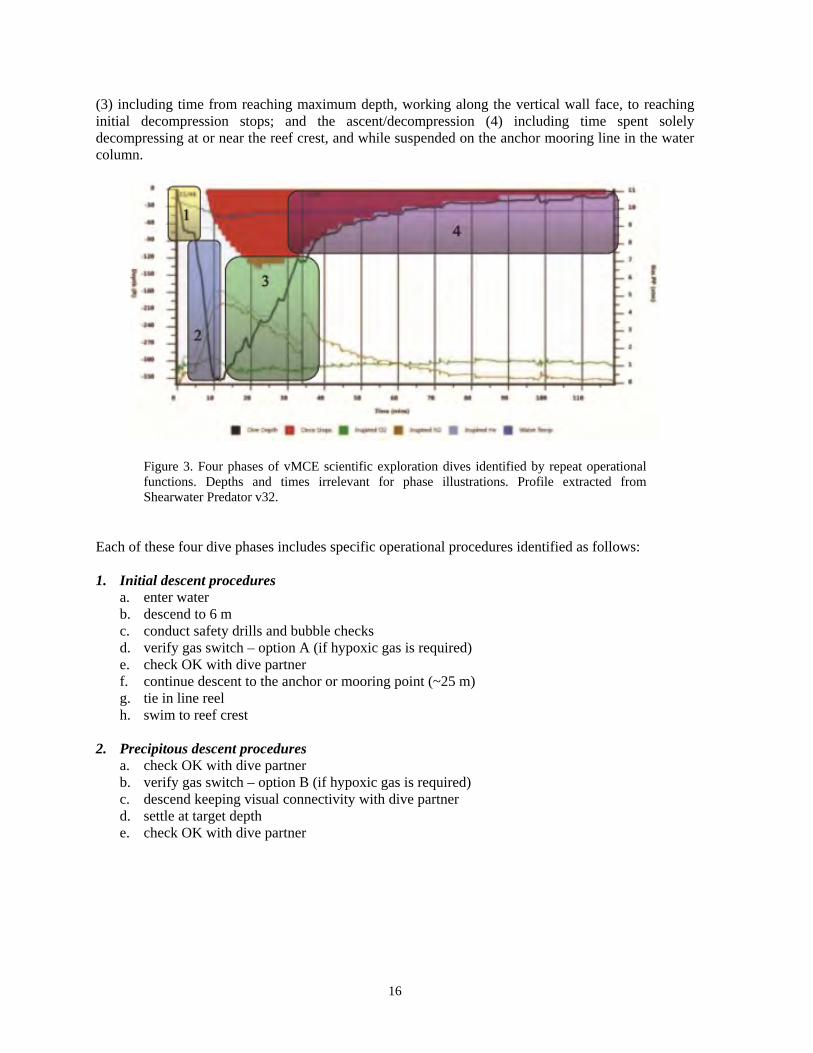
The multitude of scientific tasks required significant multi-tasking by the two person dive team, as such careful operational planning was required to minimize in-water task loading and subsequent diver stress. This paper highlights these in-water operational methodologies, presenting considerations for efficient work procedures throughout the full vMCE from 50 to 150 m during single surface to surface excursions, and further identifying areas requiring improved technologies and techniques for increased efficiency. Methods The 2010 TOTO field event included six working dives (12 person-dives) with maximum depths spanning from 76 to 131 m. The 2011 ExS field event included an additional five working dives with maximum depths spanning from 94 to 136 m. All dives were conducted using mixed-gas closed-circuit rebreathers (rEvo II mCCR w/Shearwater Predator v32 electronics, and AP Diving Inspiration Vision eCCR respectively). Dive profile data was recorded with onboard rebreather computers. Varying gradient factors (GF 30/85, 5/95, 10/95) of the Buhlman ZHL16 algorithm were anecdotally experimented with as they applied to enabling more work time along the reef face. Diluent gas selection was matched to target equivalent narcotic depths of 15 to 50 m and bottom PO2 of <1.3 bar following a diluent flush while working at the maximum target depth. Bail-out strategies accounted for a total loop failure by either team member, with adequate open-circuit bail-out gasses carried by the dive pair to facilitate the bail-out profile. Pure oxygen was staged at 6 m below the dive vessel for emergency use. All dives were planned to not exceed a three hour total runtime. The balance of the day was spent processing images and samples, blending gas, repacking scrubbers, dive planning, and rest for the following day's dive. In the 2010 TOTO field event, a multitude of dive profiles were experimented with while focusing on photographic tasks which were not dependent on depth or ecological zone specific interests. This flexibility provided for special attention to be placed on establishing and carefully executing in-water procedures for various phases of the dives. Repeat patterns in various phases of the dive profiles were noted for discussion. In the 2011 ExS field event, specific scientific tasks were assigned to previously established work phase procedures. In-water tasks included both passive and active image/data acquisition techniques including cryptic fish collection, cryptic invertebrate collection, scaled/quadrat still imagery, roving video transects, fluorescence exploration, sediment sampling, and counts of the invasive lionfish on each dive. Dive profiles and times spent in each phase of the dive for both field events were extracted from the Shearwater Predator v32 and Vision Electronics used on the dive for analysis and discussion. Results In all, 11 working dives (22 person-dives) were made in the 2010 and 2011 field events. Each dive included consistent patterns of operation and procedures for each of four distinct phases (Figure 3). These were defined as the initial descent (1) including time from first breaking the surface, through to the decision to commit to a deep vertical descent and leaving the 25 m reef crest; the precipitous descent (2) including time from leaving reef crest to hitting maximum target depth; the work phase
16
(3) including time from reaching maximum depth, working along the vertical wall face, to reaching initial decompression stops; and the ascent/decompression (4) including time spent solely decompressing at or near the reef crest, and while suspended on the anchor mooring line in the water column.
Figure 3. Four phases of vMCE scientific exploration dives identified by repeat operational functions. Depths and times irrelevant for phase illustrations. Profile extracted from Shearwater Predator v32.
Each of these four dive phases includes specific operational procedures identified as follows: 1. Initial descent procedures
a. enter water b. descend to 6 m c. conduct safety drills and bubble checks d. verify gas switch – option A (if hypoxic gas is required) e. check OK with dive partner f. continue descent to the anchor or mooring point (~25 m) g. tie in line reel h. swim to reef crest
2. Precipitous descent procedures
a. check OK with dive partner b. verify gas switch – option B (if hypoxic gas is required) c. descend keeping visual connectivity with dive partner d. settle at target depth e. check OK with dive partner

17
Table 1. Cumulative time spent at each of four dive phases. Time is total of 11 individual dives.
Phase of Dive
Depth Range (msw)
Cumulative Time (min)
Mean±SD
% of Dive
1 0 – 25 49 4±2 3 2 25 – 150 72 7±2 5 3 150 – 25 355 35± 6 26 4 25 to surface 930 85±22 66
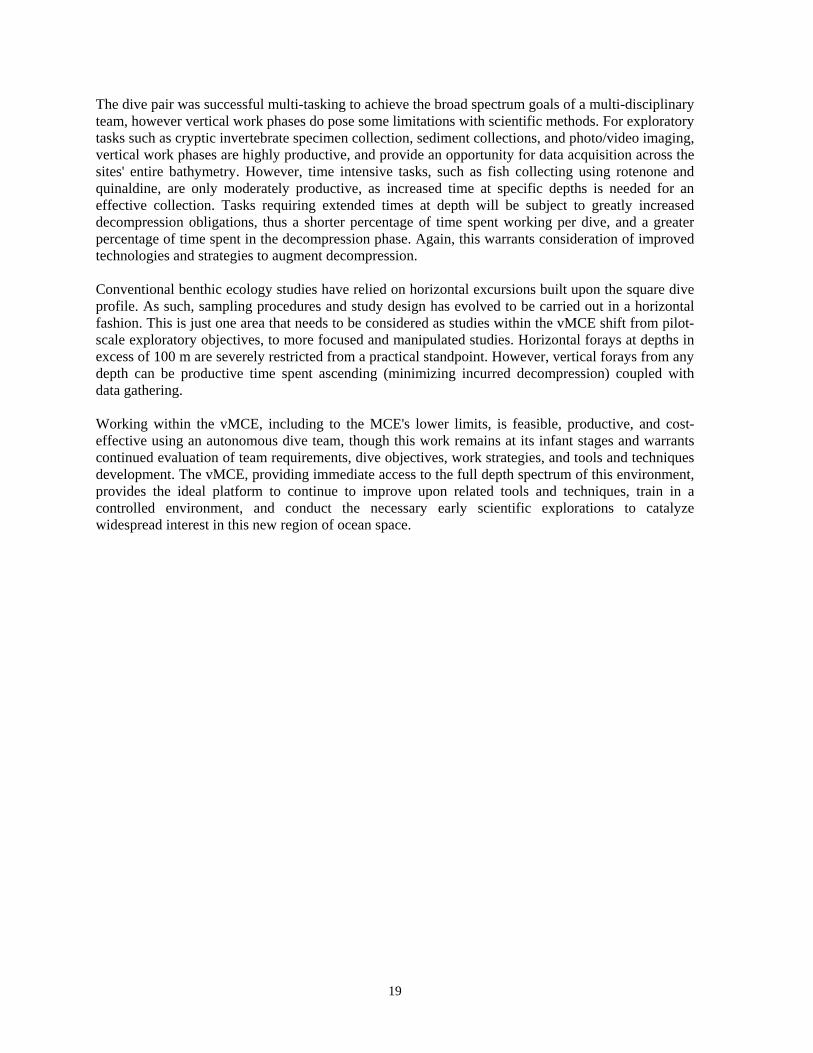
3. Work phase procedures (Figure 4) Work objectives determined the form of the ascent throughout the vMCE. This work phase included each diver carrying out individual delegated responsibilities. Three forms of working ascents were determined as follows:
a. Consistent ascent a slow but consistent 3 m⋅minute-1 ascent along the vMCE face working steadily until the first required decompression stop
b. Square, multi-level ascent
two or three specific depth contours were targeted for work for a pre-determined amount of time
c. Meander with variable ascent rates
the target depth is the emphasis for study, though efforts made to be productive throughout the remainder of the ascent until the first decompression stop
4. Final ascent/decompression procedures All work was stopped once 60 to 80 minutes of decompression was incurred per onboard real-time computer calculations, at which point the dive pair continued the ascent to the first required decompression stop which varied from 64 m up to 21 m. Though work ceased, lengthy 4–5 minute stops at the reef crest were used opportunistically for additional data/image gathering. Once the dive pair left the reef crest, decompression stops were spent hanging on the anchor/mooring line where no work was conducted. Time spent by the dive pair (i.e., length of individual dive time, not cumulative time) at each phase was extracted from profile data and is summarized in Table 1. Immediately evident is that the vast majority of in-water time is spent decompressing at 66% of total dive time, averaging 85±22 minutes per dive. However, regardless of maximum depth targeted, work time accounted for 26% of the total dive time, averaging 35±6 minutes along the vMCE per working dive. Variable work-phase forms were paired with specific active and passive scientific diving functions (Table 2) for discussion.
18
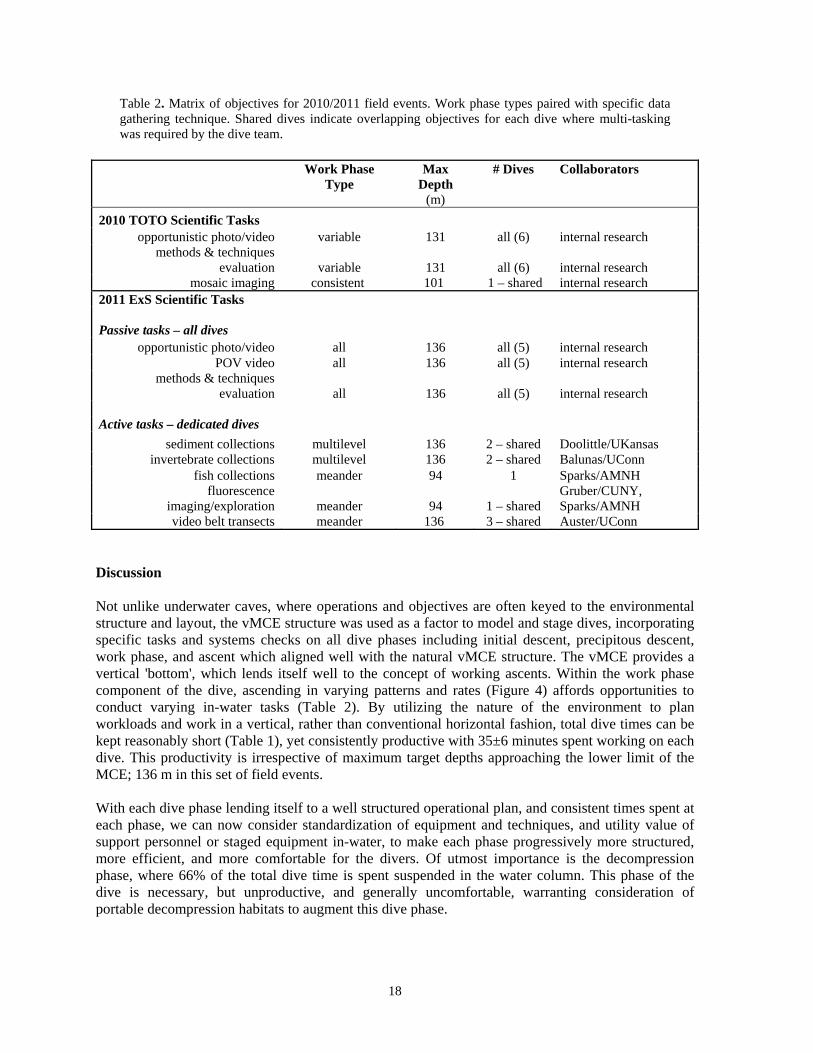
Table 2. Matrix of objectives for 2010/2011 field events. Work phase types paired with specific data gathering technique. Shared dives indicate overlapping objectives for each dive where multi-tasking was required by the dive team.
Work Phase Type
Max Depth
(m)
# Dives
Collaborators
2010 TOTO Scientific Tasks opportunistic photo/video variable 131 all (6) internal research
methods & techniques evaluation variable 131 all (6) internal research
mosaic imaging consistent 101 1 – shared internal research 2011 ExS Scientific Tasks Passive tasks – all dives
opportunistic photo/video all 136 all (5) internal research POV video all 136 all (5) internal research
methods & techniques evaluation all 136 all (5) internal research
Active tasks – dedicated dives
sediment collections multilevel 136 2 – shared Doolittle/UKansas invertebrate collections multilevel 136 2 – shared Balunas/UConn
fish collections meander 94 1 Sparks/AMNH fluorescence
imaging/exploration meander 94 1 – shared Gruber/CUNY, Sparks/AMNH
video belt transects meander 136 3 – shared Auster/UConn Discussion Not unlike underwater caves, where operations and objectives are often keyed to the environmental structure and layout, the vMCE structure was used as a factor to model and stage dives, incorporating specific tasks and systems checks on all dive phases including initial descent, precipitous descent, work phase, and ascent which aligned well with the natural vMCE structure. The vMCE provides a vertical 'bottom', which lends itself well to the concept of working ascents. Within the work phase component of the dive, ascending in varying patterns and rates (Figure 4) affords opportunities to conduct varying in-water tasks (Table 2). By utilizing the nature of the environment to plan workloads and work in a vertical, rather than conventional horizontal fashion, total dive times can be kept reasonably short (Table 1), yet consistently productive with 35±6 minutes spent working on each dive. This productivity is irrespective of maximum target depths approaching the lower limit of the MCE; 136 m in this set of field events. With each dive phase lending itself to a well structured operational plan, and consistent times spent at each phase, we can now consider standardization of equipment and techniques, and utility value of support personnel or staged equipment in-water, to make each phase progressively more structured, more efficient, and more comfortable for the divers. Of utmost importance is the decompression phase, where 66% of the total dive time is spent suspended in the water column. This phase of the dive is necessary, but unproductive, and generally uncomfortable, warranting consideration of portable decompression habitats to augment this dive phase.
19
The dive pair was successful multi-tasking to achieve the broad spectrum goals of a multi-disciplinary team, however vertical work phases do pose some limitations with scientific methods. For exploratory tasks such as cryptic invertebrate specimen collection, sediment collections, and photo/video imaging, vertical work phases are highly productive, and provide an opportunity for data acquisition across the sites' entire bathymetry. However, time intensive tasks, such as fish collecting using rotenone and quinaldine, are only moderately productive, as increased time at specific depths is needed for an effective collection. Tasks requiring extended times at depth will be subject to greatly increased decompression obligations, thus a shorter percentage of time spent working per dive, and a greater percentage of time spent in the decompression phase. Again, this warrants consideration of improved technologies and strategies to augment decompression. Conventional benthic ecology studies have relied on horizontal excursions built upon the square dive profile. As such, sampling procedures and study design has evolved to be carried out in a horizontal fashion. This is just one area that needs to be considered as studies within the vMCE shift from pilot-scale exploratory objectives, to more focused and manipulated studies. Horizontal forays at depths in excess of 100 m are severely restricted from a practical standpoint. However, vertical forays from any depth can be productive time spent ascending (minimizing incurred decompression) coupled with data gathering. Working within the vMCE, including to the MCE's lower limits, is feasible, productive, and cost-effective using an autonomous dive team, though this work remains at its infant stages and warrants continued evaluation of team requirements, dive objectives, work strategies, and tools and techniques development. The vMCE, providing immediate access to the full depth spectrum of this environment, provides the ideal platform to continue to improve upon related tools and techniques, train in a controlled environment, and conduct the necessary early scientific explorations to catalyze widespread interest in this new region of ocean space.
20
Figure 4. Deep work strategies on ascent. A1) Bounce dive with slow yet consistent ascent. A2) Square, but multi-level ascent. A3) Meadering with variable ascent rates. Specific depths are irrelevent, as method functions are keyed to work phase ascent forms.
Acknowledgments Fieldwork was made possible by the National Geographic Society/Waitt Grants Program (Award #W140-10), and funds from Ocean Opportunity Inc. Advising provided by the collaborative of
21
Sparks/AMNH, Gruber/CUNY, Auster/UConn, Balunas/UConn, Doolittle/UKansas and Reid/UMiami. Programs hosted at Small Hope Bay Lodge (2010) and the John H. Perry Caribbean Marine Research Center (2011). References Lombardi MR, ed. The Next Step: Mixed Gas Technical Diving 'Science 300 feet deep' Procedures for diving operations using mixed-gas, open-circuit scuba with staged, in-water decompression for conducting undersea science exploration. PIMS-CMRC/NOAA-NURC, 2002; internal document; 33 pp. Lombardi MR. Considerations for scientific technical diving: An overview of logistics, procedures, and implications for program development. Diving for Science 2003 AAUS Annual Symposium Proceedings, 2003; pp. 43–58. Lombardi MR. A visual profile of the vertical mesophotic coral ecosystem of the Tongue of the Ocean (TOTO), Andros, Bahamas to 100 meters. In: Pollock NW, ed. Diving for Science 2011. Proceedings of the American Academy of Underwater Sciences 30th Symposium. Dauphin Island, AL: AAUS; 2011; pp 9-12. Mesophotic.org image collection. http://www.mesophotic.org. Accessed April 20, 2011. Puglise KA, Hinderstein LM, Marr JCA, Dowgiallo MJ, Martinez FA (2009) Mesophotic Coral Ecosystems Research Strategy. NOAA Technical Memorandum NOS NCCOS 98 and OAR OER 2. 24 pp. NASA Visible Earth image and maps collection. http://visibleearth.nasa.gov/view_rec.php?id=5403. Accessed January 9, 2011.
22
Survey of Previously Outplanted Pinto (Northern) Abalone (Haliotis kamtschatkana) in the San Juan Island Archipelago, Washington State Jeffrey B. Hester, Jenna M. Walker, Paul A. Dinnel*, Nathan T. Schwarck Shannon Point Marine Center, Western Washington University, 1900 Shannon Point Road, Anacortes WA 98221, USA [email protected] *corresponding author Abstract
In 1992, the Washington Department of Fish and Wildlife (WDFW) began monitoring the pinto abalone (Haliotis kamtschatkana) populations at 10 index sites in the San Juan Island Archipelago in Northern Washington State. As of 2009, there has been an 83% decrease in the population since the beginning of the WDFW index site monitoring. It has recently been determined that this species will not likely recover without human intervention; so, in 2009, restoration efforts began by outplanting juvenile abalone to four different test sites. In March 2011, two new outplant sites were added. In July and August 2011, surveys of the six outplant sites were completed based on techniques used by WDFW to collect annual data on survival and growth rates. One site was repeatedly surveyed a total of four times at weekly intervals to compare data obtained from the repeated surveys. The Schnabel method was used to obtain a population estimate of 121 abalone out of the 350 tagged abalone known to have been outplanted in March 2011 at this site. Perimeter surveys were performed at two of the sites to determine if any abalone emigration was evident. The perimeter surveys found a total of three abalone, supporting the hypothesis that there has been little emigration from the test plots. Keywords: NOAA species of concern, REU, Schnabel method, scientific diving, Shannon Point Marine Center
Introduction Life Cycle Pinto abalone (Haliotis kamtschatkana) are marine gastropods found between the low intertidal zone and approximately 20 m of water (Bouma, 2007). These mollusks feed on various macroalgae and diatom films and grow to roughly 16 cm in length. Pinto abalone are distributed along the west coast of North America from California to Alaska. They are broadcast spawners with minimum density requirements of 0.15 abalone⋅m-² in order to insure successful egg fertilization (Babcock and Keesing, 1999). After fertilization, developing larvae are planktonic for 7–10 days until they find habitat to settle on, most commonly crustose corraline algae. These larvae undergo metamorphosis into the post-larval/early juvenile stage. Once the larvae reach 5 mm in shell length, they are considered juvenile abalone. Pinto juveniles are cryptic, blending in with their habitat and remaining in crevices or under rocks, until a size of approximately 50 mm, at which point they become emergent. At this stage, they are generally sexually mature, easier to find and will move to macroalgal forests to feed.
In: Pollock NW, ed. Diving for Science 2011. Proceedings of the American Academy of Underwater Sciences 30th Symposium. Dauphin Island, AL: AAUS; 2011.

23
History In 1992, the Washington Department of Fish and Wildlife (WDFW) began monitoring pinto abalone populations at 10 index sites in the San Juan Island Archipelago in Northern Washington. While commercial harvest of abalone has never been permitted in the state, the sport fishery may have extracted as many as 38,200 individuals per year in the San Juan Archipelago (Bargmann, 1984). Therefore, it is possible that abalone densities may have already been too low for successful fertilization and post-larval recruitment at the time of the sport fishery closure in 1994. As of 2009, there has been an 83% decrease in the population since the beginning of the WDFW index site monitoring (Figure 1) (Rothaus et al., 2008). Over-harvesting, poaching by commercial sea urchin divers, changing environmental conditions, lack of successful juvenile recruitment (Allee effect– the distance between spawning abalone is too great for successful egg fertilization) and disease are all possible factors for the decline (Campell, 2000).
Figure 1. Average number of pinto abalone found at WDFW's 10 index monitoring sites in the San Juan Archipelago from 1992 to 2009 (Figure produced by WDFW from unpublished data used with permission; methods according to Rothaus et al. 2008).
The pinto abalone has been listed as a NOAA Species of Concern (SOC) since 2004, in addition to being listed as a State Candidate Species and a Species of Greatest Conservation Need in Washington State. In 2009, pinto abalone ("northern abalone" in Canada) were listed as 'Endangered' under Canada's Species at Risk Act. It has recently been determined that this species will not likely recover without human intervention (Rothaus et al., 2008). Therefore, in 2009, restoration efforts began by outplanting hatchery raised juvenile abalone to four different test sites (Burrows Island South and West, Allan Island South and West (Bergman, 2009). In March 2011, a second outplanting was made at these four sites in addition to establishing two new outplant sites (Low Island East and West) (Table 1). The goal of this test program is to eventually restore abalone densities in the plots so that the average density of spawning adults is >0.15 abalone⋅m-².

24
Table 1. Total numbers of outplanted juvenile abalone by location and year (* = tagged individuals).
Site 2009 2011 Total Burrows West 304* 321 625 Burrows South 257 350* 607 Allan West 260 330* 590 Allan South 309* 305 614 Low East N/A 381* 381 Low West N/A 383* 383
Methods In July and August 2011, surveys of all six outplant sites were completed following WDFW protocol (Bouma, 2007). Annual data on survival and growth rates was collected. Each outplant site was roughly 10 m x 10 m and was divided into five 2-m lanes. These sites include a shallow side located at an average depth of 5 m and a deeper side which lies in approximately 9–10 m of water (depths referenced to mean lower low water). Before the initial outplant, four pitons were secured to benthic substrate to mark each corner of the plot. Polypropylene rope was attached to each piton and corners were denoted with either one, two, three or four knots. Sites were set up by running an open reel measuring tape through the four corner pitons and then the tape was referenced to create 2 m wide lanes with lead line (Figure 2). Non-invasive survey methods were conducted by leaving all habitat undisturbed and utilizing mirrors and lights to survey small cracks in the benthic substrate. Each lane was surveyed at a rate of approximately 1 m²⋅min-1 (20 minute surveys when single diver in a lane, 10 minute surveys when two divers in a single lane). For each abalone found, lane number, tag number, tag color, shell length and cryptic or emergent state were recorded (Figure 3).
Figure 2. Example of abalone outplant site with numbered lanes and defined by a diver deployed lead line (adapted from Bouma field notes– WDFW).

25
Figure 3. Juvenile abalone mortalities with slate for recording data in background.
Burrows Island South Resurveys An effort to test survey efficiency was conducted by repeatedly surveying the Burrows Island South outplant site. As juvenile abalone are very cryptic and are often found hidden under rocks, a total of four surveys were conducted to better assess the number of abalone present in this test plot. All outplanted abalone from March 2011 were previously tagged and the numbers of new individuals found during the repeated surveys were used to calculate surviving abalone by using the Schnabel mark/recapture formula (Schnabel, 1938). Perimeter Surveys To better understand outplanted abalone emigration, two test sites (Burrows Island South and West) were subjected to perimeter surveys five months after initial outplanting. Two 2-m lanes were added to the east and west sides of the selected outplant sites using lead line. The lanes were then surveyed using the same methods as the surveys of the plot interior. Results Plot Survival and Density The number of juvenile abalone found at each of the six test sites in July/August 2011 ranged from 5 to 46 individuals. Survival rates ranged from 0% (no abalone found) to 1.9% for the abalone outplanted in 2009 and 1.3% to 10.9% for abalone outplanted in 2011. Current population densities are now at a low of 0.07 abalone⋅m-2 and a high of 0.89 abalone⋅m-2 (Table 2).

26
Table 2. Density and survival of previously outplanted pinto abalone.
Site Density
(abalone⋅m-²) Total Abalone
Found Summer 2009 Outplant
(% found)* Spring 2011 Outplant
(% found)* Burrows South 0.89 43 1.4 10.9 Burrows West 0.16 11 0 3.4 Allan South 0.07 7 0.3 1.3 Allan West 0.15 13 1.9 2.4 Low East 0.12 12 N/A 3.1 Low West 0.10 9 N/A 2.3
*Based on single surveys Burrows Island South Repeat Surveys The Burrows Island South test site was surveyed once a week over a time span of one month to compare repeated surveys of the tagged March 2011 outplanted individuals. The Schnabel mark/recapture method was utilized for estimating population size. Based on tag numbers, a total of 87 unique individuals were found for all four of the repeated surveys, representing 24.9% of the outplanted population. However, the iterative use of the Schnabel mark/recapture method yielded an estimate of 121 survivors out of the 350 outplanted at this site in March 2011. This represents a 5 month survival of 34.6% at the Burrows south test site, corresponding to a 23.7% higher estimate when compared to the first single survey survival percentage of 10.9%. Perimeter Survey Perimeter surveys were performed at the two Burrows island sites to determine if any abalone emigration was evident. The perimeter surveys on the east and west sides of these two plots found an average of 1.5 per site. Using these numbers to extrapolate to the north and south sides of the plots, the evident emigration based on these two plots is estimated to be three abalone per plot. This represents a calculated emigration rate of 0.6% of the outplanted population. Outplant Growth Shell length ranged from 26.3±11.7 mm to 37.9±9.2 mm (Table 3). From the 2009 outplant, the lowest average shell length was 27 mm and the highest average shell length was 39.8±13.6 mm while the 2011 outplant had a lowest average shell length of 24.5±10.1 mm and a highest average shell length of 37.9±9.2 mm (Table 3). The average growth from 2009 outplants ranged from 7.9 mm to 29±12.6 mm and the average growth from the 2011 outplants ranged from 2±1.6 mm to 14.5±6.8 mm (Table 3). In an effort to isolate statistical error, data was normalized by removing significant outliers that were most likely members of the wild population.
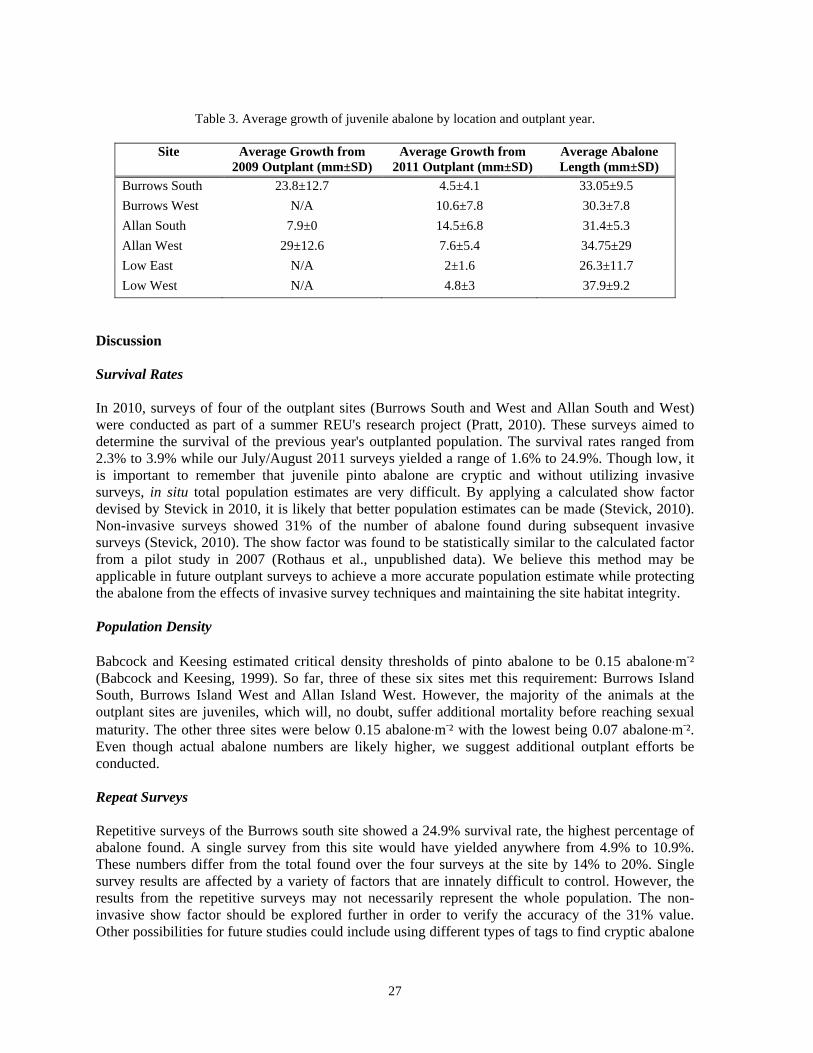
27
Table 3. Average growth of juvenile abalone by location and outplant year.
Site Average Growth from
2009 Outplant (mm±SD) Average Growth from
2011 Outplant (mm±SD) Average Abalone Length (mm±SD)
Burrows South 23.8±12.7 4.5±4.1 33.05±9.5 Burrows West N/A 10.6±7.8 30.3±7.8 Allan South 7.9±0 14.5±6.8 31.4±5.3 Allan West 29±12.6 7.6±5.4 34.75±29 Low East N/A 2±1.6 26.3±11.7 Low West N/A 4.8±3 37.9±9.2
Discussion Survival Rates In 2010, surveys of four of the outplant sites (Burrows South and West and Allan South and West) were conducted as part of a summer REU's research project (Pratt, 2010). These surveys aimed to determine the survival of the previous year's outplanted population. The survival rates ranged from 2.3% to 3.9% while our July/August 2011 surveys yielded a range of 1.6% to 24.9%. Though low, it is important to remember that juvenile pinto abalone are cryptic and without utilizing invasive surveys, in situ total population estimates are very difficult. By applying a calculated show factor devised by Stevick in 2010, it is likely that better population estimates can be made (Stevick, 2010). Non-invasive surveys showed 31% of the number of abalone found during subsequent invasive surveys (Stevick, 2010). The show factor was found to be statistically similar to the calculated factor from a pilot study in 2007 (Rothaus et al., unpublished data). We believe this method may be applicable in future outplant surveys to achieve a more accurate population estimate while protecting the abalone from the effects of invasive survey techniques and maintaining the site habitat integrity. Population Density Babcock and Keesing estimated critical density thresholds of pinto abalone to be 0.15 abalone⋅m-² (Babcock and Keesing, 1999). So far, three of these six sites met this requirement: Burrows Island South, Burrows Island West and Allan Island West. However, the majority of the animals at the outplant sites are juveniles, which will, no doubt, suffer additional mortality before reaching sexual maturity. The other three sites were below 0.15 abalone⋅m-² with the lowest being 0.07 abalone⋅m-². Even though actual abalone numbers are likely higher, we suggest additional outplant efforts be conducted. Repeat Surveys Repetitive surveys of the Burrows south site showed a 24.9% survival rate, the highest percentage of abalone found. A single survey from this site would have yielded anywhere from 4.9% to 10.9%. These numbers differ from the total found over the four surveys at the site by 14% to 20%. Single survey results are affected by a variety of factors that are innately difficult to control. However, the results from the repetitive surveys may not necessarily represent the whole population. The non-invasive show factor should be explored further in order to verify the accuracy of the 31% value. Other possibilities for future studies could include using different types of tags to find cryptic abalone
28
more readily or to conduct a larger number of repetitive surveys. Additional tagging or survey techniques could be considered in order to obtain more precise data. Acknowledgments The authors thank Josh Bouma of Puget Sound Restoration Fund for his assistance in project development and for providing insight and expertise of survey methods and information regarding pinto abalone. Gene McKeen provided boat support, helped in the planning of dives and aided with overall project assistance. Karl Mueller supplied boat support. Project coordination was associated with Puget Sound Restoration Fund, Washington Department of Fish and Wildlife and Shannon Point Marine Center. Lastly, thank you Dr. Steve Sulkin for supporting the REU program. Funding for this study was provided by the National Science Foundation Research Experience for Undergraduate program. References Babcock R Keesing J. Fertilization biology of the abalone Haliotis laevigata: laboratory and field studies. Can J Fish Aquat Sci. 1999; 56:1668–78. Bargmann GG. Recreational diving in the State of Washington and the associated harvest of food fish and shellfish. State of Washington, Dept. of Fisheries, Marine Fish Program, Olympia, WA, 1984. Bergman D. Pilot outplanting of the abalone, Haliotis kamtschatkana, and the effects of predation on hatchery tagged individuals. Final Report: REU Program, Shannon Point Marine Center, Western Washington University, 2009. Bouma J V. Early life history dynamics of pinto abalone (Haliotis kamtschatkana) and implications for recovery in the San Juan Archipelago, Washington State. MS Thesis. School of Aquatic and Fisheries Science, University of Washington, Seattle, WA, 2007. Campell AE. Workshop on rebuilding abalone stocks in British Columbia. Can Spec Pub Fish Aquat Sci. 2000; 130; 158 pp. Pratt P. Survey of previously outplanted abalone, Haliotis kamtschatkana, and effects of weaning diets on growth rates of hatchery individuals. Final Report: REU Program, Shannon Point Marine Center, Western Washington University, 2010. Rothaus DP, Vadopalas B, Friedman CS. Precipitous declines in pinto abalone (Haliotis kamtschatkana kamtschatkana) abundance in the San Juan Archipelago, Washington, USA, despite statewide fishery closure. Can J Fish Aquat Sci. 2008; 65: 2703–9. Schnabel ZE. The estimation of the total fish population of a lake. Amer Mathematician Monthly. 1938; 45: 348–52. Stevick B. Experimental rearing methods of pinto abalone (Haliotis kamtschatkana) and their effect on outplant survival in Washington State. MS Thesis. School of Aquatic and Fisheries Science, University of Washington, Seattle, WA, 2010.
29
Reproduction of Red Tree Corals in the Southeastern Alaskan Fjords: Implications for Conservation and Population Turnover Rhian G. Waller1*, Robert P. Stone2, Jennifer Mondragon3, Christian E. Clark1
1 Darling Marine Center, University of Maine, 193 Clarks Cove Road, Walpole, ME 04573, USA [email protected] 2 NOAA-NMFS, Alaska Fisheries Science Center, 17109 Point Lena Loop Road, Juneau, AK, 99801, USA 3 NOAA- NMFS, Alaska Regional Office, 709 West 9th Street, Juneau, AK 99801, USA *corresponding author Abstract
In September 2010 38 colonies of Red Tree Coral, Primnoa pacifica, were tagged from a single population living at 18 m depth in Tracy Arm fjord, south of Juneau, Alaska. This species of coral usually resides at 150–900 m depth in the Gulf of Alaska, and so its emergence to shallow water in the fjords provides a unique opportunity to study the seasonal reproductive ecology of a deep species in an accessible habitat. Keywords: Alaska, cold-water coral, fjords, reproduction
The Southeastern Alaskan fjords are one of the great fjord regions of the world, formed through large-scale oceanographic processes and complex geological formations, they provide a diverse array of marine habitats (Weingartner et al., 2009). The slenderness of the continental shelf and the deep passageways threading through the area may also make connections between offshore and inshore waters more likely (Weingartner et al., 2009). Indeed a number of species usually found deep in the Gulf of Alaska are found shallower than their normal distribution (Taggart et al., 2005; Stone and Shotwell, 2007), including a recently discovered population of Red Tree Corals, Primnoa pacifica (Stone et al., 2005). The term 'Deepwater Emergence' has been used to describe this phenomenon, though the environmental factors that allow species to survive much shallower than their usual distribution (often by thousands of meters) are not yet fully understood. Water temperatures in these fjord areas tend to be much cooler than the open ocean, mimicking temperatures usually found at bathyal depths (Friewald et al., 1997; Lindner et al., 2008). Nutrient rich upwelling, strong current regimes and the thick hyposaline layer reducing light levels are all other factors that could influence how these deep-sea species survive in shallow waters. There are just a few of these ecosystems worldwide – Chile (Försterra and Häussermann, 2003), Norway (Hovland and Risk, 2003), New Zealand (Grange et al., 1981; Smith and Witman, 1999, Roberts, 2001), British Columbia (Conway et al., 2008) and Alaska (Stone et al., 2005) – and all have been found to house species of, usually deep-water, corals. Similar to shallow-water systems, deep-water (or more recently termed cold-water) corals form important habitats, creating oases on continental shelves, slopes and ridges, yet the ecological processes of these corals is poorly understood because of the difficulties of sampling below traditional scuba depths. Their ability to harbor a broad array of associated fauna, including commercially important fisheries species (Stone, 2006; Reed, 1992; Koenig et al., 2000; ACES, 2003), makes them of interest to conservationists, commercial fishermen, managers and scientists
In: Pollock NW, ed. Diving for Science 2011. Proceedings of the American Academy of Underwater Sciences 30th Symposium. Dauphin Island, AL: AAUS; 2011.
30
alike. Unfortunately the damaging effects of fisheries to these corals has been seen in many areas around the globe (Stone, 2006; Probert et al., 1997; Koslow and Gowlett-Jones, 1998; Brooke, 2002; Hall-Spencer et al., 2003; Waller et al., 2007), highlighting the importance of providing ecological baseline data to ascertain these corals responses and recovery from anthropogenic impacts, as well as impending climate changes. In Alaska in particular, cold-water coral areas are considered essential fish habitat (Witherell and Coon, 2001) and five deep-water areas of Red Tree corals off southeast Alaska have already been identified as 'Habitat Areas of Particular Concern' (HAPC) (Stone and Shotwell, 2007). These corals form habitat for commercially important rockfish (Sebastes aleutianus, S. borealis and S. ruberrimus) as well as juvenile crabs (Krieger and Wing, 2002; Stone et al., 2005), and can form massive stands, 2–3m in height (Krieger and Wing, 2002). They are also exceptionally slow growing, living for over 100 years (Andrews et al., 2002), leading to slow recovery from extensive fisheries damage in the Gulf of Alaska (Krieger, 2001). The relatively recent discovery of dense thickets (over 100 colonies) of P. pacifica at shallow depths (~20–100 ft) within Tracy and Endicott fjords of Holkham Bay, and within Glacier Bay National Park (Stone et al., 2005) presented a unique opportunity to examine the reproductive biology of this species on a seasonal basis, a study unachievable within their more common 150–900 m depth range. In September 2010, we began a time-series investigation of 38 colonies of P. pacifica from a single population within Tracy Arm fjord, to both examine the seasonal reproduction of this primnoid octocoral, and how fishing damage may affect their reproductive ecology. To simulate fisheries-caused damage, ten of the tagged colonies had approximately half of the colony removed in September 2010. Subsequent cruises (December 2010, March 2011, June 2011, September 2011) collected two-inch snips of each colony and preserved them for histological and ultrastructure analysis. A current meter (Sontek – Argonaut MD) was also deployed at this site from March – September 2011, and CTD (Conductivity, Temperature, Depth) measurements were taken across the fjord in each field season to a depth of 100 m to examine the seasonal oceanographic variability. Initial results are showing surprising reproductive strategies and patterns. In this highly seasonal environment in terms of food sources you would expect a seasonal reproductive trait to promote optimal larval survival. Such large aggregations of corals are also usually associated with a spawning reproductive strategy, to allow propagules to disperse widely. These Red Tree corals however, display prolonged continuous reproduction (with gametes potentially taking over a year to mature), low fecundity and novel protected development. This life history is more concurrent with K-strategists, yet paradoxically the environment they inhabit, a fjord with two tidewater glaciers, is highly unstable over relatively short time scales (tens of years in this area), potentially making these thickets ephemeral populations. The life history traits observed also make this species particularly susceptible to mechanical damage from fishing gear, which might crop colonies and result in even lower fecundities, affecting natural population turnover. This study has demonstrated that seasonal studies on cold-water corals are fundamental for understanding the intricacies of life history strategies and traits, and that this information is essential in developing management and conservation strategies for these important ecosystem engineers. Deep-sea studies are often sporadic at best, so gaining baseline data on similar species in shallow depths can form important timelines with which novel strategies can be discovered, and comparisons to deep species can be made.
31
Acknowledgments This work was funded through the NOAA's Alaska Fisheries Science Center, Auke Bay Labs and through the National Geographic Society and Waitt Foundation (#W146-10). The authors gratefully acknowledge help and support for this project provided by Captain Dennis Rogers (Alaska Sea Adventures), Captain Dan Foley (RV Steller), Wade Loofburrow (Alaska Sea Adventures), Robert Frampton (Pacific Northwest Coastal) and Christopher Rigaud (DSO UMaine). References ACES. The Atlantic Coral Ecosystem Survey Final Report. 2003: Compiled by A. Freiwald, 250 pp. Andrews AH, Cordes EE, Mahoney MM, Munk K, Coale KH, Cailliet GM, Heifetz J. Age, growth and radiometric age validation of a deep-sea, habitat-forming gorgonian (Primnoa resedaeformis) from the Gulf of Alaska. Hydrobiologia. 2002; 471:101–10. Brooke SD. Reproductive Ecology of a Deep-Water Scleractinian Coral, Oculina varicosa from the South East Florida Shelf: Ph.D. Thesis, 2002. Southampton, Southampton Oceanography Centre. Conway KW, Barrie JV, Krautter M. Sponge reefs and reef building corals in the coastal waters of western Canada. The Fourth International Symposium on Deep Water Corals, 2002, Wellington, New Zealand, pp114. Försterra G, Häussermann V. First report on large scleractinian (Cnidaria: Anthozoa) accumulations in cold-temperate shallow water of south Chilean fjords. Zoologische Verhandelingen Leiden. 2003; 345: 117–28. Freiwald A, Henrich R, Paetzold J. Anatomy of a deep-water coral reef mound from Stjernsund, West Finnmark, northern Norway, In: James NP, Clarke Jonathan AD, eds. Cool-water carbonates, vol. 56. Society for Sedimentary Geology, 1997: pp. 141–62. Grange KR, Singleton RJ, Richardson JR, Hill PJ, Main WDe. Shallow rock wall biological associations of some southern fiords of New Zealand. NZ J Zoology. 1981; 8: 209–27. Hall-Spencer J, Allain V, Fossa J. Trawling damage to Northeast Atlantic ancient coral reefs: Proceedings of the Royal Society, 2003; 269: 507–11. Hovland M, Risk MJ. Do Norwegian deep-water coral reefs rely on seeping fluids? Mar Geol. 2003; 198: 83–96. Koenig CC, Coleman FC, Grimes CB, Fitzhugh GR, Scanlon KM, Gledhill CT, Grace M. Protection of fish spawning habitat for the conservation of warm temperate reef-fish fisheries of shelf edge reefs of Florida: Bulletin of Marine Sciences, 2000; 66: 593–616. Koslow J, Gowlett-Jones K. The Seamount Fauna off Southern Tasmania: Benthic communities, their conservation and impacts of trawling., Final Report to Environment Australia and Fisheries Research Development Corporation, Australia, 1998; pp. 104. Krieger KJ. Coral (Primnoa) impacted by fishing gear in the Gulf of Alaska. In: Wilson et al., (eds) Proceedings of the first international symposium on deep sea corals, 2001, Ecology Action Centre and Nova Scotia Museum, Halifax, Nova Scotia, pp 106–16. Krieger KJ, Wing BL. Megafauna associations with deepwater corals (Primnoa spp.) in the Gulf of Alaska. Hydrobiologia, 2002; 471: 83–90.
32
Lindner A, Cairns SD, Cunningham CW. From offshore to onshore: multiple origins of shallow-water corals from deep-sea ancestors. PLoSONE 2008; 3(6): e2429. doi:10.1371/journal.pone.0002429. Morgan LE, Tsao CF, Guinotte J. Status of deep-sea corals in US waters, with recommendations for their conservation and management. Marine Conservation Biology Institute, 2006, Bellevue, WA; 64 pp. Probert P, McKnight D, Grover S. Benthic invertebrate bycatch from a deep-water trawl fishery, Chatham Rise, New Zealand. Aquatic Conservation: Marine and Freshwater Ecosystems, 1997, v. 7. Reed J. Submersible studies of deep-water Oculina and Lophelia banks off the South-eastern USA. Proceedings of the American Academy of Underwater Sciences 12th Annual Scientific Diving Symposium: 1992. Roberts CD. Survey of deepwater emergence in New Zealand fiord fishes. NZ J Mar Freshwater Res. 2001; 35(4): 661. Smith F, Witman JD. Species diversity in subtidal landscapes: maintenance by physical processes and larval recruitment. Ecol. 1999; 80: 51–69. Stone RP. Coral habitat in the Aleutian Islands of Alaska: depth distribution, fine-scale species associations, and fisheries interactions. Coral Reefs. 2006; 25: 229–38. Stone R, Andrews A, Mondragon J. Deepwater emergence of red tree coral (Primnoa pacifica) in Glacier Bay, Alaska. Third International Symposium on Deep Water Corals, Miami, FL; 2005, pp 221. Stone RP, Shotwell SK. State of deep coral ecosystems in the Alaska Region: Gulf of Alaska, Bering Sea and the Aleutian Islands. In: Lumsden SE et al., eds. The State of Deep Coral Ecosystems of the United States. NOAA Technical Memorandum CRCP-3. Silver Spring, MD; 2007; pp 65–108. Taggart SJ, Andrews AG, Mondragon J, Mathews EA. Co-occurrence of Pacific Sleeper Sharks Somniosus pacificus and Harbor Seals Phoca vitulina in Glacier Bay. Alaska Fishery Res Bull. 2005; 11: 113–7. Waller RG, Watling L, Auster P, Shank TM. Fishing impacts on the corner rise seamounts. J Mar Biol Assoc UK. 2007; 87: 1075–6. Weingartner T, Eisner L, Eckert G, Danielson S. Southeast Alaska: oceanographic habitats and linkages. J Biogeog. 2009; 36: 387–400. Witherell D, Coon C. Protecting gorgonian corals off Alaska from fishing impacts. In: Wilson JHM, ed. Proceedings of the First International Symposium on Deep Sea Corals, 2001. Ecology Action Centre and Nova Scotia Museum, Halifax; pp 117–25.
33
Toxic Caviar: Using Fish Embryos to Monitor Contaminant Impacts Lisa Kerr Lobel
Biology Department, Boston University, 5 Cummington St., Boston, MA 02215, USA [email protected] Abstract
One challenge in underwater research is conducting surveys to detect adverse ecological impacts. Surveys often rely on counting 'indicator organisms' to help identify impacts or changes in water and environmental quality. The scientific problem is that for a given environment, we must choose our 'canary' or indicator organism which best responds to the suspected perturbation. Once we have our indicator then we must decide what to measure and how to link measured effects to a specific stressor. I will provide an example of how quantifying developmental abnormalities in the embryos of a demersal spawning fish can be used as a monitoring tool or indicator of chemical contamination. This study investigated the use of developmental abnormalities as indicators of adverse effects in the reef damselfish, Abudefduf sordidus by comparing developmental abnormalities between PCB contaminated and uncontaminated areas within Johnston Atoll, Central Pacific Ocean. These results demonstrate that embryonic abnormalities in demersal spawning fishes can be used as an easily quantified metric for comparing contaminated and uncontaminated locations. Keywords: bioassessment, bioindicator, contaminant impacts
Introduction In bioassessment, the goal is to develop a biological measurement that is a consistent indicator of environmental condition or quality. The early life stages of fishes have been widely used in laboratory assessments of the potential toxicity of chemical contaminants (Weis and Weis, 1989). Due to the sensitivities of fish embryos and larvae, levels of abnormal fish embryos collected from the sea surface microlayer have been proposed as indicators of water quality (Longwell and Hughes, 1980; Chang and Longwell, 1984; Hardy et al., 1987; von Westernhagen et al., 1988; Klumpp and von Westernhagen, 1995; Kingsford and Gray, 1996). These studies show higher levels of embryonic abnormalities in coastal developed and otherwise 'polluted' environments (18–90%) when compared to relatively pristine environments (4–13%; Klump and von Westernhagen, 1995). However, there are several difficulties in sampling pelagic fish embryos that can be overcome using demersal fish embryos. When sampling pelagic fish embryos, their exact origin is unknown and they may pass through several water masses as they develop. This makes pinpointing an area or poor water quality or contamination difficult. Plankton tows result in the collection of an assemblage of species that may vary in space and time making replication difficult. Many fish embryos or larvae are difficult to identify to the species level. Pooling at the generic level may combine species at different trophic levels and with these species experiencing different exposure levels. Finally, abnormal embryos might be under sampled due to the fact that they might sink out of the sampling zone. In comparison, demersal embryos are retained in a limited area, often within the home range of at least one parent. Many demersal spawners are territorial with limited home ranges making the
In: Pollock NW, ed. Diving for Science 2011. Proceedings of the American Academy of Underwater Sciences 30th Symposium. Dauphin Island, AL: AAUS; 2011.
34
comparison of multiple sites easier. Individuals could be identified and resampled over time. Choosing a demersal spawner with appropriate food habits allows the exposure route to be identified. Damselfish embryos have several advantages over the use of pelagic embryos for assessing biological effects of pollutants. Damselfishes (Pomacentridae) are numerous and conspicuous inhabitants of coral reefs throughout all tropical seas (Allen, 1991). A large omnivorous pomacentrid such as the blackspot sergeant major, Abudefduf sordidus has the potential to accumulate contaminants since it ingests sediments along with its diet of benthic invertebrates and algae. Pomacentrids are territorial and thus have limited home ranges, which allows for a finer resolution in pollution studies. Their demersal spawning habit allows for the easy collection of embryos. Males spawn repeatedly in the same nest sites so that individuals can be identified and followed over time. Some damselfish species, including A. sordidus, spawn in large groups or colonies allowing small populations in different locations to be studied. Johnston Atoll is a remote Central Pacific Atoll that lies about 1,287 km (800 miles) southwest of Honolulu, Hawaii. It was under military control from 1934 until 2003 and during those years some of the activities (unfortunately) contaminated some of the reefs within the atoll (Lobel and Kerr, 2002; Lobel and Kerr Lobel, 2008; Kerr Lobel and Lobel, 2009). For this study, I focused on polychlorinated biphenyl (PCB) contamination due to their potential for accumulation and toxicity. PCB contamination at Johnston was due to leakage from discarded electrical equipment, transformers and contaminated fuel. PCBs were found in sediments from two areas of the lagoon, the west end of Sand Island and in the Navy Pier (tank 49 lagoon) area on Johnston Island (JI), the main island within the atoll. The goal of this study was to determine whether increased levels of adverse effects were measurable at PCB contaminated sites compared to uncontaminated sites using developmental abnormalities in fish embryos as the measurement endpoint. This was accomplished by monitoring embryonic abnormalities from nests of damselfish spawning in colonies that occur in both PCB contaminated and uncontaminated areas. This study examined variability in embryonic abnormalities within and between sites over several years and therefore reports baseline levels of damselfish embryonic abnormalities in both contaminated and uncontaminated sites at Johnston Atoll. Methods Study locations included two sites containing sediment PCB contamination and three additional locations with background levels of PCB contamination in sediment (Figure 1; Lobel and Kerr, 2002). Daily underwater surveys were conducted to assess spawning activity. When new clutches were observed, embryo samples were scraped into 50 mL centrifuge tubes and labeled (Figure 2). Embryo samples were transferred to aerated 500 mL containers in the laboratory. A sub-sample of 200 embryos from each clutch was examined for developmental abnormalities using an Olympus SZH zoom dissecting microscope at 45−70x magnification. Samples from all new clutches were examined for developmental defects. Normal and abnormal development was determined by observation and comparison with diagrams, photographs and descriptions from the literature (Shaw, 1955; Fritzsche, 1978; Klumpp and von Westernhagen, 1995; Cameron et al., 1992; von Westernhagen, 1988). Since development within a clutch is synchronous, an embryo was considered defective if its developmental stage was grossly different from the developmental stage of other embryos in the sample or if there was no morphological differentiation observed in the embryo. Embryos damaged by sampling were detected by gently squeezing the embryo with forceps. An undamaged embryo was firm and did not have any yolk material in the
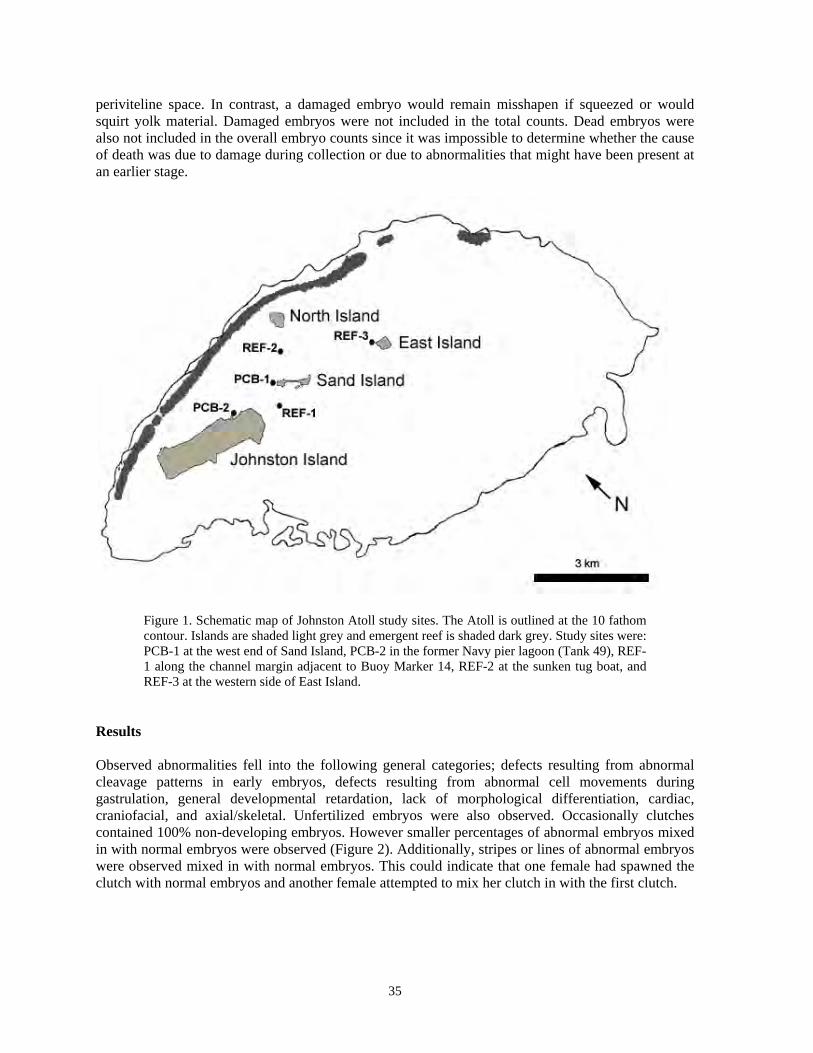
35
periviteline space. In contrast, a damaged embryo would remain misshapen if squeezed or would squirt yolk material. Damaged embryos were not included in the total counts. Dead embryos were also not included in the overall embryo counts since it was impossible to determine whether the cause of death was due to damage during collection or due to abnormalities that might have been present at an earlier stage.
Figure 1. Schematic map of Johnston Atoll study sites. The Atoll is outlined at the 10 fathom contour. Islands are shaded light grey and emergent reef is shaded dark grey. Study sites were: PCB-1 at the west end of Sand Island, PCB-2 in the former Navy pier lagoon (Tank 49), REF-1 along the channel margin adjacent to Buoy Marker 14, REF-2 at the sunken tug boat, and REF-3 at the western side of East Island.
Results Observed abnormalities fell into the following general categories; defects resulting from abnormal cleavage patterns in early embryos, defects resulting from abnormal cell movements during gastrulation, general developmental retardation, lack of morphological differentiation, cardiac, craniofacial, and axial/skeletal. Unfertilized embryos were also observed. Occasionally clutches contained 100% non-developing embryos. However smaller percentages of abnormal embryos mixed in with normal embryos were observed (Figure 2). Additionally, stripes or lines of abnormal embryos were observed mixed in with normal embryos. This could indicate that one female had spawned the clutch with normal embryos and another female attempted to mix her clutch in with the first clutch.
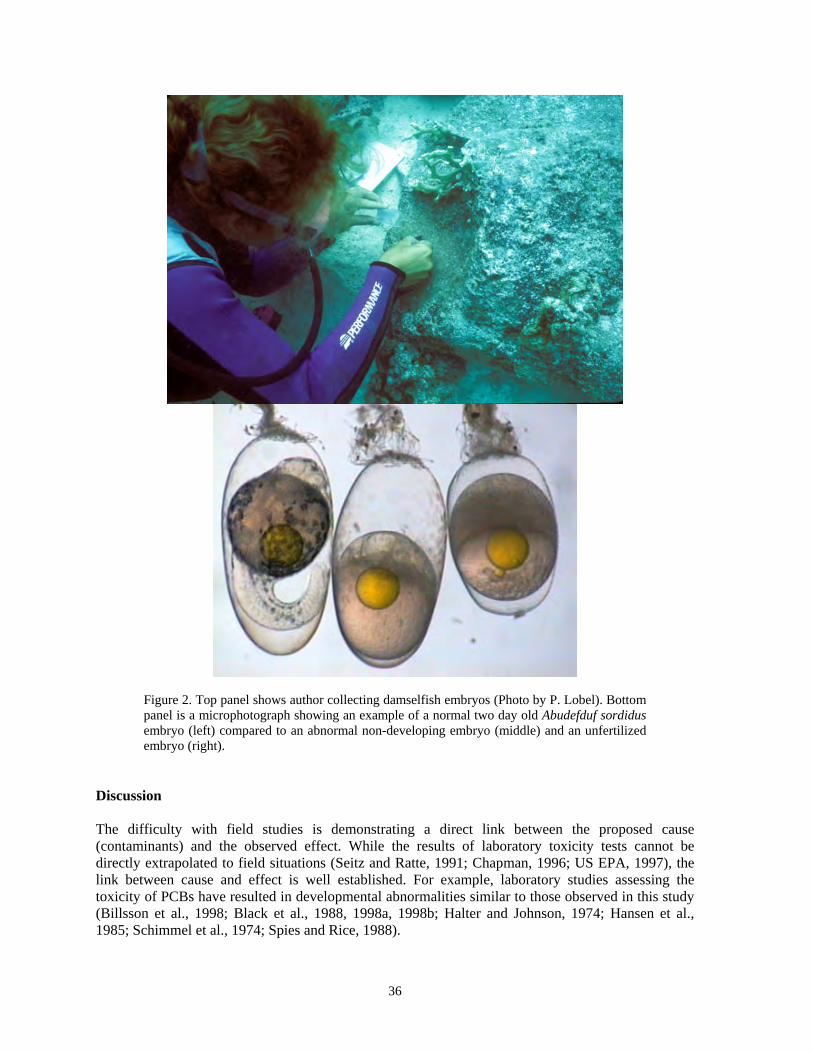
36
Figure 2. Top panel shows author collecting damselfish embryos (Photo by P. Lobel). Bottom panel is a microphotograph showing an example of a normal two day old Abudefduf sordidus embryo (left) compared to an abnormal non-developing embryo (middle) and an unfertilized embryo (right).
Discussion The difficulty with field studies is demonstrating a direct link between the proposed cause (contaminants) and the observed effect. While the results of laboratory toxicity tests cannot be directly extrapolated to field situations (Seitz and Ratte, 1991; Chapman, 1996; US EPA, 1997), the link between cause and effect is well established. For example, laboratory studies assessing the toxicity of PCBs have resulted in developmental abnormalities similar to those observed in this study (Billsson et al., 1998; Black et al., 1988, 1998a, 1998b; Halter and Johnson, 1974; Hansen et al., 1985; Schimmel et al., 1974; Spies and Rice, 1988).
37
While it is difficult to attribute field observations of embryonic abnormalities to specific contaminants, their presence at higher levels compared to pristine or reference habitats may indicate their use as a significant monitoring tool (Bodammer, 1993). The use of abnormal or dead amphibian embryos as an indicator of poor water quality is also prevalent in the bioassessment of wetlands (US EPA, 2002). Amphibian embryos, like fish embryos lack a shell and may be more sensitive to environmental pollutants present in the water. It is important to note that PCBs were detected in embryos and larvae using immunohistochemical methods. Higher levels were found in abnormal embryos and in samples collected from PCB contaminated sites (Kerr Lobel and Davis, 2002). However, chemical measurements alone cannot adequately assess the biological quality of the environment or biological effects within an organism. Numerous biotic and abiotic factors play important roles in either attenuating or increasing the toxicity of a chemical in the environment. Organism responses to anthropogenic perturbations result from integrated responses to both direct and indirect anthropogenic impacts added to any natural environmental stress (Adams and Ham, 1996). This study measured this integrated biological response to both natural and anthropogenic stressors in terms of damselfish development over several years, providing a relative or background measure of the occurrence of embryonic abnormalities at different sites with varying levels of sediment PCB contamination. Acknowledgments Research was supported by the Defense Threat Reduction Agency, Army Research Office (DAAAG55-98-1-0304, DAAD19-02-1-0218), Office of Naval Research (N00014-19-J1519, N00014-92-J-1969 and N00014-95-1-1324) and Legacy Resource Management Program (DACA87-00-H-0021, DACA87-01-H-0013, W912DY-06-2-0017). The work was performed under USFWS special use permit 12515–00003and MBL IACUC 97-04. References Adams SM, Ham KD. Current challenges in contaminant effects monitoring: multiple stressors and ecological significance. In: Barton B, MacKinlay D, eds. Contaminant effects on fish. Symposium Proceedings from the International Congress on the Biology of Fishes. San Francisco, 1996. Billsson K, Westerlund L, Tysklind M, Olsson P. Developmental disturbances caused by polychlorinated biphenyls in zebrafish, (Brachydanio rerio). Mar Environ Res. 1998; 46: 461–4. Black DE, Gutjahr-Gobell R, Pruell RJ, Bergen B, Mills L, McElroy AE. Effects of non-ortho and mono-ortho polychlorinated biphenyls on reproduction in Fundulus heteroclitus (Linnaeus). Environ Toxicol Chem. 1998a; 17:1396–1404. Black DE, Gutjahr-Gobell R, Pruell RJ, Bergen B, Mills L, McElroy AE. Reproduction and polychlorinated biphenyls in Fundulus heteroclitus (Linnaeus) from New Bedford Harbor, Massachusetts, USA. Environ Toxicol Chem. 1998b; 17:1405–14. Bodammer JE. The teratological and pathological effects of contaminants on embryonic and larval fishes exposed as embryos: a brief review. In: Fuiman LA ed. Proceedings of the American Fisheries Society Symposium 14. Water quality and the early life stages of fishes. Kingston, RI. June 1992. 1993: 77–84. Cameron P, Berg J. Morphological and chromosomal aberrations during embryonic development in dab, Limanda limanda. Mar Ecol Prog Ser. 1992; 91:163–9.
38
Chang S, Longwell A. Examining statistical associations of malformation cyto-pathology and cytogenic abnormality of Atlantic mackerel embryos with indictor levels of environmental contaminants in the New York Bight. CM/ICES. 1984; E11:1–9. Chapman PM. Extrapolating laboratory toxicity results to the field. Environ Toxicol Chem. 1996; 14:927–930. Fritzsche RA. Development of fishes of the mid-Atlantic Bight: an atlas of egg, larval and juvenile stages. Vol. V. Chaetodontidae through Ophidiidae. US Dept. of the Interior. Fish and Wildlife Service. Office of Biological Services. 1978: FWS/OBS-78/12. Halter MT, Johnson HE. Acute toxicities of polychlorinated biphenyls (PCB) and DDT alone and in combination to early life stages of coho salmon (Oncorhynchus kisutch). J Fish Res Bd. Can. 1974; 31: (9) 1543–7 Hansen PD, von Westernhagen H, Rosenthal H. Chlorinated hydrocarbons and hatching success in Baltic herring spring spawners. Mar Environ Res. 1985; 15:56–76. Kerr Lobel L, Davis EA. Immunohistochemical detection of polychlorinated biphenyls in field collected damselfish (Abudefduf sordidus; Pomacentridae) embryos and larvae. Environ Pollution. 2002; 120(3):529–32. Kerr Lobel, L, Lobel PS. Contaminants in fishes from Johnston Atoll. Proceedings of the 11th International Coral Reef Symposium. 2009: 1123–8. Kingsford MJ, Gray CA. Influence of pollutants and oceanography on abundance and deformities of wild fish larvae. In: Schmitt RJ, Osenberg CW, eds. Detecting ecological impacts: concepts and applications in coastal habitats. Academic Press: San Diego, CA; 1996: 235–55. Klump, DW, von Westernhagen H. Biological effects of pollutants in Australian coastal waters: Embryonic malformations and chromosomal aberrations in developing fish eggs. Mar Poll Bull. 1995; 30:158–65. Lobel PS, Kerr LM. Status of contaminants in Johnston Atoll lagoon sediments after 70 years of US military activity. Proceedings of the 9th International Coral Reef Symposium. Bali, Indonesia 23–27 October 2000. Vol 2. 2002: 861–66. Lobel PS, Kerr Lobel L. Aspects of the Biology and Geology of Johnston and Wake Atolls, Pacific Ocean. Chapter 17 In: Riegl BM, Dodge RE eds. Coral Reefs of the USA, Series: Coral Reefs of the World, Vol. 1 2008: 806pp. Longwell AC, Hughes JB. Cytologic, cytogenetic, and developmental state of Atlantic mackerel eggs from sea surface waters of the New York Bight, and prospects for biological effects monitoring with ichthyoplankton. Rapp P.-v Reun Cons Int Explor Mer. 1980; 179: 275–91. Schimmel SC, Hansen DJ, Forester J. Effects of Aroclor 1254 on laboratory reared embryos and fry of sheepshead minnows (Cyprinodon variegatus). Trans Am Fish Soc. 1974; 103(3): 582–6. Seitz A, Ratte HT. Aquatic ecotoxicology: on the problems of extrapolation from laboratory experiments with individuals and populations to community effects in the field. Compar Biochem Physiol. 1991; 100C(1/2): 301–4. Shaw ES. The embryology of the sergeant major, Abudefduf saxatilis. Copeia. 1955; 1955(2): 85–9. Spies RB, Rice DW. Effects of organic contamination on reproduction of the starry flounder (Platichthys stellatus) in San Francisco Bay.Part II. Reproductive success of fish captured in San Francisco Bay and spawned in the laboratory. Mar Biol. 1998; 98:191–200.

39
US EPA. Ecological Risk Assessment Guidance for Superfund: Process for Designing and Conducting Ecological Risk Assessments – Interim Final. Solid Waste and Emergency Response. 1997: EPA 540/R-97-006. US EPA. Methods for Evaluating Wetland Condition: Using Amphibians in Bioassessments of Wetlands. Office of Water, U.S. Environmental Protection Agency, Washington, DC. 2002: EPA-822-R-02-022. von Westernhagen H, Rosenthal H, Dethlefsen V, Ernst W, Harms U, Hansen PD. Bioaccumulating substances and reproductive success in Baltic flounder Platichthys flesus. Aquat Toxicol. 1981; 1:85–99. von Westernhagen, H, Dethlefsen V, Cameron P, Berg J, Fursternberg G. Developmental defects in pelagic fish embryos from the western Baltic. Helgo Meeres. 1988; 42:13–36. Weis JS, Weis P. Effects of environmental pollutants on early fish development. Crit Rev Aquatic Sci. 1989; 1: 45–73.

40
2011 American Academy of Underwater Sciences/Our World Underwater Scholarship Society Internship Report: Shannon Point Marine Center Jenna M. Walker, Nathan T. Schwarck* Shannon Point Marine Center, Western Washington University, 1900 Shannon Point Road, Anacortes WA 98221, USA [email protected] *corresponding author Abstract
From June 13th to August 18th Shannon Point Marine Center of Western Washington University hosted the 2011 American Academy of Underwater Sciences/Our World Underwater Scholarship Society Scientific Diving Internship in Anacortes, WA. The internship consisted of the following components: 1) general and specialized diving knowledge and skill development, 2) project specific dive training and assistance with diving research, and 3) introduction to scientific dive program management. The 2011 intern demonstrated expertise in all program areas by obtaining lead scientific diver status and additionally mastering the specialized knowledge and skill set of research tasks associated with the recovery of threatened pinto abalone Haliotis kamtschatkana. Also, by assisting the diving safety officer with dive program management, the intern was able to familiarize herself with the professional responsibilities of maintaining organizational membership with AAUS while balancing the needs and limitations of the institution. Keywords: AAUS training, dive program management, H. kamtschatkana
Diving Knowledge The AAUS scientific diving program has had a longstanding tradition of diver safety by way of rigorous education and training standards. In accordance with these standards the intern completed twelve training modules of the AAUS Scientific Diver Course through SPMC's scientific diving program. First aid requirements were met by obtaining certification through alternate training programs, specifically with Divers Alert Network (DAN) Diving First Aid for Professional Divers and On-Site Neurological Assessment courses encompassing basic first aid, CPR, AED procedures, hazardous marine life injuries, neurological exam techniques and emergency oxygen administration (Lang et al., 2007). Nitrox, Drysuit, Advanced Open Water, and Rescue Diver certifications were also completed by the intern, exceeding the minimum safety requirements of AAUS divers (PADI, 2010). Lead Diver Status and Local Environment Dive Planning While diving first aid and theory were emphasized during initial training, a wide range of applied diving skills were developed throughout the summer. A total of 51 dives were completed during the internship and lead diver responsibilities were assumed during 18 of the dives (Table 1). This included organizing dives, checking qualifications of individual divers, briefing all dive teams on dive plans and profiles, conducting safety checks, and forming dive specific emergency action plans (AAUS, 2009). Additionally, the intern learned specific diving limitations of the Pacific Northwest including seasonal minimum temperatures of 8°C and average visibility of 3–4 m. The primary
In: Pollock NW, ed. Diving for Science 2011. Proceedings of the American Academy of Underwater Sciences 30th Symposium. Dauphin Island, AL: AAUS; 2011.

41
safety concerns in local waters were strong currents and short average slack tide windows of 20–30 minutes between 0.5 knot ebb and 0.5 knot flood exchanges. The intern terminated two dives while acting as lead diver due to dangerous current conditions adhering to Section 2.30 of the AAUS Standards (AAUS, 2009).
Table 1. Summary of Internship Dives
Dive Category # Dives As Lead Diver Training Dives 12 0
Abalone Surveys 26 13 Brood Stock Collections 5 0 Water Quality Analysis 2 1
CTD Retrieval/Deployment 2 1 Intake Surveys 3 2
Organism Collection 1 1 Total 51 18
Practical Diving Skill Development Practical diving skills were continually improved during the internship through close mentoring scenarios. The SPMC DSO participated in all swimming examinations and presented a discussion on the health and safety benefits of maintaining diver fitness (Ma and Pollock, 2007). Advanced Open Water certification was obtained through search and recovery, night, drift, deep, and navigation specialty dives with the DSO (PADI, 2010). The safety officer also conducted several in-water training sessions incorporating check-out skills, rescue scenarios, and the divemaster level full equipment exchange while buddy breathing exercise. These individual training opportunities provided the intern with the ability to learn from their mistakes and develop effective problem solving skills, emphasizing the importance of mentoring in scientific diving (Pollock, 2007). Underwater Research: Native Pinto Abalone, Haliotis kamtschatkana A significant portion of the internship included working on native pinto abalone restoration efforts with the Puget Sound Restoration Fund and the Washington Department of Fish and Wildlife. One day was spent learning about current restoration projects and touring a NOAA hatchery facility designed for the threatened pinto abalone, H. kamtschatkana. This species reproduces by way of broadcast spawning and must live within close proximity of one another for successful egg fertilization (Rothaus et al., 2008). As such, the WDFW permits the PSRF to collect solitary adult abalone in order to assist with their hatchery efforts. The intern participated in five dives supporting these brood stock collections of reproductively isolated individuals within the San Juan Archipelago (Table 1). An alternative aspect of H. kamtschatkana recovery efforts involved assisting a National Science Foundation funded Research Experience for Undergraduates (REU) student with their research on pinto abalone. The intern conducted 26 research dives laying transects, surveying, and recovering gear related to pinto abalone monitoring projects (Table 1). In areas where hatchery raised H. kamtschatkana had been previously outplanted, the intern and REU student set up six 10 m x 10 m transects. The plots were divided into five 2.0 m lanes running north to south and each lane was surveyed for approximately 20 minutes at a rate of 1.0 m2·min-1. All sites were surveyed according to
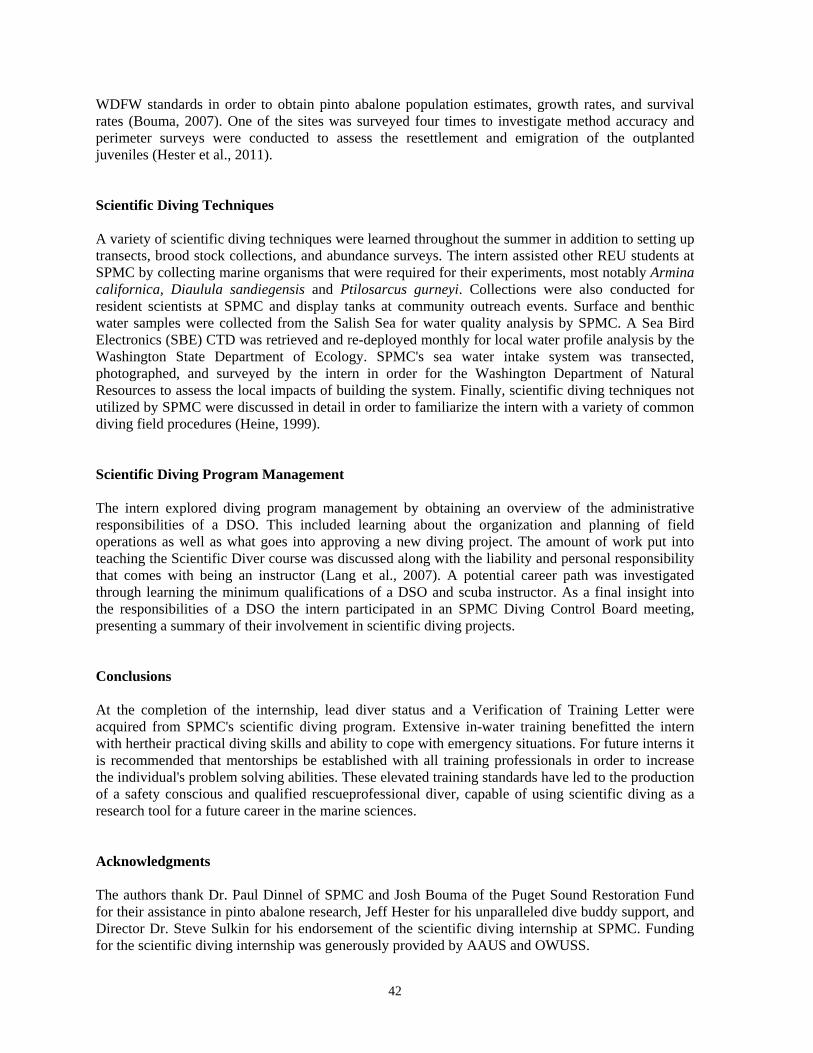
42
WDFW standards in order to obtain pinto abalone population estimates, growth rates, and survival rates (Bouma, 2007). One of the sites was surveyed four times to investigate method accuracy and perimeter surveys were conducted to assess the resettlement and emigration of the outplanted juveniles (Hester et al., 2011). Scientific Diving Techniques A variety of scientific diving techniques were learned throughout the summer in addition to setting up transects, brood stock collections, and abundance surveys. The intern assisted other REU students at SPMC by collecting marine organisms that were required for their experiments, most notably Armina californica, Diaulula sandiegensis and Ptilosarcus gurneyi. Collections were also conducted for resident scientists at SPMC and display tanks at community outreach events. Surface and benthic water samples were collected from the Salish Sea for water quality analysis by SPMC. A Sea Bird Electronics (SBE) CTD was retrieved and re-deployed monthly for local water profile analysis by the Washington State Department of Ecology. SPMC's sea water intake system was transected, photographed, and surveyed by the intern in order for the Washington Department of Natural Resources to assess the local impacts of building the system. Finally, scientific diving techniques not utilized by SPMC were discussed in detail in order to familiarize the intern with a variety of common diving field procedures (Heine, 1999). Scientific Diving Program Management The intern explored diving program management by obtaining an overview of the administrative responsibilities of a DSO. This included learning about the organization and planning of field operations as well as what goes into approving a new diving project. The amount of work put into teaching the Scientific Diver course was discussed along with the liability and personal responsibility that comes with being an instructor (Lang et al., 2007). A potential career path was investigated through learning the minimum qualifications of a DSO and scuba instructor. As a final insight into the responsibilities of a DSO the intern participated in an SPMC Diving Control Board meeting, presenting a summary of their involvement in scientific diving projects. Conclusions At the completion of the internship, lead diver status and a Verification of Training Letter were acquired from SPMC's scientific diving program. Extensive in-water training benefitted the intern with hertheir practical diving skills and ability to cope with emergency situations. For future interns it is recommended that mentorships be established with all training professionals in order to increase the individual's problem solving abilities. These elevated training standards have led to the production of a safety conscious and qualified rescueprofessional diver, capable of using scientific diving as a research tool for a future career in the marine sciences. Acknowledgments The authors thank Dr. Paul Dinnel of SPMC and Josh Bouma of the Puget Sound Restoration Fund for their assistance in pinto abalone research, Jeff Hester for his unparalleled dive buddy support, and Director Dr. Steve Sulkin for his endorsement of the scientific diving internship at SPMC. Funding for the scientific diving internship was generously provided by AAUS and OWUSS.

43
References American Academy of Underwater Sciences Standards for Scientific Diving. Sections 2.20 and 2.30. Pre-Dive Procedures and Diving Procedures, 2009. AAUS. Nahant, MA. www.aaus.org Bouma JV. Early life history dynamics of pinto abalone (Haliotis kamtschatkana) and implications for recovery in the San Juan archipelago, Washington state. M.S. Thesis. 2007. School of Aquatic and Fisheries Science, University of Washington, Seattle, WA. Heine JN. Scientific diving techniques: a practical guide for the research diver. 1999. Falgstaff, AZ. Hester JB, Dinnel PA, Walker JM, Schwarck NT. Survey of previously outplanted pinto (northern) abalone (Haliotis kamtschatkan) in the San Juan island archipelago, Washington state. 2011. Final Report: REU program, Shannon Point Marine Center, Western Washington University. Lang MA, Egstrom GH, McDonald CM. AAUS diving officer and scientific diver certifications: the need for quality control. In: Pollock NW, Godfrey JM, eds. Diving for Science 2007. Proceedings of the American Academy of Underwater Sciences 26th scientific meeting. Dauphin Is, AL: AAUS, 2007: 23–6. PADI. Advanced Open Water Manual, Nitrox Manual, and Rescue Diver Manual. 2010. Rancho Santa Margarita, CA. Pollock NW. Scientific diving safety: integrating institutional, team, and individual responsibility. In: Pollock NW, Godfrey JM, eds. Diving for Science 2007. Proceedings of the American Academy of Underwater Sciences 26th scientific meeting. Dauphin Is, AL: AAUS, 2007: 45–50. Ma AC, Pollock NW. Physical fitness of scientific divers: standards and shortcomings. In: Pollock NW, Godfrey JM, eds. Diving for Science 2007. Proceedings of the American Academy of Underwater Sciences 26th scientific meeting. Dauphin Is, AL: AAUS, 2007: 33–43. Rothaus DP, Vandopalas B, Friedman CS. Precipitous declines in pinto abalone (Haliotis kamtschatkana) abundance in the San Juan Archipelago, Washington, USA, despite statewide fishery closure. Can J Fish Aquatic Sci. 2008; 65(12): 2703–11.
44
Use of Tethered Scuba for Scientific Diving Sean Sheldrake1*, Rob Pedersen1, Chad Schulze1, Steven Donohue2, Alan Humphrey3 1 USEPA, Region 10, 1200 6th Avenue, Suite 900, Mailstop ECL-110, Seattle, WA 98101, USA www.epa.gov/region10/dive, [email protected] 2 USEPA, Region 3, Environmental Assessment and Innovation Division, 1650 Arch Street, Philadelphia, PA 19103–2029 USA 3 USEPA, Environmental Response Team, 2890 Woodbridge Ave, Edison, NJ 08837, USA *corresponding author Abstract
Many scientific diving entities face logistical challenges in their data collection including high currents, low visibility, and high entanglement areas. We will discuss standard practices for use of tethered scuba for scientific applications to enhance both efficiency and safety of the scientific diver. We will examine relevant regulatory requirements and applicable standards of the federal dive community (e.g., NOAA, EPA) relative to the application to scientific diving. Finally, we will make recommendations to advance this diving mode within the scientific diving community. Keywords: contaminated water protocols, decontamination, EPA diving, federal dive programs, polluted water diving, tethered scuba
Introduction Tethered scuba diving is a tended diving method where one diver in the water is line tended by surface personnel and directed to perform a variety of underwater tasks, which could include light work or scientific tasks. OSHA also requires that standby divers for working dives be line tended. This method is much like that of surface supplied diving in many ways other than the virtually unlimited air supply. Typical tethered diving equipment, personnel, and procedure is described below. Methods The tethered scuba mode requires particular equipment and protocols, further discussed below. Equipment Tethered scuba diving equipment nominally includes standard diver dress, e.g., wetsuit/drysuit, fins, and weight belt, as well as particular equipment to tethered diving needs. These other items include a full face mask with voice communications, strength member with quick release snap shackle tether, hardwired or wireless communications, and man-rated safety harness rated for lifting the diver from the water. In addition, a cutting device is recommended for the diver within easy reach, e.g., EMT shears mounted on the harness.
In: Pollock NW, ed. Diving for Science 2011. Proceedings of the American Academy of Underwater Sciences 30th Symposium. Dauphin Island, AL: AAUS; 2011.
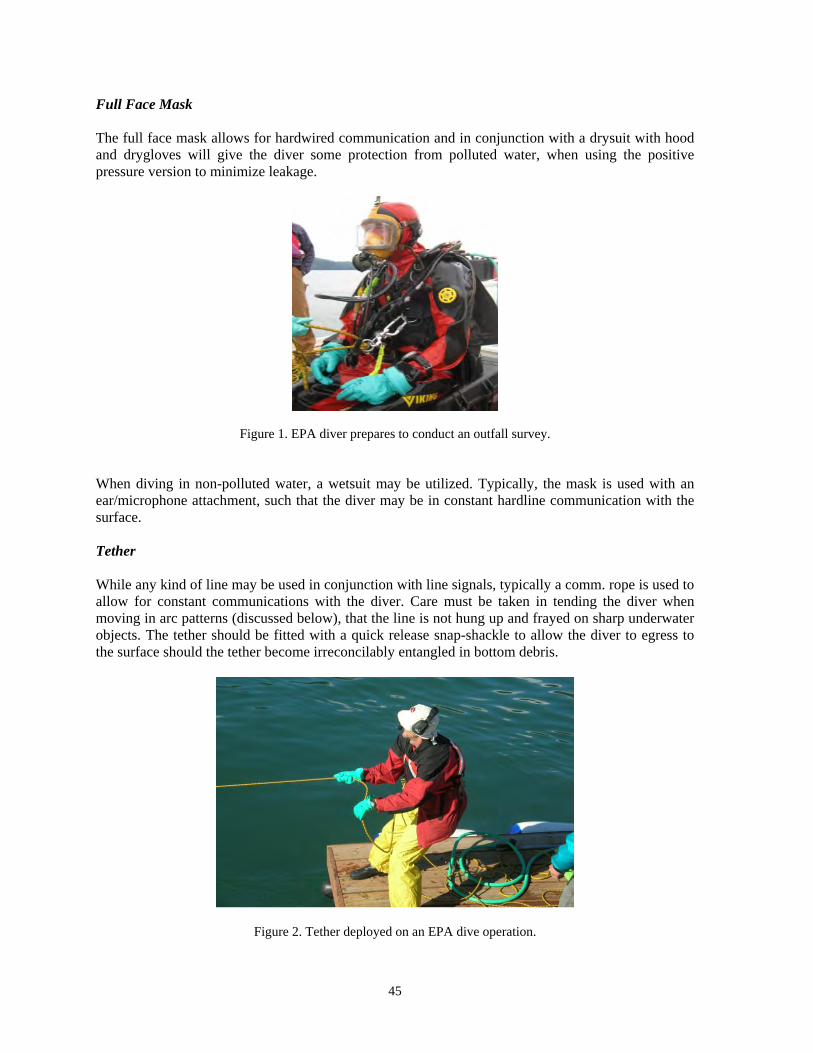
45
Full Face Mask The full face mask allows for hardwired communication and in conjunction with a drysuit with hood and drygloves will give the diver some protection from polluted water, when using the positive pressure version to minimize leakage.
Figure 1. EPA diver prepares to conduct an outfall survey. When diving in non-polluted water, a wetsuit may be utilized. Typically, the mask is used with an ear/microphone attachment, such that the diver may be in constant hardline communication with the surface. Tether While any kind of line may be used in conjunction with line signals, typically a comm. rope is used to allow for constant communications with the diver. Care must be taken in tending the diver when moving in arc patterns (discussed below), that the line is not hung up and frayed on sharp underwater objects. The tether should be fitted with a quick release snap-shackle to allow the diver to egress to the surface should the tether become irreconcilably entangled in bottom debris.
Figure 2. Tether deployed on an EPA dive operation.

46
The tether may also be marked in intervals for measuring distances used in search patterns, for example. Tethers can be made in most any length, though 200 and 300 ft tethers are typical for most dive operations. Generally, the tether required must be the distance from the dive platform added to the depth to the dive site multiplied by 1.5 (NOAA, 2009), e.g., 50 ft from the dive site at a 50 ft depth would be 150 ft of tether. A tether longer than 300 ft can present some span of control problems with a dive platform under anchor, in adequately fending off nearby vessel traffic in a timely fashion. The tether should be stowed in a bucket or bag of some kind, with the tender end going in first, diver end last, to keep it from being stepped on and damaged, and to avoid tripping/falling hazards on the dive platform. The container should allow for easy decontamination and segregation of contaminated line from other gear. Communications Unit The communications unit is utilized by the tender while tending the diver's line to maintain constant verbal communication with the diver and standby diver. The tender communications unit allows the tender to talk with the diver via a headset and belt clip communications unit. The tender unit typically uses replaceable batteries, which should be changed out on a daily basis to ensure constant communications. The vessel should have one set of batteries per day for the dive operation, plus one spare set. Care should also be taken when installing batteries in the unit, as the battery compartment soldering can be quite fragile. Rechargeable batteries are beneficial for this purpose to minimize waste generation from daily dive operations. When connecting the headset to the belt clip unit, a "squeal" should initially be heard as the unit powers on. Absence of this sound can indicate that the batteries are dead, or that the unit is otherwise not functioning. When the unit is not in use, the headset should be disconnected from the belt clip unit to conserve battery power. Harness A diver harness is necessary to connect the diver securing to the tether line. Buoyancy compensation device (BCD) D-rings are inadequate strength members for this task, as they cannot support the diver's entire weight and dynamic load when the tender needs to quickly retrieve the diver.
Figure 3. EPA diver with a harness on, preparing to dress in.

47
Breakage of a BCD D-ring could result in serious injury to the diver, as the diver's head is connected to the tether via the communications cable, absent the secure harness connection. The harness is worn underneath the BCD or backpack on top of the wetsuit or drysuit. The harness should be rated to pull the diver from the water, in the event of an emergency on the surface or beneath the water. Emergency Gas Supply An emergency gas supply (EGS) is necessary for tethered diving operations should the primary air supply be exhausted. The EGS supply is typically controlled through a manifold block, connected to the BCD. The manifold block should have a one way valve, such that opening the block does not equalize the primary and EGS cylinders. The EGS itself may be a pony bottle connected to a larger primary bottle up to a fully redundant scuba bottle, depending on diving depth, and should include an overpressure relief valve on the first stage (Barsky, 2007). The overpressure relief valve allows pressure to escape should the emergency gas supply first stage malfunction and send higher intermediate pressures down the hose to the manifold block, which could rupture a hose.
Figure 4. A yellow 30 ft3 (cf) EGS bottle pictured on an EPA Superfund Site sampling project on the Willamette River, Oregon.
The EGS bottle is left open for diving, while the manifold block is in the closed position, such that the diver is breathing off the primary air supply, but may access the reserve supply by simply turning the manifold knob, similar to a surface supply configuration. This is different than a non full face mask (FFM) configuration, where the pony bottle is normally left off (e.g., NOAA mouthpiece reserve air supply system or RASS) to prevent a free flow from emptying the reserve supply. A smaller EGS may be adequate for shallow diving, while a 30 ft3 or larger size tank could be used at or below 100 ft. The size of the bail-out bottle is determined based upon the type of water, i.e., contaminated vs. non-contaminated, working depth, type of equipment, i.e., FFM vs. helmet and the air consumption rate of the individual diver. The EGS should be mounted upside down such that the diver can reach the tank valve, should it accidentally be left closed or bumped while underwater. A submerged pressure gauge must also be in plain view of the diver so that they may see the current status of their EGS bottle. For example, if the manifold block is bumped, the diver may start
48
breathing off the EGS without their knowledge. Frequent checking of the primary gas supply SPG, bail-out block and EGS SPG will help to ensure that the diver is continuously breathing off the primary air supply. Also, as tethered diving is often used for low visibility situations, analog gauges should be used as digital gauges cannot be read when pressing the gauge directly against the FFM in true blackout conditions. For diving with a drysuit, the inflator whip should be connected to the manifold block such that suit inflation may still be achieved when using the EGS. Personnel Typically tethered diving operations consist of a three person team, the diver, the standby diver, and the divemaster/tender. Each diver will be continuously tended while in the water. Diver The diver, unlike in the conventional scuba diving buddy system, will be diving alone. This takes some adjustment for the diver, and reminders from their divemaster that they will be in constant communication with the surface. While this is planned vs. unplanned, e.g., buddy diving in low visibility water where buddy contact is soon lost, taking the dive slowly and not rushing through tasks is key to avoiding panic, but also in minimizing air consumption. While the diver is still responsible for checking their air supply and reporting this to topside support, unlike surface supplied diving, other adjustments are needed. Often the dive may be controlled from the surface depending upon the task being performed. If the dive is primarily surface controlled, the diver will need to adjust to not being primarily in control of their dive, i.e., the divemaster will be in constant communication with them, and will instruct the diver what to do, and when to do it. As with all dives, the diver or divemaster may end the dive for any reason. Tender/Divemaster The divemaster/tender will assist the diver in dressing in, tending the line, and doffing gear at the end of the dive. The tender should also be a diver prepared to dive each day, especially for deeper dive profiles. Divemaster responsibilities are the same as generally defined for buddy type scuba operations e.g., the divemaster continues to be in charge of the overall dive, except that they can hear the diver throughout the dive, and should be monitoring the diver constantly for signs of anxiety.
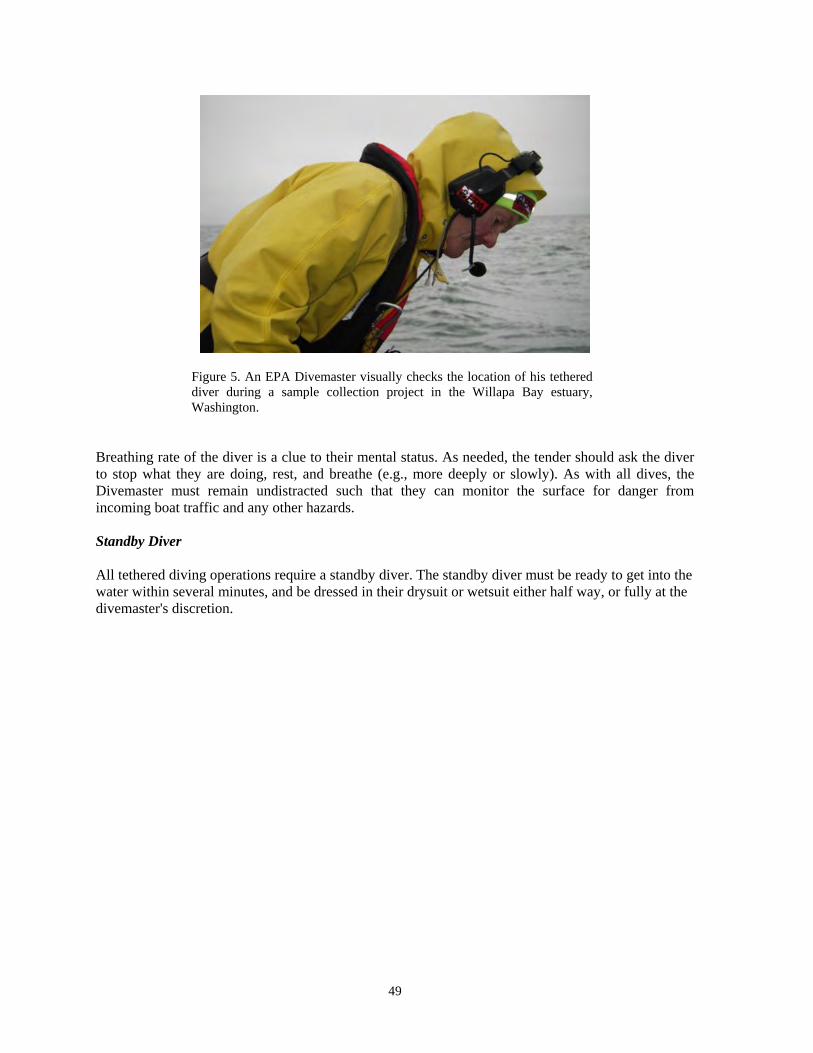
49
Figure 5. An EPA Divemaster visually checks the location of his tethered diver during a sample collection project in the Willapa Bay estuary, Washington.
Breathing rate of the diver is a clue to their mental status. As needed, the tender should ask the diver to stop what they are doing, rest, and breathe (e.g., more deeply or slowly). As with all dives, the Divemaster must remain undistracted such that they can monitor the surface for danger from incoming boat traffic and any other hazards. Standby Diver All tethered diving operations require a standby diver. The standby diver must be ready to get into the water within several minutes, and be dressed in their drysuit or wetsuit either half way, or fully at the divemaster's discretion.

50
Figure 6. An EPA standby diver fully dressed in at left/tender at right, Cordova, Alaska.
Procedures As noted above, the tethered diving operation normally involves at least three divers. This allows for safe and efficient diving by rotating through the crew of 3, especially for deeper dive profiles. The 3 person rotation allows for ample surface intervals for the diver who has just dived, and then becomes the Divemaster/Tender, the diver who has been out of the water for the duration of the last dive, who becomes the standby diver, and the diver, who has been out of the water for at least two dives worth of time. Donning Gear and Water Entry/Descent The tender and standby diver assist the diver in donning gear as needed. Special attention is paid to placement and setting of the manifold block/EGS and verification that the diver can reach the block and EGS valves easily, and without looking, as tethered diving is often used in low visibility environments. The primary and EGS tank pressures are checked and recorded. Communications checks are performed and volumes/ear piece placement adjusted as needed. The diver is deployed with an extra loop of line available (to avoid jerking the diver during descent) and the tender arrests their descent into the water via the tether line and holds them at the surface until they can complete a mask check.

51
Figure 7. The tender uses both hands to arrest the diver's entry at the surface, with legs spread apart for balance.
The tender uses both hands to tend the line, so as to ensure that the diver is firmly held in place. The tether line is never wound around the tender in any way for two reasons: 1) the line may be contaminated, and this could leave polluted water and sediment on the tender, and 2), the tender could be pulled into the water with the line wound around them. The tender should use gloves to prevent chafing, and these should be covered by disposable gloves if there is any chance of contamination in surface water or sediment. Likewise, the tether should be managed in a portion of the dive platform considered to be the "hot zone" where it can be appropriately decontaminated and otherwise managed without tracking contamination throughout the vessel during tending at contaminated sites. The diver controls the rate of descent, including making requests for the amount and rate of slack given by the surface to ensure too much line is not paid into the water column, resulting in entanglements. On the Bottom Directing the diver is undertaken in a different manner than in buddy type scuba operations, where movements are relative to the tethered line itself. For example, the tender may instruct the diver to swim "toward the line," "away from the line," "take a 90 right," "take a 90 left," and so on. The diver trusts that the surface can direct them where they need to go, as in conducting a search pattern, "Hold line tension, and swim with the tether at your left." Surface may ask the diver to conduct search patterns via an arc, sweep, or out and back methods, using these line signals. Based on whether there is visibility on the bottom, this will determine the distance between diver sweeps (Hendrick, 2000).
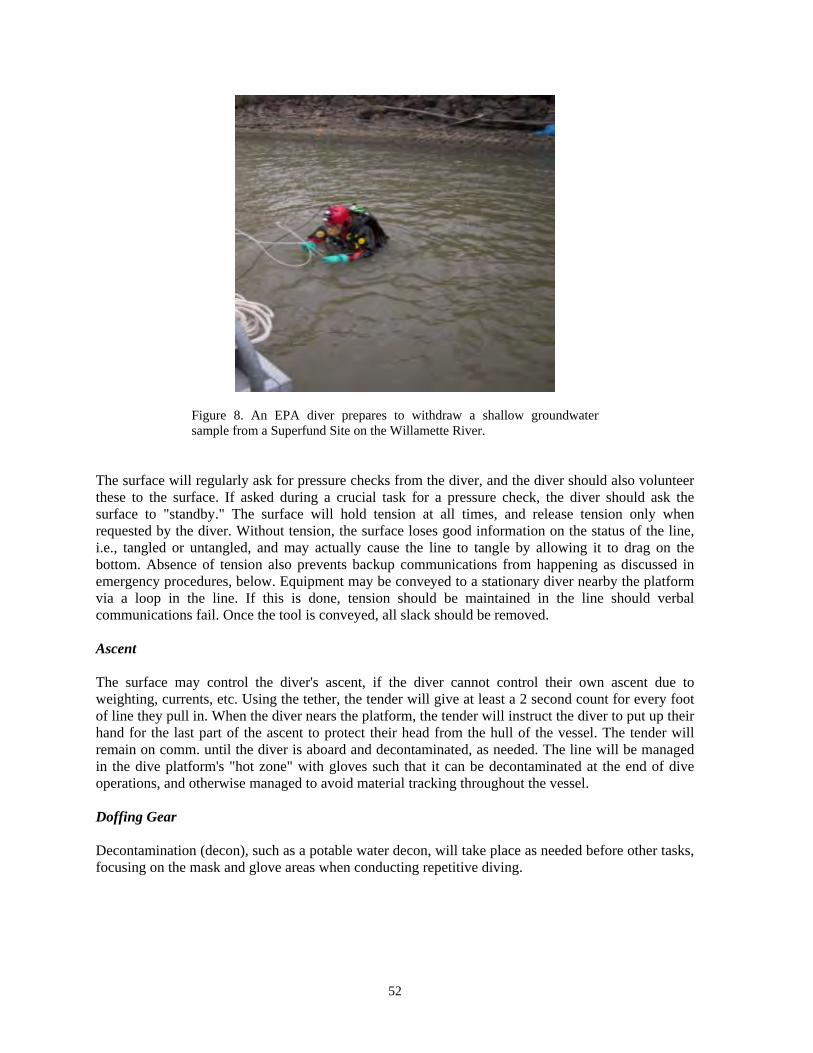
52
Figure 8. An EPA diver prepares to withdraw a shallow groundwater sample from a Superfund Site on the Willamette River.
The surface will regularly ask for pressure checks from the diver, and the diver should also volunteer these to the surface. If asked during a crucial task for a pressure check, the diver should ask the surface to "standby." The surface will hold tension at all times, and release tension only when requested by the diver. Without tension, the surface loses good information on the status of the line, i.e., tangled or untangled, and may actually cause the line to tangle by allowing it to drag on the bottom. Absence of tension also prevents backup communications from happening as discussed in emergency procedures, below. Equipment may be conveyed to a stationary diver nearby the platform via a loop in the line. If this is done, tension should be maintained in the line should verbal communications fail. Once the tool is conveyed, all slack should be removed. Ascent The surface may control the diver's ascent, if the diver cannot control their own ascent due to weighting, currents, etc. Using the tether, the tender will give at least a 2 second count for every foot of line they pull in. When the diver nears the platform, the tender will instruct the diver to put up their hand for the last part of the ascent to protect their head from the hull of the vessel. The tender will remain on comm. until the diver is aboard and decontaminated, as needed. The line will be managed in the dive platform's "hot zone" with gloves such that it can be decontaminated at the end of dive operations, and otherwise managed to avoid material tracking throughout the vessel. Doffing Gear Decontamination (decon), such as a potable water decon, will take place as needed before other tasks, focusing on the mask and glove areas when conducting repetitive diving.

53
Figure 9. An EPA diver exits the water. Note the manifold block at picture center allowing the full face mask to be fed air from the primary or EGS tanks as needed.
The tender will ensure that the diver leaves the bottom with sufficient pressure to undergo whatever type of decon deemed necessary. Vessel Operations Vessel operations necessitate important tethered diving safety procedures, which include: 1. All boat/ship propellers must be deactivated prior to initiating dive operations. 2. A small boat must be on anchor before deploying the tethered diver. 3. Ships do not need to be on anchor for a ship husbandry dive, e.g., clearing a fouled propeller
in deep water. 4. A bow and stern line should be available. While it is not required to be at a two-point or
greater anchor configuration, sudden wind changes may necessitate a two point anchoring system to complete a dive safely.
5. If the boat were to swing on its anchor, it is important that sufficient slack is given and/or tension is kept on the diver to ensure they are not swept away in current, or subjected to sudden changes in pressure.
6. When operating near channel, a "Security" call should be made to all concerned traffic over VHF channel 16 and vessel traffic and channel 16 communications should be monitored to determine if large vessels are inbound.
7. An Alpha Flag (blue and white) as well as the standard diver down flag must be flown from the vessel during dive operations.
As the dive platform cannot fend off other boat traffic by means of physical presence, care should be given how far channel-ward a tethered diver is allowed to travel. Consideration of notice to mariners, broadcast of an encumbered vessel status either via VHF and/or automatic identification system (AIS) could also be considered.
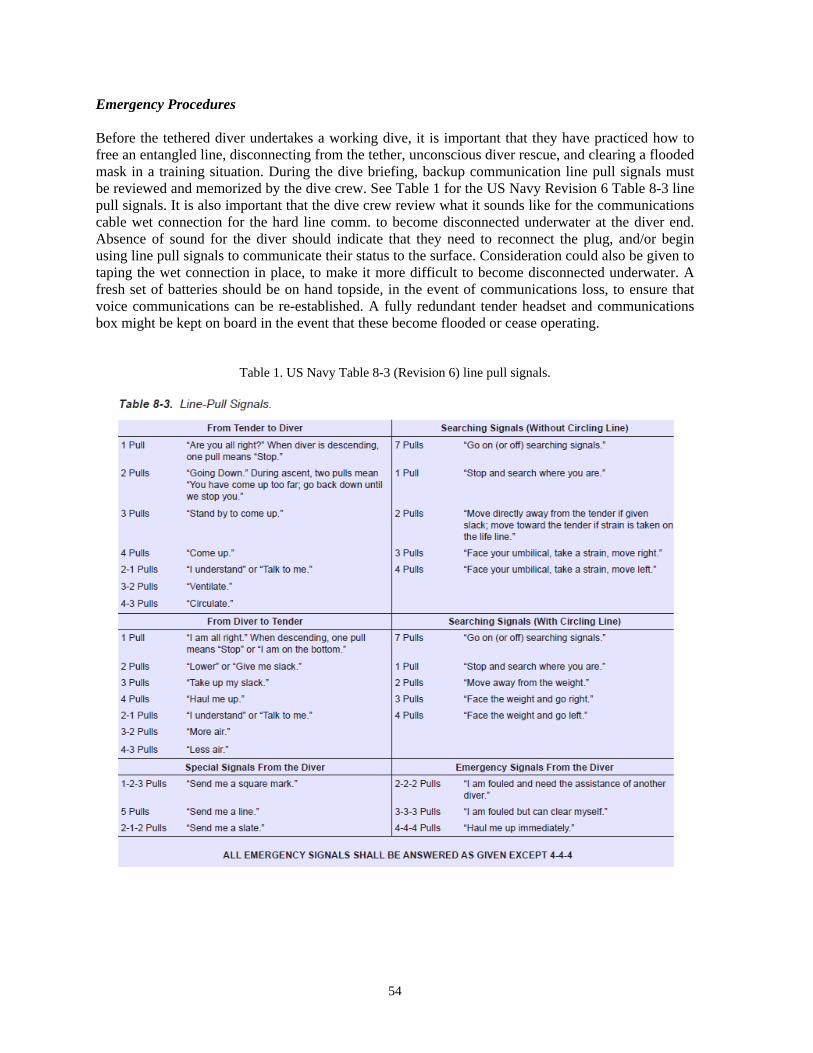
54
Emergency Procedures Before the tethered diver undertakes a working dive, it is important that they have practiced how to free an entangled line, disconnecting from the tether, unconscious diver rescue, and clearing a flooded mask in a training situation. During the dive briefing, backup communication line pull signals must be reviewed and memorized by the dive crew. See Table 1 for the US Navy Revision 6 Table 8-3 line pull signals. It is also important that the dive crew review what it sounds like for the communications cable wet connection for the hard line comm. to become disconnected underwater at the diver end. Absence of sound for the diver should indicate that they need to reconnect the plug, and/or begin using line pull signals to communicate their status to the surface. Consideration could also be given to taping the wet connection in place, to make it more difficult to become disconnected underwater. A fresh set of batteries should be on hand topside, in the event of communications loss, to ensure that voice communications can be re-established. A fully redundant tender headset and communications box might be kept on board in the event that these become flooded or cease operating.
Table 1. US Navy Table 8-3 (Revision 6) line pull signals.
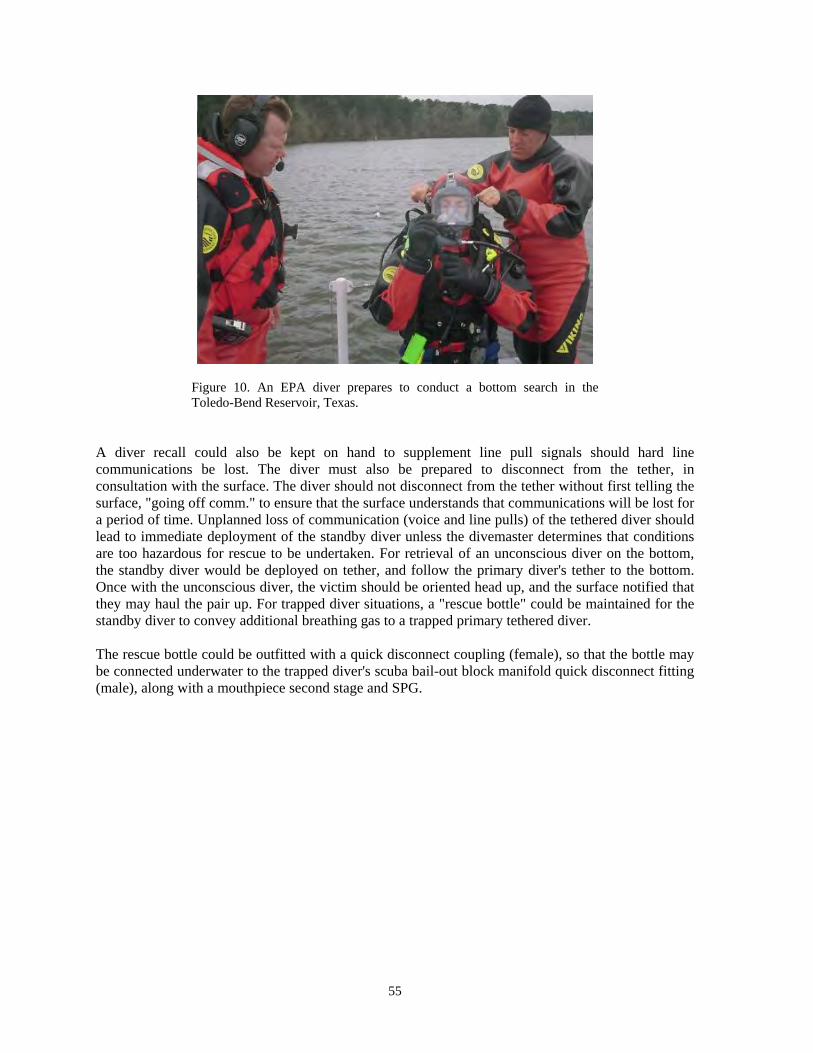
55
Figure 10. An EPA diver prepares to conduct a bottom search in the Toledo-Bend Reservoir, Texas.
A diver recall could also be kept on hand to supplement line pull signals should hard line communications be lost. The diver must also be prepared to disconnect from the tether, in consultation with the surface. The diver should not disconnect from the tether without first telling the surface, "going off comm." to ensure that the surface understands that communications will be lost for a period of time. Unplanned loss of communication (voice and line pulls) of the tethered diver should lead to immediate deployment of the standby diver unless the divemaster determines that conditions are too hazardous for rescue to be undertaken. For retrieval of an unconscious diver on the bottom, the standby diver would be deployed on tether, and follow the primary diver's tether to the bottom. Once with the unconscious diver, the victim should be oriented head up, and the surface notified that they may haul the pair up. For trapped diver situations, a "rescue bottle" could be maintained for the standby diver to convey additional breathing gas to a trapped primary tethered diver. The rescue bottle could be outfitted with a quick disconnect coupling (female), so that the bottle may be connected underwater to the trapped diver's scuba bail-out block manifold quick disconnect fitting (male), along with a mouthpiece second stage and SPG.
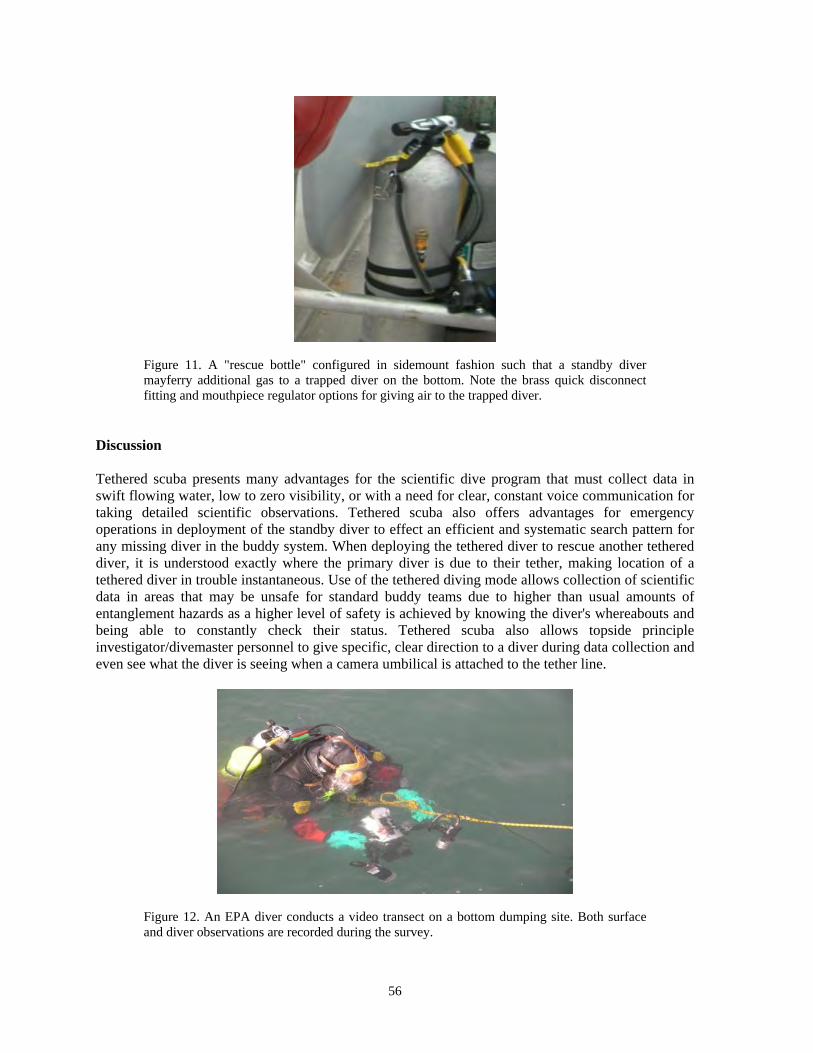
56
Figure 11. A "rescue bottle" configured in sidemount fashion such that a standby diver mayferry additional gas to a trapped diver on the bottom. Note the brass quick disconnect fitting and mouthpiece regulator options for giving air to the trapped diver.
Discussion Tethered scuba presents many advantages for the scientific dive program that must collect data in swift flowing water, low to zero visibility, or with a need for clear, constant voice communication for taking detailed scientific observations. Tethered scuba also offers advantages for emergency operations in deployment of the standby diver to effect an efficient and systematic search pattern for any missing diver in the buddy system. When deploying the tethered diver to rescue another tethered diver, it is understood exactly where the primary diver is due to their tether, making location of a tethered diver in trouble instantaneous. Use of the tethered diving mode allows collection of scientific data in areas that may be unsafe for standard buddy teams due to higher than usual amounts of entanglement hazards as a higher level of safety is achieved by knowing the diver's whereabouts and being able to constantly check their status. Tethered scuba also allows topside principle investigator/divemaster personnel to give specific, clear direction to a diver during data collection and even see what the diver is seeing when a camera umbilical is attached to the tether line.
Figure 12. An EPA diver conducts a video transect on a bottom dumping site. Both surface and diver observations are recorded during the survey.
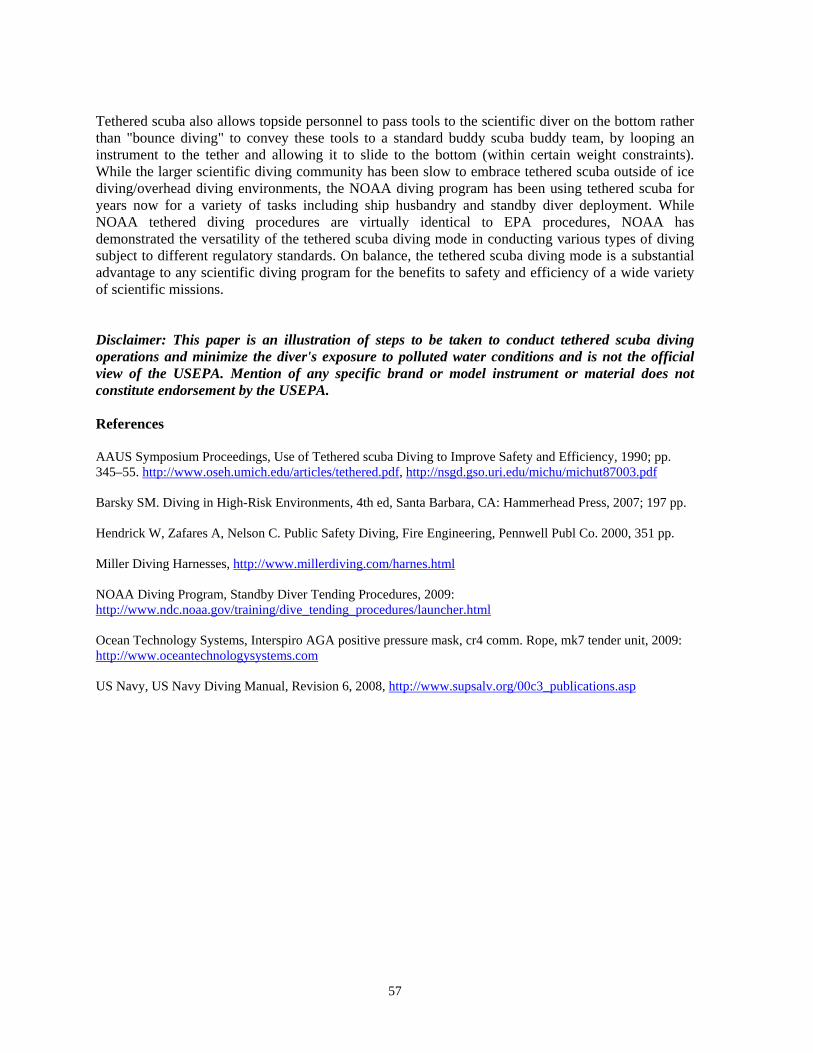
57
Tethered scuba also allows topside personnel to pass tools to the scientific diver on the bottom rather than "bounce diving" to convey these tools to a standard buddy scuba buddy team, by looping an instrument to the tether and allowing it to slide to the bottom (within certain weight constraints). While the larger scientific diving community has been slow to embrace tethered scuba outside of ice diving/overhead diving environments, the NOAA diving program has been using tethered scuba for years now for a variety of tasks including ship husbandry and standby diver deployment. While NOAA tethered diving procedures are virtually identical to EPA procedures, NOAA has demonstrated the versatility of the tethered scuba diving mode in conducting various types of diving subject to different regulatory standards. On balance, the tethered scuba diving mode is a substantial advantage to any scientific diving program for the benefits to safety and efficiency of a wide variety of scientific missions. Disclaimer: This paper is an illustration of steps to be taken to conduct tethered scuba diving operations and minimize the diver's exposure to polluted water conditions and is not the official view of the USEPA. Mention of any specific brand or model instrument or material does not constitute endorsement by the USEPA. References AAUS Symposium Proceedings, Use of Tethered scuba Diving to Improve Safety and Efficiency, 1990; pp. 345–55. http://www.oseh.umich.edu/articles/tethered.pdf, http://nsgd.gso.uri.edu/michu/michut87003.pdf Barsky SM. Diving in High-Risk Environments, 4th ed, Santa Barbara, CA: Hammerhead Press, 2007; 197 pp. Hendrick W, Zafares A, Nelson C. Public Safety Diving, Fire Engineering, Pennwell Publ Co. 2000, 351 pp. Miller Diving Harnesses, http://www.millerdiving.com/harnes.html NOAA Diving Program, Standby Diver Tending Procedures, 2009: http://www.ndc.noaa.gov/training/dive_tending_procedures/launcher.html Ocean Technology Systems, Interspiro AGA positive pressure mask, cr4 comm. Rope, mk7 tender unit, 2009: http://www.oceantechnologysystems.com US Navy, US Navy Diving Manual, Revision 6, 2008, http://www.supsalv.org/00c3_publications.asp

58
Use of Surface-Supplied Gas for Scientific Diving Alan Humphrey1*, Scott Grossman2, Jonathan McBurney2, Sean Sheldrake3 1 USEPA, Environmental Response Team, 2890 Woodbridge Avenue, Edison, NJ 08837, USA [email protected] 2 Lockheed Martin SERAS, 2890 Woodbridge Avenue, Edison, NJ 08837, USA 3 USEPA, Region 10, 1200 6th Avenue, Suite 900, Mailstop ECL-110, Seattle, WA 98101, USA *corresponding author Abstract
Many scientific diving entities face logistical challenges in their data collection, including high currents, low visibility, finite air supply, and high entanglement areas. This paper and presentation will discuss standard practices for the use of surface-supplied breathing gas for scientific applications to enhance both safety and efficiency of the scientific diver. The paper will examine the relevant regulatory requirements and applicable standards of the federal dive community (e.g., NOAA, EPA) relative to the application of scientific diving, as well as some pros/cons for the scientific diver of tether vs. surface-supply vs. free swimming. Lastly, the paper will make recommendations to advance the surface-supplied breathing gas mode within the scientific diving community. Keywords: contaminated water protocols, epa diving, federal dive programs polluted diving, surface-supplied diving, surface-supplied gas
Introduction Surface-supplied diving is unique compared to free swimming scientific divers' more routine use of self-contained underwater breathing apparatus (SCUBA) to accomplish their objectives. Using surface-supplied air, the diver is provided a virtually unlimited supply of breathing gas from tanks or a compressor on the surface through a three-part umbilical consisting of a breathing gas hose, a pneumofathometer (pneumo) hose and communication line (comm line)/strength member to the diver.
Figure 1. EPA conducting surface-supplied dive operations aboard the EPA vessel Biglane.
In: Pollock NW, ed. Diving for Science 2011. Proceedings of the American Academy of Underwater Sciences 30th Symposium. Dauphin Island, AL: AAUS; 2011.

59
This paper presents the equipment and methodology used by EPA dive teams engaged in surface-supplied diving and discusses the potential advantages and disadvantages of this mode of diving. The methods presented are specific to the equipment used by the EPA dive teams but are generally applicable to any surface-supply equipment and will be useful in selecting equipment and developing methodology for any system. For the most up-to-date information, the EPA Dive Safety Manual and EPA Dive Standard Operating Procedures should be consulted (US Environmental Protection Agency, 2010). Methods Equipment
Figure 2. An EPA surface-supplied diver prepares to enter the water to collect sediment core samples at a Superfund site in New Jersey.
Depending on the planned dive profile, EPA typically uses air or enriched air (nitrox up to 40% oxygen), provided the equipment is approved by the manufacturer for that oxygen concentration and/or has been oxygen cleaned. Check the specifications or contact the manufacturer of the control box before using nitrox. Gas may be supplied to the control box by pressurized tanks (working pressure can range from 3,000 pounds per square inch [psi] to 3,500 psi; check the manufacturer specifications for details), low pressure/high volume compressors, or a compressor/tank system. All breathing gases must be either generated on-site with a compressor, or purchased through a reputable dive shop or commercial gas supplier. Compressor-generated breathing gas is required to be analyzed to CGA grade E standards at least once every six months. Dive operations shall not be initiated unless there is a sufficient supply of breathing gas for all divers, including stand-by divers and emergency reserve.
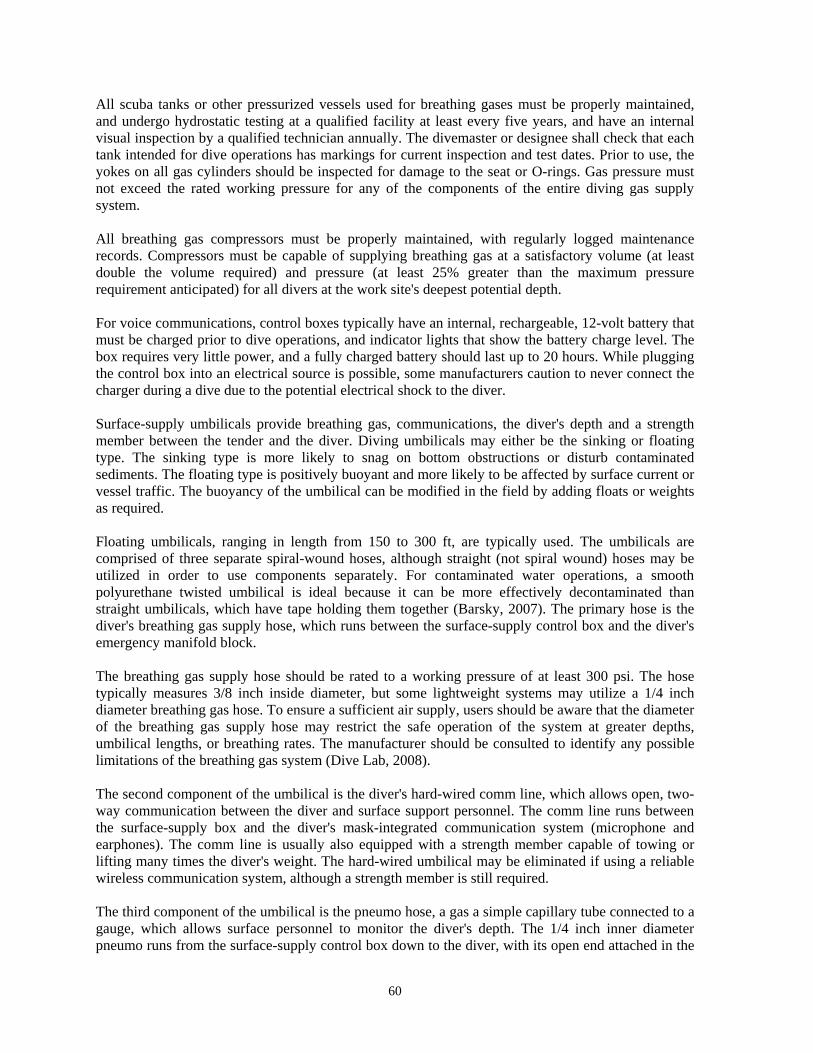
60
All scuba tanks or other pressurized vessels used for breathing gases must be properly maintained, and undergo hydrostatic testing at a qualified facility at least every five years, and have an internal visual inspection by a qualified technician annually. The divemaster or designee shall check that each tank intended for dive operations has markings for current inspection and test dates. Prior to use, the yokes on all gas cylinders should be inspected for damage to the seat or O-rings. Gas pressure must not exceed the rated working pressure for any of the components of the entire diving gas supply system. All breathing gas compressors must be properly maintained, with regularly logged maintenance records. Compressors must be capable of supplying breathing gas at a satisfactory volume (at least double the volume required) and pressure (at least 25% greater than the maximum pressure requirement anticipated) for all divers at the work site's deepest potential depth. For voice communications, control boxes typically have an internal, rechargeable, 12-volt battery that must be charged prior to dive operations, and indicator lights that show the battery charge level. The box requires very little power, and a fully charged battery should last up to 20 hours. While plugging the control box into an electrical source is possible, some manufacturers caution to never connect the charger during a dive due to the potential electrical shock to the diver. Surface-supply umbilicals provide breathing gas, communications, the diver's depth and a strength member between the tender and the diver. Diving umbilicals may either be the sinking or floating type. The sinking type is more likely to snag on bottom obstructions or disturb contaminated sediments. The floating type is positively buoyant and more likely to be affected by surface current or vessel traffic. The buoyancy of the umbilical can be modified in the field by adding floats or weights as required. Floating umbilicals, ranging in length from 150 to 300 ft, are typically used. The umbilicals are comprised of three separate spiral-wound hoses, although straight (not spiral wound) hoses may be utilized in order to use components separately. For contaminated water operations, a smooth polyurethane twisted umbilical is ideal because it can be more effectively decontaminated than straight umbilicals, which have tape holding them together (Barsky, 2007). The primary hose is the diver's breathing gas supply hose, which runs between the surface-supply control box and the diver's emergency manifold block. The breathing gas supply hose should be rated to a working pressure of at least 300 psi. The hose typically measures 3/8 inch inside diameter, but some lightweight systems may utilize a 1/4 inch diameter breathing gas hose. To ensure a sufficient air supply, users should be aware that the diameter of the breathing gas supply hose may restrict the safe operation of the system at greater depths, umbilical lengths, or breathing rates. The manufacturer should be consulted to identify any possible limitations of the breathing gas system (Dive Lab, 2008). The second component of the umbilical is the diver's hard-wired comm line, which allows open, two-way communication between the diver and surface support personnel. The comm line runs between the surface-supply box and the diver's mask-integrated communication system (microphone and earphones). The comm line is usually also equipped with a strength member capable of towing or lifting many times the diver's weight. The hard-wired umbilical may be eliminated if using a reliable wireless communication system, although a strength member is still required. The third component of the umbilical is the pneumo hose, a gas a simple capillary tube connected to a gauge, which allows surface personnel to monitor the diver's depth. The 1/4 inch inner diameter pneumo runs from the surface-supply control box down to the diver, with its open end attached in the
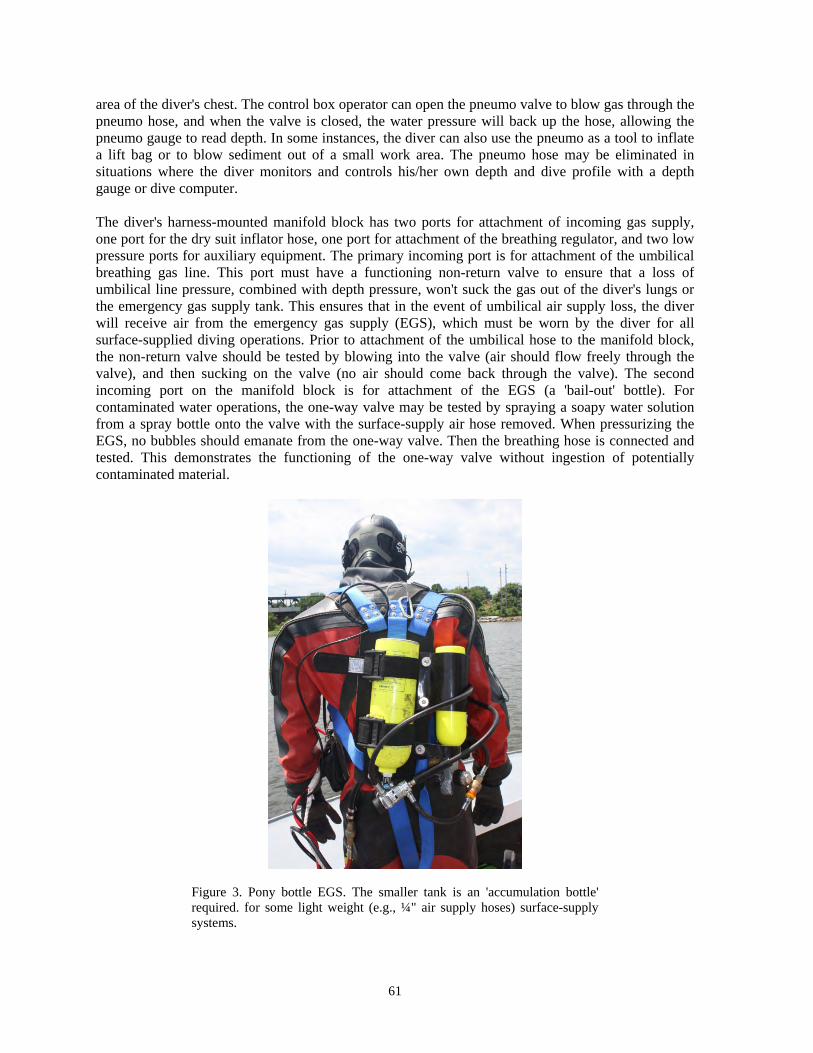
61
area of the diver's chest. The control box operator can open the pneumo valve to blow gas through the pneumo hose, and when the valve is closed, the water pressure will back up the hose, allowing the pneumo gauge to read depth. In some instances, the diver can also use the pneumo as a tool to inflate a lift bag or to blow sediment out of a small work area. The pneumo hose may be eliminated in situations where the diver monitors and controls his/her own depth and dive profile with a depth gauge or dive computer. The diver's harness-mounted manifold block has two ports for attachment of incoming gas supply, one port for the dry suit inflator hose, one port for attachment of the breathing regulator, and two low pressure ports for auxiliary equipment. The primary incoming port is for attachment of the umbilical breathing gas line. This port must have a functioning non-return valve to ensure that a loss of umbilical line pressure, combined with depth pressure, won't suck the gas out of the diver's lungs or the emergency gas supply tank. This ensures that in the event of umbilical air supply loss, the diver will receive air from the emergency gas supply (EGS), which must be worn by the diver for all surface-supplied diving operations. Prior to attachment of the umbilical hose to the manifold block, the non-return valve should be tested by blowing into the valve (air should flow freely through the valve), and then sucking on the valve (no air should come back through the valve). The second incoming port on the manifold block is for attachment of the EGS (a 'bail-out' bottle). For contaminated water operations, the one-way valve may be tested by spraying a soapy water solution from a spray bottle onto the valve with the surface-supply air hose removed. When pressurizing the EGS, no bubbles should emanate from the one-way valve. Then the breathing hose is connected and tested. This demonstrates the functioning of the one-way valve without ingestion of potentially contaminated material.
Figure 3. Pony bottle EGS. The smaller tank is an 'accumulation bottle' required. for some light weight (e.g., ¼" air supply hoses) surface-supply systems.
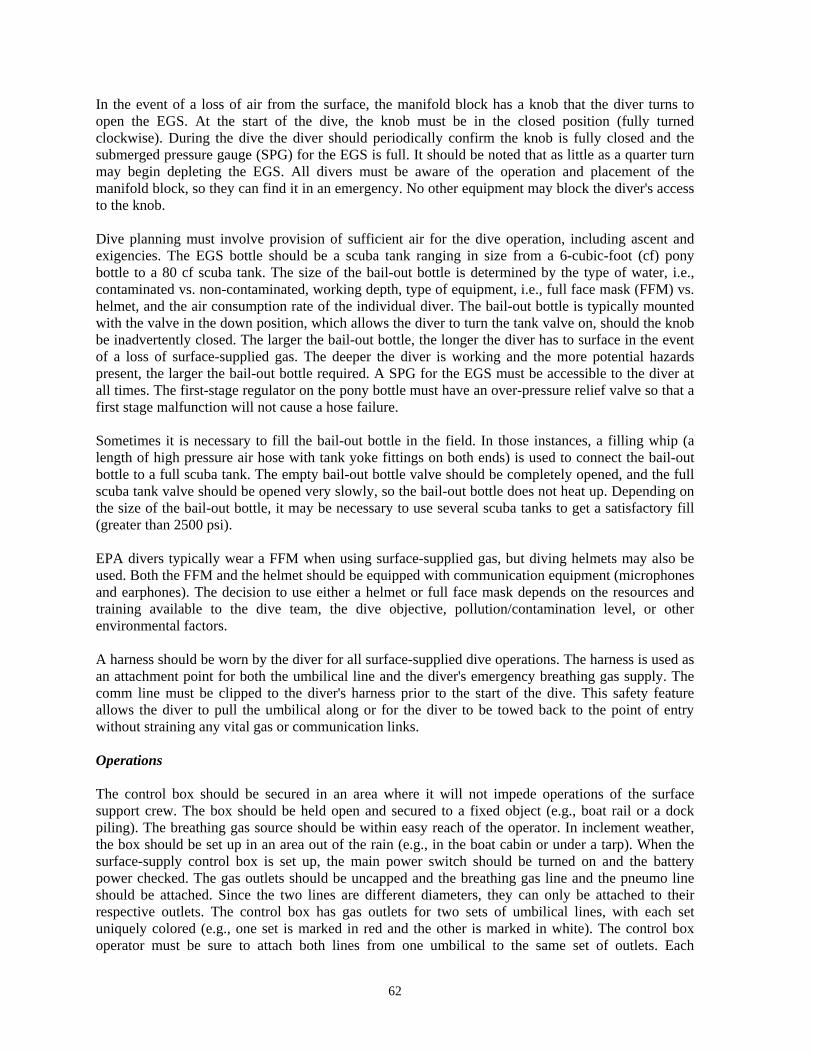
62
In the event of a loss of air from the surface, the manifold block has a knob that the diver turns to open the EGS. At the start of the dive, the knob must be in the closed position (fully turned clockwise). During the dive the diver should periodically confirm the knob is fully closed and the submerged pressure gauge (SPG) for the EGS is full. It should be noted that as little as a quarter turn may begin depleting the EGS. All divers must be aware of the operation and placement of the manifold block, so they can find it in an emergency. No other equipment may block the diver's access to the knob. Dive planning must involve provision of sufficient air for the dive operation, including ascent and exigencies. The EGS bottle should be a scuba tank ranging in size from a 6-cubic-foot (cf) pony bottle to a 80 cf scuba tank. The size of the bail-out bottle is determined by the type of water, i.e., contaminated vs. non-contaminated, working depth, type of equipment, i.e., full face mask (FFM) vs. helmet, and the air consumption rate of the individual diver. The bail-out bottle is typically mounted with the valve in the down position, which allows the diver to turn the tank valve on, should the knob be inadvertently closed. The larger the bail-out bottle, the longer the diver has to surface in the event of a loss of surface-supplied gas. The deeper the diver is working and the more potential hazards present, the larger the bail-out bottle required. A SPG for the EGS must be accessible to the diver at all times. The first-stage regulator on the pony bottle must have an over-pressure relief valve so that a first stage malfunction will not cause a hose failure. Sometimes it is necessary to fill the bail-out bottle in the field. In those instances, a filling whip (a length of high pressure air hose with tank yoke fittings on both ends) is used to connect the bail-out bottle to a full scuba tank. The empty bail-out bottle valve should be completely opened, and the full scuba tank valve should be opened very slowly, so the bail-out bottle does not heat up. Depending on the size of the bail-out bottle, it may be necessary to use several scuba tanks to get a satisfactory fill (greater than 2500 psi). EPA divers typically wear a FFM when using surface-supplied gas, but diving helmets may also be used. Both the FFM and the helmet should be equipped with communication equipment (microphones and earphones). The decision to use either a helmet or full face mask depends on the resources and training available to the dive team, the dive objective, pollution/contamination level, or other environmental factors. A harness should be worn by the diver for all surface-supplied dive operations. The harness is used as an attachment point for both the umbilical line and the diver's emergency breathing gas supply. The comm line must be clipped to the diver's harness prior to the start of the dive. This safety feature allows the diver to pull the umbilical along or for the diver to be towed back to the point of entry without straining any vital gas or communication links. Operations The control box should be secured in an area where it will not impede operations of the surface support crew. The box should be held open and secured to a fixed object (e.g., boat rail or a dock piling). The breathing gas source should be within easy reach of the operator. In inclement weather, the box should be set up in an area out of the rain (e.g., in the boat cabin or under a tarp). When the surface-supply control box is set up, the main power switch should be turned on and the battery power checked. The gas outlets should be uncapped and the breathing gas line and the pneumo line should be attached. Since the two lines are different diameters, they can only be attached to their respective outlets. The control box has gas outlets for two sets of umbilical lines, with each set uniquely colored (e.g., one set is marked in red and the other is marked in white). The control box operator must be sure to attach both lines from one umbilical to the same set of outlets. Each
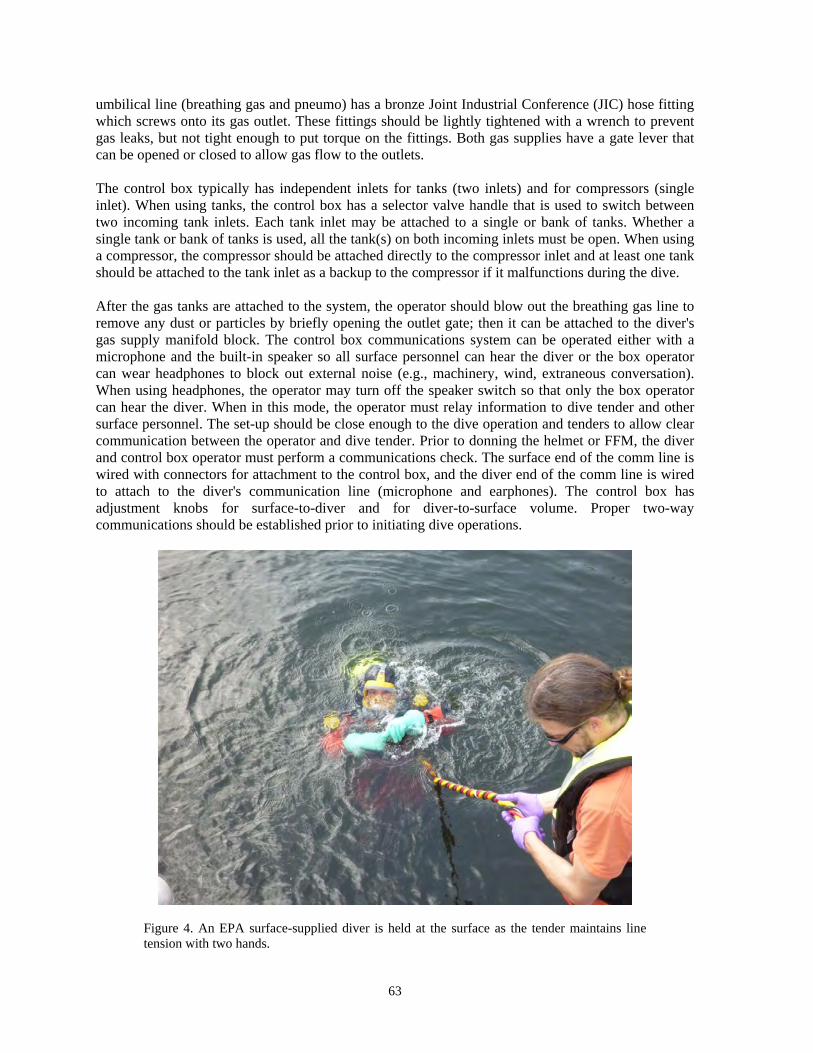
63
umbilical line (breathing gas and pneumo) has a bronze Joint Industrial Conference (JIC) hose fitting which screws onto its gas outlet. These fittings should be lightly tightened with a wrench to prevent gas leaks, but not tight enough to put torque on the fittings. Both gas supplies have a gate lever that can be opened or closed to allow gas flow to the outlets. The control box typically has independent inlets for tanks (two inlets) and for compressors (single inlet). When using tanks, the control box has a selector valve handle that is used to switch between two incoming tank inlets. Each tank inlet may be attached to a single or bank of tanks. Whether a single tank or bank of tanks is used, all the tank(s) on both incoming inlets must be open. When using a compressor, the compressor should be attached directly to the compressor inlet and at least one tank should be attached to the tank inlet as a backup to the compressor if it malfunctions during the dive. After the gas tanks are attached to the system, the operator should blow out the breathing gas line to remove any dust or particles by briefly opening the outlet gate; then it can be attached to the diver's gas supply manifold block. The control box communications system can be operated either with a microphone and the built-in speaker so all surface personnel can hear the diver or the box operator can wear headphones to block out external noise (e.g., machinery, wind, extraneous conversation). When using headphones, the operator may turn off the speaker switch so that only the box operator can hear the diver. When in this mode, the operator must relay information to dive tender and other surface personnel. The set-up should be close enough to the dive operation and tenders to allow clear communication between the operator and dive tender. Prior to donning the helmet or FFM, the diver and control box operator must perform a communications check. The surface end of the comm line is wired with connectors for attachment to the control box, and the diver end of the comm line is wired to attach to the diver's communication line (microphone and earphones). The control box has adjustment knobs for surface-to-diver and for diver-to-surface volume. Proper two-way communications should be established prior to initiating dive operations.
Figure 4. An EPA surface-supplied diver is held at the surface as the tender maintains line tension with two hands.
64
In the event of a loss of voice communication, the dive unit should practice backup line pull signals to ensure the dive can be safely and efficiently aborted. To insure proper interpretation of line pulls, it is vital that there is no slack in the umbilical. Line pulls should be discussed during the dive briefing and included in the Dive Plan. Standard line pull signals are available in the US Navy Diving Manual, 2008. Example Emergency Line-Pull Signals Primary Diver to Tender: 2-2-2 I am in a difficulty but I am OK, I need assistance, send the backup diver. 3-3-3 I am entangled and OK, I am stopping to handle it myself but ready the backup diver. 4-4-4 I am not OK, I need immediate assistance. The area in which the diver dresses and uses for access to the water should be kept clear of all debris and items that could present slip, trip or fall hazards. The tender should always be available to physically assist the fully dressed diver. The tender should assist the diver in donning all equipment and ensure all belts, clips and harnesses are securely fastened. The dive tender and/or the box operator should ensure that all air systems and communications are functioning properly. The tender should complete all pre-dive checks as specified in a Surface-supplied Air Checklist.
Figure 5. Diver entering the water to conduct a bottom search in zero visibility conditions. The tender should assist the diver entering the water and always maintain a grip on the umbilical. When the diver jumps into the water, it is the tender's responsibility to ensure that there are no obstacles in the diver's landing area. The tender should also give the diver enough slack in the umbilical to get into the water just below the surface. Immediately after the diver has entered the water, the tender should pull the diver back to the surface. Once back at the surface, the diver should ensure that he or she is properly weighted and do another communication check. The tender and the diver should assess the diver for leaks (bubbling, particularly around the mask). Once the diver is

65
ready to submerge, the tender should give the diver enough slack to descend. Since the tender is usually in the best position to witness the diver submerging, the tender should call out to the box operator and/or divemaster when the diver has submerged so the submergence time can be recorded. When a diver is in the water, the box operator must maintain regular, open communication. Once the diver has descended to the work site, the operator should monitor the diver's depth using the pneumo. Using the correct pneumo gauge for the diver's umbilical, the operator should open the pneumo valve below the gauge by turning it in a counter clockwise direction until the depth gauge reads a depth that is known to be deeper than the diver, or until the diver reports bubbles coming from the open end of the pneumo hose. The operator should then close the valve, monitor the depth gauge and record the diver's depth (measured in feet of sea water [fsw]) when the gauge needle stabilizes. The operator should monitor the diver's depth frequently, especially when the diver is moving around. The divemaster or designee records this information on the tending form during the dive. The divemaster may choose to use a computer or depth gauge to monitor depth in lieu of using a pneumo hose, as long as the control box operator appropriately compensates for intermediate pressures throughout the dive, as discussed below. The control box operator should ensure that the diver is getting sufficient breathing gas pressure at depth. The umbilical pressure gauge on the control box should read between 115 psi and 225 psi depending upon the specifications of the mask or dive helmet being utilized, bottom depth, and particular control box instructions. Lower umbilical pressure results in more effort on the diver's part to breathe. The EPA typically maintains umbilical pressure at 150 psi for light to moderate workloads. If the diver is performing manual labor (e.g., pounding sediment cores or moving heavy objects) and is breathing hard, it may be necessary to increase the umbilical pressure by turning the umbilical pressure knob until the diver reports that gas flow is comfortable. The control box operator must maintain careful watch over the pressure gauge on the line that is supplying gas to the diver when using breathing supplied from tank(s). When the gauge reads approximately 500 psi, the operator should flip the selector handle to the other incoming gas line. The selector handle must be turned all the way to its stop for breathing gas to flow properly. As soon as possible, the operator, or designee, should replace the spent gas cylinder with a full cylinder. When using scuba tanks, the spent tank valve should be closed, and the pressure should be bled out of the hose between the tank and the control box using the bleed valve on the yoke. Upon removing the spent tank and replacing it with a full tank, the bleed valve should be closed and the tank valve should slowly be fully opened. The operator should ensure that the pressure gauge on the control box indicates a full tank. This procedure should be followed each time a spent tank is replaced. It is the responsibility of the control box operator to ensure that a sufficient gas supply is readily available for all diving. Prior to switching the gas source, the operator should notify the diver to suspend the current activity, locate the EGS manifold block and be ready to switch to emergency gas. Once the diver has responded to the operator and has put a hand on the manifold block, the operator can switch the gas source. In the event that a gas line or a seal (O-ring or fitting) should fail upon changing pressure, the diver will be prepared to immediately switch to EGS. If a seal should fail and gas pressure to the system is lost, the operator must switch back to the previous tank and inform the diver to be ready to switch to the EGS. The box operator should replace the failed tank with a new tank as quickly as possible and switch to the replacement tank. Once the situation has been resolved, it is the divemaster's decision to either continue or terminate the mission. It is the responsibility of the divemaster, the diver and the tender to ensure that the valve of the bail-out bottle is opened after it is connected to the manifold block and that the manifold block knob is
66
closed. The bail-out bottle pressure should be checked and recorded prior to every working dive. The EGS should be mounted upside down, and the divemaster should verify that the diver can reach the tank valve to re-open it, should it become closed. At the termination of each dive, the operator should notify the surface support crew that the diver is ready to ascend. If conditions permit the diver to control the ascent, the tender should slowly pull in the slack from the umbilical as it becomes available. The umbilical should be coiled in alternating over-under loops to facilitate the next deployment. If conditions do not permit the diver to control the ascent (e.g., low visibility or mid-water current), the tender should gently pull in all slack umbilical and the operator should have the diver swim on the bottom in the direction of the umbilical. Once the diver is close to or below the boat/platform, the diver should become negatively buoyant and the tender will use the umbilical to lift the diver to the surface. The tender must maintain an ascent rate of no more than 30 feet per minute, and the operator must continually communicate with the diver to ensure that the ascent rate is not causing discomfort (e.g., reverse squeeze). The box operator can monitor the diver's rate of ascent simply by watching the pneumo gauge. The operator should warn the diver if any surface hazards are present. Once the diver surfaces, the tender should call out to the divemaster or box operator, who should record surface time on the dive log. Once at the dive platform, the tender should assist the diver exiting the water. When diving in contaminated water, proper decontamination methods should be utilized prior to undressing the diver. When switching divers, the same harness rig is worn but the next diver's personal FFM should be used. To switch FFMs, the box operator should close the gate on the umbilical gas outlet, and the tender should push the purge button on the first diver's FFM to bleed the pressure out of the breathing gas hose. The FFM should then be removed and the next diver's mask put on the system. Dive computers must not be shared. Equipment Maintenance At the end of each day, the main power switch on the control box should be turned off, and the battery power should be checked. If the battery is low, the box should be charged overnight prior to the next dive operation. The microphone should be disconnected and stowed in the battery compartment, and the comm line connectors should be gently pulled. The gas supply tank valves should be closed and the bleed valves on the tank yokes should be opened to depressurize the supply hoses. The scuba tanks should be taken off the system, and any tanks that have not been exhausted should be capped for future use. Tanks that have been exhausted should not be capped, and should be kept separate from the full tanks. The FFM purge button should be pushed to bleed the gas out of the umbilical. The gas supply gate should then be closed. Using a wrench, the umbilical lines (both breathing gas and pneumo) should be disconnected from the box and the breathing gas hose should be capped immediately. The gas outlets should then be capped, finger-tight, with their brass caps. The control box should then be closed and latched. The harness should be disconnected by unclipping the umbilical and using a wrench to disconnect the breathing gas supply hose. The pony bottle valve should be closed, and the valve on the manifold block should be briefly opened to bleed the hose pressure so that the regulator first stage can be removed from the bottle and capped. After decontamination, the umbilical should be coiled neatly and stowed Once all gear has dried, the umbilical, harness, pony bottle and regulator should be stowed and all of the latches should be tightened. If shipping the case by air, the pony bottle must either be removed or emptied. After the project is completed, all equipment should be allowed to air dry prior to being stored.

67
The control box should be serviced by a qualified technician on an annual basis or as recommended by the manufacturer. The breathing gas hose must be pressure tested to 1.5 times its working pressure and cleaned internally by a qualified facility on an annual basis. The breathing gas hose must be kept clean, inside and out. For cleaning, a 20–30 minute detergent and water flush should be followed by a 10-minute rinse, then drying using diver's air or nitrogen. It is important to ensure that both ends of the hose are properly capped when the hose is not in use to prevent dust and particulate contaminants from getting into the breathing system. (DiveLab, 2008). Personnel Each member of the surface-supplied dive team will have the experience or training necessary to perform the assigned tasks in a safe and efficient manner. This experience and training will include the use of tools and equipment needed for the specified tasks and techniques required for surface-supplied diving. Each member of the dive team will also have training in the emergency procedures required in the event of a diving accident. Each dive team member will only be assigned tasks in accordance with that person's training and experience. A simple surface-supplied diving operation (a single diver and shallow, short duration dives) requires a minimum of four people; a diver, a stand-by diver, a tender, and control box operator/divemaster. However, dive projects requiring multiple dives, depths greater than 30 ft and multiple divers may need a larger minimum crew. If two divers are in the water simultaneously, a minimum of six people are required: two divers, two tenders, a stand-by diver, and a control box operator/divemaster. These minimum numbers assume that all personnel, with the exception of tenders, are qualified divers who could switch duties from surface support to in-water operations. Crew size will ensure that each diver shall be continuously tended while in the water. The responsibilities of the dive team are described in the EPA Diving Safety Manual, but those responsibilities specific to surface-supplied diving follow. The divemaster carries the overall responsibility for the safety and performance of the dive operation. On small operations, the divemaster may also assume the responsibilities of another surface support person or even perform in-water duties if there is a qualified divemaster available to assume the divemaster's surface responsibilities. Divers are primarily responsible for performing dive duties as instructed, and maintaining open communication with surface personnel. The diver is also responsible for ensuring all dive equipment is present and in working order. The surface-supply control box operator and the divemaster should be aware of the diver's status at all times. It is the diver's responsibility to ensure that he/she understands the objectives of the dive and is aware of all safety equipment and procedures that may be required. For supplied diving operations, at least one qualified member of the team will be designated as a stand-by diver. The stand-by diver will be ready to enter the water promptly in case of an emergency. The dive tender must assist the diver while preparing for, conducting, and recovering from in-water operations. The dive tender will maintain control of the surface-supply air umbilical, ensuring that the diver has enough umbilical to work freely, but not so much umbilical to pose an entanglement hazard. The dive tender will also be responsible for visually tracking the diver's location while in the water. The dive tender and all surface personnel are responsible for advising other vessels of the dive operation and warning off any vessels that may pose a hazard to the diver. Although the tender does not need to be a certified diver, the tender must be trained to perform the required duties and have an understanding of the diving equipment.
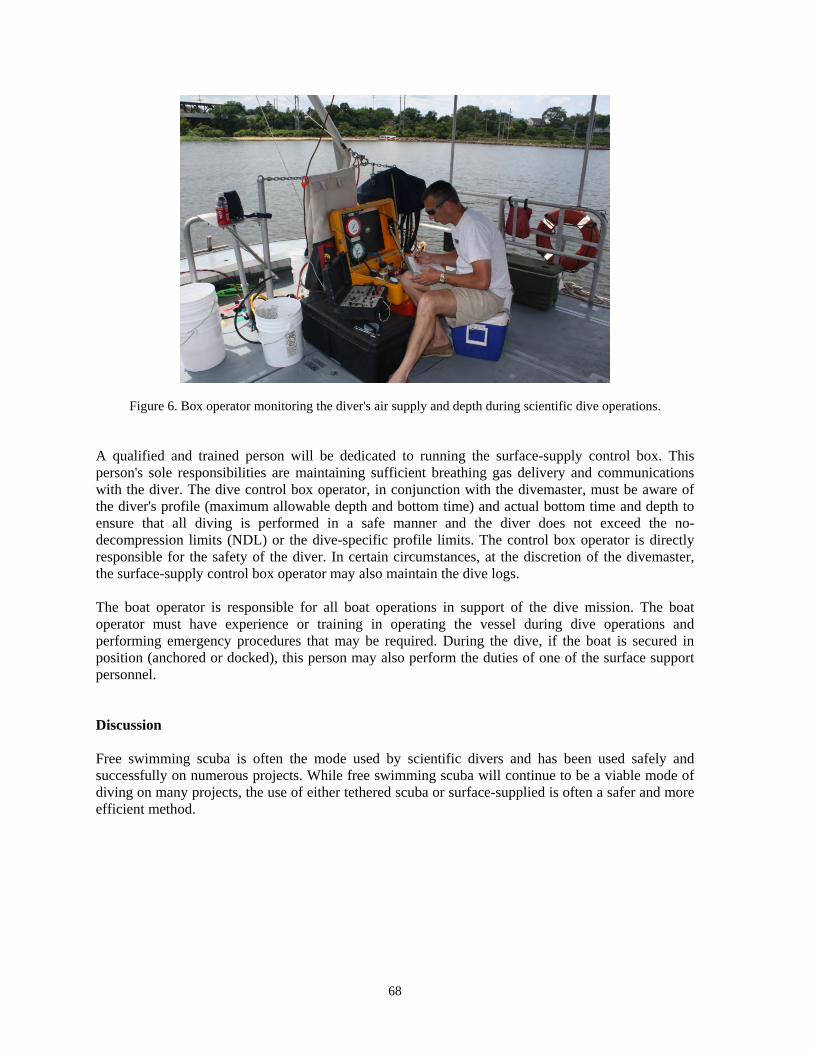
68
Figure 6. Box operator monitoring the diver's air supply and depth during scientific dive operations. A qualified and trained person will be dedicated to running the surface-supply control box. This person's sole responsibilities are maintaining sufficient breathing gas delivery and communications with the diver. The dive control box operator, in conjunction with the divemaster, must be aware of the diver's profile (maximum allowable depth and bottom time) and actual bottom time and depth to ensure that all diving is performed in a safe manner and the diver does not exceed the no-decompression limits (NDL) or the dive-specific profile limits. The control box operator is directly responsible for the safety of the diver. In certain circumstances, at the discretion of the divemaster, the surface-supply control box operator may also maintain the dive logs. The boat operator is responsible for all boat operations in support of the dive mission. The boat operator must have experience or training in operating the vessel during dive operations and performing emergency procedures that may be required. During the dive, if the boat is secured in position (anchored or docked), this person may also perform the duties of one of the surface support personnel. Discussion Free swimming scuba is often the mode used by scientific divers and has been used safely and successfully on numerous projects. While free swimming scuba will continue to be a viable mode of diving on many projects, the use of either tethered scuba or surface-supplied is often a safer and more efficient method.

69
Figure 7. An EPA diver dons a dive helmet for polluted water dive operations. There are many advantages to tethered scuba, such as being able to hold a diver on station in current, communicate with the diver using clear hard line comms, pass instruments to the diver, and easily navigate a diver to a location with directions relative to the umbilical. There are even more advantages to the surface-supplied diving mode. Not only does surface-supplied air provide the diver with extended bottom times compared to scuba, but it also provides a safer and more efficient mode of diving to conduct scientific diving operations. When using surface-supplied air, the diver is no longer limited to bottom times based on the volume of air that can be carried by the diver, but rather by decompression limits, which, at shallow depths (less than 50 ft), are significantly longer. This provides the diver more time to safely complete tasks without having to return to the surface to change tanks. The single greatest hazard to a diver is running out of air, or running low on air inadvertently or due to entanglement. When using surface-supplied air this hazard is greatly reduced. The risk of inadvertent loss of air supply is completely eliminated and if a diver is entangled, the surface support team will be in communication with the diver and able to supply air until the diver frees himself or the standby diver is sent in to render assistance. Even if the planned dive times or no decompression limits are exceeded, there is still sufficient air supply to extend safety stops or run in water decompression so the diver can safely return to the surface with no increased risk of decompression sickness.

70
Figure 8. Surface-supply hoses should be managed in the vessel's "hot zone" for polluted water operations.
Due to the virtually unlimited air supply, surface-supplied diving offers the scientific, polluted water diver the ability to conduct extensive decontamination without exposing the diver. For example, at some dive sites, an antimicrobial solution may be required to have "contact time" on the diver before he or she may remove the mask or helmet. The surface-supplied gas allows the diver this extended time to egress his or her personal protective gear safely. A scientific diver, using surface-supplied air, is supported by several dive team members topside who will monitor the diver's air supply, bottom time, depths and direction of travel, freeing the diver to concentrate solely on accomplishing the dive objectives. The diver does not have to constantly monitor air supply, rush to finish, or leave tasks uncompleted, due to dwindling air supply. This is also beneficial in areas with extremely low visibility where it is difficult (if not impossible) to read diver worn gauges and/or compass. The surface-supply team can also direct a diver to targets verbally, using the umbilical, and/or tracking the diver's bubbles.
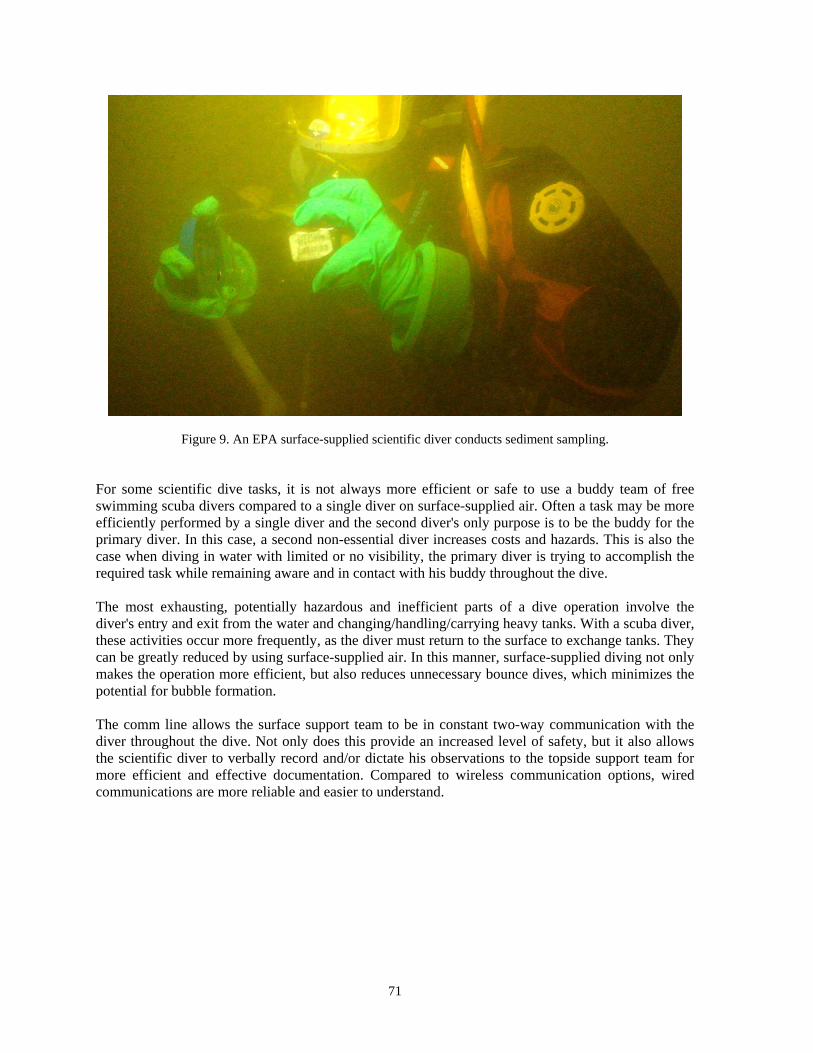
71
Figure 9. An EPA surface-supplied scientific diver conducts sediment sampling. For some scientific dive tasks, it is not always more efficient or safe to use a buddy team of free swimming scuba divers compared to a single diver on surface-supplied air. Often a task may be more efficiently performed by a single diver and the second diver's only purpose is to be the buddy for the primary diver. In this case, a second non-essential diver increases costs and hazards. This is also the case when diving in water with limited or no visibility, the primary diver is trying to accomplish the required task while remaining aware and in contact with his buddy throughout the dive. The most exhausting, potentially hazardous and inefficient parts of a dive operation involve the diver's entry and exit from the water and changing/handling/carrying heavy tanks. With a scuba diver, these activities occur more frequently, as the diver must return to the surface to exchange tanks. They can be greatly reduced by using surface-supplied air. In this manner, surface-supplied diving not only makes the operation more efficient, but also reduces unnecessary bounce dives, which minimizes the potential for bubble formation. The comm line allows the surface support team to be in constant two-way communication with the diver throughout the dive. Not only does this provide an increased level of safety, but it also allows the scientific diver to verbally record and/or dictate his observations to the topside support team for more efficient and effective documentation. Compared to wireless communication options, wired communications are more reliable and easier to understand.
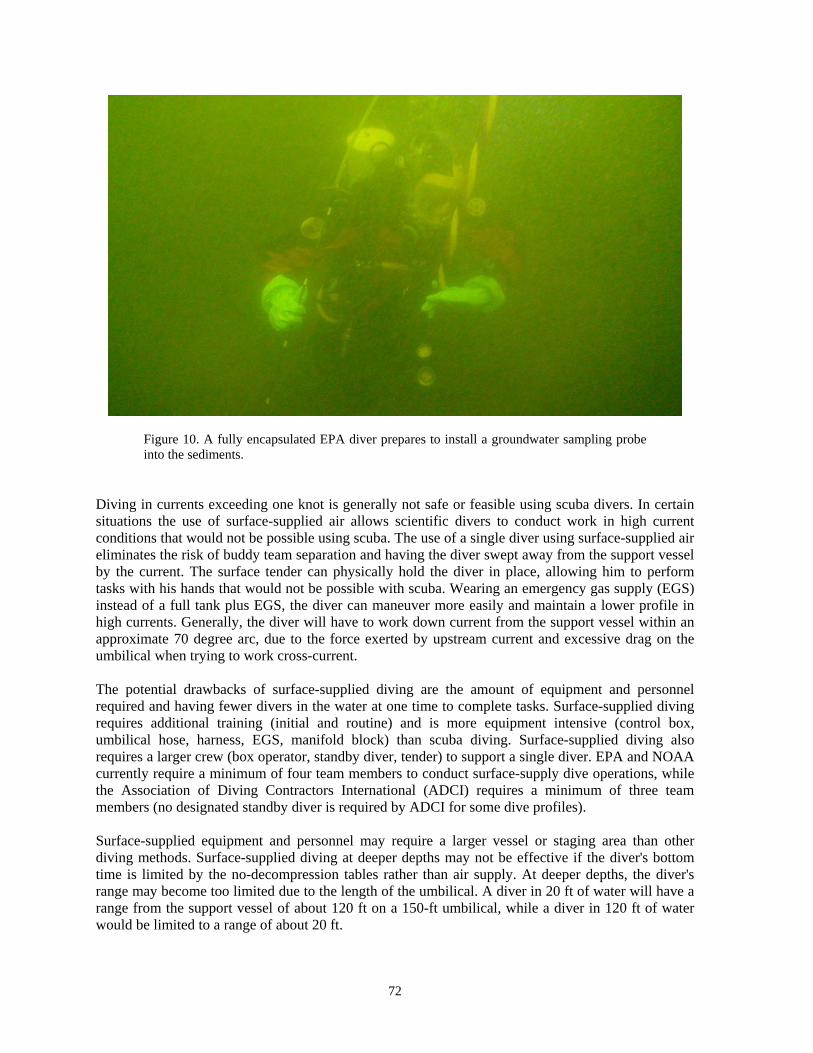
72
Figure 10. A fully encapsulated EPA diver prepares to install a groundwater sampling probe into the sediments.
Diving in currents exceeding one knot is generally not safe or feasible using scuba divers. In certain situations the use of surface-supplied air allows scientific divers to conduct work in high current conditions that would not be possible using scuba. The use of a single diver using surface-supplied air eliminates the risk of buddy team separation and having the diver swept away from the support vessel by the current. The surface tender can physically hold the diver in place, allowing him to perform tasks with his hands that would not be possible with scuba. Wearing an emergency gas supply (EGS) instead of a full tank plus EGS, the diver can maneuver more easily and maintain a lower profile in high currents. Generally, the diver will have to work down current from the support vessel within an approximate 70 degree arc, due to the force exerted by upstream current and excessive drag on the umbilical when trying to work cross-current. The potential drawbacks of surface-supplied diving are the amount of equipment and personnel required and having fewer divers in the water at one time to complete tasks. Surface-supplied diving requires additional training (initial and routine) and is more equipment intensive (control box, umbilical hose, harness, EGS, manifold block) than scuba diving. Surface-supplied diving also requires a larger crew (box operator, standby diver, tender) to support a single diver. EPA and NOAA currently require a minimum of four team members to conduct surface-supply dive operations, while the Association of Diving Contractors International (ADCI) requires a minimum of three team members (no designated standby diver is required by ADCI for some dive profiles). Surface-supplied equipment and personnel may require a larger vessel or staging area than other diving methods. Surface-supplied diving at deeper depths may not be effective if the diver's bottom time is limited by the no-decompression tables rather than air supply. At deeper depths, the diver's range may become too limited due to the length of the umbilical. A diver in 20 ft of water will have a range from the support vessel of about 120 ft on a 150-ft umbilical, while a diver in 120 ft of water would be limited to a range of about 20 ft.
73
Surface-supplied diving has numerous safety and efficiency advantages over traditional free swimming scuba. Although free swimming scuba will continue to be a valuable tool for scientific diving operations, the use of surface-supplied diving should be evaluated and considered as a safer and more efficient mode of diving, often under demanding conditions. Scientific dive teams currently using free swimming scuba should consider the numerous advantages of this mode of diving. If there is an apparent need, the team should pursue the training and equipment required to utilize this valuable method of diving to safely fulfill their scientific diving objectives. Special Note: The standard practices presented in this article presume and require prior training and experience with surface-supplied diving and are not a substitute for actual hands-on training. Each component of a diver's equipment shall be maintained in a safe operating condition, and shall be inspected, tested, serviced and logged as required. Divers should be dive certified and medically qualified to perform their diving duties. The US EPA requires preparation and review of a Dive Safety Plan prior to conducting dive operations, with additional information required for polluted water dives. A Job Safety Analysis (JSA) will insure that all appropriate safety equipment is available at the dive site, as specified in the Dive Safety Plan. References Barsky SM. Diving in High-Risk Environments, 4th ed, Hammerhead Press: Santa Barbara, CA, 2007; 197 pp. Diving Systems International (DSI). Dive Control System – 2A, Operations and Maintenance Manual, 1996. Dive Lab. Surface-supply Breathing Requirements and Recommendations for Kirby Morgan Helmets and Band Masks, 2008; 37 pp, http://www.kirbymorgan.com/PDF/Checklists/Surface_Supply_Requirements_02-17-2009.pdf Kirby Morgan Dive Systems Inc. Kirby Morgan Air Control System 5 Operations and Maintenance Manual, 2009. US Environmental Protection Agency. 2001. Dive Safety Manual. http://yosemite.epa.gov/r10/OEA.NSF/webpage/EPA+Dive+Safety+Manual US Navy Diving Manual, 2008, Revision 6. http://www.supsalv.org/00c3_publications.asp
74
Atmospheric Diving Suits – New Technology May Provide ADS Systems that are Practical and Cost-Effective Tools for Conducting Safe Scientific Diving, Exploration, and Undersea Research Douglas E. Kesling
J. F. White Contracting Company, 10 Burr Street, Framington, MA 01701, USA Abstract
During the past decade significant technological advances have been achieved capacities in the ocean exploration capabilities provided by submersibles, unmanned vehicles ROVs, AUVs, and shipboard towed sensors. Despite ever increasing performance capacity, these undersea systems separate the marine explorer to some degree from the environment they are trying to observe. The free-swimming diver may be able to approach a study task more closely, but limitations are imposed by diving equipment utilized. Ambient diving requires the human body to adapt physiologically to pressure, cold, and other ocean conditions, but with atmospheric diving the human body is protected from such conditions. This paper will examine the use of the atmospheric diving suits (ADS) and consider new advances in ADS design which may provide greater productivity for marine science exploration and research. Keywords: atmospheric diving systems (ADS), decompression, EXOSUIT, JIM
Introduction The quest for an effective atmospheric pressure suit to facilitate underwater exploration has been ongoing for the past 300 years (Morrison, 1989). The benefits of a pressure suit include protecting the human body from conditions such as extreme temperatures, pressure, and ocean conditions. Unlike a submersible or ROV which places an individual some distance from the environment they are trying to study, an ADS has the ability to put the underwater scientist directly at the study site. By isolating the diver (pilot) from the ambient pressure, however, an ADS allows work to be conducted without the hazards associated with decompression (Bachrach et al., 1988). History The earliest recorded attempt at atmospheric diving was by John Lethbridge in 1715 (Morrison, 1989). He fashioned a diving suit that was made by a cooper of oak with a viewport to salvage coins from shipwrecks. It was essentially a watertight wooden barrel with cuffed armholes (Earle et al., 1980), and a self-contained life support system with the operator breathing and rebreathing air trapped inside the hull. Since the operator's arms protruded outside the suit, this was strictly speaking not a true ADS. Lethbridge claimed, however, to have made successful dives to 10 fathoms and even 12 fathoms "with great difficulty" (Bachrach et al., 1988). Technology Not unlike the early pressure suit systems, the purpose of a modern ADS is to create a barrier, which protects the operator from the high pressure of the deep ocean, yet does not prevent the operator from doing useful work (Carter, 1976). It is usually self-contained and designed to supply the operator with onboard life support via oxygen cylinders, has the ability to remove expired CO2 from the operator
In: Pollock NW, ed. Diving for Science 2011. Proceedings of the American Academy of Underwater Sciences 30th Symposium. Dauphin Island, AL: AAUS; 2011.
75
compartment, and may additionally provide climate control, communications, and navigational information to the pilot. It is essentially a "Submarine that you wear" (MacInnis, 1983). Oil and gas exploration drove the development of effective atmospheric diving systems. In the early seventies, the JIM suit was designed to reach greater depths than previous systems. The JIM design created a joint system in which the articulated arms and legs could be operated effectively under pressure, and this was achieved by filling the joints with fluid. In 1975 Oceaneering International, Inc. purchased rights to the JIM suit; they continued to make improvements to the suit design, and used them successfully worldwide on offshore oil fields. Exploring the Deep Frontier There have been two noteworthy expeditions that have utilized ADS for marine science investigation and exploration. In 1979, Dr. Sylvia Earle tested the applicability of an ADS to conduct scientific exploration. Working with Oceaneering International, Inc. she dived a JIM suit to a depth of 1,250 fsw off the Coast of Hawaii. Dr. Joe MacInnis subsequently used the WASP system to explore the sunken vessel Breadalbane in 1989 within the Artic Circle. Located in 340 fsw this British bark was lost in 1853 beneath the ice of Canada's Northwest Passage. At the time she was the northernmost shipwreck ever discovered on the seafloor (MacInnis, 1983). Advancement In 1984, Phil Nuytten one of the founders of Oceaneering received a patent for an oil-filled rotary joint design. He incorporated this new design into the NEWTSUIT. The NEWTSUIT provided greater dexterity to the operator, due to the ease of the movement of the joints. This had been a major limiting factor for suits prior to Dr. Nuytten's patented design. Production began on the newly termed "Hardsuit", by Hardsuits International. It is a truly anthropomorphic suit with articulated arms and legs and just enough room for the operator to pull his arms back into the suit to operate interior controls (Thornton et al., 2001). New interest has emerged with the ability of an ADS to deploy untethered from a research vessel or surface work platform. The new EXOSUIT, conceived by Phil Nuytten, was designed as a swimmable version of the NEWSUIT. The new EXOSUIT can be swimmable if untethered or powered through an umbilical by thrusters. The EXOSUIT incorporates many new innovations in its design to improve ADS performance as a tool for marine science research and data collection. The features of the EXOSUIT include enhanced thermal and buoyancy hull properties, a neutrally buoyant umbilical, and minimal topside support equipment. New manipulators will provide even greater dexterity and functionality than those seen in present ROVs. The EXOSUIT is lightweight and provides far greater joint flexibility than any previous ADS design. Training Operators considering using an EXOSUIT will need to undergo significant training. Learning the operating systems is important for both pilots and topside support crew. Currently, Hardsuits provide six or more hours of normal dive time, with additional onboard life support of 48 hours. Learning to maneuver the suit via the thruster packs takes considerable practice before developing a working proficiency.

76
Operations Currently in development is an enhanced launch and recovery system (LARS) to handle deployment of the EXOSUIT. This will greatly reduce the footprint required for topside operations. Additionally, further refinement of the suit manipulators will improve upon the pilot's dexterity and functionality while working and collecting specimens or performing other delicate tasks on the seafloor. Conclusions The principal advantage of an ADS is the elimination of the physiological hazards associated with ambient pressure diving. Once the EXOSUIT is complete, it will undergo further testing and evaluation to determine its applicable for the marine science community. If successful, this new ADS should extend our effective reach into the ocean depths. Acknowledgments The author would like to acknowledge the professional support of Dr. Phil Nuytten and his staff at Nuytco in Vancouver, British Columbia – Canada and the Diving Division staff from J. F. White Contracting Company – Boston, MA. References Bachrach AJ. One-Manned Atmospheric Diving Systems. In: Bachrach AJ, Desiderati BM, Matzen MM, ed. A Pictorial History of Diving. San Pedro, CA: Undersea and Hyperbaric Medical Society, Inc./Best Publishing Co., 1988: 74–83. Carter RC. Evaluation of JIM: A One-Atmospheric Diving Suit. Navy Experimental Diving Unit Report. 5-76. 1976. 8 pp. Curley MD, Bachrach AJ. Operator performance in the one-atmosphere diving system JIM in water at 20°C and 30°C. Undersea Biomed Res. 1982; 9(3): 203–12. Earle SA, Giddings S. Exploring the Deep Frontier; The Adventure of Man in the Sea. Washington, DC. National Geographic Society. 1980: 229–32. MacInnis JB. Exploring a 140-year-old ship under Arctic Ice. National Geographic. 1983; 164(1): 104A–D. Morrison SJ. A history of atmospheric diving suits and the development of a highly mobile rotary joint. SAE Technical Paper Series. Engineering Society for the Advancing Mobility Land Sea and Space, 1989. Thorton M, Randall R, Albaugh K. Then and now: atmospheric diving suits. Underwater Magazine. 2001; Mar–Apr: 25–34. Viau G. Technology improves safety and performance for atmospheric diving systems. Ocean News Technol. 2009; April/May: 38–9.
77
Belize Barrier Reef Transect: How Far Do Coral Reef Fish Larvae Travel In Marine Currents? Oscar Puebla, Edgardo Ochoa, Owen McMillan, Eldredge Bermingham Smithsonian Tropical Research Institute, Apartado Postal 0843–03092, Panamá, República de Panamá [email protected]; [email protected] Abstract
The vast majority of coral reef fishes go through a pelagic larval stage, which provides potential for long-distance dispersal by marine currents. Yet planktonic larvae are notoriously difficult to track owing to their small size, and as a consequence the spatial scale of dispersal in coral reef fishes is largely unknown. Robust estimates of dispersal are needed owing to the fundamental importance of this parameter for the design and management of networks of marine protected areas. If larvae disperse locally, geographically nearer individuals are anticipated to be more similar genetically. A pattern of increasing genetic differentiation with geographic distance, referred to as genetic 'isolation by distance', is expected in this case and provides an opportunity to estimate dispersal. A specific aspect of this approach is that it requires the continuous sampling of individuals along a continuous population. The 250 km long Belize Barrier Reef provides an unparalleled opportunity to sample continuously along continuous populations of coral reef fishes. Individuals were collected continuously along a 250-km transect following the Belize Barrier Reef to estimate larval dispersal in seven species of coral reef fish with different life histories. Keywords: isolation by distance, larval dispersal, microsatellites, population genetics
Introduction Caribbean coral reefs are declining on a regional scale (Gardner et al., 2003), and associated coral reef fishes are following this trend (Paddack et al., 2009). This ongoing decline calls for the protection of coral reefs and associated fishes, and networks of marine protected areas (MPAs) have emerged as a key conservation and management tool. But how large should be a MPA to be self-sustainable? How far away should different MPAs be located in order to stay demographically connected? To what extent do MPAs contribute to replenish neighboring, non-protected areas? The answers to these questions depend on the spatial scale of dispersal of the organisms living within the MPAs. In coral reef fishes, the greatest potential for dispersal is provided by the larvae, which can drift in marine currents for days, weeks or months depending on the species. Yet planktonic larvae are notoriously difficult to track owing to their small size, and as a consequence larval movement has been unanimously recognized as a major 'science gap' for the conservation and management of coral reefs (Sale et al., 2005; Cowen et al., 2007; Botsford et al., 2009). Population genetics provide an appropriate framework to address questions of larval movement. Rousset (2000) showed how the decrease in genetic relatedness between individuals with increasing geographic distance (genetic 'isolation by distance') can be used to estimate dispersal if population density is known. This approach has provided dispersal estimates that are consistent with mark-
In: Pollock NW, ed. Diving for Science 2011. Proceedings of the American Academy of Underwater Sciences 30th Symposium. Dauphin Island, AL: AAUS; 2011.
78
recapture estimates of dispersal within a factor of two in reptiles, mammals and insects (Rousset, 2000; Sumner et al., 2001; Broquet et al., 2006; Watts et al., 2007), challenging the notion that genetic and demographic estimates of dispersal are inconsistent. A very specific aspect of this approach is that requires the continuous sampling of individuals along a continuous population. Methods A total of 100 regularly spaced sampling sites were considered along a 250 km transect following the Belize Barrier Reef. The indigo hamlet (Hypoplectrus indigo), black hamlet (H. nigricans), barred hamlet (H. puella), bicolor damselfish (Stegastes partitus), bluehead wrasse (Thalassoma bifasciatum), foureye butterflyfish (Chaetodon capistratus) and French grunt (Haemulon flavolineatum) were selected as target species because they comprise planktonic larval durations ranging from a few to >45 days typical of most coral reef fishes, because ten or more hypervariable (microsatellite) DNA markers have been developed for all of them, and because they are relatively small and abundant in Belize, facilitating population monitoring and sampling. The objective was to collect one individual of each target species at each sampling site, and perform a 400 m2 scuba survey every other sampling site to estimate population densities of all target species. Fieldwork was undertaken between June 26th and July 16th 2010 from the S/V Legacy, a 64' 10" liveaboard, crewed custom catamaran specially accommodated for scientists with a 8.5 cfm Bauer compressor and a covered working area. All the fieldwork was realized by a team of five scuba divers including the four authors and Myriam Morneau. Results Owing to the early first tropical storm of the season (Alex), we were not able to work at the first 14 sites of the transect. Fieldwork was therefore realized at 86 sites along 210 km of reef, from Ambergris Cay (17º 51.88' N, 87º 58.20' W) to the Sapodilla Cays (16º 4.75' N, 88º 17.00' W). A total of 508 samples were collected, including 52 barred hamlets, 55 indigo hamlets, 66 black hamlets, 82 bluehead wrasses, 85 bicolor damselfish, 83 foureye butterflyfishes and 85 French grunts. Forty-three transects covering a total of 17,200 m2 of reef were performed. All in all, fieldwork involved more than 300 scuba dives by the five participants. Genetic analyses of all samples have been performed at the Smithsonian Tropical Research Institute in Panama. Preliminary results suggest restricted dispersal (30 km or less) in some, but not all species considered. Acknowledgments The Marine Science Network, National Geographic Society, and Smithsonian Institution provided funding for this study. We acknowledge the governments of Belize and Panama for support our research. References Botsford LW, White JW, Coffroth MA, Paris CB, Planes S, Shearer TL, Thorrold SR, Jones GP. Connectivity and resilience of coral reef metapopulations in marine protected areas: matching empirical efforts to predictive needs. Coral Reefs. 2009; 28: 327–37.
79
Broquet T, Johnson CA, Petit E, Thompson I, Burel F, Fryxell M. Dispersal and genetic structure in the American marten, Martes Americana. Mol Ecol. 2006; 15: 1689–97. Cowen RK, Gawarkiewicz G, Pineda J, Thorrold SR, Werner FE. Population connectivity in marine systems: an overview. Oceanog. 2007; 20: 14–21. Gardner TA, Côté IM, Gill JA, Grant A, Watkinson AR. Long-term region-wide declines in Caribbean corals. Sci. 2003; 301: 958–60. Paddack MJ, Reynold JD, Aguilar C, Appeldoorn RS, Beets J, Burkett EW, Chittaro PM, Clarke K, Esteves R, Fonseca AC, Forrester GE, Friedlander AM, García-Sais J, González-Sansón G, Jordan LKB, McClellan DB, Miller MW, Molloy PP, Mumby PJ, Nagelkerken I, Nemeth M, Navas-Camacho R, Pitt J, Polunin NVC, Reyes-Nivia MC, Robertson DR, Rodríguez-Ramírez A, Salas E, Smith SR, Spieler RE, Steele MA, Williams ID, Wormald CL, Watkinson AR, Côté IM. Recent region-wide declines in Caribbean reef fish abundance. Current Biol. 2009; 19: 590–5. Rousset F. Genetic differentiation between individuals. J Evol Biol. 2000; 13: 58–62. Sale PF, Cowen RK, Danilowicz BS, Jones GP, Kritzer JP, Lindeman KC, Planes S, Polunin NVC, Russ GR, Sadovy YJ, Steneck RS. Critical science gaps impede use of no-take fishery reserves. Trends Ecol Evol. 2005; 20: 74–80. Sumner J, Rousset F, Estoup A, Moritz C. 'Neighbourhood' size, dispersal and density estimates in the prickly forest skink (Gnypetoscincus queenslandiae) using individual genetic and demographic methods. Mol Ecol. 2001; 10: 1917–27. Watts PC, Rousset F, Saccheri IJ, Leblois R, Kemp SJ, Thompson DJ. Compatible genetic and ecological estimates of dispersal rates in insect (Coenagrion mercuriale: Odonata: Zygoptera) populations: analysis of 'neighbourhood size' using a more precise estimator. Mol Ecol. 2007; 16: 737–51.
80
Spectral Reflectance as a Method to Identify the Invasive Tunicate Didemnum vexillum Thomas Leeuw, Emmanuel S. Boss, Wayne H. Slade University of Maine, Orono, ME 04469, USA [email protected] Abstract
The spatial extent of the bottom colonizing invasive tunicate Didemnum vexillum within Gulf of Maine is largely unknown. Current methods for mapping D. vexillum coverage, based on human analysis of images, provide poor spatial resolution and are labor intensive. Here we present an investigation into using measurement of the bottom spectral reflectance to identify D. vexillum. Using two different systems, a NightSea Dive-Spec and a combination of flashlight and a Satlantic hyperspecral radiometer, we collected in-situ measurements of reflectance from which we isolated the reflectance spectrum of D. vexillum. In comparison to other common bottom substrates, D. vexillum appears to be unique in its spectral signature between 500 nm and 675 nm. We have also found evidence that D. vexillum may fluoresce at 550 nm. These findings will be applied to map the distribution D. vexillum from surveys preformed by an autonomous underwater vehicle. Keywords: invasive, ocean optics, species identification
Introduction The east coast of the United States is home to some of the oldest seaports in the country. Ships have transported a variety of marine invasive from around the world to the east coast. A relatively recent invader is the tunicate Didemnum vexillum. D. vexillum was first sighted in the late 1980s on the northeast coast of the United States (Bullard et al., 2007). Since this time the population of D. vexillum has exploded. In the northeast, D. vexillum has become a common sight in inshore and offshore waters. This includes the prized fishing grounds of Georges Bank. D. vexillum may pose a significant threat to the ecosystems of the Northeast because it is an invasive ecosystem engineer. D. vexillum is a bottom colonizing colonial tunicate that spreads rapidly over most substrates. It is able to form a blanket over many substrates, even cobble bottoms. This creates a problem for benthic organisms or ground fish that feed on benthic organism. Its ability to colonize the benthos is unrivaled; it has even been seen to grow right over other organisms (Valentine et al., 2007). It is possible that D. vexillum could change the ecology of northeast waters in the next few years. The first step to finding a solution to the problem of D. vexillum is to understand its distribution. Currently there is an effort to map the extent of D. vexillum on Georges Bank. Mapping of D. vexillum coverage is now being conducted by remote or autonomous vehicles that take photographs of the bottom. Computer recognition of contours and borders find pictures that likely contain D. vexillum, and then a human analyst confirms the presence of D. vexillum. This process is labor intensive and extremely time consuming. This method also provides poor spatial and temporal resolution. Once a significant number of pictures have been analyzed it is possible that the
In: Pollock NW, ed. Diving for Science 2011. Proceedings of the American Academy of Underwater Sciences 30th Symposium. Dauphin Island, AL: AAUS; 2011.
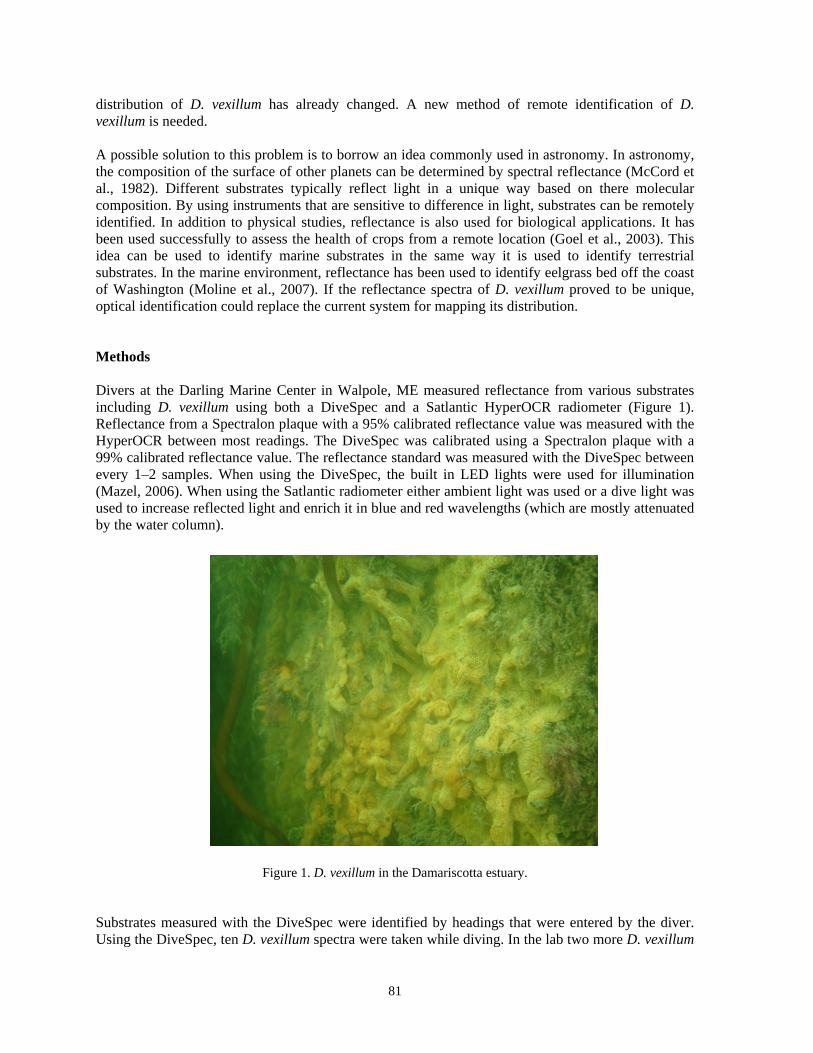
81
distribution of D. vexillum has already changed. A new method of remote identification of D. vexillum is needed. A possible solution to this problem is to borrow an idea commonly used in astronomy. In astronomy, the composition of the surface of other planets can be determined by spectral reflectance (McCord et al., 1982). Different substrates typically reflect light in a unique way based on there molecular composition. By using instruments that are sensitive to difference in light, substrates can be remotely identified. In addition to physical studies, reflectance is also used for biological applications. It has been used successfully to assess the health of crops from a remote location (Goel et al., 2003). This idea can be used to identify marine substrates in the same way it is used to identify terrestrial substrates. In the marine environment, reflectance has been used to identify eelgrass bed off the coast of Washington (Moline et al., 2007). If the reflectance spectra of D. vexillum proved to be unique, optical identification could replace the current system for mapping its distribution. Methods Divers at the Darling Marine Center in Walpole, ME measured reflectance from various substrates including D. vexillum using both a DiveSpec and a Satlantic HyperOCR radiometer (Figure 1). Reflectance from a Spectralon plaque with a 95% calibrated reflectance value was measured with the HyperOCR between most readings. The DiveSpec was calibrated using a Spectralon plaque with a 99% calibrated reflectance value. The reflectance standard was measured with the DiveSpec between every 1–2 samples. When using the DiveSpec, the built in LED lights were used for illumination (Mazel, 2006). When using the Satlantic radiometer either ambient light was used or a dive light was used to increase reflected light and enrich it in blue and red wavelengths (which are mostly attenuated by the water column).
Figure 1. D. vexillum in the Damariscotta estuary.
Substrates measured with the DiveSpec were identified by headings that were entered by the diver. Using the DiveSpec, ten D. vexillum spectra were taken while diving. In the lab two more D. vexillum
82
spectra were taken as well as a variety of other substrates. The data from the Satlantic radiometer required more work to organize because it was allowed to log data continuously. The radiometer lens cap was used as a delimiter between samples. It was also obvious when the dive light was used because this produced much higher reflectance values. Using the notes taken by the divers and the previously mentioned landmarks, the dataset was organized according to substrate. The data included the following ambient light measurements: seven of D. vexillum, two of algae, and one of a sponge. The dive light was used to illuminate five D. vexillum measurements and one sponge measurement. There were also nine ambient light Spectralon plaque measurements and two dive light illuminated Spectralon measurements. The median of all HyperOCR spectra taken during one measurement was used to represent the sample. The median of each Spectralon plaque reading was taken as well. Each sample was divided by the closest plaque reading to calculate percent reflectance. The DiveSpec uses an internal function to conduct the same calculation and returns data in terms of percent reflectance. Ratios were calculated for suspected unique wavelength pairs. Once more spectral data is collected these unique wavelength pairs can be used to create a detection algorithm (Manolakis, 2002). The DiveSpec also includes a fluorescence function that was used to measure D. vexillum fluorescence. The DiveSpec uses blue LEDs to excite fluorescent materials and returns the data in absolute units, instead of percent reflectance. Fluorescence measurements of D. vexillum were taken both in-situ and in the lab. The full library of reflectances measure including pictures of the substrate can be found at http://misclab.umeoce.maine.edu/research/SpecIndex/spec_index.htm. Results Our measurements have allowed us to confidently identify the reflectance spectra of D. vexillum. Both the DiveSpec and HyperOCR return similar reflectance spectra for D. vexillum (Figure 2). When compared to reflectance of the most common substrates we encountered D. vexillum appears unique (Figure 3). Reflectance in the 500–675 nm range is where D. vexillum appears to be most unique, even when compared to another species of colonial tunicate.

83
Figure 2. Reflectance spectra for D. vexillum using DiveSpec (n = 10) (top) and HyperOCR (n = 7) (bottom). All spectra are referenced to 99% reflectance standard. Dashed lines show 95% confidence interval.
In order to create a detection algorithm, identification parameters must be found. One method of identification is to generate ratios or differences between unique wavelengths. The ratio of 550/500 is the most robust ratio we have identified (Table 1). It is quite possible that many more unique ratios exist for D. vexillum. Once enough unique points have been identified, statistical methods can be used to find likely D. vexillum spectra. Similar methods have already been applied in the field of fisheries acoustics (De Robertis et al., 2010).
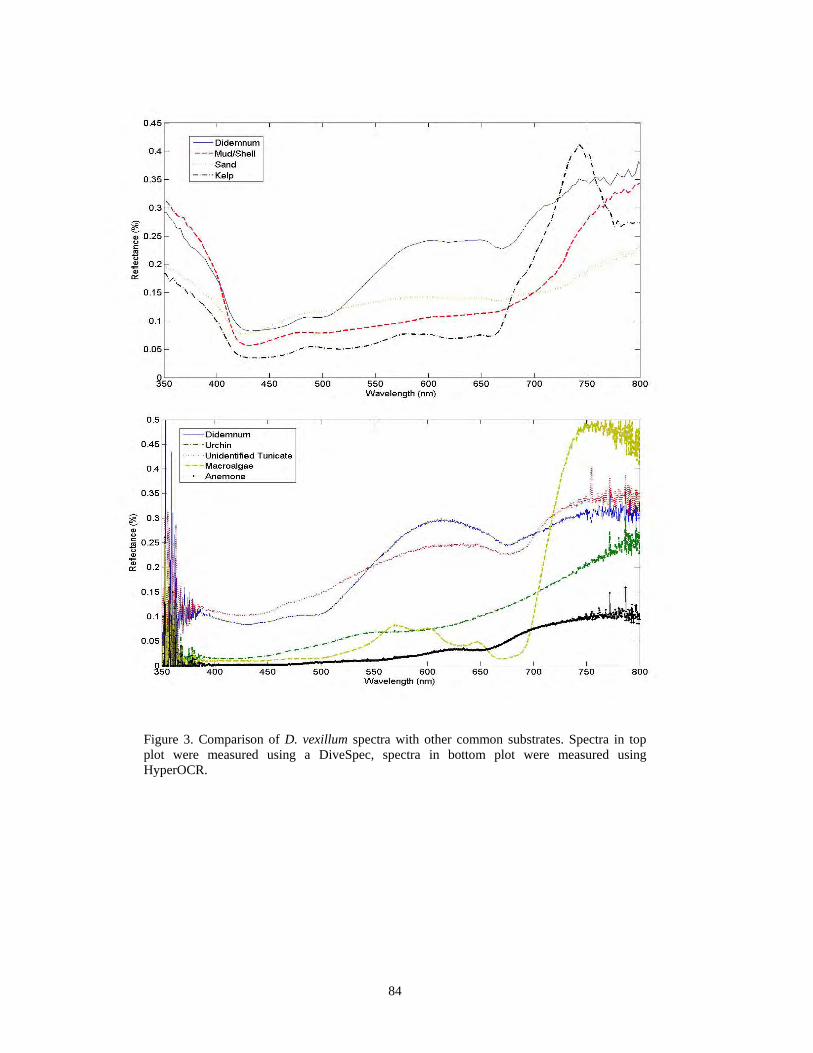
84
Figure 3. Comparison of D. vexillum spectra with other common substrates. Spectra in top plot were measured using a DiveSpec, spectra in bottom plot were measured using HyperOCR.
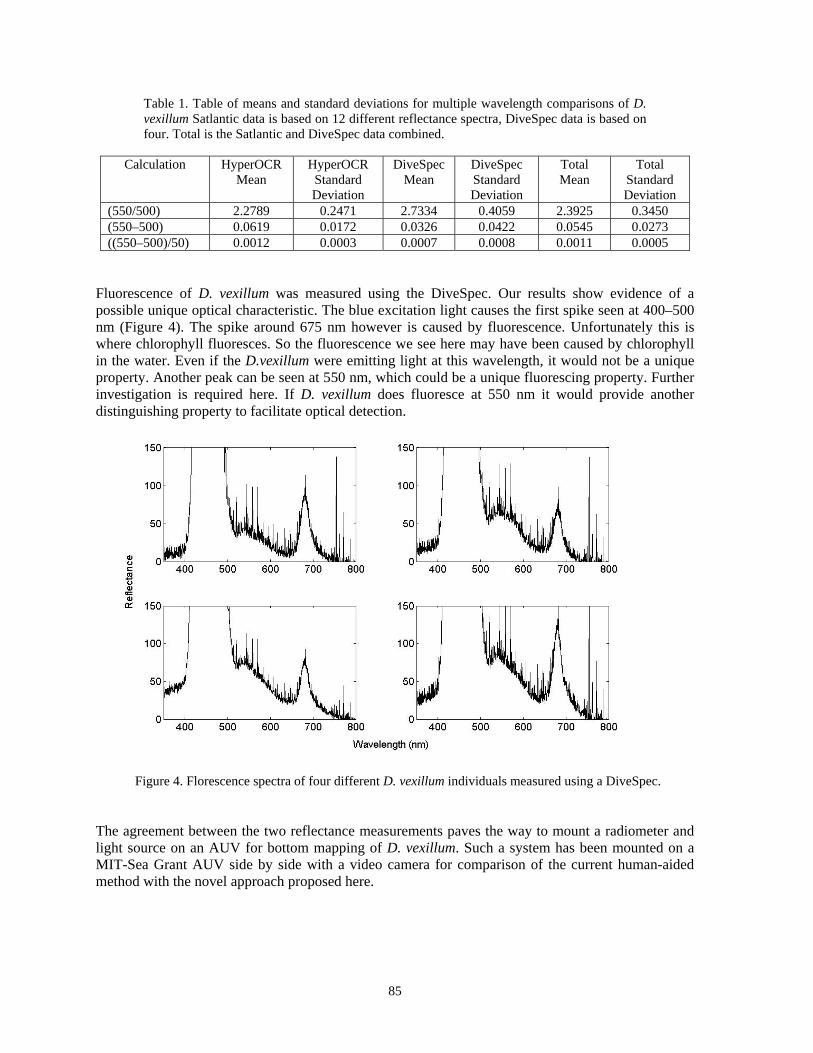
85
Table 1. Table of means and standard deviations for multiple wavelength comparisons of D. vexillum Satlantic data is based on 12 different reflectance spectra, DiveSpec data is based on four. Total is the Satlantic and DiveSpec data combined.
Fluorescence of D. vexillum was measured using the DiveSpec. Our results show evidence of a possible unique optical characteristic. The blue excitation light causes the first spike seen at 400–500 nm (Figure 4). The spike around 675 nm however is caused by fluorescence. Unfortunately this is where chlorophyll fluoresces. So the fluorescence we see here may have been caused by chlorophyll in the water. Even if the D.vexillum were emitting light at this wavelength, it would not be a unique property. Another peak can be seen at 550 nm, which could be a unique fluorescing property. Further investigation is required here. If D. vexillum does fluoresce at 550 nm it would provide another distinguishing property to facilitate optical detection.
Figure 4. Florescence spectra of four different D. vexillum individuals measured using a DiveSpec.
The agreement between the two reflectance measurements paves the way to mount a radiometer and light source on an AUV for bottom mapping of D. vexillum. Such a system has been mounted on a MIT-Sea Grant AUV side by side with a video camera for comparison of the current human-aided method with the novel approach proposed here.
Calculation HyperOCR Mean
HyperOCR Standard Deviation
DiveSpec Mean
DiveSpec Standard Deviation
Total Mean
Total Standard Deviation
(550/500) 2.2789 0.2471 2.7334 0.4059 2.3925 0.3450 (550–500) 0.0619 0.0172 0.0326 0.0422 0.0545 0.0273 ((550–500)/50) 0.0012 0.0003 0.0007 0.0008 0.0011 0.0005
86
Acknowledgments We thank Suzie Arnold for help in diving at the DMC. This work has been funded by SeaGrant and is part of a collaboration with MIT SeaGrant. References Bullard SG, Lambert G, Carman MR, Byrnes J, Whitlatch RB, Ruiz G, Miller RJ, Harris L, Valentine PC, Collie JS, Pederson J, McNaught DC, Cohen AN, Asch RG, Dijkstra J, Heinonen K. The colonial ascidian Didemnum sp. A: current distribution, basic biology and potential threat to marine communities of the northeast and west coasts of North America. J Experim Mar Biol Ecol. 2007; 342: 99–108. De Robertis A, McKelvey DR, Ressler PH. Development and application of an empirical multifrequency method for backscatter classification. Can J Fish Aquatic Sci. 2010; 67: 1459–74. Goel PK, Prasher SO, Landry JA, Patel RM, Bonnell RB, Viau AA, Miller JR. Potential of airborne hyperspectral remote sensing to detect nitrogen deficiency and weed infestation in corn. Computers Electronics Agriculture. 2003; 38: 99–124. Manolakis D, Shaw G. Detection algorithms for hyperspectral imaging applications. Signal Processing Magazine, IEEE. 2002; 19(1): 29–43. Mazel CH. In-situ measurement of reflectance and fluorescence spectra to support hyperspectral remote sensing and marine biology research. Oceans. 2006 (conference): 1–4. McCord TB, Clark RN, Singer RB. Mars: Near-infrared spectral reflectance of surface regions and compositional implications. J Geophysical Res. 1982; 87(B4): 3021–32. Moline MA, Woodruff DL, Evans NR. Optical delineation of benthic habitat using an autonomous underwater vehicle. J Field Robotics. 2007; 24(6): 461–71. Valentine PC, Carman MR, Blackwood DS, Heffron EJ. Ecological observations on the colonial ascidian Didemnum sp. in a New England tide pool habitat. J Experim Mar Biol Ecol. 2007; 342: 109–21.
87
Milestones in Underwater Ichthyology: A Historical Perspective Phillip S. Lobel Boston University, Boston, MA, 02215 USA [email protected] Abstract
The history of underwater studies of fish behavior and ecology begins with William Longley in the early 1900s. Longley used a diving helmet and first generation underwater camera to document fish color patterns and behavior. Unfortunately, he died before he could publish all of his work. The scientific community of the day recognized the great importance of these first underwater studies. As a result, Samuel Hildebrand, senior Ichthyologist, United States Fish and Wildlife Service was selected to collate and edit Longley's notes. The resulting manuscript was published in 1941 as the "Systematic catalogue of the fishes of Tortugas, Florida with observations on color, habits and local distribution." This presentation will review the diving technology that Longley used, highlight his discoveries from underwater observations and show its lasting influenced on coral reef ecology. Keywords: fish behavior, Miller-Dunn diving helmet, reef ecology, underwater photography, William Longley
Introduction The first diving ichthyologist was William H. Longley (who was actually trained as a botanist). He started diving in 1910 using the Miller-Dunn shallow water helmet at the first tropical marine laboratory in the western hemisphere, the Carnegie Marine Laboratory in the Dry Tortugas, Florida. By contrast, the famous William Beebe made his first helmet dive in 1925. Longley is best known for taking the first underwater color photographs in collaboration with Charles Martin for National Geographic Magazine in 1926. Prior to this, Longely used an underwater black and white camera to document fish behavior. Longley's monumental study "Systematic catalogue of the fishes of Tortugas, Florida with observations on color, habits and local distribution" was published in 1941 after his death in 1937. Longley's notes and preliminary manuscript were edited and completed by Samuel Hildebrand, also an ichthyologist. This book was based on Longley's observations of over 25 years of diving using a shallow-water helmet and includes dozens of underwater photographs. It was the first underwater study of fish behavior and set the stage for the generations of diving ichthyologists who followed. This presentation will review the major discoveries by Longley and the diving equipment he used. I will also summarize some subsequent milestones in scientific diving by ichthyologists over the years when scuba first became available (particularly by John Randall) and the further discoveries eventually made possible using rebreathers. My interest in the studies by Longley developed from research that I had done in collaboration with J. E. Randall. Randall and I had worked on two studies concerning goby behavior and ecology. While reviewing the literature, we found that Longley reported these behaviors for first time. These studies concerned the symbiosis of goby and shrimps in burrows (Randall et al., 2005) and the systematics and behavior of cleaning gobies in the Caribbean (Randall and Lobel, 2009).
In: Pollock NW, ed. Diving for Science 2011. Proceedings of the American Academy of Underwater Sciences 30th Symposium. Dauphin Island, AL: AAUS; 2011.
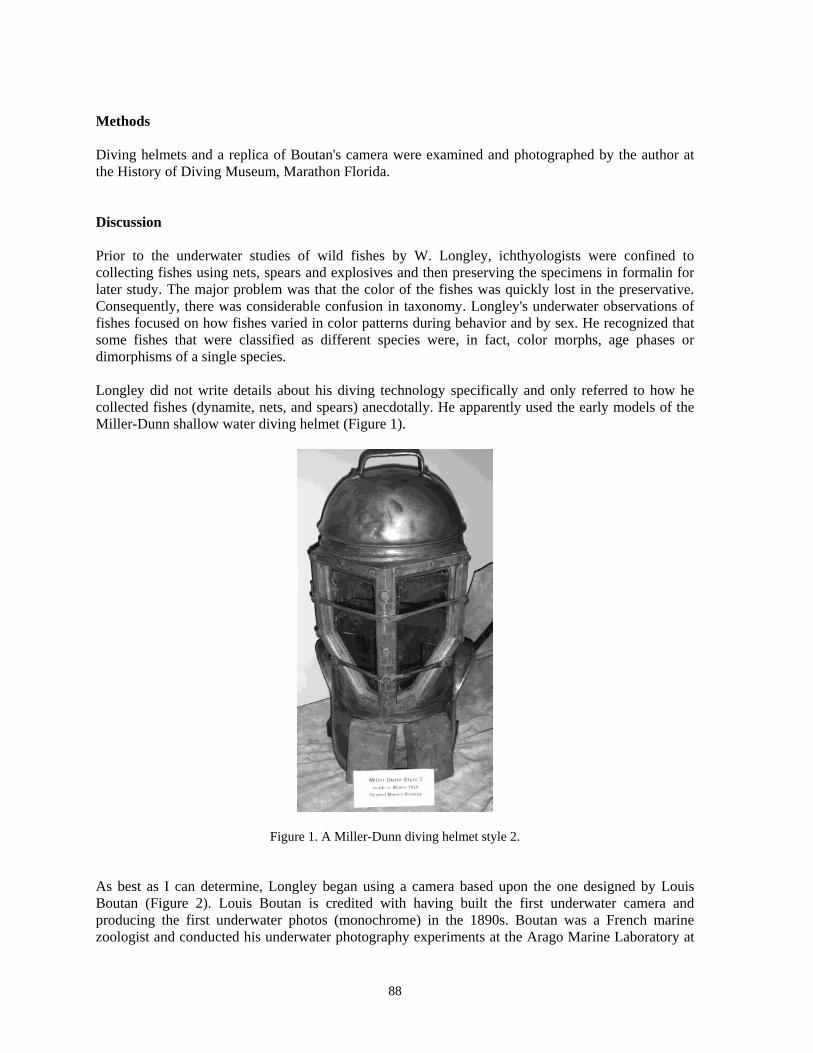
88
Methods Diving helmets and a replica of Boutan's camera were examined and photographed by the author at the History of Diving Museum, Marathon Florida. Discussion Prior to the underwater studies of wild fishes by W. Longley, ichthyologists were confined to collecting fishes using nets, spears and explosives and then preserving the specimens in formalin for later study. The major problem was that the color of the fishes was quickly lost in the preservative. Consequently, there was considerable confusion in taxonomy. Longley's underwater observations of fishes focused on how fishes varied in color patterns during behavior and by sex. He recognized that some fishes that were classified as different species were, in fact, color morphs, age phases or dimorphisms of a single species. Longley did not write details about his diving technology specifically and only referred to how he collected fishes (dynamite, nets, and spears) anecdotally. He apparently used the early models of the Miller-Dunn shallow water diving helmet (Figure 1).
Figure 1. A Miller-Dunn diving helmet style 2. As best as I can determine, Longley began using a camera based upon the one designed by Louis Boutan (Figure 2). Louis Boutan is credited with having built the first underwater camera and producing the first underwater photos (monochrome) in the 1890s. Boutan was a French marine zoologist and conducted his underwater photography experiments at the Arago Marine Laboratory at
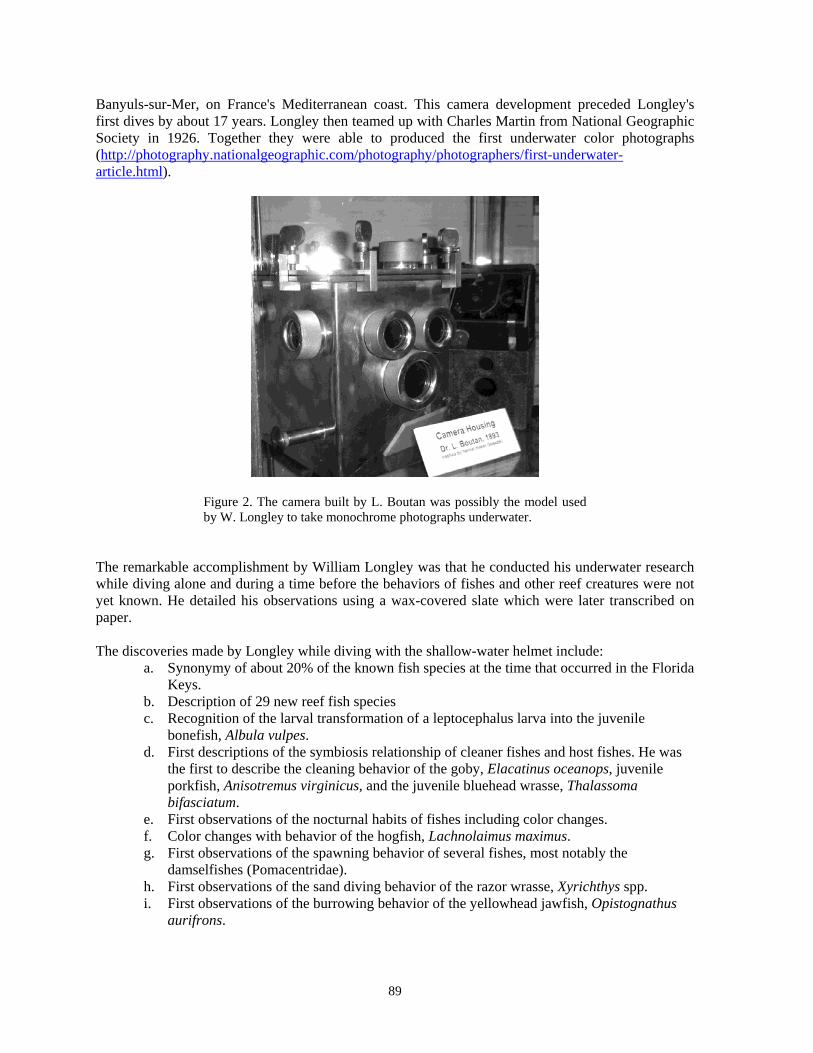
89
Banyuls-sur-Mer, on France's Mediterranean coast. This camera development preceded Longley's first dives by about 17 years. Longley then teamed up with Charles Martin from National Geographic Society in 1926. Together they were able to produced the first underwater color photographs (http://photography.nationalgeographic.com/photography/photographers/first-underwater-article.html).
Figure 2. The camera built by L. Boutan was possibly the model used by W. Longley to take monochrome photographs underwater.
The remarkable accomplishment by William Longley was that he conducted his underwater research while diving alone and during a time before the behaviors of fishes and other reef creatures were not yet known. He detailed his observations using a wax-covered slate which were later transcribed on paper. The discoveries made by Longley while diving with the shallow-water helmet include:
a. Synonymy of about 20% of the known fish species at the time that occurred in the Florida Keys.
b. Description of 29 new reef fish species c. Recognition of the larval transformation of a leptocephalus larva into the juvenile
bonefish, Albula vulpes. d. First descriptions of the symbiosis relationship of cleaner fishes and host fishes. He was
the first to describe the cleaning behavior of the goby, Elacatinus oceanops, juvenile porkfish, Anisotremus virginicus, and the juvenile bluehead wrasse, Thalassoma bifasciatum.
e. First observations of the nocturnal habits of fishes including color changes. f. Color changes with behavior of the hogfish, Lachnolaimus maximus. g. First observations of the spawning behavior of several fishes, most notably the
damselfishes (Pomacentridae). h. First observations of the sand diving behavior of the razor wrasse, Xyrichthys spp. i. First observations of the burrowing behavior of the yellowhead jawfish, Opistognathus
aurifrons.
90
j. First observations of the symbiotic burrow sharing behavior of the goby, Nes longus and the alpheid shrimp, Alpheus floridanus.
In many ways, the subsequent discoveries by John E. Randall were built upon the scientific approach that Longley established. Randall also used photography and developed a new technique for photographing fishes in trays in order to accurately document their color patterns (Randall, 1961). To obtain the best-looking specimens with minimal damage, Randall invented the multi-prong mini-spear (Randall, 1963). Randall's many discoveries were largely based upon being a skilled scuba diver who understood what he was observing. He readily recognized new species and was often the first ichthyologist to dive many remote locations worldwide. Today, scientists can dive longer and deeper using nitrox and rebreathers. Scientists using rebreathers are now going to where open-circuit scuba divers have not been able to collect before and are discovering new fishes at deeper depths (e.g., Pyle, 1996). Previously unknown behaviors such as the sounds made by fishes during mating are also being discovered using the silent rebreathers and innovative recording technology (e.g., Lobel, 2002). We can see a simple progression in our diving history. The core element of advancement being based on the gear used to explore the undersea. The importance of the underwater breathing technology to making advancements in our science is obvious. We need to imagine what are the next technological innovations needed that will enable new discoveries in the future. Acknowledgments I sincerely thank Sally Bauer and the late Joe Bauer for many years of great conversations about the history of diving. I also thank Jack Randall, who has taught me the history of marine ichthyology and much more. References Longley WH. Life on a Coral Reef. National Geographic Magazine. 1927; 51(1). Longley WH, Hildebrand S. Systematic catalogue of the fishes of Tortugas, Florida with observations on color, habits and local distribution. Carnegie Institute of Washington Publication 535, Washington DC, 1941; 331pp + 34 plates. Lobel PS. Diversity of fish spawning sounds and the application of passive acoustic monitoring. Bioacoustics. 2002; 12: 286–9. Pyle RL. How much coral reef biodiversity are we missing? Global biodiversity. 1996; 6(1): 3–7. Randall JE. A technique for fish photography. Copeia. 1961; 2: 241–2. Randall JE. Methods of collecting small fishes. Underwater Naturalist. 1963; 1(2): 6 –11, 32–6. Randall JE, Lobel PS. A literature review of the sponge-dwelling gobiid fishes of the genus Elacatinus from the western Atlantic, with description of two new Caribbean species. Zootaxa. 2009; 2133: 1–19. Randall JE, Lobel PS, Kennedy CW. Comparative ecology of the gobies Nes longus and Ctenogobius saepepallens, both symbiotic with the snapping shrimp Alpheus floridanus. Environ Biol Fishes. 2005; 74(2): 119–27.
91
Discoveries of New Marine Species of the Aleutian Islands Stephen C. Jewett1,2, Roger N. Clark3
1 Institute of Marine Science, 128 O'Neill, PO Box 757220; 2 University of Alaska Fairbanks, Fairbanks, AK 99775–7220, USA [email protected] 3 Insignis Biological Consulting, 3808 E. Pinehurst Drive, Eagle Mountain, UT 84005–6007, USA [email protected] Abstract
During the summers of 2006 and 2007 divers descended the shallow (<20 m), nearshore marine waters of the Aleutian Islands to conduct the first Alaska Monitoring and Assessment Program (AKMAP) of this remote region. AKMAP coastal surveys are based on the Environmental Protection Agency National Coastal Assessment procedures using a probabilistic sampling design featuring monitoring of select environmental indicators. Ancillary products that emerged from the Aleutian surveys were the discoveries of several species new to science. As of 2011, the following discoveries were confirmed and published in peer-reviewed journals: one new genus and species of benthic marine alga; one new species of sea anemone; one new genus of sea star; and 17 new species of sea stars. This paper presents an overview of these published new species. Keywords: alga, new species, sea anemone, sea stars, taxonomy
Introduction Between 2000 and 2009 approximately 2700 scientists from more than 80 nations were involved in more than 540 expeditions in all oceans, thus contributing to the Census of Marine Life (Ausubel et al., 2010). Among the millions of species collected in marine waters, the Census found more than 6,000 potentially new species and completed formal descriptions of more than 1,200 of them. The Census found living creatures everywhere it looked, even in the most extreme environments. Extreme and remote environments are where one would expect to find new species because of the difficulty of accessing these locations. One such extreme and remote environment is the Aleutian Islands of Alaska. The Aleutian Archipelago lies west of the Alaska Peninsula, extending westward from Unimak Island to Attu Island, a distance of nearly 1,200 miles (1,931 km). Over 200 Aleutian Islands totaling about 2.7 million acres (110,000 km2) form an arc that separates the North Pacific Ocean from the Bering Sea. The chain arcs farther south than any point in Southeast Alaska, dipping below 52º latitude. Because the International Dateline runs north and south at 180º longitude through Amchitka Pass, the Aleutians include both the easternmost and westernmost points in the United States. The Aleutians contain five island groups: Fox Islands, Islands of Four Mountains, Andreanof Islands, Rat Islands, and Near Island (Figure 1). Most Aleutian Islands are part of the USF&W Alaska Maritime Wildlife Refuge. Further to the west of the Near Islands, the Commander Islands, Russia, continue the island arc and are biologically linked to the Kamchatka shelf and coast. On the southern edge of this submerged mountain range, of which the Aleutian Islands are the exposed peaks, is a curving submarine trench as deep as ~25,000 ft (7,600 m) extending across the North Pacific for ~2000 statute miles (3,200 km) from the Gulf of Alaska to Kamchatka Peninsula. Climatically the
In: Pollock NW, ed. Diving for Science 2011. Proceedings of the American Academy of Underwater Sciences 30th Symposium. Dauphin Island, AL: AAUS; 2011.
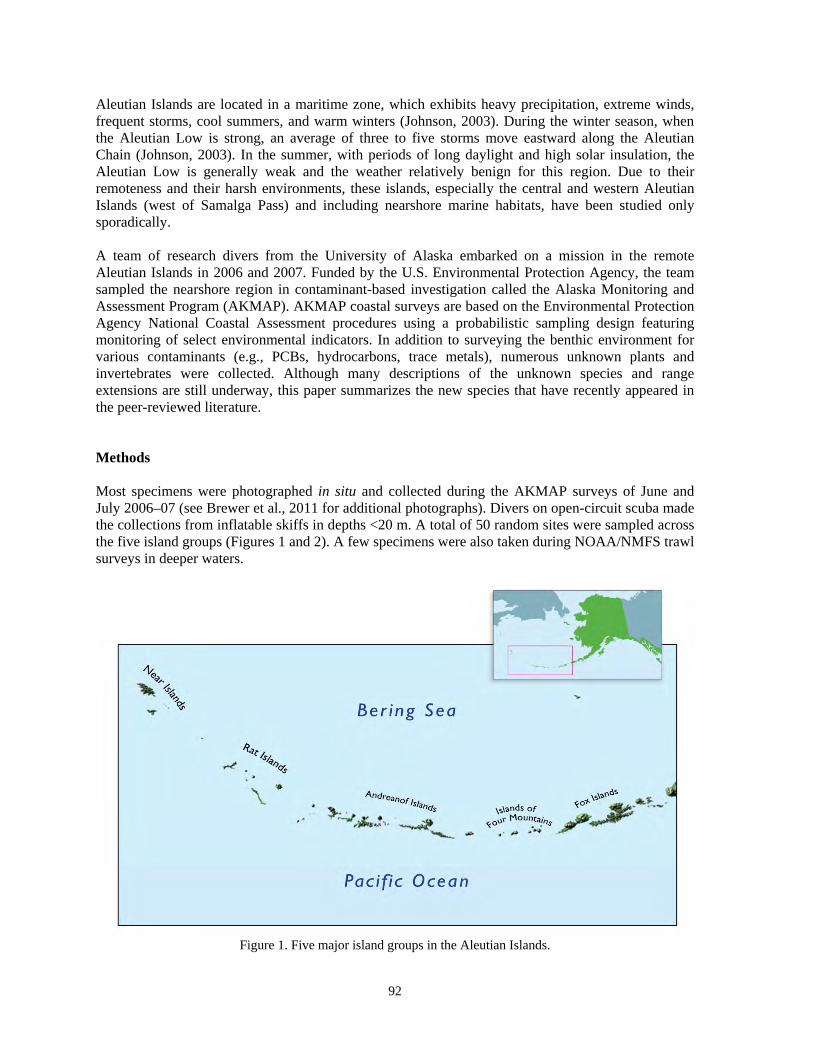
92
Aleutian Islands are located in a maritime zone, which exhibits heavy precipitation, extreme winds, frequent storms, cool summers, and warm winters (Johnson, 2003). During the winter season, when the Aleutian Low is strong, an average of three to five storms move eastward along the Aleutian Chain (Johnson, 2003). In the summer, with periods of long daylight and high solar insulation, the Aleutian Low is generally weak and the weather relatively benign for this region. Due to their remoteness and their harsh environments, these islands, especially the central and western Aleutian Islands (west of Samalga Pass) and including nearshore marine habitats, have been studied only sporadically. A team of research divers from the University of Alaska embarked on a mission in the remote Aleutian Islands in 2006 and 2007. Funded by the U.S. Environmental Protection Agency, the team sampled the nearshore region in contaminant-based investigation called the Alaska Monitoring and Assessment Program (AKMAP). AKMAP coastal surveys are based on the Environmental Protection Agency National Coastal Assessment procedures using a probabilistic sampling design featuring monitoring of select environmental indicators. In addition to surveying the benthic environment for various contaminants (e.g., PCBs, hydrocarbons, trace metals), numerous unknown plants and invertebrates were collected. Although many descriptions of the unknown species and range extensions are still underway, this paper summarizes the new species that have recently appeared in the peer-reviewed literature. Methods Most specimens were photographed in situ and collected during the AKMAP surveys of June and July 2006–07 (see Brewer et al., 2011 for additional photographs). Divers on open-circuit scuba made the collections from inflatable skiffs in depths <20 m. A total of 50 random sites were sampled across the five island groups (Figures 1 and 2). A few specimens were also taken during NOAA/NMFS trawl surveys in deeper waters.
Figure 1. Five major island groups in the Aleutian Islands.
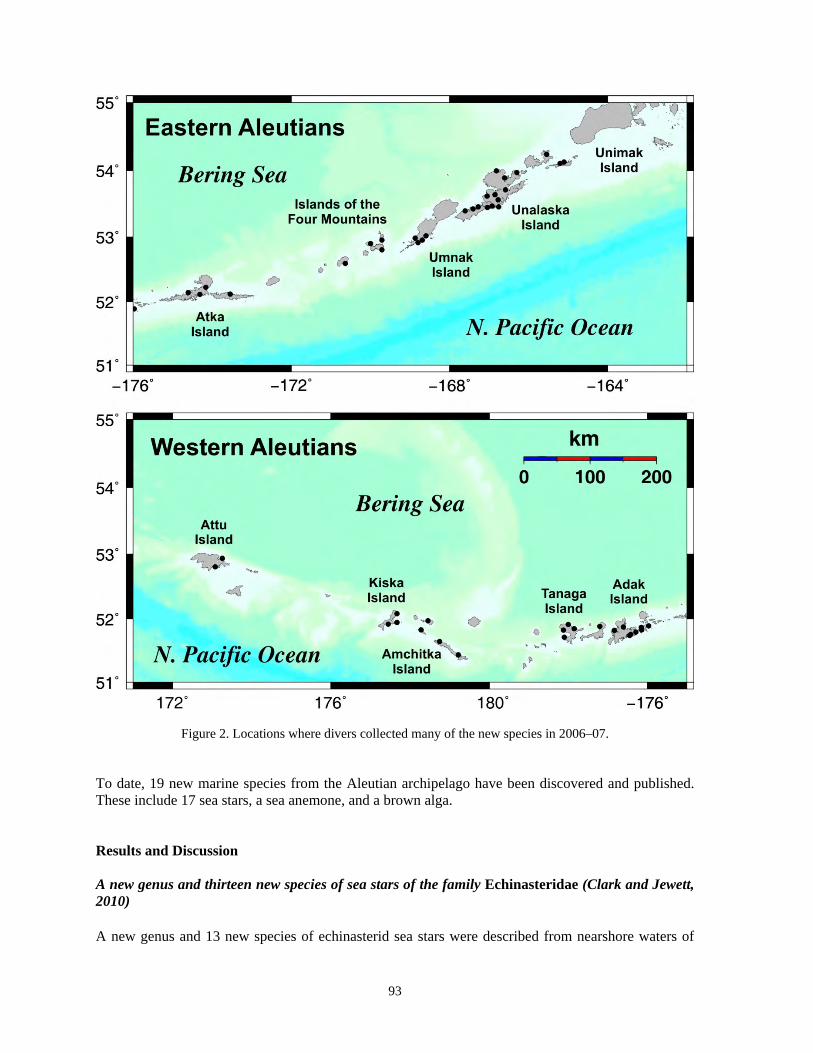
93
Figure 2. Locations where divers collected many of the new species in 2006–07. To date, 19 new marine species from the Aleutian archipelago have been discovered and published. These include 17 sea stars, a sea anemone, and a brown alga. Results and Discussion A new genus and thirteen new species of sea stars of the family Echinasteridae (Clark and Jewett, 2010) A new genus and 13 new species of echinasterid sea stars were described from nearshore waters of
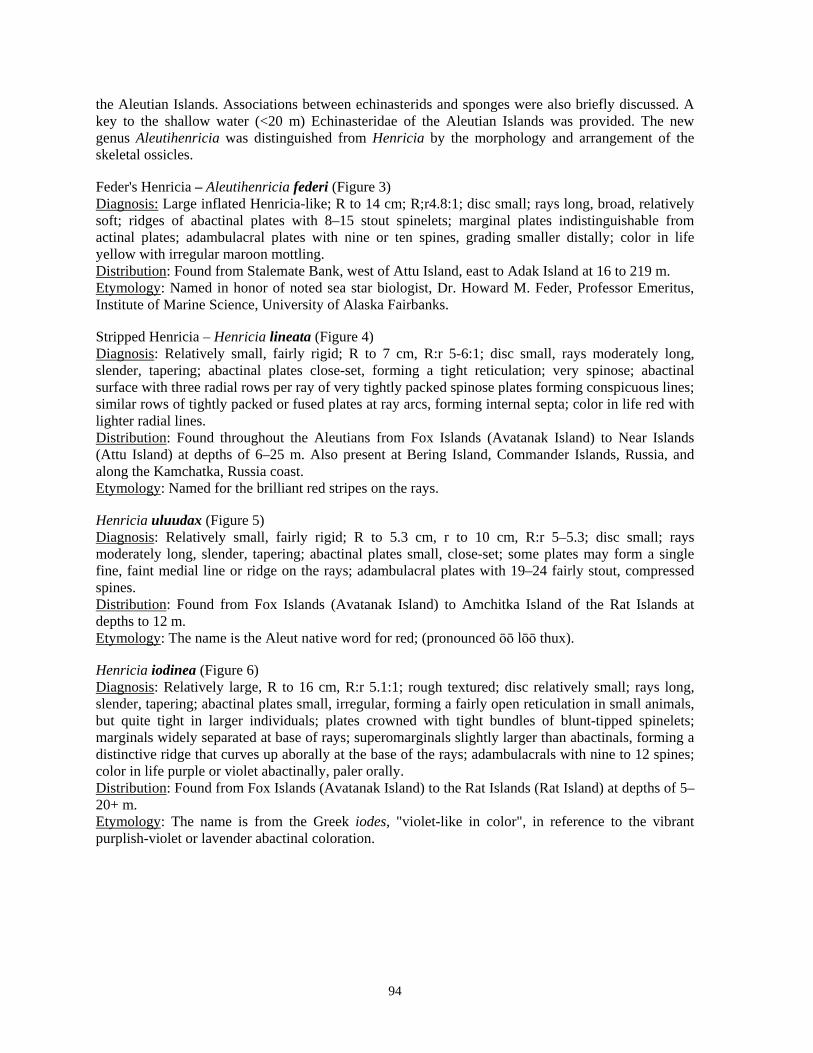
94
the Aleutian Islands. Associations between echinasterids and sponges were also briefly discussed. A key to the shallow water (<20 m) Echinasteridae of the Aleutian Islands was provided. The new genus Aleutihenricia was distinguished from Henricia by the morphology and arrangement of the skeletal ossicles. Feder's Henricia – Aleutihenricia federi (Figure 3) Diagnosis: Large inflated Henricia-like; R to 14 cm; R;r4.8:1; disc small; rays long, broad, relatively soft; ridges of abactinal plates with 8–15 stout spinelets; marginal plates indistinguishable from actinal plates; adambulacral plates with nine or ten spines, grading smaller distally; color in life yellow with irregular maroon mottling. Distribution: Found from Stalemate Bank, west of Attu Island, east to Adak Island at 16 to 219 m. Etymology: Named in honor of noted sea star biologist, Dr. Howard M. Feder, Professor Emeritus, Institute of Marine Science, University of Alaska Fairbanks. Stripped Henricia – Henricia lineata (Figure 4) Diagnosis: Relatively small, fairly rigid; R to 7 cm, R:r 5-6:1; disc small, rays moderately long, slender, tapering; abactinal plates close-set, forming a tight reticulation; very spinose; abactinal surface with three radial rows per ray of very tightly packed spinose plates forming conspicuous lines; similar rows of tightly packed or fused plates at ray arcs, forming internal septa; color in life red with lighter radial lines. Distribution: Found throughout the Aleutians from Fox Islands (Avatanak Island) to Near Islands (Attu Island) at depths of 6–25 m. Also present at Bering Island, Commander Islands, Russia, and along the Kamchatka, Russia coast. Etymology: Named for the brilliant red stripes on the rays. Henricia uluudax (Figure 5) Diagnosis: Relatively small, fairly rigid; R to 5.3 cm, r to 10 cm, R:r 5–5.3; disc small; rays moderately long, slender, tapering; abactinal plates small, close-set; some plates may form a single fine, faint medial line or ridge on the rays; adambulacral plates with 19–24 fairly stout, compressed spines. Distribution: Found from Fox Islands (Avatanak Island) to Amchitka Island of the Rat Islands at depths to 12 m. Etymology: The name is the Aleut native word for red; (pronounced ōō lōō thux). Henricia iodinea (Figure 6) Diagnosis: Relatively large, R to 16 cm, R:r 5.1:1; rough textured; disc relatively small; rays long, slender, tapering; abactinal plates small, irregular, forming a fairly open reticulation in small animals, but quite tight in larger individuals; plates crowned with tight bundles of blunt-tipped spinelets; marginals widely separated at base of rays; superomarginals slightly larger than abactinals, forming a distinctive ridge that curves up aborally at the base of the rays; adambulacrals with nine to 12 spines; color in life purple or violet abactinally, paler orally. Distribution: Found from Fox Islands (Avatanak Island) to the Rat Islands (Rat Island) at depths of 5–20+ m. Etymology: The name is from the Greek iodes, "violet-like in color", in reference to the vibrant purplish-violet or lavender abactinal coloration.
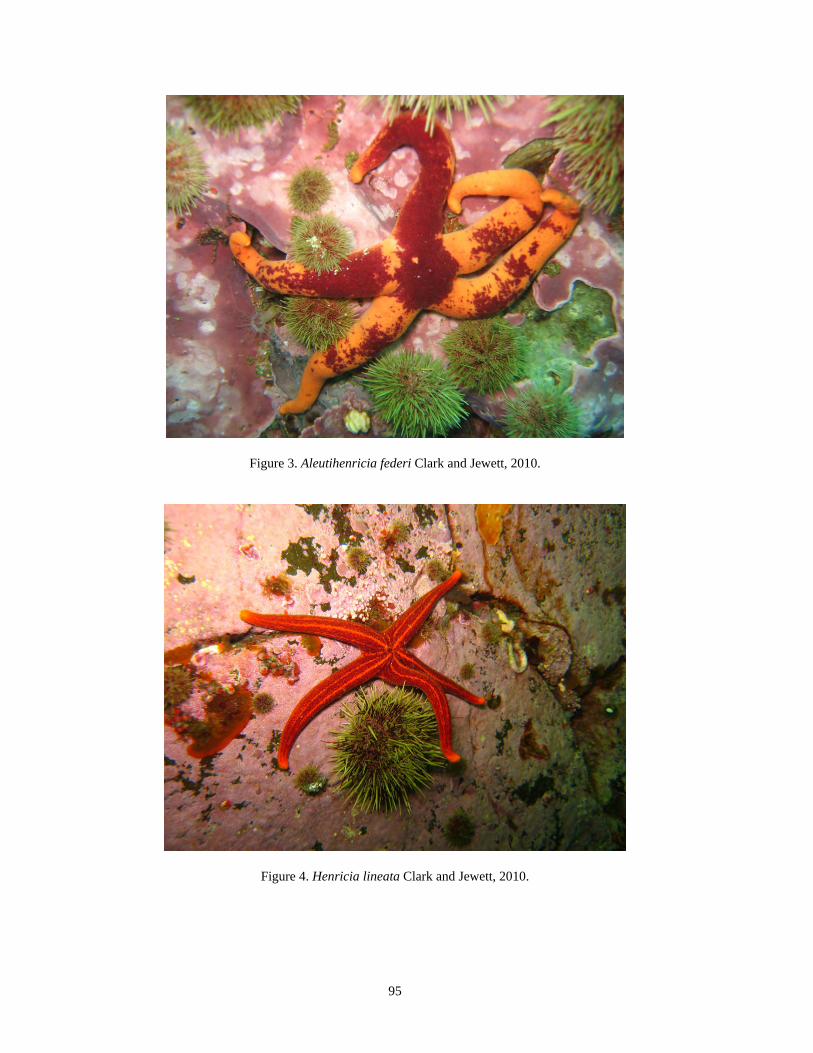
95
Figure 3. Aleutihenricia federi Clark and Jewett, 2010.
Figure 4. Henricia lineata Clark and Jewett, 2010.
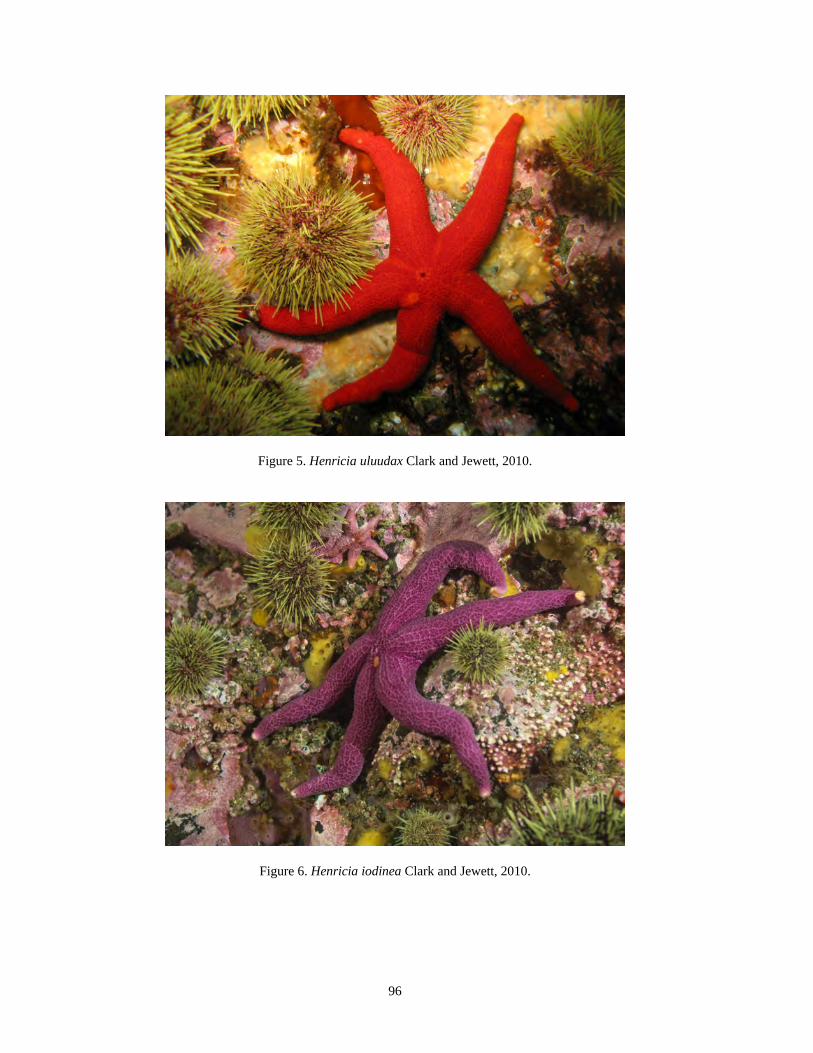
96
Figure 5. Henricia uluudax Clark and Jewett, 2010.
Figure 6. Henricia iodinea Clark and Jewett, 2010.
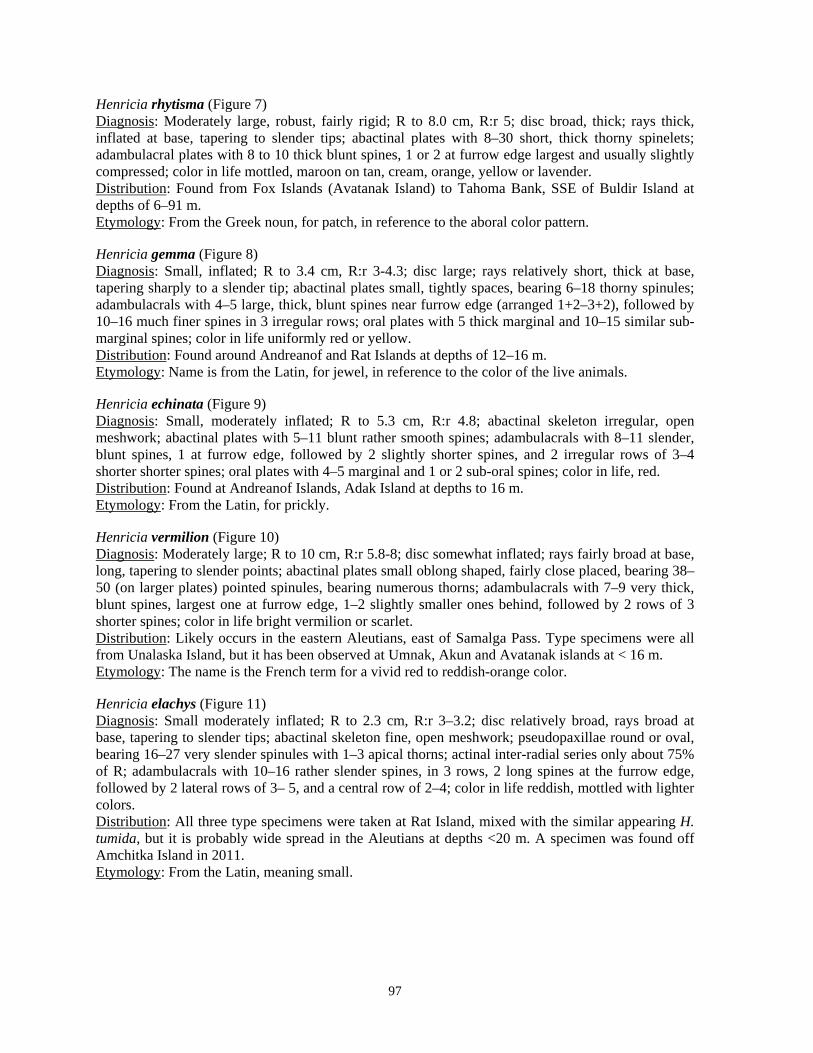
97
Henricia rhytisma (Figure 7) Diagnosis: Moderately large, robust, fairly rigid; R to 8.0 cm, R:r 5; disc broad, thick; rays thick, inflated at base, tapering to slender tips; abactinal plates with 8–30 short, thick thorny spinelets; adambulacral plates with 8 to 10 thick blunt spines, 1 or 2 at furrow edge largest and usually slightly compressed; color in life mottled, maroon on tan, cream, orange, yellow or lavender. Distribution: Found from Fox Islands (Avatanak Island) to Tahoma Bank, SSE of Buldir Island at depths of 6–91 m. Etymology: From the Greek noun, for patch, in reference to the aboral color pattern. Henricia gemma (Figure 8) Diagnosis: Small, inflated; R to 3.4 cm, R:r 3-4.3; disc large; rays relatively short, thick at base, tapering sharply to a slender tip; abactinal plates small, tightly spaces, bearing 6–18 thorny spinules; adambulacrals with 4–5 large, thick, blunt spines near furrow edge (arranged 1+2–3+2), followed by 10–16 much finer spines in 3 irregular rows; oral plates with 5 thick marginal and 10–15 similar sub-marginal spines; color in life uniformly red or yellow. Distribution: Found around Andreanof and Rat Islands at depths of 12–16 m. Etymology: Name is from the Latin, for jewel, in reference to the color of the live animals. Henricia echinata (Figure 9) Diagnosis: Small, moderately inflated; R to 5.3 cm, R:r 4.8; abactinal skeleton irregular, open meshwork; abactinal plates with 5–11 blunt rather smooth spines; adambulacrals with 8–11 slender, blunt spines, 1 at furrow edge, followed by 2 slightly shorter spines, and 2 irregular rows of 3–4 shorter shorter spines; oral plates with 4–5 marginal and 1 or 2 sub-oral spines; color in life, red. Distribution: Found at Andreanof Islands, Adak Island at depths to 16 m. Etymology: From the Latin, for prickly. Henricia vermilion (Figure 10) Diagnosis: Moderately large; R to 10 cm, R:r 5.8-8; disc somewhat inflated; rays fairly broad at base, long, tapering to slender points; abactinal plates small oblong shaped, fairly close placed, bearing 38–50 (on larger plates) pointed spinules, bearing numerous thorns; adambulacrals with 7–9 very thick, blunt spines, largest one at furrow edge, 1–2 slightly smaller ones behind, followed by 2 rows of 3 shorter spines; color in life bright vermilion or scarlet. Distribution: Likely occurs in the eastern Aleutians, east of Samalga Pass. Type specimens were all from Unalaska Island, but it has been observed at Umnak, Akun and Avatanak islands at < 16 m. Etymology: The name is the French term for a vivid red to reddish-orange color. Henricia elachys (Figure 11) Diagnosis: Small moderately inflated; R to 2.3 cm, R:r 3–3.2; disc relatively broad, rays broad at base, tapering to slender tips; abactinal skeleton fine, open meshwork; pseudopaxillae round or oval, bearing 16–27 very slender spinules with 1–3 apical thorns; actinal inter-radial series only about 75% of R; adambulacrals with 10–16 rather slender spines, in 3 rows, 2 long spines at the furrow edge, followed by 2 lateral rows of 3– 5, and a central row of 2–4; color in life reddish, mottled with lighter colors. Distribution: All three type specimens were taken at Rat Island, mixed with the similar appearing H. tumida, but it is probably wide spread in the Aleutians at depths <20 m. A specimen was found off Amchitka Island in 2011. Etymology: From the Latin, meaning small.
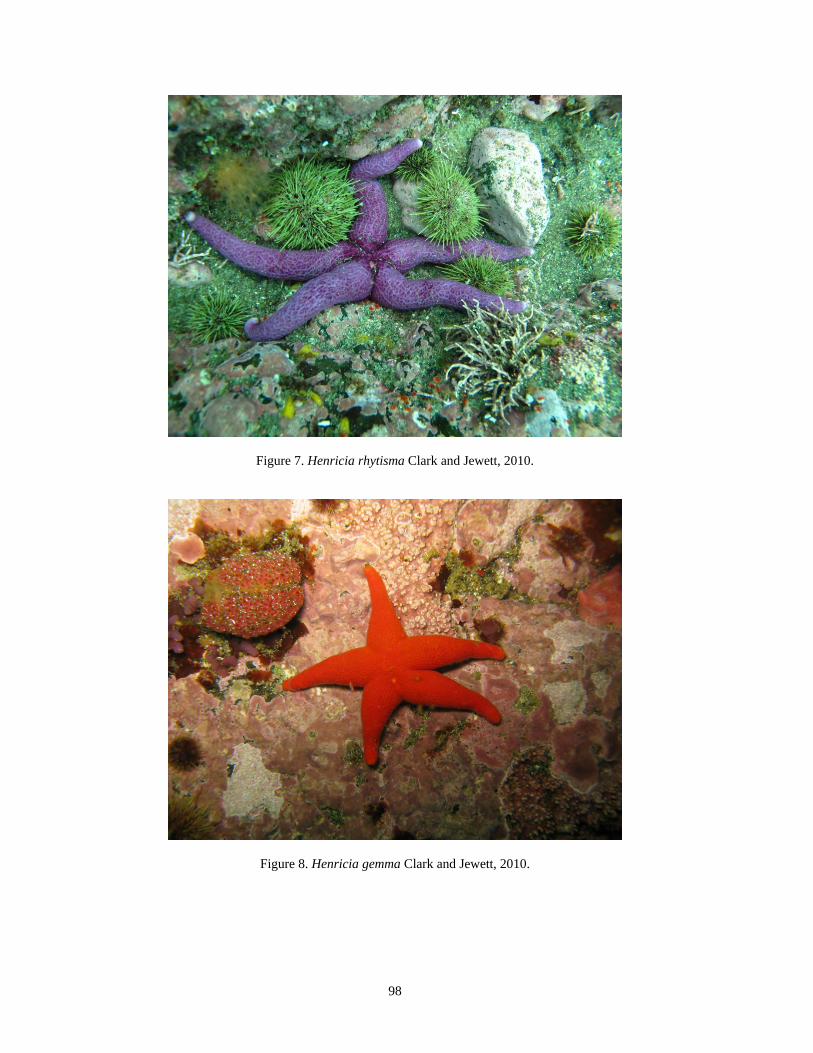
98
Figure 7. Henricia rhytisma Clark and Jewett, 2010.
Figure 8. Henricia gemma Clark and Jewett, 2010.
99
Figure 9. Henricia echinata Clark and Jewett, 2010.
Figure 10. Henricia vermilion Clark and Jewett, 2010.

100
Figure 11. Henricia elachys Clark and Jewett, 2010.
Figure 12. Henricia insignis Clark and Jewett, 2010.
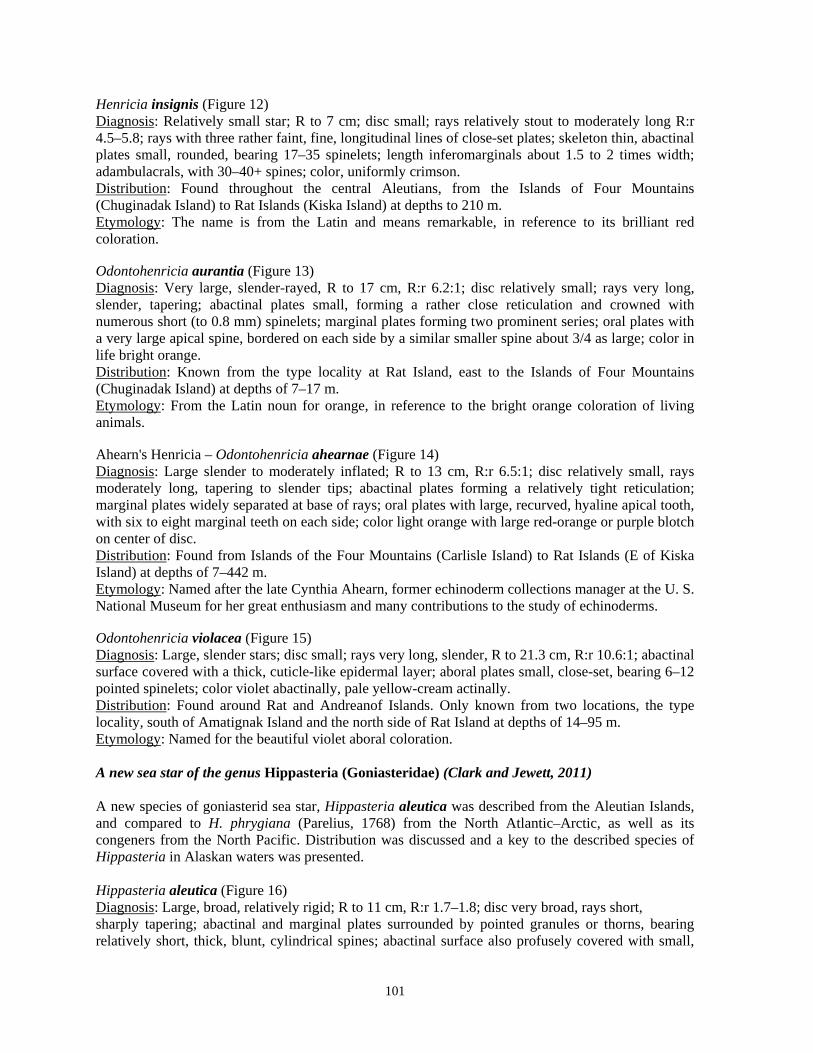
101
Henricia insignis (Figure 12) Diagnosis: Relatively small star; R to 7 cm; disc small; rays relatively stout to moderately long R:r 4.5–5.8; rays with three rather faint, fine, longitudinal lines of close-set plates; skeleton thin, abactinal plates small, rounded, bearing 17–35 spinelets; length inferomarginals about 1.5 to 2 times width; adambulacrals, with 30–40+ spines; color, uniformly crimson. Distribution: Found throughout the central Aleutians, from the Islands of Four Mountains (Chuginadak Island) to Rat Islands (Kiska Island) at depths to 210 m. Etymology: The name is from the Latin and means remarkable, in reference to its brilliant red coloration. Odontohenricia aurantia (Figure 13) Diagnosis: Very large, slender-rayed, R to 17 cm, R:r 6.2:1; disc relatively small; rays very long, slender, tapering; abactinal plates small, forming a rather close reticulation and crowned with numerous short (to 0.8 mm) spinelets; marginal plates forming two prominent series; oral plates with a very large apical spine, bordered on each side by a similar smaller spine about 3/4 as large; color in life bright orange. Distribution: Known from the type locality at Rat Island, east to the Islands of Four Mountains (Chuginadak Island) at depths of 7–17 m. Etymology: From the Latin noun for orange, in reference to the bright orange coloration of living animals. Ahearn's Henricia – Odontohenricia ahearnae (Figure 14) Diagnosis: Large slender to moderately inflated; R to 13 cm, R:r 6.5:1; disc relatively small, rays moderately long, tapering to slender tips; abactinal plates forming a relatively tight reticulation; marginal plates widely separated at base of rays; oral plates with large, recurved, hyaline apical tooth, with six to eight marginal teeth on each side; color light orange with large red-orange or purple blotch on center of disc. Distribution: Found from Islands of the Four Mountains (Carlisle Island) to Rat Islands (E of Kiska Island) at depths of 7–442 m. Etymology: Named after the late Cynthia Ahearn, former echinoderm collections manager at the U. S. National Museum for her great enthusiasm and many contributions to the study of echinoderms. Odontohenricia violacea (Figure 15) Diagnosis: Large, slender stars; disc small; rays very long, slender, R to 21.3 cm, R:r 10.6:1; abactinal surface covered with a thick, cuticle-like epidermal layer; aboral plates small, close-set, bearing 6–12 pointed spinelets; color violet abactinally, pale yellow-cream actinally. Distribution: Found around Rat and Andreanof Islands. Only known from two locations, the type locality, south of Amatignak Island and the north side of Rat Island at depths of 14–95 m. Etymology: Named for the beautiful violet aboral coloration. A new sea star of the genus Hippasteria (Goniasteridae) (Clark and Jewett, 2011) A new species of goniasterid sea star, Hippasteria aleutica was described from the Aleutian Islands, and compared to H. phrygiana (Parelius, 1768) from the North Atlantic–Arctic, as well as its congeners from the North Pacific. Distribution was discussed and a key to the described species of Hippasteria in Alaskan waters was presented. Hippasteria aleutica (Figure 16) Diagnosis: Large, broad, relatively rigid; R to 11 cm, R:r 1.7–1.8; disc very broad, rays short, sharply tapering; abactinal and marginal plates surrounded by pointed granules or thorns, bearing relatively short, thick, blunt, cylindrical spines; abactinal surface also profusely covered with small,
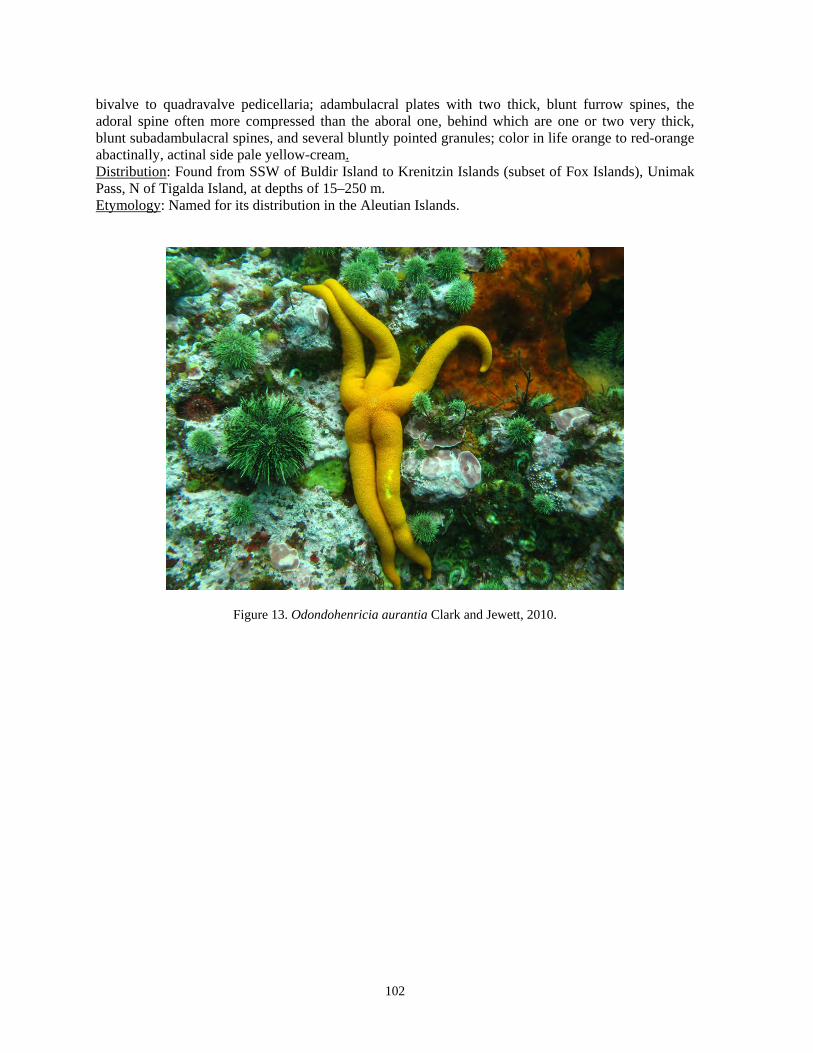
102
bivalve to quadravalve pedicellaria; adambulacral plates with two thick, blunt furrow spines, the adoral spine often more compressed than the aboral one, behind which are one or two very thick, blunt subadambulacral spines, and several bluntly pointed granules; color in life orange to red-orange abactinally, actinal side pale yellow-cream. Distribution: Found from SSW of Buldir Island to Krenitzin Islands (subset of Fox Islands), Unimak Pass, N of Tigalda Island, at depths of 15–250 m. Etymology: Named for its distribution in the Aleutian Islands.
Figure 13. Odondohenricia aurantia Clark and Jewett, 2010.
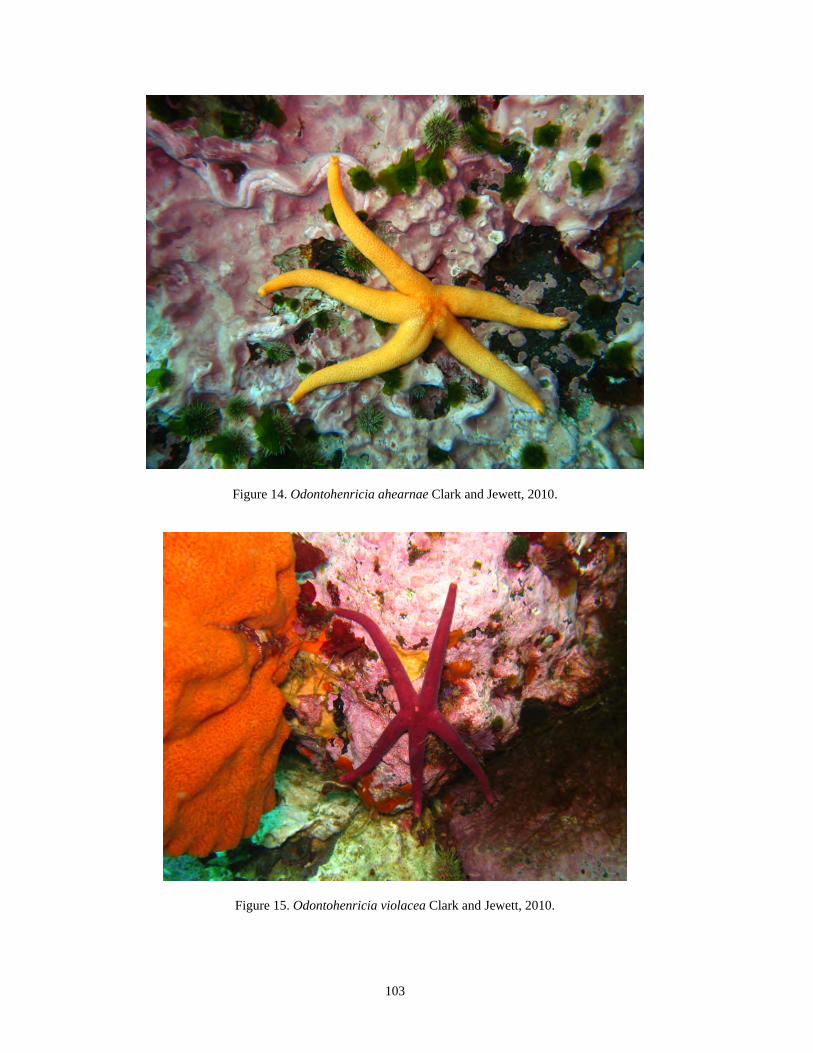
103
Figure 14. Odontohenricia ahearnae Clark and Jewett, 2010.
Figure 15. Odontohenricia violacea Clark and Jewett, 2010.
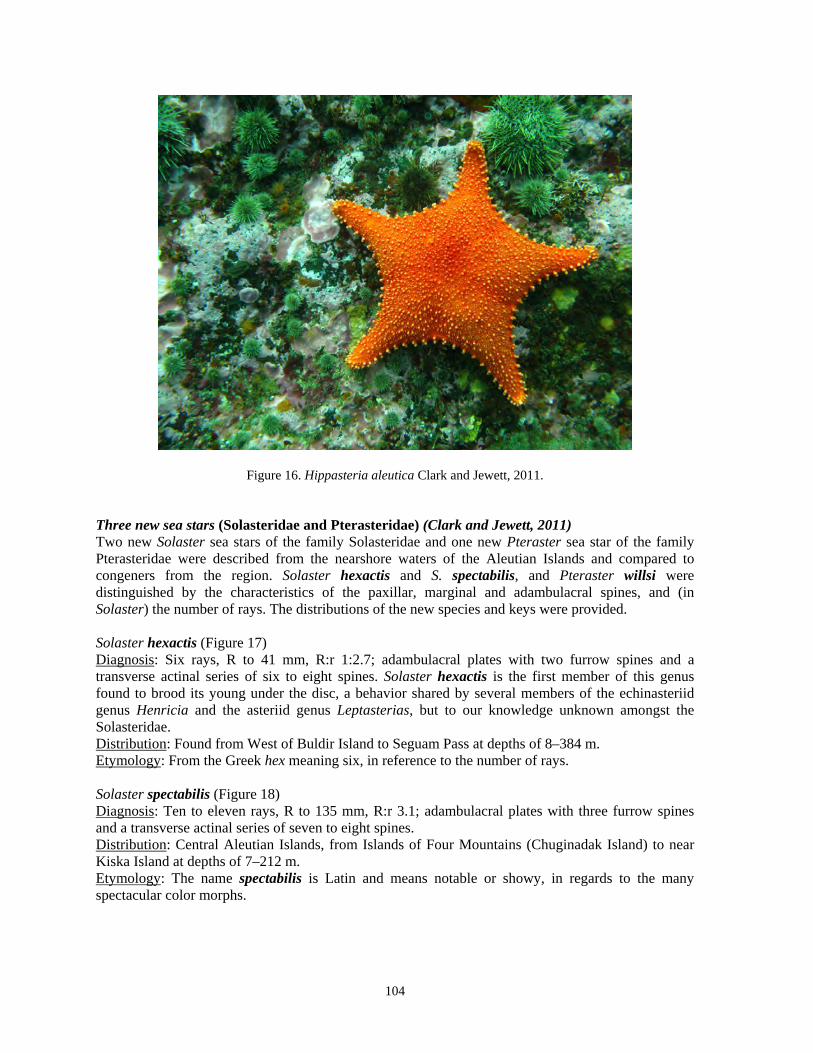
104
Figure 16. Hippasteria aleutica Clark and Jewett, 2011. Three new sea stars (Solasteridae and Pterasteridae) (Clark and Jewett, 2011) Two new Solaster sea stars of the family Solasteridae and one new Pteraster sea star of the family Pterasteridae were described from the nearshore waters of the Aleutian Islands and compared to congeners from the region. Solaster hexactis and S. spectabilis, and Pteraster willsi were distinguished by the characteristics of the paxillar, marginal and adambulacral spines, and (in Solaster) the number of rays. The distributions of the new species and keys were provided. Solaster hexactis (Figure 17) Diagnosis: Six rays, R to 41 mm, R:r 1:2.7; adambulacral plates with two furrow spines and a transverse actinal series of six to eight spines. Solaster hexactis is the first member of this genus found to brood its young under the disc, a behavior shared by several members of the echinasteriid genus Henricia and the asteriid genus Leptasterias, but to our knowledge unknown amongst the Solasteridae. Distribution: Found from West of Buldir Island to Seguam Pass at depths of 8–384 m. Etymology: From the Greek hex meaning six, in reference to the number of rays. Solaster spectabilis (Figure 18) Diagnosis: Ten to eleven rays, R to 135 mm, R:r 3.1; adambulacral plates with three furrow spines and a transverse actinal series of seven to eight spines. Distribution: Central Aleutian Islands, from Islands of Four Mountains (Chuginadak Island) to near Kiska Island at depths of 7–212 m. Etymology: The name spectabilis is Latin and means notable or showy, in regards to the many spectacular color morphs.
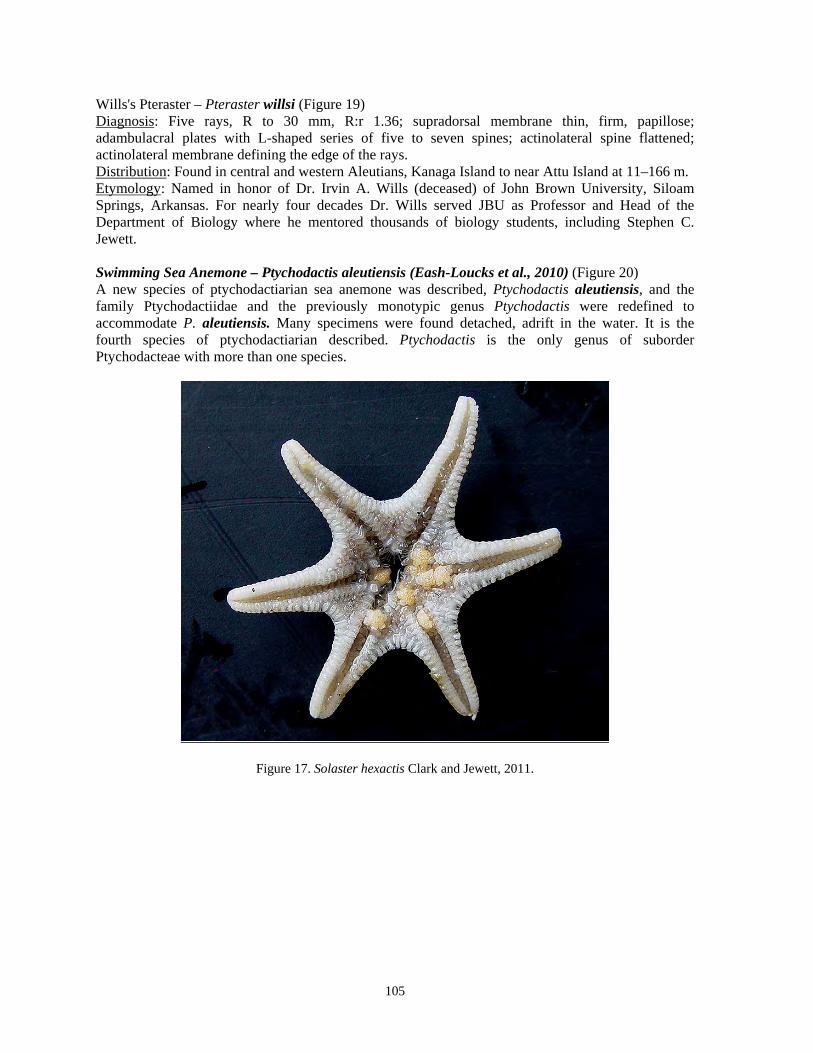
105
Wills's Pteraster – Pteraster willsi (Figure 19) Diagnosis: Five rays, R to 30 mm, R:r 1.36; supradorsal membrane thin, firm, papillose; adambulacral plates with L-shaped series of five to seven spines; actinolateral spine flattened; actinolateral membrane defining the edge of the rays. Distribution: Found in central and western Aleutians, Kanaga Island to near Attu Island at 11–166 m. Etymology: Named in honor of Dr. Irvin A. Wills (deceased) of John Brown University, Siloam Springs, Arkansas. For nearly four decades Dr. Wills served JBU as Professor and Head of the Department of Biology where he mentored thousands of biology students, including Stephen C. Jewett. Swimming Sea Anemone – Ptychodactis aleutiensis (Eash-Loucks et al., 2010) (Figure 20) A new species of ptychodactiarian sea anemone was described, Ptychodactis aleutiensis, and the family Ptychodactiidae and the previously monotypic genus Ptychodactis were redefined to accommodate P. aleutiensis. Many specimens were found detached, adrift in the water. It is the fourth species of ptychodactiarian described. Ptychodactis is the only genus of suborder Ptychodacteae with more than one species.
Figure 17. Solaster hexactis Clark and Jewett, 2011.

106
Figure 18. Solaster spectabilis Clark and Jewett, 2011.
Figure 19. Pteraster willsi Clark and Jewett, 2011.
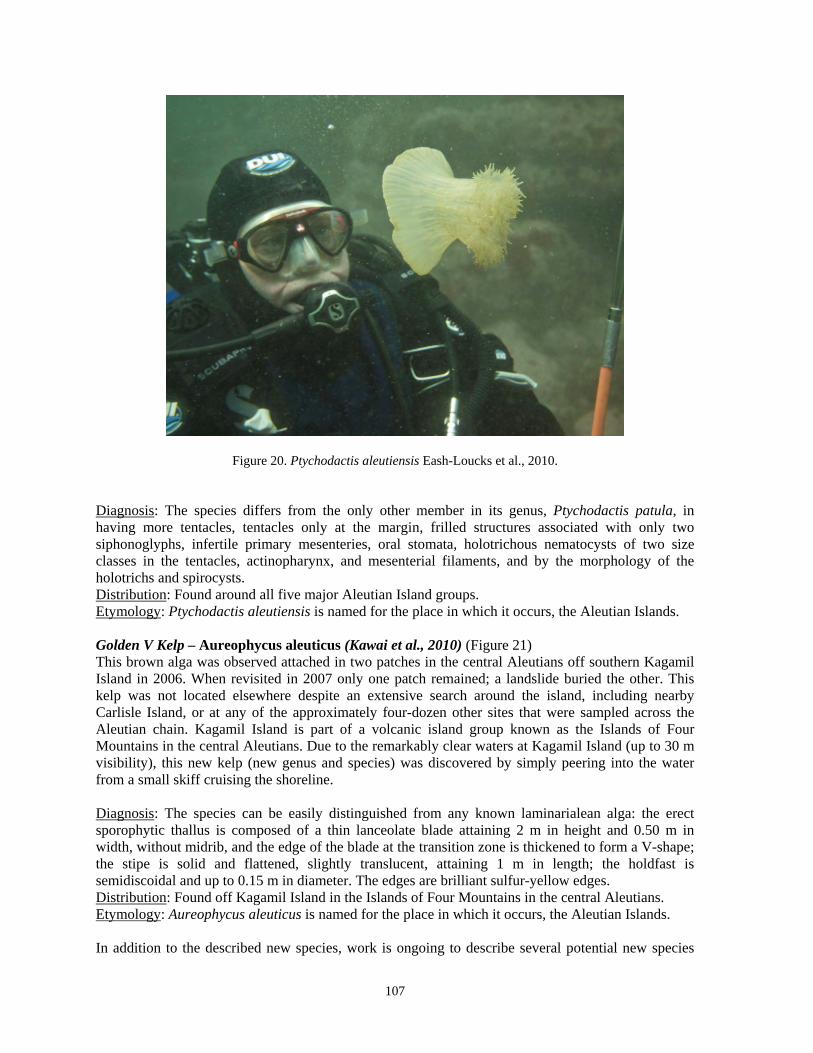
107
Figure 20. Ptychodactis aleutiensis Eash-Loucks et al., 2010. Diagnosis: The species differs from the only other member in its genus, Ptychodactis patula, in having more tentacles, tentacles only at the margin, frilled structures associated with only two siphonoglyphs, infertile primary mesenteries, oral stomata, holotrichous nematocysts of two size classes in the tentacles, actinopharynx, and mesenterial filaments, and by the morphology of the holotrichs and spirocysts. Distribution: Found around all five major Aleutian Island groups. Etymology: Ptychodactis aleutiensis is named for the place in which it occurs, the Aleutian Islands. Golden V Kelp – Aureophycus aleuticus (Kawai et al., 2010) (Figure 21) This brown alga was observed attached in two patches in the central Aleutians off southern Kagamil Island in 2006. When revisited in 2007 only one patch remained; a landslide buried the other. This kelp was not located elsewhere despite an extensive search around the island, including nearby Carlisle Island, or at any of the approximately four-dozen other sites that were sampled across the Aleutian chain. Kagamil Island is part of a volcanic island group known as the Islands of Four Mountains in the central Aleutians. Due to the remarkably clear waters at Kagamil Island (up to 30 m visibility), this new kelp (new genus and species) was discovered by simply peering into the water from a small skiff cruising the shoreline. Diagnosis: The species can be easily distinguished from any known laminarialean alga: the erect sporophytic thallus is composed of a thin lanceolate blade attaining 2 m in height and 0.50 m in width, without midrib, and the edge of the blade at the transition zone is thickened to form a V-shape; the stipe is solid and flattened, slightly translucent, attaining 1 m in length; the holdfast is semidiscoidal and up to 0.15 m in diameter. The edges are brilliant sulfur-yellow edges. Distribution: Found off Kagamil Island in the Islands of Four Mountains in the central Aleutians. Etymology: Aureophycus aleuticus is named for the place in which it occurs, the Aleutian Islands. In addition to the described new species, work is ongoing to describe several potential new species
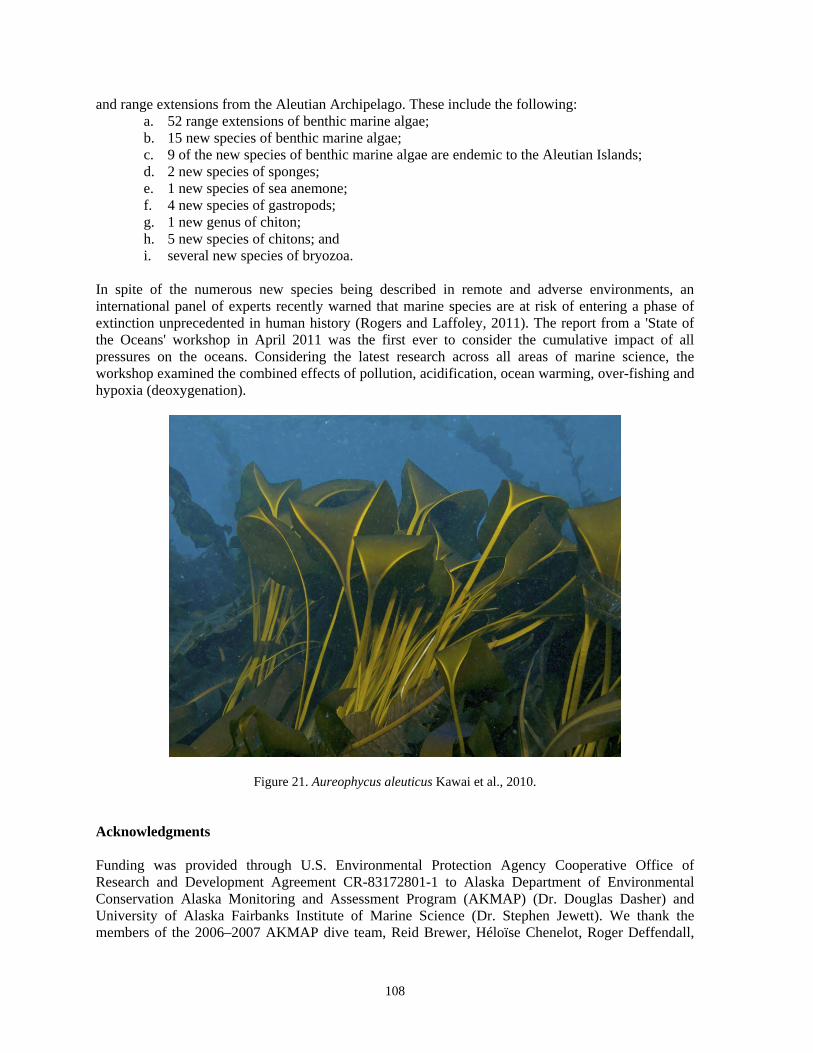
108
and range extensions from the Aleutian Archipelago. These include the following: a. 52 range extensions of benthic marine algae; b. 15 new species of benthic marine algae; c. 9 of the new species of benthic marine algae are endemic to the Aleutian Islands; d. 2 new species of sponges; e. 1 new species of sea anemone; f. 4 new species of gastropods; g. 1 new genus of chiton; h. 5 new species of chitons; and i. several new species of bryozoa.
In spite of the numerous new species being described in remote and adverse environments, an international panel of experts recently warned that marine species are at risk of entering a phase of extinction unprecedented in human history (Rogers and Laffoley, 2011). The report from a 'State of the Oceans' workshop in April 2011 was the first ever to consider the cumulative impact of all pressures on the oceans. Considering the latest research across all areas of marine science, the workshop examined the combined effects of pollution, acidification, ocean warming, over-fishing and hypoxia (deoxygenation).
Figure 21. Aureophycus aleuticus Kawai et al., 2010. Acknowledgments Funding was provided through U.S. Environmental Protection Agency Cooperative Office of Research and Development Agreement CR-83172801-1 to Alaska Department of Environmental Conservation Alaska Monitoring and Assessment Program (AKMAP) (Dr. Douglas Dasher) and University of Alaska Fairbanks Institute of Marine Science (Dr. Stephen Jewett). We thank the members of the 2006–2007 AKMAP dive team, Reid Brewer, Héloïse Chenelot, Roger Deffendall,

109
Shawn Harper and Max Hoberg for collecting and photographing specimens in situ. Thanks to Héloïse Chenelot for editing this manuscript. References Ausubel JH, Crist DT, Waggoner PE. First Census of Marine Life 2010: Highlights of a Decade of Discovery. Census of Marine Life, Washington, DC. 2010; 64. pp Brewer R, Chenelot H, Harper S, Jewett SC. Sea Life of the Aleutians: An Underwater Photo Journey. Alaska Sea Grant, SG-ED-71, Fairbanks, 2011; 156 p. Clark RN, Jewett SC. A new genus and thirteen new species of sea stars (Asteroidea: Echinasteridae) from the Aleutian Island Archipelago. Zootaxa. 2010; 2571: 1–36. Clark RN, Jewett SC. A new species of sea star, Hippasteria (Asteroidea: Goniasteridae), from the Aleutian Islands. Zootaxa. 2011; 2963: 48–54. Clark RN, Jewett SC. Three new sea stars (Asteroidea: Solasteridae and Pterasteridae) from the Aleutian Islands. Zootaxa, 2011; 3051: 1-13. Eash-Loucks W, Jewett S, Fautin D, Hoberg M, Chenelot H. Ptychodactis aleutiensis, a new species of ptychodactiarian sea anemone (Cnidaria: Anthozoa: Actiniaria) from the Aleutian Islands, Alaska. Mar Biol Res. 2010; 6(6): 570–8. Johnson T. The Bering Sea and Aleutian Islands: Regions of Wonders. Publication Number SG-ED-42. Fairbanks, Alaska: Alaska Sea Grant College Program, 2003; 199 pp. Kawai H, Hanyuda T, Lindeberg M, Lindstrom SC. Morphology and molecular phylogeny of Aureophycus aleuticus gen. et sp. nov. (Laminariales, Phaeophyceae) from the Aleutian Islands. J Phycol. 2008; 44:1013–21. Ladd C, Hunt GL, Mordy CW, Salo SA, Stabeno PJ. Marine environment of the eastern and central Aleutian Islands. Fisheries Oceanog. 2005; 14(suppl. 1): 22–38. Rogers AD, Laffoley Dd'A. International Earth system expert workshop on ocean stresses and impacts. Summary report. IPSO Oxford, 2011; 18 pp. http://cmsdata.iucn.org/downloads/ipso_workshop_report_june_2011.pdf
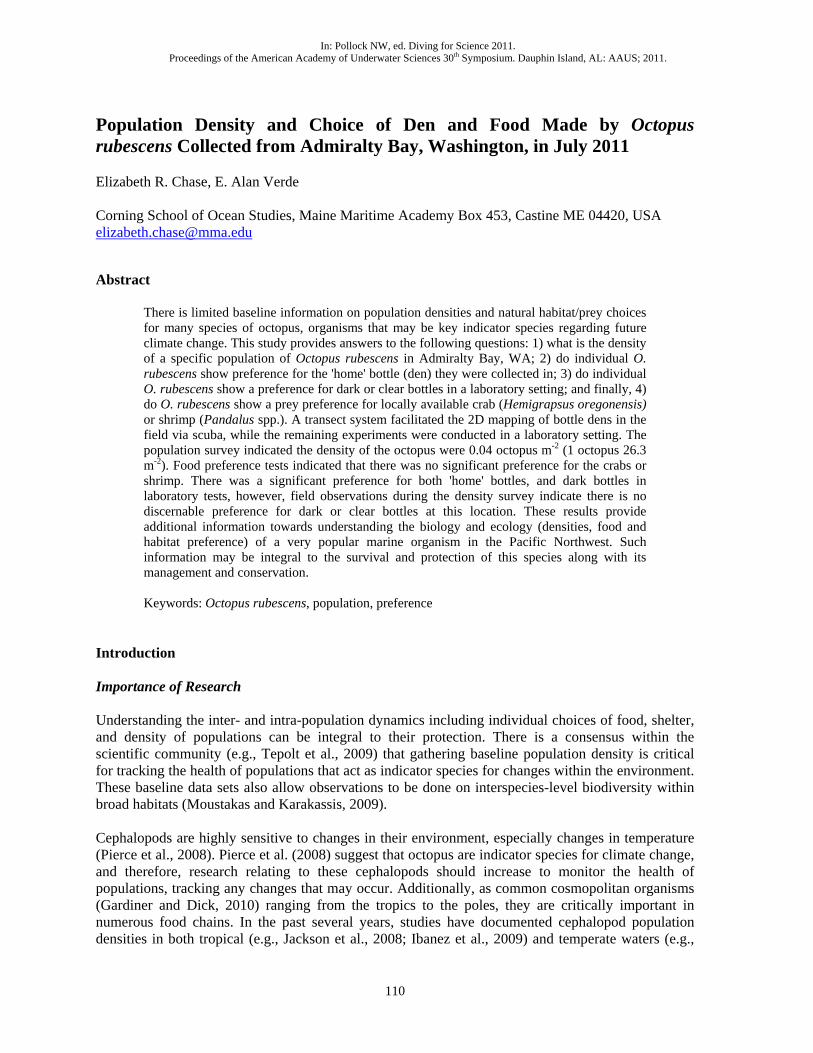
110
Population Density and Choice of Den and Food Made by Octopus rubescens Collected from Admiralty Bay, Washington, in July 2011 Elizabeth R. Chase, E. Alan Verde Corning School of Ocean Studies, Maine Maritime Academy Box 453, Castine ME 04420, USA [email protected] Abstract
There is limited baseline information on population densities and natural habitat/prey choices for many species of octopus, organisms that may be key indicator species regarding future climate change. This study provides answers to the following questions: 1) what is the density of a specific population of Octopus rubescens in Admiralty Bay, WA; 2) do individual O. rubescens show preference for the 'home' bottle (den) they were collected in; 3) do individual O. rubescens show a preference for dark or clear bottles in a laboratory setting; and finally, 4) do O. rubescens show a prey preference for locally available crab (Hemigrapsus oregonensis) or shrimp (Pandalus spp.). A transect system facilitated the 2D mapping of bottle dens in the field via scuba, while the remaining experiments were conducted in a laboratory setting. The population survey indicated the density of the octopus were 0.04 octopus m-2 (1 octopus 26.3 m-2). Food preference tests indicated that there was no significant preference for the crabs or shrimp. There was a significant preference for both 'home' bottles, and dark bottles in laboratory tests, however, field observations during the density survey indicate there is no discernable preference for dark or clear bottles at this location. These results provide additional information towards understanding the biology and ecology (densities, food and habitat preference) of a very popular marine organism in the Pacific Northwest. Such information may be integral to the survival and protection of this species along with its management and conservation. Keywords: Octopus rubescens, population, preference
Introduction Importance of Research Understanding the inter- and intra-population dynamics including individual choices of food, shelter, and density of populations can be integral to their protection. There is a consensus within the scientific community (e.g., Tepolt et al., 2009) that gathering baseline population density is critical for tracking the health of populations that act as indicator species for changes within the environment. These baseline data sets also allow observations to be done on interspecies-level biodiversity within broad habitats (Moustakas and Karakassis, 2009). Cephalopods are highly sensitive to changes in their environment, especially changes in temperature (Pierce et al., 2008). Pierce et al. (2008) suggest that octopus are indicator species for climate change, and therefore, research relating to these cephalopods should increase to monitor the health of populations, tracking any changes that may occur. Additionally, as common cosmopolitan organisms (Gardiner and Dick, 2010) ranging from the tropics to the poles, they are critically important in numerous food chains. In the past several years, studies have documented cephalopod population densities in both tropical (e.g., Jackson et al., 2008; Ibanez et al., 2009) and temperate waters (e.g.,
In: Pollock NW, ed. Diving for Science 2011. Proceedings of the American Academy of Underwater Sciences 30th Symposium. Dauphin Island, AL: AAUS; 2011.

111
Vecchione et al., 2010; Rosa et al., 2008). Although progress is being made, many species of octopus have no population density data on record. Octopus rubescens, also known as the red octopus, is a cephalopod indigenous to the temperate waters off the western coast of North America from Alaska to California (De los Angeles Barringa Sosa, 1995; Figure 1). The species has been described as the most common intertidal octopus (Anderson et al., 1999) in those temperate waters. Anderson et al. (1999) state that individuals of O. rubescens have only been observed in shelters of human trash, in the form of discarded bottles. Research is ongoing to understand aspects of the natural history of this species in Admiralty Bay, WA, but baseline density data are lacking. Food and Shelter Octopuses have been described as specializing generalists (Anderson et al., 2008) as evidenced by their choices of food and shelter. Individual octopuses migrate in search of food and consume whatever prey is available in their local vicinity, from crustaceans to other mollusks (Anderson et al., 2008). However, prey items they consume in the field are not always their preferred choice in laboratory tests (Mather and O'Dor, 1991). Due to consumption commonly occurring within dens (Anderson et al., 2008), choice of shelter: the quality, durability, and cover that any given den gives the occupant, is critical for growth and reproductive success. The beer bottle dens that O. rubescens occupy in Washington as dwellings makes these ideal organisms to study. Octopuses that do not burrow into the sand are constrained by shelter availability (Katsanevakis and Verriopoulos, 2004), which not only allows for simple population surveying, but also collection of individuals. Additionally, the small size of O. rubescens makes them ideal for successful study in the laboratory (Mather, 1982). They are normally found hidden within their dens during daylight hours and can thus be collected (Mather and Anderson, 1993), further observations can be made, and natural history information gleaned. This information includes behavior and feeding preference for individuals within populations of O. rubescens. This study provides a two-dimensional survey of the population of O. rubescens located in Admiralty Inlet, Washington, using self-contained underwater breathing apparatus (SCUBA) diving operations. Field observations are noted, and three laboratory tests are delineated: food preference, and two bottle preference tests. Methods Field Observations The field site for the population density survey was roughly 3.2 km east of the Keystone Jetty, Washington (Figure 1). The dive site is a pebble beach that stretches east from the jetty for several kilometers, facing Admiralty Bay to the south. The dive site is bordered to the north by private homes, and boat access is only available from the Keystone boat ramp. As the beach slopes into the bay, there is a steep bank covered in large kelp beds. Depending on the tide cycle, at a depth of approximately 20 m, the seafloor levels out. All of the bottle litter thrown into the ocean from the
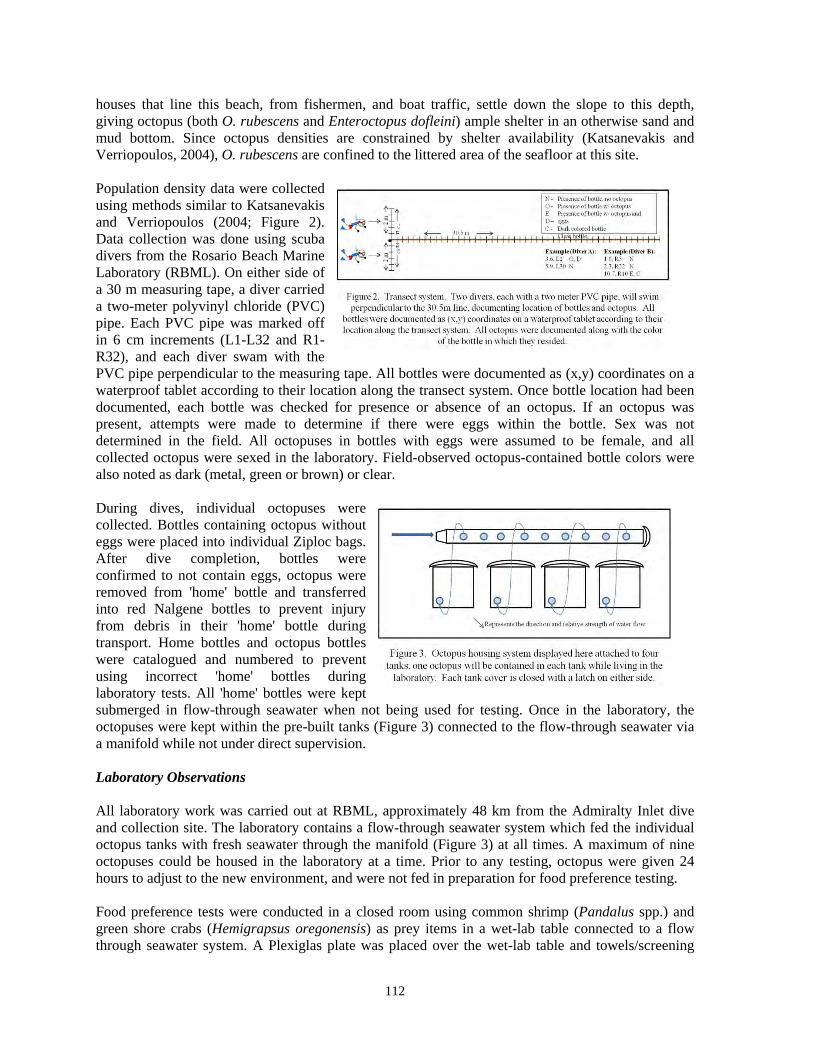
112
houses that line this beach, from fishermen, and boat traffic, settle down the slope to this depth, giving octopus (both O. rubescens and Enteroctopus dofleini) ample shelter in an otherwise sand and mud bottom. Since octopus densities are constrained by shelter availability (Katsanevakis and Verriopoulos, 2004), O. rubescens are confined to the littered area of the seafloor at this site. Population density data were collected using methods similar to Katsanevakis and Verriopoulos (2004; Figure 2). Data collection was done using scuba divers from the Rosario Beach Marine Laboratory (RBML). On either side of a 30 m measuring tape, a diver carried a two-meter polyvinyl chloride (PVC) pipe. Each PVC pipe was marked off in 6 cm increments (L1-L32 and R1-R32), and each diver swam with the PVC pipe perpendicular to the measuring tape. All bottles were documented as (x,y) coordinates on a waterproof tablet according to their location along the transect system. Once bottle location had been documented, each bottle was checked for presence or absence of an octopus. If an octopus was present, attempts were made to determine if there were eggs within the bottle. Sex was not determined in the field. All octopuses in bottles with eggs were assumed to be female, and all collected octopus were sexed in the laboratory. Field-observed octopus-contained bottle colors were also noted as dark (metal, green or brown) or clear. During dives, individual octopuses were collected. Bottles containing octopus without eggs were placed into individual Ziploc bags. After dive completion, bottles were confirmed to not contain eggs, octopus were removed from 'home' bottle and transferred into red Nalgene bottles to prevent injury from debris in their 'home' bottle during transport. Home bottles and octopus bottles were catalogued and numbered to prevent using incorrect 'home' bottles during laboratory tests. All 'home' bottles were kept submerged in flow-through seawater when not being used for testing. Once in the laboratory, the octopuses were kept within the pre-built tanks (Figure 3) connected to the flow-through seawater via a manifold while not under direct supervision. Laboratory Observations All laboratory work was carried out at RBML, approximately 48 km from the Admiralty Inlet dive and collection site. The laboratory contains a flow-through seawater system which fed the individual octopus tanks with fresh seawater through the manifold (Figure 3) at all times. A maximum of nine octopuses could be housed in the laboratory at a time. Prior to any testing, octopus were given 24 hours to adjust to the new environment, and were not fed in preparation for food preference testing. Food preference tests were conducted in a closed room using common shrimp (Pandalus spp.) and green shore crabs (Hemigrapsus oregonensis) as prey items in a wet-lab table connected to a flow through seawater system. A Plexiglas plate was placed over the wet-lab table and towels/screening
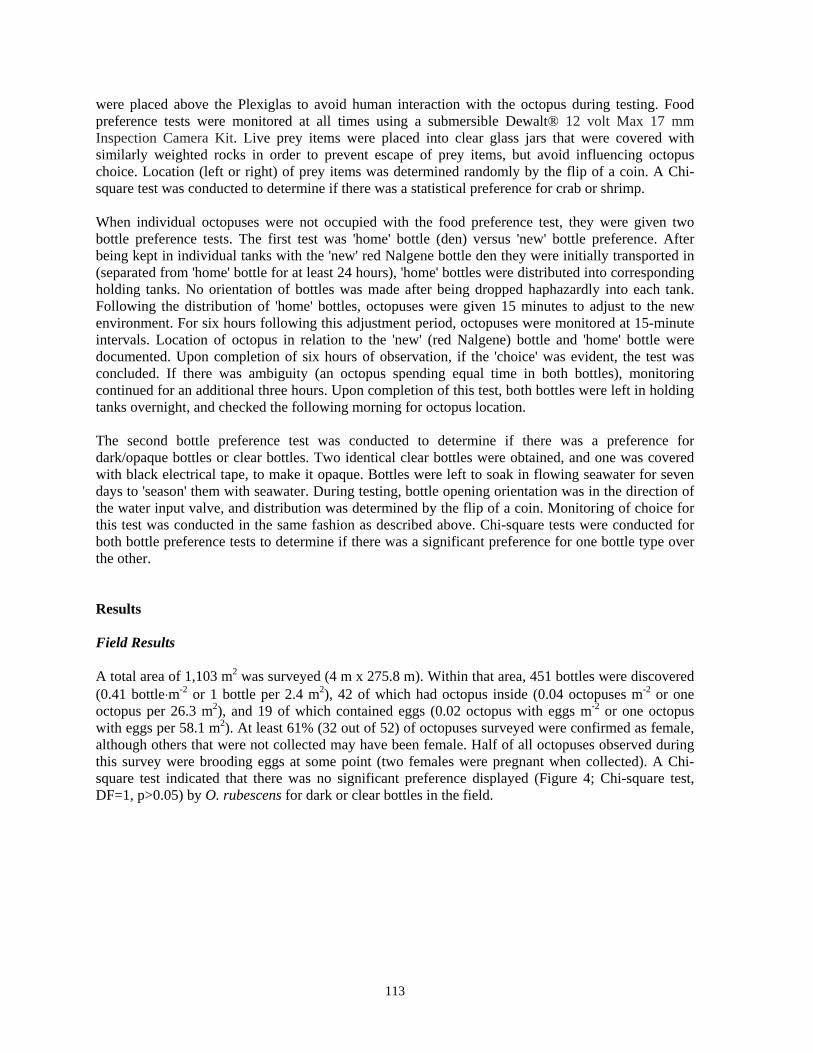
113
were placed above the Plexiglas to avoid human interaction with the octopus during testing. Food preference tests were monitored at all times using a submersible Dewalt® 12 volt Max 17 mm Inspection Camera Kit. Live prey items were placed into clear glass jars that were covered with similarly weighted rocks in order to prevent escape of prey items, but avoid influencing octopus choice. Location (left or right) of prey items was determined randomly by the flip of a coin. A Chi-square test was conducted to determine if there was a statistical preference for crab or shrimp. When individual octopuses were not occupied with the food preference test, they were given two bottle preference tests. The first test was 'home' bottle (den) versus 'new' bottle preference. After being kept in individual tanks with the 'new' red Nalgene bottle den they were initially transported in (separated from 'home' bottle for at least 24 hours), 'home' bottles were distributed into corresponding holding tanks. No orientation of bottles was made after being dropped haphazardly into each tank. Following the distribution of 'home' bottles, octopuses were given 15 minutes to adjust to the new environment. For six hours following this adjustment period, octopuses were monitored at 15-minute intervals. Location of octopus in relation to the 'new' (red Nalgene) bottle and 'home' bottle were documented. Upon completion of six hours of observation, if the 'choice' was evident, the test was concluded. If there was ambiguity (an octopus spending equal time in both bottles), monitoring continued for an additional three hours. Upon completion of this test, both bottles were left in holding tanks overnight, and checked the following morning for octopus location. The second bottle preference test was conducted to determine if there was a preference for dark/opaque bottles or clear bottles. Two identical clear bottles were obtained, and one was covered with black electrical tape, to make it opaque. Bottles were left to soak in flowing seawater for seven days to 'season' them with seawater. During testing, bottle opening orientation was in the direction of the water input valve, and distribution was determined by the flip of a coin. Monitoring of choice for this test was conducted in the same fashion as described above. Chi-square tests were conducted for both bottle preference tests to determine if there was a significant preference for one bottle type over the other. Results Field Results A total area of 1,103 m2 was surveyed (4 m x 275.8 m). Within that area, 451 bottles were discovered (0.41 bottle⋅m-2 or 1 bottle per 2.4 m2), 42 of which had octopus inside (0.04 octopuses m-2 or one octopus per 26.3 m2), and 19 of which contained eggs (0.02 octopus with eggs m-2 or one octopus with eggs per 58.1 m2). At least 61% (32 out of 52) of octopuses surveyed were confirmed as female, although others that were not collected may have been female. Half of all octopuses observed during this survey were brooding eggs at some point (two females were pregnant when collected). A Chi-square test indicated that there was no significant preference displayed (Figure 4; Chi-square test, DF=1, p>0.05) by O. rubescens for dark or clear bottles in the field.

114
Laboratory Results There was no significant preference (Figure 5; Chi-square, DF=1, p>0.05) for the shrimp (Pandalus spp.) or crab (Hemigrapsus oregonensis). There were significant preferences for both the 'home' bottle (Figure 6; Chi-square test, DF=2, p<0.05) over the 'new' bottle, and significant preference for the dark/opaque bottle (Figure 7; Chi-square test, DF=2, p<0.05) over the clear bottle. Every instance where the bottles were left in tanks overnight following a preference test, octopus were found in the same location the next morning. This allowed for a quality control check of the preference test, and indicates that the results are accurate.
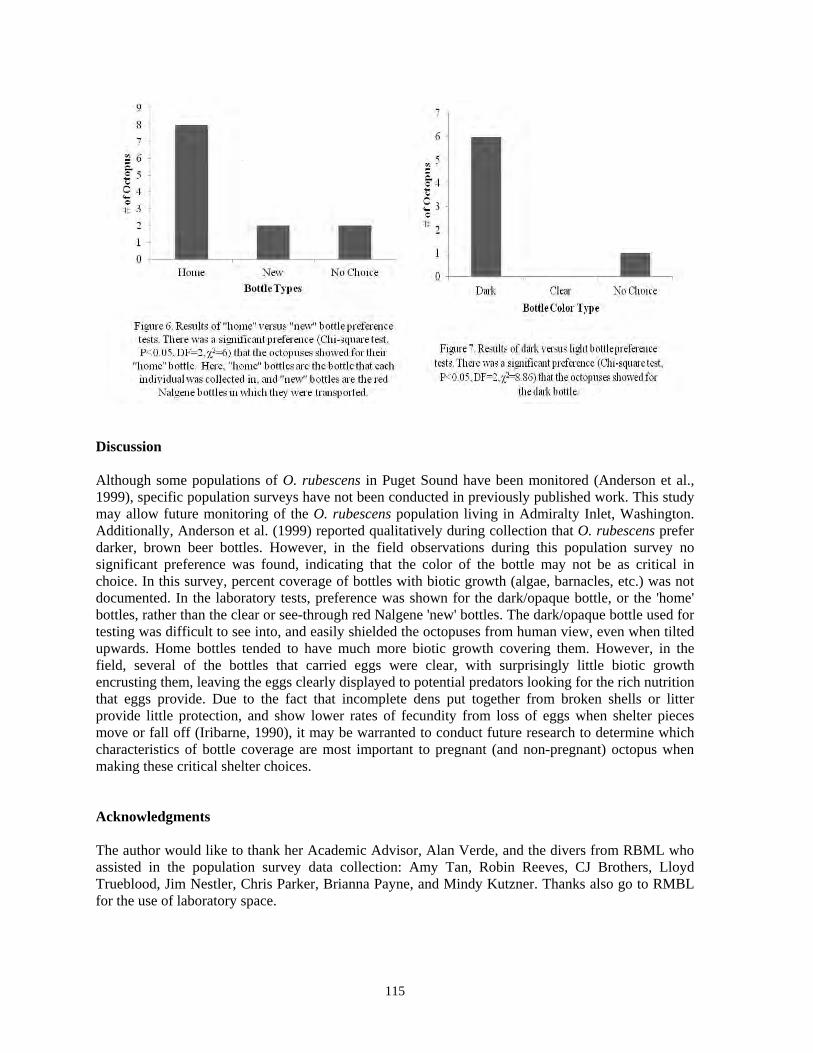
115
Discussion Although some populations of O. rubescens in Puget Sound have been monitored (Anderson et al., 1999), specific population surveys have not been conducted in previously published work. This study may allow future monitoring of the O. rubescens population living in Admiralty Inlet, Washington. Additionally, Anderson et al. (1999) reported qualitatively during collection that O. rubescens prefer darker, brown beer bottles. However, in the field observations during this population survey no significant preference was found, indicating that the color of the bottle may not be as critical in choice. In this survey, percent coverage of bottles with biotic growth (algae, barnacles, etc.) was not documented. In the laboratory tests, preference was shown for the dark/opaque bottle, or the 'home' bottles, rather than the clear or see-through red Nalgene 'new' bottles. The dark/opaque bottle used for testing was difficult to see into, and easily shielded the octopuses from human view, even when tilted upwards. Home bottles tended to have much more biotic growth covering them. However, in the field, several of the bottles that carried eggs were clear, with surprisingly little biotic growth encrusting them, leaving the eggs clearly displayed to potential predators looking for the rich nutrition that eggs provide. Due to the fact that incomplete dens put together from broken shells or litter provide little protection, and show lower rates of fecundity from loss of eggs when shelter pieces move or fall off (Iribarne, 1990), it may be warranted to conduct future research to determine which characteristics of bottle coverage are most important to pregnant (and non-pregnant) octopus when making these critical shelter choices. Acknowledgments The author would like to thank her Academic Advisor, Alan Verde, and the divers from RBML who assisted in the population survey data collection: Amy Tan, Robin Reeves, CJ Brothers, Lloyd Trueblood, Jim Nestler, Chris Parker, Brianna Payne, and Mindy Kutzner. Thanks also go to RMBL for the use of laboratory space.
116
References Anderson RC, Hughes PD, Mather JA, Steele CW. Determination of the diet of Octopus rubescens Berry, 1953 (Cephalopoda: Octopodidae), through examination of its beer bottle dens in Puget Sound. Malacologia. 1999; 41(2): 455–60. Anderson RC, Wood JB, Mather JA. Octopus vulgaris in the Caribbean is a specializing generalist. Mar Ecol Progress Series. 2008; 371: 199–202. De Los Angeles Barringa Sosa I, Beckenback K, Hartwick B, Smith MJ. The molecular phylogeny of five eastern North Pacific octopus species. Molec Phylogenetics Evol. 1995; 4(2): 163–74. Gardiner K, Dick TA. Arctic cephalopod distributions and their associated predators. Polar Res. 2010; 29: 209–27. Ibanez CM, Camus PA, Rocha FJ. Diversity and distribution of cephalopod species off the coast of Chile. Mar Biol Res. 2009; 5: 347–84. Jackson GD, Meekan MG, Wotherspoon S, Jackson CH. Distribution of young cephalopods in the tropical waters of Western Australia over two consecutive summers. ICES J Marine Sci. 2008; 65(2): 140–7. Katsanevakis S, Verriopoulos G. Den ecology of Octopus vulgaris Cuvier, 1797, on soft sediment: availability and types of shelter. Scientia Marina. 2004; 68: 147–57. Mather JA. Factors affecting the spatial distribution of natural populations of Octopus joubini Robson. Animal Behav. 1982; 30: 1166–70. Mather JA, Anderson RC. Personalities of octopuses (Octopus rubescens). J Comparative Psych. 1993; 107(3): 336–40. Mather JA, O'Dor RK. Foraging strategies and predation risk shape the natural history of juvenile Octopus vulgaris. Bull Marine Sci. 1991; 491: 256–69. Moustakas A, Karakassis I. A geographic analysis of the published aquatic biodiversity research in relation to the ecological footprint of the country where the work was done. Stochastic Environmental Research and Risk Assessment. 2009; 23: 737–48. Pierce GJ, Valavanis VD, Guerra A, Jereb P, Orsi-Relini L, Bellido JM, Katara I, Piatkowski U, Pereira J, Balguerias E, Sobrino I, Lefkaditou E, Wang JJ, Santurtun M, Boyle PR, Hastie LC, MacLeod CD, Smith JM, Viana M, Gonzalez AF, and Zuur AF. A review of cephalopod-environment interactions in European Seas. Hydrobiologia. 2008; 612: 49–70. Rosa R, Dierssen HM, Gonzalez L, Seibel BA. Ecological biogeography of cephalopod molluscs in the Atlantic Ocean: historical and contemporary causes of coastal diversity patterns. Global Ecol Biogeog. 2008; 17: 600–10. Tepolt CK, Darling JA, Bagley MJ, Geller JB, Blum MJ, Grosholz ED. European green crabs (Carcinus maenas) in the northeastern Pacific: genetic evidence for high population connectivity and current mediated expansion from a single introduced source population. Diversity Distribution. 2009; 15: 997–1009. Vecchione M, Young RE, Piatkowski U. Cephalopods of the northern Mid-Atlantic Ridge. Mar Biol Res. 2010; 6: 25–52.

117
Scuba Diving Surveys Used to Estimate Pacific Herring Egg Deposition in Southeastern Alaska Kyle P. Hebert Alaska Department of Fish and Game, PO Box 110024, Juneau, AK 99811–0024, USA [email protected] Abstract
Pacific herring, Clupea pallasi, is an important species in the marine ecology of southeastern Alaska and is also harvested in subsistence and commercial fisheries. To ensure adequate stock size, prior to allowing commercial harvest, the Department of Fish and Game assesses the abundance of spawning populations. The stock assessment is based primarily upon two types of information: estimates of egg deposition and age composition of the spawning population. Each spring, a team of scuba divers conducts surveys to estimate egg deposition. Survey location is determined through aerial surveys and mapping of spawn along the shoreline. Dive teams conduct transects perpendicular to the spawn bed, beginning at the intertidal and ending in the sub tidal at a depth of about 35–50 ft. The goal of the surveys is to produce estimates of total egg deposition to index abundance. The index is a primary input of one of two models: age-structured or biomass accounting. Both models are used to estimate the current mature herring biomass and forecast mature biomass for the ensuing year. Estimates from 2010 dive surveys indicate that egg deposition was highly variable among stocks and Sitka Sound continues to be the largest herring stock in the region.
Key words: Clupea pallasi, dive surveys, scuba, southeastern Alaska, spawning population, stock assessment
Introduction Since 1975 the Alaska Department of Fish and Game (ADF&G) has conducted scuba dive surveys to evaluate herring stock size in southeastern Alaska. These surveys were developed in response to greater demands on the resource by developing commercial fisheries. The goal of the project is to provide biological data necessary for science-based fishery management of the region's herring stocks. Data generated during these stock assessment surveys, along with data collected for age and size estimates, are used directly in the management of all commercial herring fisheries conducted in Southeast Alaska. Data are input into one of two stock assessment models used to estimate spawning biomass and to forecast mature herring abundance. These models include an age-structured analysis (ASA) model and a biomass accounting model. A more detailed explanation of these models and how the objective estimates are used is provided by Carlile et al. (1996). The principal outputs from all models are forecasts of mature herring biomass for the ensuing year. These forecasts are compared to stock-specific threshold biomass levels to determine whether a fishery will be allowed in a particular area. If harvest is allowed, appropriate exploitation rates are applied to determine harvest levels, and allocations for commercial quotas for each fishery are determined by regulations.
In: Pollock NW, ed. Diving for Science 2011. Proceedings of the American Academy of Underwater Sciences 30th Symposium. Dauphin Island, AL: AAUS; 2011.
118
Methods Aerial Surveys Aerial surveys were used to record the linear distance of spawning along shorelines during the spring of 2010 for major stocks in southeastern Alaska (Figure 1). Observed herring spawn was documented on a chart during each survey and then later transferred to computer mapping software to measure shoreline receiving spawn. The mapped shoreline that received spawn was used as the basis for designing and targeting the location of the spawn deposition dive surveys. Dive Surveys Typically, 20–40 transect locations were selected randomly along the shoreline receiving spawn. Transect direction was determined by setting a compass bearing perpendicular to the spawn shoreline. Transects began at high intertidal, if eggs were observed, and continued down to a depth in the subtidal zone until no further egg deposition was observed, usually about a depth of 12 m (40 ft). The portion of each transect above the waterline was surveyed by walking until the water reached diving depth, usually 0.6 m (2 ft), at which point diving commenced. All diving was conducted by ADF&G scientific divers in compliance with the ADF&G Dive Safety Manual (Hebert, 2006). A two-stage sampling design, similar to that of Schweigert et al. (1985), was used to estimate the density of herring eggs. The sampling procedure entailed a two-person dive team that swam along each transect while recording visual estimates of the number of eggs within a 0.1 m2 (1.2 ft2) sampling frame placed on the bottom at 5.0 m (16.4 ft) intervals. The first diver carried the sampling frame and estimated egg deposition, while the second diver signaled the first diver to stop by tugging a 5.0 m (16.4 ft) line connected to the sampling frame. The second diver also recorded data on a clip board. To help estimate the number of eggs, estimators used a reference of 40,000 eggs per single layer of eggs within the sampling frame, which was determined mathematically using measurements of egg diameter and frame dimensions. Additional data recorded includes substrate, vegetation type, percent vegetation, and depth. Visual estimate correction Since visual estimates rather than actual counts of eggs within the sampling frame were recorded, there exists measurement error. To minimize bias and the influence of measurement error on estimates of egg deposition within each frame, correction coefficients were used to adjust egg estimates either up or down depending on an estimators tendency to underestimate or overestimate. Correction coefficients were estimated by double sampling (Jessen, 1978) frames independent of those estimates obtained along regular spawn deposition transects. Samples for correction coefficients were obtained by divers after visually estimating the number of eggs within a 0.1 m2 (1.2 ft2) sampling frame underwater and then collecting all of the eggs within the frame for later more precise estimation in a laboratory. Correction coefficients were calculated as the ratio of sums of laboratory estimates to an estimator's visual estimates. Estimator/kelp-specific correction coefficients were applied to egg estimates when the appropriate kelp type matched. For example, the "large brown kelp" correction coefficient was applied when kelp types that fit that description were encountered, and the "eel grass" correction coefficient was applied when eelgrass was encountered.

119
Estimates of total egg deposition Total egg deposition for a particular spawning area (ti) was estimated as follows:
it = ia id (2)
where ai is the estimated total area (m2) on which eggs have been deposited; and id is the estimated mean density of eggs per 0.1 m2 (1.2 ft2) quadrate, extrapolated to 1.0 m2 (10.8 ft2) area (eggs⋅m-2) at spawning area i. The total area on which eggs were deposited (ai) was then estimated as,
a = l wi i i , (3) where li is the total length of shoreline receiving spawn; and wi is the mean width of spawn, as determined by the mean length of transects conducted at spawning area i.
The mean egg density (eggs⋅m-2) at area i ( id ) was calculated as,
⋅
hhi
h j khkhijk
im
cv=d 10 (4)
where vhij is the visual estimate of egg numbers by estimator h, at area i, quadrate j, on kelp type k. The chk term refers to a diver-specific, kelp-specific correction factor to adjust visual estimates made by estimator h on kelp type k; mhi is the number of quadrates visually estimated by estimator h at area i. Since egg estimates were made within 0.1 m2 (1.2 ft2) quadrates, multiplying by 10 expresses the mean density in per 1.0 m2. Estimator/kelp-specific correction factors (chk) were calculated as follows:
qr=c
hk
hkhk
;(5)
where qhk is the sum of visual estimates of eggs for estimator h on kelp type k; and, rhk is the sum of laboratory estimates of eggs collected from quadrates that were visually estimated by estimator h on kelp type k. Results In 2010, a total of 252 transects were conducted during dive surveys in nine herring spawning areas in southeastern Alaska. Estimates of total egg deposition in 2010 were highly variable among stocks. Survey results revealed that the herring stock in Sitka Sound continues to be by far the largest stock in southeastern Alaska. Point estimates of total egg deposition made in 2010 were greater than those made in 2009 for four of nine stocks surveyed (Table 1) and increases ranged from 10% to 87% (note: 100% increase means the stock doubled since the previous year). The remainder of stocks decreased, ranging from -9% to -91% of 2009 levels.
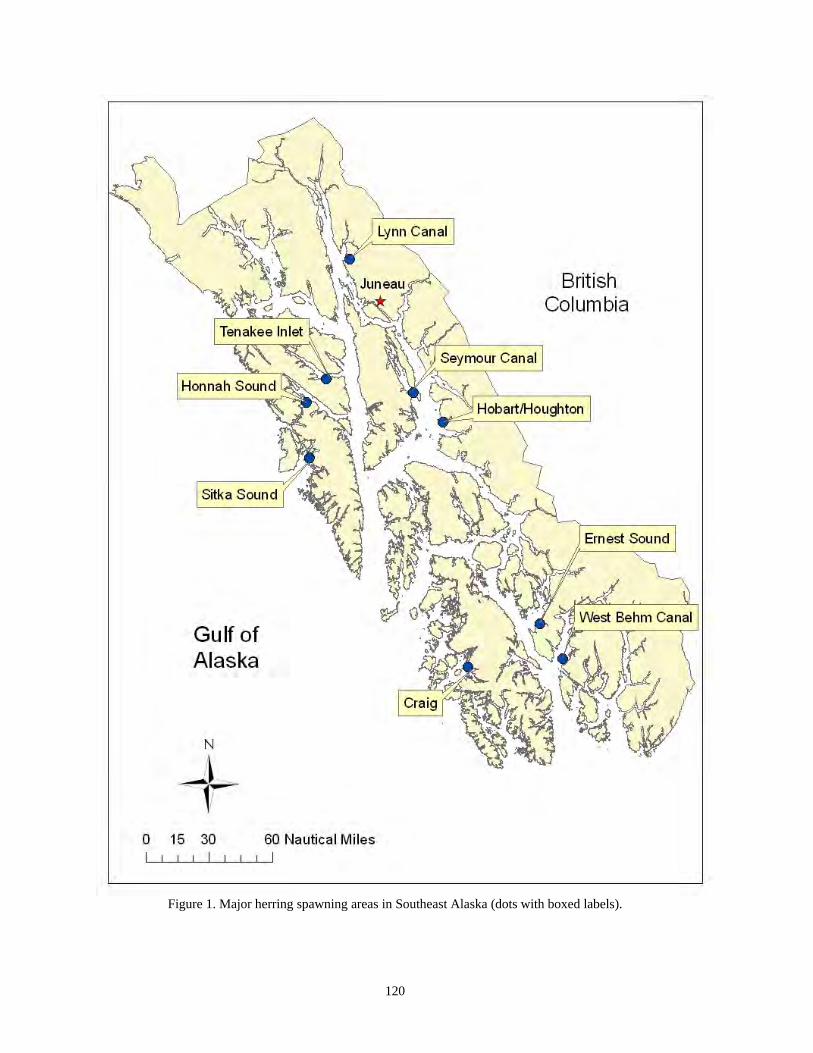
120
Figure 1. Major herring spawning areas in Southeast Alaska (dots with boxed labels).
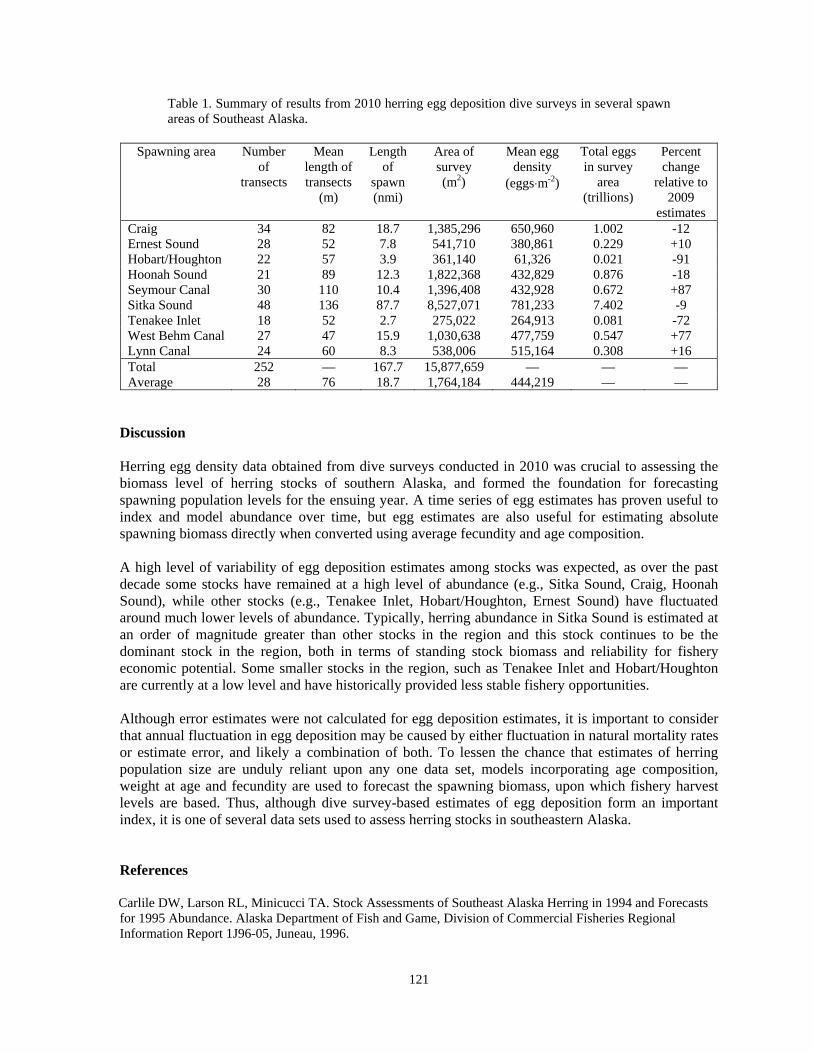
121
Table 1. Summary of results from 2010 herring egg deposition dive surveys in several spawn areas of Southeast Alaska.
Spawning area Number
of transects
Mean length of transects
(m)
Length of
spawn (nmi)
Area of survey (m2)
Mean egg density
(eggs⋅m-2)
Total eggs in survey
area (trillions)
Percent change
relative to 2009
estimates Craig 34 82 18.7 1,385,296 650,960 1.002 -12 Ernest Sound 28 52 7.8 541,710 380,861 0.229 +10 Hobart/Houghton 22 57 3.9 361,140 61,326 0.021 -91 Hoonah Sound 21 89 12.3 1,822,368 432,829 0.876 -18 Seymour Canal 30 110 10.4 1,396,408 432,928 0.672 +87 Sitka Sound 48 136 87.7 8,527,071 781,233 7.402 -9 Tenakee Inlet 18 52 2.7 275,022 264,913 0.081 -72 West Behm Canal 27 47 15.9 1,030,638 477,759 0.547 +77 Lynn Canal 24 60 8.3 538,006 515,164 0.308 +16 Total 252 — 167.7 15,877,659 — — — Average 28 76 18.7 1,764,184 444,219 — —
Discussion Herring egg density data obtained from dive surveys conducted in 2010 was crucial to assessing the biomass level of herring stocks of southern Alaska, and formed the foundation for forecasting spawning population levels for the ensuing year. A time series of egg estimates has proven useful to index and model abundance over time, but egg estimates are also useful for estimating absolute spawning biomass directly when converted using average fecundity and age composition. A high level of variability of egg deposition estimates among stocks was expected, as over the past decade some stocks have remained at a high level of abundance (e.g., Sitka Sound, Craig, Hoonah Sound), while other stocks (e.g., Tenakee Inlet, Hobart/Houghton, Ernest Sound) have fluctuated around much lower levels of abundance. Typically, herring abundance in Sitka Sound is estimated at an order of magnitude greater than other stocks in the region and this stock continues to be the dominant stock in the region, both in terms of standing stock biomass and reliability for fishery economic potential. Some smaller stocks in the region, such as Tenakee Inlet and Hobart/Houghton are currently at a low level and have historically provided less stable fishery opportunities. Although error estimates were not calculated for egg deposition estimates, it is important to consider that annual fluctuation in egg deposition may be caused by either fluctuation in natural mortality rates or estimate error, and likely a combination of both. To lessen the chance that estimates of herring population size are unduly reliant upon any one data set, models incorporating age composition, weight at age and fecundity are used to forecast the spawning biomass, upon which fishery harvest levels are based. Thus, although dive survey-based estimates of egg deposition form an important index, it is one of several data sets used to assess herring stocks in southeastern Alaska. References Carlile DW, Larson RL, Minicucci TA. Stock Assessments of Southeast Alaska Herring in 1994 and Forecasts for 1995 Abundance. Alaska Department of Fish and Game, Division of Commercial Fisheries Regional Information Report 1J96-05, Juneau, 1996.
122
Hebert K. Dive Safety Manual. Alaska Department of Fish and Game, Special Publication No. 06-39. Anchorage, 2006. Jessen RJ. Statistical survey techniques. John Wiley and Sons: New York, NY, 1978. Schweigert JF, Haegele CW, Stocker M. Optimizing sampling design for herring spawn surveys in the Strait of Georgia, BC. Can J Fish Aquatic Sci. 1985; 42: 1806–14.
123
An Assessment of Growout Strategies for the Green Sea Urchin (Strongylocentrotus droebachiensis) Pamelia E. Fraungruber*, Nick P. Brown Center for Cooperative Aquaculture Research, 33 Salmon Farm Road, Franklin, ME 04634, USA [email protected] Abstract
Declining catches of sea urchins and high market price for their edible gonads has led to increased interest in sea urchin aquaculture in recent years. Land- and sea-based methods such as tank culture, suspended sea cages and sea ranching are being explored for sea urchins in both juvenile and adult stages, and an economic analysis of these methods will determine the viability of these methods for echiniculture in the Gulf of Maine. Dive sampling indicates that growth and survival on lease sites in Penobscot Bay may be site-dependent. Urchins collected at the Sloop Island lease site consistently exceed those collected at the Job Island site in both size and quantity. Urchins raised in the laboratory have shown nearly 100% survival, and though they had a smaller average size than those at the Sloop Island lease site in early months, have now shown greater average growth. Determining the costs and benefits of each method requires further data collection and subsequent cost analysis. Keywords: recirculating aquaculture, sea ranching
Introduction
Sea urchins are highly sought after for their edible gonads, particularly in Japan, where up to 80% of urchins harvested worldwide are sold through the Tokyo Central Wholesale Market (TCWM). While supply, demand, source and quality cause market price to fluctuate annually, sea urchins have commonly fetched prices exceeding $60/kg. While Japanese species are most highly prized, and Japan could provide urchins without extensive importing before the 1980s, declining catches have led to fisheries developing in other parts of Asia, Russia, Chile, and Washington State, California and Maine (Reynolds and Wilen, 2000; Taylor, 2004). Most of these fisheries, however, have also been overfished. The green sea urchin is the primary species found in the Gulf of Maine. Catches increased during the 1980s, and the fishery peaked in the 1992–93 season at 39 million pounds (Taylor, 2004). Since that time, catches have consistently declined, and in 2010, only 2.2 million pounds were harvested, for an ex-vessel value of $4.5 million, contributing only 1% of the total value of Maine fisheries (DMR, 2011). Declining wild catches and high market value have led to increased interest in sea urchin aquaculture, or echiniculture, in recent years. A three-year research project to investigate sea urchin growout strategies is being conducted by researchers at the Center for Cooperative Aquaculture Research (CCAR) for the University of Maine. A purpose-built recirculating system has been built to assess the viability of land-based echiniculture. Sea-ranching, whereby urchins are released at lease sites in Penobscot Bay, Maine, is being assessed using dive surveys to sample for growth and survival.
In: Pollock NW, ed. Diving for Science 2011. Proceedings of the American Academy of Underwater Sciences 30th Symposium. Dauphin Island, AL: AAUS; 2011.
124
Methods A single cohort of hatchery-raised urchins, produced at the CCAR in 2009, were used in this study. Nursery Stage Both land-based and sea-based strategies are under investigation. One group of juvenile urchins (measured for size/weight) were held in a recirculation system and fed to satiation with wild-harvested kelp. Temperature and water quality were maintained at optimum levels. Growth and survival data were collected. Another group of juvenile urchins were placed in suspended mesh cages at a lease site in Great Bay, NH by Dr. Larry Harris of the University of New Hampshire. Divers were used to recover the cages after several months, and growth and survival data were collected. A cost analysis will be completed for both land- and sea-based methods for growing juvenile urchins, and the economic viability of each method will be assessed. Growout stage Ten-thousand urchins from the land-based nursery facilities were then transferred to a purpose-built recirculating tank system upon reaching a size of 5-15 mm. Temperature and water quality are being maintained at optimum levels, and urchins are being fed to satiation using formulated feeds, to ensure rapid growth to market size (55 mm). Growth and survival data are being collected. Another 10,000 hatchery-reared urchins were seeded onto each of two lease sites at Job Island and Sloop Island in Penobscot Bay, Maine by divers using transects. In each compass direction, 500 to 1000 urchins, which had been tagged using fluorochrome dyes, were deposited at 5.0 m and 10 m from the starting point, as well as in the center of the study area. Predator, bottom cover and sea urchin surveys were completed to characterize the sites prior to seeding. Divers complete a survey of each site every four months, in spring, summer and winter, to collect samples and do predator surveys at each site. Visual surveys were used for collection of samples, and the addition of suction sampling in summer of 2011 ensures that counts are accurate. Samples are then taken to the laboratory to be measured and processed for microscopy. The jaws of each individual urchin are removed and placed in a sodium hypochlorite bleach solution for 24 hours, then rinsed with fresh water, dried, and taken to a lab for tag identification using fluorescence microscopy. Results Surveys of growth and contribution of hatchery-reared urchins to existing populations of urchins at the lease sites indicate that Sloop Island had a higher percentage of tagged urchins (40–58%) within the sampled area than the Job Island site (10–23%) (Figure 1). Initial weight data indicates that the growth of tagged urchins sampled at Sloop Island and those reared at CCAR has been significantly higher than that of urchins at Job Island. Laboratory urchins had average weights of 0.47 g at the time of lease site outplanting, 2.00 g at eight months and 3.87 g at 10 months, and survival is nearly 100%. Tagged urchins sampled at Sloop Island had average weights of 0.65 g at outplanting, 0.93 g at two months, 2.51 g at s months and 2.21 g at 10 months. Tagged urchins sampled at Job Island had average weights of 0.50 g at outplanting, 0.46 g at two months, 0.95 g at seven months and 0.24 g at 10 months.
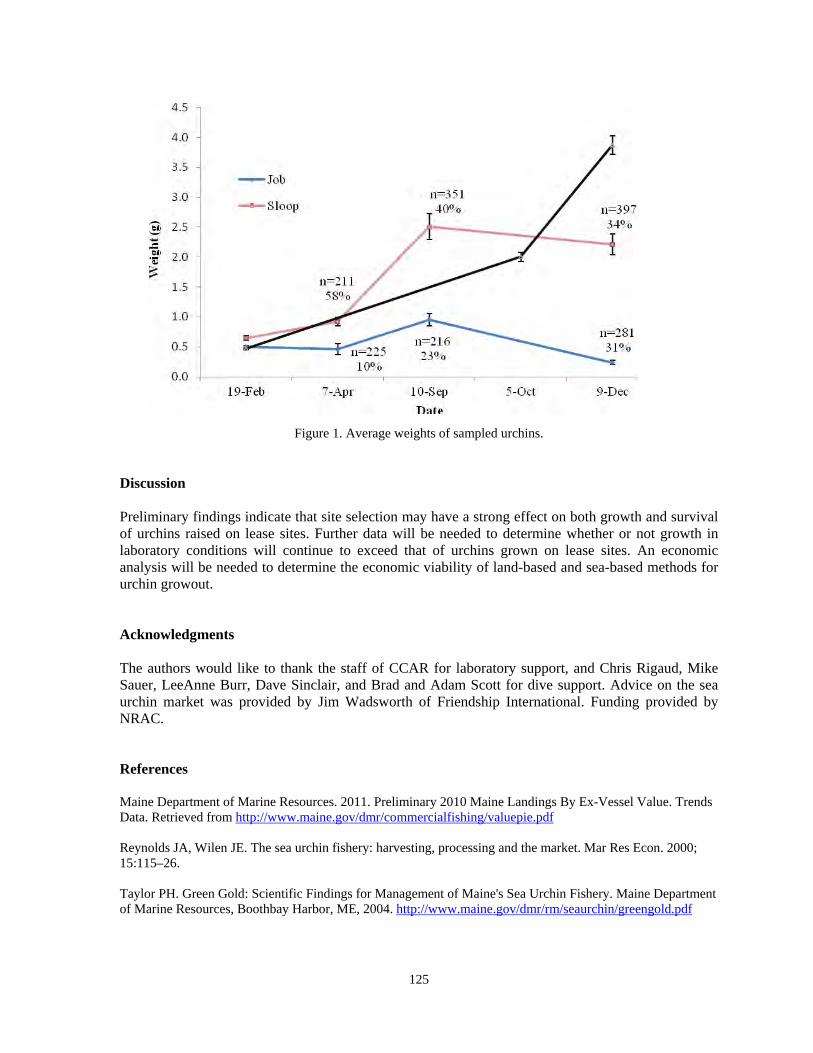
125
Figure 1. Average weights of sampled urchins.
Discussion Preliminary findings indicate that site selection may have a strong effect on both growth and survival of urchins raised on lease sites. Further data will be needed to determine whether or not growth in laboratory conditions will continue to exceed that of urchins grown on lease sites. An economic analysis will be needed to determine the economic viability of land-based and sea-based methods for urchin growout. Acknowledgments The authors would like to thank the staff of CCAR for laboratory support, and Chris Rigaud, Mike Sauer, LeeAnne Burr, Dave Sinclair, and Brad and Adam Scott for dive support. Advice on the sea urchin market was provided by Jim Wadsworth of Friendship International. Funding provided by NRAC. References Maine Department of Marine Resources. 2011. Preliminary 2010 Maine Landings By Ex-Vessel Value. Trends Data. Retrieved from http://www.maine.gov/dmr/commercialfishing/valuepie.pdf Reynolds JA, Wilen JE. The sea urchin fishery: harvesting, processing and the market. Mar Res Econ. 2000; 15:115–26. Taylor PH. Green Gold: Scientific Findings for Management of Maine's Sea Urchin Fishery. Maine Department of Marine Resources, Boothbay Harbor, ME, 2004. http://www.maine.gov/dmr/rm/seaurchin/greengold.pdf
126
A 'BLAGRRA' Assessment of Coral Bleaching and Disease in Bonaire Phoebe Jekielek
University of Maine School of Marine Sciences, Aubert Hall, Orono, ME 04469, USA [email protected] Abstract
The frequency and intensity of bleaching events in the Caribbean is exponentially increasing. From February 26th to March 10th 2011, the Bleaching Atlantic and Gulf Rapid Reef Assessment (BLAGRRA) protocol was used to assess reef health after a November 2010 bleaching event at 27 sites on the coral reefs of Bonaire and Klein Bonaire. Observations for signs of thermal stress, frequency and extent of mortality and presence of disease were recorded in Fishing Protected Areas (FPA) and control areas on Bonaire. A total of 28 species were assessed over all of the 27 sites. Montastrea annularis was the most abundant coral species and had the greatest amount of area affected by paling, bleaching and new mortality. Mean percentages for paling, bleaching and new mortality were higher at Klein Bonaire sites than for FPA or control sites on. Six known diseases were observed between all sites with Yellow Band disease as the most prevalent. Eighteen species of coral were affected by disease with the genus Montastrea having the highest frequency of disease. This study highlights the need for a broader understanding of reef recovery from bleaching events and the threatening link between bleaching and disease in the Caribbean. Furthermore, it suggests a need for improved monitoring methods to properly assess the effects of bleaching and disease on coral reefs.
Introduction Coral reef bleaching has dramatically increased in frequency, intensity and spatial extent worldwide since first recorded in 1911 and often corresponds with large scale temperature disturbances such as El Nino (Glynn, 1993; Goreau and Hayes, 1994; Brown, 1997; Berkelmans et al., 2004; Burke et al., 2011). Most often, mass bleaching events correlate with high temperature and light levels (Hough-Guldberg 1999). Due to this synergistic interaction, there exist global ocean 'hot spots' that may be more susceptible to bleaching (Goreau and Hayes, 1994). The Caribbean, an identified hot spot, has experienced major bleaching events in both 1998 and 2005 and, more recently, a less severe but still damaging event in the Fall of 2010 (Goreau and Hayes, 1994). Coral disease is also considered one of the greatest threats to the health of coral reef systems. A disproportionate number of records of coral disease have been found in the Caribbean with 76% of coral diseases described world-wide being found here (Green and Bruckner, 2000; Miller et al., 2009). It is suspected that anomalously high temperatures can also lead to increased outbreaks of disease in corals in addition to bleaching (Bruno et al., 2007). Recently, outbreaks of disease have been connected with bleaching events and the incidence and number of diseases in marine systems is on the rise (Ward and Lafferty, 2004; Miller et al., 2009). This study assesses the current state of reefs in Bonaire after a high temperature anomaly and bleaching event in November of 2010 using the Bleaching Atlantic and Gulf Rapid Reef Assessment (BLAGRRA) protocol which quantifies the signs and symptoms of bleaching, disease and recovery as indicators of reef health.
In: Pollock NW, ed. Diving for Science 2011. Proceedings of the American Academy of Underwater Sciences 30th Symposium. Dauphin Island, AL: AAUS; 2011.

127
Methods Using the BLAGRRA protocol, data collection was conducted over a period of two weeks from the 28th of February to the 10th of March 2011 on the islands of Bonaire and Klein Bonaire in the Dutch Antilles at a total of 27 sites. Ten m2 belt transects of fore reef habitat parallel to the coast at 10 m depth were assessed. All stony coral greater than or equal to 4cm in maximum length having any part inside the belt was measured to the nearest centimeter. Corals were identified by a four-letter code made up of the first letter of the genus and the first three letters of the species (e.g., Favia fragum = FFRA). If species could not be determined, the first four letters of the genus only were used. Disease, if present, was identified, if possible, and noted by disease code. Extent of bleaching, if present, was noted and recorded as percent cover of the live tissue. Bleaching was assessed as either percent pale or percent fully bleached. Mortality was also assessed as percent cover of the entire coral colony and noted as either percent of new, transitional or old mortality, rounded to the nearest 5%. Comparisons between fish protection area (FPA) sites, control (non-FPA) sites and Klein Bonaire sites are presented. Results A total of 28 species were assessed over all of the 27 sites. Montastrea annularis was the most abundant coral species and had the greatest amount of area affected by paling, bleaching and new mortality. Mean percentages for paling, bleaching and new mortality were higher at Klein Bonaire sites than for FPA or control sites on Bonaire with 22.1%, 2.1% and 13.9%, respectively. Six diseases were observed throughout the study including Yellow Band disease (YBD), Dark Spot disease (DS), White Plague disease (WP), Red Band disease #2 (RBD2), Black Band disease (BBD), and White Band disease (WBD).A total of 17 species, %77, were identified as being diseased and the frequency of disease was highest in Montastrea annularis. Yellow Band disease was the most common disease among corals with a total count of 123 incidences. Sites on Klein Bonaire had an average of 22.1%, 2.11% and 13.9% of pale, bleached and 'new' mortality, respectively. These values were all considerably higher than found on the island of Bonaire. Four out of the five sites on Klein Bonaire were observed to have diseased corals. Conclusions Four months after a bleaching event in Bonaire, area of tissue paled and area of 'new' mortality both increased whereas area of bleaching was decreased compared with assessments done immediately during and after the bleaching event. The species showing highest rates of pale and bleached tissue, such as Montastrea faveolata, and the most abundant species, Montastrea annularis, also showed high frequency of disease. Yellow band disease, the most prevalent disease found in Bonaire, was particularly common on the oldest and largest domal corals in reef systems and has become increasingly abundant in the Caribbean, causing high rates of mortality in the 1990s (Humann, 2003). Because this disease is currently so prevalent on reefs in Bonaire, its impact on reef health should continue to be closely monitored. Because coral cover and habitat architecture define the carrying capacity of ecosystems, the prevalence of bleaching and disease in large, reef-building domal morphologies, such as Colpophyllia and Montastrea, should be closely monitored and assessed. This study highlights the need for a broader understanding of reef recovery from bleaching events and the threatening link between bleaching and disease in the Caribbean. Furthermore, it suggests a need for improved monitoring methods to properly assess the effects of bleaching and disease on coral reefs.

128
Acknowledgments The author acknowledges the financial support from the Bonairian government for this monitoring project and Dr. Bob Steneck for the opportunity to participate. References Bruno JF, Selig ER, Casey KS, Page CA, Willis BL, Harvell CD, Sweatman H, Melendy AM. Thermal stress and coral cover as drivers of coral disease outbreaks. PLoS Biol. 2007. 5 (6): 1220–7. Berkelmens R, De'ath G, Kininmonth S, Skirving WJ. A comparison of the 1998 and 2002 coral bleaching events on the Great Barrier Reef: spatial correlation, patterns, and predictions. Coral Reefs. 2004. 23: 74–83. Brown BE. Coral bleaching: causes and consequences. Coral Reefs. 1997. 16(suppl): S129–38. Glynn PW. Coral reef bleaching: ecological perspectives. Coral Reefs. 1993. 12: 1–17. Goreau TJ, Hayes RL. Coral bleaching and ocean "hot spots". Ambio. 1994. 23: 176–80. Green EP, Bruckner AW. The significance of coral disease epizootiology for coral conservation. Biolog Conserv. 2000. 96 (3): 347–61. Hoegh-Guldberg O. Climate change, coral bleaching and the future of the world's coral reefs. Mar Freshwater Res. 1999. 50: 839–66. Humann P, Deloach N. Coral Diseases. In: Deloach N, ed. Reef Coral Identification: Florida, Caribbean, Bahamas. 2nd edition. New World Publications, Jacksonville, FL, pp 240–61. Miller J, Muller E, Rogers C, Waara R, Atkinson A, Whelan KRT, Patterson M, Witcher B. Coral disease following massive bleaching in 2005 causes 60% decline in coral cover on reefs in the US Virgin Islands. Coral Reefs. 2009. 28: 925–37. Ward, JR, Lafferty KD. The elusive baseline of marine disease: Are diseases in ocean systems increasing? PLoS Biol. 2004; 2 (4): 0542–7.
129
Freediving for Science: The Study of Coral Overgrowth by an Encrusting Red Alga (Ramicrusta sp.) in a Shallow Reef Environment Caren E. Eckrich1, M. Sabine Engel2 1 CIEE Research Station Bonaire, Kaya Gob. Debrot 26, Kralendijk, Bonaire, Dutch Caribbean [email protected] 2 STINAPA, PO Box 368, or Barcadera z/n, Bonaire, Dutch Caribbean Abstract
Although the use of scuba has been instrumental to coral reef research over the past half century, snorkeling or freediving in shallow reef environments can optimize research field days, allow access to areas not accessible by boat and is often the most cost-effective choice among research method. In Bonaire, Dutch Caribbean, there is an encrusting red alga (Ramicrusta sp., Peyssonneliaceae) that overgrows and kills numerous species of corals and other sessile organisms. The only location where the undescribed alga has been reported is the shallow back reef (<3 m) of Lac Bay and the forereef seaward of the bay. Both areas are difficult to sample using scuba gear, so snorkeling and freediving were utilized to collect data on various ecological characteristics of Ramicrusta sp. This study highlights the data collection methods and the pros and cons of freediving for research. Keywords: alga, Bonaire, competition, coral, encrusting, freediving, overgrowth, Peyssonneliaceae, Ramicrusta, scuba, snorkeling
Introduction Several species of red encrusting macroalgae in the family Peyssonneliaceae are capable of overgrowing corals (James et al., 1988; Antonius, 1998; Verlaque et al., 2000; Bruckner and Bruckner, 2008; Pueschel and Saunders, 2009; Ballantine and Ruiz, 2011). Little is known about the taxonomy, range distributions, abundances, or the capability of different species of algae in the Peyssonneliaceae family to overgrow other marine benthos. One undescribed species in particular, Ramicrusta sp. (Eckrich et al., 2011), is capable of overgrowing almost any substrate, living or non-living. As many reefs have undergone shifts from coral to algal-dominated alternate states, the study of algal-coral competitive interactions has become necessary to understand current reef dynamics and predict future trends. The only confirmed location of the undescribed Ramicrusta sp. is within and just outside of Lac Bay, Bonaire, Dutch Antilles (Figure 1). Lac Bay is situated on the windward side of Bonaire and although researchers were able to scuba dive to document the presence of Ramicrusta sp. seaward of the bay, data collection at this site was not possible due to strong surge. The shallow backreef also posed problems for scuba diving as this area is difficult to navigate by motorboat due to extensive stands of large corals, many of which extend to the water's surface. Therefore, freediving was utilized to collect data on the back reef of Lac Bay regarding the competitive interactions of the alga and its immediate and possible future impacts on the reef community.
In: Pollock NW, ed. Diving for Science 2011. Proceedings of the American Academy of Underwater Sciences 30th Symposium. Dauphin Island, AL: AAUS; 2011.
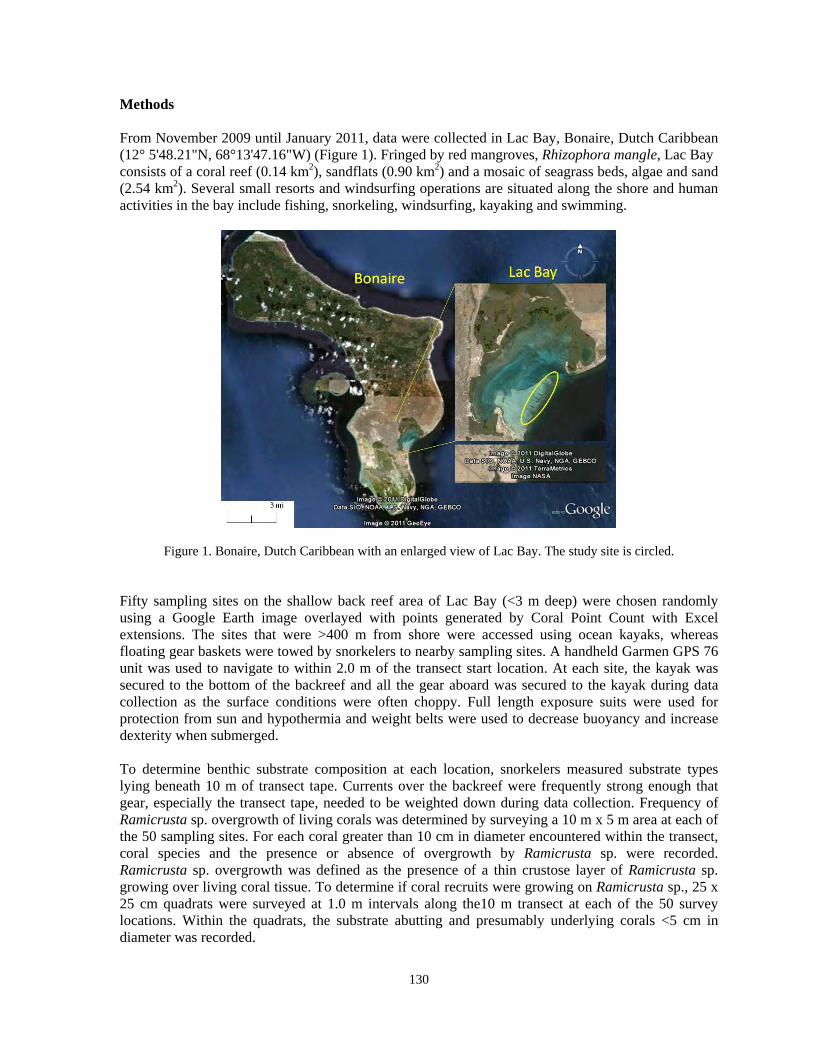
130
Methods From November 2009 until January 2011, data were collected in Lac Bay, Bonaire, Dutch Caribbean (12° 5'48.21"N, 68°13'47.16"W) (Figure 1). Fringed by red mangroves, Rhizophora mangle, Lac Bay consists of a coral reef (0.14 km2), sandflats (0.90 km2) and a mosaic of seagrass beds, algae and sand (2.54 km2). Several small resorts and windsurfing operations are situated along the shore and human activities in the bay include fishing, snorkeling, windsurfing, kayaking and swimming.
Figure 1. Bonaire, Dutch Caribbean with an enlarged view of Lac Bay. The study site is circled. Fifty sampling sites on the shallow back reef area of Lac Bay (<3 m deep) were chosen randomly using a Google Earth image overlayed with points generated by Coral Point Count with Excel extensions. The sites that were >400 m from shore were accessed using ocean kayaks, whereas floating gear baskets were towed by snorkelers to nearby sampling sites. A handheld Garmen GPS 76 unit was used to navigate to within 2.0 m of the transect start location. At each site, the kayak was secured to the bottom of the backreef and all the gear aboard was secured to the kayak during data collection as the surface conditions were often choppy. Full length exposure suits were used for protection from sun and hypothermia and weight belts were used to decrease buoyancy and increase dexterity when submerged. To determine benthic substrate composition at each location, snorkelers measured substrate types lying beneath 10 m of transect tape. Currents over the backreef were frequently strong enough that gear, especially the transect tape, needed to be weighted down during data collection. Frequency of Ramicrusta sp. overgrowth of living corals was determined by surveying a 10 m x 5 m area at each of the 50 sampling sites. For each coral greater than 10 cm in diameter encountered within the transect, coral species and the presence or absence of overgrowth by Ramicrusta sp. were recorded. Ramicrusta sp. overgrowth was defined as the presence of a thin crustose layer of Ramicrusta sp. growing over living coral tissue. To determine if coral recruits were growing on Ramicrusta sp., 25 x 25 cm quadrats were surveyed at 1.0 m intervals along the10 m transect at each of the 50 survey locations. Within the quadrats, the substrate abutting and presumably underlying corals <5 cm in diameter was recorded.
131
To determine maximum Ramicrusta sp. overgrowth rates on Millepora complanata, Porites porites, and P. astreoides colonies, monthly photos were taken using a Sony HD SR7 camcorder in an Ocean Images housing. The photo documentation period was from November 2009 to January 2011. Individual coral colonies (n ≥9 for each species) were marked with rebar stakes, and zip ties or reference nails were positioned on each colony to be used for measurement reference. For each photo, a freediver held a 25 x 25 cm quadrat over the site of Ramicrusta overgrowth to standardize the camera angle for the photographer that was also freediving. The freediver with the quadrat held a ruler along the boundary of the Ramicrusta sp. and living coral tissue. A minimum of two photos were taken on each sampling date during the documentation period. Results Analysis of the benthic composition and maximum overgrowth rates are being analyzed and will be submitted to a peer-reviewed journal for publication. Conclusions For the purposes of this study, freediving was an attractive choice for data collection for several reasons. Space limitation, especially when operating from a kayak, was an important consideration. Freediving gear, being less bulky than scuba gear, allowed for more space for research equipment in the kayak or aoard the floating gear baskets. Researchers found that more sites could be sampled in one field day when freediving due to less time spent transporting and donning scuba gear. Snorkeling gear has the added benefit of being more streamlined when compared to scuba gear, which was advantageous during long surface swims. Freediving allowed for more maneuverability in rough conditions, especially in locations where the reef was dense with living corals. Although the researchers preferred freediving over scuba diving for this study, there were drawbacks to this method. Researchers needed to be experienced in freediving and physically fit to successfully collect data in the challenging conditions of the backreef. Coordinated efforts were required during photography and each researcher needed advanced breath-holding skills to achieve images that were sharp and aligned correctly. Also, at the deeper sampling sites, frequent breath-hold dives resulted in slower progress and, at times, were exhausting. Although freediving has its shortcomings, it is a useful method for data collection, especially when shortcomings are outweighed by advantages, as was concluded in the application of freediving for this study. Acknowledgments This work was supported by CIEE (Council for International Educational Exchange) and STINAPA (Bonaire National Parks Foundation). Special thanks to Rita Peachey for reviewing this manuscript and Lisa Faber for her help in the field and lab. Jibe City donated the use of kayaks. References Antonius A, Ballesteros E. Epizoism: a new threat to coral health in Caribbean reefs. Rev Biol Trop. 1998; 46(5):145–56.

132
Ballantine DL, Ruiz H. Metapeyssonnelia milleporoides, a new species of coral-killing red alga (Peyssonneliaceae) from Puerto Rico, Caribbean Sea Bot Mar. 2011; 54:47–51. Bruckner AW, Bruckner RJ. Improving restoration approaches for Acropora palmata: lessons from the Fortuna Reefer grounding in Puerto Rico. Proc. 11th Int Coral Reef Sym. 2008: 1199–203. Eckrich CE, Engel MS, Peachey RBJ. Crustose, calcareous algal bloom (Ramicrusta sp.) overgrowing scleractinian corals, gorgonians, a hydrocoral, sponges, and other algae in Lac Bay, Bonaire, Dutch Caribbean. Coral Reefs. 2011; 30:131. Google Inc. Google Earth (Version 6.0.3.2197) Mountain View, CA: Google Inc. 2011. James NP, Wray JL, Ginsburg RN. Calcification of encrusting aragonitic algae (Peyssonneliaceae): implications for the origin of late Paleozoic reefs and cements. J Sed Petrol. 1988; 58: 291–303. Kohler KE, Gill SM. Coral Point Count with Excel extensions (CPCe): A visual basic program for the determination of coral and substrate coverage using random point count methodology. Comput Geosci. 2006; 32(9):1259–69. Pueschel CM, Saunders GW. Ramicrusta textilis sp. nov. (Peyssonneliaceae, Rhodophyta), an anatomically complex Caribbean alga that overgrows corals. Phycologia 2009; 48(6): 480–91. Verlaque M, Ballesteros E, Antonius A. Metapeyssonnelia corallepida sp. nov. (Peyssonneliaceae, Rhodophyta), an Atlantic encrusting red alga overgrowing corals. Bot Mar. 2000; 43:191–200.
133
Phylogenetic Order Differentiates Fatty Acid Composition of 40 Northeast Pacific Macrophytes Aaron W. E. Galloway1, Kevin H. Britton-Simmons1, Michael T. Brett2
1 Friday Harbor Laboratories, University of Washington (UW), 620 University Road, Friday Harbor, WA, 98250, USA [email protected] 2 UW Civil and Environmental Engineering, Seattle, WA, 98195–2700, USA Abstract
NE Pacific macrophyte communities are a diverse mix of species representing four divisions. Such variety can confound traditional stable isotope biomarker approaches to food web ecology. Fatty acids (FA) may offer a more taxon-specific approach to tracing specific carbon sources, but the distribution of FA among the diverse marine macrophyte groups is poorly characterized. We conducted a phylogenetically diverse survey of the FA content of 40 subtidal and intertidal macrophyte taxa within the Anthophyta, Chlorophyta, Ochrophyta, and Rhodophyta (21 orders and 36 families) found in the San Juan Archipelago (SJA), WA. We collected five replicate specimens from the median depth distribution for the taxa in the SJA during late May 2010 using scuba for subtidal specimens and extracted FA methyl esters from three replicate specimens. FA composition of macrophytes differs significantly among phylogenetic orders and families using both the full suite of all 44 FA identified and just seven 'essential' omega-3 and-6 FA (PERMANOVA, p<0.0001). This result is significant because essential FA are potentially more useful as biomarkers because consumers cannot synthesize these molecules de novo. Keywords: biomarker, ecosystem, fatty acids, macroalgae, spatial subsidy, temperate nearshore macrophytes
Introduction Does primary production from nearshore macrophyte communities fuel deep subtidal food webs? High latitude macrophyte communities (e.g., seaweeds and seagrasses) are among the most productive systems on earth, but little of this production is thought to be directly consumed by herbivores (Mann, 1988). A large portion of this energy is exported as a spatial subsidy (e.g., Polis et al., 1997) to subtidal (Duggins et al., 1989) food webs. Due to inherent difficulties of quantifying diet of invertebrate suspension feeders through direct observation or gut content, marine ecologists have turned to stable isotopes (e.g., Dunton and Schell, 1987; Duggins et al., 1989) and increasingly fatty acids (Budge et al., 2008; Richoux and Froneman, 2008; Brett et al., 2009; Copeman et al., 2009) to make inferences on the sources of primary production fueling consumer diets. Such approaches rely upon the fundamental assumption that the molecular signatures of the various primary producer 'sources' are different from one another. Here, we investigate whether taxonomic relationships (e.g., phyla, orders, and families) explain the FA content of 40 macrophyte taxa found in the San Juan Archipelago (SJA), WA.
In: Pollock NW, ed. Diving for Science 2011. Proceedings of the American Academy of Underwater Sciences 30th Symposium. Dauphin Island, AL: AAUS; 2011.

134
Methods Selection of taxa and collection We generated a list of 40 taxa (list available on request from lead author) that maximizes macrophyte phylogenetic diversity primarily by including as many orders as possible. We included multiple taxa within an order if: 1) each taxon was from a different family; 2) if the taxa could be found in significantly different habitats, e.g., inter- and sub-tidal; or 3) in the case of the Laminariales, we included eight species because of the ecological significance and biomass of this group in the standing stock or in the drift (e.g., Britton-Simmons et al., 2009) in the SJA. Assessment of seasonal, within-thallus, or depth variation was outside the scope of this research. To account for such potential variation, we only collected samples during a three-week window (21 May–10 June, 2010). We constrained sample collection to five locations in the SJA and collected replicate thalli within a taxon from only one location. We collected five replicate specimens from each taxon from the median point of its depth distribution (+3 to -10 m) and replicates were >2 m apart. Subtidal taxa (30 of the 40 total) were collected using scuba with nested game bags over the course of ~30 dives. To account for the broad array of thallus morphology we sampled from mechanistically comparable areas of the thalli, e.g., generally mid-blade, avoiding meristematic, reproductive, stipe/holdfast tissues in all specimens. Specimens were carefully brushed, rinsed, and frozen (-20°C) in Eppendorf sample tubes. Fatty acid extraction We extracted total FA from three replicates and archived the remaining samples as vouchers. All extractions were complete within seven months of collection. We lyopholized samples and ground the dry material into a powder prior to FA extraction following a modified Folch procedure (described in Brett et al. 2009). FA methyl esters were analyzed with a gas chromatograph equipped flame-ionization detector. We cross-verified our identified FA with chromatograms of three of our samples which were run through a GCMS at a Seattle NOAA FA lab, ultimately identifying a total of 44 unique FA. Individual FA are expressed as a percentage of the total FA weight and FA mass to total sample dry mass. Analytical approach We used PERMANOVA (Anderson, 2001) to evaluate differences among groups with multivariate FA datasets. Taxonomic factors are nested within each other in the analysis (e.g., family is nested in order, which is nested in division). We used Principal Components Analysis (PCA) ordinations of Euclidean resemblance matrices of percent FA composition data for multivariate data visualization. The seven 'essential' omega-3 and-6 FA (EFA) used in the reduced analyses included: 18:2n-6 [LIN], 18:3n-6, 18:3n-3 [ALA], 18:4n-3 [SDA], 20:4n-6 [ARA], 20:5n-3 [EPA], and 22:6n-3 [DHA]. We used PRIMER for all analyses. Results FA composition of macrophytes differs significantly among phylogenetic grouping variables of division, order, and family (PERMANOVA, p=0.0001). Furthermore, we found that similar (and significant) taxonomic differentiation is achieved using only seven EFA (PERMANOVA, p=0.0001). We found several EFA that may be used as biomarkers in marine food webs when considered along
135
with the abundance of other FA (e.g., 18:3n-3 in Anthophyta). We show that the proposed biomarker arachadonic acid (20:4n-6) is not indicative of brown algae in the Ochrophyta only and is present in similar amounts in several Rhodophyta taxa as well. Discussion EFA are an especially useful set of molecules in food web studies because they are important to survival, growth, and reproduction in a wide range of aquatic species (Brett and Muller-Navarra, 1997), but are only generated in significant amounts by aquatic algae (Gladyshev et al., 2009). Animals need EFA for many physiological processes but rely upon primary producers for the synthesis of these molecules. While researchers have investigated the contribution of phytoplankton-derived EFA to aquatic food webs (Kainz et al., 2004; Ravet et al., 2010) the role that macrophytes growing in nearshore ecosystems play in synthesizing EFA for subtidal food webs has not been specifically investigated. This is somewhat surprising due to the high productivity (Mann, 1973) and importance of benthic algae to nearshore invertebrate communities, including submarine canyons (Vetter and Dayton, 1998), offshore soft-sediment habitats (Kim, 1992), and deep rocky-reefs (Vanderklift and Wernberg, 2008). The dynamics of subtidal algae production, export, and utilization by consumer communities are difficult to assess, as observations or collections require the use of scuba or submersibles. The species list evaluated here is the largest and most diverse subtidal algae assemblage ever evaluated for FA content. Furthermore, the FA signatures of many of the taxa on our list are described here for the first time. We have shown that FA biomarkers offer a potentially fine resolution of disparate primary production sources (e.g., down to the family level). This 'taxonomic resolution' may ultimately be applied toward estimates of contribution of disparate macrophyte sources to primary consumers. Most importantly, this level of resolution is also achieved using only seven EFA biomarkers that consumers cannot synthesize de novo. Acknowledgments We thank A.P. Summers, D.O. Duggins, C. O'Kelly, M.N. Dethier, and A.T. Lowe for thoughtful comments and ideas. We thank D.P. Herman at NOAA-NWFSC for assistance with FA identification. This work was supported financially in part by: the American Academy of Underwater Sciences (Kathy T. Johnston PhD support scholarship to AWEG); AWEG was supported by the National Science Foundation (NSF) for an OACIS-GK12 Teaching Fellowship DGE-0742559 and NSF grant OCE-0925718. References Anderson MJ. A new method for non-parametric multivariate analysis of variance. Austral Ecol. 2001; 26: 32– 46.

136
Brett MT, Kainz MJ, Taipale SJ, Seshan H. Phytoplankton, not allochthonous carbon, sustains herbivorous zooplankton production. Proceedings of the National Academy of Sciences of the United States of America. 2009; 106: 21197–201. Brett MT, Muller-Navarra DC. The role of highly unsaturated fatty acids in aquatic foodweb processes. Freshwater Biol. 1997; 38: 483–99. Britton-Simmons KH, Foley G, Okamoto D. Spatial subsidy in the subtidal zone: utilization of drift algae by a deep subtidal sea urchin. Aquatic Biol. 2009; 5: 233–43. Budge SM, Wooller MJ, Springer AM, Iverson SJ, McRoy CP, Divoky GJ. Tracing carbon flow in an arctic marine food web using fatty acid-stable isotope analysis. Oecologia. 2008; 157: 117–29. Copeman LA, Parrish CC, Gregory RS, Jamieson RE, Wells J, Whiticar MJ. Fatty acid biomarkers in coldwater eelgrass meadows: elevated terrestrial input to the food web of age-0 Atlantic cod Gadus morhua. Mar Ecol Progress Ser. 2009; 386: 237–51. Duggins DO, Simenstad CA, Estes JA. Magnification of secondary production by kelp detritus in coastal marine ecosystems. Sci. 1989; 245: 170–3. Dunton KH, Schell DM. Dependence of consumers on macroalgal (Laminaria solidungula) carbon in an arctic kelp community: d13C evidence. Mar Biol. 1987; 93: 615–25. Gladyshev MI, Arts MT, Sushchik NN. Preliminary estimates of the export of omega-3 highly unsaturated fatty acids (EPA + DHA) from aquatic to terrestrial ecosystems. In: Arts MT, Brett MT, Kainz M, eds. Lipids in Aquatic Ecosystems. Springer: New York, NY; 2009; pp 179–209. Kainz MM, Arts T, Mazumder A. Essential fatty acids in the planktonic food web and their ecological role for higher trophic levels. Limnol Oceanog. 2004; 49: 1784–93. Kim SL. The role of drift kelp in the population ecology of a Diopatra ornata Moore (Polychaeta: Onuphidae) ecotone. J Experim Mar Biol Ecol. 1992; 156: 253–72. Mann KH. Production and use of detritus in various freshwater, estuarine, and coastal marine ecosystems. Limnol Oceanog. 1988; 33: 910–30. Polis GA, Anderson WB, Holt RD. Towards an integration of landscape and food web ecology: the dynamics of spatially subsidized food webs. Annual Rev Ecol Systematics. 1997; 28: 289–316. Ravet JL, Brett MT, Arhonditsis GB. The effects of seston lipids on zooplankton fatty acid composition in Lake Washington, Washington, USA. Ecol. 2010; 91: 180–90. Richoux NB, Froneman PW. Trophic ecology of dominant zooplankton and macrofauna in a temperate, oligotrophic South African estuary: a fatty acid approach. Mar Ecol Progress Ser. 2008; 357: 121–37. Vanderklift MA, Wernberg T. Detached kelps from distant sources are a food subsidy for sea urchins. Oecologia. 2008; 157: 327–35. Vetter EW, Dayton PK. Macrofaunal communities within and adjacent to a detritus-rich submarine canyon system. Deep-Sea Res. 1998; 45: 25–54.
137
Variability in Antibacterial Activity in Hawaiian Corals Deborah J. Gochfeld1,2*, Katerina E. Pappas1, Sylvester Lee2, Greta S. Aeby3
1 National Center for Natural Products Research, and 2 Environmental Toxicology Research Program, PO Box 1848, University of Mississippi, Oxford, MS 38677, USA [email protected] 3 Hawaii Institute of Marine Biology, PO Box 1346, Kaneohe, HI 96744, USA *corresponding author Abstract
Coral disease has emerged as a serious threat to coral reefs worldwide and a major cause of reef deterioration. We assessed the potential production of antibacterial chemical defenses in three common species of Hawaiian corals, Pocillopora meandrina, Porites lobata and Montipora capitata that vary in their susceptibility to disease. We performed reef surveys to determine the relative levels of disease susceptibility among species. Coral extracts were tested for antibacterial activity in bacterial growth assays using a diversity of potential marine pathogens and chemical profiles of extracts from healthy and diseased M. capitata were compared. Extracts from all three species of Hawaiian corals exhibited high levels of antibacterial activity, which was selective against different bacterial strains, and varied at the colony, population and species levels. Colonies of M. capitata exhibiting the disease Montipora White Syndrome produced different levels of antibacterial chemical defenses than did healthy neighbors. Antibacterial chemical defenses have the potential to provide corals with protection from bacterial pathogens. Differences in levels and types of defense might enable particular populations, species or genotypes to have an advantage over others in resisting invasion by pathogens. Keywords: antibacterial activity, chemical ecology, coral disease, Hawaiian reefs
Introduction Coral disease has emerged as a serious threat to coral reefs worldwide and a major cause of reef deterioration (Rosenberg and Loya, 2004). As sessile organisms, corals are particularly susceptible to invasion by pathogens. Corals employ a suite of defense mechanisms to rid themselves of potential pathogens. One potential mechanism of disease resistance in corals is the production of antibacterial chemical defenses (Gochfeld and Aeby, 2008). Chemical defenses in sessile organisms such as corals provide protection from predators, competitors, pathogens and fouling organisms, and are necessary for the survival of these species. We assessed the potential production of antibacterial chemical defenses in three common species of Hawaiian corals, Pocillopora meandrina, Porites lobata and Montipora capitata that vary in their susceptibility to disease. Methods We performed reef surveys using scuba to determine the relative levels of disease susceptibility among three common coral species and among individual colonies within species. We tested aqueous extracts of small pieces of the dominant Hawaiian coral species at natural volumetric concentrations in a bacterial growth assay. Briefly, bacteria were exposed to natural concentrations of coral extract
In: Pollock NW, ed. Diving for Science 2011. Proceedings of the American Academy of Underwater Sciences 30th Symposium. Dauphin Island, AL: AAUS; 2011.
138
and bacterial growth was measured over time in a 96-well plate assay. The slopes of the growth curves were compared to zero (no growth) to determine whether there was inhibitory, stimulatory or no effect of the extract on bacterial growth (Gochfeld and Aeby, 2008). Since the pathogens responsible for most coral diseases have not been identified, the bacteria used in our assays included a panel of known coral pathogens, human enteric bacteria that may enter near-shore waters by point source discharges, and bacteria that have been isolated from coral surfaces. In addition, we also collected diseased and healthy tissue from M. capitata affected by the disease Montipora White Syndrome, as well as tissue from nearby healthy conspecifics. We tested antibacterial activity from extracts of these corals, and produced chemical profiles of M. capitata extracts using High Performance Liquid Chromatography. From these profiles, we quantified the relative concentrations of individual compounds by calculating the areas under the curve for each of 21 ubiquitous peaks. Results Reef surveys indicated that corals of the genus Porites have the highest prevalence of disease on Hawaiian reefs, whereas Pocillopora corals are rarely affected. However, Porites spp. are primarily affected by chronic diseases with relatively low rates of mortality, such as the parasitic infection Porites trematodiasis and growth anomalies. In contrast, Montipora White Syndrome is one of the most frequently observed infectious diseases on Hawaiian reefs, and it is particularly common in Kanehoe Bay, Oahu. This disease is specific to M. capitata, which represents approximately 60% of the coral cover in Kaneohe Bay. Montipora White Syndrome causes up to 25% total colony mortality within two years and is considered highly infectious (Aeby et al., 2010). Interestingly, during reef surveys, it was observed that two distinct color morphs of M. capitata exhibit differential susceptibility to Montipora White Syndrome. Although the red morph represents 80% of the M. capitata population, Montipora White Syndrome disproportionately affects the orange color morph (70% of affected colonies). Ecological and biochemical differences among these conspecific variants are currently being investigated. Several bacterial isolates are currently being assessed as potential etiologic agents for Montipora White Syndrome. Extracts from all three species of Hawaiian corals exhibited high levels of antibacterial activity, which was highly selective against different bacterial strains, and varied at the colony, population and species levels. This variability in chemical defenses may protect certain corals from invasion by certain bacteria by inhibiting bacterial growth. In addition, some coral extracts were stimulatory towards specific bacterial strains, an adaptation that may also benefit corals by encouraging the establishment of a resident bacterial assemblage that might compete with invasive pathogenic microbes. Colonies of M. capitata exhibiting signs of Montipora White Syndrome produced different levels of antibacterial chemical defenses than did healthy conspecific neighbors. Healthy corals had significantly higher levels of antibacterial activity against one of the pathogens tested than did diseased corals, which may indicate an overall greater level of immunity from disease in healthy colonies. In addition, MWS-affected tissue had significantly higher levels of activity against another pathogen than did unaffected tissue on the same colony, suggesting the presence of a localized induced defense. Antibacterial activity against putative pathogens specific to Montipora White Syndrome is also being evaluated. Chemical fingerprints of M. capitata identified at least two compounds that differed in concentrations between healthy and diseased coral tissue.
139
Conclusions Antibacterial chemical defenses have the potential to provide corals with protection from bacterial pathogens. The high degree of selectivity of coral extracts likely plays an important role, by facilitating the establishment of the coral's naturally associated microbial community, while warding off potentially harmful invaders. Differences in levels and types of defense might enable particular populations, species or genotypes to have an advantage over others in resisting invasion by pathogens. This plasticity may represent a mechanism by which variability in resistance or susceptibility to pathogens might be realized and may provide insight into patterns of disease incidence and prevalence on coral reefs. Acknowledgments Funding was provided by NSF grant #0961384 to DJG and by from the NOAA Center for Sponsored Coastal Ocean Science, under award NA05NOS4261157 to the University of Hawaii for the Hawaii Coral Reef Initiative. All coral samples were collected under Hawaii Division of Aquatic Resources permits. References Aeby GS, Ross M, Williams GJ, Lewis TD, Work TM. Disease dynamics of Montipora white syndrome within Kaneohe Bay, Oahu, Hawaii: distribution, seasonality, virulence, and transmissibility. Diseases Aquatic Organisms. 2010; 91: 1–8. Gochfeld DJ, Aeby GS. Antimicrobial chemical defenses in Hawaiian corals: possible protection from disease? Mar Ecol Progress Series. 2008. 362: 119–28. Rosenberg E, Loya Y. Coral health and disease. Springer-Verlag: Berlin, Germany, 2004.
140
Fertilization Success of the Circumpolar Antarctic Seastar Odontaster validus (Koehler, 1906): A Diver-Collected Study Laura J. Grange1*, Paul A. Tyler1 , Lloyd S. Peck2 1 School of Ocean and Earth Sciences, University of Southampton, National Oceanography Centre, Southampton, SO14 3ZH, UK [email protected] * Present address: Oceanography Department, MSB 614, University of Hawaii at Manoa, 1000 Pope Road, Honolulu, HI 96822, USA 2 British Antarctic Survey, Natural Environment Research Council, High Cross, Madingley Road, Cambridge, CB3 0ET, UK Abstract
Broadcast spawning invertebrates in the Antarctic encounter a very arduous and unforgiving environment, where consistently low temperatures, high seawater viscosities and at times high flow conditions undermine successful sperm-egg interactions. The fertilization traits of the circumpolar Antarctic seastar Odontaster validus, were analyzed from diver-collected monthly samples from a shallow water site adjacent to the British Antarctic Survey (BAS) Rothera Research Station (Western Antarctic Peninsula). Dives were conducted using open-circuit scuba between 15–20 m depths. Successful sperm-egg interactions varied amongst seastars, however there was an optimum range in sperm concentration over which high numbers of eggs were fertilized (105–106 sperm⋅mL-1). This Antarctic seastar required 1–2 orders of magnitude more sperm to ensure optimal fertilization success compared to several comparable temperate species and the longevity of spermatozoa was moderate, retaining some activity and minimal fertilizing ability up to 24 hours after release. Eggs and sperm released by O. validus were also highly stenothermal, with extremely narrow ranges of thermal tolerance. Therefore, even small modifications in temperature dramatically reduced the number of eggs fertilized. This has important implications for the geographical distribution of Antarctic invertebrates, but also confirms the susceptibility of these species to environmental modification, making them one of the most temperature sensitive fauna on Earth. Such stenothermy is of particular relevance if ocean warming and the 1–2ºC rise in global temperature, predicted over the next century, is realized. Keywords: Antarctica, broadcast spawning, fertilization kinetics, gamete age, ocean warming, sperm-egg interactions, temperature
Introduction Fertilization success in broadcast spawning marine invertebrates is a function of many factors some of which include, but are not restricted to, the concentration of sperm available to fertilize eggs, the longevity of gametes, and the physical properties experienced within the ambient environment, e.g., seawater temperature. The relative importance of each factor is dependent on both species-specific and habitat/ environment-specific characteristics (Levitan, 1995). There have been few studies of fertilization kinetics centered on polar, broadcast spawning marine invertebrates, except for a small amount of species-specific work (e.g., Powell, 2001; Powell et al., 2001). Powell and colleagues (2001) determined the optimum sperm concentration for fertilization
In: Pollock NW, ed. Diving for Science 2011. Proceedings of the American Academy of Underwater Sciences 30th Symposium. Dauphin Island, AL: AAUS; 2011.
141
success in the Antarctic soft-shelled clam Laternula elliptica and the Antarctic limpet Nacella concinna. Optimum sperm concentrations found for these species were also used to assess the effect of sperm aging on fertilization success and revealed spermatozoa that were long-lived; capable of fertilizing newly released eggs for >90 hours in L. elliptica and ~ 65 hours in N. concinna. However, the vast majority of research has focused on nearshore temperate and tropical marine invertebrates. These studies have included a wide array of molluscan species, particularly those of commercial importance (André and Lindegarth, 1995; Levy and Couturier, 1996; Babcock and Keesing, 1999; Styan and Butler, 2000; Baker and Tyler, 2001; Grubert et al., 2005), echinoderms particularly echinoids (Vogel et al., 1982; Pennington, 1985; Levitan et al., 1991; Sewell and Young, 1999; Meidel and Yund, 2001), polychaetes (Thomas, 1994; Kupriyanova and Havenhand, 2002; Kupriyanova, 2006), corals (Lasker et al., 1996; Coma and Lasker, 1997bb), ascidians (Marshall et al., 2000; Jantzen and Havenhand, 2001; Marshall et al., 2002), bryozoans (Yund and McCartney, 1994; Manríquez et al., 2001) and fish (Griffin et al., 1998; Litvak and Trippel, 1998); the vast majority of which are amenable to both laboratory and field manipulations (see reviews by Levitan and Petersen, 1995; Levitan, 1996; Yund, 2000). Successful fertilization is possible over a wide range of sperm concentrations, however in both field and laboratory observational studies, fertilization success varies over a broad range (0–100%) (Levitan, 1995). At lower sperm concentrations the numbers of successful sperm-egg interactions become diminished as sperm become diluted and gametes become less effective over time. There are several examples of broadcast spawning amongst nearshore Antarctic marine invertebrates (Clarke, 1992; Pearse, 1994; Stanwell-Smith et al., 1999; Pearse and Lockhart, 2004). Many of these invertebrates exhibit spawning adaptations to counter the deleterious effects of sperm dilution, including aggregative behavior, observed in stacks of N. concinna (Picken and Allan, 1983) and synchronous spawning, demonstrated for several shallow water echinoderms and a nemertean worm (Grange et al., 2004; 2007; 2011). However, the fertilization ecology of polar invertebrates and the factors intrinsic to their fertilization success have not been widely reported. Antarctic marine invertebrates have evolved over millennial timescales and have become closely adapted to a background of low, constant seawater temperatures (typically between -1.8 and +2°C) (Clarke and Crame, 1989). These low temperatures constrain the physical attributes of the marine environment and the physiological characteristics of the fauna, producing a water column, which is highly viscous, dense and low in pH, and promoting a community that is typified by deferred maturation, extended gametogenic cycles, delayed embryonic development and prolonged larval periods (Bosch et al., 1987; Hoegh-Guldberg and Pearse, 1995; Pearse and Lockhart, 2004; Peck et al., 2006; 2007). Polar marine invertebrates experience a very narrow range of temperature and other environmental parameters within which they can function efficiently (Peck et al., 2004) and are regarded as highly stenothermal (Peck et al., 2009ab; Peck et al., 2010). This has important implications for the distribution and potential survival of Antarctic marine invertebrates, especially as waters round Antarctica are being increasing affected by global warming (King and Harangozo, 1998; Meredith and King, 2005; Clarke et al., 2007; McClintock et al., 2008). The current study investigated fertilization success of O. validus. This seastar is ubiquitous to the Antarctic and is extremely abundant, ranging between the intertidal to 940 m depth. Records of O. validus indicate a circumpolar distribution from sites in South Georgia (54°S), throughout the Southern Ocean to the extreme southerly latitude of McMurdo Sound (78°S) (McClintock et al., 1988). O. validus are known to broadcast spawn directly into the water column (Pearse, 1965; 1969). Spawning occurs synchronously between males and females and annually during the austral winter after a prolonged period (18–24 months) of gametogenic development (Pearse, 1965; 1969; Pearse et al., 1991; Grange et al., 2007). With the exception of Stanwell-Smith and Clarke (1998), who studied

142
spawning competence in the seastar, studies on the factors affecting fertilization success of O. validus have not previously been reported. Methods Diver collection Individual seastars were scuba diver collected from South Cove (Figure 1A), a shallow water site adjacent to the British Antarctic Survey Rothera Research Station, Adelaide Island, Western Antarctic Peninsula (67°34 S, 68°08 W). Collections were undertaken once a month during the summer field seasons of March 2003 and March 2004. Dives were conducted using open-circuit scuba, using both shore entry and a rigid inflatable boat as a dive platform. Collection dives were typically 30–45 minutes during which time divers were always tethered via individual surface marker buoys to the surface. Dive teams, consisting of a buddy pair, donned standard dry suits and 7 mm custom-made, neoprene full-finger mitts. Divers collected seastars randomly from 15–20 m depths, with a preference for larger seastars, ensuring sexual maturity in sampled individuals. On surfacing, divers immediately transferred specimens into buckets containing seawater, before transport to the Bonner Laboratory where seastars were housed in a temperature controlled, flow-through seawater aquarium adjacent to South Cove. Experimental trials were conducted at the British Antarctic Survey headquarters in Cambridge UK, where seastars were maintained in 1.0 m deep tanks in a purpose built aquarium. This semi-closed re-circulating system was housed at a constant temperature (seawater 0.5±0.5°C) and experiments were conducted during July – late August to coincide with the natural spawning period of O. validus.
Figure 1 (A). Location of South Cove study site at Rothera Point, Adelaide Island, Antarctica. A CTD site and sediment trap located south west of Rothera Point provide marine environmental data as part of the British Antarctic Survey's long-term monitoring program (RaTS). Large-scale map indicates the position of Rothera Research Station on Adelaide Island, Western Antarctic Peninsula. (B) Female Odontaster validus spawning.
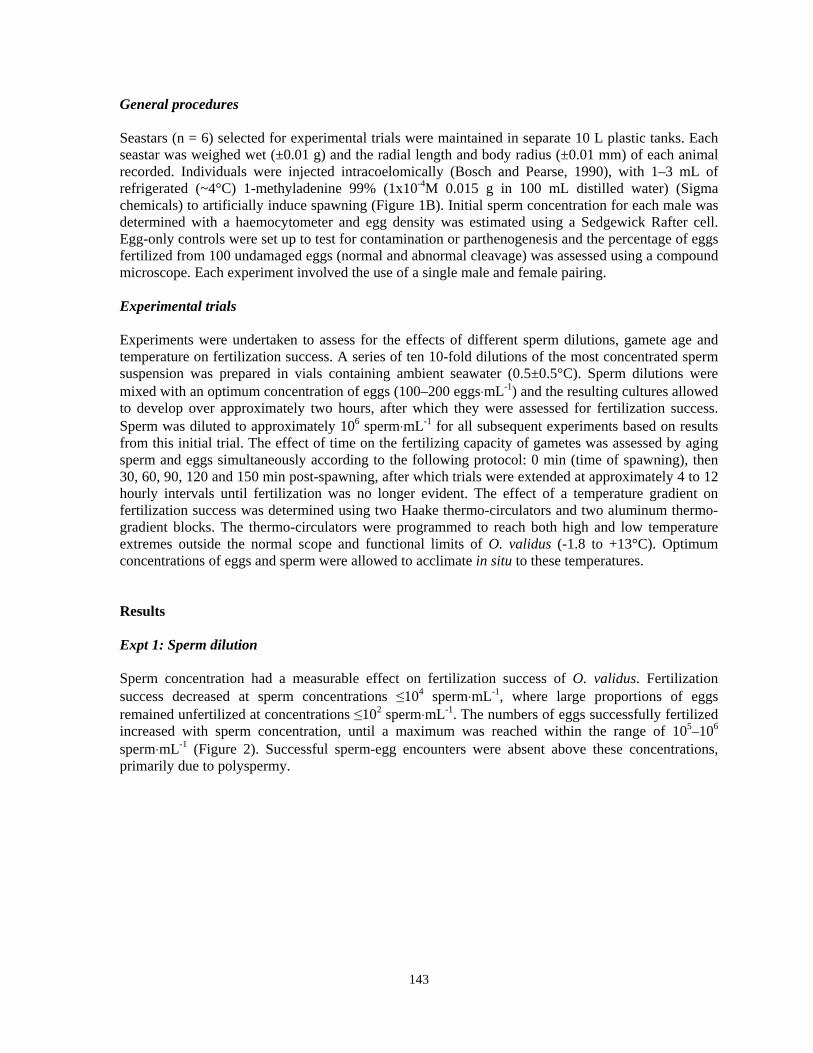
143
General procedures Seastars (n = 6) selected for experimental trials were maintained in separate 10 L plastic tanks. Each seastar was weighed wet (±0.01 g) and the radial length and body radius (±0.01 mm) of each animal recorded. Individuals were injected intracoelomically (Bosch and Pearse, 1990), with 1–3 mL of refrigerated (~4°C) 1-methyladenine 99% (1x10⁻⁴M 0.015 g in 100 mL distilled water) (Sigma chemicals) to artificially induce spawning (Figure 1B). Initial sperm concentration for each male was determined with a haemocytometer and egg density was estimated using a Sedgewick Rafter cell. Egg-only controls were set up to test for contamination or parthenogenesis and the percentage of eggs fertilized from 100 undamaged eggs (normal and abnormal cleavage) was assessed using a compound microscope. Each experiment involved the use of a single male and female pairing. Experimental trials Experiments were undertaken to assess for the effects of different sperm dilutions, gamete age and temperature on fertilization success. A series of ten 10-fold dilutions of the most concentrated sperm suspension was prepared in vials containing ambient seawater (0.5±0.5°C). Sperm dilutions were mixed with an optimum concentration of eggs (100–200 eggs⋅mL-1) and the resulting cultures allowed to develop over approximately two hours, after which they were assessed for fertilization success. Sperm was diluted to approximately 106 sperm⋅mL-1 for all subsequent experiments based on results from this initial trial. The effect of time on the fertilizing capacity of gametes was assessed by aging sperm and eggs simultaneously according to the following protocol: 0 min (time of spawning), then 30, 60, 90, 120 and 150 min post-spawning, after which trials were extended at approximately 4 to 12 hourly intervals until fertilization was no longer evident. The effect of a temperature gradient on fertilization success was determined using two Haake thermo-circulators and two aluminum thermo-gradient blocks. The thermo-circulators were programmed to reach both high and low temperature extremes outside the normal scope and functional limits of O. validus (-1.8 to +13°C). Optimum concentrations of eggs and sperm were allowed to acclimate in situ to these temperatures. Results Expt 1: Sperm dilution Sperm concentration had a measurable effect on fertilization success of O. validus. Fertilization success decreased at sperm concentrations ≤104 sperm⋅mL-1, where large proportions of eggs remained unfertilized at concentrations ≤102 sperm⋅mL-1. The numbers of eggs successfully fertilized increased with sperm concentration, until a maximum was reached within the range of 105–106 sperm⋅mL-1 (Figure 2). Successful sperm-egg encounters were absent above these concentrations, primarily due to polyspermy.
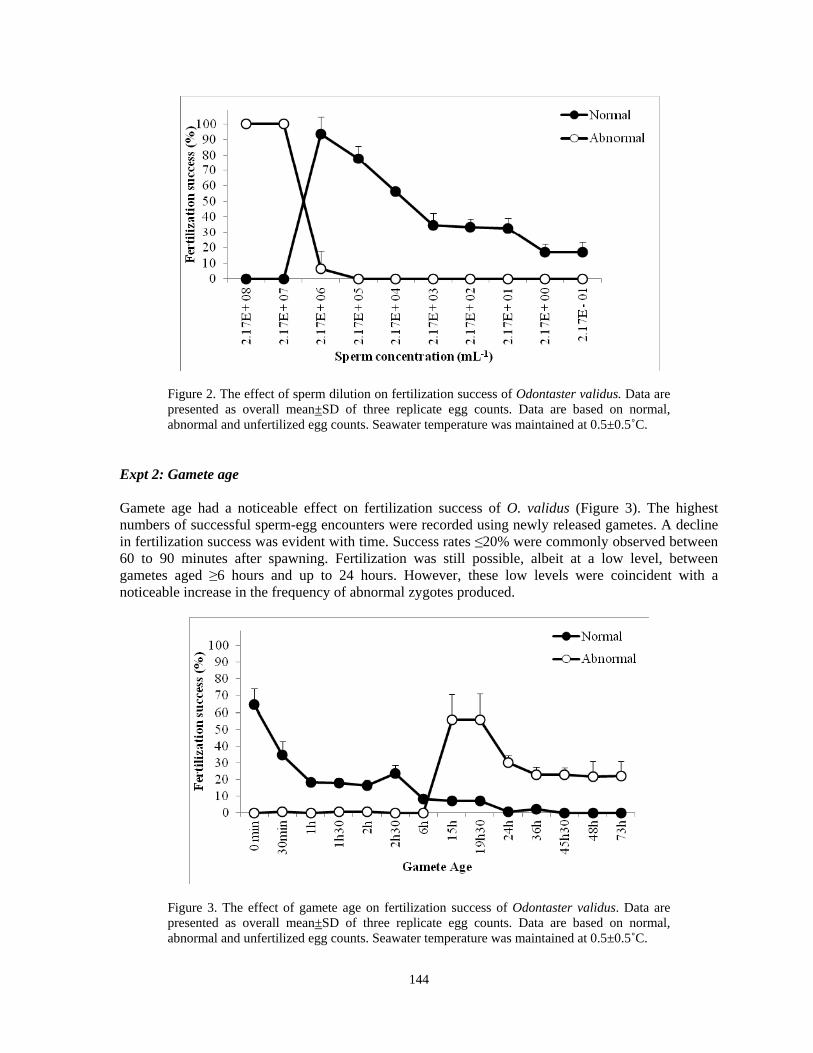
144
Figure 2. The effect of sperm dilution on fertilization success of Odontaster validus. Data are presented as overall mean±SD of three replicate egg counts. Data are based on normal, abnormal and unfertilized egg counts. Seawater temperature was maintained at 0.5±0.5˚C.
Expt 2: Gamete age Gamete age had a noticeable effect on fertilization success of O. validus (Figure 3). The highest numbers of successful sperm-egg encounters were recorded using newly released gametes. A decline in fertilization success was evident with time. Success rates ≤20% were commonly observed between 60 to 90 minutes after spawning. Fertilization was still possible, albeit at a low level, between gametes aged ≥6 hours and up to 24 hours. However, these low levels were coincident with a noticeable increase in the frequency of abnormal zygotes produced.
Figure 3. The effect of gamete age on fertilization success of Odontaster validus. Data are presented as overall mean±SD of three replicate egg counts. Data are based on normal, abnormal and unfertilized egg counts. Seawater temperature was maintained at 0.5±0.5˚C.
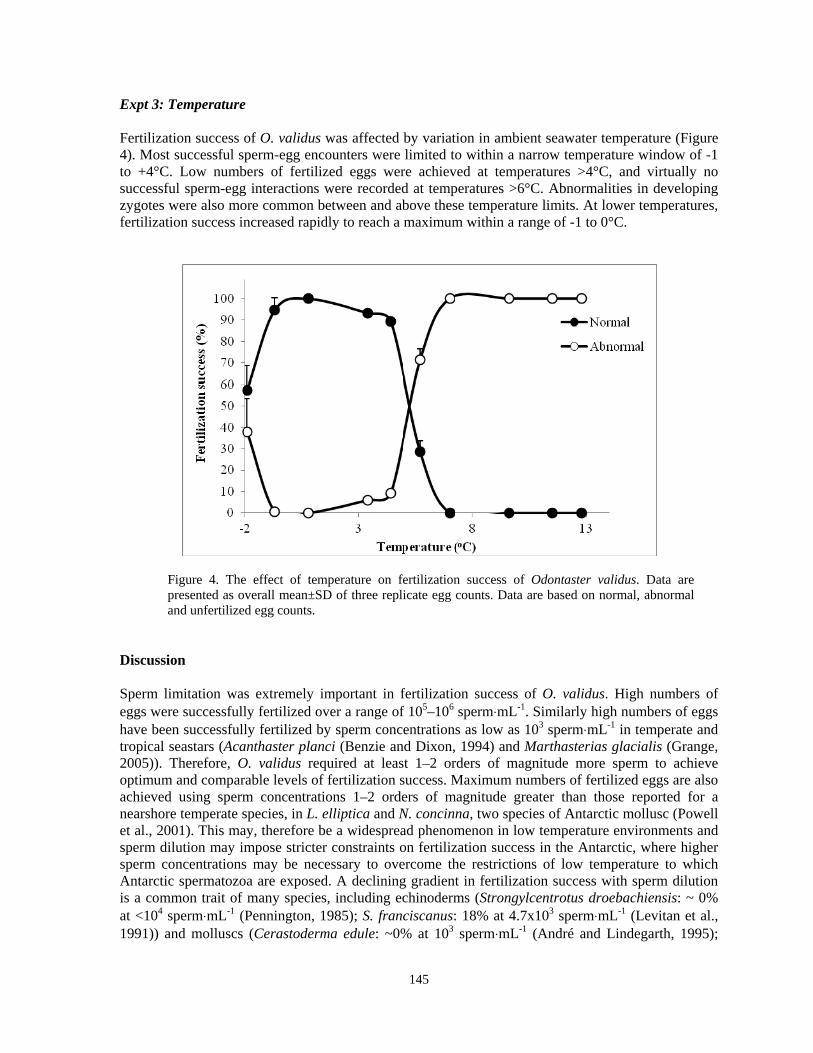
145
Expt 3: Temperature Fertilization success of O. validus was affected by variation in ambient seawater temperature (Figure 4). Most successful sperm-egg encounters were limited to within a narrow temperature window of -1 to +4°C. Low numbers of fertilized eggs were achieved at temperatures >4°C, and virtually no successful sperm-egg interactions were recorded at temperatures >6°C. Abnormalities in developing zygotes were also more common between and above these temperature limits. At lower temperatures, fertilization success increased rapidly to reach a maximum within a range of -1 to 0°C.
Figure 4. The effect of temperature on fertilization success of Odontaster validus. Data are presented as overall mean±SD of three replicate egg counts. Data are based on normal, abnormal and unfertilized egg counts.
Discussion Sperm limitation was extremely important in fertilization success of O. validus. High numbers of eggs were successfully fertilized over a range of 105–106 sperm⋅mL-1. Similarly high numbers of eggs have been successfully fertilized by sperm concentrations as low as 103 sperm⋅mL-1 in temperate and tropical seastars (Acanthaster planci (Benzie and Dixon, 1994) and Marthasterias glacialis (Grange, 2005)). Therefore, O. validus required at least 1–2 orders of magnitude more sperm to achieve optimum and comparable levels of fertilization success. Maximum numbers of fertilized eggs are also achieved using sperm concentrations 1–2 orders of magnitude greater than those reported for a nearshore temperate species, in L. elliptica and N. concinna, two species of Antarctic mollusc (Powell et al., 2001). This may, therefore be a widespread phenomenon in low temperature environments and sperm dilution may impose stricter constraints on fertilization success in the Antarctic, where higher sperm concentrations may be necessary to overcome the restrictions of low temperature to which Antarctic spermatozoa are exposed. A declining gradient in fertilization success with sperm dilution is a common trait of many species, including echinoderms (Strongylcentrotus droebachiensis: ~ 0% at <104 sperm⋅mL-1 (Pennington, 1985); S. franciscanus: 18% at 4.7x10³ sperm⋅mL-1 (Levitan et al., 1991)) and molluscs (Cerastoderma edule: ~0% at 103 sperm⋅mL-1 (André and Lindegarth, 1995);
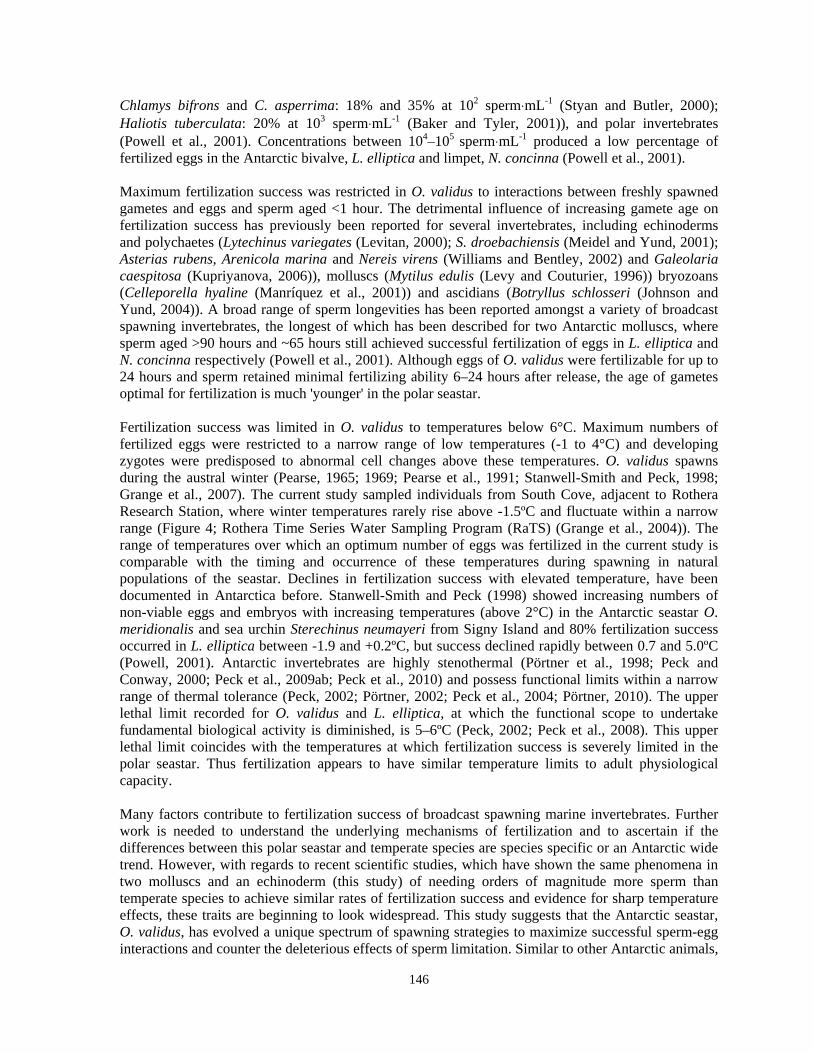
146
Chlamys bifrons and C. asperrima: 18% and 35% at 102 sperm⋅mL-1 (Styan and Butler, 2000); Haliotis tuberculata: 20% at 103 sperm⋅mL-1 (Baker and Tyler, 2001)), and polar invertebrates (Powell et al., 2001). Concentrations between 104–105 sperm⋅mL-1 produced a low percentage of fertilized eggs in the Antarctic bivalve, L. elliptica and limpet, N. concinna (Powell et al., 2001). Maximum fertilization success was restricted in O. validus to interactions between freshly spawned gametes and eggs and sperm aged <1 hour. The detrimental influence of increasing gamete age on fertilization success has previously been reported for several invertebrates, including echinoderms and polychaetes (Lytechinus variegates (Levitan, 2000); S. droebachiensis (Meidel and Yund, 2001); Asterias rubens, Arenicola marina and Nereis virens (Williams and Bentley, 2002) and Galeolaria caespitosa (Kupriyanova, 2006)), molluscs (Mytilus edulis (Levy and Couturier, 1996)) bryozoans (Celleporella hyaline (Manríquez et al., 2001)) and ascidians (Botryllus schlosseri (Johnson and Yund, 2004)). A broad range of sperm longevities has been reported amongst a variety of broadcast spawning invertebrates, the longest of which has been described for two Antarctic molluscs, where sperm aged >90 hours and ~65 hours still achieved successful fertilization of eggs in L. elliptica and N. concinna respectively (Powell et al., 2001). Although eggs of O. validus were fertilizable for up to 24 hours and sperm retained minimal fertilizing ability 6–24 hours after release, the age of gametes optimal for fertilization is much 'younger' in the polar seastar. Fertilization success was limited in O. validus to temperatures below 6°C. Maximum numbers of fertilized eggs were restricted to a narrow range of low temperatures (-1 to 4°C) and developing zygotes were predisposed to abnormal cell changes above these temperatures. O. validus spawns during the austral winter (Pearse, 1965; 1969; Pearse et al., 1991; Stanwell-Smith and Peck, 1998; Grange et al., 2007). The current study sampled individuals from South Cove, adjacent to Rothera Research Station, where winter temperatures rarely rise above -1.5ºC and fluctuate within a narrow range (Figure 4; Rothera Time Series Water Sampling Program (RaTS) (Grange et al., 2004)). The range of temperatures over which an optimum number of eggs was fertilized in the current study is comparable with the timing and occurrence of these temperatures during spawning in natural populations of the seastar. Declines in fertilization success with elevated temperature, have been documented in Antarctica before. Stanwell-Smith and Peck (1998) showed increasing numbers of non-viable eggs and embryos with increasing temperatures (above 2°C) in the Antarctic seastar O. meridionalis and sea urchin Sterechinus neumayeri from Signy Island and 80% fertilization success occurred in L. elliptica between -1.9 and +0.2ºC, but success declined rapidly between 0.7 and 5.0ºC (Powell, 2001). Antarctic invertebrates are highly stenothermal (Pörtner et al., 1998; Peck and Conway, 2000; Peck et al., 2009ab; Peck et al., 2010) and possess functional limits within a narrow range of thermal tolerance (Peck, 2002; Pörtner, 2002; Peck et al., 2004; Pörtner, 2010). The upper lethal limit recorded for O. validus and L. elliptica, at which the functional scope to undertake fundamental biological activity is diminished, is 5–6ºC (Peck, 2002; Peck et al., 2008). This upper lethal limit coincides with the temperatures at which fertilization success is severely limited in the polar seastar. Thus fertilization appears to have similar temperature limits to adult physiological capacity. Many factors contribute to fertilization success of broadcast spawning marine invertebrates. Further work is needed to understand the underlying mechanisms of fertilization and to ascertain if the differences between this polar seastar and temperate species are species specific or an Antarctic wide trend. However, with regards to recent scientific studies, which have shown the same phenomena in two molluscs and an echinoderm (this study) of needing orders of magnitude more sperm than temperate species to achieve similar rates of fertilization success and evidence for sharp temperature effects, these traits are beginning to look widespread. This study suggests that the Antarctic seastar, O. validus, has evolved a unique spectrum of spawning strategies to maximize successful sperm-egg interactions and counter the deleterious effects of sperm limitation. Similar to other Antarctic animals,
147
the eggs and sperm of O. validus are extremely temperature sensitive, where even small changes in temperature can severely diminish the numbers of eggs fertilized. Waters around the Antarctic Peninsula are experiencing one of the fastest rates of warming seen on Earth in the sea today, with temperatures having risen over 1°C in the last 50 years (Meredith and King, 2005). These rising temperatures could have dramatic repercussions on the endemic fauna, particularly in terms of fertilization success, if the 1–2°C rise in global temperature and subsequent ocean warming, predicted over the next century, is realized. Acknowledgments The authors acknowledge the professional support of the British Antarctic Survey Rothera Scuba Diving Team for collecting the animals used in this study and marine assistant L. Conway for all her efforts maintaining and caring for the animals on their transit north and whilst in the BAS aquarium facility. Diving at the station is supported by the NERC National Facility for Scientific Diving. We acknowledge a grant to L.J.G. from the Natural Environment Research Council (NER/S/S/2001/06366) and her case partner the British Antarctic Survey. References André C, Lindegarth M. Fertilization efficiency and gamete viability of a sessile, free-spawning bivalve, Cerastoderma edule. Ophelia. 1995; 43: 215–27. Babcock R, Keesing J. Fertilization biology of the abalone Haliotis laevigata: laboratory and field studies. Can J Fish Aquat Sci. 1999; 56(9): 1668–78. Baker MC, Tyler PA. Fertilization success in the commercial gastropod Haliotis tuberculata. Mar Ecol Prog Ser. 2001; 211: 205–13. Benzie JAH, Dixon P. The effects of sperm concentration, sperm:egg ratio, and gamete age on fertilization success in Crown-of-Thorns Starfish (Acanthaster planci) in the laboratory. Biol Bull. 1994; 186(2): 139–52. Bosch I, Pearse JS. Developmental types of shallow-water asteroids of McMurdo Sound, Antarctica. Mar Biol. 1990; 104: 41–6. Bosch I, Beauchamp KA, Steele ME, Pearse JS. Development, metamorphosis, and seasonal abundance of embryos and larvae of the Antarctic sea urchin Sterechinus neumayeri. Biol Bull. 1987; 173: 126–35. Clarke A. Reproduction in the cold: Thorson revisited. Invertebr Reprod Dev. 1992; 22(1–3): 175–84. Clarke A, Crame JA. The origin of the Southern Ocean marine fauna. In: Crame JA, ed. Geological Society Special No 47 Origins and Evolution of the Antarctic Biota. London: The Geological Society. 1989: 256–68. Clarke A, Murphy EJ, Meredith MP, King JC, Peck LS, Barnes DKA, Smith RC. Climate change and the marine ecosystem of the western Antarctic Peninsula. Philos. Trans. R. Soc. Lond., Ser. B: Biol. Sci. 2007; 362: 149–66. Coma R, Lasker HR. Small-scale heterogeneity of fertilization success in a broadcast spawning octocoral. J Exp Mar Biol Ecol. 1997a; 214: 107–20. Coma R, Lasker HR. Effects of spatial distribution and reproductive biology on in situ fertilization rates of a broadcast-spawning invertebrate. Biol Bull. 1997b; 193(1): 20–9.
148
Grange LJ. Reproductive success in Antarctic marine invertebrates. Southampton University. Ph.D. Southampton. 2005. Grange LJ, Tyler PA, Peck LS, Cornelius N. Long-term interannual cycles of the gametogenic ecology of the Antarctic brittle star Ophionotus victoriae. Mar Ecol Prog Ser. 2004; 278: 141–55. Grange LJ, Tyler PA, Peck LS. Multi-year observations on the gametogenic ecology of the Antarctic seastar Odontaster validus. Mar Biol. 2007; 153(1): 15–23. Grange LJ, Peck LS, Tyler PA. Reproductive ecology of the circumpolar Antarctic nemertean Parborlasia corrugatus: No evidence for inter-annual variation. J Exp Mar Biol Ecol. 2011; 404(1–2): 98–107. Griffin FJ, Pillai MC, Vines CA, Kaaria J, Hibbard-Robbins T, Yanagimachi R, Cherr GN. Effects of salinity on sperm motility, fertilization, and development in the Pacific herring, Clupea pallasi. Biol Bull. 1998; 194(1): 25–35. Grubert MA, Mundy C, Ritar A. The effects of sperm density and gamete contact time on the fertilization success of blacklip (Haliotis rubra; Leach, 1984) and greenlip (H. laevigata; Donovan, 1808) abalone. J Shellfish Res. 2005; 24(2): 407–13. Hoegh-Guldberg O, Pearse JS. Temperature, food availability, and the development of marine invertebrate larvae. Am Zool. 1995; 35: 415–25. Jantzen TM, Havenhand JN. Fertilization success and the effects of sperm chemoattractants on effective egg size in marine invertebrates. Mar Biol. 2001; 138(6): 1153–61. Johnson SL, Yund PO. Remarkable longevity of dilute sperm in a free-spawning colonial ascidian. Biol Bull. 2004; 206(3): 144–51. King JC, Harangozo SA. Climate changes in the western Antarctic Peninsula since 1945: observations and possible causes. Ann Glaciol. 1998; 27: 571–75. Kupriyanova E. Fertilization success in Galeolaria caespitosa (Polychaeta: Serpillidae): gamete characteristics, role of sperm dilution, gamete age, and contact time. Sci Mar. 2006; 70(S3): 309–17. Kupriyanova E, Havenhand JN. Variation in sperm swimming behaviour and its effect on fertilization success in the serpulid polychaete Galeolaria caespitosa. Invertebr Reprod Dev. 2002; 41(1–3): 21–6. Lasker HR, Brazeau DA, Calderon J, Coffroth MA, Coma R, Kim K. In situ rates of fertilization among broadcast spawning gorgonian corals. Biol Bull. 1996; 190(1): 45–55. Levitan DR. The ecology of fertilisation kinetics in free-spawning invertebrates. In: McEdward L, ed. Ecology of Marine Invertebrate Larvae. Florida: 1995: 123–56. Levitan DR. Effects of gamete traits on fertilization in the sea and the evolution of sexual dimorphism. Nature. 1996; 382(6587): 153–55. Levitan DR. Sperm velocity and longevity trade off each other and influence fertilization in the sea urchin Lytechinus variegatus. Proc R Soc Lond Ser B Biol Sci. 2000; 267(1443): 531–4. Levitan DR, Petersen C. Sperm limitation in the sea. Trends Ecol Evol. 1995; 10(6): 228–31. Levitan DR, Sewell MA, Chia FS. Kinetics of fertilization in the sea urchin Strongylocentrotus franciscanus: Interaction of gamete dilution, age, and contact time. Biol Bull. 1991; 181(3): 371–8.
149
Levy LA, Couturier CA. Effects of sperm longevity and gamete concentrations on fertilization success in the blue mussel. Bull Aquac Assoc Can. 1996; 96: 71–3. Litvak MK, Trippel EA. Sperm motility patterns of Atlantic cod (Gadus morhua) in relation to salinity: effects of ovarian fluid and egg presence. Can J Fish Aquat Sci. 1998; 55(8): 1871–7. Manríquez PH, Hughes RN, Bishop JDD. Age-dependent loss of fertility in water-borne sperm of the bryozoan Celleporella hyalina. Mar Ecol Prog Ser. 2001; 224: 87–92. Marshall DJ, Styan CA, Keough MJ. Intraspecific co-variation between egg and body size affects fertilisation kinetics of free-spawning marine invertebrates. Mar Ecol Prog Ser. 2000; 195: 305–9. Marshall DJ, Styan CA, Keough MJ. Sperm environment affects offspring quality in broadcast spawning marine invertebrates. Ecol Lett. 2002; 5: 173–6. McClintock JB, Pearse JS, Bosch I. Population structure and energetics of the shallow-water antarctic sea star Odontaster validus in contrasting habitats. Mar Biol. 1988; 99: 235–46. McClintock JB, Ducklow HW, Fraser W. Ecological responses to climate change on the Antarctic Peninsula. Am Sci. 2008; 96: 302–10. Meidel SK, Yund PO. Egg longevity and time-integrated fertilization in a temperate sea urchin (Strongylocentrotus droebachiensis). Biol Bull. 2001; 201(1): 84–94. Meredith MP, King JC. Rapid climate change in the ocean west of the Antarctic Peninsula during the second half of the 20th century. Geophys. Res. Lett. 2005; 32: L19604. Pearse JS. Reproductive periodicities in several contrasting populations of Odontaster validus (Koehler), a common Antarctic asteroid. In: Llano GA, ed. Biology of the Antarctic Seas II. Washington: American Geophysical Union. 1965: 39–85. Pearse JS. Slow developing demersal embryos and larvae of the Antarctic seastar Odontaster validus Mar Biol. 1969; 3: 110–6. Pearse JS. Cold-water echinoderms break "Thorson's Rule". In: Young CM, Eckelbarger, K.J., ed. Reproduction, larval biology and recruitment of the deep-sea benthos. New York: Columbia University Press. 1994: 26-43. Pearse JS, Lockhart SJ. Reproduction in cold water: paradigm changes in the 20th century and a role for cidaroid sea urchins. Deep Sea Res. (II Top. Stud. Oceanogr.). 2004; 51(14–16): 1533–49. Pearse JS, McClintock JB, Bosch I. Reproduction of Antarctic benthic marine invertebrates: Tempos, modes and timing. Am Zool. 1991; 31(1): 65–80. Peck LS. Ecophysiology of Antarctic marine ectotherms: limits to life. Polar Biol. 2002; 25(1): 31–40. Peck LS, Conway LZ. The myth of metabolic cold adaptation: oxygen consumption in stenothermal Antarctic bivalves. In: Harper EM, Taylor JD , Crame JA, ed. The Evolutionary Biology of the Bivalvia. London: Geological Society. 2000: 441–50. Peck LS, Webb KE, Bailey DM. Extreme sensitivity of biological function to temperature in Antarctic marine species. Funct Ecol. 2004; 18(5): 625–30. Peck LS, Clarke A, Chapman AL. Metabolism and development of pelagic larvae of Antarctic gastropods with mixed reproductive strategies. Mar Ecol Prog Ser. 2006; 318: 213–20.
150
Peck LS, Powell D, Tyler PA. Very slow development in two Antarctic bivalve molluscs, the infaunal clam Laternula elliptica and the scallop Adamussium colbecki. Mar Biol. 2007; 150: 1191–7. Peck LS, Webb KE, Miller A, Clark MS, Hill T. Temperature limits to activity, feeding and metabolism in the Antarctic starfish Odontaster validus. Mar Ecol Prog Ser. 2008; 358: 181–9. Peck LS, Massey A, Thorne M, Clark M. Lack of acclimation in Ophionotus victoriae: brittle stars are not fish. Polar Biol. 2009a; 32: 399–402. Peck LS, Clark MS, Morley SA, Massey A, Rossetti H. Animal temperature limits and ecological relevance: effects of size, activity and rates of change. Funct Ecol. 2009b; 23: 248–56. Peck LS, Morley S, Clark MS. Poor acclimation capacities in Antarctic marine ectotherms. Mar Biol. 2010; 157: 2051–9. Pennington JT. The ecology of fertilization of echinoid eggs: The consequences of sperm dilution, adult aggregation, and synchronous spawning. Biol Bull. 1985; 169(2): 417–30. Picken GB, Allan D. Unique spawning behaviour by the Antarctic limpet Nacella (Patinigera) concinna (Strebel, 1908). J Exp Mar Biol Ecol. 1983; 71: 283–7. Pörtner HO. Physiological basis of temperature-dependent biogeography: trade-offs in muscle design and performance in polar ectotherms. J Exp Biol. 2002; 205: 2217–30. Pörtner HO. Oxygen- and capacity-limitation of thermal tolerance: a matrix for integrating climate-related stressor effects in marine ecosystems. J Exp Biol. 2010; 213: 881–93. Pörtner HO, Hardewig I, Sartorius FJ, van Dijk P. Energetic aspects of cold adaptation: critical temperatures in metabolic, ionic and acid base regulation? In: Pörtner HO , Playle R, ed. Society for Experimental Biology Seminar Series 66. Cambridge: Cambridge University Press. 1998: 88–120. Powell DK. The reproductive ecology of Antarctic free-spawning molluscs. Southampton University. PhD. Southampton. 2001. Powell DK, Tyler PA, Peck LS. Effect of sperm concentration and sperm ageing on fertilisation success in the Antarctic soft-shelled clam Laternula elliptica and the Antarctic limpet Nacella concinna. Mar Ecol Prog Ser. 2001; 215: 191–200. Sewell MA, Young CM. Temperature limits to fertilization and early development in the tropical sea urchin Echinometra lucunter. J Exp Mar Biol Ecol. 1999; 236(2): 291–305. Stanwell-Smith D, Clarke A. Seasonality of reproduction in the cushion star Odontaster validus at Signy Island, Antarctica. Mar Biol. 1998; 131(3): 479–87. Stanwell-Smith D, Peck LS. Temperature and embryonic development in relation to spawning and field occurrence of larvae of three antarctic echinoderms. Biol Bull. 1998; 194(1): 44–52. Stanwell-Smith D, Peck LS, Clarke A, Murray AWA, Todd CD. The distribution, abundance and seasonality of pelagic marine invertebrate larvae in the maritime Antarctic. Philos. Trans. R. Soc. Lond., Ser. B: Biol. Sci. 1999; 354(1382): 471–84. Styan CA, Butler AJ. Fitting fertilisation kinetics models for free-spawning marine invertebrates. Mar Biol. 2000; 137(5): 943–51.
151
Thomas FIM. Transport and mixing of gametes in three free-spawning polychaete annelids, Phragmatopoma californica (Fewkes), Sabellaria cementarium (Moore), and Schizobranchia insignis (Bush). J Exp Mar Biol Ecol. 1994; 179(1): 11–27. Vogel H, Czihak G, Chang P, Wolf W. Fertilization kinetics of sea urchin eggs. Math Biosci. 1982; 58: 189–216. Williams ME, Bentley MG. Fertilization success in marine invertebrates: The influence of gamete age. Biol Bull. 2002; 202(1): 34–42. Yund PO. How severe is sperm limitation in natural populations of marine free-spawners? . Trends Ecol Evol. 2000; 15: 10–3. Yund PO, McCartney MA. Male reproductive success in sessile invertebrates: Competition for fertilizations. Ecology. 1994; 75(8): 2151–67.
152
CCR Validation Protocol and Associate Training Gregg R. Stanton1*, Joerg Hess1
1 Wakulla Diving Center, Inc., 2784 Coastal Highway, Route 98, Crawfordville, FL 32327, USA [email protected] *corresponding author Abstract
Failure to maintain preventative maintenance of life support technology is known to contribute to the risk of diving accidents. AAUS has clear standards and many options to address OC scuba technology. Closed-circuit rebreathers (CCR), while older than open-circuit (OC) scuba, have little similarity with traditional underwater life support technology, and as such, find little formal maintenance standards or training available nationally. Platforms that are purchased either by universities or by individuals working under university auspices are seldom monitored for maintenance schedules or validated for functionality as is the tradition for OC scuba technology. Under AAUS standards, a regulator and cylinder must be serviced at least once a year to a manufacturer's standard and by a qualified service center. More affluent university programs hire a technician, secure training and provide this required monitoring in-house. Most University programs send their participants to a dive shop for the service of their life support technology. There are precious few dive shops that provide any CCR validation service at this time. We propose a validation protocol for CCR platforms that is specific to manufacturer's specifications which, like cylinder inspections, may be applied on a specific schedule as defined by the university's Diving Control Board (DCB). This protocol may be adopted by a qualified dive program technical staff or serve as a standard for third party to whom the university may contract for service. We also propose a training program for University CCR technicians which in concert with this protocol will enable the university administration more options when managing the condition of their supervised CCR technology. Keywords: protocol, rebreather, safety, training, validation
Introduction Regulator and cylinder maintenance and repair have seen a rocky early history. The local Dive Shop that sold the technology also became the repair facility, where a person, often the owner and a diver him or herself, provided repairs based upon their own experience and help from the manufacturer. Many owners repaired their own equipment back then, getting the parts from a dive shop. Manufacturers improved their oversight of this service as warranty requirements demanded better service. Manufacturers reached a point where their product could not be repaired by the owner because access to parts was restricted to only those they certified. Today we see facilities that repair all brands of dive equipment following a generic protocol often taught by a single company (such as PSI/PCI) using generic parts or manufacturer assembled repair kits with unknown origins. Training to complete these repairs is now available on the Internet as are most repair manuals. The Interstate Commerce Commission (ICC) and later the Department of Transportation (DOT) have provided standards for cylinder safety testing since the inception of the scuba industry. In the early 80s, Bill High began a search to codify the DOT and other compressed gas agencies cylinder
In: Pollock NW, ed. Diving for Science 2011. Proceedings of the American Academy of Underwater Sciences 30th Symposium. Dauphin Island, AL: AAUS; 2011.

153
standards as they might relate to the recreational and scientific diver (High and Gresham, 2010). Based upon his findings, a simple non-destructive test protocol was developed for the early identification of critical cylinder failures, which, if unmonitored, endanger those handling and using scuba cylinders. We continue to use this industry self-policing 18 step protocol throughout our scuba community today. The DOT insists upon the 5 year hydrostatic test. The Diving Community insists upon the annual Visual Inspection. Additionally, manufacturer mandated regular service intervals for scuba regulators fulfill the same preventative malfunction role or warranty support is lost to the customer. Failure to perform preventative maintenance has been cited as a contributor to diving accidents over the years, leading the diving industry to press for improved maintenance requirements. When the American Academy of Underwater Sciences (AAUS) set forth their diving standards, they specified Diving Control Boards (DCB) enforce life support preventative maintenance policies. The AAUS, by their standard, mandates that each program assures compliance with community standards regarding cylinder, regulator, BC and other critical components of the diving life support package or diving status is lost to the participant. More affluent university programs hire a technician, secure training and provide this required maintenance in-house. Most University programs however, send their participants to an independent dive shop, not the manufacturer, for the service of their life support technology. Advantages for in-house technical programs include greater assurance of quality control and greater technical support capability for their community. Disadvantage of in-house technical program is the cost is born by the university and has less transfer of liability value should an incident occur. We have witnessed the revival of an old technology for new applications. For over a decade now, rebreathers and training for their use have become increasingly available. Rebreathers have become the technology of choice for advanced underwater excursions. The logistical footprint of a rebreather (greater deployment both in depth, gas efficiency and cost) over open-circuit (OC) scuba technology has allowed many diving scientists to gather data previously inaccessible to them (compare Suárez-Morales and Iliffe, 2005). Graduate students and faculty have used personal funds to purchase closed-circuit rebreathers (CCR) and used them under university auspices, raising concern from their respective DCB. Also, because the initial investment of the platform is high, some universities have purchased rigs from their contracts or grants, thus exposing their university to the liability of their monitoring and maintenance. We feel like the 1960s all over again! When open-circuit technology was first introduced, an aging-process of knowledge and technical development also lead to injuries and fatalities from which we learned a great deal. It seems during this past decade, we are going through this same process with regards to the application of CCR technology to our scuba community and unfortunately we see the same onset of incidents and accidents. Yes, as in the 1960s human error is often the culprit with CCR incidents. But at least the same level of oversight is needed for the safe application of CCR technology as is required for OC technology. Universities can no longer rely upon their participants to validate CCR technology. Methods Areas of Concern We propose three areas of concern specific to the use of CCR technology, beyond those that can cause incidents in open-circuit diving:
154
1) Technological design
Technological designs determine the function of a rebreather. Examples include choice of dimensions, diameter of breathing hoses, size of one-way valves, dimensions of CO2 absorption canister, etc. The design is determined by the manufacturer, and defines the performance of a new, properly built and adequately configured rebreather. After-market modifications however, can alter the manufacturer's design, and thus the rebreather's performance.
2) Appropriate (or inappropriate) use
Inappropriate use is either based on bad training, ignorance, complacency, distraction or simple neglect. Examples include the over-use of sensors, batteries or CO2 absorbent material beyond its conceptual limits, or simply to forget to fill one of the breathing gas tanks. Unfortunately, history gives plenty of real-world examples of such accidents.
3) State of Performance
The state of technology determines the actual state of the rebreather, either during use or at the time of testing. It is mostly a question of wear and tear (thus upkeep), but also includes predictable reduced performance due to manufacturing tolerances. Examples include the age and performance of sensors, valves, flow performance of injection and mushroom valves, breathing loop integrity, and the reliability of electronics (such as limitations due to corrosion).
Unfortunately, the separation of these three classifications is not always possible, and thus results in heated debate. Is the injury or death due to an omitted O-ring, a question of design or the result of limited training? Can a more advanced (foolproof) design cause even more fatalities due to increased complexity? While such discussions should and will hopefully improve the future safety record of rebreathers, they are not topic of this paper. Validation Paradigm In the introduction to this paper, the need for the validation of closed-circuit systems is compared to the established validation requirements for the much simpler open-circuit apparatus. While rebreather technology in its crudest form predates OC diving, the implementations of today's electronically controlled mixed-gas closed-circuit systems are far more complicated than their bubbly counterpart. It is the detail rather than the concept that has demonstrated the potential for catastrophic failure. These failure points in their details are not impossible to monitor, but require their identification, and a measurement criterion to judge their state of performance. In an ideal world, all potential failures are considered and investigated, in order to ensure the safe performance of the system. In the real world, however, even peer-reviewed test criteria, such as the European CE test, only consider a limited range of scenarios, under which the CCR system as a whole has to demonstrate an agreed upon performance. An example to illustrate this abstract point: A requirement for the CE test is the absorption of carbon dioxide for a predetermined amount of time while applying a high, somewhat human-like breath-pulsed gas flow pattern. All tests are completed using a machine, not human testing. Although pulsed, the volume flow pattern is maintained constant and static during a test run, and so is the simulated depth. Detailed investigations (Hess, J, in: Mount, T et al., 2004) however indicate that a more life-like, dynamic alteration of both breathing pattern, as well as depth has the potential to greatly influence the longevity of carbon dioxide absorption capacity, even negatively. However, such dynamic tests have so far not been described or applied.

155
The CE test, or any other for that matter, only monitors a very limited range of potential scenarios. As stated in the beginning of this chapter, all failure points require identification. The example demonstrates that this is not as simple as it sounds. Even more to the point, it becomes obvious that the term "performance" is poorly defined. Thus the CE-test is concerned with the technological design of a rebreather. This, however, is not the purpose of the validation protocol discussed here, and neither is the appropriateness of the use. The paradigm of the proposed validation protocol is to compare test units to a functioning and new rebreather as a performance term of reference. The validation thus provides a measure for the wear and tear, as well as upkeep of the CCR. Consequently, the validation tests are not to be destructive in nature, just like the inspection of scuba cylinders (commonly referred to as "visual inspection") does not require the destruction of the tank. Have in mind that the fuzziness of the term "performance" and "functioning," as well as the limitation in test criteria, still applies. While this may appear philosophical, the paradigm's practical realization will be based on empirical knowledge, which is to be contributed to over time. Consequently, the protocol introduced here has to be understood as a living paper, which is to be augmented or altered based on future experience. Furthermore, the validation test cannot predict future performance. Validation Contents All of the following tests are either judged by an experienced/trained technician, to be determined acceptable/not acceptable, or compared to values derived from like-new systems. Periphery
1. HP and LP gas hoses a. Visual deterioration / wear (rubbing) b. Leaks
2. Gauge and display accuracy a. Cleanliness (oxygen environment) b. Swivel performance c. Harness and webbing damaged d. Properly routed cables, harness, wiring
3. Stage (bail-out) cylinder Gas supply
1. Cylinder (PSI/PCI inspection protocol) a. Hydro, (DOT testing protocol) b. Valves, cleanliness (PSI/PCI protocol)
2. Regulators (manufacture protocol) a. Service b. Cleanliness (oxygen environment)
3. Solenoid(s) a. Rust b. Wear c. Flow performance
4. Trickle valve a. Volume flow b. Cleanliness c. Rust
156
5. Schraeder valves (ADV, BC, manual injection) a. Cleanliness (oxygen environment)
6. DSV a. Damage b. Ease of operation c. Cleanliness and lubrication
7. OPVs a. Cracking pressure b. Leaks
Electronics
1. Cell health 2. Wire health
a. Connector corrosion b. Wire damage/ sensor load
3. Battery health 4. Firmware health
a. Power consumption b. Latest version/known bugs c. All menus accessible d. Injection settings e. Injection algorithm performance in situ (P, PI, PID?)
Integrity
1. Replace O-rings in rig (full replacement as in a regulator?) 2. Negative/positive test for integrity 3. Check lid, can for damage 4. Pressure test counter lungs 5. Pressure test rig to 250 ft 6. Flow resistance 7. Cracks/leaks in components
It is to be understood that such a validation can only document the performance at the date of the test and not after the unit has left the validation station. The simple action of dismantling the gas cylinders breaches the integrity of the system as a whole. The validation does however define a point in time, at which the unit fulfilled the criteria as described, and thus either meets the expected criteria, or requires specific service, improvement or replacement. Unfortunately, not all components of every rebreather model available today can be tested using the same protocol. Reasons can range from absence of components, to their integration into a black-box system. Experience and training of the evaluator is mandatory. Associate Training The authors have gained experience in providing the technical training to permit CCR validation. Such a training course should include the following:
1. A solid understanding of the fundamentals of scuba technical repair a. Cylinder inspection (PSI protocols) and handling
157
b. Regulator repair and configuration c. BC/dry and wet suit repair d. Dive computer maintenance and basic repair e. Blending (blender certification)
2. A solid understanding of the fundamentals of CCR technology a. CCR loop integrity, work of breathing, b. Sensor/battery performance and pressure pot testing c. Oxygen clean (PSI oxygen protocol) and compatibility d. Dive computer applications to CCR
3. Specific principles used in CCR a. Mechanical b. Chemical c. Pneumatic d. Electronic
4. Manufacturer specific requirements a. Performance download software b. Component testing protocols
5. Technical Internship approach preferred (two week minimum class) a. Week one (basics)
I. Safety overview II. PSI core class III. Oxygen cleaning and compatibility IV. Regulator maintenance, configuration and repair V. BC, dry suit and wet suit maintenance and repair VI. Dive computer maintenance and repair VII. Blender course
b. Week two (CCR) I. Electrostatic protection, II. Fundamentals for soldering electronics (build a circuit) III. CCR diagnostic tools IV. Batteries, Sensors and Solenoids V. O-ring, lubricant and sensor tutorials VI. Wrist, HUD and remote displays VII. Basics CCR computer performance VIII. Canisters and absorbent performance
Results The sequence of validation of each of the elements listed in section (cross-reference) is not pre-determined per se, although follows a logical order. At conclusion of the protocol, the system has to have undergone a complete test. Unlike a forensic system examination, it is to be expected that the rebreather arrives disassembled at the time of validation. It is recommended that testing of each and all components is performed in a concise and timely manner to avoid age-related deterioration. Suggested is the following sequence for the validation protocol:
1. Case integrity (cracks in and disintegrated components) 2. HP and LP gas hoses 3. Gauge and display integrity and accuracy 4. Cylinder (PSI/PCI Inspection protocol) including all stage (bail-out) cylinders 5. Regulators (manufacture protocol)
158
6. Solenoid(s) 7. Trickle valve 8. Schraeder valves (ADV, BC, manual injection) 9. DSV 10. OPVs 11. Cell health 12. Wire health 13. battery health 14. Firmware health 15. Assembly of rig 16. Negative/Positive test for integrity 17. Component flow resistance tests 18. Pressure test counter lungs 19. Pressure test rig to 250 ft wet and dry
Conclusions The requirement for a codified evaluation protocol for closed-circuit rebreathers is highlighted in comparison to the tests performed on standard Scuba equipment. No such evaluation program exists today. The limitations of such a test are considered, in the areas of concept as well as practicability. Listed are the detailed areas for investigation, but no performance values are considered as of yet. Such values will be derived from experience as well as extensive training for the investigator. A training scheme is laid out, which is available today for the interested technician. The sequence of investigation is suggested based on identified areas of concern. It can be expected that regular adherence to the evaluation protocol eliminates the risks associated with wear and tear of the rebreather. Wear and tear is one of the three areas that have been identified as foundation for rebreather incidents. Following the proposed protocol is a viable agency option when managing the condition and liability of their supervised CCR technology. References High B, Gresham M, Inspecting Cylinders, 5th edition. PSI/PCI, 2010. Mount T, Sawatzky D, Hess J, Jorgensen J, Partidge B, Closed-Circuit Rebreather Normoxic Trimix Workbook, IANTD, 2004. Suárez-Morales E, Iliffe T. A new exumellea (crustacea: Copepoda Ridgewayiidae) from anchialine waters of the western Caribbean, with comments on regional biogeography, Bull Mar Sci. 2005; 77(3): 409–23.
159
AAUS 2011 Symposium Program – Portland, ME
October 14th 0830 – 0840 Opening Comments 0840 – 0910 Habitat structure influences survival and predator-prey interactions of early juvenile
Red King Crab, Paralithodes camtschaticus Jodi L. Pirtle1,2, Ginny L. Eckert2 1University of New Hampshire, Center for Coastal and Ocean Mapping, Durham, NH; 2School of Fisheries and Ocean Sciences, Juneau Center, University of Alaska Fairbanks, Juneau, AK
0910 – 0940 Effects of the red sea urchin on benthic invertebrate communities: a link to spatial
subsidies Ross Whippo1, Alex Lowe2, Kevin Britton-Simmons2 1University of British Columbia, Department of Zoology, Vancouver, B.C. Canada; 2Friday Harbor Laboratories, University of Washington, Friday Harbor, WA
0940 – 0955 A visual profile of the vertical mesophotic coral ecosystem of the tongue of the ocean
(TOTO), Andros, Bahamas to 100 meters Michael Lombardi 1,2,3 1American Museum of Natural History, Department of Environmental Health and Safety, New York, NY; 2University of Rhode Island, Office of Research Compliance, Kingston, RI; 3Ocean Opportunity Inc., New York, NY
0955 – 1010 In-water strategies for scientific diver based examinations of the vertical mesophotic coral ecosystem (vMCE) from 50 to 150 meters
Michael Lombardi 1,2,3, Jeff Godfrey 4 1American Museum of Natural History, Department of Environmental Health and Safety, New York, NY; 2University of Rhode Island, Office of Research Compliance, Kingston, RI; 3Ocean Opportunity Inc., New York, NY 4 University of Connecticut, Groton CT
1010 – 1040 Break 1040 − 1110 Survey of Previously Outplanted Pinto (Northern) Abalone (Haliotis kamtschatkana) in
the San Juan Island Archipelago, Washington State Jeffrey B. Hester, Jenna M. Walker, Paul A. Dinnel, Nathan T. Schwarck Shannon Point Marine Center, Western Washington University, Anacortes WA
1110 – 1140 Reproduction of red tree corals in the southeastern Alaskan fjords: implications for
conservation and population turnover Rhian G. Waller1, Robert P. Stone2, Jennifer Mondragon3, Christian E. Clark1
1Darling Marine Center, University of Maine, Walpole, ME; 2 NOAA-NMFS, Alaska Fisheries Science Center, Juneau, AK; 3 NOAA-NMFS, Alaska Regional Office, Juneau, AK
1140 – 1210 Toxic caviar: using fish embryos to monitor contaminant impacts
Lisa Kerr Lobel
Biology Department, Boston University, Boston, MA
1210 – 1340 Lunch
160
1340 – 1410 2011 American Academy of Underwater Sciences/Our World Underwater Scholarship
Society internship report: Shannon Point Marine Center Jenna M. Walker, Nathan T. Schwarck Shannon Point Marine Center, Western Washington University, Anacortes WA
1410 – 1440 Use of tethered scuba for scientific diving
Sean Sheldrake1, Rob Pedersen1, Chad Schulze1, Steven Donohue2, Alan Humphrey3 1USEPA, Region 10, Seattle, WA; 2USEPA, Region 3, Environmental Assessment and Innovation Division, Philadelphia, PA; 3USEPA, Environmental Response Team, Edison, NJ
1440 – 1510 Use of surface-supplied gas for scientific diving
Alan Humphrey1, Scott Grossman2, Jonathan McBurney2, Sean Sheldrake3 1USEPA, Environmental Response Team, Edison, NJ; 2Lockheed Martin SERAS, Edison, NJ; 3USEPA, Region 10, Seattle, WA
1510 – 1540 Break 1540 – 1610 Atmospheric diving suits – new technology may provide ADS systems that are practical
and cost-effective tools for conducting safe scientific diving, exploration and undersea research
Douglas E. Kesling J. F. White Contracting Company, Framington, MA
1610 – 1640 Belize barrier reef transect: how far do coral reef fish larvae travel in marine currents?
Oscar Puebla, Edgardo Ochoa, Owen McMillan, Eldredge Bermingham Smithsonian Tropical Research Institute, Panamá, República de Panamá
1640–1710 Spectral reflectance as a method to identify the invasive tunicate Didemnum vexillum
Thomas Leeuw, Emmanuel Boss, Wayne Slade University of Maine, Orono, ME
October 15th 0830 – 0840 Opening Comments 0840 – 0910 Milestones in underwater ichthyology: a historical perspective
Phillip S. Lobel Boston University, Boston, MA
0910 – 0940 Discoveries of new marine species of the Aleutian Islands
Stephen C. Jewett12, Roger N. Clark3
1Institute of Marine Science; 2University of Alaska Fairbanks, Fairbanks, AK; 3Insignis Biological Consulting, Eagle Mountain, UT
0940 – 1010 Population density and choice of den and food made by Octopus rubescens collected
from Admiralty Bay, Washington, in July 2011 Elizabeth R. Chase Corning School of Ocean Studies, Maine Maritime Academy, Castine ME
1010 – 1040 Break

161
1040 –1110 Scuba diving surveys used to estimate Pacific herring egg deposition in Southeastern
Alaska Kyle P. Hebert Alaska Department of Fish and Game, Juneau, AK
1110 – 1140 An assessment of growout strategies for the green sea urchin (Strongylocentrotus
droebachiensis) Pamelia E. Fraungruber, Nick P. Brown Center for Cooperative Aquaculture Research, Franklin, ME
1140 – 1210 A 'BLAGRRA' assessment of coral bleaching and disease in Bonaire
Phoebe Jekielek
University of Maine School of Marine Sciences, Aubert Hall, Orono, ME 1210 – 1340 Lunch 1340 – 1410 Freediving for science: the study of coral overgrowth by an encrusting red alga
(Ramicrusta sp.) in a shallow reef environment Caren E. Eckrich1, M. Sabine Engel2 1CIEE Research Station Bonaire, Bonaire, Dutch Caribbean; 2 STINAPA, Bonaire, Dutch Caribbean
1410 – 1440 Phylogenetic order differentiates fatty acid composition of 40 Northeast Pacific
macrophytes Aaron W. E. Galloway1, Kevin H. Britton-Simmons1, Michael T. Brett2
1Friday Harbor Laboratories, University of Washington (UW), Friday Harbor, WA; 2UW Civil and Environmental Engineering, Seattle, WA
1440 – 1510 Variability in antibacterial activity in Hawaiian corals
Deborah J. Gochfeld1,2, Katerina E. Pappas1, Sylvester Lee2, Greta S. Aeby3
1National Center for Natural Products Research; 2Environmental Toxicology Research Program, University of Mississippi, Oxford, MS; 3Hawaii Institute of Marine Biology, Kaneohe, HI
1510 – 1540 Break 1540 – 1610 Fertilization success of the circumpolar Antarctic seastar Odontaster validus (Koehler,
1906): a diver-collected study Laura J. Grange1, Paul A. Tyler1, Lloyd S. Peck2 1School of Ocean and Earth Sciences, University of Southampton, National Oceanography Centre, Southampton, UK; 2 British Antarctic Survey, Natural Environment Research Council, High Cross, Cambridge, UK
1610 – 1640 CCR validation protocol and associate training
Gregg R. Stanton, Joerg Hess Wakulla Diving Center, Inc., Crawfordville, FL
1640 – 1650 Closing Comments
Diving For Science 2011
Proceeding of the American Academy of Underwater Sciences
30th Scientific Symposium
PRO
CE
ED
ING
S
DIV
ING
FOR
SCIE
NC
E
2011 A
AU
S
Pollock

![Asia – Australia | AAUS – NL · 2020-01-06 · Updated: 30 September 2019 Asia – Australia | AAUS – NL AUSTRALIA – ASIA NORTHBOUND [transit time in days] Mon Wed Fri Sun](https://static.fdocuments.in/doc/165x107/5e63531069a6c4304935ace2/asia-a-australia-aaus-a-nl-2020-01-06-updated-30-september-2019-asia-a.jpg)