Diving and ranging behaviour of odontocetes: a ...
25
© 2001 Mammal Society, Mammal Review, 31, 81–105 Diving and ranging behaviour of odontocetes: a methodological review and critique SASCHA K. HOOKER* and ROBIN W. BAIRD Department of Biology, Dalhousie University, Halifax, Nova Scotia, B3H 4J1, Canada ABSTRACT Movements can be analysed in terms of horizontal or vertical dimensions, but cetacean move- ment is ultimately three-dimensional, and it is the integration of analyses of both horizon- tal and vertical movements that will provide the most insight about an animal’s behaviour. Current field techniques can provide simultaneous information on both diving (vertical move- ments) and ranging (horizontal movements). We discuss the considerations, techniques and analyses for diving and ranging studies, together with the advantages and disadvantages of each technique. Ranging studies using VHF or satellite-linked radio-transmitters have evolved alongside studies of diving behaviour using time–depth recorders, and problems associated with deployment and attachment techniques apply to both. The diving (and concurrent ranging behaviour) of 13 species of odontocetes has been studied using time–depth recorders or acoustic transponders with VHF-or satellite-transmitters. However, differences in sampling techniques used, and summary statistics presented, have made comparisons difficult. We review these issues and suggest parameters that should be presented in future studies of diving and ranging. In general, studies should be consistent in their presentation of the basic para- meters and statistics,and provide enough information for the reader to assess the limitations of the data. CONTENTS Introduction 82 Diving methodology 84 Techniques 84 Sampling regime 85 Data retrieval 88 Ranging studies and spatio-temporal scale 89 Deployment and attachment techniques 91 Summarizing diving and ranging between studies 92 Definition of diving behaviour 92 Analysis of ranging data 95 Data resolution 96 Sample size, sampling duration and representativeness 96 Comparative studies 97 Integrating diving and ranging 99 Conclusions 100 Mammal Rev. 2001, Volume 31, No. 1, 81–105. Printed in Great Britain. *Present address: British Antarctic Survey, High Cross, Madingley Road, Cambridge CB3 0ET, UK. E-mail: [email protected]
Transcript of Diving and ranging behaviour of odontocetes: a ...
© 2001 Mammal Society, Mammal Review, 31, 81–105
Diving and ranging behaviour of odontocetes: a methodologicalreview and critique
SASCHA K. HOOKER* and ROBIN W. BAIRDDepartment of Biology, Dalhousie University, Halifax, Nova Scotia, B3H 4J1, Canada
ABSTRACTMovements can be analysed in terms of horizontal or vertical dimensions, but cetacean move-ment is ultimately three-dimensional, and it is the integration of analyses of both horizon-tal and vertical movements that will provide the most insight about an animal’s behaviour.Current field techniques can provide simultaneous information on both diving (vertical move-ments) and ranging (horizontal movements). We discuss the considerations, techniques andanalyses for diving and ranging studies, together with the advantages and disadvantages ofeach technique. Ranging studies using VHF or satellite-linked radio-transmitters have evolvedalongside studies of diving behaviour using time–depth recorders, and problems associatedwith deployment and attachment techniques apply to both. The diving (and concurrentranging behaviour) of 13 species of odontocetes has been studied using time–depth recordersor acoustic transponders with VHF-or satellite-transmitters. However, differences in samplingtechniques used, and summary statistics presented, have made comparisons difficult. Wereview these issues and suggest parameters that should be presented in future studies of divingand ranging. In general, studies should be consistent in their presentation of the basic para-meters and statistics, and provide enough information for the reader to assess the limitationsof the data.
CONTENTSIntroduction 82Diving methodology 84
Techniques 84Sampling regime 85Data retrieval 88
Ranging studies and spatio-temporal scale 89Deployment and attachment techniques 91Summarizing diving and ranging between studies 92
Definition of diving behaviour 92Analysis of ranging data 95Data resolution 96Sample size, sampling duration and representativeness 96Comparative studies 97
Integrating diving and ranging 99Conclusions 100
Mammal Rev. 2001, Volume 31, No. 1, 81–105. Printed in Great Britain.
*Present address: British Antarctic Survey, High Cross, Madingley Road, Cambridge CB3 0ET, UK.E-mail: [email protected]
82 S. K. Hooker and R. W. Baird
© 2001 Mammal Society, Mammal Review, 31, 81–105
INTRODUCTIONInformation on three-dimensional ranging of animals can provide insights into many aspectsof their behaviour and ecology, including the mating system, diet, and daily and yearly energybudgets (Harris et al., 1990; Boyd, Lunn & Barton, 1991; de Leeuw, 1996). Cetaceans spendthe vast majority of their time beneath the water’s surface, where they are invisible toobservers, and the lack of ranging information in three dimensions has limited a compre-hensive study of their ecology.
The term ‘diving’ has been used to describe two different aspects of the behaviour of marinemammals. Some authors use ‘diving behaviour’ to describe the pattern of surfacing (i.e. divedurations without information on dive depths, e.g. Leatherwood & Ljungblad, 1979; Mateet al., 1994, 1995), while others use it to describe subsurface behaviour of marine mammals(i.e. always including information on depths as well as duration of dives, e.g. Martin & Smith,1992; Westgate et al., 1995). Throughout this review we use the term ‘diving’ to refer to thesubsurface behaviour of marine mammals involving information on the depths of dives. Inthe past, information on diving behaviour of many cetaceans could only be obtained fromincidental reports of whales taking line out when harpooned (e.g. Gray, 1882), from whalesentangled in deep sea cables (e.g. Heezen, 1957), or from navy experiments with captured andtrained animals (e.g. Ridgway, Scronce & Kanwisher, 1969; Bowers & Henderson, 1972).Knowledge of the diet of a species has also been used to infer dive depth (Fitch & Brownell,1968; Clarke, 1976; Bernard & Hohn, 1989), but while dietary information can be extremelyuseful for interpretation of studies of diving, it should not be used in lieu of them. Such tech-niques alone have provided either snapshots of behaviour or insights into the probable divedepths of some species, but cannot replace detailed description of diving behaviour.
More recently, researchers have been able to follow diving animals using ship-board echo-sounders or sonar systems, and have managed to track animals through all or part of theirdives (Lockyer, 1977; Gordon, 1987; Papastavrou, Smith & Whitehead, 1989; Mano, 1990;Kriete, 1995; Simila, 1997; Hooker & Baird, 1999). This technique is potentially problematicfor many odontocetes, because sonar systems may be audible to the study animal, possiblyaffecting the behaviour observed. In addition, this technique is only feasible for fairly largeanimals, which show relatively consistent movements. Among odontocetes, sonar-trackinghas only been successful with Sperm Whales, Physeter macrocephalus (Lockyer, 1977;Papastavrou et al., 1989), Killer Whales, Orcinus orca (Simila, 1997), and partially successfulwith Northern Bottlenose Whales, Hyperoodon ampullatus (Hooker & Baird, 1999). With asmaller species, the Bottlenose Dolphin, Tursiops truncatus, short sequences of sonar record-ings have been used to calculate swim speeds (Ridoux et al., 1997), but no vertical movementinformation could be recorded using this system.
Studies of ranging behaviour have also been subject to various limitations (Scott et al.,1990). ‘Discovery’ tags were used during the whaling era to mark individual animals. Thesewere labelled metal cylinders fired into the blubber of large whales (among odontocetes thesewere primarily Sperm Whales, and occasionally Ziphiids, Killer Whales and Pilot Whales,Globicephala spp.) which were later recovered from animals caught in a fishery. However, thepotential of these tags to ascertain movements was limited to only the deployment and re-covery points, and whales were often tagged and recovered during the same whaling seasonand on the same whaling grounds (Brown, 1975). Other remotely deployed marking tech-niques such as spaghetti tags (vinyl covered strands of wire connected to a dart tip) sufferedproblems due to a high shedding rate (Sergeant & Brodie, 1969; Scott et al., 1990). Paint-marking has also been tested on bow-riding dolphins (Watkins & Schevill, 1976) but markswere only short-term (lasting up to 24 h). Marking of captured animals (freeze-branding, fin
Odontocete diving and ranging 83
© 2001 Mammal Society, Mammal Review, 31, 81–105
notching, rototags or Petersen-type disk tags) has been fairly successful, but due to the effortinvolved in capture operations, sample sizes are usually limited, and fairly extensive effort isrequired to obtain resightings (Evans et al., 1972; Scott et al., 1990). The use of resightingdata based on photographs of natural markings bypasses the logistics involved in applyingmarks, but also requires extensive field effort, and can be biased by a number of factors,including uneven distribution of survey effort or animal distribution, and variable recaptureprobabilities of individuals (Hammond, Mizroch & Donovan, 1990). Some tracking infor-mation has previously been obtained by following cetaceans acoustically using hydrophonearrays, but this is problematic if the animals cease to vocalize at any time (Watkins & Schevill,1977). While groups of animals can sometimes be followed in this manner (e.g. Whitehead& Gordon, 1986), following one animal is often impossible for periods longer than minutes,unless it is alone or is the only animal vocalizing (Watkins & Schevill, 1977).
The development of miniature instrumentation such as radio transmitters and time–depthrecorders (TDRs) has opened up opportunities for following and recording both the divingand the ranging behaviour of aquatic animals (Evans, 1971; Kooyman, Gentry & Urquhart,1976; Frost, Lowry & Nelson, 1985; Mate, 1989; Scott et al., 1990; Anonymous, 1992b;Martin & Smith, 1992; Stone et al., 1994). However, attachment of these devices to cetaceansis not simple. Unlike land mammals, sea mammals cannot simply be collared. Pinnipeds canbe captured fairly easily while hauled out on land, and instruments can be attached with glueand later recovered when the animals return to land to breed or moult (e.g. Le Boeuf et al.,1986). Capture operations for cetaceans, on the other hand, are either fairly complicated orimpossible. Consequently, for many species instruments must be remotely deployed. The highepidermal shedding rate and furless skin of cetaceans prohibits simple attachment with glue.Initial attachment of instrumentation to cetaceans involved harness backpacks (Norris,Evans & Ray, 1974), but these were found to cause problems of chaffing and increased drag,and have largely been discontinued for all but short-term deployments. Instead, instrumentsare now usually either pinned or sutured to the dorsal fin or ridge, or attached via suction-cups (although for male Narwhals, Monodon monoceros, the tusk can be used for long-termattachment, Heide-Jorgensen & Dietz, 1995). The relative ease of long-term attachment andrecovery of instrumentation on pinnipeds has allowed studies of their diving and rangingbehaviour to advance at a much greater rate than those of cetaceans (Butler & Jones, 1997).It has been only recently that researchers have begun to use tags to investigate the diving andranging behaviour of cetaceans in detail.
Previous comparative reviews of marine mammal movement have focused primarily ondiving behaviour, investigating the link between diving and body size across species (Boyd &Croxall, 1996; Schreer, 1997; Schreer & Kovacs, 1997), modelling various aspects of divingbehaviour (Kramer, 1988; Houston & Carbone, 1992; Thompson, Hiby & Fedak, 1993;Carbone & Houston, 1996), tests of these models (Boyd, Reid & Bevan, 1995), or reviews ofthe behavioural and physiological implications of diving (Boyd, 1997; Butler & Jones, 1997;Kooyman & Ponganis, 1998). There have been few comparative reviews of horizontal rangingbehaviour among marine mammals. Reviews of other mammal species have investigated thelink between home range size, group size and body weight (e.g. primates, Clutton-Brock &Harvey, 1977; carnivores, Gittleman & Harvey, 1982). Technique-orientated reviews havedescribed the various field methods used to study horizontal ranging behaviour in cetaceans(Scott et al., 1990), or compared the analytical techniques used to study home range (Harriset al., 1990). Analysis of three-dimensional home-ranges (e.g. Koeppl et al., 1977) appear to be rare. While cetacean movement is three-dimensional, these animals are bound to thewater surface by the necessity to breathe, and as such are probably not suited to such three-
84 S. K. Hooker and R. W. Baird
© 2001 Mammal Society, Mammal Review, 31, 81–105
dimensional home range analyses. Nevertheless, studies of both diving and ranging comple-ment each other in providing an accurate picture of animal movements.
Among marine mammals, the pattern of diving behaviour appears to be somewhat relatedto taxonomic groupings (i.e. there are differences between odontocetes, mysticetes, otariidsand phocids, Schreer & Kovacs, 1997). For future comparative work on diving and rangingwithin any taxonomic group, some consistency in presentation of data between species willbe required. This paper is the forerunner to such work, and endeavours to point out thecurrent inconsistencies in data collection and presentation for studies of odontocete divingand ranging. The study of odontocete three-dimensional movement is relatively new and cantherefore benefit from such a critique. In this review, we discuss the techniques currently avail-able for studying diving and ranging of odontocetes, together with the advantages and dis-advantages of each, the results that each technique can provide, and the analytical methodsavailable.
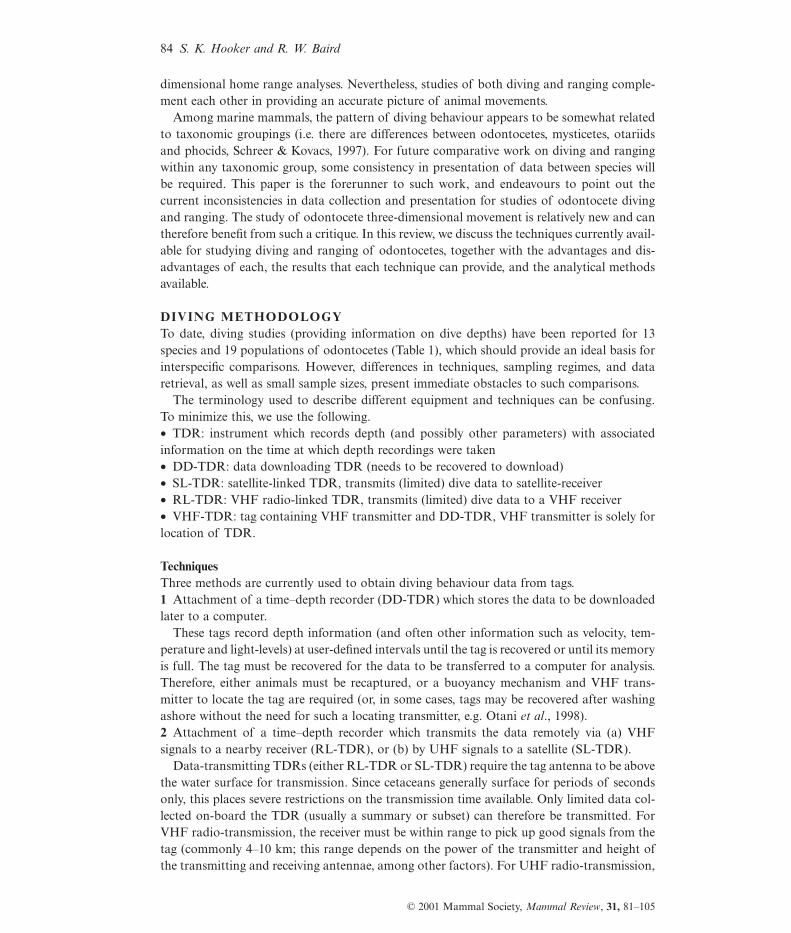
DIVING METHODOLOGYTo date, diving studies (providing information on dive depths) have been reported for 13species and 19 populations of odontocetes (Table 1), which should provide an ideal basis forinterspecific comparisons. However, differences in techniques, sampling regimes, and dataretrieval, as well as small sample sizes, present immediate obstacles to such comparisons.
The terminology used to describe different equipment and techniques can be confusing.To minimize this, we use the following.∑ TDR: instrument which records depth (and possibly other parameters) with associatedinformation on the time at which depth recordings were taken∑ DD-TDR: data downloading TDR (needs to be recovered to download)∑ SL-TDR: satellite-linked TDR, transmits (limited) dive data to satellite-receiver∑ RL-TDR: VHF radio-linked TDR, transmits (limited) dive data to a VHF receiver∑ VHF-TDR: tag containing VHF transmitter and DD-TDR, VHF transmitter is solely forlocation of TDR.
TechniquesThree methods are currently used to obtain diving behaviour data from tags.1 Attachment of a time–depth recorder (DD-TDR) which stores the data to be downloadedlater to a computer.
These tags record depth information (and often other information such as velocity, tem-perature and light-levels) at user-defined intervals until the tag is recovered or until its memoryis full. The tag must be recovered for the data to be transferred to a computer for analysis.Therefore, either animals must be recaptured, or a buoyancy mechanism and VHF trans-mitter to locate the tag are required (or, in some cases, tags may be recovered after washingashore without the need for such a locating transmitter, e.g. Otani et al., 1998).2 Attachment of a time–depth recorder which transmits the data remotely via (a) VHFsignals to a nearby receiver (RL-TDR), or (b) by UHF signals to a satellite (SL-TDR).
Data-transmitting TDRs (either RL-TDR or SL-TDR) require the tag antenna to be abovethe water surface for transmission. Since cetaceans generally surface for periods of secondsonly, this places severe restrictions on the transmission time available. Only limited data col-lected on-board the TDR (usually a summary or subset) can therefore be transmitted. ForVHF radio-transmission, the receiver must be within range to pick up good signals from thetag (commonly 4–10 km; this range depends on the power of the transmitter and height ofthe transmitting and receiving antennae, among other factors). For UHF radio-transmission,

Odontocete diving and ranging 85
© 2001 Mammal Society, Mammal Review, 31, 81–105
a receiving satellite must be passing overhead (see Mate, 1989 for details of Argos satellitepaths). Furthermore, the reliability of the uplink depends on whether environmental andatmospheric factors degrade the transmitter signal.3 Attachment of an acoustic transponder tag which can be interrogated sonically, or whichtransmits continuously while underwater.
Acoustic transponder tags may transmit data continuously at a pulse rate dependent ondepth (Goodyear, 1993), or can be interrogated at intervals (Watkins et al., 1993). Oneproblem with acoustic tags is that, generally, the signals can only be received from less than2 km away (Goodyear, 1993; Watkins et al., 1993). This distance is dependent on the fre-quency used and the environmental conditions. Lower frequencies can be received at greaterdistances, but the signals would be more likely to lie within the hearing range of the animal,potentially affecting its behaviour. This is perhaps a greater problem for odontocetes thanmysticetes, due to their presumed higher frequency hearing range.
The major differences in these techniques result from limitations of data sampling and dataretrieval. In general, two data-storage/retrieval regimes are used in time–depth recorderstudies: storage of the raw depth data, or on-board summarizing or processing of data intoa format thought to be representative of each dive. Associated with these are two respectivedata retrieval methods: recovery of the tag and the stored data, or remote retrieval of datafrom the tag while still deployed.
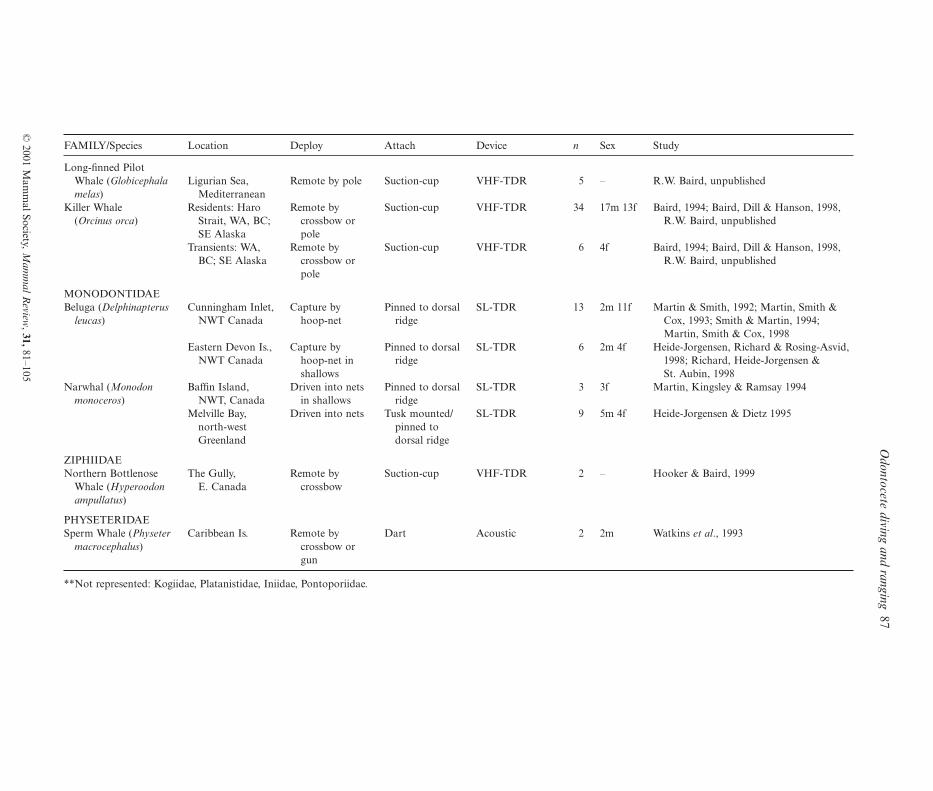
Sampling regimeThe collection of data at regular intervals over each dive can potentially provide a largeamount of data over a short time-span. This method gives the most detailed picture of diveprofiles, often providing a second-by-second account of the study animal’s depth. Thismethod also allows the user to scan the data for potential errors, which would be impossibleto detect if only certain parameters (such as maximum depth) were collected for each dive.For example, if the maximum recorded depth is at the limit of the depth sensor’s range, it isimpossible to know whether the animal went deeper than this. Viewing the dive profile wouldhelp determine whether the animal went beyond the range of the sensor, whereas if only
Fig. 1 Dive profile showing temperature-related shifts in depth readings. After ascent from a deep dive thecold temperature, which the tag was exposed to, causes an offset in the depth measurement such that thesurface is recorded as 10 m depth. This depth offset gradually returns to zero as the tag warms up over5 min. This temperature-related shift in depth measurements potentially prohibits accurate assessment ofdive durations or amount of time spent at different depths, particularly for tags where dive profiles cannotbe observed in detail. Profile from Short-finned Pilot Whale, Hokkaido, Japan, sampling rate 1 second, reso-lution 1 m; R.W. Baird & M. Amano, unpublished data. Note only the top 50 m of depth readings areshown; this TDR recorded depth to 237 m and the two long dives (~ 4 min) went to over 200 m.

86S
.K.H
ooker and R.W
.Baird
© 2001 M
amm
al Society,Mam
mal R
eview,31,81–105
Table 1. Studies of odontocete diving behaviour showing the device used, together with the deployment and attachment methods, number of individuals tagged (n) and thesex of these when known. Devices include TDR with attached VHF transmitter (VHF-TDR), satellite-linked TDR (SL-TDR), VHF radio-linked TDR (RL-TDR), andacoustic transmitter. VHF or satellite tracking carried out in conjunction is shown in parentheses
FAMILY/Species Location Deploy Attach Device n Sex Study
PHOCOENIDAEHarbour Porpoise Bay of Fundy, Incidental catch, Pinned to dorsal VHF-TDR 7 3m 4f Westgate et al., 1995
(Phocoena phocoena) Canada herring weir Westgate & Read, 1998Hokkaido, Japan Incidental catch, Pinned to dorsal TDR 2 2f Otani et al., 1998
set netSan Juan Is., WA, Directed Suction-cup VHF-TDR 1 1f M.B. Hanson, unpublished
USA gill-netDall’s Porpoise San Juan Is., Remote by pole Suction cup or VHF-TDR; 1 – Hanson & Baird, 1998
(Phocoenoides dalli) WA, USA or capture by pinned to VHF-TDR, 7 2f 5m Hanson, Baird & DeLong, 1998;hoop-net dorsal (satellite, VHF) R.W. Baird & M.B. Hanson, unpublished
DELPHINIDAEShort-beaked Common Southern Capture by Pinned to dorsal RL-TDR 3 – Evans, 1971, 1974
Dolphin (Delphinus California, purse seinedelphis) USA net
Heaviside’s Dolphin St. Helena Bay, Capture by Pinned to dorsal SL-TDR 3 2m 1f Sekiguchi et al., 1998(Cephalorhynchus South Africa hoop-net (VHF)heavisidii)
Pantropical Spotted E. Tropical Pacific Capture by purse Pinned to dorsal VHF-TDR 11 – Scott et al. 1993, 1995Dolphin (Stenella seine netattenuata) Hawaiian Is., USA Remote by pole Suction cup VHF-TDR 4 – R.W. Baird, unpublished
Atlantic Spotted Dolphin Gulf of Mexico, Rehabilitated Pinned to dorsal SL-TDR 1 m Davis et al., 1996(Stenella frontalis) USA
Short-finned PilotWhale (Globicephala Hokkaido, Japan Remote by Suction-cup VHF-TDR 2 – Amano & Baird, 1998macrorhynchus) crossbow
Odontocete diving and ranging
87
© 2001 M
amm
al Society,Mam
mal R
eview,31,81–105
FAMILY/Species Location Deploy Attach Device n Sex Study
Long-finned PilotWhale (Globicephala Ligurian Sea, Remote by pole Suction-cup VHF-TDR 5 – R.W. Baird, unpublishedmelas) Mediterranean
Killer Whale Residents: Haro Remote by Suction-cup VHF-TDR 34 17m 13f Baird, 1994; Baird, Dill & Hanson, 1998,(Orcinus orca) Strait, WA, BC; crossbow or R.W. Baird, unpublished
SE Alaska poleTransients: WA, Remote by Suction-cup VHF-TDR 6 4f Baird, 1994; Baird, Dill & Hanson, 1998,
BC; SE Alaska crossbow or R.W. Baird, unpublishedpole
MONODONTIDAEBeluga (Delphinapterus Cunningham Inlet, Capture by Pinned to dorsal SL-TDR 13 2m 11f Martin & Smith, 1992; Martin, Smith &
leucas) NWT Canada hoop-net ridge Cox, 1993; Smith & Martin, 1994;Martin, Smith & Cox, 1998
Eastern Devon Is., Capture by Pinned to dorsal SL-TDR 6 2m 4f Heide-Jorgensen, Richard & Rosing-Asvid,NWT Canada hoop-net in ridge 1998; Richard, Heide-Jorgensen &
shallows St. Aubin, 1998Narwhal (Monodon Baffin Island, Driven into nets Pinned to dorsal SL-TDR 3 3f Martin, Kingsley & Ramsay 1994
monoceros) NWT, Canada in shallows ridgeMelville Bay, Driven into nets Tusk mounted/ SL-TDR 9 5m 4f Heide-Jorgensen & Dietz 1995
north-west pinned to Greenland dorsal ridge
ZIPHIIDAENorthern Bottlenose The Gully, Remote by Suction-cup VHF-TDR 2 – Hooker & Baird, 1999
Whale (Hyperoodon E. Canada crossbowampullatus)
PHYSETERIDAESperm Whale (Physeter Caribbean Is. Remote by Dart Acoustic 2 2m Watkins et al., 1993
macrocephalus) crossbow orgun
**Not represented: Kogiidae, Platanistidae, Iniidae, Pontoporiidae.
88 S. K. Hooker and R. W. Baird
© 2001 Mammal Society, Mammal Review, 31, 81–105
maximum depth is recorded the means to check this is lost and must be inferred from thedistribution of depth values (Heide-Jorgensen & Dietz, 1995). Furthermore, it is only possi-ble to correct for temperature-related depth shifts when the entire dive profile can be viewed(e.g. see Fig. 1). Viewing such a profile, it is apparent that the surface is recorded at increaseddepth immediately after ascent from a deep dive (into much cooler waters) and then gradu-ally shifts back to 0 metres over a period of time spent in warmer surface waters.
The collection of summary statistics for each dive, in contrast, provides a much coarserresolution of data over the same time period. There is some debate as to the best method tosummarize dives such that the least amount of information is lost (Anonymous, 1992a). Cur-rently, summary statistics are often generated as frequency distributions of dives withincertain depth and duration ranges. For example, summary statistics recorded for satellite-tagged Narwhals included: maximum depth during 24 h, number of dives deeper than a pre-defined value in various depth categories in four 6-hour sampling periods, and frequency ofdives in six duration categories for each 6-hour period (from Heide-Jorgensen & Dietz, 1995).However, without prior information on a species’ diving behaviour, the definition of theseranges may not be optimal. For investigations of the diving behaviour of new species or pop-ulations it would appear to be valuable initially to sample depth values (and other parame-ters) at frequent intervals, to ascertain some of the basic dive characteristics from which todefine an optimal sampling regime for use in longer-term studies.
Histogram summary statistics are useful for asking specific behavioural questions in termsof broad categorization of results (e.g. are there differences in summary dive parametersbetween the four 6-hour time periods?). One recent study showed broad-scale similaritybetween biological data recorded using histogram summary statistics and those obtainedfrom downloading raw dive data (Burns & Castellini, 1998). However, summary statisticsprovide no information on the behaviour of the animal during these dives, or on the animal’sdescent and ascent rates, as can be gained from the dive profile. Because dive information isobtained within broad user-defined limits, researchers are unable to look at dive shapes(Schreer & Testa, 1995), or to investigate dive features such as the correlation of dive depthand duration. Furthermore, short-term changes in diving behaviour (e.g. crepuscular activ-ity) would easily be overlooked using long periods over which summary data are calculated.
Data retrievalTag recovery (and downloading of archived data) provides the potential to store only a fixedamount of data (usually governed by the finite memory capability but potentially also thelimited battery life of the tag). This finite capacity leads to a trade-off between sampling rateand total sampling time, at least for long duration attachments (Boyd, 1993). There are alsoproblems in comparisons between studies using different sampling rates, as this can affect theresolution of dive shape obtained (Schreer, 1997), and can also provide quite varying resultsfor parameters such as time spent at the surface and the number of shallow dives. A highersampling rate will always provide the most detailed data, and will be of most value for fine-scale analysis of feeding ecology, but will result in a shorter data collection time-span. Fordescription of diving behaviour, at minimum a sampling rate should be used which providesa good representation of dive shape.
Using satellite-linked data retrieval, it is only possible to send small amounts of data ateach uplink. The number of uplinks will be affected by the number of satellite passes andthe behaviour of the study animal. The number of satellite passes is latitude-dependent, withat least three satellite passes at the equator and up to 27–30 at high latitudes, from betweentwo and three satellites per day (Mate, 1989; A.R. Martin, pers. comm.). Species which surface

Odontocete diving and ranging 89
© 2001 Mammal Society, Mammal Review, 31, 81–105
for short periods, or which show very little of their back (or tagged surface) above the waterwill have fewer viable uplinks. Martin, Smith & Cox (1993) describe the problems found inusing this method to study Beluga Whales:
‘The constraint on the amount of data that can be sent and received within the ARGOSsystem proved to be a considerable limitation in this project and will inevitably be so in anystudy of marine mammals using ARGOS. A maximum of 256 bits of data can be sent in atransmission, and the probability of any such transmission coinciding with a satellite pass,and therefore potentially being received by the satellite (termed an ‘uplink’), is small. Eventhen, many uplinks are corrupted, often by the animal submerging during the propagationof the signal itself.’
The major advantages of this method are the world-wide coverage, rendering ship-tracking unnecessary, and the potential for longer sampling time (up to months), allowing agreat deal of information to be gained from one study animal. However, increased samplingtime is not equivalent to increased sample size, which is based principally on the number ofanimals sampled (Machlis, Dodd & Fentress, 1985). Increased sampling time is likely toincrease the probability of detecting the extremes within the data, such as the maximum depthor the maximum dive time (Link & Sauer, 1996), and to detect long-term periodic variation.However, mean or modal values are better indicators of routine dive depths or durations thanare maximum values, and are of more value in comparisons between different studies. Theother major advantages of the data-transmission method are that the tags do not have to berecovered in order to access the data, and simultaneous monitoring of more than one animalis far simpler than when each animal needs to be tracked acoustically or by VHF. However,the increased cost of this method may necessitate a small sample size.
In general, recovered TDRs tend to use regular and frequent sampling and are oftendeployed for only short intervals and so are not limited in terms of data storage or retrieval.As these tags are retrieved they may also be deployed multiple times on several individuals.Satellite-linked TDRs are used to collect longer-term but limited data, so researchers caneither collect summary statistics on all dives, or more complete information on a selectedsample of dives prior to the uplink (e.g. Martin & Smith, 1992; Martin et al., 1993). Thesetags are generally not recoverable and therefore cannot be reused.
The choice of technique to be used for each potential study will be based on a variety ofconsiderations, e.g. the species, habitat, available funding, boats, experience of researchers,questions to be asked, etc. Associated considerations include the ranging information thatcan be obtained simultaneously and the deployment and attachment techniques needed. Eachstudy should be assessed in its own right based on the pros and cons of different techniquesand a decision made as to the methodology to be used.
RANGING STUDIES AND SPATIO-TEMPORAL SCALEFor the purposes of this paper, a comprehensive review of ranging behaviour is not practi-cal, and a good review of the topic is available in Scott et al. (1990). Our aim instead is todiscuss the study of ranging in conjunction with the study of diving behaviour. The sameradio-tracking mechanisms used for telemetry of dive-data or for recovering dive-recordingtags are used to follow (VHF radio-telemetry) or remotely track (satellite-linked radio-telemetry) animals. We will compare these with the other commonly used field technique –photographic re-identification of individuals. The major problem involved in studies ofranging is scale (i.e. the spatial and temporal resolution at which behaviour is measured). Ananimal’s behaviour may appear very different if viewed over a scale of seconds compared to

90 S. K. Hooker and R. W. Baird
© 2001 Mammal Society, Mammal Review, 31, 81–105
one of years, or over a range of a few metres compared to one of thousands of kilometres.To understand behaviour, observation should take place at a similar scale to the behaviourbeing studied (Levin, 1992; McConnell & Fedak, 1998). Studies using photo-identificationare opportunistic in space and time. A more detailed view of a particular animal’s behaviouris obtained by focal following of one individual or group (see review of methodology inMann, 1999). Photo-identification, VHF radio-tracking and satellite-linked radio-tracking alloperate over different scales, with potential implications for interpretation or comparison ofresults (Table 2). However, not all techniques are equally applicable to all species for reasonsdiscussed below.
For cetaceans, which are relatively slow-moving and are found in small groups, photo-identification of natural or man-made marks may be used to identify individual animals, andto provide movement information when an individual is re-sighted in different locations. (Thistechnique is more difficult for offshore cetaceans both due to increased cost and logistically,e.g. for oceanic dolphins found in groups of several hundred.) As many odontocetes cannotbe followed easily between surfacings, photo-identification can provide only a series of snap-shots of animal positions. In addition, these locations are highly dependent on boat position,and unless coverage is equal in space and time, will not accurately represent the animal’sranging behaviour (Kenney & Winn, 1987; Whitehead, Christal & Tyack, 2000). While snap-shots of movements within a certain study area over a long time-scale may be obtained, thepossibility of the study animals making long-distance movements to unsampled areas cannotbe refuted (e.g. the short-term movements of Right Whales, Eubalaena glacialis, out of areasin which they are usually encountered, Mate, Nieukirk & Kraus, 1997).
For some populations, animals can be followed in real time on the basis of their marks(e.g. Killer Whales, Baird & Dill, 1995; some Bottlenose Dolphin populations, Mann &
Table 2. Measurement of ranging behaviour
Temporal scale SamplingType of tag (study duration) rate Accuracy Disadvantages Advantages
Photography Months – Highly variable ~ 100 m Biased by Inexpensive forof natural decades (hours – years) (using GPS distribution inshoremarks or LORAN) of effort in species; large
space and sample sizes;time; often simultaneousspatially behaviourallimited to data can benearshore collectedareas
VHF tags Up to Each surfacing ~ 100 m - 1 km Small sample Simultaneousmonths or every few (dependent sizes; tracking behavioural
surfacings on tracking may be data can bedistance) difficult in collected
some areas,e.g. offshore;moderate cost
Satellite tags Up to Approx 1–3 ~1–10 km + High cost; small Does not months times per (measure of sample sizes require field
day, accuracy effort post-dependent available with deployment;on satellite each satellite globalcoverage pass) coverage

Odontocete diving and ranging 91
© 2001 Mammal Society, Mammal Review, 31, 81–105
Smuts, 1998). However, for species that have unreliable markings or that make long, unpre-dictable dives, radio-telemetry provides a means for tracking animals. VHF radio-trackingcan potentially give the most detailed information about animal movement at small spatialand temporal scales, allowing researchers to track animal location during every surfacingbout, either visually or by using a ground-truthed signal strength and bearing from a knownposition. From this, it is possible to calculate rates of movement for each surfacing, or overshort time periods of hours to a few days (for methods see White & Garrott, 1990; Turchin,1998). However, this type of radio-tracking is often logistically constrained over larger scales,due to boat size or fuel limitations, or, in the case of shore-based studies, when animals swimout of receiver range.
Satellite-linked radio-tracking usually provides a less-detailed but longer-term and largerscale picture of animal movements. Coverage of Argos satellites varies depending on geo-graphical area, with more frequent satellite passes (and thus more potential locations) inhigher latitudes (Mate, 1989). This technique is more suitable for monitoring long-distancemovements, providing on average one or two reliable locations per day from dorsal ridge- ordorsal fin- attached transmitters (Dietz & Heide-Jorgensen, 1995; Davis et al., 1996). Theaccuracy of these positions can be quite variable however (Burns & Castellini, 1998). TheArgos manufacturers are attempting to introduce various improvements for their next gen-eration of equipment (Taillade, 1998). These include improving satellite coverage, increasingdata volume transmission capability, improving satellite receiver sensitivity to reduce plat-form power requirements or enhance transmission performance, and to allow control of plat-forms remotely by two-way communication with the transmitter through the satellite receiver (Taillade, 1998).
DEPLOYMENT AND ATTACHMENT TECHNIQUESThe major problem with using TDRs or radio-transmitters on odontocetes has been tagattachment. There are two major deployment techniques: capturing the study animal andattaching the tag, or remotely deploying the tag (Table 1). Associated with these are twoattachment techniques: penetrating – pinning through the dorsal fin or using a barb/hookattachment to the blubber; or non-penetrating – using suction-cup attachment to the skinsurface (Table 1).
Capturing odontocetes is only feasible for smaller to midsize species (Asper, 1975; Walker,1975). Methods of capture include hoop-netting smaller species (e.g. Dall’s Porpoise, Pho-coenoides dalli, and Heaviside’s Dolphin, Cephalorhynchus heavisidii), purse-seine netting anddrive captures for midsize species (e.g. Belugas, Delphinapterus leucas, and Narwhals). Theexpense and logistical difficulty of such operations encourage the use of penetrating tags sincethese usually have longer-term attachments than suction-cup tags. Furthermore, long-termattachment is needed to ensure that ‘normal behaviour’ can be recorded after the potentialinitial shock of their brief capture. Some odontocetes have been tagged after incidentalcapture in herring weirs or other fisheries (Westgate et al., 1995; Read & Westgate, 1997; Otaniet al., 1998). While this is feasible for coastal fisheries, the logistics of getting researchers toincidentally caught (but living) animals offshore may be problematic (Otani et al., 1998).
Tags may be remotely deployed by crossbow or long pole (Baird, 1994, 1998; Stone et al.,1994; Schneider et al., 1998) or by shotgun (Watkins et al., 1993). Pole deployment is rela-tively simple for large, slow-surfacing or bowriding species (Stone et al., 1994; Giard &Michaud, 1997; Hanson & Baird 1998), but is problematic for odontocete species which donot normally bowride, such as Killer Whales or Northern Bottlenose Whales. Crossbow-deployed tags are usually more successfully applied using penetrating barb attachments than

92 S. K. Hooker and R. W. Baird
© 2001 Mammal Society, Mammal Review, 31, 81–105
using suction-cup attachments, as the latter have a high chance of bouncing off. However,remote deployment of penetrating tags is unsuitable for many small odontocetes, due to rel-atively thin blubber layers and thus the increased chance of harming the animal (see diagramin Goodyear, 1993). For larger odontocetes, whose capture is not feasible, remotely deployedsuction-cup tags are therefore gaining popularity, despite deployment difficulties. Typicallythese remain attached for hours (a mean of 9.75 h for 41 deployments on Killer Whales; R.W.Baird unpublished data), although such attachments have held for up to 38 h on a HarbourPorpoise (M.B. Hanson unpublished data), and up to 3 days on a Fin Whale (Giard &Michaud, 1997; Baird, 1998). A suction-cup system has recently been designed to be used oncaptured small cetaceans, and involves a moulded dorsal-fin design using multiple smallsuction cups and velcro straps (Shippee et al., 1995).
The behavioural impact of different attachment and deployment methods has been notedfor many studies and generally appears to be low-level, although at times strong reactionshave been observed. Capture of free-ranging dolphins has been conducted successfully for alarge number of species and does not appear to cause excessive stress to the study animals(Table 1 and references therein). Capture and attachment of tags by pinning through thedorsal fin was found to cause slight short-term reaction limited to the first few minutes aftertag attachment, but no long-term reaction for Boto, Inia geoffrensis, over periods of yearsduring and after tag attachment (Martin & da Silva, 1998). Penetrating tags deployed byshotgun were found to cause little response from Sperm Whales (Watkins et al., 1993). Slightshort-term reactions in the first few minutes after tag attachment were also observed forsuction-cup attachment by pole or crossbow (Stone et al., 1994; Hanson & Baird, 1998;Hooker & Baird, 1999). However, Bottlenose Dolphins off New Zealand were found to showstrong reactions to suction-cup attachment (Schneider et al., 1998). The magnitude of reac-tion therefore appears to vary more for different species or populations than for differenttechniques.
SUMMARISING DIVING AND RANGING BETWEEN STUDIESTo date, TDR studies have been ‘published’ (in theses or peer-reviewed literature) on thediving behaviour of nine odontocete species (Table 1), almost all of which have also usedeither satellite or VHF radio-tracking simultaneously with collection of dive data. We discusssome of the inconsistencies in data collection, analysis, and presentation among these. Sug-gestions for future studies are made to minimize these differences, making comparisonsbetween studies both more appropriate and more feasible.
Definition of diving behaviourTwo issues affect how diving behaviour is analysed and interpreted by researchers. First is thequestion of function. The nature of cetacean adaptation is that almost all behaviour (includ-ing travelling behaviour) is subsurface. ‘Diving’ behaviour therefore often encompasses severalbehavioural functions, yet a single ‘mean dive depth’ is often presented. Second is the ques-tion of the minimum depth necessary to constitute a dive. Diving and subsurface behaviourare generally thought to be synonymous, but depth sensor resolution, zero-offset drift andwave action all influence the level of uncertainty about whether an animal was in fact at thesurface or underwater.
Many authors define a dive as deeper than twice the value of error or resolution of thedepth sensor (this appears to have originated from the design of analysis programs by theTDR manufacturer Wildlife Computers, Redmond, WA, rather than from any rigorous

Odontocete diving and ranging 93
© 2001 Mammal Society, Mammal Review, 31, 81–105
definition). TDRs were first developed for use on seals which often stay continuously at thesurface of the water between dives, and for which such a cut-off dependent on sensor-resolution is useful. In contrast, the deep, foraging dives of cetaceans are usually followed bya surfacing bout of shallower dives, the purpose of which may be to travel or replenish oxygenstores. Inclusion of these surfacing bouts can potentially cloud the analysis of ‘diving’ be-haviour, since several dive classes, including a large number of short shallow dives, are com-bined in analyses. The use of this 2¥ resolution value provides a cut-off point for what isunderwater and what is at the surface, but usually includes a large proportion of these short,shallow dives and is therefore likely to affect interpretation of results substantially. To infer‘foraging’ behaviour from all dives greater than this value (which are likely to incorporateboth foraging and respiratory bout dives) is therefore a misrepresentation. Furthermore,it is apparent that use of tags with different depth resolution would give very different esti-mates of measures such as ‘time spent at surface’ or ‘mean depth of dives’ using this crite-rion. Likewise, the size of the study species will probably influence the depth of surfacingbouts. A Harbour Porpoise may remain above 2 m during surfacing bouts, whereas a KillerWhale or Bottlenose Whale is likely to submerge deeper than this solely due to its body size.
There has been a good deal of interest in how to classify dives (Anonymous, 1992a; Schreer& Testa, 1995; Schreer, 1997; Lesage, Hammill & Kovacs, 1999). While these studies haveusually been concerned with delineating more categories than deep vs. surface, the issue isstill to find an objective criterion for differentiating between dive types, in this case shallow,short dives during respiration bouts, and longer, deeper dives which serve other functions(e.g. foraging).
Various methods have been used in both cetacean and pinniped studies to discriminatesurface from deeper dives objectively. An example dataset of 24 h of diving data (recordedat 1 s intervals to 1 m resolution using a Wildlife Computers Mk 6 TDR, Table 3) from asouthern ‘resident’ Killer Whale in Haro Strait, WA (Baird, Dill & Hanson, 1998) is used todemonstrate differences between these methods (Fig. 2):1 Elimination of any dives less than twice the depth sensor resolution from analysis and pre-sentation (Fig. 2a). This criterion often appears to be used by default. Satellite-linked TDRs,for which post-hoc investigation of dives is limited, require the use of a simple definition ofthis type (e.g. Heide-Jorgensen & Dietz, 1995; Davis et al., 1996). This cut-off has also beenused for TDR studies (although the presence of a variety of dive types may be noted, e.g.Baird, 1994; Westgate et al., 1995).2 Subjective grouping of ‘diving’ behaviour according to certain dive characteristics (Hindell,Slip & Burton, 1991; Martin & Smith, 1992; Le Boeuf et al. 1993; van Dam & Diez, 1996).A result of this is that criteria such as ‘foraging dives are considered to be those of more than1 min at maximum depth’ are applied (e.g. Hindell et al., 1991) (Fig. 2b). Martin & Smith(1992) use a similar subjective definition and present information for flat-bottomed divesdeeper than 150 m. However, this weights dive statistics toward deeper and longer dives,whereas studies including ‘respiration’ dives are weighted toward shallow, short dives.3 Use of multivariate statistical analyses such as cluster analysis or artificial neural networksto identify groupings within the data (Schreer & Testa, 1995; Schreer, 1997) (Fig. 2c). Con-siderable care must be taken as to how many groupings there are within the data, however.4 Investigating the multimodal nature of a three-dimensional plot of depth and duration canbe used to discriminate shallow, short-duration dives from longer, deeper dives (Boveng,Walker & Bengtson, 1996) (Fig. 2d). Independent histograms of either duration or depth canbe used, but tend not to represent the data as clearly.

94 S. K. Hooker and R. W. Baird
© 2001 Mammal Society, Mammal Review, 31, 81–105
Fig. 2. Examples of different methods used to categorize dives, illustrated using data from a single southern‘resident’ Killer Whale, Haro Strait, WA (R.W. Baird, unpublished data): (a) using twice the data resolution;(b) using a subjective definition such as more than 1 min at maximum depth; (c) using cluster analysis; (d)using a three-dimensional frequency histogram of depth and duration; (e) using a log-survivorship plot ofdive durations; (f) using the bimodality of a plot of cumulative time spent in dives of different durations.Values given in boxes represent mean dive depth of ‘long, deep’ dives, and give the number of such divesrecorded with each technique. For (a), (b) and (c), open circles show dives of the definition given.
Table 3. Time at surface showing differences in definition of surface, based on same data as used in Fig. 2,from a single southern resident Killer Whale, British Columbia (R.W. Baird, unpublished data)
Depth interval Percentage time at each depth layer Cumulative percentage time between surface(m) and layer
0–2 12.8 12.82–4 30.8 43.64–6 9.4 53.06–8 7.1 60.08–10 12.7 72.7

Odontocete diving and ranging 95
© 2001 Mammal Society, Mammal Review, 31, 81–105
5 Use of a log-survivorship plot of dive or surface durations (Fagen & Young, 1978; Gentry& Kooyman, 1986; Beavers & Cassano, 1996) (Fig. 2e). This technique is used for identify-ing bouts of behaviour, and can therefore be used to separate bouts of respiration dives fromdeeper dives. A break or inflection in the slope of the log survivor function represents achange in probability of the event, signalling the presence of bouts within the data.6 Investigating the cumulative time spent in dives of different durations and using thebimodality of this to distinguish between long and short dives (Hooker & Baird, 1999)(Fig. 2f). This technique weights the duration of dives according to the time involved in suchdives, presenting a perspective on the investment rather than solely the number of dives induration categories.
These techniques range from completely subjective (No. 2) to almost completely objective(Nos 5 and 6) means to identify dive type. Different techniques will be optimal for differentdatasets. Among published odontocete diving studies there are very few explanations or def-initions for the delineation of foraging dives. For the dataset shown (Fig. 2), it is interestingto note that four of the six methods give relatively similar mean dive depths for ‘long’ dives(and relatively similar sample sizes), while the other two methods produce widely divergentresults. Data based on twice the resolution of the depth sensor (Fig. 2a) do not appear to besufficient when sensor resolution is relatively precise, as many short, shallow dives are lumpedinto the ‘long, deep’ dive category. At the other extreme, standardized cluster analysis intotwo clusters appears to group many intermediate depth and duration dives with surfacingdives, and so includes only very long and very deep dives in the ‘long, deep’ dive category(see Schreer (1997) for more detailed discussion of statistical clustering techniques). The log-survivorship function shows quite clearly that there appear to be at least three behaviouraltypes (Fig. 2e), the first of which, the 45-second cut-off, is likely to define surfacing bouts.The other techniques were relatively straightforward and give quite similar results. It is clearfrom these example data using different definitions that interpretation of results should beconducted with great care.
Our primary recommendation is the explicit categorization of dives by statistical or graphical investigation of dive type. At minimum, odontocete dives should be separated into those involved in respiratory bouts and those more likely to represent foraging behaviour.
Analysis of ranging dataThere does not appear to be any standard method for display of ranging data. The three-dimensional nature of cetacean ranging data (point locations, x and y, at sequential time, t)renders visual analysis difficult since this is usually done in two dimensions. Data are there-fore generally either displayed statically in time, in terms of a spatial representation of (x, y)-locations (e.g. Read & Westgate, 1997; Mate et al., 1995), or features of movement, such asdistance travelled between fixes, are plotted against time (White & Garrott, 1990). Mam-malian movement has generally been analysed spatially by investigating plots of movementsand describing home range, following the definition given by Burt (1943) as ‘that area tra-versed by the individual in its normal activities of food gathering, mating, and caring for theyoung’. An alternative method of displaying movement data has been proposed by Turchin(1998) following the theoretical framework of random movement (diffusion) models. Plotsof net displacement (or net displacement squared) for increasing time intervals can be usedto illustrate both rate of movement and range displacement (see Turchin, 1998 for details).This method of analysis may apply well to odontocete movement and appears likely to provevaluable in future.

96 S. K. Hooker and R. W. Baird
© 2001 Mammal Society, Mammal Review, 31, 81–105
Data resolutionSampling rate for detailed TDR records varies both within and between studies. Westgateet al. (1995) use a sampling rate of 1–3 s for research on Harbour Porpoises. While this variation in rate does not have a large effect on the recorded depths and durations ofdeep dives, it may cause some error in accuracy. Otani et al. (1998) use a sampling rate of 10 s for the same species and it can be seen that the distribution of dive durations they recorded is quite different to that observed by Westgate et al. Many of the short surface respiration dives appear not to have been recorded using a 10-s sampling rate (seeOtani et al., 1998). Schreer (1997) showed that sampling rate can also affect dive shapes.The sampling interval should be small enough both to allow resolution of the dive profileand to identify all surface intervals accurately (see Boyd, 1993 for more detailed discus-sion of this problem). A 10-s sampling rate for Narwhals, which have a mean dive durationof 5 min (Heide-Jorgensen & Dietz, 1995), is likely to produce far more accurate results than a 10-s sampling rate for Harbour Porpoise, which have a mean dive duration of 1 min(Otani et al., 1998).
The resolution of ranging data also affects the resultant data. Animal movements are con-tinuous, but records of ranging data are typically collected by noting position at regular orirregular time intervals. A good review of the effects of oversampling and undersampling ofmovements is available in Turchin (1998). Oversampling is rarely a problem in marinemammal studies, due to the logistics of gaining position data on animals over short timeintervals. The straight-line distance assumed between locations is an underestimate of thecontinuous distance the animal travelled, and the longer the intervals between recorded loca-tions, the more biased the estimates of distances travelled and the speeds will be. Dietz &Heide-Jorgensen (1995) noted such an effect for calculations of the speed at which Narwhalstravelled and stated that speeds were underestimated if calculated over intervals longer than0.5–5 h. The most detailed (but usually somewhat impractical) measurement of movement isto record the velocity of the animal and view this in conjunction with the dive profile. Overlonger time intervals, position fixes can provide longer-term ranging information; forexample, core-areas and long-term ranges.
The primary inconsistency in presentation of ranging statistics by different authors is to present a single rate of travel (calculated based on the sampling interval – perminute/hour/day). However, if animals are not travelling in straight lines, the sampling inter-val will have a large effect on this estimated rate of travel. In some studies estimates of rateof travel are presented for two different time intervals (e.g. rate of movement per hour andrate of movement per day) where one is merely a multiple of the other (e.g. Davis et al., 1996).For the majority of temperate latitude satellite-tracking data, locations tend to be sampledapproximately once or twice a day and so the rate of travel is better presented as average dailymovement than as hourly movement. One solution to this is to present these data graphically,showing how displacement varies with time interval (see methodology suggested above). Inthis manner displacement over various time intervals, ranging from the sampling interval upto the study duration, can be displayed.
The sampling interval from which diving and ranging data are calculated should be explic-itly stated in all studies. Sampling interval is crucial both for interpretation of results and forcomparison between studies.
Sample size, sampling duration and representativenessA further obstacle in the comparison presented here, which applies to both the diving andranging studies, is the difference caused by sample size and ‘quality’ of study animals. Some

Odontocete diving and ranging 97
© 2001 Mammal Society, Mammal Review, 31, 81–105
of the studies noted in Table 1 include a number of individuals sampled for periods up tomonths (Heide-Jorgensen & Dietz, 1995; Westgate et al., 1995; Read & Westgate, 1997), whileothers are of a single rehabilitated study animal (Davis et al., 1996) or animals sampled foronly short periods, i.e. 1–30 h (Baird et al., 1998). Whether studies of rehabilitated animalsare representative of the behaviour of free-ranging wild animals may be questionable.However, it is possible that attachment of any tag, regardless of the condition of the studyanimal, may cause behavioural modification (e.g. Schneider et al., 1998).
Sample size and duration of sampling affect the maximum values of data parameters, e.g.the maximum dive depth ever recorded, or maximum speed ever recorded, more so than theyaffect mean or modal dive depth or duration (see Link & Sauer, 1996). While these parame-ters can provide an indication of the potential of a species, their strong dependence on samplesize prohibits fine-scale interspecific and interpopulation comparisons of diving behaviourfor datasets of widely differing sample sizes.
Differences in diving or ranging summary measures with increasing duration and samplesize have not been investigated. The number of samples required to obtain a reliable meanforaging depth could be investigated visually by plotting the mean depth for increasingnumber of dives or number of individuals (bootstrap or jackknife analyses; Krebs, 1989). Asimilar method is used to test the number of fixes required to obtain an accurate measure ofhome range size (Voigt & Tinline, 1980).
Comparative studiesIn addition to the general problems described above, resulting from differing methodologiesand definitions, there are differences between studies in the data presented. We will summa-rize the parameters commonly used and note some of the differences in calculation and pre-sentation of these values by different authors.
The terminology used for dive parameters can be confusing; we have used the definitions:
dive depth = maximum depth of each dive mean dive depth = mean (maximum depth of dives)modal dive depth = mode (maximum depth of dives)modal depth = depth at which most time is spent, based on a cumulative distribution of depth
readings bottom time = time at > 85% maximum depth of dive daily maximum depth = maximum depth recorded each day
When comparing diving behaviour between species using detailed TDR records, the divedepth and duration are probably the most common and important summary parameters foreach dive. Mean or modal values of dive depth and duration are most useful for comparisonsbetween individuals or species (Machlis et al., 1985). An indication of the rate at which divesare performed (the number of dives per day) is a crucial gauge of the energetic expenditureinvolved. Further to these, the percentage of time spent at the surface (or the percentage oftime spent at depth) provides an indication of the time constraints of foraging. Presentationof modal depth is important to assess an animal’s use of the water column. Categorizationof dive shapes and presentation of the proportion of time spent at the ‘bottom’ of dives(bottom time) may provide information on the function of dives (Asaga et al., 1994). Ascentand descent rates together with other dive parameters (duration, max. depth, and bottomtime) can provide some information on the energetics of diving. Whether or not the studyanimal is diving to the sea floor is an important consideration for interpopulation differences,since this may be highly dependent on location rather than on a species’ capability. Finally,

98 S. K. Hooker and R. W. Baird
© 2001 Mammal Society, Mammal Review, 31, 81–105
an overall summary for all individuals of the mean values of these parameters may be ofmost use in making broad comparisons between species and populations.
While this list sounds quite straightforward, the presentation of these data by differentauthors varies. Many authors provide detailed statistics for each animal studied (e.g. West-gate et al., 1995), while others fail to provide many of the basic dive statistics suggested above.Others present description of dive types rather than quantification of these types (e.g. Baird,1994), or provide ranges of dive parameters with no other information to describe the dis-tribution of these parameters (e.g. Martin & Smith, 1992).
Data-downloading TDR studies usually provide mean dive depth recorded, while satellite-linked TDR studies usually provide a histogram of dive-depths. Studies using satellite-deriveddata often also present the mean of daily maximum depths, and it is worth noting that thisis not the same as the daily mean of dive depths and cannot be used as a substitute. Most,but not all, studies provide results for dive rate (the number of dives observed per day), butdo not separate this into the rate of dives of different classes, such as the rate of long, deepdiving. Ideally, the dive rate should be provided for the classes of dives (depending on thedive definition used) for which basic statistics such as mean depth or duration are given.
Few studies calculate the proportion of bottom time for each dive and present a mean ofthis. Instead many authors provide mean bottom time and mean dive duration (essentiallydiscarding information about dive shape, e.g. Westgate et al., 1995). However, calculatingmean proportion of the dive at the bottom from these is not accurate:
(mean bottom time)/(mean dive duration) π mean (bottom time/dive duration)
For example, if one dive has a total dive duration of 10 min with bottom time of 8 min,i.e. BT/DT = 0.8, while a second dive has total dive duration of 5 min with bottom time of1 min i.e. BT/DT = 0.2, then
(1)
whereas
(2)
The mean proportion of a dive spent at the bottom, averaged over all dives (2) is more indica-tive of the ‘average’ dive shape and is less susceptible to bias from dives of longer duration.This is therefore the more reliable calculation method of the two.
In assessing the proportion of time animals spend at the surface, a wide range of depths(1 m, 2 m, 5 m, 8 m, 10 m) have been used to define ‘surface’. This value, calculated from afrequency histogram of the number of depth values recorded within certain ranges, is oftendetermined for use in sighting surveys and so may be defined by reference to the clarity ofthe surface waters. Alternatively, authors may use ‘2¥ instrument resolution’. In order to sim-plify comparisons with other studies, an indication of time spent at different depth rangeswould be helpful (e.g. Table 4). This allows readers to assess the differences in sightability atthe surface depending on various factors such as water clarity or surface chop. Further infor-mation regarding time spent at depth is also important for consideration of depth-specificthreats (such as impact of certain fishing methods, acoustic impacts, etc.). Westgate et al.(1995) used an alternative definition of surface time as the sum of the interdive times betweendives of deeper than 2 m, divided by the total deployment time. Using the program DiveAnalysis (Wildlife Computers, Redmond, WA), this definition is identical to a calculation oftime spent as < 2 m depth since the maximum depth of the surface (2 m) is used to definethe start and end points for dives.
mean bottom time dive duration mean . , .( ) = ( ) =0 8 0 2 0 5.
mean bottom time mean dive duration( ) ( ) = =4 5 7 5 0 6. . .

Odontocete diving and ranging 99
© 2001 Mammal Society, Mammal Review, 31, 81–105
Finally, for comparisons between populations it is important to consider whether diving isbottom-limited. Results from Narwhal and Beluga studies (Martin & Smith, 1992; Martinet al., 1993; Martin, Kingsley & Ramsey, 1994; Heide-Jorgensen & Dietz, 1995; Heide-Jorgensen, Richard & Rosing-Asvid, 1998; A.R. Martin, pers. comm.) suggest that divingbehaviour (especially maximum dive depths) depends to a large extent on the bottom depthof the area in which the studies are conducted. This is likely to be the case for many divestudies (e.g. Baird, 1994), thus reporting bottom depth is important for comparisons betweenstudies.
INTEGRATING DIVING AND RANGINGThe two major resources that marine mammals need for survival are air and food. Animalswill therefore optimize their diving behaviour in order to gain the maximum food under limitations of oxygen requirements (Kramer, 1988). However, the spatial ranging behaviourof animals will be unaffected by oxygen requirements since oxygen is uniformly distributedat the surface, so we would expect ranging behaviour instead to be governed by maximiza-tion of prey. Such correlation between movements and the profitability of foraging has been
Table 4. Suggestions regarding data analysis and presentation for future studies (see text for additionalexplanation).
Sampling rate Differences in sampling rate will cause differences in results. Higher sampling ratewill provide more precise results.
Sample size Individual and seasonal variation may be a problem.Sample size is based on the number of individuals sampled, although the
duration of the sampling period will affect the ability to detect temporal trendsin the data.
Presentation of ranging Displacements should be investigated over time intervals varying from the data with varying sampling interval to the study duration, to investigate both short- and long-time interval term displacement rates and patterns.
Definition of dive There is a need to differentiate objectively between ‘respiration’ dives and other dives.
Possibilities include:– definition of foraging (although subjective)– cluster analysis– three dimensional frequency histogram: depth and duration– log-survivorship plot of dive duration– bimodal plot of cumulative time spent in dives of different durations
Presentation of dive Dive statistics (independently for dive-types):statistics dive duration (mean, mode, max), dive depth (mean, max.), proportion of time
at bottom, ascent rate, descent rate, modal depth.– summary results should be presented for each animal– numerical data description (mean, SD)
Dive rate (no. dives/day) Present dive rate (for each dive-type).Proportion of dive at Presentation of mean proportion of dive at bottom will provide information on
bottom general dive shape.Percentage of time at Present the proportion of time at various depths (dependent on sampling
surface resolution), so that time (%) in top 2, 4, 6, 8, 10 m (for example) of the watercan be assessed.
Are dives depth limited? Dives to the sea floor are likely to differ in dive depths between sites. Sea floordepths in the study area should therefore be presented, and dives to the seafloor noted.
Representativeness Representativeness of deployments should be discussed. Taggability of animalsmay vary such that data are not obtained from a random sample of thepopulation, especially for studies of rehabilitated animals.

100 S. K. Hooker and R. W. Baird
© 2001 Mammal Society, Mammal Review, 31, 81–105
shown for Sperm Whales (Whitehead, 1996; Jaquet & Whitehead, 1999). The integration ofstudies of diving and ranging can therefore provide information concerning the dimensions,concentration and patchiness of prey aggregations, and will allow a more detailed descrip-tion of the foraging ecology of an animal than studies of either diving or ranging alone.
CONCLUSIONSDue to the logistical difficulty of deploying time–depth recorders or radio-tags and the oftenlimited attachment durations, studies of the diving and ranging patterns of odontocetes havenot progressed at the same rate as those of pinnipeds. Perhaps because so few publications haveresulted from this work, and by so few investigators, there is currently little accord in the waydata are collected or summary measures reported. We have tried to identify some of the impor-tant considerations to keep in mind when designing and undertaking studies of the diving andranging behaviour of odontocetes, particularly those using time–depth recorders. We havemade a number of recommendations on which techniques and sampling regimes are appro-priate, depending on the questions being asked and the logistical constraints of the systembeing studied. Our suggestions for standardization between studies in terms of data analysisand presentation are summarized in Table 4. In particular, an objective discrimination betweendive types of odontocetes is needed in order that dive statistics are not biased by the frequentshallow dives made during a surfacing bout and, if more than one dive-type for deep dives isidentified, statistics should be presented for each dive-type. Studies using different samplingrates and sensor resolutions will not be strictly comparable and the effect of these will need tobe considered in comparisons between studies. Ranging data should be analysed over varioustime intervals ranging from the sampling interval up to the scale of the study duration toprovide information on both short and long-term rates of movement. Certain results are par-ticularly important for management considerations. These include the modal depth and theproportion of each dive spent at the bottom, which are important in assessment of depth-spe-cific (e.g. acoustic) impacts, and the percentage of time at the surface, which is required to estab-lish correction factors for population census analyses. We hope that the adoption of some orall of these recommendations in future studies will aid the comparison of data collected bydifferent investigators, on different species and populations of odontocetes.
ACKNOWLEDGMENTSDuring the writing of this review, S.K.H. received funding support from a Canadian Com-monwealth Scholarship; R.W.B. received funding support from a Natural Sciences and Engi-neering Research Council (NSERC) postdoctoral fellowship and from the Free-Willy KeikoFoundation. Many thanks to W.D. Bowen, J. Christal, M.B. Hanson, R. Hill, S.J. Iverson, B.Lagerquist, J.F. Schreer, M.D. Scott and H. Whitehead for helpful discussion and commentson various drafts of this manuscript. This paper also benefitted from reviews by A.R. Martinand V. Papastavrou. Example data used in this report came from a study of Short-finnedPilot Whales conducted by M. Amano and R.W. Baird off Hokkaido, Japan, and a study of‘resident’ Killer Whales conducted by R.W. Baird, off the San Juan Islands, WA, under permitno. 926 issued by the National Marine Fisheries Service.
REFERENCESAmano, M. & Baird, R.W. (1998) Research on the behavior and social structure of the ‘Tappanaga’, the north-
ern form of the short-finned pilot whale. Abstract presented at the International Forum of Dolphins andWhales, Muroran, Japan, 5–6 July 1998, p. 20, Volcano Bay Marine Animals Watching Association,Muroran, Japan
Odontocete diving and ranging 101
© 2001 Mammal Society, Mammal Review, 31, 81–105
Anonymous (1992a) Analysis of data from time–depth recorders and satellite-linked time–depth recorders. Reportof a technical workshop, 20–22 September 1992. Institute of Marine Science, University of Alaska Fair-banks, Fairbanks, AK.
Anonymous (1992b) Workshop on tagging and tracking technology. Report of a scientific workshop held 11–13February 1992 at the Airlie House, Warrenton, Virginia. Northeast Fisheries Science Center Reference Document 93–08.
Asaga, T., Naito, Y., Le Boeuf, B.J. & Sakurai, H. (1994) Functional analysis of dive types of female north-ern elephant seals. In: Elephant Seals: Population Ecology, Behavior and Physiology (Ed. by B.J. Le Boeuf& R.M. Laws), p. 414. University of California Press, Berkeley.
Asper, E.D. (1975) Techniques of live capture of smaller Cetacea. Journal of the Fisheries Research Board ofCanada, 32, 1191–1196.
Baird, R.W. (1994) Foraging behaviour and ecology of transient killer whales (Orcinus orca). PhD Thesis, SimonFraser University, Burnaby, British Columbia.
Baird, R. (1998) Studying diving behavior of whales and dolphins using suction-cup attached tags. Whale-watcher, 31, 3–7.
Baird, R.W. & Dill, L.M. (1995) Occurrence and behaviour of transient killer whales: seasonal and pod-specific variability, foraging behaviour, and prey handling. Canadian Journal of Zoology, 73, 1300–1311.
Baird, R.W., Dill, L.M. & Hanson, M.B. (1998) Diving Behaviour of Killer Whales. Abstracts of the WorldMarine Mammal Science Conference, Monaco, p. 9. Society for Marine Mammalogy, Lawrence, Kansas.
Beavers, S.C. & Cassano, E.R. (1996) Movements and dive behaviour of a male sea turtle (Lepidochelys oli-vacea) in the Eastern Tropical Pacific. Journal of Herpetology, 30, 97–104.
Bernard, H.J. & Hohn, A.A. (1989) Differences in feeding habits between pregnant and lactating spotted dol-phins (Stenella attenuata). Journal of Mammalogy, 70, 211–215.
Boveng, P.L., Walker, B.G. & Bengtson, J.L. (1996) Variability in Antarctic fur seal dive data: implications forTDR studies. Marine Mammal Science, 12, 543–554.
Bowers, C.A. & Henderson, R.S. (1972) Project deep ops: deep object recovery with pilot and killer whales. NavalUndersea Technical Publication 306.
Boyd, I.L. (1993) Selecting sampling frequency for measuring diving behavior. Marine Mammal Science, 9,424–430.
Boyd, I.L. (1997) The behavioural and physiological ecology of diving. Trends in Ecology and Evolution, 12,213–217.
Boyd, I.L. & Croxall, J.P. (1996) Dive durations in pinnipeds and seabirds. Canadian Journal of Zoology, 74,1696–1705.
Boyd, I.L., Lunn, N.J. & Barton, T. (1991) Time budgets and foraging characteristics of lactating Antarcticfur seals. Journal of Animal Ecology, 60, 577–592.
Boyd, I.L., Reid, K. & Bevan, R.M. (1995) Swimming speed and allocation of time during the dive cycle inAntarctic fur seals. Animal Behaviour, 50, 769–784.
Brown, S.G. (1975) Marking of small cetaceans using ‘Discovery’ type whale marks. Journal of the FisheriesResearch Board of Canada, 32, 1237–1240.
Burns, J.M. & Castellini, M.A. (1998) Dive data from satellite tags and time-depth recorders: a comparison inWeddell seal pups. Marine Mammal Science, 14, 750–764.
Burt, W.H. (1943) Territoriality and home range concepts as applied to mammals. Journal of Mammalogy, 24,346–352.
Butler, P.J. & Jones, D.R. (1997) Physiology of diving of birds and mammals. Physiological Reviews, 77,837–899.
Carbone, C. & Houston, A.I. (1996) The optimal allocation of time over the dive cycle: an approach basedon aerobic respiration. Animal Behaviour, 51, 1247–1255.
Clarke, M.R. (1976) Observation on sperm whale diving. Journal of the Marine Biological Association of theU K, 56, 809–810.
Clutton-Brock, T.H. & Harvey, P.H. (1977) Primate ecology and social organisation. Journal of Zoology,London, 183, 1–39.
van Dam, R.P. & Diez, C.E. (1996) Diving behaviour of immature hawksbills (Eretmochelys imbricata) in aCaribbean cliff-wall habitat. Marine Biology, 127, 171–178.
Davis, R.W., Worthy, G.A.J., Wursig, B., Lynn, S.K. & Townsend, F.I. (1996) Diving behavior and at-sea move-ments of an Atlantic spotted dolphin in the Gulf of Mexico. Marine Mammal Science, 12, 569–581.
Dietz, R. & Heide-Jorgensen, M.P. (1995) Movements and swimming speed of narwhals, Monodon monoceros,equipped with satellite transmitters in Melville Bay, northwest Greenland. Canadian Journal of Zoology,73, 2106–2119.
Evans, W.E. (1971) Orientation behavior of delphinids: radio telemetric studies. Annals of the New YorkAcademy of Sciences, 188, 142–160.
102 S. K. Hooker and R. W. Baird
© 2001 Mammal Society, Mammal Review, 31, 81–105
Evans, W.E. (1974) Radio-telemetric studies of two species of small odontocete cetaceans. In: The WhaleProblem (Ed. by W.E Schevill), pp. 385–394. Harvard University Press, Cambridge, Mass.
Evans, W.E., Hall, J.D., Irvine, A.B. & Leatherwood, J.S. (1972) Methods for tagging small cetaceans. FisheryBulletin, 70, 61–65.
Fagen, R.M. & Young, D.Y. (1978) Temporal patterns of behaviors: durations, intervals, latencies andsequences. In: Quantitative Ethology (Ed. by P.W. Colgan), pp. 79–114. John Wiley & Sons, New York.
Fitch, J.E. & Brownell, R.L. Jr (1968) Fish otoliths in cetacean stomachs and their importance in interpretingfeeding habits. Journal of the Fisheries Research Board of Canada, 25, 2561–2574.
Frost, K.J., Lowry, L.F. & Nelson, R.R. (1985) Radiotagging studies of belukha whales (Delphinapterus leucas)in Bristol Bay, Alaska. Marine Mammal Science, 1, 191–202.
Gentry, R.L. & Kooyman, G.L. (1986) Methods of dive analysis. In: Fur Seals: Maternal Strategies on Land andat Sea (Ed. by R.L Gentry & G.L. Kooyman), pp. 28–40. Princeton University Press, Princeton, New Jersey.
Giard, J. & Michaud, R. (1997) L’observation des rorquals sous surveillance par la telemetrie VHF. Le Natu-raliste Canadien, 121, 25–29.
Gittleman, J.L. & Harvey, P.H. (1982) Carnivore home-range size, metabolic needs and ecology. BehaviouralEcology Sociobiology, 10, 57–63.
Goodyear, J.D. (1993) A sonic/radio tag for monitoring dive depths and underwater movements of whales.Journal of Wildlife Management, 57, 503–513.
Gordon, J.C.D. (1987) Behaviour and ecology of sperm whales off Sri Lanka. PhD Thesis, University of Cam-bridge, Cambridge.
Gray, D. (1882) Notes on the characteristics and habits of the bottlenose whale (Hyperoodon rostratus). Pro-ceedings of the Zoological Society of London, 1882, 726–731.
Hammond, P.S., Mizroch, S.A. & Donovan, G.P. (1990) Individual recognition of cetaceans: use of photo-identification and other techniques to estimate population parameters. The International Whaling Commis-sion, Cambridge.
Hanson, M.B. & Baird, R.W. (1998) Dall’s porpoise reactions to tagging attempts using a remotely-deployedsuction-cup tag. Marine Technology Society Journal, 32, 18–23.
Hanson, M.B., Baird, R.W. & DeLong, R.L. (1998) Short-term movements and dive behavior of tagged Dall’sporpoise in Haro Strait, Washington. Abstracts of The World Marine Mammal Science Conference,Monaco, pp. 59–60, Society for Marine Mammalogy, Lawrence, Kansas.
Harris, S., Cresswell, W.J., Forde, P.G., Trewhella, W.J., Woollard, T. & Wray, S. (1990) Home-range analysisusing radio-tracking data – a review of problems and techniques particularly as applied to the study ofmammals. Mammal Review, 20, 97–123.
Heezen, B.C. (1957) Whales entangled in deep sea cables. Deep-Sea Research, 4, 105–115.Heide-Jorgensen, M.P. & Dietz, R. (1995) Some characteristics of narwhal, Monodon monoceros, diving
behaviour in Baffin Bay. Canadian Journal of Zoology, 73, 2120–2132.Heide-Jorgensen, M.P., Richard, P.R. & Rosing-Asvid, A. (1998) Dive patterns of belugas (Delphinapterus
leucas) in waters near eastern Devon Island. Arctic, 51, 17–26.Hindell, M.A., Slip, D.J. & Burton, H.R. (1991) The diving behaviour of adult male and female southern ele-
phant seals, Mirounga leonina (Pinnipedia: Phocidae). Australian Journal of Zoology, 39, 595–619.Hooker, S.K. & Baird, R.W. (1999) Deep-diving behaviour of the northern bottlenose whale, Hyperoodon
ampullatus (Cetacea: Ziphiidae). Proceedings of the Royal Society of London B, 266, 671–676.Houston, A. & Carbone, C. (1992) The optimal allocation of time during the diving cycle. Behavioral Ecology,
3, 255–265.Jaquet, N. & Whitehead, H. (1999) Movements, distribution and feeding success of sperm whales in the Pacific
Ocean, over scales of days and tens of kilometers. Aquatic Mammals, 25, 1–13.Kenney, R.D. & Winn, H.E. (1987) Cetacean biomass densities near submarine canyons compared to adja-
cent shelf/slope areas. Continental Shelf Research, 7, 107–114.Koeppl, J.W., Slade, N.A., Harris, K.S. & Hoffmann, R.S. (1977) A three-dimensional home range model.
Journal of Mammalogy, 58, 213–220.Kooyman, G.L., Gentry, R.L. & Urquhart, D.L. (1976) Northern fur seal diving behavior: a new approach to
its study. Science, 193, 411–412.Kooyman, G.L. & Ponganis, P.J. (1998) The physiological basis of diving to depth: birds and mammals. Annual
Review of Physiology, 60, 19–32.Kramer, D.L. (1988) The behavioral ecology of air breathing by aquatic animals. Canadian Journal of Zoology,
66, 89–94.Krebs, C.J. (1989) Ecological Methodology. Harper & Row, New York.Kriete, B. (1995) Bioenergetics in the killer whale, Orcinus orca. PhD Dissertation, University of British Colum-
bia, Canada.

Odontocete diving and ranging 103
© 2001 Mammal Society, Mammal Review, 31, 81–105
Leatherwood, S. & Ljungblad, D.K. (1979) Nighttime swimming and diving behavior of a radio-tagged spotteddolphin, Stenella attenuata. Cetology, 34, 1–6.
Le Boeuf, B.J., Costa, D.P., Huntley, A.C., Kooyman, G.L. & Davis, R.W. (1986) Pattern and depth of divesin northern elephant seals, Mirounga angustirostris. Journal of Zoology, London, 208, 1–7.
Le Boeuf, B.J., Crocker, D.E., Blackwell, S.B., Morris, P.A. & Thorson, P.H. (1993) Sex differences in divingand foraging behaviour of northern elephant seals. Symposia of the Zoological Society of London, 66,149–178.
de Leeuw, J.J. (1996) Diving costs as a component of daily energy budgets of aquatic birds and mammals:generalising the inclusion of dive-recovery costs demonstrated in tufted ducks. Canadian Journal ofZoology, 74, 2131–2142.
Lesage, V., Hammill, M.O. & Kovacs, K.M. (1999) Functional classification of harbor seal (Phoca vitulina)dives using depth profiles, swimming velocity, and an index of foraging success. Canadian Journal ofZoology, 77, 74–87.
Levin, S.A. (1992) The problem of pattern and scale in ecology. Ecology, 73, 1943–1967.Link, W.A. & Sauer, J.R. (1996) Extremes in ecology: avoiding the misleading effects of sampling variation in
summary analyses. Ecology, 77, 1633–1640.Lockyer, C. (1977) Observations on diving behaviour of the sperm whale, Physeter catodon. In: A Voyage of
Discovery (Ed. by M. Angel), pp. 591–609. Pergamon, Oxford.Machlis, L., Dodd, P.W.D. & Fentress, J.C. (1985) The pooling fallacy: problems arising when individuals con-
tribute more than one observation to the data set. Zietschrift Fur Tierpsychologie, 68, 201–214.Mann, J. (1999) Behavioral sampling methods for cetaceans: a review and critique. Marine Mammal Science,
15, 102–122.Mann, J. & Smuts, B.B. (1998) Natal attraction: allomaternal care and mother–infant separations in wild bot-
tlenose dolphins. Animal Behaviour, 55, 1097–1113.Mano, S. (1990) Analysis of diving behaviour of sperm whale. Nippon Suisan Gakkaishi, 56, 179–187.Martin, A.R. & da Silva, V.M.F. (1998) Tracking aquatic vertebrates in dense tropical forest using VHF teleme-
try. Marine Technology Society Journ, 32, 82–88.Martin, A.R., Kingsley, M.C.S. & Ramsey, M.A. (1994) Diving behaviour of narwhals (Monodon monoceros)
on their summer grounds. Canadian Journal of Zoology, 72, 118–125.Martin, A.R. & Smith, T.G. (1992) Deep diving in wild, free-ranging beluga whales, Delphinapterus leucas.
Canadian Journal of Fisheries and Aquatic Sciences, 49, 462–466.Martin, A.R., Smith, T.G. & Cox, O.P. (1993) Studying the behaviour and movements of high Arctic belugas
with satellite telemetry. Symposia of the Zoological Society of London, 66, 195–210.Martin, A.R., Smith, T.G. & Cox, O.P. (1998) Dive form and function in belugas Delphinapterus leucas of the
eastern Canadian High Arctic. Polar Biology, 20, 218–228.Mate, B. (1989) Satellite-monitored radio-tracking as a method for studying cetacean movements and behav-
iour. Reports of the International Whaling Commission, 39, 389–391.Mate, B.R., Nieukirk, S.L. & Kraus, S.D. (1997) Satellite-monitored movements of the northern right whale.
Journal of Wildlife Management, 61, 1393–1405.Mate, B.R., Rossbach, K.A., Nieukirk, S.L., Wells, R.S., Irvine, A.B., Scott, M.D. & Read, A.J. (1995) Satel-
lite-monitored movements and dive behavior of a bottlenose dolphin (Tursiops truncatus) in Tampa Bay,Florida. Marine Mammal Science, 11, 452–463.
Mate, B.R., Stafford, K.M., Nowojchik, R. & Dunn, J.L. (1994) Movements and dive behavior of a satellite-monitored Atlantic white-sided dolphin (Lagenorhynchus acutus) in the Gulf of Maine. Marine MammalScience, 10, 116–121.
McConnell, B.J. & Fedak, M. (1998) Artefacts, Aliases and Argos: Gaps Between Perception and Reality.Abstracts of the World Marine Mammal Science Conference, Monaco, p. 90, Society for Marine Mam-malogy, Lawrence, Kansas.
Norris, K.S., Evans, W.E. & Ray, G.C. (1974) New tagging and tracking methods for the study of marinemammal biology and migration. In: The Whale Problem (Ed. by W.E. Schevill), pp. 395–408. Harvard Uni-versity Press, Cambridge, Mass.
Otani, S., Naito, Y., Kawamura, A., Kawasaki, M., Nishiwaki, S. & Kato, A. (1998) Diving behavior and per-formance of harbor porpoises, Phocoena phocoena, in Funka Bay, Hokkaido, Japan. Marine MammalScience, 14, 209–220.
Papastavrou, V., Smith, S.C. & Whitehead, H. (1989) Diving behaviour of the sperm whale, Physeter macro-cephalus, off the Galapagos Islands. Canadian Journal of Zoology, 67, 839–846.
Read, A.J. & Westgate, A.J. (1997) Monitoring the movements of harbour porpoises (Phocoena phocoena) withsatellite telemetry. Marine Biology, 130, 315–322.
Richard, P.R., Heide-Jorgensen, M.P. & St. Aubin, D. (1998) Fall movements of belugas (Delphinapterus leucas)

104 S. K. Hooker and R. W. Baird
© 2001 Mammal Society, Mammal Review, 31, 81–105
with satellite-linked transmitters in Lancaster Sound, Jones Sound, and Northern Baffin Bay. Arctic, 51,5–16.
Ridgway, S.H., Scronce, B.L. & Kanwisher, J. (1969) Respiration and deep diving in the bottlenose porpoise.Science, 166, 1651–1654.
Ridoux, V., Guinet, C., Liret, C., Creton, P., Steenstrup, R. & Beauplet, G. (1997) A video sonar as a new toolto study marine mammals in the wild: measurements of dolphin swimming speed. Marine Mammal Science,13, 196–206.
Schneider, K., Baird, R.W., Dawson, S., Visser, I. & Childerhouse, S. (1998) Reactions of bottlenose dolphinsto tagging attempts using a remotely-deployed suction-cup tag. Marine Mammal Science, 14, 316–324.
Schreer, J.F. (1997) Diving behavior of air-breathing vertebrates: allometry, classification, and interspecific com-parisons. PhD Dissertation, University of Waterloo, Waterloo.
Schreer, J.F. & Kovacs, K.M. (1997) Allometry of diving capacity in air-breathing vertebrates. Canadian Journalof Zoology, 75, 339–358.
Schreer, J.F. & Testa, J.W. (1995) Statistical classification of diving behavior. Marine Mammal Science, 11,85–93.
Scott, M.D., Wells, R.S., Irvine, A.B. & Mate, B.R. (1990) Tagging and marking studies on small cetaceans.In: The Bottlenose Dolphin (Ed. by S. Leatherwood & R.R. Reeves), pp. 489–512. Academic Press, Inc.,San Diego.
Scott, M.D., Chivers, S.J., Olson, R.J. & Lindsay, R.J. (1993) Radiotracking of spotted dolphins associated withtuna in the eastern tropical Pacific. Abstracts of the 10th Biennial Conference on the Biology of MarineMammals, Galveston, TX, p. 97. Society for Marine Mammalogy, Lawrence, Kansas.
Scott, M., Olson, R., Chivers, S. & Holland, K. (1995) Tracking of spotted dolphins and yellowfin tuna in theeastern tropical Pacific. Abstracts of the 11th Biennial Conference on the Biology of Marine Mammals,Orlando, FL, p. 102. Society for Marine Mammalogy, Lawrence, Kansas.
Sekiguchi, K., Meyer, M.A., Best, P.B., Davis, R. & David, J.H.M. (1998) Satellite-monitored movements anddiving patterns of Heaviside’s dolphin (Cephalorhynchus heavisidii) off St. Helena Bay, South Africa.Abstracts of The World Marine Mammal Science Conference, Monaco, pp. 122–123. Society for MarineMammalogy, Lawrence, Kansas.
Sergeant, D.E. & Brodie, P.F. (1969) Tagging white whales in the Canadian Arctic. Journal of the FisheriesResearch Board of Canada, 25, 2201–2205.
Shippee, S.F., Townsend, F.I., Deckert, F.L. & Gates, D.L. (1995) A Tracking and Monitoring System for FreeSwimming Dolphins Using a Trac-Pac Dorsal Fin Tag. Abstract published in Proceedings of the 23rd AnnualIMATA conference, November 1995, Las Vegas, NV. International Marine Animal Trainers Association,Chicago.
Simila, T. (1997) Sonar observations of killer whales (Orcinus orca) feeding on herring schools. AquaticMammals, 23, 119–126.
Smith, T.G. & Martin, A.R. (1994) Distribution and movements of belugas, Delphinapterus leucas, in the Cana-dian High Arctic. Canadian Journal of Fisheries and Aquatic Sciences, 51, 1653–1663.
Stone, G., Goodyear, J., Hutt, A. & Yoshinaga, A. (1994) A new non-invasive tagging method for studyingwild dolphins. Marine Technology Society Journal, 28, 11–16.
Taillade, M. (1998) Argos Second and Third Generations, Argos System Evolution for Animal Tracking. Abstractsof the World Marine Mammal Science Conference, Monaco, p. 132. Society for Marine Mammalogy,Lawrence, Kansas.
Thompson, D., Hiby, A.R. & Fedak, M.A. (1993) How fast should I swim? Behavioural implications of divingphysiology. Symposia of the Zoological Society of London, 66, 349–368.
Turchin, P. (1998) Quantitative analysis of movement. Measuring and Modeling Population Redistribution inAnimals and Plants Sinauer Associates, Inc., Sunderland, MA.
Voigt, D.R. & Tinline, R.R. (1980) Strategies for analysing radio-tracking data. In: A Handbook on Bioteleme-try and Radio Tracking (Ed. by C.J.J. Amlaner & D.W. Macdonald), pp. 387–404. Pergamon Press, Oxford.
Walker, W.A. (1975) Review of the live-capture fishery for smaller cetaceans taken in southern California watersfor public display, 1966–73. Journal of the Fisheries Research Board of Canada, 32, 1197–1211.
Watkins, W.A., Daher, M.A., Fristrup, K.M., Howald, T.J., Notarbartolo-d. & i-Sciara, G. (1993) Spermwhales tagged with transponders and tracked underwater by sonar. Marine Mammal Science, 9, 55–67.
Watkins, W.A. & Schevill, W.E. (1976) Underwater paint marking of porpoises. Fishery Bulletin, 74, 687–689.Watkins, W.A. & Schevill, W.E. (1977) Spatial distribution of Physeter catodon (sperm whales) underwater.
Deep-Sea Research, 24, 693–699.Westgate, A.J. & Read, A.J. (1998) Applications of new technology to the conservation of porpoises. Marine
Technology Society Journal, 32, 70–81.Westgate, A.J., Read, A.J., Berggren, P., Koopman, H.N. & Gaskin, D.E. (1995) Diving behaviour of harbour
porpoises, Phocoena phocoena. Canadian Journal of Fisheries and Aquatic Sciences, 52, 1064–1073.

Odontocete diving and ranging 105
© 2001 Mammal Society, Mammal Review, 31, 81–105
White, G.C. & Garrott, R.A. (1990) Analysis of Wildlife Radio-Tracking Data. Academic Press, San Diego,CA.
Whitehead, H. (1996) Variation in the feeding success of sperm whales: temporal scale, spatial scale and rela-tionship to migrations. Journal of Animal Ecology, 65, 429–438.
Whitehead, H., Christal, J. & Tyack, P. (2000) Studying cetacean social structure in space and time: innova-tive techniques. In: Cetacean Societies: Field Studies of Dolphins and Whales (Ed. by J. Mann, R.C. Connor,P. Tyack & H. Whitehead), pp. 65–87 University of Chicago Press, Chicago.
Whitehead, H. & Gordon, J. (1986) Methods of obtaining data for assessing and modelling sperm whale pop-ulations which do not depend on catches. Reports of the International Whaling Commission (Special Issue8), 149–165.
Submitted 6 January 1999; returned for revision 2 August 1999; revision accepted 29 September 1999