DIVIDEND PAYOUT AND EXECUTIVE COMPENSATION: THEORY AND EVIDENCE€¦ · · 2004-08-261 DIVIDEND...
26
DIVIDEND PAYOUT AND EXECUTIVE COMPENSATION: THEORY AND EVIDENCE Nalinaksha Bhattacharyya * Amin Mawani Cameron Morrill August 2004 ABSTRACT Recent studies have documented an association between managerial compensation and firm dividend policy. We develop a model based on Bhattacharyya (2003) whereby managerial quality and effort are unobservable to shareholders, and therefore first-best contracts are not possible. In the second-best world, compensation contracts motivate high quality managers to retain and invest firm earnings, while low quality managers are motivated to distribute income to shareholders. These hypotheses arising from our model are tested on data for US firms’ dividend payouts over the period 1992-2001 using tobit regression analyses. Our results show that, ceteris paribus, executive compensation is positively (negatively) associated with earnings retention (dividend payouts). These results hold when the definition of payout is modified to incorporate both common dividends and common share repurchases. Our results indicate that corporate dividend policy is perhaps best understood by considering the payout ratio (dividends divided by earnings available to common shareholders), rather than the level of, or changes in, cash dividends alone. JEL classification: G35, J38 Keywords: Dividend payout; Executive compensation; Earnings retention * Nalinaksha Bhattacharrya is from the University of Manitoba. Mailing address: I. H. Asper School of Business, University of Manitoba, Winnipeg MB R3T 5V4 CANADA. Tel: (204) 474-6774. Fax: (204) 474-7545. E-mail: [email protected]. Amin Mawani is from York University and Cameron Morrill is from the University of Manitoba. The authors acknowledge financial assistance provided by the Centre for Accounting Research (CARE) at the University of Manitoba. Ron Giammarino, Heather Wier, Gady Jacoby, Kai Li, Vikas Mehrotra, Usha Mittoo, Ranjini Sivakumar and Steven Zheng provided helpful comments on earlier versions of the paper.
Transcript of DIVIDEND PAYOUT AND EXECUTIVE COMPENSATION: THEORY AND EVIDENCE€¦ · · 2004-08-261 DIVIDEND...

DIVIDEND PAYOUT AND EXECUTIVE COMPENSATION: THEORY AND EVIDENCE
Nalinaksha Bhattacharyya∗
Amin Mawani
Cameron Morrill
August 2004
ABSTRACT Recent studies have documented an association between managerial compensation and firm dividend policy. We develop a model based on Bhattacharyya (2003) whereby managerial quality and effort are unobservable to shareholders, and therefore first-best contracts are not possible. In the second-best world, compensation contracts motivate high quality managers to retain and invest firm earnings, while low quality managers are motivated to distribute income to shareholders. These hypotheses arising from our model are tested on data for US firms’ dividend payouts over the period 1992-2001 using tobit regression analyses. Our results show that, ceteris paribus, executive compensation is positively (negatively) associated with earnings retention (dividend payouts). These results hold when the definition of payout is modified to incorporate both common dividends and common share repurchases. Our results indicate that corporate dividend policy is perhaps best understood by considering the payout ratio (dividends divided by earnings available to common shareholders), rather than the level of, or changes in, cash dividends alone. JEL classification: G35, J38 Keywords: Dividend payout; Executive compensation; Earnings retention ∗ Nalinaksha Bhattacharrya is from the University of Manitoba. Mailing address: I. H. Asper School o f Business, University of Manitoba, Winnipeg MB R3T 5V4 CANADA. Tel: (204) 474-6774. Fax: (204) 474-7545. E-mail: [email protected]. Amin Mawani is from York University and Cameron Morrill is from the University of Manitoba. The authors acknowledge financial assistance provided by the Centre for Accounting Research (CARE) at the University of Manitoba. Ron Giammarino, Heather Wier, Gady Jacoby, Kai Li, Vikas Mehrotra, Usha Mittoo, Ranjini Sivakumar and Steven Zheng provided helpful comments on earlier versions of the paper.

1
DIVIDEND PAYOUT AND EXECUTIVE COMPENSATION: THEORY AND EVIDENCE
ABSTRACT
Recent studies have documented an association between managerial compensation and firm
dividend policy. We develop a model based on Bhattacharyya (2003) whereby managerial quality
and effort are unobservable to shareholders, and therefore first-best contracts are not possible. In
the second-best world, compensation contracts motivate high quality managers to retain and
invest firm earnings, while low quality managers are motivated to distribute income to
shareholders. These hypotheses arising from our model are tested on data for US firms’ dividend
payouts over the period 1992-2001 using tobit regression analyses. Our results show that, ceteris
paribus, executive compensation is positively (negatively) associated with earnings retention
(dividend payouts). These results hold when the definition of payout is modified to incorporate
both common dividends and common share repurchases. Our results indicate that corporate
dividend policy is perhaps best understood by considering the payout ratio (dividends divided by
earnings available to common shareholders), rather than the level of, or changes in, cash
dividends alone.
2
DIVIDEND PAYOUT AND EXECUTIVE COMPENSATION: THEORY AND EVIDENCE
Why do corporations pay dividends? Despite decades of study, we have yet to understand
completely the factors that influence dividend policy and the manner in which these factors
interact. A quarter of a century ago, Black (1976) wrote that “. . . the harder we look at the
dividend picture, the more it seems like a puzzle, with pieces that just don’t fit together” (p. 5).
The situation is not much different today, where Brealy and Myers (2003) list dividends as one of
the ten important unsolved problems in finance.
To date, finance researchers have advanced three principal paradigms to explain the
dividend puzzle. Miller and Modigliani (1961) offered the tax clientele theory, according to
which investors select portfolios with reference to their marginal tax rates. A change in
dividends changes the tax position of shareholders and induces trading as investors rebalance
their portfolios. Signalling theory (e. g., Bhattacharya, 1979; Miller and Rock, 1985; John and
Williams, 1985) suggests that managers use dividends to signal their private information to
investors. Finally, the free cash flow hypothesis (Easterbrook, 1984; Jensen, 1986) posits that an
increase in dividends is favorably received by investors because it means that managers will have
less cash to invest in negative net present value projects.
Bhattacharyya (2003) develops a model of dividend payout that is based in the principal-
agent paradigm. In his model, uninformed principals (shareholders) set up a menu of contracts to
screen agents according to productivity type (which is known to the agent). Higher quality
agents are those who have access to more positive net present value (NPV) projects. These
agents are induced to invest the firm’s cash rather than pay out dividends. Lower quality agents
do not have the same access to positive NPV projects, and the compensation contract they choose
induces them to pay out higher dividends. i In equilibrium, high quality managers receive higher
3
compensation than do low quality managers and pay out lower dividends. Empirically,
Bhattacharyya’s model predicts that dividend payout and managerial compensation are
negatively correlated. We perform tobit analyses of managerial compensation and dividend
payout in US firms over the period 1992-2001. Our results are consistent with the predictions of
Bhattacharyya’s model.
The rest of the paper is organized as follows. The next section presents Bhattacharyya’s
dividend payout model. Then, the sample data and results of empirical analyses are presented.
Finally, conclusions are drawn.
I. A Theory of Dividend Payout and Managerial Compensation
A. Background
The main contribution of this study is to develop a formal model that explicitly links
managerial compensation to the proportion of earnings paid out as dividends, and document
empirical support for hypotheses arising from the theoretical model. While other studies have
documented evidence in related areas, they differ in the variables selected for empirical
constructs as well as in their underlying models.
For example, Fenn and Liang (2001) find that the ratio of cash dividends paid to the
market value of the common stock (or the dividend yield from the investor’s perspective) is
negatively linked to managerial stock incentives as proxied by the level of stocks and stock
options held by executives as a percentage of shares outstanding. In contrast, our dependent
variable is the ratio of dividends paid to earnings to reflect the choice variables faced by
managers – i.e., what proportion of earnings should be paid out as dividends? We argue that the
dividend yield (as measured by the ratio of cash dividends paid to the market value of the
common stock) is more influenced by the vagaries of the stock market, and is less within the

4
control of managers. In addition, unlike Fenn and Liang (2001), our explanatory compensation
variable is a flow variable consisting of total compensation, bonus and options granted in the
same period in which the decision to payout a certain percentage of earnings as dividends is
made. In contrast, Fenn and Liang (2001) use the level of cumulative stocks and stock options
(as a percentage of total shares outstanding) as their explanatory compensation variable.
Lambert et al (1989) find a negative link between changes in the cash level of dividends
paid and the adoption of employee stock option plans for executives. In contrast, we examine
dividend payouts instead of levels or changes in levels, and test for an association with the annual
flow of compensation from options, salary and bonus instead of an association with a one-time
(stock option plan) adoption event. White (1996) finds that dividend payments are linked to
management’s stock ownership. Unlike this study, she does not examine dividend payouts, nor
does she examine the link with stock options or with total compensation.
Past research has documented a strong link between the compensation of many CEOs
and firm outputs, measured as firm earnings (e. g., Healy, 1985) and/or firm stock price and
returns (e. g., Jensen and Murphy, 1990; see Pavlik et al, 1993, for a review of this literature).
Some researchers have also noted a positive link between dividend payment and executive
compensation, implying that dividend payments are, under certain circumstances at least,
rewarded by shareholders. Lewellen et al (1987) find a significant positive association between
executive cash compensation (salary and bonus) and dividend payout, a result that is consistent
with Healy’s (1985) observation that the upper limit on amounts transferred to the executive
bonus pool is often a function of cash dividends paid on common stock. Other mechanisms that
directly link executive compensation to dividend payments include dividend units (Larcker,
1983) and restricted stock (Crystal, 1989).

5
Bhattacharyya (2003) models the dividend-compensation link identified in the empirical
studies cited above and tries to understand the impact of such linkages on the dividend policies
followed by firms. He starts by positing a linear compensation contractii where managerial
compensation is a linear function of dividends and output. If the compensation contract is a
linear function of dividends alone, then the rational action for the manager is to have a 100%
dividend payout ratio. Having both dividends and outputs as components of linear compensation
contracts ensures that managers try to achieve a proper balance between dividend payments and
investments.
When managers are of different productive qualities (which are privately known to
managers but are essentially unobservable attributes), then compensation contracts will be set up
in a way such that managers with the lowest level of acceptable quality will be paid the
reservation wage ex ante and managers of higher quality will be paid information rent ex ante.
The amount of rent will depend, inter alia, on the probability distribution of managerial quality.
In equilibrium the optimal compensation contract will be such that, ceteris paribus (and in
particular for a given amount of available cash), managers of highest quality get the most rent and
invest the most in productive projects, while managers with least acceptable productive quality
will get just the reservation wage and will invest the least.
It therefore follows that compensation contracts will ensure that, for a given amount of
available cash, managers with higher quality will get more information rents (i.e., more
compensation), will invest more in productive enterprises and, as a result, will have less money to
distribute as dividends. Similarly, managers with lowest acceptable quality will get the
participation wage and invest less, thereby leaving more cash for distribution as dividends. The
payout ratio, i.e., the fraction of available cash paid out as dividends, will thus be negatively
related to agent quality which, in turn, is positively related to managerial compensation.

6
Therefore, a testable hypothesis of the model is that the dividend payout ratio will be negatively
related to managerial compensation.
B. The Model
Bhattacharyya’s (2003) one-period model is used as a starting point to motivate our
empirical hypothesis. The manager of firm j is presented with a menu of linear wage contracts
that determine total compensation ϖj. Each member of the menu of wage contracts is a linear
function of the dividend declared and stochastic output to be realized. The general form of the
contract is presented in equation (1) below:
jYjD0j Y~bDbb ++=ϖ (1)
where b0 is the fixed component of managerial compensation, Dj is the dividend declared for the
period, ? j is the stochastic output for the period, and bD and bY are nonnegative coefficients (this
is discussed below).
Different contracts will have different coefficients b0,bD and bY. The manager is
presented with a menu of contracts and the manager selects a contract. The menu of contracts is
designed so as to be separating in agent types. Having picked the contract which is most
beneficial to him/her, the manager will then declare a dividend Dj and invest the balance of the
available amount.
Cash available for the period is partially distributed as Dj at the manager’s discretion, and
the rest is invested in the production process. The stochastic output from the production process
is given by
( ) jjjjjj~DCn1e0Y
~ε+−= (2)
where θj is the productivity or quality of the manager (i.e., the manager’s ability to identify net
present value projects; managerial quality is assumed to be unknown to the owner), C j is the cash

7
available for the period, ej is the effort expended by the manager (also unobservable to the
owner), and the final term is random noise. Output is dependent on the lo garithm of the net
investment, implying diminishing marginal returns to investment. Substituting (2) into (1), we
get
(( ) )jjjjjYjD0j~DCn1e0bDbb ε+−++=ϖ (3)
We should note here that the signs of both bD and bY must be positive because if either
is negative, then the manager will ensure that the expected value of that component is zero. To
illustrate, suppose bD is negative, i. e., the manager is penalized for paying dividends. Then the
manager will always set the dividend equal to zero. Similarly, if bY is negative, then the manager
will set effort to zero, which will make the expected value of production zero. The sign of b0 will
be indeterminate and b0 will be adjusted to ensure that the ex ante expected compensation for the
manager with the lowest acceptable quality is set at the participation constraint. iii For managers of
higher quality, the intercept term b0 will be adjusted to minimise the information rent payable.
Rearranging the terms in (3), we get
jj
jjjjjD0j
~bC
D1n1nC1e0bDbb ε+
−+++=ϖ ΥΥ (4)
Note that Dj/Cj is a dividend payout ratio. Transposing and simplifying, we get
( ) jjjjj
jjj
jj
D
jj eebnCD
ebb
ebb
Payoutn εϖ ~
01
01
00Ratio 11 0
j −+−−−=−ΥΥΥ
(5)
The left-hand side of equation (5) can be interpreted as a measure of earnings retention.
The model predicts that dividend payout (earnings retention) is positively (negatively) associated
with both Dj, dividends declared, and C j, cash available.

8
The positive relationship between Dj and the payout ratio, Dj /Cj, is not surprising. The
relationship between Cj and the payout ratio is more subtle. At first glance, it would appear that,
by construction, an increase in Cj will result in a reduction in the payout ratio. This is not the
case, however, because of the assumption regarding diminishing marginal returns to investment
implicit in equation (2). The manager will allocate available Cj between investment and
dividends such that, ex ante, the marginal compensation from dividend payment is equal to the
marginal compensation from production. Marginal compensation from dividend payment (bD) is
constant. Marginal compensation from production (bY) is also constant. However, from (2),
expected marginal production increases with investment but at a diminishing rate. Therefore, as
Cj increases, the manager will find it increasingly to his/her advantage to pay out proportiona tely
more dividends. Hence, there is a positive relationship between C j and the payout ratio.
Dividend payout (retention) is negatively (positively) associated with managerial
compensation, reflecting that higher quality managers will be induced to invest more in the
production process and earn greater compensation. The next section of the paper presents the
results of empirical tests of this model.
II. Empirical Tests
A. Data
We obtained executive compensation data from the 2002 Execucomp database and
collected firm-specific accounting variables from Compustat. Our sample began with a total of
14,013 firm-year observations. Firms in the financial service, professional service and
government sectors were deleted (2,263 firm-years), as well as firm-years with negative or
missing shareholders’ equity (636 firm-years) and negative share repurchases (2 firm-years). In
addition, we restrict our analysis to firms with payout ratios that are (1) non-negative because of

9
difficulty in interpreting a negative payout ratio; and (2) less than one, since ln(1 – Payout) is
undefined for values of dividend payout greater than or equal to one.
A preliminary analysis of the data revealed the presence of some extreme values in many of
the variables in our analysis. To mitigate the effect of these extreme values on our results, we
eliminated observations falling within the top and bottom one-half of one percent of values of the
following variables: Total CEO compensation, market-to-book ratio, capital expenditures and
beta. In addition, we eliminated the top one-half of one percent of the following variables:
Salary, options, bonus and debt-equity ratio. We did not perform this elimination process on
variables that were “naturally” truncated. For example, bonus and options each had a significant
number of zero values as the minimum. For these variables, we only eliminated the top one -half
of one percent of values. As well, the logarithmic transformation of income available to
shareholders eliminated loss firm-years from our sample and reduced extreme positive values.
Performing our analyses without these eliminations had no effect on the statistical results
presented here.
Descriptive statistics on the remaining sample are presented in Table I. The mean (median)
firm-year in our sample has total assets of $4.370 billion ($1.063 billion). The mean (median)
total annual CEO compensation is $3.253 million ($1.664 million), while the mean (median)
Black-Scholes value of annual stock options granted to CEOs in our sample is $1.633 million
($415,090). On average, the value of options granted accounts for more than 50% of total
compensation. The mean (median) annual CEO salary and bonus are $551,140 ($500,000) and
$468,750 ($282,450), respectively. The mean (media n) dividend payout ratio is 0.23 (0.14). The
minimum and maximum values of the payout ratio (0 and 0.99, respectively), and the smaller
number of valid cases, result from the restrictions imposed on the payout ratio as described
above.

10
A correlation matrix of the variables in the sample is presented in Table II. By virtue of
the large sample size, almost all of the correlations are statistically significant at conventional
levels. It is noteworthy that firm size, as measured by the log of total assets, is positively
correlated with total compensation and all of its components, and is particularly highly correlated
with salary (Pearson r = 0.68). This finding is consistent with results reported by Baker et al
(1988) and suggests that CEO salary is the component of compensation that is most highly
correlated with firm size.
Dividend payout is positively associated with firm size (LNASSETS) and negatively
associated with BETA. Consistent with the descriptive statistics in Table I, the value of options
granted is very highly correlated with total compensation (Pearson r = 0.90), much higher than
the correlations between total compensation and salary (r = 0.43); and total compensation and
bonus (r = 0.49).
B. Tobit regression results
Bhattacharyya models dividend payout as a function of dividends (Dj), cash (Cj) and
managerial compensation (ϖ j). In our empirical tests of this model, we use dividends declared as
Dj and compensation figures from Execucomp as ϖ j. We use earnings available to common
shareholders as the empirical proxy for Cj for three reasons. First, the dividend payout ratio is
traditionally defined as dividends divided by earnings available to common shareholders.
Second, dividend payouts are often constrained by earnings-based covenants (e.g., times-
dividends-earned). Finally, earnings are frequently used as a measure of the long run cash-
generating potential of a firm.
We estimate two sets of tobit regression models. The first is a direct test of equation (5)
and is operationalized as:

11
ln(1-PAYOUT) = β0 + β1COMPENSATION + β2DIVIDEND + β3LNINCOME + ε (6)
where PAYOUT is cash dividends declared to common shareholders divided by net income
available to common shareholders (i. e., net income less preferred dividend requirement);
COMPENSATION is one of total compensation, bonus and options granted; DIVIDEND is cash
dividends declared to common shareholders; and LNINCOME is the log of net income available
to common shareholders. iv We repeated all of our analyses with several alternate specifications
of “dividends” and “cash,” and all specifications yielded qualitatively consistent results. These
alternate specifications are described later in this paper.
The results of estimating equation (6) are presented in Table III. The pseudo R2 for the
regressions is around 8%, and the Wald test results allow us to reject the null hypothesis that all
of the regression coefficients, except for the intercept term, are not significant ly different from
zero. As predicted by Bhattacharyya (2003), the compensation coefficient β1 is positive and
strongly significant for total compensation, as well as for the individual compensation
components bonus and options granted. The coefficients β2 and β3, on dividends and income,
respectively, are both negative and significant as predicted by Bhattacharyya. The intercept
coefficient, β0, is theoretically indeterminate but is consistently and significantly positive in all
four models.
The results in Table III provide strong support for the Bhattacharyya model. However,
some or all of these results could be due to excluded variables that other studies have found to be
related to dividend policy (e. g., White, 1996). In order to test this possibility, we estimate the
following tobit regression model.

12
ln(1-PAYOUT) = β0 + β1COMPENSATION + β2DIVIDEND + β3LNINCOME + β4DEBTEQ + β5MKTBOOK + β6CAPEXP + β7BETA +
η1 ... η53 + ε (7)
where COMPENSATION, DIVIDEND and LNINCOME are as defined in equation (6) above.
DEBTEQ is long-term debt divided by common shareholders’ equity, and is used here as a
measure of firm leverage and a proxy for closeness to debt covenant restrictions. High leverage,
with its associated financial risk and debt-servicing requirements, should be associated with
lower dividend payout. MKTBOOK is the market value of the firm’s common shares divided by
the book value of common shareholders’ equity, both at fiscal year-end. The market-to-book
ratio is frequently used to proxy for investment opportunities available to the firm, regardless of
the quality of the manager. We expect a higher market-to-book ratio to be associated with lower
dividend payout. CAPEXP is capital expenditures for the year as reported on the cash flow
statement, and controls for the possible effects of the firm’s normal investment/capital asset
replacement cycle. We expect capital expenditures to be negatively associated with dividend
payout. BETA is the monthly fundamental beta, calculated for a 60-month period ending in the
month of the firm-year’s fiscal year end. We expect riskier firms to be more reluctant to pay out
dividends and, therefore, expect BETA to be negatively associated with dividend payout. η1
through η53 are dummy variables included to control for the effects of four years and 49 two-digit
SIC industry groups in our sample.
Tobit regression results for equation (7) are presented in Table IV (note that the coef-
ficients for the year and industry dummy variables are not reported). The pseudo R2 for the
different versions of the model is approximately 33%. In all three cases, the Wald statistic is sig-
nificant, permitting rejection of the null hypothesis that all of the coefficients, aside from the

13
intercept term, are zero. As in Table III, all of the compensation variables are significantly and
negatively (positively) associated with dividend payout (earnings retention).
Dividends declared and the natural logarithm of income are both negatively (positively)
associated with earnings retention (dividend payout), consistent with the results in Table III. The
market-to-book ratio (MKTBOOK), capital expenditures (CAPEXP) and firm beta (BETA) are
all negatively associated with dividend payout, as expected, and are statistically significant in all
three regressions. The coefficient on the debt-to-equity ratio (DEBTEQ), on the other hand, is
negative, contrary to our expectations. Perhaps one of the other control variables (capital
expenditures, for example) more effectively proxies for growth opportunities as they affect
dividend policy.
While the indicator variables were included only to control for potential industry and year
effects, it is noteworthy that no more than five of the 50 two-digit industry indicator variables are
statistically significant in any of the three regression models. This is consistent with results
obtained by chance, and suggests that either there are no significant inter- industry differences in
dividend policy, or that these differences are effectively captured by other independent variables
in the regression model. Two of the fiscal year dummy variables, for the years 2000 and 2001,
were positive and statistically significant, suggesting that annual dividend payouts in these years
were systematically lower than over the period 1997-1999.v This supports the argument that
firms are increasingly resorting to stock repurchases, rather than cash dividends, to distribute
excess cash to shareholders. This possibility is considered in more detail in the next section.

14
C. Sensitivity analysis
Cash dividends are not the only vehicle available to managers for distributing income to
shareholders. Many firms frequently engage in share repurchases as a way of distributing excess
cash to shareholders while avoiding the “stickiness” associated with increased dividends (see, for
example, Jolls, 1998; Kahle, 2002; and Weisbenner, 2000). Grullon and Michaely (2002) find
evidence that firms have gradually substituted repurchases for dividends. Ignoring share
repurchases, therefore, risks misspecifying the cash distribution parameter in Bhattacharyya
(2003).
To address this issue, we compute a new payout variable based on the approach used by
Grullon and Michaely (2002). DIVPURCH is defined as the sum of cash dividends on common
stock declared and total expenditure on repurchase of common and preferred stock, minus any
reduction in the value of the net number of preferred shares outstanding. The payout ratio
associated with DIVPURCH is DPPAYOUT, defined as DIVPURCH divided by net income
available to common shareholders. We redo the analyses presented in tables III and IV, using
DIVPURCH and DPPAYOUT in place of DIVIDEND and PAYOUT, respectively.
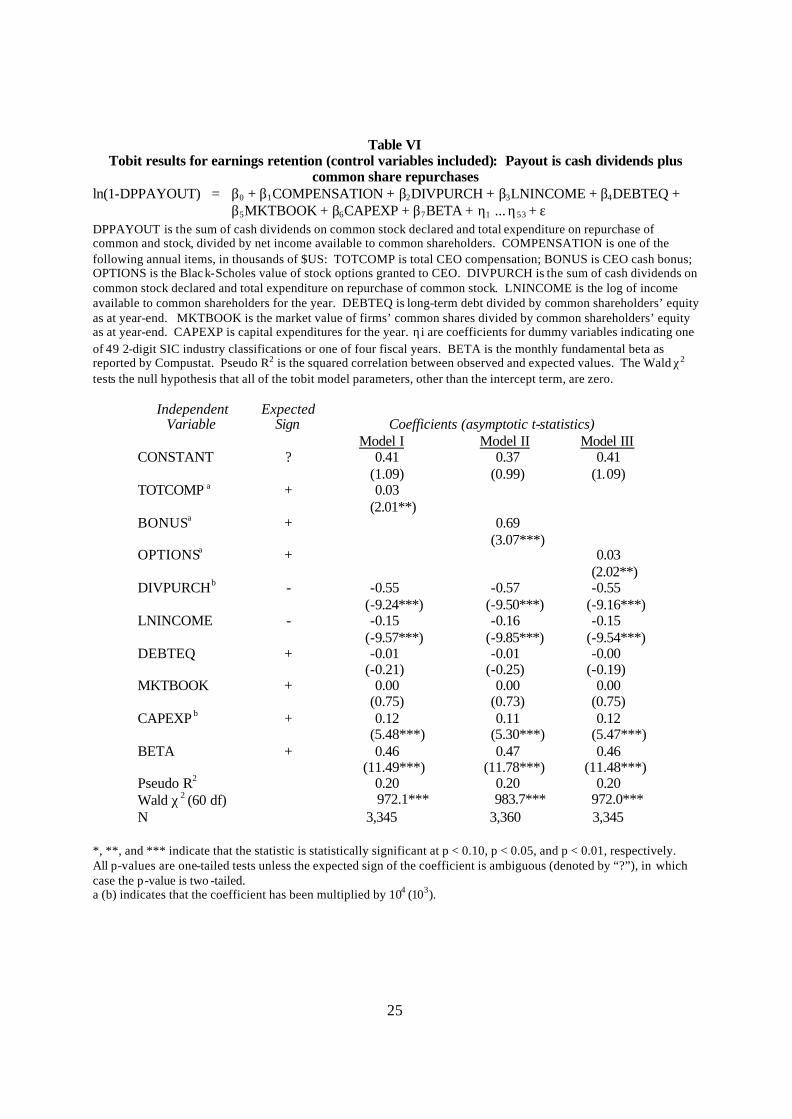
The results of these supplementary analyses are presented in tables V and VI. In all
regressions, the results concerning the effect of compensation on retention are qualitatively
similar to those reported in tables III and IV. The results in table VI are similar to those in table
IV, except that the market-to-book ratio is no longer statistically significant (although still
positive). These results provide strong additional support for the Bhattacharyya model.
As a supplementary check, we identified and deleted from our sample all firm-years
reporting share repurchase activity on the cash flow statement. The tobit results obtained from
this reduced sample (not reported here) are qualitatively the same as those reported in Table IV, i.

15
e., total compensa tion, bonus and options granted are significantly and negatively associated with
dividend payout of non-repurchasing firms.
We used earnings available to common shareholders as the empirical measure of the
Bhattacharyya cash parameter since earnings can be interpreted as a long-term average measure
of cash generated by the firm’s operations, and because earnings available to common share-
holders is probably the most widely used denominator term in the payout ratio. We also conduct
our analyses using (1) cash flow from operations (from the cash flow statement) and (2) free cash
flow, as defined by Lehn and Poulsen (1989), in lieu of income available to common
shareholders. In a further analysis, we used dividend yield in lieu of dividend payout, and market
value of shareholders’ equity in lieu of earnings, in our tobit regressions. In all cases, the results
are qualitatively similar to those reported in Table IV.
Because it is a one-period model, Bhattacharyya (2003) assumes that the compensation
effects of dividend and investment decisions are realized in the same period that those decisions
are made. It is possible, however, that current managerial performance is rewarded (or punished)
in subsequent periods through lagged adjustments to compensation (Fama, 1980). To test for this
possibility, we ran our regressions using next year’s (i. e., year t+1) compensation variables in
place of this year’s (year t) compensation. The results are qualitatively similar to those reported
in Tables III and IV.
To ensure that heteroscedasticity or outliers do not affect our results, we performed rank
transformations on all of the continuous variables in equation (7) and conducted our analyses
using these ranks in place of the raw variable scores (see Iman and Conover, 1979, for a
discussion of this technique). Secondly, we divided all variables by total assets and performed

16
the tobit procedure on the deflated variables. In both cases, the results are qualitatively similar to
those reported in Table IV.
III. Conclusion
Understanding dividend policy has for many years been one of the most significant
challenges in finance. A number of studies have documented an empirical association between
managerial compensation and dividend policy although, until recently, no formal theoretical
model has been advanced to explain this link. Bhattacharyya (2003) offers a model of dividend
payout that incorporates managerial compensation and demonstrates that compensation affects
the level of cash dividends, conditional upon the level of cash available for distribution.
The central premise underlying our model is that shareholders use the compensation
contract to induce managers with lower productivity (i. e., managers with less access to positive
NPV projects) to distribute more of their available earnings or cash as dividends. In contrast,
managers with high productivity have access to many more positive NPV projects. These
managers are, therefore, offered incentives to invest more of their available earnings or cash in
productive ventures, leaving less for distribution as dividends. Consequently, dividend payout is
negatively associated with managerial productivity. In equilibrium, higher productivity managers
are paid more and, therefore, it follows that dividend payouts will be nega tively associated with
managerial compensation. The results of tobit analyses of dividend payouts of US firms over the
period 1992-2001 are consistent with the predictions of the Bhattacharyya model, even after
controlling for firm size, leverage, market-to-book value, capital expenditures, systematic risk,
and year and industry effects.
17
References
Baker, George, Michael Jensen, and Kevin Murphy, 1988, Compensation and Incentives: Practice vs. Theory, Journal of Finance 43, 593-616. Bhattacharyya, Nalinaksha, 2003, Good Managers Work More and Pay Less Dividends – A Model of Dividend Policy, http://papers.ssrn.com/author=115728. Bhattacharya, Sudipto, 1979, Imperfect information, dividend policy, and the ‘bird in the hand’ fallacy, Bell Journal of Economics 10, 259-270. Black, Fischer, 1976, The Dividend Puzzle, Journal of Portfolio Management 2, 5-8. Brealey, Richard, and Stewart Myers, 2003, Fundamentals of Corporate Finance (7th ed.), McGraw-Hill Irwin, Toronto. Crystal, Graef S., 1989, Incentive Pay that Doesn't Work, Fortune, August 28, 101-104. Easterbrook, Frank, 1984, Two Agency-Cost Explanations of Dividends, American Economic Review 74, 650-659. Fama, Eugene, 1980, Agency Problems and the Theory of the Firm, Journal of Political Economy 88, 288-307. Fenn, George, and Nellie Liang, 2001, Corporate Payout Policy and Managerial Stock Incentives, Journal of Financial Economics 60, 45-72. Grullon, Gustavo, and Roni Michaely, 2002, Dividends, Share Repurchases, and the Substitution Hypothesis, Journal of Finance 57, 1649-1684. Healy, Paul, 1985, The Effect of Bonus Schemes on Accounting Decisions, Journal of Accounting and Economics 7, 85-107. Iman, Ronald, and W. J. Conover, 1979, The Use of the Rank Transform in Regression, Technometrics 21, 499-509. Jagannathan, Murali, Clifford Stephens, and Michael Weisbach, 2000, Financial flexibility and the choice between dividends and stock repurchases, Journal of Financial Economics 57, 355-384. Jensen, Michael, 1986, Agency Costs of Free Cash Flow, Corporate Finance, and Takeovers, American Economic Review 76, 323-329. Jensen, Michael, and Kevin Murphy, 1990, Performance Pay and Top-Management Incentives, Journal of Political Economy 98, no. 2, 225-64.

18
John, Kose, and Joseph Williams, 1985, Dividends, Dilution and Taxes: A Signalling Equilibrium, Journal of Finance 40, 1053-70. Jolls, Christine, 1998. Stock Repurchases and Incentive Compensation. National Bureau of Economic Research Working Paper 6467. Kahle, Kathleen, 2002, When a Buyback isn’t a Buyback: Open Market Repurchases and Employee Options, Journal of Financial Economics 63, 235-261. Lambert, Richard, William Lanen, and David Larcker, 1989, Executive Stock Options and Corporate Dividend Policy, Journal of Financial and Quantitative Analysis 24, 409-425. Larcker, David F., 1983, The Association between Performance Plan Adoption and Corporate Capital Investment. Journal of Accounting and Economics 5, no. 1, 3-30. Lehn, Kenneth, and Annette Poulsen, 1989, Free Cash Flow and Stockholder Gains in Going Private Transactions, Journal of Finance 44, 771-787. Lewellen, Wilbur G., Claudio Loderer, and Kenneth Martin, 1987, Executive Compensation and Executive Incentive Problems: An Empirical Analysis, Journal of Accounting and Economics 9, no. 3, 287-310. Miller, Merton, and Franco Modigliani, 1961, Dividend Policy, Growth and the Valuation of Shares, Journal of Business 34, 411-433. Miller, Merton, and Kevin Rock, 1985, Dividend Policy under Asymmetric Information, Journal of Finance 40, 1031-1051. Pavlik, Ellen L., Thomas W. Scott, and Peter Tiessen, 1993, Executive Compensation: Issues and Research, Journal of Accounting Literature 12, 131-89. Weisbenner, Scott, 2000, Corporate Share Repurchases in the 1990s: What Role do Stock Options Play? Board of Governors of the Federal Reserve System, Finance and Economics Discussion Paper 2000/29. White, Lourdes Ferreira, 1996, Executive Compensation and Dividend Policy, Journal of Corporate Finance 2, 335-358.

19
Endnotes i The compensation contract is assumed to be structured in such a way that the manager finds it in
her self- interest to pay out dividends rather than invest in negative NPV projects, since the latter
reduces firm value in an efficient market.
ii The linear compensation function is assumed for reasons of tractability.
iii b0 refers to the fixed component of total compensation, but is not equivalent to “salary” as that
term is normally used. Salary itself can have a variable component in that it can be adjusted as a
function of managerial performance.
iv LNINCOME also serves as a proxy for size, as it is highly correlated (Pearson r = 0.84) with ln
of total assets (LNASSETS). The results are qualitatively similar when both LNINCOME and
LNASSETS are included as independent variables.
v The regressions reported in Table 4 only contain observations from the period 1997-2001
because BETA is not available in Compustat for years prior to 1997.

20
Table I Descriptive statistics
Our sample includes firm-years from the period 1992-2001. Dividends is cash dividends declared to common shareholders during the year. Income available is net income available to common shareholders. Payout ratio is dividends divided by income available to common shareholders. Total compensation is total CEO compensation. Salary is CEO salary. Bonus is CEO cash bonus. Options is the Black-Scholes value of stock options granted to the CEO. Assets is total assets as at year-end. Debt-equity ratio is long-term debt divided by common shareholders’ equity as at year-end. Market-book ratio is the market value of firms’ common shares divided by common shareholders’ equity, both as at fiscal year end. Capital expenditures is capital expenditures for the year as reported on the cash flow statement. Assets, debt-equity ratio and market-book ratio are as at fiscal year end; all other items are for the fiscal year. Beta is the monthly fundamental beta, as reported by Compustat, calculated for a 60-month period ending in the month of the firm-year’s fiscal year end. Beta is only available on Compustat for the years 1997-2001. As a result, there are only 5,577 valid firm-years in our sample.
Variable N Mean Median Std dev. Minimum Maximum Dividendsa 11,297 82.29 5.54 295.1 0 7,442.0 Incomea 11,326 182.46 44.80 898.4 -56,121.9 21,964 Payout ratio 9,069 0.23 0.14 0.3 0 0.99 Total compensationb 11,102 3,253.21 1,664.86 4,833.8 68.0 49,483.3 Salaryb 11,269 551.14 500.00 276.4 0 1,976.9 Bonusb 11,274 468.75 282.45 620.7 0 5,278.3 Optionsb 11,158 1,633.84 415.09 3,694.4 0 40,554.6 Assetsa 11,330 4,370.72 1,063.78 13,226 5.1 303,100 Debt-equity ratio 11,205 0.35 0.17 0.5 0 5.6 Market-book ratio 11,011 3.44 2.37 3.7 0 43.9 Capital expendituresa 11,065 247.02 63.84 547.3 0.4 5,930.0 Beta 5,577 0.93 0.86 0.5 -0.3 3.2 a (b) indicates that amounts are in millions (thousands) of dollars US.

21
Table II Correlation matrix
PAYOUT is cash dividends declared to common shareholders divided by net income available to common shareholders. TOTCOMP is total CEO compensation for the (fiscal) year. SALARY is CEO salary for the year. BONUS is CEO cash bonus for the year. OPTIONS is the Black-Scholes value of stock options granted to CEO during the year. DIVIDEND is cash dividends to common shareholders declared during the year. LNINCOME is the log of income available to common shareholders for the year. LNASSETS is log of total assets as at year-end. DEBTEQ is long-term debt divided by common shareholders’ equity as at year-end. MKTBOOK is the market value of the firm’s common shares divided by common shareholders’ equity as at year-end. CAPEXP is capital expenditures for the year. BETA is the monthly fundamental beta from Compustat, calculated for a 60-month period ending in the month of the firm-year’s fiscal year end. 1 2 3 4 5 6 7 8 9 10 11 1. PAYOUT 1 2. TOTCOMP -.05* 1 3. SALARY .20* .43* 1 4. BONUS .01 .49* .53* 1 5. OPTIONS -.10* .90* .25* .30* 1 6. DIVIDEND .31* .28* .43* .30* .15* 1 7. LNINCOME .28* .40* .62* .47* .27* .51* 1 8. LNASSETS .38* .40* .68* .44* .25* .47* .84* 1 9. DEBTEQ .15* -.06* .06* -.07* -.08* -.02 -.05* .20* 1 10. MKTBOOK -.10* .26* .04* .16* .26* .10* .18* -.02 -.25* 1 11. CAPEXP .20* .31* .43* .30* .19* .60* .58* .62* .04* .04* 1 12. BETA -.40* .11* -.13* -.02 .17* -.11* -.07* -.14* -.16* .15* -.06* * correlation is significantly different from zero at p < 0.01.

22
Table III Tobit results for earnings retention (no control variables)
ln(1-PAYOUT) = β0 + β1COMPENSATION + β2DIVIDEND + β3LNINCOME + ε PAYOUT is cash dividends declared to common shareholders divided by net income available to common shareholders. COMPENSATION is one of the following annual items, in thousands of $US: TOTCOMP is total CEO compensation; BONUS is CEO cash bonus; OPTIONS is the Black-Scholes value of stock options granted to the CEO. DIVIDEND is cash dividends declared during the year. LNINCOME is the log of income available to common shareholders for the year. Pseudo R2 is the squared correlation between observed and expected values. The Wald χ2 tests the null hypothesis that all of the tobit model parameters, other than the intercept term, are zero.
Coefficients (asymptotic t-statistics) Independent
Variable Expected
sign Model I Model II Model III
CONSTANT ? 0.47 (14.72***)
0.45 (13.94***)
0.45 (14.17***)
TOTCOMPa + 0.47 (19.68***)
BONUSa + 2.35 (13.96***)
OPTIONSa + 0.60 (19.25***)
DIVIDENDb - -0.49 (-14.34***)
-0.50 (-13.93***)
-0.44 (-13.05***)
LNINCOME - -0.17 (-21.79***)
-0.16 (-19.67***)
-0.15 (-20.13***)
Pseudo R2 0.08 0.07 0.08 Wald χ2 (3 df) 1,199.9*** 1,044.0*** 1,181.7*** N 8,904 9,022 8,942
*, **, and *** indicate that the statistic is statistically significant at p < 0.10, p < 0.05, and p < 0.01, respectively. All p-values are one-tailed tests unless the expected sign of the coefficient is ambiguous (denoted by “?”), in which case the test is two-tailed. a (b) indicates that the coefficient has been multiplied by 104 (103).

23
Table IV Tobit results for earnings retention (control variables included)
ln(1-PAYOUT) = β0 + β1COMPENSATION + β2DIVIDEND + β3LNINCOME + β4DEBTEQ + β5MKTBOOK + β6CAPEXP + β7BETA + η1 ... η53 + ε
PAYOUT is cash dividends declared to common shareholders divided by net income available to common shareholders. COMPENSATION is one of the following annual items, in thousands of $US: TOTCOMP is total CEO compensation; BONUS is CEO cash bonus; OPTIONS is the Black-Scholes value of stock options granted to CEO. DIVIDEND is cash dividends declared during the year. LNINCOME is the log of income available to common shareholders for the year. DEBTEQ is long-term debt divided by common shareholders’ equity as at year-end. MKTBOOK is the market value of firms’ common shares divided by common shareholders’ equity as at year-end. CAPEXP is capital expenditures for the year. η i are coefficients for dummy variables indicating one of 49 2-digit SIC industry classifications or one of four fiscal years. BETA is the monthly fundamental beta as reported by Compustat. Pseudo R2 is the squared correlation between observed and expected values. The Wald χ2 tests the null hypothesis that all of the tobit model parameters, other than the intercept term, are zero.
Coefficients (asymptotic t-statistics)
Independent Variable
Expected Sign
Model I Model II Model III CONSTANT ? -0.16
(-0.49) -0.19
(-0.57) -0.14
(-0.44) TOTCOMP a + 0.11
(2.96***)
BONUSa + 0.49 (1.68**)
OPTIONSa + 0.22 (4.55***)
DIVIDENDb - -0.73 (-8.09***)
-0.74 (-8.27***)
-0.73 (-8.18***)
LNINCOME - -0.13 (-7.60***)
-0.13 (-7.14***)
-0.13 (-7.71***)
DEBTEQ + -0.07 (-1.50)
-0.06 (-1.44)
-0.07 (-1.49)
MKTBOOK + 0.01 (2.25**)
0.02 (3.17***)
0.01 (1.86**)
CAPEXP b + 0.07 (1.57*)
0.09 (1.92**)
0.06 (1.31*)
BETA + 0.68 (14.98***)
0.69 (15.50***)
0.67 (14.77***)
Pseudo R2 0.33 0.33 0.33 Wald χ2 (60 df) 1,965.8*** 1,975.1*** 1,977.6*** N 4,198 4,235 4,219
*, **, and *** indicate that the statistic is statistically significant at p < 0.10, p < 0.05, and p < 0.01, respectively. All p-values are one-tailed tests unless the expected sign of the coefficient is ambiguous (denoted by “?”), in which case the p-value is two -tailed. a (b) indicates that the coefficient has been multiplied by 104 (103).

24
Table V Tobit results for earnings retention (no control variables): Payout is cash dividends plus
common share repurchases ln(1-DPPAYOUT) = β0 + β1COMPENSATION + β2DIVPURCH + β3LNINCOME + ε DPPAYOUT is the sum of cash dividends on common stock declared and total expenditure on repurchase of common stock, divided by net income available to common shareholders. COMPENSATION is one of the following annual items, in thousands of $US: TOTCOMP is total CEO compensation; BONUS is CEO cash bonus; OPTIONS is the Black-Scholes value of stock options granted to the CEO. DIVPURCH is sum of cash dividends on common stock declared and total expenditure on repurchase of common stock. LNINCOME is the log of income available to common shareholders for the year. Pseudo R2 is the squared correlation between observed and expected values. The Wald χ2 tests the null hypothesis that all of the tobit model parameters, other than the intercept term, are zero.
Coefficients (asymptotic t-statistics) Independent
Variable Expected
Sign Model I Model II Model III
CONSTANT ? 0.27 (5.86***)
0.26 (6.39***)
0.26 (5.75***)
TOTCOMPa + 0.07 (6.17***)
BONUSa + 1.49 (8.55***)
OPTIONSa + 0.07 (5.81***)
DIVPURCHb - -0.42 (-11.04***)
-0.47 (-12.01***)
-0.41 (-10.76***)
LNINCOME - -0.17 (-15.70***)
-0.19 (-16.82***)
-0.16 (-15.44***)
Pseudo R2 0.08 0.09 0.08 Wald χ2 (3 df) 763.8*** 807.1*** 759.1*** N 6,501 6,573 6,501
*, **, and *** indicate that the statistic is statistically significant at p < 0.10, p < 0.05, and p < 0.01, respectively. All p-values are one-tailed tests unless the expected sign of the coefficient is ambiguous (denoted by “?”), in which case the test is two-tailed. a (b) indicates that the coefficient has been multiplied by 104 (103).
25
Table VI Tobit results for earnings retention (control variables included): Payout is cash dividends plus
common share repurchases ln(1-DPPAYOUT) = β0 + β1COMPENSATION + β2DIVPURCH + β3LNINCOME + β4DEBTEQ +
β5MKTBOOK + β6CAPEXP + β7BETA + η1 ... η53 + ε DPPAYOUT is the sum of cash dividends on common stock declared and total expenditure on repurchase of common and stock, divided by net income available to common shareholders. COMPENSATION is one of the following annual items, in thousands of $US: TOTCOMP is total CEO compensation; BONUS is CEO cash bonus; OPTIONS is the Black-Scholes value of stock options granted to CEO. DIVPURCH is the sum of cash dividends on common stock declared and total expenditure on repurchase of common stock. LNINCOME is the log of income available to common shareholders for the year. DEBTEQ is long-term debt divided by common shareholders’ equity as at year-end. MKTBOOK is the market value of firms’ common shares divided by common shareholders’ equity as at year-end. CAPEXP is capital expenditures for the year. ηi are coefficients for dummy variables indicating one of 49 2-digit SIC industry classifications or one of four fiscal years. BETA is the monthly fundamental beta as reported by Compustat. Pseudo R2 is the squared correlation between observed and expected values. The Wald χ2 tests the null hypothesis that all of the tobit model parameters, other than the intercept term, are zero.
Coefficients (asymptotic t-statistics)
Independent Variable
Expected Sign
Model I Model II Model III CONSTANT ? 0.41
(1.09) 0.37
(0.99) 0.41
(1.09) TOTCOMP a + 0.03
(2.01**)
BONUSa + 0.69 (3.07***)
OPTIONSa + 0.03 (2.02**)
DIVPURCHb - -0.55 (-9.24***)
-0.57 (-9.50***)
-0.55 (-9.16***)
LNINCOME - -0.15 (-9.57***)
-0.16 (-9.85***)
-0.15 (-9.54***)
DEBTEQ + -0.01 (-0.21)
-0.01 (-0.25)
-0.00 (-0.19)
MKTBOOK + 0.00 (0.75)
0.00 (0.73)
0.00 (0.75)
CAPEXP b + 0.12 (5.48***)
0.11 (5.30***)
0.12 (5.47***)
BETA + 0.46 (11.49***)
0.47 (11.78***)
0.46 (11.48***)
Pseudo R2 0.20 0.20 0.20 Wald χ2 (60 df) 972.1*** 983.7*** 972.0*** N 3,345 3,360 3,345
*, **, and *** indicate that the statistic is statistically significant at p < 0.10, p < 0.05, and p < 0.01, respectively. All p-values are one-tailed tests unless the expected sign of the coefficient is ambiguous (denoted by “?”), in which case the p-value is two -tailed. a (b) indicates that the coefficient has been multiplied by 104 (103).