Diversify globally and gain on both risk and return! Thomas Fischer SVP JGAM April 6, 2013 The JGAM...
54
Diversify globally and gain on both risk and return! Thomas Fischer SVP JGAM April 6, 2013 The JGAM Team
-
Upload
leona-edwards -
Category
Documents
-
view
214 -
download
0
Transcript of Diversify globally and gain on both risk and return! Thomas Fischer SVP JGAM April 6, 2013 The JGAM...

Diversify globally and gain on both risk and return!
Thomas Fischer SVP JGAMApril 6, 2013
The JGAM Team

Thomas Fischer
• MBA
• 37 years in financial services
• Currency trader 1978-2000
• England, Germany and Denmark
• Jyske Bank since 2000
• JGAM since 2008
• Golf
• Copenhagen Marathon 05 4:10
• Copenhagen Marathon 07 4:08

JGAM – What’s in it for you?
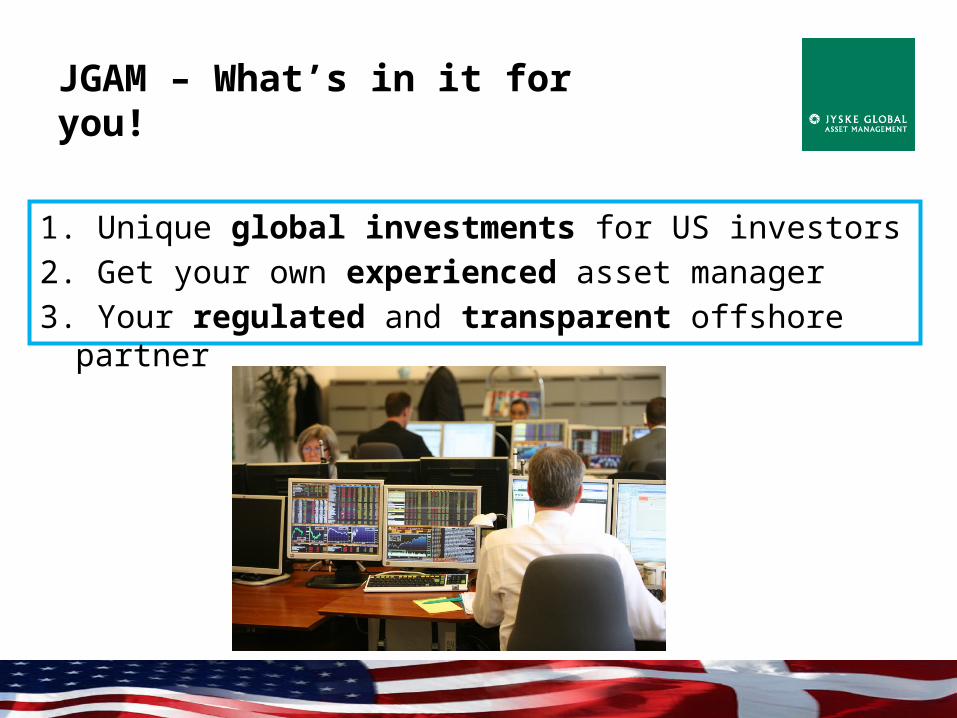
1. Unique global investments for US investors2. Get your own experienced asset manager3. Your regulated and transparent offshore partner
Henrik, Carsten and Bente working with a smile
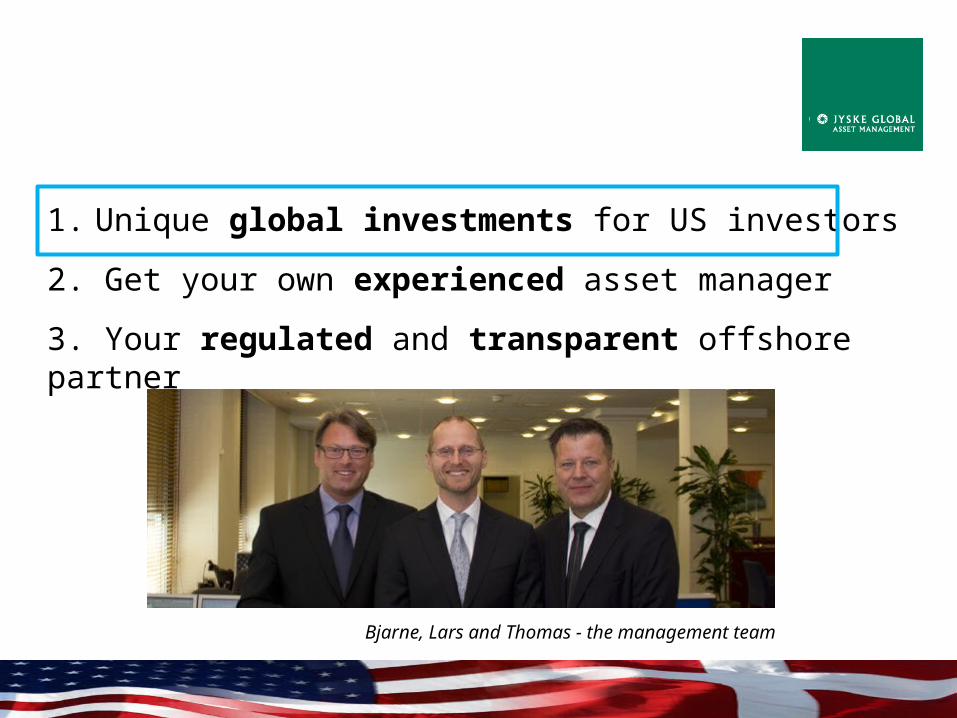
1. Unique global investments for US investors
2. Get your own experienced asset manager
3. Your regulated and transparent offshore partner
Bjarne, Lars and Thomas - the management team

What we do
JGAM offers Global Investments
to US persons

Unique global investmentsfor US investors
• SEC registered Investment Adviser since 2008• Regulated by the Danish FSA• JGAM invest your money as a non-US person• A world of opportunities• Increased diversification and potentially higher returns
Carsten, Henrik, Bente and Thomas – the relationship managers

Invest globally and you gain on both risk and return
Risk
Return
Efficient front withand without global investments
Lower risk at a givenlevel of return
Higher return at a given levelof risk

Risk diversification by spreading your investments
8
“Why Not Diversify Internationally Rather Than Domestically?” Solnik (1974)
1. The greater the number of securities, the less the portfolio is likely to lose as the result of one company’s misfortune
2. An internationally diversified portfolio is likely to carry a much smaller risk than a domestic portfolio
1
2

The Size of the Foreign Exchange market
• USD 4 trillion a day• Spot transactions 1.4 trillion a day• 98% of FX trades involve at least one of the G3 currencies• EUR/USD 28% of total turnover• USD/JPY 14% of total turnover• GBP/USD 9% of total turnover • AUD/USD 6% of total turnover• USD/CAD 5% of total turnover

FX As An Asset Class –why currencies make sense in an uncertain climate
• 24 hour trading• Low spreads between buying/selling• Liquid – daily volume $ 4 Trillion (NYSE daily turnover $ 55
Billion)• Many participants – difficult to manipulate markets• Anonymous Trading• Absolute returns• Not correlating with other asset classes• Even during the 2008 ”Meltdown” trading remain liquid

Returns in a Zero-Sum Market
• As the most liquid market in the world, shouldn’t currency markets be the most efficient, and so not offer consistent returns to investors?
• AND
• How can a zero-sum game (or a long-short market) such as currencies offer consistent returns to investors? Who are the systematic losers?

Liquidity-Seekers (or Non-Profit Seekers)
• International investors who buy bonds, equities, or credit, who either fully hedge their currency exposure, or do not hedge at all
• Central banks who buy or sell currencies in order to maintain an exchange rate policy
• Corporates who need to export, import or engage in FDI• Tourists

Profit-Seekers
• Currency Managers• Dedicated currency-only hedge funds• Global macro hedge funds, who trade currencies as well as
other markets• Retail Traders (Trading platforms)• JGAM

Trading Strategies
• Simple transaction (FX account)• Leverage (options-loans-
platforms)• Fundamental (long term)• Technical analysis (short term)• Hedging

Technical analysis
When under stress, your instincts take over and you are governed by factors such as fear, hope, greed, confidence and orthodox beliefs
Thus, markets often collapse in much the same manner because investors react to the same stress factors.
This explains why patterns are used in a technical analysis.

Important tools
• 50/100/200 days moving average• Fibonacci – Extension/Retracement• High and Low points

The EUROSource: BCA

Cyprus – A game changer?
• Cyprus GDP 0.20% of total Eurozone (USD 25 billion)• Cyprus banks 8X GDP (Iceland 2008 10X)• Officially 30-40% (probably much more) of deposits come
from non-residents (Russians)• Tiny Cyprus is the biggest foreign investor in the Russian
economy!• End of Cyprus business model!

Eurozone alphabet soup!

ECB alphabet soup - explained!
• EFSF = European Financial Stability Facility created 2010 EUR 440 Billion
• EFSM = European Financial Stabilisation Mechanism created 2010 – EUR 60 billion
• SMP = Securities Markets Programme – ECB purchase in secondary bond markets – discontinued 2012 now OMT
• ESM = European Stability Mechanism created 2012 EUR 500 Billion
• LTRO = Long-Term Refinancing Operations existed since 1999 but Mario Draghi introduced 3 year lending in 2011 EUR 489 Billion in 2012 EUR 529 Billion
• OMT = Outright Monetary Transacions 2012 – ECB purchase secondary sovereign bond markets

America INC (USD)
• 1981-1984 USD trade weighted 80-120 (+50%)
• 1994-2000 USD trade weighted 77-110 (+43%)
• Another major revaluation in USD – NO!
• In 1981 and 1994 US had a current account surplus, high interest rates and an under valued currency (based on PPP)
• Today current account deficit, low interest rates and a fairly valued currency

Path to a weaker USD
• Fed’s open-ended QE will crowd out foreign buyers
• Falling real interest rates
• Increasing current account deficits
• Less important as a reserve currency
• Cheap Eurozone equities and higher yields attract capital inflows (when risk of common currency falling apart dissipates)

How did JGAM invest in previous years
• In 2009 we hit corporate bonds spot on– We entered the year 40% in cash and within few months we were significantly into
undervalued corporate bonds
• In 2010 we swapped into stocks– Economies were improving after the 2008 crisis, stock markets rallied and we took the
profit on corporate bonds and swapped into stocks
• In 2011 we rushed for shelter– The euro crisis took off, stock markets crashed and we looked for shelter outside the
eurozone and the euro, favoring gold and solid dividend paying global stocks
• In 2012 we have been riding the “equity wave”– Stock markets have rallied on the back of aggressive monetary policies in most major
economies except the eurozone– We have been heavily exposed to stock markets except in Europe– However, in July we reduced risk exposure, awaiting an opportunity to enter the
undervalued European market

• Focus on medium term outlook– Economic momentum; improving– Liquidity; still favorable– Valuation; favor stocks
• Equities – overweight with Emerging Market exposure
• Corporate bonds for diversification

Asset allocation and diversification
• Top-down investment decision process• Time horizon
– Short term; 0-3 months, market sentiments, 10%– Medium term; 3-12 months, (three indicators), 60%
• Valuation; what asset classes/sectors/regions are over-/under-valued?• Liquidity; free liquidity available for investments in financial assets• Economic momentum; the business cycle, growth and output gap
– Long term; 1-5 years, structural fundamentals, 30%
Ole, Lars and Peter – the portfolio managers
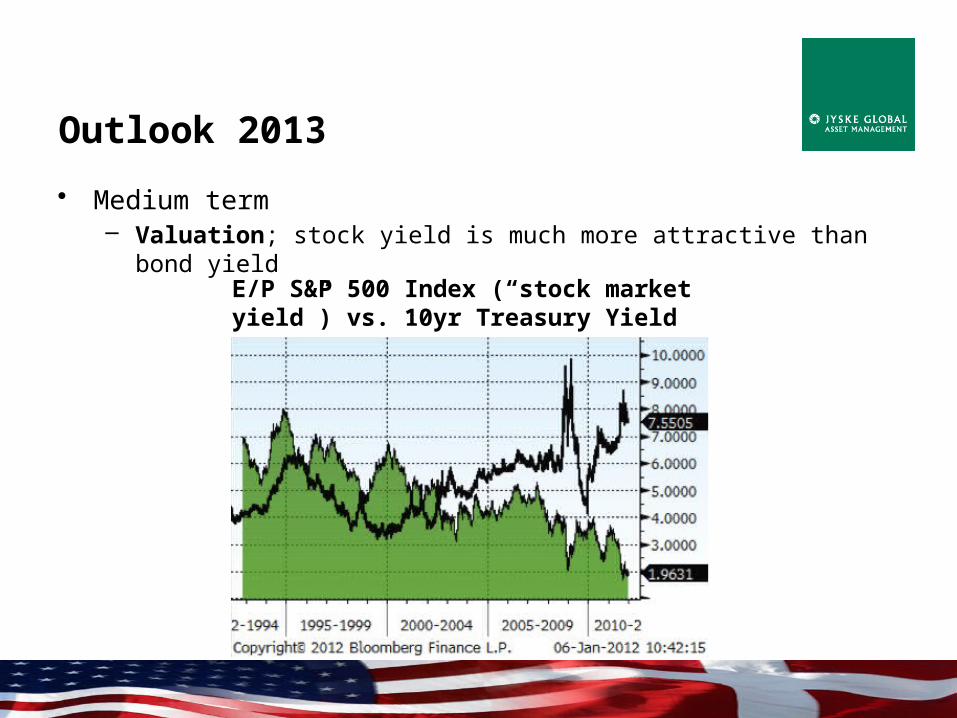
Outlook 2013
• Medium term– Valuation; stock yield is much more attractive than bond yield
E/P S&P 500 Index (“stock market yield”) vs. 10yr Treasury Yield

Outlook 2013
• Medium term– Liquidity
• aggressive central banks -> excess money + deleveraging and excess capacity -> flow into financial assets ->
• risk-on = equities and EM
• risk-off = bonds and gold
Source: Gold Switzerland

PortfolioYear
Unleveraged IRA Benchmark ex fee
Return Risk Return Risk Return Risk
2009 18.3% 8.4% 12.3% 6.2% 24.7% 6.5%*
2010 7.4% 9.4% 6.6% 9.2% 7.9% 8.6%
2011 -1.3% 7.9% -1.0% 7.4% 4.0% 5.8%
2012 8.1% 5.4% 8.4% 5.5% 3.3% 4.0%
Accumulated 2009-12 35.6% 28.5% 44.4%
Average p.a. 2009-12 7.9% 7.9% 6.5% 7.3% 9.6% 6.2%
Low Risk Portfolio

Medium Risk Portfolios
PortfolioYear
Unleveraged IRA Leveraged (LRx1) Benchmark ex fee
Return Risk Return Risk Return Risk Return Risk
2009 23.2% 11.2% 16.9% 6.6% 32.4% 10.2% 28.1% 6.5%*
2010 10.3% 12.8% 8.4% 12.7% 6.8% 13.0% 9.9% 13.2%
2011 -4.8% 9.2% -4.9% 9.0% -5.5% 11.3% -0.3% 9.6%
2012 11.2% 9.1% 10.0% 8.4% 9.2% 6.6% 7.7% 7.0%
Accumulated 2009-12 43.8% 32.6% 46.0% 51.2%
Average p.a. 2009-12 9.5% 10.7% 7.3% 9.8% 9.9% 10.8% 10.9% 9.8%

High Risk Portfolios
PortfolioYear
Unleveraged IRA Leveraged (LRx2) Leveraged (MRx1)
Benchmark ex fee
Return
Risk Return Risk Return Risk Return
Risk Return
Risk
2009 27.9% 15.5% 31.4% na. 44.5% na. 28.6% 14.9% 32.3% 8.5%*
2010 8.0% 17.1% 7.2% 20.7% 5.8% 19.2% 12.3% 20.5% 11.6% 16.4%
2011 -8.6% 11.5% -9.4% 11.5% -10.9% 16.3% 13.9% 14.6% -4.7% 14.6%
2012 12.4% 11.0% 12.4% 11.0% 8.9% 10.8% 12.0% 11.4% 12.1% 10.9%
Accum. 2009-12 42.0% 43.5% 48.3% 39.3% 57.7%
Avg. p.a. 2009-12
9.2% 14.0% 9.4% 14.0%** 10.3% 15.6%** 8.6% 15.8% 12.1% 13.5%

Investing should be more like watching paint dry or watching grass grow. If you want excitement, take $800 and go to Las Vegas.Paul Samuelson - Economist
Finally, a good advice

ProductsAn overview
• Managed Accounts (Discretionary Portfolio Management)
• Advisory Account (non-Discretionary)
• IRA pension plans
• Leveraged investments
• Minimum funds
Risk Profiles
Horizonin years
Low RiskMedium RiskHigh RiskSpeculative
+3+5+7+10
AUM
200t USD Managed Account1m USD Advisory Account
• Client segmentation

ProductsMore details
• Managed Accounts (Discretionary Portfolio Management)– No restrictions on securities– Minimum 200t USD
• Advisory Account (non-discretionary)– Restrictions on non U.S. securities and choice of broker– Minimum 1m USD
• IRA pension plans– Downscale of risk and no leverage
• Leveraged investments – Minimum medium risk profile

JGAM setup options
• Personal accounts• Company accounts• Trusts• Foundations• IRA
Bente, Carsten, Thomas and Henrik – the relationship managers

Fee based only
AUM interval Fee
Up to 500t USD 2.00%
500t – 1m USD 1.50%
1m – 5 m USD 1.00%
Above 5 m USD 0.75%
Competitors
2.02%
1.84%
0.92%
NA*
Analysis based on PriceMetrix North America database representing 15,000 advisors, 2.3 mill. investors and over USD 850 bn in investment assets.PriceMetrix, Spring 2011.
* Swiss banks typically have a minimum fee of +3,000 USD, required minimum investable assets of +2 mill. USD and higher fees.
No performance fees and no bonuses.
JGAM believe they create wrong incentives.

Hard facts per 31 December 2012
• 2.1bn DKK (365m USD) under management• 437 clients• 31m DKK (5.3m USD) equity capital• 72% solvency ratio• 10 employees
Peter concentrated dealing or reading an analysis

Investment Committee members
Lars Stouge• Chairman• MSc and MBA • Banking since 1990• Established JGAM 2008
Thomas Fischer• Deputy chairman• MBA• Banking since 1975• Joined JGAM 2008
Ole Stig Helland• Senior Portfolio Manager• BA• Banking since 1992• Joined JGAM 2008
Peter Conradsen• Senior Portfolio Manager• BA• Banking since 1991• Joined JGAM 2008


1. Unique global investments for US investors
2. Get your own experienced asset manager
3. Your regulated and transparent offshore partner

History
• Subsidiary of Jyske Bank
• Danish FSA approval 8 February 2008
• SEC Investment Adviser24 March 2008
• Operations started 1 April 2008
• Danish FSA inspection June 2009
Providing advise on securities using
U.S. “interstate commerce” requires to register with the SEC
cf. The Securities Act of 1933 and The Investment Adviser Act of
1940.

Research and trading partners

JGAM publications
• All JGAM’s investment decisions and analysis are documented in various publications, published on JGAM’s homepage www.jgam.com
• Market Update - Weekly memo summing up major financial events
• Portfolio Update - Summarizing changes in the Asset Allocation portfolios
• Asset Allocation Strategy – Details of the Asset Allocation portfolios
• Investment Recommendations - Investment cases for Advisory clients
• Editors’ corner - Memos on economic and financial topics


Strong Danish banks in EU stress test
• New capital requirement of 9% (before 7%)
• Major Danish banks show strong resilience in EU stress tests (European Banking Authority’s test)
• Jyske Bank’s core capital is 13.8% and was never below 12.3% in the stress test

Denmark
• Trade balance surplus• Low unemployment• Highly regulated banking industry• Active democracy (voting participation +85%)• Least corrupt nation, 2008 and 2010• Member of EU but not part of the euro

5 easy steps to become a client
1. Complete custodian bank application forms
2. Choose JGAM investment product
3. Sign JGAM contracts
4. Wire transfer funds
5. Go!

Relationship Management Team
Carsten Brandt – Vice President• Financial Services since 1986• Joined JGAM 2008
Bente Larnkjær – Vice President• Financial Services since 1976• Joined JGAM 2008
Thomas Fischer – Senior Vice President• Financial Services since 1975• Joined JGAM 2008
Henrik Tjott Villumsen – Vice President• Financial Services since 1999• Joined JGAM 2008

Documents
Initial package• Investment profile questionnaire• General Business Conditions• Form ADV Part 2A (Brochure)• Custodian Bank forms
Package when account is established• Managed and/or Advisory Agreement• General Client Agreement• Other documents
See legal documents on jgam.com/terms

Compliance & Administration
Susanne Bisballe – Administration Manager• Joined JGAM 2008
Connie Jepsen – Administration Manager• Joined JGAM 2008
Bjarne Fibiger – Chief Compliance Officer• Joined JGAM 2008

E-mail: [email protected]
Phone: +45 8989 5900
Free-call: 1-866-602-5426
Fax: +45 8989 5901
Website: www.jgam.com
Contact details
Jyske Global Asset Management
JGAM
H.C. Andersens Boulevard 11
1553 Copenhagen V
Denmark
JGAM – What’s in it for you!
1. Unique global investments for US investors2. Get your own experienced asset manager3. Your regulated and transparent offshore partner

DisclaimerImportant Disclosures
Owned by Jyske BankJyske Global Asset Management Fondsmaeglerselskab A/S, in short JGAM or Jyske Global Asset Management, business registration number (CVR-nr.) 30359038 is fully owned by Jyske Bank A/S, business registration number (CVR-nr.) 17616617. JGAM has an independent Board of Directors.
Registration and supervisionJyske Global Asset Management is a Danish registered company under supervision of the Danish Financial Supervisory Authority and a Registered Investment Adviser with the Securities and Exchange Commission in the United States. Registration with the SEC does not signify in any manner whatsoever that an adviser is sponsored, recommended, or approved, or that its abilities or qualifications have in any respect been passed upon, by the SEC or by any other agency of the United States or any officer thereof.
Past performance and fluctuationsThe price of and return on securities, commodities, currencies etc. may fall as well as rise. Past performance is not a guide to the future, and investors may not get back the full amount invested. The price of emerging-market bonds and equities can be extremely volatile. Where an investment is denominated in a currency other than the investor's base currency, the investor must be warned that changes in rates of exchange may have an adverse effect on the value and price of or return on an investment.
Performance figuresAny reference to performance figures on JGAM’s managed portfolios may be based on JGAM’s Model Portfolio Tracker and are calculated by including dividends and other earnings. The performance figures do not necessarily reflect results of actual funds invested, but shows theoretical results. Any quoted performance figures could be before trading costs and management fee, which will differ depending on the client. Please visit www.jgam.com/terms for further legal information.