
Fabio v Diversified Consultants Inc Diversified Credit Preliminary Pretrial Conference Order

Diversified global provider of leading engineered technologies to the energy, environmental, and industrial markets
2
Notes to Investors
Any statements contained in this presentation other than statements of historical fact, including statements about management’s beliefs and expectations, are
forward-looking statements and should be evaluated as such. These statements are made on the basis of management’s views and assumptions regarding
future events and business performance. Words such as “estimate,” “believe,” “anticipate,” “expect,” “intend,” “plan,” “target,” “project,” “should,” “may,” “will”
and similar expressions are intended to identify forward-looking statements. Forward-looking statements (including oral representations) involve risks and
uncertainties that may cause actual results to differ materially from any future results, performance or achievements expressed or implied by such statements.
These risks and uncertainties include, but are not limited to: our ability to successfully integrate acquired businesses and realize the synergies from
acquisitions, as well as a number of factors related to our business including economic and financial market conditions generally and economic conditions in
CECO’s service areas; dependence on fixed price contracts and the risks associated therewith, including actual costs exceeding estimates and method of
accounting for contract revenue; fluctuations in operating results from period to period due to seasonality of the business; the effect of growth on CECO’s
infrastructure, resources, and existing sales; the ability to expand operations in both new and existing markets; the potential for contract delay or cancellation;
changes in or developments with respect to any litigation or investigation; the potential for fluctuations in prices for manufactured components and raw
materials; the substantial amount of debt incurred in connection with our recent acquisitions and our ability to repay or refinance it or incur additional debt in the
future; the impact of federal, state or local government regulations; economic and political conditions generally; and the effect of competition in the product
recovery, air pollution control and fluid handling and filtration industries. These and other risks and uncertainties are discussed in more detail in CECO’s filings
with the Securities and Exchange Commission, including our reports on Form 10-K and Form 10-Q. Many of these risks are beyond management’s ability to
control or predict. Should one or more of these risks or uncertainties materialize, or should the assumptions prove incorrect, actual results may vary in material
aspects from those currently anticipated. Investors are cautioned not to place undue reliance on such forward-looking statements as they speak only to our
views as of the date the statement is made. All forward-looking statements attributable to CECO or persons acting on behalf of CECO are expressly qualified
in their entirety by the cautionary statements and risk factors contained in this presentation and CECO’s respective filings with the Securities and Exchange
Commission. Furthermore, forward-looking statements speak only as of the date they are made. Except as required under the federal securities laws or the
rules and regulations of the Securities and Exchange Commission, CECO undertakes no obligation to update or review any forward-looking statements,
whether as a result of new information, future events or otherwise.
While CECO reports its results in accordance with generally accepted accounting principles in the U.S. (GAAP), comments made during this conference call
and these materials will include the following "non-GAAP" measures: Non-GAAP gross margin, non-GAAP operating income, non-GAAP net income, adjusted
EBITDA, non-GAAP gross profit margin, non-GAAP operating margin, non-GAAP earnings per basic and diluted share, and selected measures expressed on
a constant currency basis. These measures are included to provide additional useful information regarding CECO’s financial results and are not a substitute for
their comparable GAAP measures. Explanations of these non-GAAP measures and reconciliations of these non-GAAP measures to their directly comparable
GAAP measures are included in the accompanying "Supplementary Non-GAAP Materials." Descriptions of many of these non-GAAP measures are also
included in CECO’s SEC reports.
Forward-Looking Statements and Non-GAAP Information

3
CECO at a Glance
Exchange: Nasdaq
Ticker: CECE
Share Price : $9.30
Market Cap : $320M
Dividend Yield: 2.8%
• Market Leader with Clear Competitive Advantage
o Critical integrated technology solutions to diverse global industrial manufacturing, natural gas power & midstream gas pipeline markets
o Industry-leading technologies & respected brands o Long history of performance, reliability, flawless execution & timely delivery
• Broad end market exposure
o Including natural gas turbine power, refineries & petrochemical plants & midstream gas pipelines
• Diversified product base
o Engineered solutions & technologies (~73%) and aftermarket services & parts (~27%)
• Strategically balanced global footprint
o ~60% of sales in U.S. & ~40% outside the U.S.
• Well positioned to capitalize on:
o $5BN global installed base driving aftermarket revenues at favorable margins o increasing global demand for natural gas power generation o increasing regulations & demand for cleaner, environmentally friendly power
generation o increases in industrial capital spending & growth in Asia
• Attractive asset-light business model
4
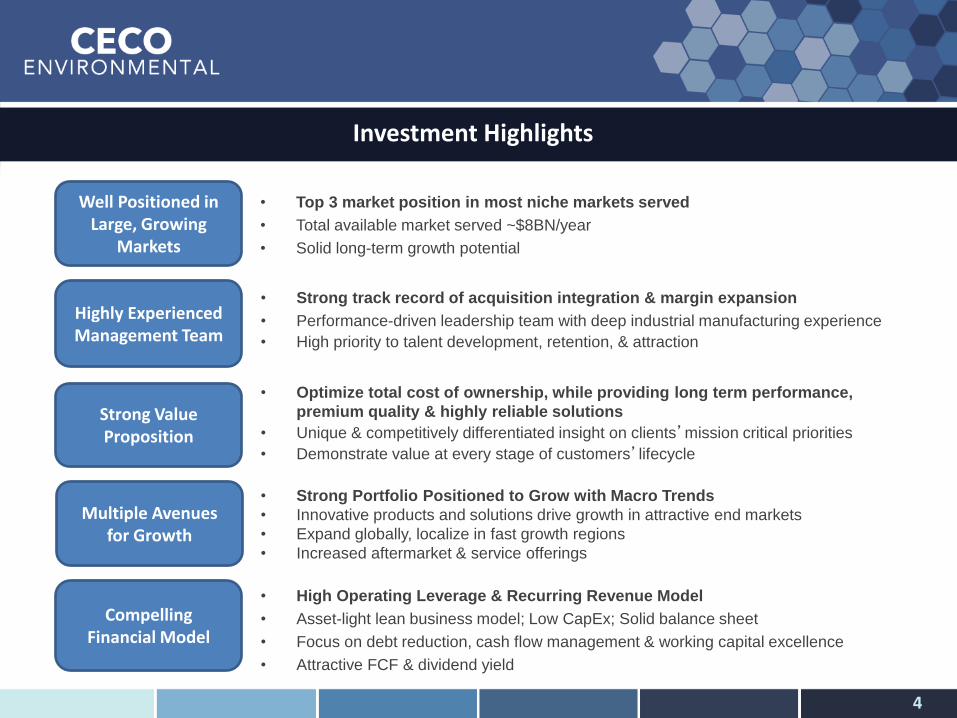
Investment Highlights
• Top 3 market position in most niche markets served
• Total available market served ~$8BN/year
• Solid long-term growth potential
Well Positioned in Large, Growing
Markets
• Strong track record of acquisition integration & margin expansion
• Performance-driven leadership team with deep industrial manufacturing experience
• High priority to talent development, retention, & attraction
Highly Experienced Management Team
• Optimize total cost of ownership, while providing long term performance,
premium quality & highly reliable solutions
• Unique & competitively differentiated insight on clients’mission critical priorities
• Demonstrate value at every stage of customers’lifecycle
Strong Value Proposition
• Strong Portfolio Positioned to Grow with Macro Trends
• Innovative products and solutions drive growth in attractive end markets
• Expand globally, localize in fast growth regions
• Increased aftermarket & service offerings
Multiple Avenues for Growth
• High Operating Leverage & Recurring Revenue Model
• Asset-light lean business model; Low CapEx; Solid balance sheet
• Focus on debt reduction, cash flow management & working capital excellence
• Attractive FCF & dividend yield
Compelling Financial Model
5
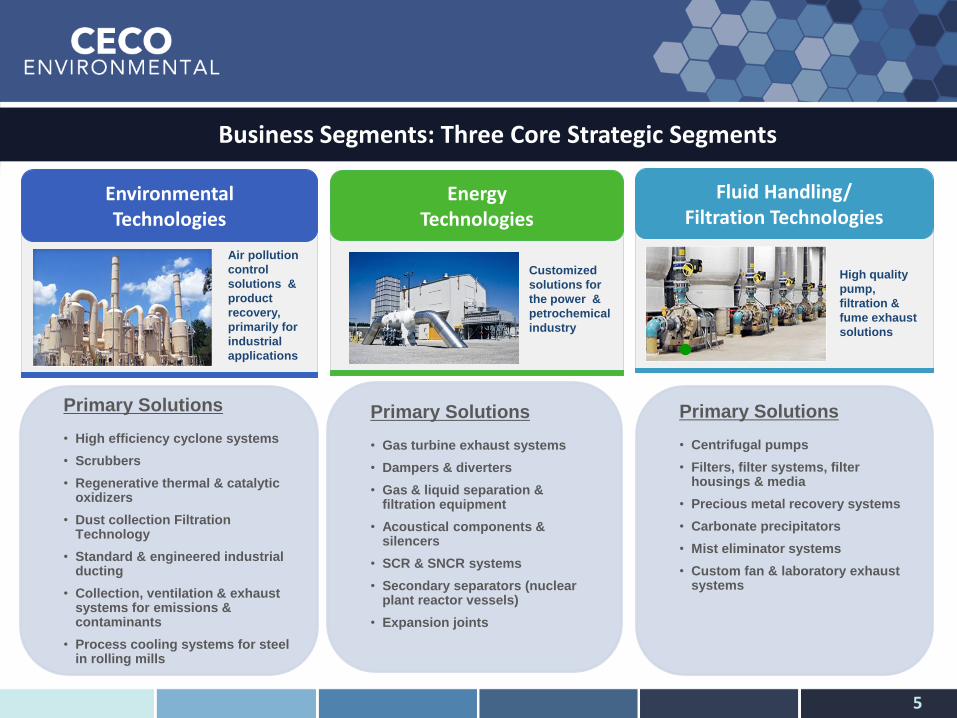
Business Segments: Three Core Strategic Segments
Environmental Technologies
Air pollution
control
solutions &
product
recovery,
primarily for
industrial
applications
Energy Technologies
Customized
solutions for
the power &
petrochemical
industry
Fluid Handling/ Filtration Technologies
High quality
pump,
filtration &
fume exhaust
solutions
Primary Solutions
• High efficiency cyclone systems
• Scrubbers
• Regenerative thermal & catalytic oxidizers
• Dust collection Filtration Technology
• Standard & engineered industrial ducting
• Collection, ventilation & exhaust systems for emissions & contaminants
• Process cooling systems for steel in rolling mills
Primary Solutions
• Gas turbine exhaust systems
• Dampers & diverters
• Gas & liquid separation & filtration equipment
• Acoustical components & silencers
• SCR & SNCR systems
• Secondary separators (nuclear plant reactor vessels)
• Expansion joints
Primary Solutions
• Centrifugal pumps
• Filters, filter systems, filter housings & media
• Precious metal recovery systems
• Carbonate precipitators
• Mist eliminator systems
• Custom fan & laboratory exhaust systems

6
CECO Strategies – Strong Long-Term Growth Potential
Environmental Technologies Segment
• Help customers meet or exceed total air pollution control requirements by integrating the most efficient technology solutions (OneCECO) that operate reliably throughout an asset’s lifecycle
• Est. TAMS: $2.8 B
• Est. 5-year Market CAGR: 5%
• CECO Est. Market Share: 7%
• Significant upside potential
Energy Technologies Segment
• Provide integrated emission management systems (OneCECO) downstream of natural gas turbines as preferred supplier of world’s largest turbine manufacturers & end-users
• Provide quality compression & separation solutions as preferred supplier to midstream gas pipelines
• Est. TAMS: $3.7 B
• Est. 5-year Market CAGR: 4.5%
• CECO Est. Market Share: 5%
• Significant upside potential
Fluid Handling & Filtration Technologies Segment
• Offer unique mix of premium, mission critical fluid handling & filtration technologies to diverse industrial markets, including chemical, commercial & process industries
• Solutions include centrifugal pumps for corrosive, abrasive & high-temperature liquids; industrial filtration; & laboratory fume exhaust systems
• Est. TAMS: $1.6 B
• Est. 5-year Market CAGR: 3.5%
• CECO Est. Market Share: 4.5%
• Significant upside potential
TAMS= Total Available Market Served Data Sources: BCC Research, McIlvaine Company, European Industrial Forecasting Ltd., IBISWorld, International Energy Agency, Pipeline and Gas Journal, and internal studies
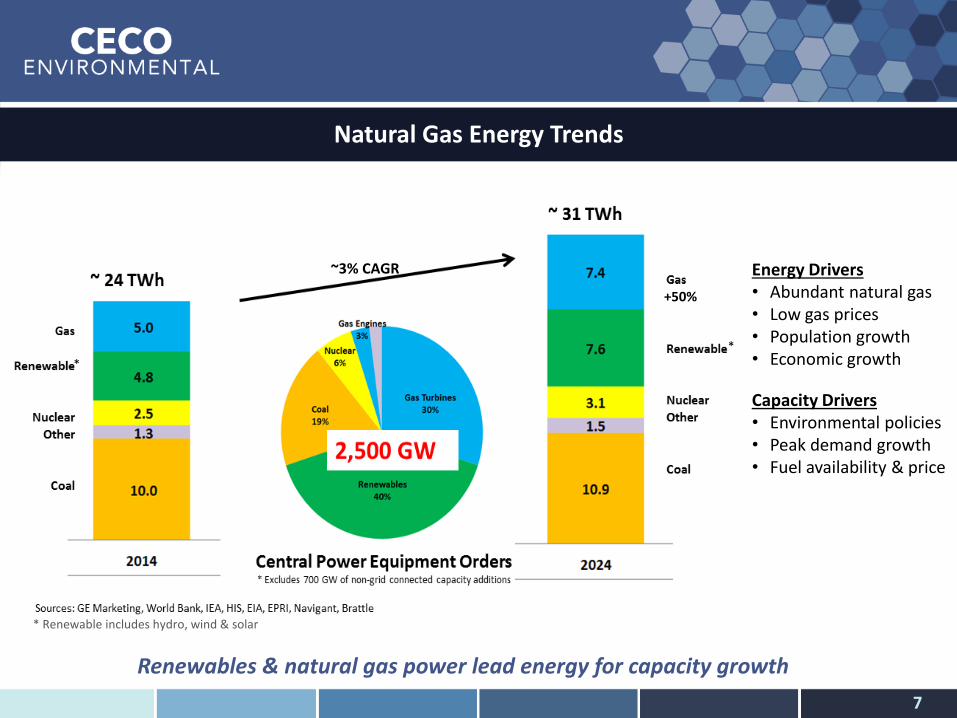
Energy Drivers • Abundant natural gas • Low gas prices • Population growth • Economic growth
Capacity Drivers • Environmental policies • Peak demand growth • Fuel availability & price
Natural Gas Energy Trends
7
Renewables & natural gas power lead energy for capacity growth
~3% CAGR
+50%
*
*
* Renewable includes hydro, wind & solar
8
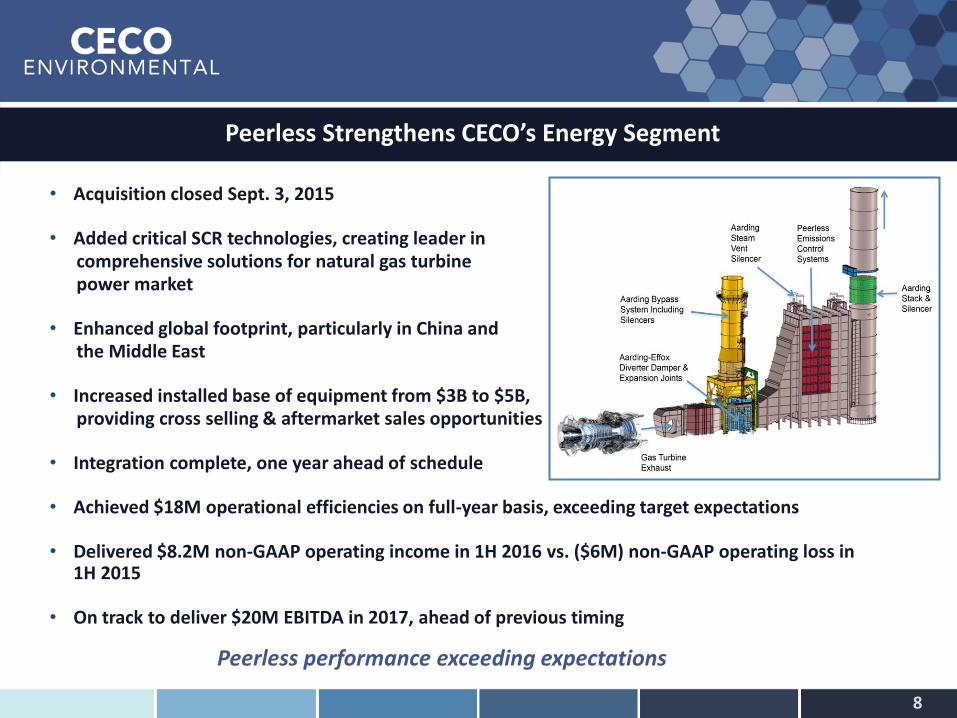
Peerless Strengthens CECO’s Energy Segment
• Acquisition closed Sept. 3, 2015 • Added critical SCR technologies, creating leader in comprehensive solutions for natural gas turbine power market • Enhanced global footprint, particularly in China and the Middle East • Increased installed base of equipment from $3B to $5B, providing cross selling & aftermarket sales opportunities
• Integration complete, one year ahead of schedule
• Achieved $18M operational efficiencies on full-year basis, exceeding target expectations
• Delivered $8.2M non-GAAP operating income in 1H 2016 vs. ($6M) non-GAAP operating loss in
1H 2015
• On track to deliver $20M EBITDA in 2017, ahead of previous timing Peerless performance exceeding expectations
9
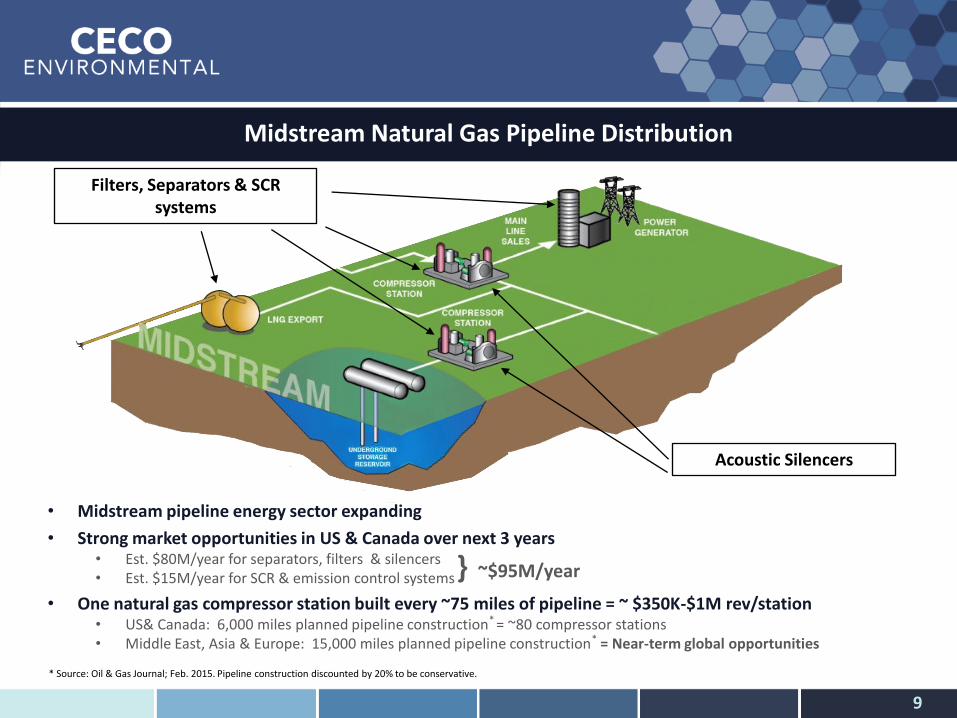
Midstream Natural Gas Pipeline Distribution
• Midstream pipeline energy sector expanding
• Strong market opportunities in US & Canada over next 3 years • Est. $80M/year for separators, filters & silencers • Est. $15M/year for SCR & emission control systems
• One natural gas compressor station built every ~75 miles of pipeline = ~ $350K-$1M rev/station • US& Canada: 6,000 miles planned pipeline construction* = ~80 compressor stations • Middle East, Asia & Europe: 15,000 miles planned pipeline construction* = Near-term global opportunities
* Source: Oil & Gas Journal; Feb. 2015. Pipeline construction discounted by 20% to be conservative.
Filters, Separators & SCR systems
Acoustic Silencers
~$95M/year }

Revenue Diversification
10
Segment (YTD 2016)
Geography
Recurring Revenue
~27%
Original Equipment
~73% Industrial Mfg. ~32%
Chem/ Petrochem
Refinery ~25%
Natural Gas Power ~25%
Midstream Gas Pipeline
~10%
Solid Fuel Power
~8%
North America
~60%
EMEA ~25% (1)
Asia ~15%
(1) Europe, Middle East and Africa
Energy ~47%
Environ-mental ~38%
Fluid Handling/ Filtration
~15%
Strategic foundation to drive profitable growth through various cycles
Geography (YTD 2016)
End Markets (Fiscal 2015)
Recurring Revenue (YTD 2016)
11
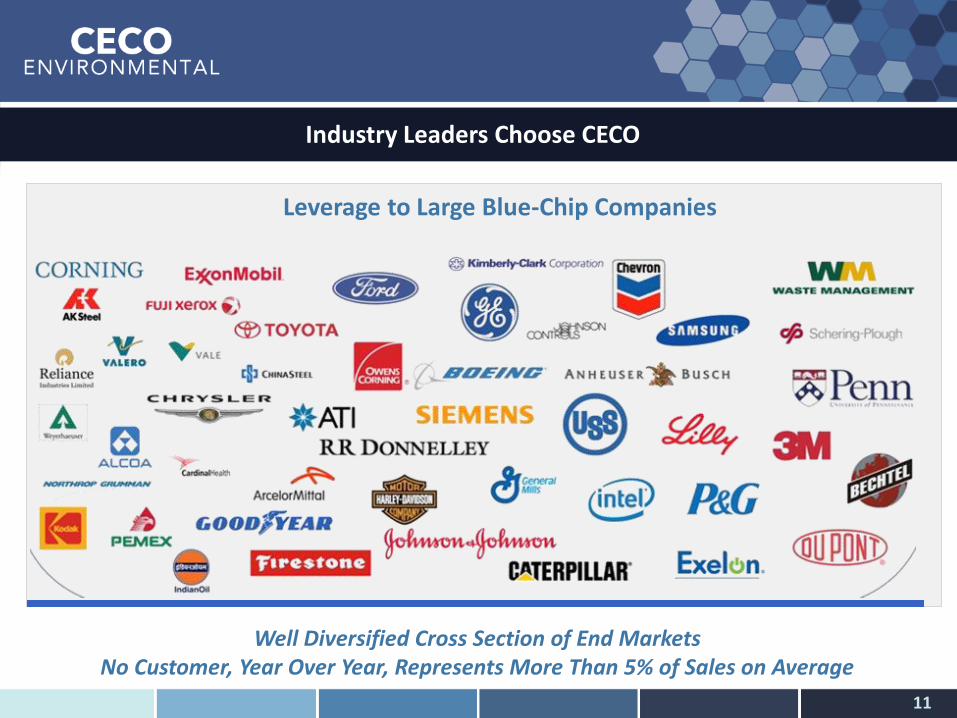
Industry Leaders Choose CECO
Well Diversified Cross Section of End Markets No Customer, Year Over Year, Represents More Than 5% of Sales on Average
Leverage to Large Blue-Chip Companies
12
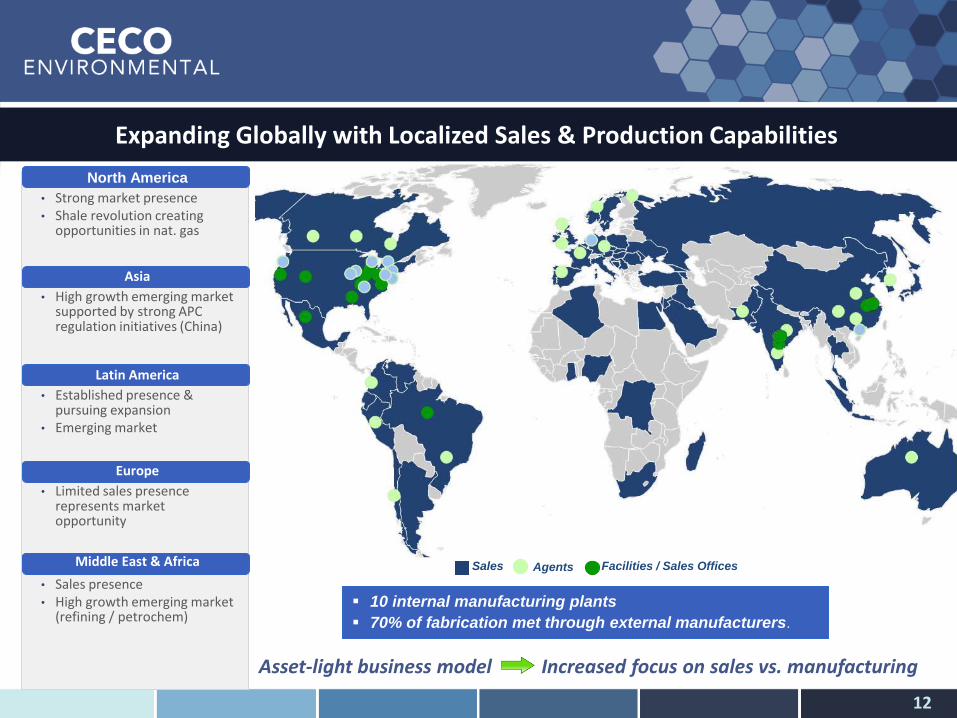
Expanding Globally with Localized Sales & Production Capabilities
Facilities / Sales Offices Agents Sales
North America
• Strong market presence • Shale revolution creating
opportunities in nat. gas
Asia
• High growth emerging market supported by strong APC regulation initiatives (China)
Latin America
• Established presence & pursuing expansion
• Emerging market
Europe
• Limited sales presence represents market opportunity
Middle East & Africa
• Sales presence • High growth emerging market
(refining / petrochem)
10 internal manufacturing plants
70% of fabrication met through external manufacturers.
Asset-light business model Increased focus on sales vs. manufacturing

Focused on Increasing Shareholder Value
• Grow market share and recurring revenue
• Pay down debt and reduce leverage ratio
• Margin expansion
• Improve free cash flow and working capital
• Monetize non-core assets
• Expand external strategic fabrication
13
Delivering on our commitments to drive shareholder value through top-line growth, margin expansion, free cash flow generation and debt pay down
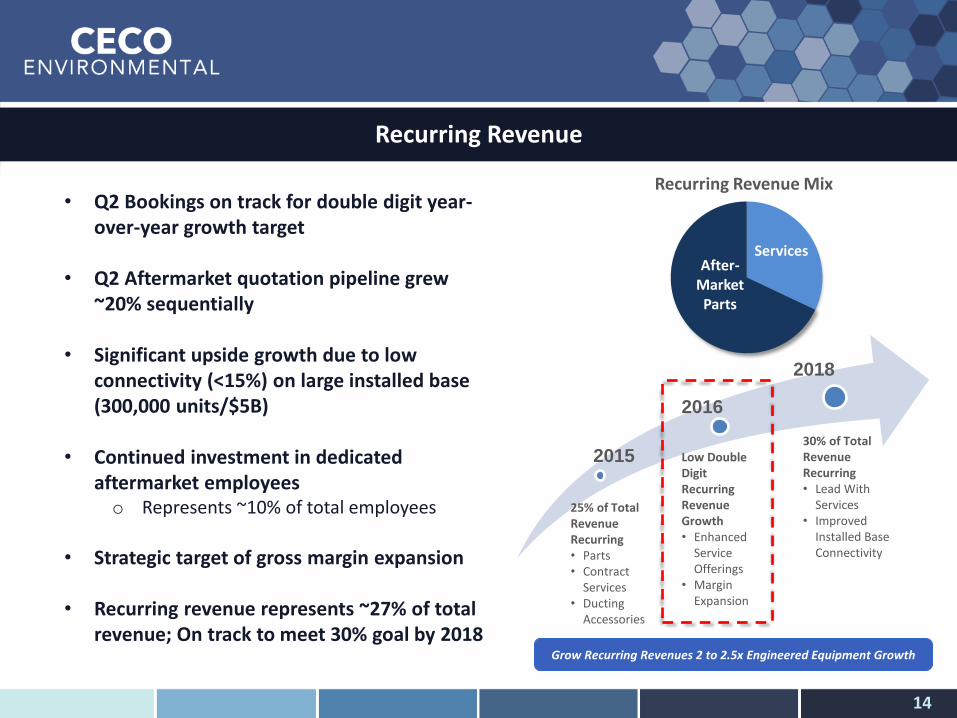
Recurring Revenue
Services After-
Market Parts
Recurring Revenue Mix
2015
2016
2018
Low Double Digit Recurring Revenue Growth • Enhanced
Service Offerings
• Margin Expansion
25% of Total Revenue Recurring • Parts • Contract
Services • Ducting
Accessories
30% of Total Revenue Recurring • Lead With
Services • Improved
Installed Base Connectivity
Grow Recurring Revenues 2 to 2.5x Engineered Equipment Growth
• Q2 Bookings on track for double digit year-over-year growth target
• Q2 Aftermarket quotation pipeline grew ~20% sequentially
• Significant upside growth due to low connectivity (<15%) on large installed base (300,000 units/$5B)
• Continued investment in dedicated aftermarket employees o Represents ~10% of total employees
• Strategic target of gross margin expansion • Recurring revenue represents ~27% of total
revenue; On track to meet 30% goal by 2018
14
15
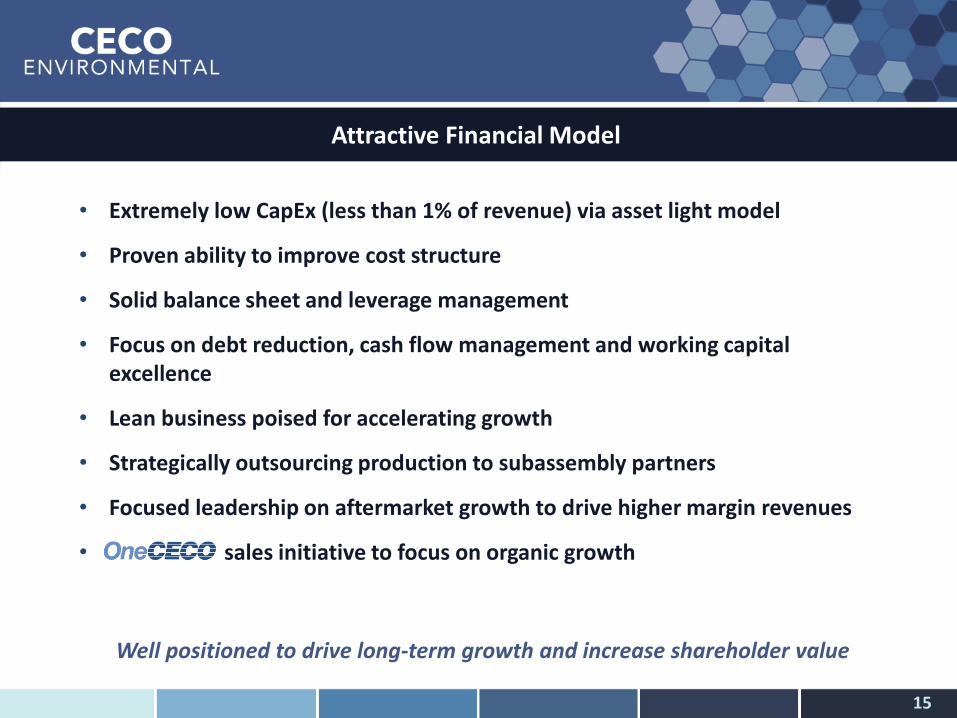
• Extremely low CapEx (less than 1% of revenue) via asset light model
• Proven ability to improve cost structure
• Solid balance sheet and leverage management
• Focus on debt reduction, cash flow management and working capital excellence
• Lean business poised for accelerating growth
• Strategically outsourcing production to subassembly partners
• Focused leadership on aftermarket growth to drive higher margin revenues
• sales initiative to focus on organic growth
Well positioned to drive long-term growth and increase shareholder value
Attractive Financial Model
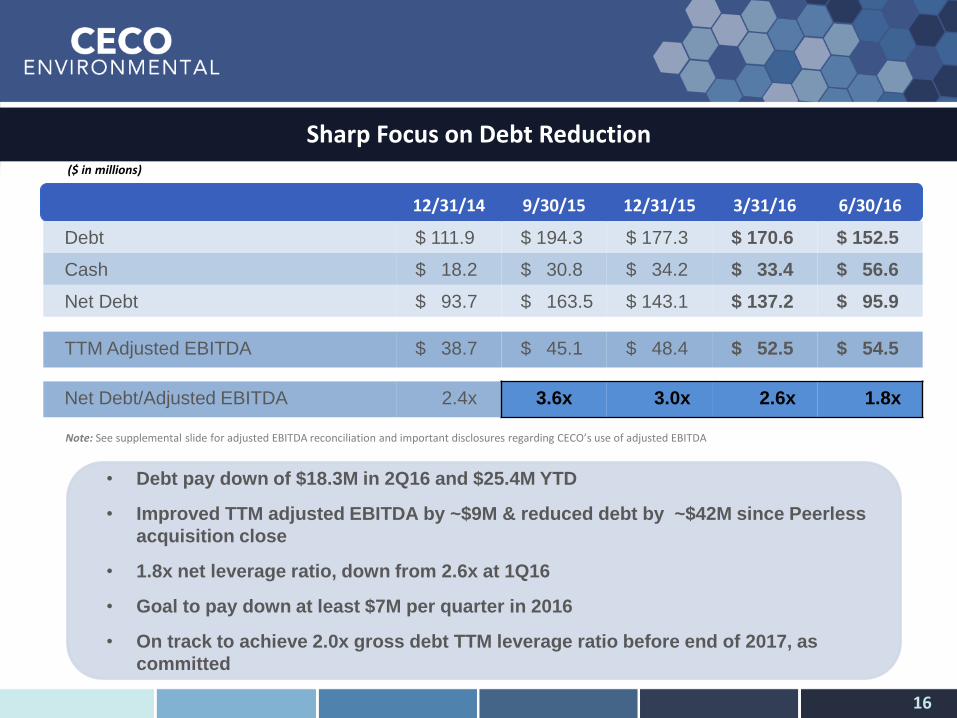
Sharp Focus on Debt Reduction
16
12/31/14 9/30/15 12/31/15 3/31/16 6/30/16
Debt $ 111.9 $ 194.3 $ 177.3 $ 170.6 $ 152.5
Cash $ 18.2 $ 30.8 $ 34.2 $ 33.4 $ 56.6
Net Debt $ 93.7 $ 163.5 $ 143.1 $ 137.2 $ 95.9
TTM Adjusted EBITDA $ 38.7 $ 45.1 $ 48.4 $ 52.5 $ 54.5
Net Debt/Adjusted EBITDA 2.4x 3.6x 3.0x 2.6x 1.8x
• Debt pay down of $18.3M in 2Q16 and $25.4M YTD
• Improved TTM adjusted EBITDA by ~$9M & reduced debt by ~$42M since Peerless
acquisition close
• 1.8x net leverage ratio, down from 2.6x at 1Q16
• Goal to pay down at least $7M per quarter in 2016
• On track to achieve 2.0x gross debt TTM leverage ratio before end of 2017, as
committed
Note: See supplemental slide for adjusted EBITDA reconciliation and important disclosures regarding CECO’s use of adjusted EBITDA
($ in millions)
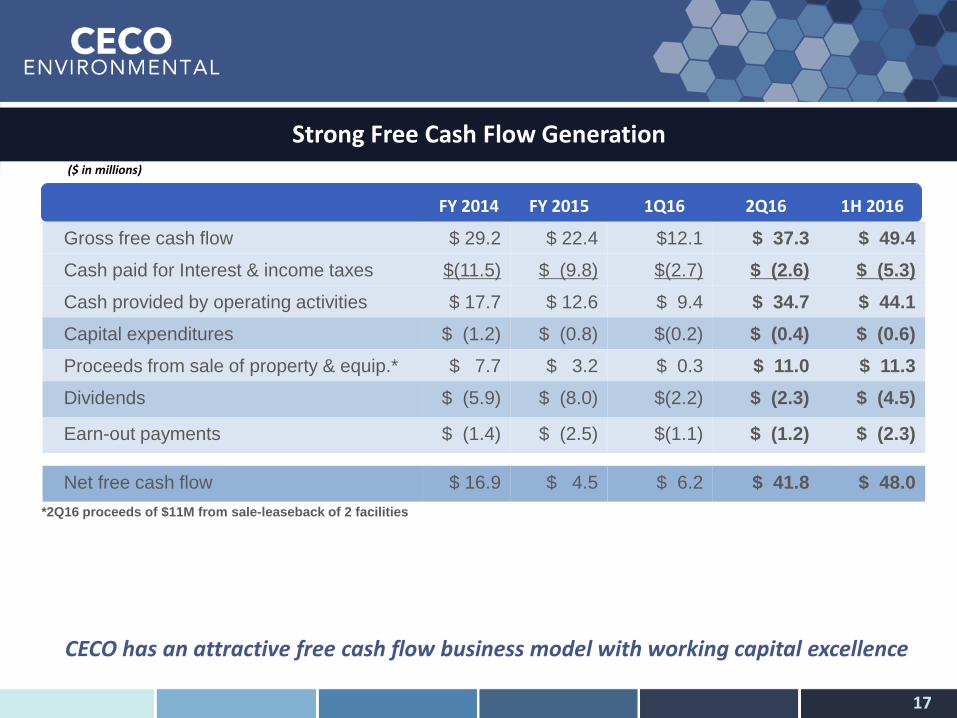
Strong Free Cash Flow Generation
17
FY 2014 FY 2015 1Q16 2Q16 1H 2016
Gross free cash flow $ 29.2 $ 22.4 $12.1 $ 37.3 $ 49.4
Cash paid for Interest & income taxes $(11.5) $ (9.8) $(2.7) $ (2.6) $ (5.3)
Cash provided by operating activities $ 17.7 $ 12.6 $ 9.4 $ 34.7 $ 44.1
Capital expenditures $ (1.2) $ (0.8) $(0.2) $ (0.4) $ (0.6)
Proceeds from sale of property & equip.* $ 7.7 $ 3.2 $ 0.3 $ 11.0 $ 11.3
Dividends $ (5.9) $ (8.0) $(2.2) $ (2.3) $ (4.5)
Earn-out payments $ (1.4) $ (2.5) $(1.1) $ (1.2) $ (2.3)
Net free cash flow $ 16.9 $ 4.5 $ 6.2 $ 41.8 $ 48.0
($ in millions)
*2Q16 proceeds of $11M from sale-leaseback of 2 facilities
CECO has an attractive free cash flow business model with working capital excellence
18
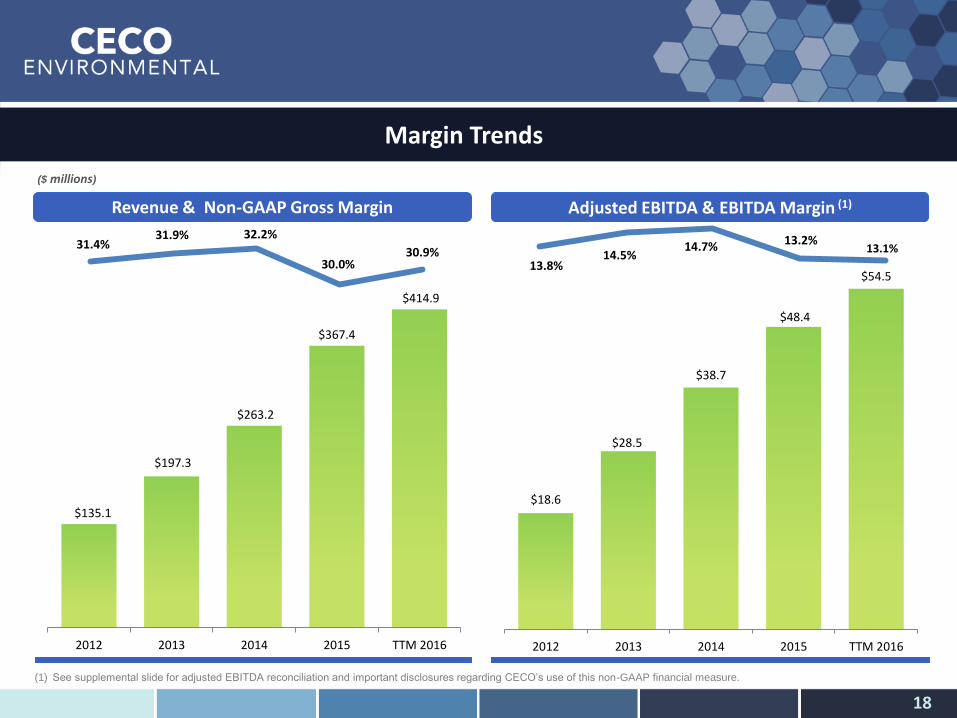
Margin Trends
Revenue & Non-GAAP Gross Margin
(1) See supplemental slide for adjusted EBITDA reconciliation and important disclosures regarding CECO’s use of this non-GAAP financial measure.
Adjusted EBITDA & EBITDA Margin (1)
$135.1
$197.3
$263.2
$367.4
$414.9
2012 2013 2014 2015 TTM 2016
$18.6
$28.5
$38.7
$48.4
$54.5
2012 2013 2014 2015 TTM 2016
13.8% 14.5%
14.7% 13.2% 13.1% 31.4%
31.9% 32.2%
30.0% 30.9%
($ millions)
19
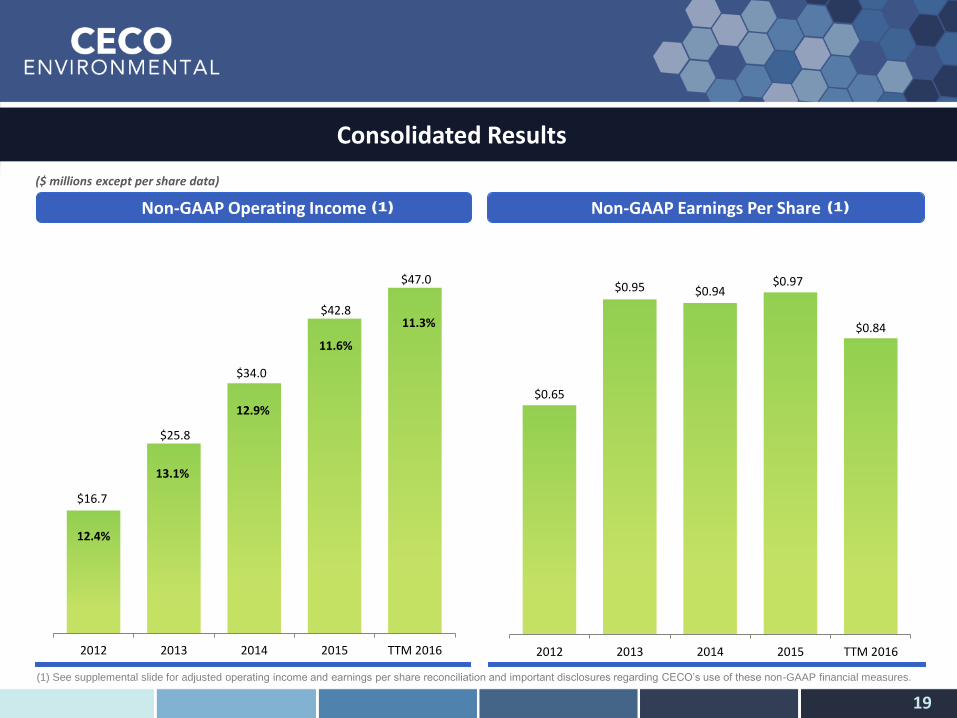
Consolidated Results
($ millions except per share data)
$16.7
$25.8
$34.0
$42.8
$47.0
12.4%
13.1%
12.9%
11.6%
11.3%
2012 2013 2014 2015 TTM 2016
$0.65
$0.95 $0.94 $0.97
$0.84
2012 2013 2014 2015 TTM 2016
Non-GAAP Operating Income Non-GAAP Earnings Per Share
(1) See supplemental slide for adjusted operating income and earnings per share reconciliation and important disclosures regarding CECO’s use of these non-GAAP financial measures.

20
Backlog & Bookings
($ in millions)
$59.5
$98.5
$140.1
$211.2
2012 2013 2014 2015 2Q16
$139.0
$196.6
$254.0
$361.1
2012 2013 2014 2015 TTM 2016
$418.0
Backlog Bookings
$224.7
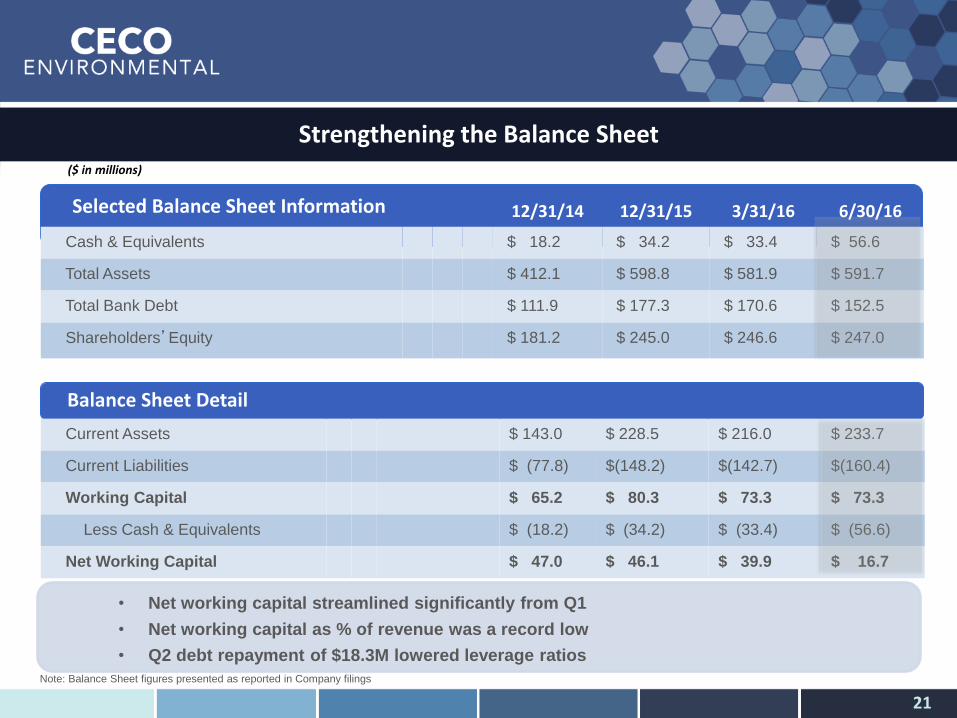
Strengthening the Balance Sheet
12/31/14 12/31/15 3/31/16 6/30/16
Cash & Equivalents $ 18.2 $ 34.2 $ 33.4 $ 56.6
Total Assets $ 412.1 $ 598.8 $ 581.9 $ 591.7
Total Bank Debt $ 111.9 $ 177.3 $ 170.6 $ 152.5
Shareholders’Equity $ 181.2 $ 245.0 $ 246.6 $ 247.0
Selected Balance Sheet Information
Note: Balance Sheet figures presented as reported in Company filings
Balance Sheet Detail
Current Assets $ 143.0 $ 228.5 $ 216.0 $ 233.7
Current Liabilities $ (77.8) $(148.2) $(142.7) $(160.4)
Working Capital $ 65.2 $ 80.3 $ 73.3 $ 73.3
Less Cash & Equivalents $ (18.2) $ (34.2) $ (33.4) $ (56.6)
Net Working Capital $ 47.0 $ 46.1 $ 39.9 $ 16.7
• Net working capital streamlined significantly from Q1
• Net working capital as % of revenue was a record low
• Q2 debt repayment of $18.3M lowered leverage ratios
21
($ in millions)
Supplementary Non-GAAP Materials
22
Notes to Investors
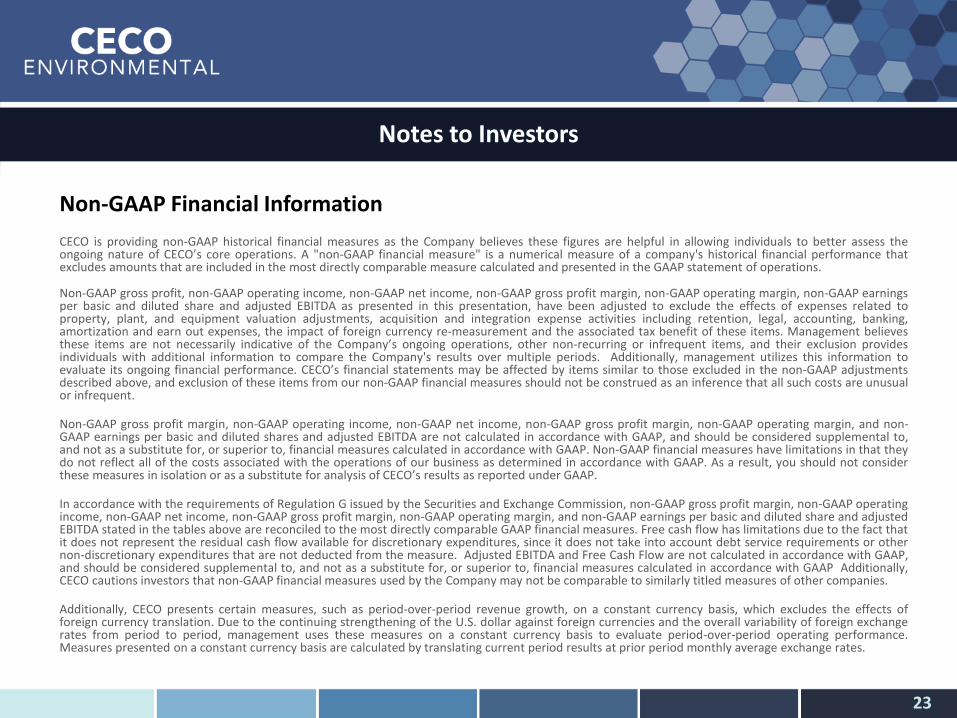
CECO is providing non-GAAP historical financial measures as the Company believes these figures are helpful in allowing individuals to better assess the ongoing nature of CECO’s core operations. A "non-GAAP financial measure" is a numerical measure of a company's historical financial performance that excludes amounts that are included in the most directly comparable measure calculated and presented in the GAAP statement of operations.
Non-GAAP gross profit, non-GAAP operating income, non-GAAP net income, non-GAAP gross profit margin, non-GAAP operating margin, non-GAAP earnings per basic and diluted share and adjusted EBITDA as presented in this presentation, have been adjusted to exclude the effects of expenses related to property, plant, and equipment valuation adjustments, acquisition and integration expense activities including retention, legal, accounting, banking, amortization and earn out expenses, the impact of foreign currency re-measurement and the associated tax benefit of these items. Management believes these items are not necessarily indicative of the Company’s ongoing operations, other non-recurring or infrequent items, and their exclusion provides individuals with additional information to compare the Company's results over multiple periods. Additionally, management utilizes this information to evaluate its ongoing financial performance. CECO’s financial statements may be affected by items similar to those excluded in the non-GAAP adjustments described above, and exclusion of these items from our non-GAAP financial measures should not be construed as an inference that all such costs are unusual or infrequent.
Non-GAAP gross profit margin, non-GAAP operating income, non-GAAP net income, non-GAAP gross profit margin, non-GAAP operating margin, and non-GAAP earnings per basic and diluted shares and adjusted EBITDA are not calculated in accordance with GAAP, and should be considered supplemental to, and not as a substitute for, or superior to, financial measures calculated in accordance with GAAP. Non-GAAP financial measures have limitations in that they do not reflect all of the costs associated with the operations of our business as determined in accordance with GAAP. As a result, you should not consider these measures in isolation or as a substitute for analysis of CECO’s results as reported under GAAP.
In accordance with the requirements of Regulation G issued by the Securities and Exchange Commission, non-GAAP gross profit margin, non-GAAP operating income, non-GAAP net income, non-GAAP gross profit margin, non-GAAP operating margin, and non-GAAP earnings per basic and diluted share and adjusted EBITDA stated in the tables above are reconciled to the most directly comparable GAAP financial measures. Free cash flow has limitations due to the fact that it does not represent the residual cash flow available for discretionary expenditures, since it does not take into account debt service requirements or other non-discretionary expenditures that are not deducted from the measure. Adjusted EBITDA and Free Cash Flow are not calculated in accordance with GAAP, and should be considered supplemental to, and not as a substitute for, or superior to, financial measures calculated in accordance with GAAP Additionally, CECO cautions investors that non-GAAP financial measures used by the Company may not be comparable to similarly titled measures of other companies. Additionally, CECO presents certain measures, such as period-over-period revenue growth, on a constant currency basis, which excludes the effects of foreign currency translation. Due to the continuing strengthening of the U.S. dollar against foreign currencies and the overall variability of foreign exchange rates from period to period, management uses these measures on a constant currency basis to evaluate period-over-period operating performance. Measures presented on a constant currency basis are calculated by translating current period results at prior period monthly average exchange rates.
Non-GAAP Financial Information
23
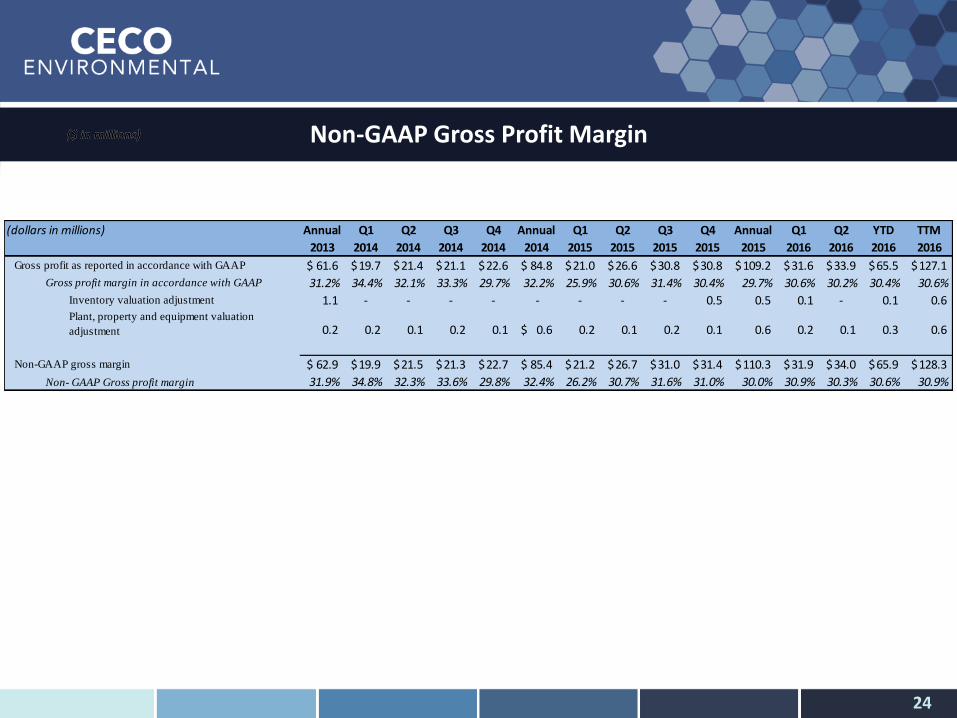
Non-GAAP Gross Profit Margin
24
($ in millions)
(dollars in millions) Annual Q1 Q2 Q3 Q4 Annual Q1 Q2 Q3 Q4 Annual Q1 Q2 YTD TTM
2013 2014 2014 2014 2014 2014 2015 2015 2015 2015 2015 2016 2016 2016 2016
Gross profit as reported in accordance with GAAP 61.6$ 19.7$ 21.4$ 21.1$ 22.6$ 84.8$ 21.0$ 26.6$ 30.8$ 30.8$ 109.2$ 31.6$ 33.9$ 65.5$ 127.1$
Gross profit margin in accordance with GAAP 31.2% 34.4% 32.1% 33.3% 29.7% 32.2% 25.9% 30.6% 31.4% 30.4% 29.7% 30.6% 30.2% 30.4% 30.6%
Inventory valuation adjustment 1.1 - - - - - - - - 0.5 0.5 0.1 - 0.1 0.6 Plant, property and equipment valuation
adjustment 0.2 0.2 0.1 0.2 0.1 0.6$ 0.2 0.1 0.2 0.1 0.6 0.2 0.1 0.3 0.6
Non-GAAP gross margin 62.9$ 19.9$ 21.5$ 21.3$ 22.7$ 85.4$ 21.2$ 26.7$ 31.0$ 31.4$ 110.3$ 31.9$ 34.0$ 65.9$ 128.3$
Non- GAAP Gross profit margin 31.9% 34.8% 32.3% 33.6% 29.8% 32.4% 26.2% 30.7% 31.6% 31.0% 30.0% 30.9% 30.3% 30.6% 30.9%
($ in millions)
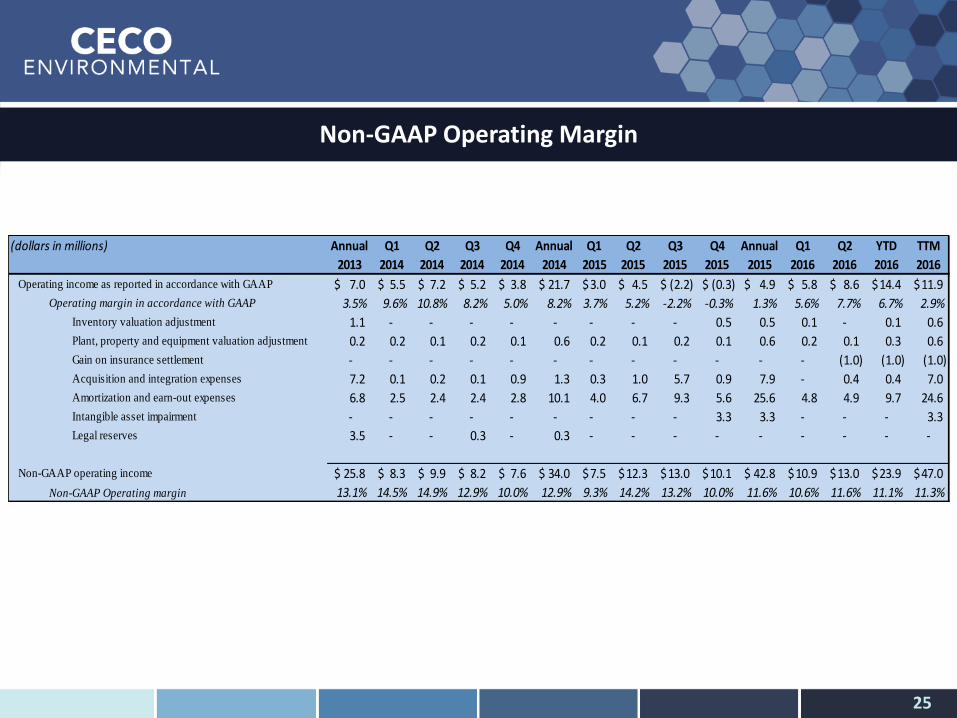
Non-GAAP Operating Margin
25
(dollars in millions) Annual Q1 Q2 Q3 Q4 Annual Q1 Q2 Q3 Q4 Annual Q1 Q2 YTD TTM
2013 2014 2014 2014 2014 2014 2015 2015 2015 2015 2015 2016 2016 2016 2016
Operating income as reported in accordance with GAAP 7.0$ 5.5$ 7.2$ 5.2$ 3.8$ 21.7$ 3.0$ 4.5$ (2.2)$ (0.3)$ 4.9$ 5.8$ 8.6$ 14.4$ 11.9$
Operating margin in accordance with GAAP 3.5% 9.6% 10.8% 8.2% 5.0% 8.2% 3.7% 5.2% -2.2% -0.3% 1.3% 5.6% 7.7% 6.7% 2.9%
Inventory valuation adjustment 1.1 - - - - - - - - 0.5 0.5 0.1 - 0.1 0.6
Plant, property and equipment valuation adjustment 0.2 0.2 0.1 0.2 0.1 0.6 0.2 0.1 0.2 0.1 0.6 0.2 0.1 0.3 0.6
Gain on insurance settlement - - - - - - - - - - - - (1.0) (1.0) (1.0)
Acquisition and integration expenses 7.2 0.1 0.2 0.1 0.9 1.3 0.3 1.0 5.7 0.9 7.9 - 0.4 0.4 7.0
Amortization and earn-out expenses 6.8 2.5 2.4 2.4 2.8 10.1 4.0 6.7 9.3 5.6 25.6 4.8 4.9 9.7 24.6
Intangible asset impairment - - - - - - - - - 3.3 3.3 - - - 3.3
Legal reserves 3.5 - - 0.3 - 0.3 - - - - - - - - -
Non-GAAP operating income 25.8$ 8.3$ 9.9$ 8.2$ 7.6$ 34.0$ 7.5$ 12.3$ 13.0$ 10.1$ 42.8$ 10.9$ 13.0$ 23.9$ 47.0$
Non-GAAP Operating margin 13.1% 14.5% 14.9% 12.9% 10.0% 12.9% 9.3% 14.2% 13.2% 10.0% 11.6% 10.6% 11.6% 11.1% 11.3%
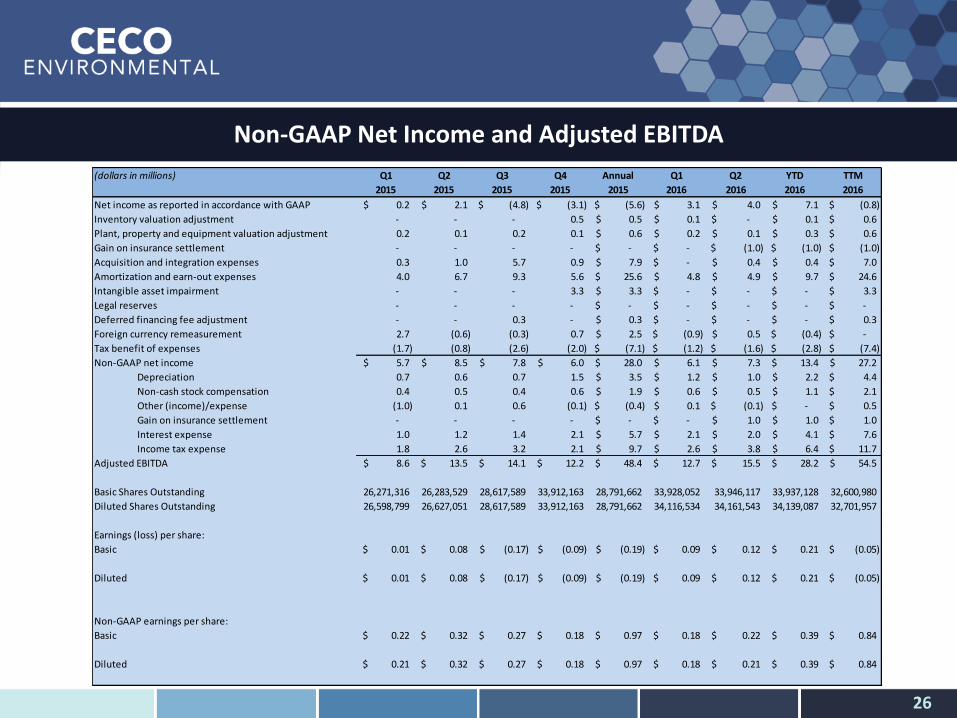
Non-GAAP Net Income and Adjusted EBITDA
26
(dollars in millions) Q1 Q2 Q3 Q4 Annual Q1 Q2 YTD TTM
2015 2015 2015 2015 2015 2016 2016 2016 2016
Net income as reported in accordance with GAAP 0.2$ 2.1$ (4.8)$ (3.1)$ (5.6)$ 3.1$ 4.0$ 7.1$ (0.8)$
Inventory valuation adjustment - - - 0.5 0.5$ 0.1$ -$ 0.1$ 0.6$
Plant, property and equipment valuation adjustment 0.2 0.1 0.2 0.1 0.6$ 0.2$ 0.1$ 0.3$ 0.6$
Gain on insurance settlement - - - - -$ -$ (1.0)$ (1.0)$ (1.0)$
Acquisition and integration expenses 0.3 1.0 5.7 0.9 7.9$ -$ 0.4$ 0.4$ 7.0$
Amortization and earn-out expenses 4.0 6.7 9.3 5.6 25.6$ 4.8$ 4.9$ 9.7$ 24.6$
Intangible asset impairment - - - 3.3 3.3$ -$ -$ -$ 3.3$
Legal reserves - - - - -$ -$ -$ -$ -$
Deferred financing fee adjustment - - 0.3 - 0.3$ -$ -$ -$ 0.3$
Foreign currency remeasurement 2.7 (0.6) (0.3) 0.7 2.5$ (0.9)$ 0.5$ (0.4)$ -$
Tax benefit of expenses (1.7) (0.8) (2.6) (2.0) (7.1)$ (1.2)$ (1.6)$ (2.8)$ (7.4)$
Non-GAAP net income 5.7$ 8.5$ 7.8$ 6.0$ 28.0$ 6.1$ 7.3$ 13.4$ 27.2$
Depreciation 0.7 0.6 0.7 1.5 3.5$ 1.2$ 1.0$ 2.2$ 4.4$
Non-cash stock compensation 0.4 0.5 0.4 0.6 1.9$ 0.6$ 0.5$ 1.1$ 2.1$
Other (income)/expense (1.0) 0.1 0.6 (0.1) (0.4)$ 0.1$ (0.1)$ -$ 0.5$
Gain on insurance settlement - - - - -$ -$ 1.0$ 1.0$ 1.0$
Interest expense 1.0 1.2 1.4 2.1 5.7$ 2.1$ 2.0$ 4.1$ 7.6$
Income tax expense 1.8 2.6 3.2 2.1 9.7$ 2.6$ 3.8$ 6.4$ 11.7$
Adjusted EBITDA 8.6$ 13.5$ 14.1$ 12.2$ 48.4$ 12.7$ 15.5$ 28.2$ 54.5$
Basic Shares Outstanding 26,271,316 26,283,529 28,617,589 33,912,163 28,791,662 33,928,052 33,946,117 33,937,128 32,600,980
Diluted Shares Outstanding 26,598,799 26,627,051 28,617,589 33,912,163 28,791,662 34,116,534 34,161,543 34,139,087 32,701,957
Earnings (loss) per share:
Basic 0.01$ 0.08$ (0.17)$ (0.09)$ (0.19)$ 0.09$ 0.12$ 0.21$ (0.05)$
Diluted 0.01$ 0.08$ (0.17)$ (0.09)$ (0.19)$ 0.09$ 0.12$ 0.21$ (0.05)$
Non-GAAP earnings per share:
Basic 0.22$ 0.32$ 0.27$ 0.18$ 0.97$ 0.18$ 0.22$ 0.39$ 0.84$
Diluted 0.21$ 0.32$ 0.27$ 0.18$ 0.97$ 0.18$ 0.21$ 0.39$ 0.84$