Diversification and Mutual Fund Performance - EFMAefmaefm.org/0EFMAMEETINGS/EFMA ANNUAL...
38
Diversification and Mutual Fund Performance Hoon Cho * , SangJin Park † January 15, 2017 ABSTRACT Keywords: Mutual Fund Performance, Fund Manager Skill, Diversification, Concentration EFM classification: 370, 380 * College of Business, Korea Advanced Institute of Science and Technology; email: [email protected]. † College of Business, Korea Advanced Institute of Science and Technology; 85 Hoegiro, Dongdaemoon-gu, Seoul, 130-722, South Korea; tel: +82-2-958-3482; email: [email protected] We introduce a comprehensive diversification measure, called Diversification Ratio (DR), to examine the effect of diversification in the mutual fund industry. Consistent with the prediction of modern portfolio theory, we identify that funds with high DR have more efficiently diversified portfolio and exhibit significantly higher return than the funds with low DR. Specifically, the high- DR funds have significantly higher return by 8.16% per year than low-DR funds. The DR significantly explains the future fund performance, even after controlling fund characteristics and managerial skills. We identify that the funds with high DR have favorable characteristics related to the diversification. The distinctive feature of high-DR fund is its relation with the existing concentration-related skill measures. We propose an important link between diversification and these skills of fund manager, that efficiently deviating from the market with concentrated investment is in line with achieving efficiently diversified portfolio.
Transcript of Diversification and Mutual Fund Performance - EFMAefmaefm.org/0EFMAMEETINGS/EFMA ANNUAL...

Diversification and Mutual Fund Performance
Hoon Cho*, SangJin Park†
January 15, 2017
ABSTRACT
Keywords: Mutual Fund Performance, Fund Manager Skill, Diversification, Concentration
EFM classification: 370, 380
* College of Business, Korea Advanced Institute of Science and Technology; email: [email protected]. † College of Business, Korea Advanced Institute of Science and Technology; 85 Hoegiro, Dongdaemoon-gu, Seoul,
130-722, South Korea; tel: +82-2-958-3482; email: [email protected]
We introduce a comprehensive diversification measure, called Diversification Ratio (DR), to
examine the effect of diversification in the mutual fund industry. Consistent with the prediction of
modern portfolio theory, we identify that funds with high DR have more efficiently diversified
portfolio and exhibit significantly higher return than the funds with low DR. Specifically, the high-
DR funds have significantly higher return by 8.16% per year than low-DR funds. The DR
significantly explains the future fund performance, even after controlling fund characteristics and
managerial skills. We identify that the funds with high DR have favorable characteristics related to
the diversification. The distinctive feature of high-DR fund is its relation with the existing
concentration-related skill measures. We propose an important link between diversification and
these skills of fund manager, that efficiently deviating from the market with concentrated investment
is in line with achieving efficiently diversified portfolio.

2
1. Introduction
In modern portfolio theory, the equity risk premium is defined as the return of the undiversifiable portfolio.
As Markowitz (1952) emphasizes the benefits of diversification, investors should invest in well-diversified
portfolio to maximize their expected returns. However, the views of academics and practitioners on mutual fund
performance are far from the diversification, rather focusing more on the portfolio concentration. They suggest
that skill of active fund manager is to take concentrated bets and deviate from the market portfolio. In this paper,
we focus on the benefits of diversification on mutual fund performance by introducing a comprehensive measure
of diversification. And we propose how existing fund managers’ skills can be explained by diversification effect
under the classical framework.
The main claim of Markowitz (1952) is that diversification is the only free lunch in finance, as it can reduce
risks without necessarily sacrificing returns. Within the Markowitz mean-variance framework, much effort has
been devoted to developing modern portfolio theory. The most remarkable model is the CAPM developed by
Sharpe (1964). Many studies have fiercely debate on the CAPM whether its assumptions reflect actual market
conditions and whether its conclusions can be turned into actual portfolio management. Especially, the efficiency
of the capitalization-weighted market index has been questioned. Haugen and Baker (1991) provide theoretical
arguments and empirical evidence that matching the market to cap-weighted stock indices is an inefficient strategy
even in an informationally efficient market. In the mutual fund industry, as reported by Sensoy (2009), almost all
active mutual funds are benchmarked to this inefficient cap-weighted market indices. Moreover, Cremers and
Petajisto (2009) point out that significant portion of actively managed mutual funds are closet indexers. This
implies that mutual fund manager can beat their benchmark and benchmark index hugging peers by achieving
efficiently enhanced diversification over a cap-weighted benchmark. Understanding from the mean-variance
framework, the skillful fund manager could certainly earn higher Sharpe ratio by achieving enhanced
diversification over a cap-weighted benchmark.
Despite the obvious benefits of diversification, existing literatures on mutual fund manager skills have
focused primarily on the portfolio concentration, which refers the extent to which the fund portfolio deviates from
the market portfolio. Most studies incorporate the weight of assets in the portfolio to construct a measure of
concentration. First, Kacperczyk, Sialm, and Zheng (2005) propose the Industry Concentration Index and suggest
that the funds that focus on a few industries perform better in the future. Following this study, Baks, Busse, and
3
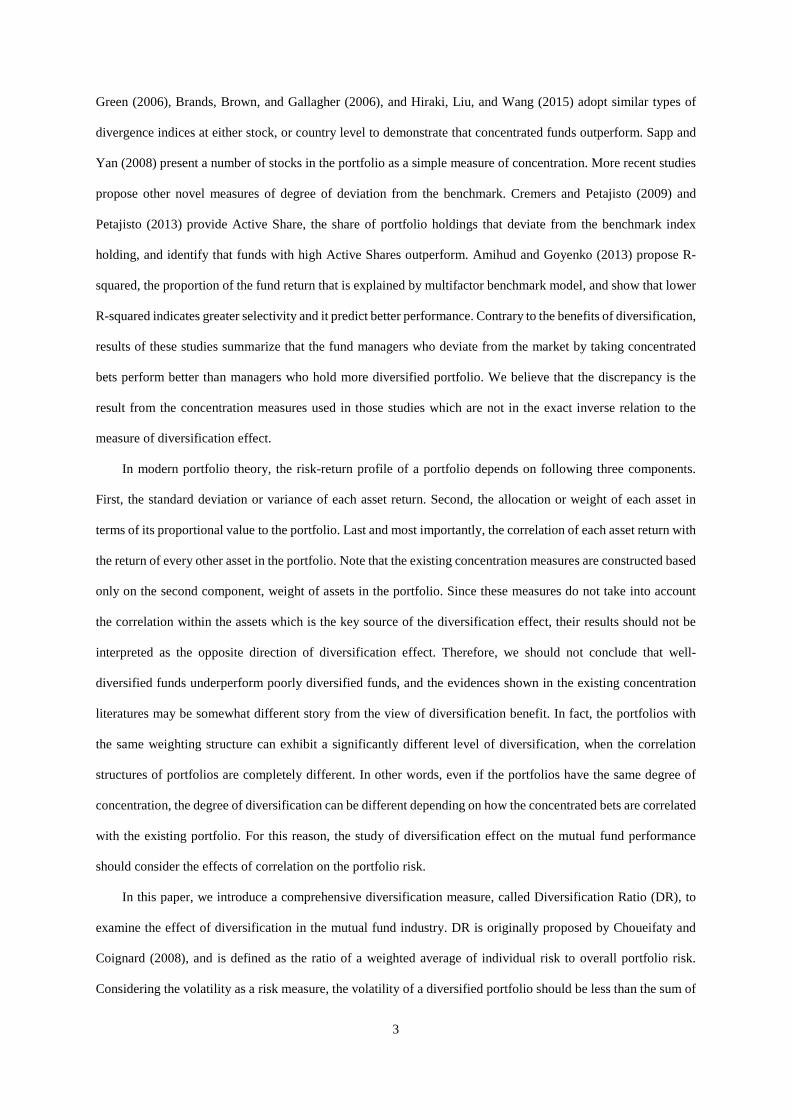
Green (2006), Brands, Brown, and Gallagher (2006), and Hiraki, Liu, and Wang (2015) adopt similar types of
divergence indices at either stock, or country level to demonstrate that concentrated funds outperform. Sapp and
Yan (2008) present a number of stocks in the portfolio as a simple measure of concentration. More recent studies
propose other novel measures of degree of deviation from the benchmark. Cremers and Petajisto (2009) and
Petajisto (2013) provide Active Share, the share of portfolio holdings that deviate from the benchmark index
holding, and identify that funds with high Active Shares outperform. Amihud and Goyenko (2013) propose R-
squared, the proportion of the fund return that is explained by multifactor benchmark model, and show that lower
R-squared indicates greater selectivity and it predict better performance. Contrary to the benefits of diversification,
results of these studies summarize that the fund managers who deviate from the market by taking concentrated
bets perform better than managers who hold more diversified portfolio. We believe that the discrepancy is the
result from the concentration measures used in those studies which are not in the exact inverse relation to the
measure of diversification effect.
In modern portfolio theory, the risk-return profile of a portfolio depends on following three components.
First, the standard deviation or variance of each asset return. Second, the allocation or weight of each asset in
terms of its proportional value to the portfolio. Last and most importantly, the correlation of each asset return with
the return of every other asset in the portfolio. Note that the existing concentration measures are constructed based
only on the second component, weight of assets in the portfolio. Since these measures do not take into account
the correlation within the assets which is the key source of the diversification effect, their results should not be
interpreted as the opposite direction of diversification effect. Therefore, we should not conclude that well-
diversified funds underperform poorly diversified funds, and the evidences shown in the existing concentration
literatures may be somewhat different story from the view of diversification benefit. In fact, the portfolios with
the same weighting structure can exhibit a significantly different level of diversification, when the correlation
structures of portfolios are completely different. In other words, even if the portfolios have the same degree of
concentration, the degree of diversification can be different depending on how the concentrated bets are correlated
with the existing portfolio. For this reason, the study of diversification effect on the mutual fund performance
should consider the effects of correlation on the portfolio risk.
In this paper, we introduce a comprehensive diversification measure, called Diversification Ratio (DR), to
examine the effect of diversification in the mutual fund industry. DR is originally proposed by Choueifaty and
Coignard (2008), and is defined as the ratio of a weighted average of individual risk to overall portfolio risk.
Considering the volatility as a risk measure, the volatility of a diversified portfolio should be less than the sum of

4
the individual volatility, the larger value of DR indicates the higher degree of diversification. As DR directly
measures the diversification, it accounts for both of allocation of assets in the portfolio and correlation of the asset
with the other assets in the portfolio that bring diversification effect. Therefore, we propose that DR appropriately
measures the comprehensive effect of diversification of mutual funds.
Our main objective is to investigate the benefits of diversification in actively managed equity mutual fund
performance. Consistent with the prediction of modern portfolio theory, we identify that funds with high DR have
more efficiently diversified portfolio and exhibit significantly higher return than the funds with low DR.
Specifically, sorting funds into decile by their DR, we find that the annualized return and alpha differences
between highest DR funds and lowest DR funds have statistically and economically significant values of 8.16%
and 3.48% per year, respectively. We check the persistence in the performance difference attributed by the DR
value that the alpha value of high DR remains higher than low DR for over a year. Also our cross-sectional
regression analysis show that DR positively predicts the future performance of fund after controlling for fund
characteristics, and various managerial skill measures. DR measure have the greatest predictability for the future
fund return among the existing fund skill measures. The results remain qualitatively unchanged regardless of
whether we use volatility, Value-at-Risk, or Expected Shortfall as a risk measure of constructing DR. Thus, our
empirical results demonstrate that funds with highly diversified portfolio have superior performance than the funds
with less diversified portfolio, which is the existence of diversification benefit in the active mutual fund industry.
We identify the high DR funds have various characteristics related to diversification and asset allocation.
First, high DR funds have more exposure to stocks with higher expected return, higher volatility and skewness,
but they exhibit higher portfolio return with lower portfolio volatility, i.e. higher Sharpe ratio, in portfolio level.
This is consistent with the effect of diversification encapsulated in the DR measures. Second, they also have large
number of stocks in their portfolio, lower portion of common stocks, and higher portion of cash and bond in their
portfolio. This evidence is consistent with their efforts to diversify from the overall portfolio perspective. Third,
these funds have positive capital inflow, and good past performance, which makes these dedicate to diversification
rather than increasing idiosyncratic bets. Lastly, the high DR funds are tend to small, young, high turnover, high
expense and fee, which is corresponding to the characteristics of funds with good performance. Therefore, as our
DR measure properly captures the diversification effect of portfolio, the high DR funds show the characteristics
that are consistent with an effectively diversified portfolio.
The most distinctive feature of DR is its relation with the skill measures. First, we conduct cross-sectional
regression to identify the determinants of DR, and find that Active Share, R-Squared, Industry Concentration
5
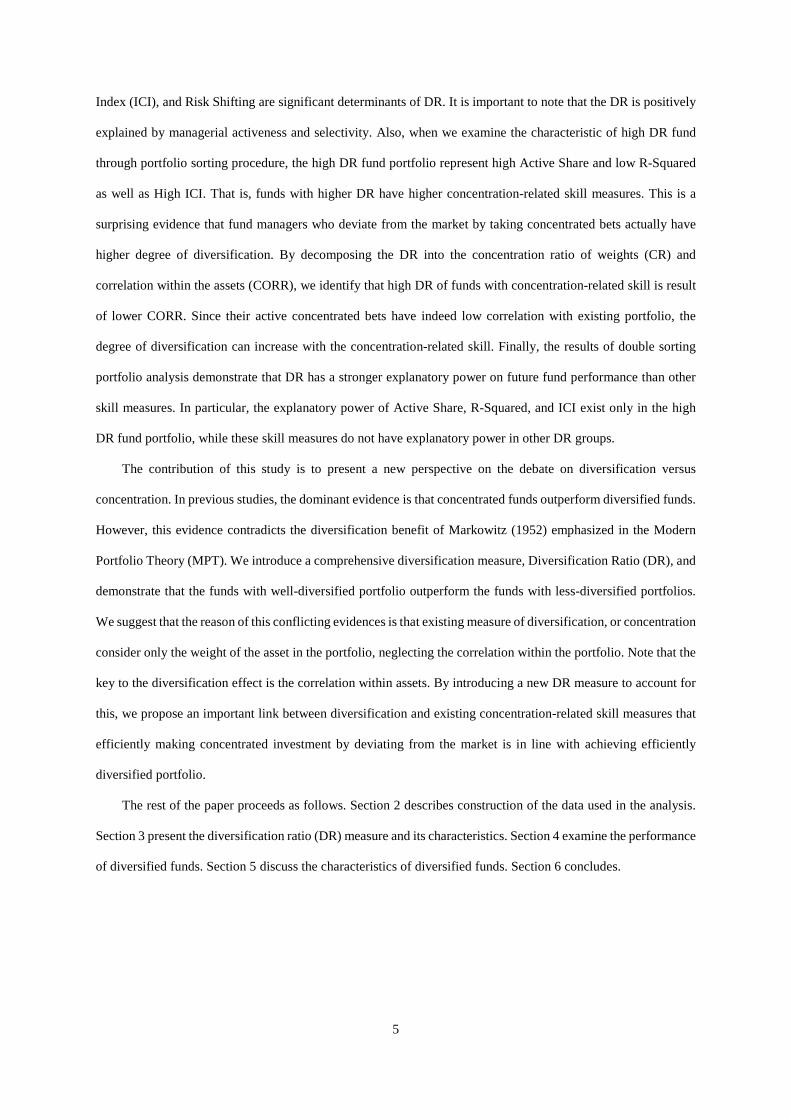
Index (ICI), and Risk Shifting are significant determinants of DR. It is important to note that the DR is positively
explained by managerial activeness and selectivity. Also, when we examine the characteristic of high DR fund
through portfolio sorting procedure, the high DR fund portfolio represent high Active Share and low R-Squared
as well as High ICI. That is, funds with higher DR have higher concentration-related skill measures. This is a
surprising evidence that fund managers who deviate from the market by taking concentrated bets actually have
higher degree of diversification. By decomposing the DR into the concentration ratio of weights (CR) and
correlation within the assets (CORR), we identify that high DR of funds with concentration-related skill is result
of lower CORR. Since their active concentrated bets have indeed low correlation with existing portfolio, the
degree of diversification can increase with the concentration-related skill. Finally, the results of double sorting
portfolio analysis demonstrate that DR has a stronger explanatory power on future fund performance than other
skill measures. In particular, the explanatory power of Active Share, R-Squared, and ICI exist only in the high
DR fund portfolio, while these skill measures do not have explanatory power in other DR groups.
The contribution of this study is to present a new perspective on the debate on diversification versus
concentration. In previous studies, the dominant evidence is that concentrated funds outperform diversified funds.
However, this evidence contradicts the diversification benefit of Markowitz (1952) emphasized in the Modern
Portfolio Theory (MPT). We introduce a comprehensive diversification measure, Diversification Ratio (DR), and
demonstrate that the funds with well-diversified portfolio outperform the funds with less-diversified portfolios.
We suggest that the reason of this conflicting evidences is that existing measure of diversification, or concentration
consider only the weight of the asset in the portfolio, neglecting the correlation within the portfolio. Note that the
key to the diversification effect is the correlation within assets. By introducing a new DR measure to account for
this, we propose an important link between diversification and existing concentration-related skill measures that
efficiently making concentrated investment by deviating from the market is in line with achieving efficiently
diversified portfolio.
The rest of the paper proceeds as follows. Section 2 describes construction of the data used in the analysis.
Section 3 present the diversification ratio (DR) measure and its characteristics. Section 4 examine the performance
of diversified funds. Section 5 discuss the characteristics of diversified funds. Section 6 concludes.

6
2. Mutual Fund Data
To construct our sample of actively managed US equity funds, we create the main data by merging CRSP
Survivorship Bias Free Mutual Fund Database and the CDA/Specturm holding database using MFLINK file based
on Wermers (2000) and available on Wharton Research Data Services. Specifically, we obtain the data on daily
fund returns and other funds characteristics are obtained from the CRSP Mutual Fund Database. Also, we retrieve
data on the detailed information about fund holdings from CDA/Spectrum Database. We link this holding data to
the CRSP stock database to obtain return and other information of individual stocks. For funds with multiple share
classes on CRSP database, we use the CRSP class group variable to combine them into single fund, and compute
the value-weighted average returns, expense, turnover ratio, and other characteristic for each fund.
Our sample includes 2,467 unique funds and 245,462 fund-month observation the period between January 1,
2000 and December 31, 2013.1 We restrict our sample to actively managed equity funds for which the holdings
data are most complete and reliable. Therefore, we exclude balanced, bond, index, international, and sector funds
either by their stated style or by their name. We require that a fund have at least 80% and less than 105% of its
assets invested in common stocks. Following Elton, Gruber, and Blake (1996), we restrict funds to have at least
15 million in total net assets, since inclusion of smaller funds can cause a survivorship bias problem due to
reporting conventions. To avoid the incubation bias of Evans (2010), we eliminate the observations before the
reported starting year of fund and also exclude funds less than one year old. We also restrict our sample to funds
have at least $15 million in assets. Also following Kacperczyk, Sialm, and Zheng (2008), we exclude funds that
do not have disclosed equity position over the last 12 months and delete funds with names missing in CRSP.
1 The daily return file of mutual fund is available on CRSP database from September 2, 1998. And the first year of the sample is required to make variables in the analysis.

7
3. Diversification Ratio
We introduce Diversification ratio (DR) to measure the degree of diversification of each fund. This measure
is first proposed by Choueifaty and Coignard (2008) who investigate the theoretical and empirical properties of
diversification as a criterion in portfolio construction.2 Technically, the DR of a certain portfolio is defined as
𝐷𝐷𝐷𝐷(ℛ) =∑ 𝑤𝑤𝑖𝑖ℛ𝑖𝑖𝑖𝑖
ℛ𝑝𝑝
where 𝑤𝑤𝑖𝑖 is the portfolio weight in i th asset, ℛ𝑖𝑖 is the risk of i th asset, and ℛ𝑝𝑝 is the total risk of the portfolio.
For the risk measure ℛ , we consider volatility as a primary measure, Value-at-Risk and Expected Shortfall
metrics as alternative risk measures.
When we adopt volatility as a risk measure, our primary measure of DR(Vol) is expressed as
𝐷𝐷𝐷𝐷(Vol) =∑ 𝑤𝑤𝑖𝑖𝜎𝜎𝑖𝑖𝑖𝑖
�∑ 𝑤𝑤𝑖𝑖2𝜎𝜎𝑖𝑖2 + ∑ ∑ 𝑤𝑤𝑖𝑖𝑤𝑤𝑗𝑗𝜎𝜎𝑖𝑖𝑗𝑗𝑖𝑖≠𝑗𝑗𝑖𝑖𝑖𝑖
where 𝑤𝑤𝑖𝑖 is the portfolio weight in i th asset, σi is the volatility of i th asset, and σi,j is the covariance between
i th and j th asset. Alternatively, when we use Value-at-Risk and Expected Shortfall as risk measures, the DR
measure are defined as
𝐷𝐷𝐷𝐷(VaR) =∑ 𝑤𝑤𝑖𝑖𝑉𝑉𝑉𝑉𝐷𝐷𝑖𝑖𝑖𝑖
𝑉𝑉𝑉𝑉𝐷𝐷𝑝𝑝 and 𝐷𝐷𝐷𝐷(ES) =
∑ 𝑤𝑤𝑖𝑖𝐸𝐸𝐸𝐸𝑖𝑖𝑖𝑖
𝐸𝐸𝐸𝐸𝑝𝑝
where 𝑤𝑤𝑖𝑖 is the portfolio weight in i th asset, 𝑉𝑉𝑉𝑉𝐷𝐷𝑖𝑖 and 𝑉𝑉𝑉𝑉𝐷𝐷𝑝𝑝 are the Value-at-Risk of i th asset and portfolio,
respectively, and also 𝐸𝐸𝐸𝐸𝑖𝑖 and 𝐸𝐸𝐸𝐸𝑝𝑝 is the Expected Shortfall of i th asset and portfolio, respectively. In the
overall analysis, we use volatility-based DR measure, DR(Vol), as our primary measure since various useful
characteristics of DR are derived from manipulating the volatility, which we will discuss below.
In the equation above, the DR(Vol) is the ratio of a weighted average volatility of assets in the portfolio to
the overall portfolio volatility. The numerator of DR (Vol), the allocation-only weight portfolio volatility, is
identical to overall portfolio volatility, if every assets in the portfolio are perfectly correlated. However, as all of
the assets will not be perfectly correlated, the portfolio volatility will be less than the sum of the individual
2 To measure a diversification effect, De Wit (1997) and Cheng and Roulac (2007) also use similar concept to analyze the effectiveness of diversification in real estate portfolio. See Hight (2009) for the discussion of measuring diversification effect.

8
volatility. This key feature of diversification is the main concept encapsulated in DR measure. The DR captures
the benefits of diversification earned from holding assets that are not perfectly correlated. We determine that the
portfolio is poorly diversified when DR value of portfolio is close to one. And we judge the portfolio is highly
diversified, when DR value of portfolio is high. Note that the DR has a value of one, only if there is only one asset
in the portfolio. When a portfolio containing N independent assets, the DR value represents √𝑁𝑁.
One of the important features of DR is that it can be decomposed into two other components that also measure
the degree of diversification. Specifically, as shown in Choueifaty, Froidure, and Reynier (2013), the DR of a
portfolio can be expressed in terms of its weighted-correlation and weighted-concentration measure. The
decomposition of DR is
𝐷𝐷𝐷𝐷 = [𝐶𝐶𝐶𝐶𝐷𝐷𝐷𝐷(1 − 𝐶𝐶𝐷𝐷) + 𝐶𝐶𝐷𝐷)]−0.5
where CORR is the volatility-weighted average correlation of the assets in the portfolio,
𝐶𝐶𝐶𝐶𝐷𝐷𝐷𝐷 =∑ �𝑤𝑤𝑖𝑖𝜎𝜎𝑖𝑖𝑤𝑤𝑗𝑗𝜎𝜎𝑗𝑗�𝜌𝜌𝑖𝑖,𝑗𝑗𝑖𝑖≠𝑗𝑗
∑ �𝑤𝑤𝑖𝑖𝜎𝜎𝑖𝑖𝑤𝑤𝑗𝑗𝜎𝜎𝑗𝑗�𝑖𝑖≠𝑗𝑗
and CR is the volatility-weighted concentration ratio (CR) of the portfolio,
CR =∑ (𝑤𝑤𝑖𝑖𝜎𝜎𝑖𝑖)2𝑖𝑖
(∑ 𝑤𝑤𝑖𝑖𝜎𝜎𝑖𝑖𝑖𝑖 )2
A fully concentrated long-only portfolio, i.e. single asset portfolio, exhibit CR value of one, while an equal
volatility weighted portfolio has the lowest value of CR that equals to the inverse of the number of assets.3 The
intuition incorporated in this decomposition is that poor diversified portfolio is the result of either higher
concentrated weight in the portfolio or higher correlated holdings, i.e. lower value of DR is the result of either
higher CR value or higher CORR value. Extremely, the DR is equal to one, if the CORR increases to one
regardless of the CR value, because a portfolio of assets is no more diversified than a single asset portfolio.
Existing literatures introduce a number of measures related to diversification (or concentration), but there is
no direct diversification measure like DR measure. Note that the portfolio risk is affected by the volatility of each
asset’s returns, the allocation or weights of each assets, and the correlation of each asset’s returns with the returns
of every other asset in the portfolio. First, the seminal paper of Kacperczyk, Sialm, and Zheng (2005) propose
Industry Concentration Index (ICI) to measure the degree of the concentration with respect to the industry. Also,
3 As mentioned in Choueifaty, Froidure, and Reynier (2013), the concentration ratio (CR) is an applied version of the Herfindahl-Hirschman Index(HHI), which is used to measure a sector concentration by US authorities. So we can consider CR measure as the concentration of weights, as well as the concentration of risks that assets are weighted in proportion to volatility

9
there are a number of similar measures in the mutual fund literatures using such divergence index at either a stock,
industry, or country level, including Baks, Busse, and Green (2006), Brands, Brown, and Gallagher (2006), Sapp
and Yan (2008), and Hiraki, Liu, and Wang (2015). The critical drawback of these weight-based measures is that
they do not account for the correlation between assets. That is, the portfolio with same weight structure, but a
completely different covariance structure can exhibit markedly different level of diversification. Second, Sapp
and Yan (2008) use the number of stocks in the portfolio as the simple measure of diversification, and its
effectiveness is first demonstrated by Evans and Archer (1968). However, the degree of diversification depends
on not only on the number of assets, but also on the factions of asset invested into the constituent. Also, counting
the number of assets does not account for the correlation between the assets in the portfolio. Since the existing
measures do not account for the covariance structure between assets, we choose DR as the comprehensive measure
of diversification to gauge the degree of diversification for a specific portfolio.
To construct DR measures of our sample, we calculate volatility, Value-at-Risk, and Expected Shortfall of
the each fund return and the stock return held by the fund at each month of fund’s disclosure. We use daily returns
over the past year for all variables, and adopt 5% value to the parameters of Value-at-Risk and Expected Shortfall.
[Insert Table 1]
Table 1 present the summary statistics for our DR measures. The average and standard deviation of DR(Vol)
are 1.94 and 0.46, respectively, and exhibit positive skewness and kurtosis of 1.36 and 3.72, respectively.
Considering that the lower bound of the DR is 1, the positive skewed with fat tail distribution of DR is quite
reasonable. The minimum and maximum values of 1.12 and 5.63 are also reasonable values. Note that DR (Vol)
and alternative DR measures, DR (VaR) and DR (ES), have almost identical distribution, and especially the
correlation structures shows that these DR measures are highly correlated. Therefore, we will proceed our main
analysis with DR(Vol), and the robustness check will proceed with DR(VaR) and DR(ES) throughout the paper.

10
4. Performance of Diversified Funds
4.1. Performance of DR-sorted Fund
We first explore the performance of high and low diversified mutual fund by sorting funds into portfolios
based on past diversification ratio (DR). At the beginning of each month, we sort funds into decile based on the
DR for recent 1 year. Then we calculate the equal-weighted returns for each decile portfolio.
[Insert Table 2]
Table 2 shows the average monthly returns and Fama-French 4 factor alpha for the DR sorted portfolios.4
Focusing on the net return, the average monthly return for high DR portfolios is 0.86%, compared with only 0.18%
for low DR portfolios. The annualized difference between high minus low DR portfolios exhibit 8.16% per year
which is economically and statistically significant at 1% level. Note that it is impossible for investors to directly
capture that this difference in performance since mutual funds cannot be sold short unlike commons tocks. Instead,
the difference correspond to the opportunity cost of investing in high DR funds instead of low DR funds.
The Fama-French four factor alpha and factor exposure also exhibit the significant difference between high
and low DR funds.5 The high DR portfolio has an alpha of 0.08% per month, while the low DR portfolio has an
alpha of -0.20% per month. The annualized difference in alpha between the high and low DR portfolios amount
to about 3.48% per year which is significant at 5% level. High DR funds more likely to tilt on low beta, small,
and value styles than low DR funds. That is, high DR funds have more exposures on the stocks with favorable
style, but these exposures do not fully explain the performance of the high DR funds. As discussed in Choueifaty,
Froidure, and Reynier (2013), it is important to note that maximizing DR is equivalent to maximizing Sharpe ratio
under the assumption that risk is homogeneously rewarded across the universe. Consistent with this intuition of
DR, high DR funds have statistically and economically significant higher return and alpha than the low DR funds.
4 In Appendix, we report additional portfolio sorting results of alternative definition of diversification ratio. The alternative measures are calculating DR by adopting risk measure as Value-at-Risk and Expected Shortfall as measure risk for robustness check. The results are consistent whether we choose other alternative measures of DR.
5 For the market, size, and value factors of Fama and French (1993) model, and momentum factor of Carhart (1997) are obtained from Kenneth French’s Webpage (http://mba.tuck.dartmouth.edu/pages/faculty/ken.french/Data Library).

11
4.2 Performance Persistence of DR-sorted Portfolio
We test the persistence of fund diversification ratio (DR) as predictor of future fund performance. In the
section 4.1, for comparison, we employ DR of each fund measured in month t to form portfolios in month t+1.
Here, we construct the fund portfolios in a similar manner except introducing a time lag between DR measurement
and portfolio formation. The time lag is varying from month t through month t+60. In each formation month, we
divide funds based on its DR measure into decile. Then we calculate the monthly Fama-French four-factor alpha
for the each fund portfolio corresponding to its formation month. The testing method of performance persistence
is similar to Carhart (1997) which suggests that past fund return predict only short-term future performance
[Insert Table 3]
In Table 3, we find that the high DR fund portfolio outperforms the low DR fund portfolio even with a long
lag between DR measurement and portfolio formation. For raw returns in Panel A, we can find that there is a
statistically significant monthly return difference of 0.22% between high and low DR fund portfolios at the 10%
level up to 36-month lags. For Fama-French 4 factor alpha in Panel B, the monthly performance difference is
0.21% and statistically significant at 10% level after 12 months of DR measurement. These difference in
performance is the one-month return for each imposed lag at each point in time. Since the difference between high
and low DR fund portfolio is not reversed, when we consider the cumulative returns, funds with high
diversification will perform better than those with low funds over five years after controlling for risk factors.
Unreported result show that the highly diversified fund has a higher return of 0.65% and a higher alpha of 0.28%
compared to less diversified fund at 1% significance level. In contrast to the momentum effect investigated in
Carhart (1997), the effect of diversification on future fund performance is highly persistent.
4.3 Persistence of DR measure
As we have seen the performance persistence of DR-sorted fund, this section analyzes the persistence of the
DR measure itself. Similar to the methodology used in section 4.2, we calculate DR of each fund measured in
month t to form decile portfolios. Then we calculate the average DR for the each decile fund portfolio from month
t to month t+60. To understand what the magnitude of the difference in DR means economically, we also calculate

12
the number of independent risk factors by the square of the DR value following Choueifaty, Froidure, and Reynier
(2013). The DR2 of any portfolio can be interpreted as the number of independent risk factors required for a
portfolio that allocate same risk to independent risk factors to achieve same DR.
[Insert Table 4]
Table 4 show that there is a statistically significant difference in the value of DR itself over a long horizon.
At the formation period, the difference in DR and DR2 between high DR and low DR fund portfolio are 1.09 and
4.55 respectively. The difference in DR2 indicates that high DR funds have more exposures of 4.55 independent
risk factors compared to low DR funds. Note that the DR value of the high DR fund portfolio is 2.64 and the DR
value of the Most Diversified Portfolio (MDP) in Choueifaty, Froidure, and Reynier (2013) is 2.6 in the year of
2010.6 We suggest that funds in the highest DR decile have a portfolio that is diversified as much as MDP which
is actually constructed by maximizing DR at the time of formation period. As the lag becomes longer, the value
of DR gradually decreases in the high DR fund and increases in the low DR fund, so that the gap between high
and low DR fund is gradually reduced. After 36 months of lag, the difference in DR values fall below 0.5 and the
difference in the number of independent risk factors falls below 2. Considering that performance persistence exists
up to 36 month lags, the difference in number of risk factors between high and low DR fund should be more than
2 to make a significant difference in performance.
4.4. Cross-sectional Regression
We perform cross-sectional regression analysis to test the role of DR in predicting the future mutual fund
performance, controlling for various fund characteristics and well-known fund managers skills. Specifically, we
use Fama and MacBeth (1973) style regression model to forecast future fund performance based on DR and
control variables. The dependent variable of the regression is the performance of the individual fund at t+1 month.
The independent variables include DR variables and the control variables associated with fund characteristics and
managerial skill. Note that all variables are standardized to have mean zero and standard deviation of 1 to identify
that which of the independent variables have a greater effect on the dependent variable in the multivariate
6 See the DR value of the listed index in Choueifaty, Froidure, and Reynier (2013) to better understand the magnitude of DR values. At the end of 2010, the DR of the MSCI World index was 1.7 and this implies that a passive MSCI World investor effectively exposed to 2.89 (=1.72) independent risk factors.

13
regression. Therefore, the coefficient is standardized and indicates how many standard deviations of the dependent
variable increase as the independent variable increases by one standard deviation.
Our main variables of the interest in regression are three versions of DR. The types of DR vary depending
on how we define the risk, such as DR(Vol), DR(VaR), and DR(ES), which adopt risk measure as volatility(Vol),
Value-at-Risk(VaR), and Expected Shortfall(ES), respectively. We basically calculate these variables by using
the daily return series, and applied the VaR and ES parameters as 1% level. Our purpose of using various DR
measures is to test the robustness of the variables, i.e. how the DR variables can explain the cross-sectional return
of the mutual fund, regardless of how we define the DR in terms of risk.
The primary control variables related to the fund characteristics include the log of total net asset, log of age,
turnover ratio, expense, flow, number of stocks, and past performance. Also, we use five variables related to fund
manager skill as control variable. The first is the active share of Cremers and Petajisto (2009) and Petajisto (2013),
which is defined as the sum of the absolute deviations of the fund’s portfolio holdings from its benchmark index
holdings. The higher active share predicts superior performance. The second is the R-squared of Amihud and
Goyenko (2013), which is obtained from a regression of fund returns on a multifactor benchmark model. The
lower R-squared is related to greater selectivity and better future performance. The third is Industry Concentration
Index (ICI) of Kacperczyk, Sialm, and Zheng (2005), which is constructed as the sum of the squared deviations
of fund’s stock holdings in each industry from the industry weights of the total stock market. The higher ICI have
superior future performance, since mutual funds which concentrated in a few industries outperform their more
diverse counterparts. The fourth is Return Gap of Kacperczyk, Sialm, and Zheng (2008), which is the difference
between the gross fund return and the holding-based return. The return gap is a proxy for the unobserved action
of the fund manager and it leads to higher future performance. The last is Risk Shifting of Huang, Sialm, and
Zhang (2011) which is defined as the difference between the current holdings volatility based on the most recently
disclosed position and the past realized volatility based on the realized returns. Since funds that increase risk
perform worse, the lower Risk Shifting is related to better future performance.
[Insert Table 5]
Table 5 shows the results for the regression analysis. The first column and the fifth column are the baseline
results of adding only the primary control variables or adding the skill variables as explanatory variables to predict
the future fund return. Not surprisingly, the past performance has a strong predictability for the future performance
of the fund, and the remaining predictive variables are fund size, flow, and number of stocks in the portfolio.
Among the predictive skill measures, the Active Shares of Cremers and Petajisto (2009) has the largest coefficient

14
value of 0.22 which is statistically significant at the 1% level. The number of stocks held by a fund, which is a
unsophisticated measure for diversification discussed in Sapp and Yan (2008), also has a significant coefficient
at the 1% level. These baseline results show that the characteristics of various funds predict future returns in a
direction consistent with previous literature.
And the next three columns following the each baseline result in Table 5 are the main result of testing the
predictive power of DR measures, such as DR(Vol), DR(VaR), and DR(ES). Regardless of the definition of DR,
the DR measure has a significant positive coefficient on future fund performance. Considering our main volatility
based DR variable, the coefficient of DR (Vol) is 0.17 and statistically significant at 1% level when controlling
only the fund characteristics in Column 2. When we further control the various skill measures in Column 6, the
coefficient is 0.24 and statistically significant at the 5% level. The explanatory power of the number of stocks,
which is a naive measure of diversification, and skill measures, such as Active shares, R-squared, and ICI, notably
decreases when DR variable is added. Note that the coefficient of DR is 0.24 which is 33% larger than 0.18 of
Active share, which indicates that the one standard deviation change in DR has a 33% greater effect on the future
fund performance relative to the active share. Furthermore, DR has a greater predictive power on future
performance than any other variable when excluding past performance variables itself. Thus, we conclude that the
funds with higher degree of diversification have significantly higher future fund performance even after
controlling for various fund characteristics and managerial skills.

15
5. Characteristics of Diversified Funds
5.1. Determinants of DR-sorted Fund
The DR value of each fund is a salient predictor for the future performance of the fund. To identify the
determinants of the DR measure, we perform the regression analysis with DR as a dependent variable. The
regression specification is similar to the Fama and MacBeth (1973) type regression in the previous section, and
independent variable include the fund character variables, such as size, age, turnover, expense, flow, number of
stocks, and past performance, as well as managerial skill measure, such as Active shares, R-squared, ICI, and
return gap. In the case of the dependent variable, three types of DR, such as DR (vol), DR (VaR), and DR (ES)
are analyzed depending on the choice of the risk measure in the calculation of DR measure.
[Insert Table 6]
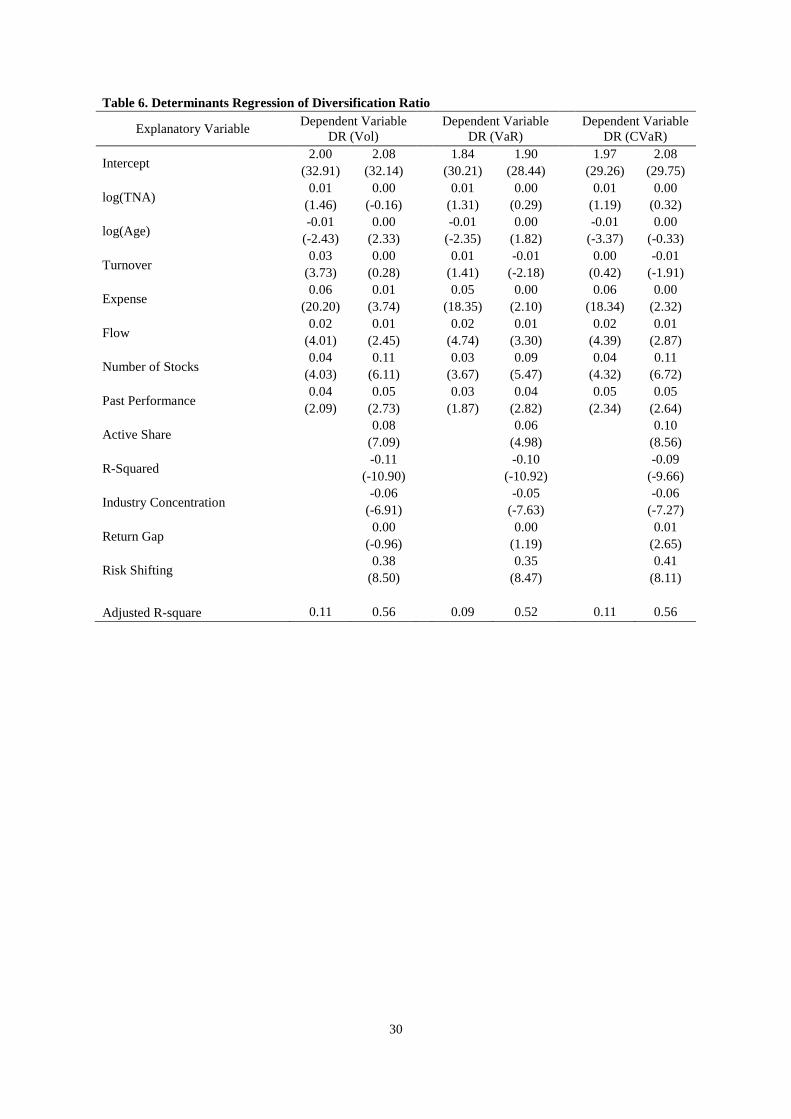
Table 6 shows the results of the regression to examine the determinants of three different version of DRs.
Among the variables related to the fund characteristics, variables that explain the DR in a statistically significant
and consistent direction in any condition are number of stocks, flow, and past performance. First, it is natural that
the number of shares exhibit a significant coefficient for explaining DR. The number of shares can be regarded as
a simple version of measuring the degree of diversification as suggested by Sapp and Yan (2008). However, DR
has differentiated information from the number of stocks measure as shown in the result of previous analysis and
past literatures. 7 Second, fund flow and past performance also have significantly positive coefficient for
explaining DR. As Berk and Green (2004) suggest that the fund flow rationally respond to past performance in
their model, these two variables are closely interconnected. That is, a well-performing fund draws capital inflow,
and funds with inflows also have higher performance in the future. We believe that the prosperous fund manager
with positive inflows or good performance could avoid speculative investment, so they are more likely to focus
on the diversification rather than increasing idiosyncratic betting or gambling.8 In summary, among the fund
7 As shown in Choueifaty, Froidure, and Reynier (2013), a large number of stocks is not the necessary condition for a higher degree of diversification. They show that MDP (Most Diversified Portfolio) is more diversified with a smaller number of shares than the market index. Shawky and Smith (2005) also point out that the cost is bigger than the benefit over a certain number of stocks, so it has a negative effect on the performance. In this respect, they analyze the optimal number of stocks that maximize the fund performance.
8 Fund managers have a strong incentives to make idiosyncratic bets to win the tournaments. Brown, Harlow, and Starks (1996) suggest that unskilled fund managers likely to be tempted to make a large idiosyncratic bet to rise in tournament ranking like a lottery winner. Funds taking a bet behavior tend to increase their volatility or skewness. See also Brown, Goetzmann, and Park (2001), Huang, Sialm, and Zhang (2011), Lin (2011), and Chang and Luo (2013).

16
characteristics, Number of Stocks, Fund Flow, and Past performance are positively related to DR measure.
Among the managerial skill measures, variables with statistically coefficient for explaining DR measure are
Active Shares, R-Squared, ICI, and Risk Shifting measures. Most of all, the Active Share and R-Squared variables,
which seemed to be largely unrelated to diversification, significantly account for DR measure. The result indicates
that fund manager’s activeness and selectivity are positively associated with portfolio diversification behavior.
Intuitively, three measures commonly represent more efficient investment leading to a higher Sharpe ratio. The
relation between skill measures and DR will be discussed in more detail in the following section. Second, it is
easy to understand that the Industry Concentration Index (ICI) negatively explains the DR measure since the two
variables have opposite concept of concentration and diversification. Third, the Risk Shifting measure is
technically related to DR measure by definition, since two variables are negatively related to the past realized
volatility of daily fund return, which is the denominator of DR measure and also the subtraction part of Risk
Shifting measure. Accordingly, the smaller the volatility of the portfolio, the greater the value of DR and Risk
Shifting. In sum, we find that DR has a positive relation with various skill measures, and most surprisingly, these
skill measures include Active Shares and R-Squared.
5.2. Characteristics of DR-sorted Fund
In this section, we focus on the characteristics of high DR funds which generate superior future performance.
We perform portfolio sorting analysis to examine the direct relation between DR and fund characteristics. First,
we sort funds by DR measure for each month and divided funds sample into decile to construct the portfolio. Then,
we calculate the characteristics value of decile portfolio by averaging the value of funds belonging to each decile.
We include various characteristics from general information to performance evaluation, portfolio composition,
investment style, and managerial skills.
[Insert Table 7]
Table 7 shows the general information of DR-sorted fund portfolio. First, performance related
characteristics of high DR funds coincide with the diversification concept, consistent with the background of DR
measure. The high-DR fund portfolio exhibit higher Sharpe ratio (i.e. higher average return and lower standard
deviation), as Choueifaty and Coignard (2008) demonstrated that increasing the DR is equivalent to increasing

17
the Sharpe ratio. Also, high-DR fund portfolio represent reduced skewness and kurtosis compared to low-DR fund
portfolio, corresponding to the result of diversification. Second, the basic properties of the high DR funds match
the characteristics of funds with superior performance identified in previous literatures. The highest DR funds are
the smallest and youngest, also ranking the highest in terms of flow, turnover ratio, expense ratio, and management
fee. The number of stocks increases with DR, but steeply decreases in the highest DR decile portfolio. This is
consistent with the notion of Shawky and Smith (2005) that there exists the optimal number of stocks reflecting
the trade-off between diversification benefit versus transactions and monitoring costs. Third, high DR funds have
a low proportion of equity holdings in their portfolio. In other words, high DR funds hold more cash and invest
more in bond. We suggest that diversified fund actively utilize assets other than common stocks in their portfolios
consistent with the asset allocation perspective. Simutin (2014) also suggest that the benefits of carrying cash
holdings from the flexibility. To summarize, characteristics of high DR funds are closely related to diversification
benefits and many favorable fund characteristics on the performance.
[Insert Table 8]
Table 8 shows the investment style and skill-related characteristics of DR-sorted funds. For the style score,
we first rank stocks based on each style in the stock universe from 1 to 10 and assign this rank value to
corresponding stock in the portfolio, then we calculate the average of the rank values for stocks in the portfolio.
First of all, funds with high DR have more exposures to stocks with higher expected return, such as small, value,
and momentum, and stocks with low information, such as low analyst coverage and low number of institutional
holdings. We suggest that the high DR funds successfully achieve diversification benefit by exposure to various
factors and broad stocks universe regardless of information, compared to low DR funds. Second, high DR funds
also more stocks with high volatility and skewness. Note that, these characteristics would be a direct evidence of
well-diversified properties of high DR funds, considering that these funds has low portfolio return volatility and
skewness. Finally, the high DR fund shows the characteristics of the manager with superior skills. The results
show that funds in the top DR decile have highest Active Shares, the lowest R-squared, and the second highest
Industry Concentration Index. In line with the regression results of the DR determinants, funds with high degree
of diversification have higher manager’s activeness and selectivity. However, ICI measure has a U-shaped relation
with DR in univariate analysis, contrast to the negative coefficient of ICI on DR in the multivariate regression.
We further discuss these relation between skill measures and DR in the following section. In summary, the results
show that high DR funds are not only well-diversified, but also invest in the stocks with high expected return in
broad sense and have superior managerial skill.

18
5.3. Relation with DR and Skill measures
In this section, we decompose the DR measure to get more insight on how DR and skill measures are related
to each other. As shown earlier, the DR of a portfolio can be decomposed into two factors, weighted-concentration
ratio (CR) and weighted-correlation (CORR). The fund can have high DR value in both cases when it has a little
concentration ratio or when it has less correlated assets. Therefore, we consider both of CR and CORR values of
each fund to analyze what factor drives the size of DR. We first sort funds into decile based on each skill measure,
then calculate average DR and its factors, CORR and CR, for each decile skill fund portfolio. We also calculate
the average number of stocks and proportion of common stocks for each decile portfolio to analyze portfolio
construction related characteristics. We have included various skill measures that are considered to be associated
with DR.
[Insert Table 9]
Table 9 shows the average values of the diversification related measures of the portfolios sorted by various
skill measures. In Panel A, the average DR value of a portfolio sorted by each skill measure indicates that the
portfolio with a better skill measure have higher DR values. This is consistent with our previous result of analyzing
the skill related characteristics of DR sorted fund portfolio. In Panel B, we find a difference between DR and other
skill measures in relation of CR values. The funds with high DR have relatively low CR value, so we can consider
this CR value as one of the factors that increases the DR value. However, funds with other superior skill measures
have high CR value, which is contrast to their higher DR values. This implies that the high DR values of the funds
with superior skills are not the result of low concentrated weight in their portfolio. As noted in Sebastian and
Attaluri (2014), the existing skill measures, especially, Active Shares, R-squared, ICI and Number of Stocks are
closely related to the high-conviction strategy, so these managerial skills are more related to concentration rather
than diversification with respect to the weighting scheme in their portfolio. Panel C, we presents the average
CORR value of a portfolio sorted by each of skill measure. Since the high DR funds have relatively low CORR
value, we consider this CORR value as another factor that increases DR. For the portfolio sorted by other skill
measures, it is important to note that skillful funds have a low CORR value. Note that, there is no change in the
value of CR as the Number of Stocks measure increases, since this measure only contains information about the
concentration. Therefore, the high DR value of funds with superior concentration skill, except for number of
stocks, is the result of a low correlation between the concentrated bets with the assets within their portfolio.

19
We suggest that skillful funds could success in investing by lowering the correlation among their investments
assets, as efficiently deviate from the benchmark and multifactor model (Active Shares, R-Squared), and the
efficiently concentrate on few industry (ICI). That is, the comparative advantage of superior funds relative to
inferior funds is that their investments are made in the direction of lowering portfolio correlation. Thus, their
superior performance is consistent with the diversification benefit in classical financial theory that efficient
investments eventually leads to a higher Sharpe ratio. We conclude that the spirit of diversification is inherent in
existing skill measures.
[Insert Table 10]
In Table 10, we repeat the previous analysis with only replacing the DR related variables to number of stocks
and portion of common stocks. The results indicate that funds with superior skills have a small number of common
stocks in their portfolio, while these common stocks account for a small portion of total net asset. As shown above,
we identified that the number of stocks measure simply proxies how much the investment bets are concentrated
or diversified, and does not account for the correlation among these bets at all. Regardless of the diversification,
if the number of stocks increases, the portfolio becomes similar to the market index, making it difficult to
outperform the market index. Therefore, we suggest that skilled funds actively make concentrated bets in fewer
stocks with high conviction, which attribute to the superior performance over benchmarks or market index. Next,
the proportion of common stock measure is a proxy for how much the fund manager considers asset allocation in
portfolio management. In contrast to the number of stocks measure, the fact that skilled fund manager have smaller
portion of common stocks in their total net asset is far from high conviction investment. Rather, they seem to
invest in consideration of asset allocation. To summary, although skilled fund managers make a concentrated
investment with confidence, they have a diversified portfolio in terms of overall asset allocation.

20
5.4. Double sorting analysis with DR and Skill measures
In this section, we analyzes how the explanatory power of existing skill measures on future fund performance
varies with the DR value of the fund. We analyze the direct relation between the DR and the various skill measures
through a double sorting analysis. In each month, we first sort entire funds based on the DR and divide into five
quintiles. Next, we sort funds within each DR quintile to divide them into five quintiles based on the each skill
measure. After this 5 by 5 sort, we finally construct 25 portfolios, and then calculate the average returns for each
of the 25 portfolios in the next month. If the explanatory power of the skill measure is maintained regardless of
the value of DR, the return of the high minus low portfolio in each DR quartile will be significant. For skill
measures, we include Active Share and R-square which have a high relevance to DR, and also include ICI and
Number of Stocks to match with DR measure.
[Insert Table 11]
Table 11 shows the results of the predictive power of Active Share and R-square after controlling for the DR
measure. In Panel A for the Active Share variable, there is a statistically significant difference in raw returns of
0.34 and 0.44 at the 1% level between high Active Share and low Active Share funds only in the fourth and fifth
DR quintiles, respectively. The Fama-French 4 factor alpha of high minus low Active Shares only shows
statistically significant difference in the highest DR quintile, with a value of 0.19 and significant at the 10% level.
That is, after controlling for DR, the predictive power of Active Shares for future fund returns only exists in high
DR fund groups. Panel B shows the results for the R-squared measure. In case of raw return, we find that the
return differences between low R-squared and high R-squared funds are -0.20 in both of second and third DR
quintile, which is marginally significant at 10% levels. However, in case of Fama-French 4 factor alpha, there is
no statistically significant difference between low minus high R-squared funds. Therefore, we conclude that the
DR variable subsumes the explanatory power of the existing skill variables of Active Share and R-squared, to
some extent.
[Insert Table 12]
Table 12 presents the results of the predictive power of concentration and diversification related measure,
Industry Concentration Index and Number of Stocks measure. In Panel A, we find that the significant differences
in raw returns between high ICI and low ICI funds in three out of five DR quintiles, although the direction
predicted by ICI is reversed in the lowest DR quintile. However, in case of Fama-French 4 factor alpha, the
statistical significance of the future performance difference between high ICI and low ICI funds disappears in all

21
DR deciles. Panel B shows the results of Number of Stocks variable, which is a very simple substitute for
diversification measure. For the raw return, funds with the high number of stocks appears to have higher return
than the funds with low number of stocks in the higher DR group, but there is no statistically significant difference.
In addition, for the Fama-French 4 factor alpha, there is no statistically significant difference in all DR quintiles,
and the direction predicted by this measure is also reversed. Thus, we conclude that although ICI and Number of
Stocks measures contain some information about concentration or diversification, their predictive power is not as
strong as the predictive power of DR.
22
6. Conclusion
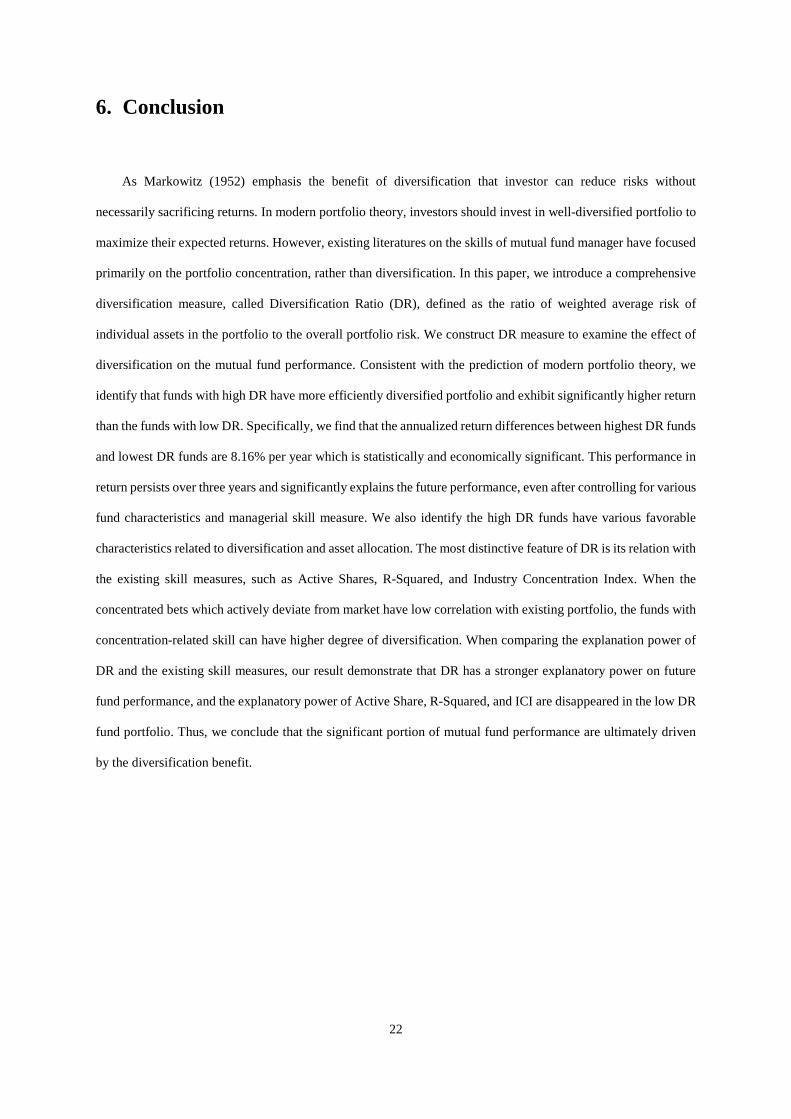
As Markowitz (1952) emphasis the benefit of diversification that investor can reduce risks without
necessarily sacrificing returns. In modern portfolio theory, investors should invest in well-diversified portfolio to
maximize their expected returns. However, existing literatures on the skills of mutual fund manager have focused
primarily on the portfolio concentration, rather than diversification. In this paper, we introduce a comprehensive
diversification measure, called Diversification Ratio (DR), defined as the ratio of weighted average risk of
individual assets in the portfolio to the overall portfolio risk. We construct DR measure to examine the effect of
diversification on the mutual fund performance. Consistent with the prediction of modern portfolio theory, we
identify that funds with high DR have more efficiently diversified portfolio and exhibit significantly higher return
than the funds with low DR. Specifically, we find that the annualized return differences between highest DR funds
and lowest DR funds are 8.16% per year which is statistically and economically significant. This performance in
return persists over three years and significantly explains the future performance, even after controlling for various
fund characteristics and managerial skill measure. We also identify the high DR funds have various favorable
characteristics related to diversification and asset allocation. The most distinctive feature of DR is its relation with
the existing skill measures, such as Active Shares, R-Squared, and Industry Concentration Index. When the
concentrated bets which actively deviate from market have low correlation with existing portfolio, the funds with
concentration-related skill can have higher degree of diversification. When comparing the explanation power of
DR and the existing skill measures, our result demonstrate that DR has a stronger explanatory power on future
fund performance, and the explanatory power of Active Share, R-Squared, and ICI are disappeared in the low DR
fund portfolio. Thus, we conclude that the significant portion of mutual fund performance are ultimately driven
by the diversification benefit.

23
Reference
Amihud, Y., and R. Goyenko, 2013, Mutual Fund’s R2 as Predictor of Performance, Review of Financial Studies 26, 667–694.
Baks, K., J.a. Busse, and T.C. Green, 2006, Fund managers who take big bets: skilled or overconfident, Papers.Ssrn.Com.
Berk, Jonathan B., and Richard C. Green, 2004, Mutual Fund Flows and Performance in Rational Markets, Journal of Political Economy 112, 1269–1295.
Brands, Simone, Stephen J. Brown, and David R. Gallagher, 2006, Portfolio concentration and investment manager performance, International Review of Finance 5, 149–174.
Brown, Keith C., W.V. Harlow, and Laura T. Starks, 1996, Of tournaments and temptations: An analysis of managerial incentives in the mutual fund industry, The Journal of Finance 51, 85–110.
Brown, Stephen J, William N Goetzmann, and James Park, 2001, Careers and survival: Competition and risk in the hedge fund and CTA industry, Journal of Finance 56, 1869–1886.
Carhart, M., 1997, On persistence in mutual fund performance, Journal of Finance 52, 57–82.
Chang, Eric C, and Yan Luo, 2013, Do Mutual Funds Gamble? Evidence from the Skewness-Adjusting Behavior of Fund Managers *, Working Paper.
Cheng, P., and S. E. Roulac, 2007, Measuring the Effectiveness of Geographical Diversification, Journal of Real Estate Portfolio Management 13, 29–44.
Choueifaty, Yves, and Yves Coignard, 2008, Toward Maximum Diversification, The Journal of Portfolio Management 35, 40–51.
Choueifaty, Yves, Tristan Froidure, and Julien Reynier, 2013, Properties of the Most Diversified Portfolio, Journal of Investment Strategies 2, 49–70.
Cremers, K. J Martijn, and Antti Petajisto, 2009, How Active Is Your Fund Manager A New Measure That Predicts Performance, Review of Financial Studies 22, 3329–3365.
De Wit, Dirk P. M., 1997, Real Estate Diversification Benefits, Journal Of Real Estate Research 14, 117–135.
Elton, Edwin J., Martin J. Gruber, and Christopher R. Blake, 1996, Survivorship bias and mutual fund performance, Review of Financial Studies 9, 1097–1120.
Evans, John L., and Stephen H. Archer, 1968, Diversification and the reduction of dispersion: an empirical analysis, Journal of Finance 23, 761–767.
Evans, Richard B., 2010, Mutual fund incubation, Journal of Finance 65, 1581–1611.
Fama, Eugene F., and Kenneth R. French, 1993, Common risk factors in the returns on stocks and bonds, Journal of Financial Economics 33, 3–56.
Fama, Eugene F., and James D. MacBeth, 1973, Risk, Return, and Equilibrium: Empirical Tests, Journal of Political Economy 81, 607–636.
Haugen, Robert A, and Nardin L Baker, 1991, The efficient market inefficiency of capitalization–weighted stock portfolios, The Journal of Portfolio Management 17, 35–40.
Hight, Grogory, 2009, A New Way to Look at Correlations: The Incremental Diversification Effect Measure, Journal of Indexes.
Hiraki, Takato, Ming Liu, and Xue Wang, 2015, Country and industry concentration and the performance of international mutual funds, Journal of Banking & Finance 59, 297–310.
Huang, Jennifer, Clemens Sialm, and Hanjiang Zhang, 2011, Risk shifting and mutual fund performance, Review of Financial Studies 24, 2575–2616.
Kacperczyk, Marcin, Clemens Sialm, and Lu Zheng, 2005, On the Industry Concentration of Actively Managed Equity Mutual Funds, The Journal of Finance 60, 1983–2011.
Kacperczyk, Marcin, Clemens Sialm, and Lu Zheng, 2008, Unobserved Actions of Mutual Funds, Review of Financial Studies 21, 2379–2416.

24
Lin, Jerchern, 2011, Fund Convexity and Tail Risk-Taking, Working Paper.
Markowitz, Harry, 1952, Portfolio Selection, 7, 77–91.
Petajisto, Antti, 2013, Active share and mutual fund performance, Financial Analysts Journal 69, 73–93.
Sapp, Travis, and Xuemin Yan, 2008, Security Concentration and Active Fund Management: Do Focused Funds Offer Superior Performance?, The Financial Review 43, 27–49.
Sebastian, Mike, and Sudhakar Attaluri, 2014, Conviction in Equity Investing, The Journal of Portfolio Management 40, 77–88.
Sensoy, Berk A., 2009, Performance evaluation and self-designated benchmark indexes in the mutual fund industry, Journal of Financial Economics 92, 25–39.
Sharpe, William F., 1964, Capital Asset Prices: A Theory of Market Equilibrium under Conditions of Risk, The Journal of Finance 19, 425.
Shawky, Hany a., and David M. Smith, 2005, Optimal Number of Stock Holdings in Mutual Fund Portfolios Based on Market Performance, The Financial Review 40, 481–495.
Simutin, Mikhail, 2014, Cash holdings and mutual fund performance, Review of Finance 18, 1425–1464.
Wermers, Russ, 2000, Mutual Fund Performance: An Empirical Decomposition into Stock-Picking Talent, Style, Transactions Costs, and Expenses, The Journal of Finance 55, 1655–1695.

25
Table 1. Summary Statistics for DR measures DR (Vol) DR (VaR) DR (ES)
Panel A: Distribution of the Measure
Mean 1.94 1.77 1.92
Median 1.89 1.69 1.86
Std. Dev 0.46 0.45 0.50
Skewness 1.36 1.65 1.20
Kurtosis 3.72 4.55 2.92
Min 1.12 1.02 1.03
Max 5.63 4.75 5.43
Panel B: Correlation Structure DR (Vol) DR (VaR) DR (ES)
DR (Vol) 1.00 0.93 0.95
DR (VaR) 0.93 1.00 0.94
DR (ES) 0.95 0.94 1.00

26
Table 2. The Future Performance on Portfolios of Funds sorted on Diversification Ratio (DR) Gross Return Net Return
MKT SMB HML UMD Adj R2 DR Decile Return Alpha Return Alpha
Low 0.28 -0.11 0.18 -0.20 1.11 0.04 -0.25 0.02 96% (0.65) (-1.17)
(0.42) (-2.22) (50.17) (1.55) (-8.67) (1.32)
2 0.35 -0.05 0.26 -0.14 1.06 0.00 -0.14 -0.01 97% (0.89) (-0.68)
(0.66) (-2.06) (65.50) (-0.17) (-6.70) (-0.87)
3 0.42 0.00 0.32 -0.10 1.04 -0.02 -0.07 -0.01 98% (1.09) (-0.08)
(0.85) (-1.61) (72.10) (-1.08) (-3.70) (-0.96)
4 0.51 0.04 0.42 -0.06 1.02 0.01 0.02 0.00 98% (1.38) (0.75)
(1.12) (-1.23) (88.54) (0.93) (1.51) (0.02)
5 0.54 0.01 0.45 -0.08 1.02 0.10 0.06 0.02 98% (1.46) (0.26)
(1.20) (-1.54) (78.50) (6.02) (3.34) (1.88)
6 0.66 0.09 0.56 -0.01 1.00 0.16 0.10 0.01 97% (1.75) (1.26)
(1.49) (-0.15) (60.04) (7.52) (4.83) (0.59)
7 0.76 0.11 0.66 0.01 0.99 0.26 0.16 0.02 97% (1.98) (1.52)
(1.71) (0.15) (55.71) (11.34) (7.05) (1.74)
8 0.82 0.13 0.72 0.03 1.00 0.33 0.19 0.04 96% (2.09) (1.67)
(1.83) (0.35) (53.81) (13.55) (7.79) (2.97)
9 0.88 0.15 0.78 0.05 0.99 0.38 0.23 0.04 96% (2.24) (1.85)
(1.98) (0.57) (49.51) (14.86) (8.89) (2.92)
High 0.97 0.20 0.86 0.08 0.92 0.46 0.30 0.01 95% (2.52) (2.24)
(2.22) (0.95) (42.80) (16.51) (10.95) (0.60)
High-Low 0.69 0.31 0.68 0.29 -0.20 0.41 0.55 -0.01 53% (3.32) (2.09)
(3.23) (1.97) (-5.56) (8.98) (12.02) (-0.47)

27
Table 3. Performance Persistence of Portfolios of Funds sorted on Diversification Ratio (DR) Months after Formation Period
DR t+1 t+3 t+6 t+9 t+12 t+24 t+36 t+48 t+60
Panel A: Raw Return
Low DR 0.18 0.17 0.27 0.17 0.32 0.49 0.74 0.64 0.69 (0.42) (0.41) (0.64) (0.42) (0.81) (1.31) (1.94) (1.60) (1.57)
2 0.26 0.29 0.33 0.27 0.39 0.53 0.74 0.67 0.66 (0.66) (0.74) (0.86) (0.71) (1.05) (1.44) (1.95) (1.68) (1.52)
3 0.32 0.33 0.40 0.32 0.43 0.58 0.77 0.69 0.66 (0.85) (0.87) (1.06) (0.86) (1.16) (1.55) (2.03) (1.72) (1.52)
4 0.42 0.43 0.43 0.40 0.49 0.61 0.78 0.72 0.66 (1.12) (1.18) (1.15) (1.08) (1.33) (1.61) (2.02) (1.77) (1.51)
5 0.45 0.49 0.46 0.43 0.52 0.65 0.80 0.76 0.73 (1.20) (1.31) (1.22) (1.14) (1.38) (1.69) (2.04) (1.85) (1.63)
6 0.56 0.51 0.56 0.49 0.60 0.67 0.86 0.77 0.73 (1.49) (1.34) (1.46) (1.28) (1.55) (1.71) (2.18) (1.81) (1.59)
7 0.66 0.63 0.62 0.52 0.65 0.70 0.89 0.79 0.77 (1.71) (1.64) (1.61) (1.32) (1.65) (1.74) (2.17) (1.86) (1.65)
8 0.72 0.67 0.68 0.59 0.69 0.76 0.92 0.77 0.78 (1.83) (1.72) (1.73) (1.49) (1.72) (1.87) (2.20) (1.76) (1.65)
9 0.78 0.74 0.74 0.68 0.77 0.81 0.91 0.84 0.78 (1.98) (1.87) (1.85) (1.68) (1.90) (1.95) (2.15) (1.88) (1.62)
High DR 0.86 0.80 0.82 0.74 0.84 0.85 0.96 0.83 0.76 (2.22) (2.10) (2.12) (1.88) (2.11) (2.06) (2.30) (1.88) (1.59)
High-Low 0.68 0.63 0.56 0.57 0.52 0.36 0.22 0.19 0.07 (3.23) (3.13) (2.88) (3.05) (2.95) (2.59) (1.79) (1.64) (0.56)
Panel B: Fama-French 4 Factor Alpha
Low DR -0.20 -0.21 -0.18 -0.20 -0.22 -0.18 -0.13 -0.14 -0.08 (-2.22) (-2.46) (-2.20) (-2.71) (-2.89) (-3.27) (-2.04) (-2.38) (-1.23)
2 -0.14 -0.13 -0.15 -0.16 -0.18 -0.16 -0.13 -0.12 -0.10 (-2.06) (-1.92) (-2.55) (-2.67) (-3.60) (-3.80) (-2.72) (-3.03) (-2.11)
3 -0.10 -0.11 -0.09 -0.14 -0.17 -0.13 -0.10 -0.10 -0.10 (-1.61) (-1.98) (-1.77) (-2.79) (-3.75) (-3.47) (-2.63) (-2.60) (-2.39)
4 -0.06 -0.06 -0.11 -0.09 -0.12 -0.11 -0.11 -0.08 -0.11 (-1.23) (-1.11) (-2.12) (-2.03) (-2.77) (-3.19) (-2.71) (-2.08) (-3.01)
5 -0.08 -0.04 -0.12 -0.09 -0.12 -0.10 -0.10 -0.05 -0.06 (-1.54) (-0.77) (-2.35) (-1.77) (-2.61) (-2.45) (-2.47) (-1.17) (-1.23)
6 -0.01 -0.06 -0.08 -0.07 -0.09 -0.10 -0.06 -0.06 -0.07 (-0.15) (-0.91) (-1.23) (-1.34) (-1.64) (-2.37) (-1.25) (-1.24) (-1.27)
7 0.01 0.00 -0.07 -0.09 -0.07 -0.11 -0.06 -0.04 -0.04 (0.15) (0.06) (-1.02) (-1.33) (-1.11) (-2.11) (-1.12) (-0.74) (-0.70)
8 0.03 0.02 -0.05 -0.06 -0.08 -0.08 -0.06 -0.08 -0.04 (0.35) (0.21) (-0.64) (-0.80) (-1.26) (-1.41) (-0.94) (-1.36) (-0.68)
9 0.05 0.04 -0.04 -0.02 -0.04 -0.06 -0.09 -0.02 -0.06 (0.57) (0.52) (-0.46) (-0.22) (-0.57) (-0.98) (-1.40) (-0.43) (-0.97)
High DR 0.08 0.08 0.00 0.00 -0.01 -0.04 -0.03 -0.02 -0.07 (0.95) (0.88) (0.05) (0.02) (-0.13) (-0.64) (-0.57) (-0.36) (-1.03)
High-Low 0.29 0.28 0.19 0.20 0.21 0.14 0.10 0.12 0.02 (1.97) (2.00) (1.34) (1.59) (1.65) (1.59) (1.02) (1.53) (0.18)

28
Table 4. Measure Persistence of Portfolios of Funds sorted on Diversification Ratio (DR) Months after Formation Period
t t+3 t+6 t+9 t+12 t+24 t+36 t+48 t+60
Low DR 1.55 1.59 1.63 1.66 1.68 1.69 1.71 1.71 1.71 (95.45) (99.11) (100.42) (100.02) (99.42) (95.89) (82.19) (71.78) (62.16)
2 1.67 1.69 1.70 1.72 1.72 1.72 1.72 1.74 1.72 (90.02) (92.65) (94.73) (93.70) (94.02) (94.07) (81.74) (69.69) (61.20)
3 1.74 1.75 1.75 1.76 1.76 1.75 1.74 1.74 1.73 (85.77) (88.98) (90.36) (90.07) (89.91) (93.74) (81.65) (72.32) (62.83)
4 1.80 1.80 1.80 1.80 1.79 1.77 1.75 1.75 1.74 (82.34) (85.34) (87.00) (87.22) (88.65) (91.69) (85.57) (75.18) (67.80)
5 1.86 1.85 1.84 1.83 1.82 1.79 1.77 1.77 1.76 (79.61) (82.96) (84.72) (86.14) (87.51) (88.66) (84.09) (77.18) (69.58)
6 1.92 1.90 1.89 1.87 1.86 1.83 1.80 1.80 1.78 (77.10) (81.13) (83.36) (84.11) (85.21) (84.78) (80.63) (77.69) (72.81)
7 1.99 1.97 1.94 1.92 1.90 1.86 1.84 1.83 1.81 (73.75) (77.54) (81.15) (83.46) (85.46) (82.49) (81.95) (76.94) (74.13)
8 2.08 2.05 2.01 1.99 1.96 1.92 1.88 1.87 1.84 (69.06) (73.66) (78.34) (80.42) (82.92) (80.41) (81.66) (76.51) (72.41)
9 2.20 2.15 2.10 2.07 2.04 1.98 1.93 1.92 1.89 (62.67) (68.23) (73.66) (76.22) (79.65) (79.17) (81.07) (74.32) (69.86)
High DR 2.64 2.54 2.46 2.41 2.36 2.26 2.20 2.16 2.10 (57.39) (61.55) (66.48) (68.77) (71.71) (74.20) (77.87) (76.98) (77.99)
High-Low 1.09 0.95 0.84 0.75 0.68 0.57 0.49 0.45 0.39 (31.23) (31.34) (32.23) (32.02) (32.74) (35.29) (48.68) (50.90) (35.66)
Diff DR2 4.55 3.92 3.42 3.05 2.74 2.25 1.92 1.75 1.50

29
Table 5. Fama-MacBeth Cross-sectional Regression on the Future Fund Performance Explanatory Variable Dependent Variable: Performance
Intercept 0.47 0.36 0.33 0.35 0.32 0.23 0.19 0.21
(1.22) (0.91) (0.83) (0.90) (0.65) (0.44) (0.36) (0.41)
DR(Vol)
0.17
0.24
(2.66)
(2.54)
DR(VaR)
0.16
0.22
(2.56)
(2.55)
DR(ES)
0.17
0.24 (2.50)
(2.42)
log(TNA) -0.05 -0.03 -0.03 -0.03 -0.03 -0.02 -0.02 -0.02
(-2.20) (-2.02) (-1.99) (-2.05) (-1.82) (-1.40) (-1.44) (-1.43)
log(Age) 0.02 0.02 0.01 0.02 0.00 0.00 0.00 0.00
(1.93) (1.56) (1.52) (1.63) (0.24) (-0.19) (-0.23) (-0.06)
Turnover 0.01 0.01 0.02 0.02 0.00 0.01 0.02 0.02
(0.17) (0.35) (0.47) (0.50) (-0.02) (0.30) (0.42) (0.48)
Expense 0.00 -0.02 -0.01 -0.02 -0.03 -0.04 -0.03 -0.03
(-0.10) (-0.98) (-0.84) (-0.97) (-2.70) (-3.41) (-2.88) (-3.25)
Flow 0.05 0.03 0.03 0.03 0.04 0.03 0.03 0.02
(3.17) (2.47) (2.33) (2.27) (2.29) (1.77) (1.64) (1.53)
Number of Stocks 0.05 0.02 0.03 0.02 0.16 0.10 0.11 0.10
(2.72) (1.76) (1.88) (1.79) (3.26) (2.62) (2.65) (2.57)
Past Performance 0.39 0.38 0.38 0.39 0.40 0.39 0.38 0.39
(2.49) (2.56) (2.54) (2.57) (2.21) (2.19) (2.13) (2.21)
Active Share
0.22 0.18 0.19 0.18 (3.15) (2.79) (2.78) (2.72)
R-Squared
-0.09 -0.02 -0.02 -0.02 (-1.95) (-0.47) (-0.50) (-0.62)
Industry Concentration
-0.08 -0.04 -0.04 -0.04 (-1.90) (-1.05) (-1.15) (-1.11)
Return Gap
0.04 0.05 0.04 0.04 (2.19) (2.34) (2.02) (2.11)
Risk Shifting
-0.10 -0.19 -0.19 -0.18 (-2.23) (-2.46) (-2.77) (-2.50)
Adjusted R-square 0.18 0.22 0.21 0.22 0.34 0.37 0.36 0.37
30
Table 6. Determinants Regression of Diversification Ratio
Explanatory Variable Dependent Variable DR (Vol) Dependent Variable
DR (VaR) Dependent Variable DR (CVaR)
Intercept 2.00 2.08
1.84 1.90
1.97 2.08
(32.91) (32.14)
(30.21) (28.44)
(29.26) (29.75)
log(TNA) 0.01 0.00
0.01 0.00
0.01 0.00
(1.46) (-0.16)
(1.31) (0.29)
(1.19) (0.32)
log(Age) -0.01 0.00
-0.01 0.00
-0.01 0.00
(-2.43) (2.33)
(-2.35) (1.82)
(-3.37) (-0.33)
Turnover 0.03 0.00
0.01 -0.01
0.00 -0.01
(3.73) (0.28)
(1.41) (-2.18)
(0.42) (-1.91)
Expense 0.06 0.01
0.05 0.00
0.06 0.00
(20.20) (3.74)
(18.35) (2.10)
(18.34) (2.32)
Flow 0.02 0.01
0.02 0.01
0.02 0.01
(4.01) (2.45)
(4.74) (3.30)
(4.39) (2.87)
Number of Stocks 0.04 0.11
0.03 0.09
0.04 0.11
(4.03) (6.11)
(3.67) (5.47)
(4.32) (6.72)
Past Performance 0.04 0.05
0.03 0.04
0.05 0.05
(2.09) (2.73)
(1.87) (2.82)
(2.34) (2.64)
Active Share
0.08
0.06
0.10 (7.09)
(4.98)
(8.56)
R-Squared
-0.11
-0.10
-0.09 (-10.90)
(-10.92)
(-9.66)
Industry Concentration
-0.06
-0.05
-0.06 (-6.91)
(-7.63)
(-7.27)
Return Gap
0.00
0.00
0.01 (-0.96)
(1.19)
(2.65)
Risk Shifting
0.38
0.35
0.41 (8.50)
(8.47)
(8.11)
Adjusted R-square 0.11 0.56 0.09 0.52 0.11 0.56

31
Table 7. General Characteristics of Portfolios of Funds sorted on Diversification Ratio (DR) Low DR 2 3 4 5 6 7 8 9 High DR Average DR 1.55 1.67 1.74 1.80 1.86 1.92 1.99 2.08 2.20 2.64
Average Return 0.36% 0.40% 0.44% 0.50% 0.56% 0.65% 0.71% 0.82% 0.88% 0.86% Standard Deviation 1.51% 1.38% 1.34% 1.31% 1.31% 1.32% 1.32% 1.32% 1.30% 1.20% Skewness -0.019 -0.034 -0.040 -0.050 -0.060 -0.068 -0.078 -0.093 -0.103 -0.125 Kurtosis 1.81 1.40 1.37 1.33 1.30 1.25 1.23 1.14 1.09 1.19 TNA (millions) 1270.2 1452.0 1442.1 1468.1 1426.7 1310.9 1314.3 1268.4 1241.0 1200.3 Age 14.1 14.9 14.8 14.5 14.3 13.9 13.6 13.1 12.4 11.9 Flow -0.16% -0.07% 0.00% 0.07% 0.19% 0.28% 0.31% 0.45% 0.56% 0.83% Turnover Ratio 0.84 0.77 0.79 0.80 0.82 0.85 0.90 0.91 0.93 0.95 Expense Ratio 1.21% 1.15% 1.14% 1.17% 1.19% 1.21% 1.24% 1.26% 1.30% 1.40% Management Fee 0.69% 0.66% 0.66% 0.67% 0.68% 0.70% 0.72% 0.74% 0.77% 0.86% # of Stocks 88.1 103.9 118.1 126.3 130.7 133.1 135.7 147.5 153.7 129.8
% Common Stock 95.66 95.89 95.74 95.20 95.00 94.84 94.68 94.27 93.71 91.64 % Preferred Stock 0.028 0.022 0.020 0.022 0.021 0.024 0.026 0.028 0.040 0.047 % Cash 1.94 1.91 2.06 2.44 2.52 2.77 2.93 2.99 3.53 5.26 % Bond 0.27 0.25 0.25 0.36 0.40 0.38 0.38 0.51 0.72 0.89 % Others 1.80 1.54 1.54 1.63 1.61 1.63 1.72 1.72 1.68 1.65

32
Table 8. Investment Style and Managerial Skill related Characteristics of Portfolios of Funds sorted on Diversification Ratio (DR) Low DR 2 3 4 5 6 7 8 9 High DR
Average DR 1.55 1.67 1.74 1.80 1.86 1.92 1.99 2.08 2.20 2.64
Beta Score 5.83 5.80 5.81 5.82 5.88 5.93 5.98 6.02 6.03 5.95
Size Score 9.67 9.65 9.58 9.49 9.34 9.14 8.89 8.58 8.22 7.62
BM Score 3.90 3.94 3.91 3.93 3.96 4.04 4.10 4.16 4.25 4.57
Momentum Score 6.03 6.02 6.04 6.08 6.15 6.17 6.23 6.27 6.28 6.29
Standard dev Score 2.78 2.75 2.83 2.92 3.10 3.30 3.51 3.75 3.99 4.31
Skewness Score 4.32 4.32 4.36 4.39 4.46 4.53 4.61 4.68 4.76 4.89
Analyst Coverage Score 8.19 8.14 8.05 7.91 7.68 7.38 7.06 6.67 6.27 5.62
# of Inst. Owner Score 9.79 9.76 9.69 9.61 9.48 9.30 9.09 8.82 8.51 7.96
Active Share 69.01% 66.50% 67.08% 68.84% 71.73% 75.64% 78.92% 82.25% 85.22% 89.17%
Tracking Error 7.58% 5.96% 5.61% 5.64% 5.90% 6.35% 6.47% 6.79% 7.22% 8.77%
ICI 5.74% 3.78% 3.49% 3.63% 3.71% 3.97% 4.24% 4.27% 4.65% 5.71%
R-squared 92.64% 94.04% 94.06% 93.67% 93.21% 92.61% 92.03% 91.58% 90.93% 88.21%
Risk Shifting -0.10% 0.10% 0.16% 0.21% 0.26% 0.35% 0.45% 0.55% 0.71% 1.05%
Return Gap -0.004% -0.010% -0.004% -0.013% -0.015% -0.004% -0.006% -0.004% 0.002% -0.025%

33
Table 9. Diversification and Its Component of Each Skill Measure Sorted Portfolio
Sorting Variable Low 2 3 4 5 6 7 8 9 High
Panel A: Average Value of Diversification Ratio (DR)
DR 1.55 1.67 1.74 1.80 1.86 1.92 1.99 2.08 2.20 2.64
Active Share 1.90 1.88 1.90 1.93 1.97 2.03 2.10 2.15 2.22 2.42
R-squared 2.19 2.03 1.99 1.97 1.95 1.92 1.89 1.87 1.83 1.81
Industry Concentration 1.83 1.90 1.92 1.94 1.94 1.95 1.95 1.98 2.01 2.01
Number of Stocks 1.90 1.91 1.91 1.92 1.94 1.94 1.95 1.97 1.99 2.01
Panel B: Average Value of Concentration Ratio (CR)
DR 0.031 0.025 0.023 0.023 0.022 0.022 0.022 0.021 0.020 0.024
Active Share 0.014 0.018 0.021 0.024 0.025 0.024 0.023 0.023 0.025 0.035
R-squared 0.039 0.029 0.026 0.025 0.023 0.022 0.020 0.019 0.017 0.014
Industry Concentration 0.015 0.018 0.020 0.021 0.022 0.022 0.023 0.025 0.027 0.038
Number of Stocks 0.053 0.035 0.029 0.025 0.022 0.019 0.017 0.015 0.012 0.008
Panel C: Average Value of Correlation of the Assets (CORR)
DR 0.40 0.34 0.31 0.29 0.27 0.25 0.24 0.22 0.19 0.12
Active Share 0.27 0.27 0.26 0.25 0.24 0.22 0.21 0.20 0.18 0.14
R-squared 0.18 0.22 0.23 0.24 0.25 0.26 0.26 0.27 0.29 0.29
Industry Concentration 0.29 0.26 0.25 0.25 0.25 0.25 0.25 0.24 0.23 0.22
Number of Stocks 0.24 0.25 0.25 0.25 0.25 0.25 0.25 0.25 0.24 0.24

34
Table 10. Portfolio Construction related Characteristics of Each Skill Measure Sorted Portfolio
Sorting Variable Low 2 3 4 5 6 7 8 9 High
Panel A: Average Number of Stocks
DR 88.1 103.9 118.1 126.3 130.7 133.1 135.7 147.5 153.7 129.8
Active Share 302.5 144.0 120.3 107.8 108.4 110.1 106.3 96.6 78.7 56.2
R-squared 60.2 73.1 83.1 89.9 99.1 108.9 124.1 144.9 168.5 311.8
Industry Concentration 229.5 175.2 141.7 125.9 115.8 111.3 107.8 97.8 87.5 74.5
Number of Stocks 29.49 43.41 53.36 63.70 74.30 86.77 102.42 126.86 183.58 502.92
Panel B: Average Portion of Common Stocks
DR 95.66 95.89 95.74 95.20 95.00 94.84 94.68 94.27 93.71 91.64
Active Share 96.55 95.83 95.66 95.65 96.03 95.49 95.46 94.48 94.71 93.51
R-squared 92.50 94.35 94.67 94.92 94.77 94.77 94.90 94.87 95.18 95.52
Industry Concentration 96.17 94.90 94.63 94.59 94.47 94.37 94.72 94.29 94.17 94.01
Number of Stocks 93.59 94.08 94.38 94.34 94.85 95.25 95.08 95.08 94.97 94.78
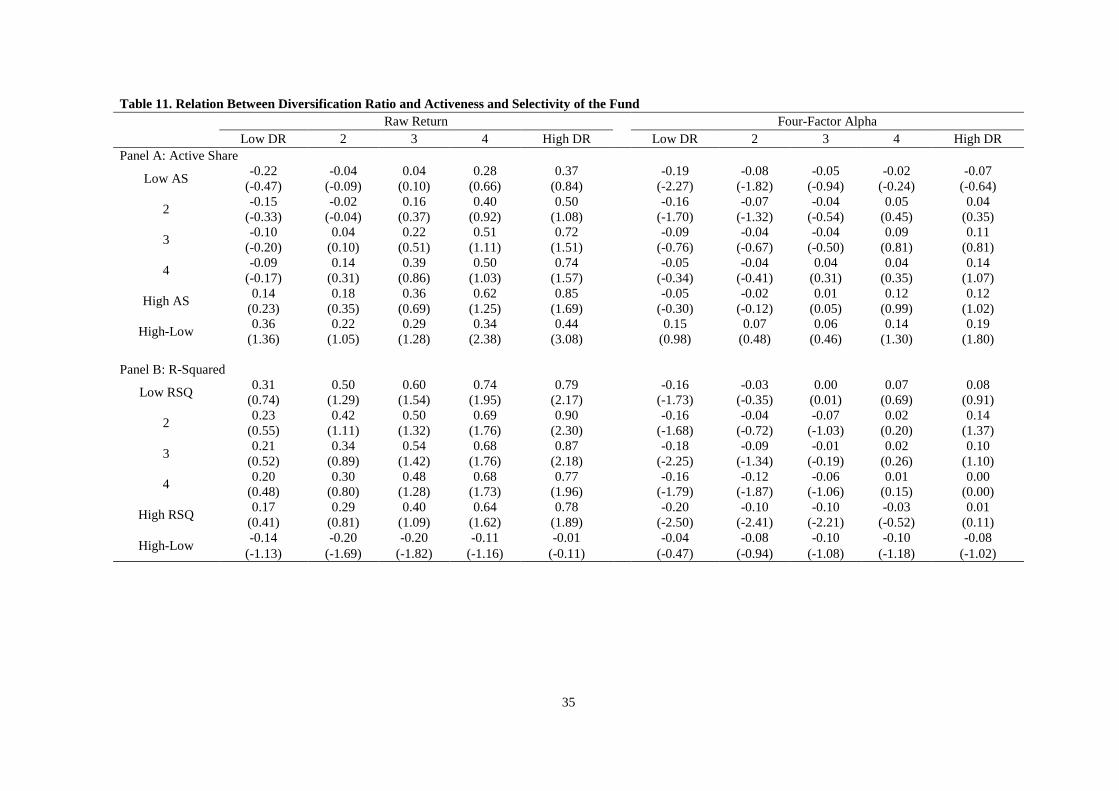
35
Table 11. Relation Between Diversification Ratio and Activeness and Selectivity of the Fund Raw Return Four-Factor Alpha Low DR 2 3 4 High DR Low DR 2 3 4 High DR Panel A: Active Share
Low AS -0.22 -0.04 0.04 0.28 0.37 -0.19 -0.08 -0.05 -0.02 -0.07 (-0.47) (-0.09) (0.10) (0.66) (0.84) (-2.27) (-1.82) (-0.94) (-0.24) (-0.64)
2 -0.15 -0.02 0.16 0.40 0.50 -0.16 -0.07 -0.04 0.05 0.04 (-0.33) (-0.04) (0.37) (0.92) (1.08) (-1.70) (-1.32) (-0.54) (0.45) (0.35)
3 -0.10 0.04 0.22 0.51 0.72 -0.09 -0.04 -0.04 0.09 0.11 (-0.20) (0.10) (0.51) (1.11) (1.51) (-0.76) (-0.67) (-0.50) (0.81) (0.81)
4 -0.09 0.14 0.39 0.50 0.74 -0.05 -0.04 0.04 0.04 0.14 (-0.17) (0.31) (0.86) (1.03) (1.57) (-0.34) (-0.41) (0.31) (0.35) (1.07)
High AS 0.14 0.18 0.36 0.62 0.85 -0.05 -0.02 0.01 0.12 0.12 (0.23) (0.35) (0.69) (1.25) (1.69) (-0.30) (-0.12) (0.05) (0.99) (1.02)
High-Low 0.36 0.22 0.29 0.34 0.44 0.15 0.07 0.06 0.14 0.19 (1.36) (1.05) (1.28) (2.38) (3.08) (0.98) (0.48) (0.46) (1.30) (1.80)
Panel B: R-Squared
Low RSQ 0.31 0.50 0.60 0.74 0.79 -0.16 -0.03 0.00 0.07 0.08 (0.74) (1.29) (1.54) (1.95) (2.17) (-1.73) (-0.35) (0.01) (0.69) (0.91)
2 0.23 0.42 0.50 0.69 0.90 -0.16 -0.04 -0.07 0.02 0.14 (0.55) (1.11) (1.32) (1.76) (2.30) (-1.68) (-0.72) (-1.03) (0.20) (1.37)
3 0.21 0.34 0.54 0.68 0.87 -0.18 -0.09 -0.01 0.02 0.10 (0.52) (0.89) (1.42) (1.76) (2.18) (-2.25) (-1.34) (-0.19) (0.26) (1.10)
4 0.20 0.30 0.48 0.68 0.77 -0.16 -0.12 -0.06 0.01 0.00 (0.48) (0.80) (1.28) (1.73) (1.96) (-1.79) (-1.87) (-1.06) (0.15) (0.00)
High RSQ 0.17 0.29 0.40 0.64 0.78 -0.20 -0.10 -0.10 -0.03 0.01 (0.41) (0.81) (1.09) (1.62) (1.89) (-2.50) (-2.41) (-2.21) (-0.52) (0.11)
High-Low -0.14 -0.20 -0.20 -0.11 -0.01 -0.04 -0.08 -0.10 -0.10 -0.08 (-1.13) (-1.69) (-1.82) (-1.16) (-0.11) (-0.47) (-0.94) (-1.08) (-1.18) (-1.02)

36
Table 12. Relation Between Diversification Ratio and Concentration-related Skill Measure Raw Return Four-Factor Alpha Low DR 2 3 4 High DR Low DR 2 3 4 High DR Panel C: Industry Concentration Index
Low ICI 0.24 0.30 0.40 0.59 0.71 -0.15 -0.10 -0.08 -0.03 -0.01 (0.65) (0.86) (1.12) (1.56) (1.86) (-3.10) (-3.39) (-1.71) (-0.53) (-0.16)
2 0.23 0.36 0.49 0.68 0.78 -0.17 -0.09 -0.05 0.01 0.04 (0.60) (0.98) (1.32) (1.75) (1.96) (-2.40) (-2.16) (-0.81) (0.13) (0.46)
3 0.23 0.40 0.51 0.67 0.82 -0.16 -0.07 -0.06 0.01 0.07 (0.59) (1.08) (1.33) (1.71) (2.09) (-1.96) (-1.38) (-0.98) (0.13) (0.74)
4 0.21 0.34 0.49 0.73 0.91 -0.19 -0.11 -0.07 0.04 0.13 (0.51) (0.86) (1.26) (1.86) (2.33) (-2.38) (-1.41) (-1.00) (0.39) (1.27)
High ICI 0.18 0.44 0.64 0.76 0.86 -0.18 -0.02 0.03 0.07 0.11 (0.36) (1.10) (1.64) (1.92) (2.22) (-1.29) (-0.18) (0.29) (0.64) (0.94)
High-Low -0.06 0.14 0.24 0.17 0.15 -0.03 0.08 0.11 0.10 0.12 (-0.28) (1.26) (2.35) (1.86) (1.89) (-0.27) (0.97) (1.28) (1.16) (1.52)
Panel D: Number of Stocks
Low NumStocks 0.23 0.40 0.47 0.68 0.72 -0.15 -0.03 -0.06 0.06 0.06 (0.55) (1.09) (1.30) (1.85) (2.01) (-1.97) (-0.48) (-0.82) (0.74) (0.73)
2 0.21 0.34 0.49 0.66 0.81 -0.15 -0.08 -0.02 0.04 0.07 (0.54) (0.92) (1.32) (1.77) (2.04) (-2.15) (-1.44) (-0.30) (0.43) (0.70)
3 0.20 0.35 0.53 0.70 0.88 -0.17 -0.09 0.00 0.03 0.11 (0.50) (0.93) (1.43) (1.78) (2.21) (-2.14) (-1.47) (0.06) (0.31) (1.08)
4 0.21 0.36 0.51 0.67 0.83 -0.19 -0.12 -0.06 -0.02 0.06 (0.51) (0.94) (1.30) (1.67) (2.10) (-1.81) (-1.93) (-0.91) (-0.28) (0.68)
High NumStocks 0.25 0.39 0.53 0.72 0.85 -0.20 -0.07 -0.09 -0.01 0.03 (0.57) (1.04) (1.35) (1.76) (2.09) (-2.11) (-1.24) (-1.81) (-0.09) (0.45)
High-Low 0.02 -0.01 0.06 0.04 0.12 -0.05 -0.04 -0.03 -0.07 -0.02
(0.21) (-0.15) (0.58) (0.43) (1.48) (-0.68) (-0.91) (-0.50) (-1.21) (-0.48)

37
Appendix 1. Performance of DR sorted Mutual Fund Portfolio using Portfolio Value-at-Risk Gross Return Net Return
MKT SMB HML UMD Adj R2 DR Decile Return Alpha Return Alpha
Low 0.29 -0.12 0.19 -0.22 1.11 0.07 -0.21 0.04
96% (0.69) (-1.35) (0.46) (-2.43) (50.60) (2.32) (-7.56) (2.45)
2 0.39 -0.02 0.29 -0.12 1.08 -0.01 -0.13 0.01
97% (0.97) (-0.34) (0.74) (-1.76) (68.20) (-0.64) (-6.44) (1.24)
3 0.41 -0.02 0.32 -0.11 1.05 -0.03 -0.05 0.00
98% (1.09) (-0.29) (0.84) (-2.09) (83.99) (-1.74) (-3.19) (0.33)
4 0.51 0.02 0.41 -0.07 1.03 0.05 -0.01 0.01
99% (1.35) (0.56) (1.09) (-1.64) (99.98) (3.97) (-0.53) (1.43)
5 0.56 0.04 0.46 -0.05 1.01 0.10 0.04 0.01
98% (1.50) (0.85) (1.25) (-1.13) (86.29) (6.34) (2.91) (0.89)
6 0.63 0.06 0.53 -0.04 1.00 0.15 0.10 0.02
97% (1.69) (1.01) (1.42) (-0.56) (66.37) (7.90) (4.96) (1.52)
7 0.71 0.08 0.61 -0.02 1.00 0.24 0.14 0.03
97% (1.87) (1.27) (1.60) (-0.26) (63.15) (11.77) (6.83) (2.54)
8 0.83 0.15 0.73 0.04 0.99 0.32 0.19 0.02
96% (2.12) (1.85) (1.86) (0.56) (51.72) (12.92) (7.68) (1.41)
9 0.90 0.17 0.79 0.06 0.98 0.39 0.24 0.01
96% (2.28) (1.99) (2.01) (0.74) (48.51) (15.04) (9.42) (0.96)
High 0.97 0.21 0.85 0.09 0.91 0.45 0.29 -0.01
95% (2.50) (2.35) (2.21) (1.07) (43.18) (16.34) (10.84) (-0.86)
High-Low 0.68 0.33 0.66 0.32 -0.20 0.38 0.51 -0.05
55% (3.52) (2.47) (3.45) (2.36) (-6.08) (9.17) (12.28) (-2.24)

38
Appendix 2. Performance of DR sorted Mutual Fund Portfolio using Conditional Value-at-Risk Gross Return Net Return
MKT SMB HML UMD Adj R2 DR Decile Return Alpha Return Alpha
Low 0.32 -0.11 0.22 -0.21 1.09 0.10 -0.20 0.06
96% (0.78) (-1.28) (0.54) (-2.43) (52.75) (3.56) (-7.57) (3.64)
2 0.39 -0.04 0.30 -0.13 1.05 0.10 -0.16 0.03
97% (1.00) (-0.57) (0.76) (-1.96) (64.68) (4.87) (-7.90) (2.53)
3 0.43 -0.02 0.33 -0.11 1.05 0.01 -0.06 0.01
99% (1.12) (-0.40) (0.87) (-2.39) (93.65) (0.96) (-4.25) (1.60)
4 0.50 0.02 0.41 -0.07 1.04 0.03 0.00 0.02
99% (1.34) (0.54) (1.09) (-1.59) (97.44) (2.22) (0.05) (2.60)
5 0.56 0.05 0.47 -0.05 1.03 0.08 0.03 0.02
99% (1.49) (1.01) (1.23) (-1.02) (90.70) (5.61) (1.97) (2.01)
6 0.62 0.06 0.52 -0.04 1.03 0.11 0.11 0.01
97% (1.64) (1.01) (1.38) (-0.58) (68.57) (5.42) (5.71) (0.91)
7 0.69 0.08 0.59 -0.02 1.00 0.18 0.15 0.00
97% (1.81) (1.22) (1.55) (-0.24) (60.40) (8.45) (7.26) (-0.05)
8 0.80 0.13 0.70 0.03 0.99 0.30 0.19 0.01
96% (2.07) (1.64) (1.81) (0.34) (51.91) (12.13) (7.96) (1.02)
9 0.90 0.19 0.80 0.09 0.96 0.37 0.23 0.00
95% (2.32) (2.22) (2.05) (1.00) (46.26) (14.01) (8.75) (-0.25)
High 0.96 0.20 0.85 0.09 0.92 0.44 0.31 -0.01
95% (2.49) (2.23) (2.20) (0.98) (42.61) (15.83) (11.13) (-0.85)
High-Low 0.65 0.31 0.63 0.29 -0.17 0.35 0.51 -0.07
54% (3.44) (2.35) (3.36) (2.24) (-5.43) (8.43) (12.49) (-2.95)