Diverse Asset Management Project Firm Assessment Final...
85
Page 1 221 Essex St. Ste. 21, Salem MA 01970 Diverse Asset Management Project Firm Assessment Final Report May 2017 Authored by: Professor Josh Lerner, Harvard Business School Ann Leamon, Bella Research Group Meagan Madden, Bella Research Group Jake Ledbetter, Bella Research Group
Transcript of Diverse Asset Management Project Firm Assessment Final...
Page 1
221 Essex St. Ste. 21, Salem MA 01970
Diverse Asset Management Project
Firm Assessment
Final Report
May 2017
Authored by:
Professor Josh Lerner, Harvard Business School
Ann Leamon, Bella Research Group
Meagan Madden, Bella Research Group
Jake Ledbetter, Bella Research Group

Page 2
221 Essex St. Ste. 21, Salem MA 01970
Contents
I. Executive Summary .............................................................................................................. 3
II. Related Studies ...................................................................................................................... 8
Mutual Funds .............................................................................................................................. 8
Hedge Funds ............................................................................................................................. 10
Real Estate ................................................................................................................................ 14
Workplace Diversity.................................................................................................................. 14
III. Data Sources ........................................................................................................................ 15
General Data Limitations ......................................................................................................... 15
Industry Employment Data ....................................................................................................... 16
Mutual Funds Data ................................................................................................................... 17
Hedge Funds Data .................................................................................................................... 20
Private Equity and Real Estate Data ........................................................................................ 21
IV. Methodology and Results ................................................................................................... 25
Mutual Funds ........................................................................................................................... 27
Current State of Diverse Ownership for Mutual Funds ........................................................ 27
Timeline of Diverse Ownership for Mutual Funds ............................................................... 34
Performance of Diverse-Owned Mutual Funds .................................................................... 36
Institutional Investor Types for Diverse-Owned Mutual Funds ........................................... 40
Hedge Funds ............................................................................................................................ 43
Current State of Diverse Ownership for Hedge Funds ......................................................... 43
Timeline of Diverse Ownership for Hedge Funds ................................................................ 49
Performance of Diverse-Owned Hedge Funds ..................................................................... 51
Private Equity and Real Estate ................................................................................................ 54
Current State of Diverse Ownership for Private Equity ....................................................... 54
Current State of Diverse Ownership for Real Estate ............................................................ 60
Timeline of Diverse Ownership for PE and Real Estate ....................................................... 67
Performance of Diverse-Owned PE Funds ........................................................................... 70
Institutional Investor Types for Diverse-Owned PE Firms .................................................. 72
V. Conclusion ........................................................................................................................... 75
VI. Acknowledgements ............................................................................................................. 76
VII. Appendix .............................................................................................................................. 77
Mutual Fund Performance ........................................................................................................ 77
Hedge Fund Performance ......................................................................................................... 80
Private Equity Performance ..................................................................................................... 83
Top-Quartile Performance........................................................................................................ 85
Page 3
221 Essex St. Ste. 21, Salem MA 01970
I. Executive Summary
The global asset management industry is vast, with $71.4 trillion in AUM and $100 billion in
profits in 2015.1 Despite the potential economic and social benefits of utilizing diverse asset
managers, the industry is afflicted by a lack of diversity.2 While past research has investigated
the representation of women and minorities in asset management positions, there is a distinct
lack of literature regarding ownership of these asset management firms, a much more elusive
statistic to capture. This report aims to provide a first look at diversity in ownership and quantify
the level of diverse ownership across a variety of metrics.
For this project, the John S. and James L. Knight Foundation contracted with Professor Josh
Lerner (Harvard Business School) and the Bella Research Group to analyze the representation of
women- and minority-owned firms in the U.S. asset management industry. Data on firm
ownership are compiled across four asset classes: mutual funds, hedge funds, private equity (PE),
and real estate. The primary focus of this project is quantifying the number of women-owned and
minority-owned firms and funds as well as the amount of assets under management (AUM) for
each asset class. The report also examines the characteristics of women- and minority-owned
firms compared to other firms in the industry. Where the data allow, we investigate the trends of
diverse ownership over time, the performance of diverse firms, and the institutional investors
engaged with these firms.
This research relies on a number of publicly-available and commercially-available data sources,
as well as some hand-collected data. For mutual funds and hedge funds, we rely on commercial
databases (eVestment and Hedge Fund Research, respectively) that contain identifiers for
women-owned and minority-owned firms, with this information being self-reported by firms.
While these databases do not contain the full universe of all mutual funds and all hedge funds,
they represent the most comprehensive sources of data that include information on diverse
ownership. Unfortunately, the commercial databases for PE and real estate do not provide
information on diverse ownership. Instead, lists of women- and minority-owned PE and real
estate firms are assembled from a number of public and proprietary sources and merged with
data on fund and firm characteristics from Preqin.
The classification of diverse-owned firms varies slightly across these data sources.3 Typically,
firms are considered women-owned or minority-owned if at least 25% of firm ownership is held
by women or minority individuals, respectively. Firms may be classified as both women-owned
and minority-owned if they have substantial levels of ownership held by women and minorities
(e.g., firms with both women and minority owners or firms owned by women who also belong to
a racial/ethnic minority group). The definition of “minority” includes racial/ethnic minorities
1 Boston Consulting Group, “Global Asset Management 2016: Doubling Down on Data,” report, July 2016. 2 See, for example, (1) Maxey, Daisy, “Where Are the Female Fund Managers?” The Wall Street Journal, July 6,
2015; (2) De Avila, Joseph, “NYC Seeks Diversity Among Its Asset Managers,” The Wall Street Journal, April 30,
2015. 3 Note that this report uses the term “diverse-owned” to refer more broadly to the group of firms with women
ownership and/or minority ownership.
Page 4
221 Essex St. Ste. 21, Salem MA 01970
(e.g., Hispanic, Black, Asian, and Native American) but does not include other underrepresented
groups such as veterans or disabled persons.
The subsets of women- and minority-owned firms from each database are compared to the
“universe” of all U.S.-based firms listed in each database to quantify the extent of diverse
ownership in each asset class. The results are further broken down by other firm- and fund-level
characteristics such as investment focus, firm location, and geographic target. These data are also
used to analyze timeline trends, performance, and the mix of institutional investor types. Below,
we summarize our overall findings and briefly describe the results for each of these analyses,
grouped by asset class. Detailed methodology and results can be found in the body of the report.
Mutual Funds:
This section uses data on institutional mutual funds from the eVestment Traditional Database
which includes mutual funds, separately-managed accounts (SMAs), co-mingled funds, and a
limited number of exchange-traded funds (ETFs). With these data, we investigate the current
state of diversity for this asset class, construct a timeline of diverse managers, analyze the
performance of these diverse firms, and describe the types of institutional investors engaged with
these firms.
Current State of Diverse Ownership for Mutual Funds: We identify 127 women-
owned and 107 minority-owned firms, managing $406 billion and $160 billion in AUM.
For women, the 127 firms represent 8.8% of firms and 0.9% of total industry AUM. For
minorities, these numbers represent 7.4% of firms and 0.3% of total industry AUM.
Timeline of Diverse Ownership for Mutual Funds: We identify diverse firms for every
quarter from Q1 2011 through Q2 2016 and find underrepresentation of diverse-owned
firms throughout this time period. While there are no distinct trends in the representation
of women- or minority-owned firms, funds, or AUM, we do observe an upward trend in
the amount of AUM. However, for minority-owned firms, this upward trend ends in the
middle of 2015, and we see a distinct drop in AUM through Q2 2016. Since the sample
size is small, this decline may be explained by the exit (or change in ownership type) of a
few large minority-owned firms or funds.
Performance of Diverse-Owned Mutual Funds: As a whole, the evidence suggests that
the performance of funds managed by diverse-owned firms is statistically no different
than the performance of those managed by non-diverse firms. This analysis examines
multiple performance metrics and controls for a number of firm- and fund-level
characteristics that may be related to performance (e.g. asset focus, firm size, and fund
size). A separate look at the distribution of returns shows that diverse funds often have
top-quartile returns, with 25% of women-owned and 28% of minority-owned funds in the
top quartile, on average.
Institutional Investor Types for Diverse-Owned Mutual Funds: Based on the most
recent data from Q2 2016, we examine the mix of institutional investor types associated
with diverse and non-diverse firms. Public funds and corporate clients have the largest
amount of AUM invested in women- and minority-owned funds, but these investor types
Page 5
221 Essex St. Ste. 21, Salem MA 01970
are heavy investors in mutual funds in general. Proportionally, we find that investments
from public funds, foundations, endowments, high net worth individuals, and family
offices represent a larger share of AUM in a typical women- or minority-owned fund,
compared to non-diverse funds.
Hedge Funds:
Using hedge fund data from Hedge Fund Research (HFR), we analyze the current state of
diversity in the hedge fund space, construct a timeline of diverse managers, and analyze the
performance of these diverse managers. It is important to note that there are a number of hedge
fund databases with varying coverage of the hedge fund universe, and our findings for hedge
funds represent the analysis of only one database. While this database only covers roughly half
of the hedge fund industry, it contains detailed demographic information on firm ownership that
is crucial to this report. We have no reason to believe that the characteristics of the hedge funds
in our analysis differ in a meaningful way from the universe of all hedge funds, but conclusions
drawn from these data should be interpreted cautiously.
Current State of Diverse Ownership for Hedge Funds: Hedge funds suffer from a lack
of diversity in ownership, with 4.3% and 8.0% of firms being owned by women and
minorities, respectively. These firms control less than 1% of total industry assets.
Timeline of Diverse Ownership for Hedge Funds: We find that since 2010, women-
and minority-owned hedge funds have gained representation, but women- and minority-
owned firms are still underrepresented in the industry.
Performance of Diverse-Owned Hedge Funds: We find no conclusive evidence that
the performance of diverse-owned hedge funds differs significantly from the performance
of non-diverse funds. The analysis uses several performance metrics and controls for
relevant firm- and fund-level characteristics. Analysis of top-quartile performance shows
that 24% of women funds and 28% of minority funds exhibit top-quartile returns, on
average.
Private Equity and Real Estate:
Women- and minority-owned firms in PE and real estate are identified using a variety of sources,
and ownership data are merged with firm- and fund-characteristic data from Preqin. In using this
approach, we inevitably miss a number of diverse-owned firms, particularly in real estate. This
may introduce some biases, such as a bias toward larger, better-known diverse firms. While we
feel confident in the data coverage of the diverse-owned PE firms, the data coverage for diverse
real estate firms is lacking. Given the small sample size of diverse-owned real estate firms and
the potential biases in data collection, we are unable to conduct a meaningful analysis of
performance or institutional investor types. Therefore, this section focuses on PE, including
findings for real estate where available.

Page 6
221 Essex St. Ste. 21, Salem MA 01970
Current State of Diverse Ownership for PE: Only 1.9% of PE firms are women-
owned, and they manage approximately 1.5% of industry assets. Minority-owned firms
represent 3.7% of all PE firms and manage 3.4% of industry assets.
Current State of Diverse Ownership for Real Estate: Of the 889 real estate firms in
our dataset, 0.7% are women-owned and 2.0% are minority-owned. Representation is
worse when measured by AUM, with women-owned firms controlling 0.3% of total
industry AUM and minority-owned firms controlling 1.5% of total industry AUM.
Timeline of Diverse Ownership for PE and Real Estate: There is some evidence of an
increase in the representation of women- and minority-owned PE and real estate firms
since 2004, in terms of the number of funds raised and the total amount of fundraising
dollars. However, diverse groups are still underrepresented, and data issues prevent a
more robust analysis.
Performance of Diverse-Owned PE Funds: Among the PE asset managers, there is no
significant difference in performance between funds managed by diverse-owned firms
and those managed by non-diverse firms. Though we find no evidence of differential
performance on average, there are a number of top-performing diverse-owned funds––
33% of women-owned funds and 20% of minority-owned funds are top quartile. Through
careful manager selection, outsized returns are possible with women- and minority-
owned PE firms.
Institutional Investor Types for Diverse-Owned PE Funds: We examine the
representation of different LP types investing in diverse-owned PE firms compared to
their representation in a random sample of PE firms from Preqin. These data show the
representation in terms of the number of LPs, not in terms of AUM, since such data are
not available. We find that foundations and endowments are underrepresented among
investors in women- and minority-owned firms, and public pensions are overrepresented
in minority-owned firms, on average.
Discussion and Conclusions:
In this report, we offer the first comprehensive look at diverse ownership of asset management
firms across several different asset classes. This research on diverse ownership complements the
existing academic literature on diversity in fund management. The limited body of evidence
shows that diverse individuals (i.e., women or racial/ethnic minorities) are underrepresented
among the population of fund managers and also suggests that diverse managers often perform as
well as––or even outperform––market benchmarks.4
Our findings regarding diverse-owned firms are generally consistent with previous research on
diverse-managed funds with a few exceptions. We find that diverse-owned firms exhibit strong
returns, but they are dramatically underrepresented in every asset class. Quantifying the
performance of diverse funds and the current level of diverse ownership is an initial step to
understanding and encouraging diversity in asset management. This report represents a
4 The body evidence is summarized in the Related Studies section below.
Page 7
221 Essex St. Ste. 21, Salem MA 01970
preliminary effort to address these questions with the currently available data, and we
acknowledge the data limitations that exist in each analysis, especially regarding the
identification of diverse-owned firms.
We hope that this report provides the foundation for future inquiry and more robust data
collection. Importantly, we highlight the need for data sources with comprehensive and detailed
reporting of diverse ownership and diverse management. This demographic information is most
notably absent for PE and real estate investment firms. Creating a publicly-available, non-
proprietary database with this information should be a top priority for the institutional investment
community. It is our hope that this report increases awareness and knowledge of this important
topic and encourages enhanced data reporting in the future.
The report is organized as follows: we first discuss the previous work that has been done on this
topic in the Related Studies section. We then step through the specifics of the data sources and
the creation of each dataset in the Data Sources section; the casual reader may wish to skip this
section. In the Methodology and Results section, we describe and present results for all
analyses, organized by asset class. At the beginning of each asset class, we give a brief summary
of key results followed by a more in-depth discussion for each individual analysis. The
summaries for each asset class should be sufficient to understand the major points of this report.
The Conclusion section summarizes the key results and takeaways. Summary statistics and
regression output for the performance analyses are available in the attached Appendix.

Page 8
221 Essex St. Ste. 21, Salem MA 01970
II. Related Studies
A limited number of studies examine diversity in asset management and the performance of
diverse funds. These studies include a mix of academic journal articles, reports/white papers, and
news articles, and they look almost exclusively at diversity of fund managers, not owners.
The biggest barrier to research is the lack of data on diversity, as most data sources do not
collect this information. Some researchers have used proxy methods to look at gender diversity,
by identifying fund managers with female first names or female prefixes (e.g. “Miss,” “Ms.,” and
“Mrs.”), but classifying racial/ethnic diversity is more difficult. Therefore, the bulk of the
research has been on female managers, not minority managers; the few studies that focus on
racial/ethnic diversity have very limited sample sizes.
Previous efforts are also skewed in terms of asset class. Most studies focus on hedge funds or
mutual funds, particularly when examining performance. There are a handful of studies that
investigate private equity, but those analyzing performance are hindered by small and potentially
biased samples of diverse firms. For real estate, there has been virtually no research on the extent
of diversity or the performance of diverse real estate funds. The rest of this section details prior
literature by asset class; we first review studies that investigate the number and demographics of
diverse funds and then discuss any available performance studies.
Mutual Funds
A report from Morningstar documents the lack of female managers in its commercial database of
mutual funds.5 Women account for 9.4% of all portfolio managers, and most of those women are
part of mixed-gender teams. Only 2% of mutual funds and assets are run exclusively by
women, while 78% of funds and 74% of assets are managed exclusively by men. The report
examines performance over a ten-year period, though there are only 37 female managers
continuously running funds for this period. Exclusively male- and female-run funds exhibit very
similar performance, with mixed-gender teams having slightly better performance. Note that the
analysis does not control for fund or firm-level characteristics such as fund expense ratio or firm
size, which may be related to performance; indeed, the authors observe that women tend to
manage more costly niche funds, and mixed-gender teams are more common at larger firms.
Three academic articles further investigate the performance and investments in women-owned or
women-managed mutual funds. These studies observe that gender, generally, has little or no
effect on performance, but women experience significantly lower inflows into their funds.
The most recent evidence comes from Niessen-Ruenzi and Ruenzi (2015), who examine net
inflows for U.S. equity mutual funds for years 1992 through 2009.6 Fund- and manager-level
data on mutual funds come from the Morningstar Direct and Morningstar Principia databases.
The Morningstar data include a field for manager name, which the authors use to identify
5 Laura Pavlenko Lutton and Erin Davis, “Morningstar Research Report: Fund Managers by Gender,” online report,
June 2015. 6 Alexandra Niessen-Ruenzi and Stefan Ruenzi, “Sex Matters: Gender Bias in the Mutual Fund Industry,” working
paper, February 2015.
Page 9
221 Essex St. Ste. 21, Salem MA 01970
manager gender. They link fund- and manager-characteristics from Morningstar with
performance data from the Center for Research in Securities Prices (CRSP) Survivor-Bias-Free
Mutual Fund database.
Niessen-Ruenzi and Ruenzi use regression analyses to determine gender effects on fund inflows.
They include an indicator for gender as well as interactions between: (1) fund manager gender
and lagged fund performance and (2) fund manager gender and lagged performance squared.
They also control for lagged fund performance, fund size, fund risk, turnover, and expense ratio.
Regression results show that female-managed funds have lower inflows, and this effect persists
after controlling for fund-level demographics. As predicted, funds with poor past performance
receive fewer investments, but the total effect of past performance differs by gender. The
coefficients on the interaction terms indicate that female-managed funds with low performance
experience further reductions in inflows compared to male-managed funds with similar
performance. In other words, women-managed funds experience an additional penalty for low
performance. The effect of gender is even greater at the high end of performance, where high-
performing female-managed funds receive significantly smaller capital inflows than high-
performing male-managed funds, on average. The magnitude of the difference between high-
performing male-managed and female-managed funds is greater than the difference between
low-performing male-managed and female-managed funds. Essentially, the highest performing
funds with female management would receive greater inflows of investments to the fund, if
they were run by men.
Niessen-Ruenzi and Ruenzi also conduct a controlled experiment to understand why women-
managed funds receive fewer investments. Participants are presented with two S&P 500 index
funds, disguised as Fund A and Fund B, and are asked to allocate 100 units of investment
between the two funds. A female manager and male manager are randomly assigned between the
two funds and everything else presented to the participants is held constant. Thus, any difference
in overall levels of investment between male- and female-managed funds is due to the name and
implied gender of the manager. In this experimental setting, the authors find significantly smaller
inflows to female-managed funds versus male-managed funds, consistent with their empirical
evidence of the mutual fund industry.
In addition, the authors test for implicit gender bias in investing and link this to investment
decisions. They utilize an implicit association test (IAT) which measures how fast participants
match stereotypical grouping of words (e.g. men and finance) versus non-stereotypical pairings
(e.g. women and finance). Niessen-Ruenzi and Ruenzi find that participants with greater bias
contribute significantly less to women-managed funds in the experimental investment task,
controlling for participant-level characteristics such as gender, college major, financial literacy,
and investment experience. Results indicate that implicit bias explains, in large part, the reduced
inflows to female-managed funds.
Two older research studies also use the Morningstar database of mutual funds but limit their
analysis to different sub-asset classes; their results are consistent with empirical findings from
Niessen-Ruenzi and Ruenzi (2015). The first, from Atkinson, Baird, and Frye (2003), limits the

Page 10
221 Essex St. Ste. 21, Salem MA 01970
sample to all taxable fixed income funds that were at least five years old.7 They identify 72
female-managed funds within this sample and find no difference between female- and male-
managed fixed income funds in terms of performance or risk. Despite the similarities in
performance, female-managed funds have significantly lower inflows than male-managed funds.
This effect is significant for the first year of a fund and for pooled inflows over the tenure of a
fund. The second study, from Bliss and Potter (2002), looks only at mutual funds that focus on
domestic and international equity.8 Using regression models, they too find no evidence that
performance is significantly different between male and female mutual fund managers.
In summary, there is no prior evidence that female mutual fund managers are less competent than
their male peers. Despite the fact that they are just as good at generating returns for their
investors, female managers see significantly lower inflows into their funds. Experimental
evidence suggests that implicit bias on the part of investors may partially explain the reluctance
to invest with female-managed mutual funds.
As mentioned above, the identification of minority managers is relatively more difficult
compared to the identification of female managers, so the majority of past research has been on
gender diversity in asset management. Unfortunately, for mutual funds, we do not know of any
reports or academic papers that examine racial/ethnic diversity in the industry.
Hedge Funds
Several reports use data from Hedge Fund Research (HFR) to identify diverse funds and
compare their performance to industry benchmarks. For example, a report by Barclays Capital
identifies 170 diverse firms (women- or minority-owned) in the HFR database as of March
2011.9 These firms managed approximately 300 funds and $48 billion, which represented 3.3%
of all funds and 2.4% of total AUM.
The Barclays report also examines the performance of diverse-owned hedge funds. Performance
indices are constructed for diverse single-manager hedge funds and diverse funds of hedge funds,
using HFR data from April 2006 through March 2011. These indices are compared to similarly
constructed indices for non-diverse single-manager hedge funds and non-diverse funds of funds
(FoFs) The Barclays report finds stronger performance for diverse funds in terms of absolute
and risk-adjusted returns. It also calculates up- and down-capture ratios and finds that diverse
firms significantly outperform the hedge fund industry in both up and down markets.
“Women in Alternative Investments,” a report from KPMG (formerly published by Rothstein
Kass), also finds strong performance for the subset of women-owned or -managed funds in
7 Stanley M. Atkinson, Samantha Boyce Baird, and Melissa B. Frye, “Do Female Mutual Fund Managers Manage
Differently?” The Journal of Financial Research 26(1): 1-18, Spring 2003. 8 Richard T. Bliss and Mark E. Potter, “Mutual Fund Managers: Does Gender Matter?” Journal of Business and
Economic Studies 8(1): 1-17, 2002. 9 Barclays Capital, “Affirmative Investing: Women and Minority Owned Hedge Funds,” online report, June 2011.

Page 11
221 Essex St. Ste. 21, Salem MA 01970
HFR’s database.10 This annual report identifies women-owned or women-managed funds
(n = 60-82 funds, depending on the year of the report), and develops a performance index for this
subset of funds. Results show that women-owned or -managed hedge funds consistently
outperform industry benchmarks (e.g. HFRX Global Hedge Fund Index). In addition, the
report finds that women-owned or -managed funds have superior risk-adjusted returns, stronger
performance during downturns, and lower drawdowns compared with all hedge funds.
These reports utilize performance and risk metrics that are aggregated across the sample of
diverse firms and several years of data. This provides a high-level view of how diverse hedge
funds’ performance compares to relevant industry benchmarks. However, these types of analyses
do not control for confounding factors such as fund size, structure, and strategy.
A recent academic paper by Aggarwal and Boyson (2016) uses regression models to analyze
performance of female-managed hedge funds, controlling for a number of fund-level
characteristics.11 The authors rely on hedge fund data from Thomson-Reuters for years 1994
through 2013 and include both active and dead funds. They identify female managers with
“Miss,” “Ms.,” or “Mrs.” in the prefix field; for managers with no prefix listed, they check first
names for distinctly female names. They identify 244 funds that are managed exclusively by
women and 195 funds with both male and female managers; together, these funds represent only
4.6% of all hedge funds in the Thomson-Reuters universe.
Regression analyses of hedge fund performance control for manager gender, AUM, fund age,
fund structure, and fund strategy. They also control for fund survivorship since “survivor bias” is
a well-known artifact of hedge fund data that distorts performance metrics.12 Data collection is
biased toward surviving funds, which are also the strongest performing funds, so performance
metrics are likely biased upward by these “survivors.” Performance of both the diverse and non-
diverse firms is likely affected by survivor bias, but this becomes problematic if the rate of
survival is related to diversity or other confounding factors. Econometric methods controlling for
whether a firm survives can partially disentangle this bias.
In regression models that do not control for firm survival, Aggarwal and Boyson observe no
statistical differences in performance between female-managed and male-managed funds. When
controlling for survivorship, however, they find that female-managed funds significantly
outperform male-managed funds.
The authors further investigate what causes hedge funds to fail. Small fund size and poor past
performance predict failure for both male- and female-managed funds. Being a female-managed
fund or being open to new investment13 is not significantly tied to failure per se, but the
10 KPMG, “Breaking Away: The path forward for women in alternatives,” online report, September 2015; Meredith
Jones, “Women in Alternative Investments: A Marathon, Not a Sprint,” online report for Rothstein Kass Institute,
December 2013; Meredith Jones, “Women in Alternative Investments: Building Momentum in 2013 and Beyond,”
online report for Rothstein Kass Institute, December 2012. 11 Rajesh Aggarwal and Nicole M. Boyson, “The Performance of Female Hedge Fund Managers,” Review of
Financial Economics 29: 23-26, 2016. 12 Mila Getmansky, Peter A. Lee, and Andrew W. Lo, “Hedge Funds: A Dynamic Industry in Transition,” working
paper, July 28, 2015. 13 In other words, funds that have not yet reached their desired scale in terms of AUM.
Page 12
221 Essex St. Ste. 21, Salem MA 01970
combination of being female-managed and open to new investment is a significant predictor of
failure.
Together, these results suggest that female-managed funds may struggle to raise capital, but
those female-managed funds that can raise sufficient capital, and survive, are actually
outperforming the surviving funds that are male-managed. These results correspond with survey
results and anecdotal evidence regarding women in the hedge fund industry. For example,
women in senior management positions are surveyed every year for the report “Women in
Alternative Investments,” and they commonly cite access to capital as a primary challenge.14
Interestingly, these female fund managers indicate that raising capital is more important for
success than is exceptional fund performance.
In summary, the evidence shows that hedge funds with diverse management have been
successful and often outperform non-diverse hedge funds. There is greater evidence in terms of
gender diversity, with multiple reports documenting the strong performance of women-managed
funds. Nonetheless, it is clear that women still have a difficult time raising capital, and this
severely affects their ability to run a successful fund. No previous work has looked specifically at
racial/ethnic diversity in hedge funds; however, the report from Barclays Capital15 groups
together women- and minority-managed firms, finding stronger absolute and risk-adjusted
returns for firms with diverse management compared to relevant market benchmarks.
Private Equity
Recent reports demonstrate the low representation of women and minorities in PE, especially
within venture capital (VC) firms. Much of the diversity data is hand-collected since it is
difficult to identify women and minority managers using any of the commercially-available PE
databases.
A report from Preqin quantifies the representation of senior-level women in its commercial PE
database.16 In North America, women represent just 10.5% of senior employees in PE, as of
2016. Another report from Pensions & Investments also uses Preqin data and evaluates gender
diversity in PE for several job titles.17 According to this report, in 2014, women held 16.5% of
investment professional roles, 11.7% of senior management roles, and 6.5% of partner or
managing partner positions in global private equity.
The extent of manager diversity is reportedly even worse in the VC industry. The Information
worked with the venture firm Social + Capital to quantify diversity in VC.18 They classify the
gender and race/ethnicity for all senior-level investment professionals (n = 522) at 71 of the
14 KPMG, “Breaking Away: The path forward for women in alternatives,” online report, September 2015; Meredith
Jones, “Women in Alternative Investments: A Marathon, Not a Sprint,” online report for Rothstein Kass Institute,
December 2013; Meredith Jones, “Women in Alternative Investments: Building Momentum in 2013 and Beyond,”
online report for Rothstein Kass Institute, December 2012. 15 Barclays Capital, “Affirmative Investing: Women and Minority Owned Hedge Funds,” online report, June 2011. 16 Preqin, “Women in Private Equity,” online report, March 2016. 17 Arleen Jacobius, “Private Equity is Changing, But Still a Man’s World,” Pension & Investments, April 6, 2015. 18 Peter Schulz, “Future List: The Venture Capital Firms Best Positioned for the Future,” The Information, October
6, 2015; Peter Schulz, “Introducing The Information’s Future List,” The Information, October 2015.
Page 13
221 Essex St. Ste. 21, Salem MA 01970
biggest U.S. VC firms, finding that only 8.6% of senior venture capitalists were women. They
found that Hispanics and African-Americans are also dramatically underrepresented in VC,
comprising 1.3% and less than 1% of all senior venture capitalists, respectively.
Richard Kerby utilizes a similar method to identify black investors for a TechCrunch article.19
He looks at nearly 2,000 investment professionals at 200 VC firms and finds that African-
Americans make up only 1.5% of them.
Given the difficulty of identifying diverse private equity and venture capital (PEVC) firms, it
follows that analyzing the performance of diverse PEVC firms is even more difficult. In the
academic literature, we know of only one performance study, which considers only the subset of
VC firms. Two additional reports have attempted to address the question of performance for
diverse PEVC firms, but they are limited by very small sample sizes.
A working paper from Gompers, Mukharlyamov, Weisburst, and Yuhai (2014) investigates
gender effects in VC and the mechanisms of effect. Gompers et al. compile data on VC
investments from 1975 to 2003, including financing by round, investment location, industry,
investment outcome, and a list of all VC firms and individuals on the board of directors.20 The
authors hand-collect data on gender, education, and work experience for every investor in this
dataset. They also assign ethnicity using a name-matching algorithm.21 They identify 212 female
venture capitalists who represent 6.1% of all venture capitalists. They determine the success of
each investment by whether or not the investment leads to an initial public offering (IPO).
Gompers et al. find that female venture capitalists are somewhat less successful in terms of going
public, so the authors use regressions to understand the factors contributing to the
underperformance of female venture capitalists. Regression models control for industry and year
as well as a number of investor characteristics including ethnicity, education, and work
experience. Despite controlling for these demographic characteristics, the gender effect persists.
The authors next test a model that includes the performance track records for: (1) the investor,
(2) their firm, and (3) any co-investors on the deal. They find that all three prior success
variables have a positive effect on performance. In other words, investments are more likely to
be successful if the investor, firm, and co-investors have a track record of success. However,
these factors do not explain why women venture capitalists are less successful, as the indicator
for female investors is still significant and negative.
Next, Gompers et al. include interactions between gender and each prior success variable.
Results from this regression model show that women, in particular, do not always benefit from
the track record of their colleagues; only the women at firms with other female venture
capitalists benefit from the prior success of their firm. In fact, the results suggest that the inability
19 Richard Kerby, “Why are There So Few Black Investors?” TechCrunch, March 10, 2015. 20 Paul A. Gompers, Vladimir Mukharlyamov, Emily Weisburst, and Yuhai Xuan, “Gender Effects in Venture
Capital,” working paper, May 2014. 21 William R. Kerr and William F. Lincoln, “The Supply Side of Innovation: H-1B Visa Reforms and U.S. Ethnic
Invention,” Journal of Labor Economics 28(3): 473-508, July 2010.
Page 14
221 Essex St. Ste. 21, Salem MA 01970
of most female venture capitalists to capture firm-level benefits can explain, in large part, their
underperformance.
In addition, the authors conduct a survey of women in VC to further elucidate these mechanisms.
Results show that most women in VC feel like they do not receive as much formal or
informal feedback as their male peers. Gompers et al. divide the sample by whether or not
there are other female venture capitalists at the firm. They find that the women at larger firms
with other women feel less disadvantaged compared to their male peers, and these findings are
consistent with their empirical results.
A 2012 report by the National Association of Investment Companies (NAIC), the trade group for
diverse-owned and -managed PE firms, examines performance of its member firms.22 This report
compiles data for 14 firms for years 1998 through 2011, and it measures NAIC firms’
performance compared to PE industry benchmarks. NAIC firms are younger and have lower
AUM. In terms of performance, NAIC firms are upper quartile for almost every year of the
study. This evidence demonstrates that some diverse firms are performing very well
compared to the PE industry as a whole. However, the sample size is small, and the firms are
all sourced from a trade association, which may introduce some biases in the types of firms that
are included. For these reasons, it is difficult to tell whether these results are indicative for all
diverse-owned and diverse-managed PE firms.
The 2013 publication of “Women in Alternative Investments” examines performance for a very
limited sample of women-owned or -managed PE firms.23 The report was only able to obtain
performance data for six women-owned or -managed PE firms. Performance of these firms is
stronger than the industry performance benchmark, but it is difficult to glean much from these
results since the sample size is so limited.
Real Estate
From previous research, we know very little about the diversity of real estate firms and
even less about their performance. One report from Preqin utilizes data on the 37,000 staff and
3,300 firms in its commercial database of real estate investment firms.24 Preqin reports that 22%
of employees in real estate investment firms are women, but only 9% of senior positions are held
by women. For investment roles, there is even less gender diversity: women represent 11% of all
investing positions and only 5% of senior investing positions.
Workplace Diversity
Our study contributes to several lines of academic research, including diversity in the workplace
and more specifically, diversity in financial services and asset management. In that vein, the
22 National Association of Investment Companies, “The Financial Return of NAIC Firms: Minority and Diverse
Private Equity Mangers and Funds Focused on the U.S. Emerging Domestic Market,” online report, September
2012. 23 Meredith Jones, “Women in Alternative Investments: A Marathon, Not a Sprint,” online report for Rothstein Kass
Institute, December 2013. 24 Preqin, “Women in Private Real Estate,” online report, Real Estate Spotlight 10(3): 6-7, May 2016.
Page 15
221 Essex St. Ste. 21, Salem MA 01970
literature on diverse work environments has shown that gender, racial, and ethnic diversity
can have positive effects on team dynamics and team performance. For instance,
Hoogendoorn, Oosterbeek and van Praag conduct a field experiment of undergraduate students
in business studies who must develop a start-up as part of their curriculum.25 They observe that
gender-diverse teams perform better than non-diverse teams in terms of sales and profits.
Another study by Badal and Harter finds that business units with greater gender diversity exhibit
stronger financial performance.26 A study by Orlando Richard examines racial diversity in the
banking industry, finding that racial diversity adds value to the firm, as measured by firm
productivity, return on equity, and market performance.27
III. Data Sources
We draw on a number of databases for this project, each specializing in a different asset class.
For some of these databases, we can classify diverse-owned firms in a systematic and
comprehensive way, but others do not report diversity information at all. In the latter case, we
hand-compile lists of diverse-owned firms from a number of public and proprietary sources.
The databases also provide a number of firm- and fund-level characteristics, which we
incorporate into our analyses to understand the demographic differences between diverse and
non-diverse firms and funds (e.g. size, strategy, and geography). Some of the databases have
historical data, performance data, and information on investor types, which we utilize to examine
the timeline of diverse asset managers, the performance of these managers, and the institutional
investor types engaged with diverse firms. We detail the additional data acquired for these three
additional avenues of analysis, where available.
General Data Limitations
At this point, it is worth mentioning several of the data limitations and potential biases that may
be present in all of the databases consulted for this project. The first, backfill bias, occurs when a
fund starts contributing to a database and reports its past performance.28 Only funds with strong
historical performance have incentives to report retroactive data. Sometimes, a firm will have
multiple funds and will selectively report only the funds with strong returns. Therefore,
“backfilling” will overstate the overall level of performance in the database and will make it look
as though most funds perform very well in their early years. Survivorship bias is another well-
documented bias in commercial databases and occurs when lower performing funds are closed
25 Sander Hoogendoorn, Hessel Oosterbeek, and Mirjam van Praag, “The Impact of Gender Diversity on the
Performance of Business Teams: Evidence from a Field Experiment,” Management Science 59(7): 1514-1528, July
2013. 26 Sangeeta Badal and James K. Harter, “Gender Diversity, Business-Unit Engagement, and Performance,” Journal
of Leadership & Organizational Studies 21(4): 354-365, November 2014. 27 Orlando C. Bloom, “Racial Diversity, Business Strategy, and Firm Performance: A Resource-Based View,”
Academy of Management Journal 43(2): 164-177, April 2000. 28 Mila Getmansky, Peter A. Lee, and Andrew W. Lo, “Hedge Funds: A Dynamic Industry in Transition,” working
paper, July 28, 2015.
Page 16
221 Essex St. Ste. 21, Salem MA 01970
by the asset management firm, leaving only high performing funds.29 Then, the overall level of
performance is biased upwards by the “survivors” that remain in the database.
Furthermore, data providers rely largely on voluntary reporting by the funds, and there are a
number of factors that may influence a fund’s decision to contribute data to a provider. For
example, funds that underperform have less incentive to make their performance data public,
which biases the overall level of performance upward in most databases. Similarly, funds that are
accepting new capital or firms that are raising a new fund may report data as a way of
advertising, particularly if recent performance has been strong. However, anecdotally, some of
the top hedge funds that are closed to new assets will not bother reporting to databases.
Finally, biases can result from the burden of reporting. There are a number of commercial
databases for each asset class, and many small firms may not have the resources to report to all
of them. Most databases do not represent the full universe of funds, and they may be biased
toward larger firms
Despite these data concerns, we accept the data sources as given. Throughout this report, we
acknowledge the flaws in the data and, where possible, provide robustness checks to mitigate
concerns of these data biases influencing the report’s primary findings.
Industry Employment Data
The U.S. Equal Employment Opportunity Commission (EEOC) maintains data on the racial and
gender composition of the American workforce, broken down by industry and year. We identify
relevant industries using the five-digit industry codes from the North American Industry
Classification System (NAICS).30 We aggregate the data for three industry groups in this
analysis:
Portfolio Management.
Open End Investment Funds.
Other Financial Vehicles.
For the years 2004 through 2006, the employment numbers are broken into nine different job
groups, and we focus on the “Officials & Managers” category for these years. Starting in 2007,
the “Officials & Managers” category is split into “Executive/Senior Level Officials & Managers”
and “First/Mid-Level Officials & Managers.” We focus on the “Executive/Senior Level”
category for later years.
It is important to note that because the EEOC data are less granular than the asset class
categories used in the rest of our analysis, these data are particularly noisy. For example, in
addition to closed-end investment funds, the “Other Financial Vehicles” category includes
collateralized mortgage obligations, real estate investment trusts, profit-sharing funds, and other
29 Rajesh K. Aggarwal and Philippe Jorion, “Hidden Survivorship in Hedge Fund Returns,” Financial Analysts
Journal 66(2): 69-74, March 2010. 30 For more information on NAICS classifications, please see:
http://www.laworks.net/downloads/lmi/naicsoverview.pdf.
Page 17
221 Essex St. Ste. 21, Salem MA 01970
vehicles irrelevant to the analysis in this project. Because of this, we include the EEOC data as
an additional indicator of overall employment trends to complement the ownership analysis,
rather than as the primary focus of this report.
Mutual Funds Data
For mutual funds, we utilize the Traditional Database from eVestment, a leading commercial
data provider for institutional investors that is frequently used for academic research.31 This
database covers more than 40,000 active and inactive investment vehicles including mutual
funds, separately managed accounts (SMAs), comingled trust funds, and exchange-traded funds
(ETFs); together, mutual funds and SMAs comprise the vast majority of data points (85.4%).
The database collects quarterly data on firms and funds, including firm- and fund-level AUM,
fund performance, fund strategy, and firm location. Importantly, eVestment also provides firm-
reported data on the percentage of firm ownership held by women and the following racial/ethnic
minority groups: African-American, Asian, and Hispanic. Quarterly data on diversity are
available starting Q1 2011.
We use eVestment data through Q2 2016 and restrict the data to U.S.-based asset managers. This
group is comprised of approximately 2,400 firms and their 19,000 funds. The dataset includes a
limited number of firms based in Puerto Rico and the Virgin Islands, which we consider part of
the U.S. in this analysis. We make several other restrictions and adjustments to construct the
relevant “universe” for analysis:
To examine the current state of diversity, we are interested in the level of diverse
ownership among current asset managers. Therefore, we restrict the data to active funds
for the snapshot analysis.
For 99.97% of these funds, the asset class is listed as Equity, Fixed Income, or
Balanced/Multi-Asset. The remaining 0.03% of funds are listed as Alternatives or Real
Estate. We disregard these data points since these two asset classes make up such a small
proportion of the eVestment universe and are covered by other sections of this report.
We drop the small number of fund of funds (FoFs), since any AUM with FoFs will be
double counted if the fund investments are also in the dataset.
We group firms into U.S. regional categories: Northeast, South, Midwest, and West.
These four regional categories are based on the office address of the firm, using the U.S.
Census Bureau state regional categories and grouping Puerto Rico and the Virgin Islands
with the South.32
31 See, for example: Jennifer Bender, P. Brett Hammond, and William Mok, “Can Alpha Be Captured by Risk
Premia?” Journal of Portfolio Management 40(2): 18-29, Winter 2014. 32 The regions are defined as follows. Northeast: Connecticut, Maine, Massachusetts, New Hampshire, New Jersey,
New York, Pennsylvania, Rhode Island, Vermont. South: Alabama, Arkansas, Delaware, Florida, Georgia,
Kentucky, Louisiana, Maryland, Mississippi, North Carolina, Oklahoma, Puerto Rico, South Carolina, Tennessee,
Texas, Virgin Islands, Virginia, Washington, DC, West Virginia. Midwest: Illinois, Indiana, Iowa, Kansas,
Michigan, Minnesota, Missouri, Nebraska, Ohio, South Dakota, North Dakota, Wisconsin. West: Alaska, Arizona,
California, Colorado, Hawaii, Idaho, Montana, Nevada, New Mexico, Oregon, Utah, Washington, Wyoming.
Page 18
221 Essex St. Ste. 21, Salem MA 01970
After these restrictions, the universe of current U.S.-based asset managers for our analysis of
mutual funds includes about 1,450 firms and 11,000 funds.33 From this universe, we have
identified subsets of women- and minority-owned firms with substantial (25-49%) or majority
ownership (50+%) in Q2 2016. For some analyses, we combine the substantial and majority
ownership subsets and examine all women-owned firms with 25+% ownership (n = 127 firms in
Q2 2016) or all minority-owned firms with 25+% ownership (n = 107 firms in Q2 2016). Please
note that there may be some overlap between the subsets of women- and minority-owned firms,
since firms can have significant levels of ownership by both women and minorities (e.g., firms
with both women and minority owners or firms owned by women who also belong to a racial
minority group).
For the performance and timeline analysis, we use quarterly data starting in Q1 2011, the first
quarter that diverse ownership is reported, through Q2 2016. For each quarter, we identify all
active funds and firms.34 The dataset includes approximately 260,000 fund-quarter observations
and 35,000 firm-quarter observations. Among the active funds and firms each quarter, we
identify funds and firms with women ownership (25+%) or minority ownership (25+%). Again,
for any given quarter, there may be some overlap between the categories of women-owned and
minority-owned firms, as these are not mutually exclusive definitions.
For the timeline analysis, we find the number of funds and firms for both diverse categories for
each quarter, as well as the total AUM with women- and minority-owned firms.35 For the
performance analysis, we also use this same dataset to analyze the effect of diverse ownership on
quarterly returns.36 We develop a number of regression models which evaluate performance,
controlling for ownership type as well as other relevant variables that may be correlated with
performance. These regressions include only those fund-quarter observations with non-missing
data for performance, firm and fund characteristics, and ownership type.
33 We found a limited number of data errors in the dataset which we attempted to correct. Three firms reported very
early years for firm’s year founded; firm websites did not corroborate the dates, so we changed these outliers to the
years specified by the websites. We also observed five relatively young firms that were managing a single fund and
listed unusually high AUM. We used firm websites to check these figures. In four cases, we found that the AUM
value listed in eVestment and the AUM reported in other sources were several orders of magnitude different. By
cross-checking the numbers, it appears that these firms reported AUM in USD instead of million USD, which is how
eVestment lists AUM. For these four firms, we adjusted AUM by dividing by one million. For one additional firm
with an outlier AUM, we could not find an AUM figure using other sources. In this case, we calculated the median
AUM for all firms founded in the same year (excluding this particular firm), and replaced the outlier with this
median. 34 We identify funds that were active at the time of download on August 25, 2016 and assume these funds are active
for Q2 2016. For Q1 2011 through Q1 2016, we assume funds are active for all quarters until the listed inactive date.
If no inactive date is provided, then we only keep fund-quarter observations that have non-missing values for either
fund AUM or fund returns. 35 Firm AUM is reported to eVestment in millions of dollars (USD), but there are a number of outlier AUM values
that appear to be reported in dollars, sometimes just for one or two quarters. We drop AUM data for firm-quarter
observations where the reported quarterly AUM is three orders of magnitude (i.e., 1,000 times) greater than the
AUM value for any of the two previous or two future quarters. We do not, however, drop cases where AUM in two
previous or future quarters was listed as zero. We assume that a jump from zero AUM to a much larger number is
indicative of a new fund. 36 Quarterly returns are self-reported by fund managers to eVestment. Approximately, 85% of returns in this dataset
are reported gross of fees and 15% are reported as net of fees.

Page 19
221 Essex St. Ste. 21, Salem MA 01970
The analysis of investor types relies on fund-level AUM data by client type as of Q2 2016. These
data describe the types of clients with capital invested with each asset manager. The table below
provides eVestment definitions for each investor type AUM variable, which are reported in
million USD.37
Investor Type eVestment Definition of AUM by Investor Type
Corporate Sum of assets managed for corporations, regardless of account type (i.e.,
Defined Benefit, Defined Contribution).
Public Fund Sum of assets managed for public fund clients regardless of account type.
Superannuation Sum of assets for Superannuations, which are government-regulated
investment strategies designed to provide a person with an income upon
their retirement. Superannuation schemes are commonly found in Australia
and New Zealand.
Union/Multi-
Employer
Sum of assets managed for union or multi-employer fund clients regardless
of account type.
Foundations &
Endowments
Sum of assets managed for a client whose assets, funds, or property are
donated to an institution, individual, or group as a source of income.
Healthcare Sum of assets managed for clients in a healthcare organization (for profit
and nonprofit).
Insurance The sum of assets managed on behalf of insurance companies. Insurance
companies often invest pooled assets to further grow available capital and
finance additional operations.
High Net Worth
Individuals
This is the sum of assets managed directly for a high net worth individual
or family office.
Sub-Advised This is the sum of assets whose day-to-day management is handled by a
third party hired by the primary manager.
Wrap Accounts Includes platform programs in which investors pay a single fee for all
services associated with their account as opposed to per-transaction fees.
This variable is a sum of assets managed for these types of programs.
Supranationals Sum of assets managed for supranationals, which are international
organizations whose member states share decision-making power.
Membership is voluntary and decisions by the group follow majority rule.
The European Union and World Trade Organization are both
supranationals.
Defined
Contribution
This is the sum of assets managed for Defined Contribution plans, such as
a retirement plan in which the employer and/or employee contribution
specified amounts (e.g., 401(k), 403(b), etc.). This category is independent
of the other asset breakdowns (i.e., an investor can be listed as defined
contribution as well as another client type).
37Again, some values appear to be reported by the firms in total dollars, so we cross-reference these variables with a
separately reported variable for fund AUM. The sum of AUM across client types should not be greater than the total
fund AUM. Therefore, for the investor type analysis, we drop any observations where this is the case. In calculating
the sum of AUM across client types, we do not include AUM in “Defined Contribution” since this category is not
mutually exclusive of all other categories. For instance, “Corporate,” “Public Fund,” and “Union/Multi-Employer”
categories may also include AUM from defined contribution plans.
Page 20
221 Essex St. Ste. 21, Salem MA 01970
Hedge Funds Data
Hedge Fund Research (HFR) is a leading provider of hedge fund data, offering monthly data
from over 2,200 distinct asset managers. These data include variables such as strategy focus,
geographic location, fund size, and performance. The standard commercial database also
includes a diversity variable to indicate whether the fund is substantially owned by women
and/or minorities. HFR has provided supplemental proprietary data for this project that include
type of firm ownership (women vs. minority) and level of ownership (substantial vs. majority).
The HFR threshold for substantial ownership is 25-50% ownership, and the threshold for
majority ownership is 51+% ownership. These identifiers allow us to categorize hedge funds into
five ownership groups: substantial women ownership, majority women ownership, substantial
minority ownership, majority minority ownership, and non-diverse ownership.
HFR has good coverage of hedge funds relative to other commercial databases and is frequently
used for academic research on the hedge fund industry.38 However, it does not capture the total
universe of hedge funds,39 so we almost certainly do not capture the entire universe of all
diverse-owned hedge funds for this report. Although it would be preferable to combine multiple
hedge fund databases for this analysis, we use the HFR database exclusively because it provides
identifiers for diverse-owned firms. We do not know of any other hedge fund databases with
similar data on diverse ownership. While we have no reason to believe that the representation or
performance of diverse-owned firms in HFR is different from other hedge fund databases, we
must acknowledge that unknown biases in the data could skew our results.
As noted above, HFR’s supplemental proprietary dataset allows us to categorize hedge funds into
five ownership groups: substantial women ownership, majority women ownership, substantial
minority ownership, majority minority ownership, and non-diverse ownership. Unlike the data
for mutual funds, these firm-level identifiers for hedge fund managers do not change over time.
We assume that any identified-diverse firms are diverse for the entire life span of the firm.
Several adjustments are required to prepare the datasets for analysis:
HFR separates the databases for fund characteristics, performance, and assets into active
and dead databases, with funds grouped by their reporting status. We utilize data for both
active and dead funds across each of these databases when constructing the timeline and
evaluating performance, in order to look back at trends in diverse ownership and
performance over multiple years.
For the look at the current state of diversity, we use only the active funds database to
construct the universe of funds, excluding any funds that are no longer reporting. This
analysis aims to quantify the current number of diverse firms and the amount of
associated AUM.
The data are restricted to firms based in the U.S. and its overseas territories.
38 See for example: Juha Joenväärä, Robert Kosowski, and Pekka Tolonen, “Hedge Fund Performance: What Do We
Know?” SSRN working paper, March 2016. 39 See, for example: (1) Andrew J. Patton, Tarun Ramadorai, and Michael Streatfield, “Change You Can Believe In?
Hedge Fund Data Revisions,” SSRN working paper, March 2013; (2) Juha Joenväärä, Robert Kosowski, and Pekka
Tolonen, “Hedge Fund Performance: What Do We Know?” SSRN working paper, March 2016.

Page 21
221 Essex St. Ste. 21, Salem MA 01970
While all funds are U.S.-based, a small minority report assets denominated in foreign
currencies. These foreign monthly asset numbers are converted to U.S. dollars based on
the monthly exchange rates provided by Oanda, a currency data provider and foreign
exchange company.
Because most diverse firms are classified as majority-diverse-owned and so few firms are
classified as substantially-diverse-owned, we combine substantial and majority categories
to create one variable to denote women ownership and one variable to denote minority
ownership.
While the “snapshot” of hedge fund AUM relies on the most recently reported fund AUM
value, the timeline analysis uses monthly assets. Reporting of monthly assets is more
limited compared to the coverage of the current AUM variable.
The fund characteristics and diversity data are merged with the monthly assets data. For a
fund to be included in the timeline analysis, it must have data available on its
characteristics (e.g., industry focus, manager location, AUM, etc.), the diversity of its
ownership, and its assets in a given month.
Similarly, for a fund to be included in the performance analysis, it must have data
available on its characteristics, the diversity of its ownership, and monthly performance.
For this analysis, we rely on monthly returns data. This information is self-reported by
firms, and 99% of observations are reported net of fees.
In addition to analyzing the data by diverse group, the HFR database allows us to investigate
other demographic breakdowns for the current state of diversity analysis. These breakdowns
include regional investment focus, manager location, and fund strategy:
Regional investment focus has three categories––North American, Global, and Other––
based on where the manager targets investments.
We group firms into four U.S. regions by manager location using the same definitions as
for mutual funds: Northeast, South, Midwest, and West.
Fund strategies include equity hedge, event driven, fund of funds, macro, and relative
value.
In this analysis, we do not consider funds of hedge funds since they typically have a distinct
structure, size, fee arrangement, and performance profile compared to direct investments. In
addition, any AUM with FoFs will be double counted if the sub-fund investments are also in the
dataset. This could overstate the amount of capital in the industry and skew the results,
misrepresenting the AUM allocated to diverse versus non-diverse firms. For these reasons, we
drop any observations that list FoF as the strategy type.
Private Equity and Real Estate Data
Preqin, a commercial data provider in the alternative assets industry, serves as our source of data
for all analyses involving PE and real estate. Preqin is among the top sources of data for the
alternative assets industry and is one of the two databases most often used in PE research.40 At
40 Robinson, David and Berk Sensoy, “Private Equity in the 21st Century: Liquidity, Cash Flows, and Performance
1984-2010,” NBER Working Paper, July 15, 2011.
Page 22
221 Essex St. Ste. 21, Salem MA 01970
the time of this analysis, its datasets of U.S.-based PE and real estate funds comprise 21,575 and
5,614 funds, respectively. These databases provide access to a number of variables of interest
and boast coverage over a long time period, with particularly strong coverage in the years since
2000.
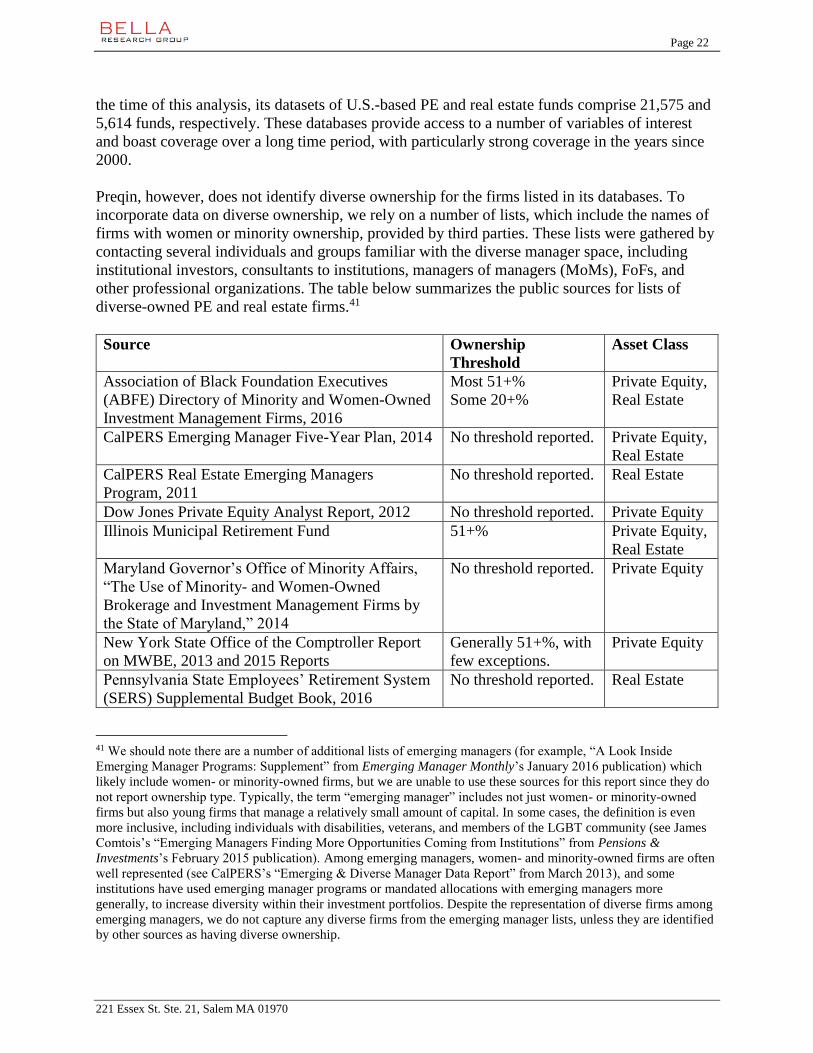
Preqin, however, does not identify diverse ownership for the firms listed in its databases. To
incorporate data on diverse ownership, we rely on a number of lists, which include the names of
firms with women or minority ownership, provided by third parties. These lists were gathered by
contacting several individuals and groups familiar with the diverse manager space, including
institutional investors, consultants to institutions, managers of managers (MoMs), FoFs, and
other professional organizations. The table below summarizes the public sources for lists of
diverse-owned PE and real estate firms.41
Source Ownership
Threshold
Asset Class
Association of Black Foundation Executives
(ABFE) Directory of Minority and Women-Owned
Investment Management Firms, 2016
Most 51+%
Some 20+%
Private Equity,
Real Estate
CalPERS Emerging Manager Five-Year Plan, 2014 No threshold reported. Private Equity,
Real Estate
CalPERS Real Estate Emerging Managers
Program, 2011
No threshold reported. Real Estate
Dow Jones Private Equity Analyst Report, 2012 No threshold reported. Private Equity
Illinois Municipal Retirement Fund 51+% Private Equity,
Real Estate
Maryland Governor’s Office of Minority Affairs,
“The Use of Minority- and Women-Owned
Brokerage and Investment Management Firms by
the State of Maryland,” 2014
No threshold reported. Private Equity
New York State Office of the Comptroller Report
on MWBE, 2013 and 2015 Reports
Generally 51+%, with
few exceptions.
Private Equity
Pennsylvania State Employees’ Retirement System
(SERS) Supplemental Budget Book, 2016
No threshold reported. Real Estate
41 We should note there are a number of additional lists of emerging managers (for example, “A Look Inside
Emerging Manager Programs: Supplement” from Emerging Manager Monthly’s January 2016 publication) which
likely include women- or minority-owned firms, but we are unable to use these sources for this report since they do
not report ownership type. Typically, the term “emerging manager” includes not just women- or minority-owned
firms but also young firms that manage a relatively small amount of capital. In some cases, the definition is even
more inclusive, including individuals with disabilities, veterans, and members of the LGBT community (see James
Comtois’s “Emerging Managers Finding More Opportunities Coming from Institutions” from Pensions &
Investments’s February 2015 publication). Among emerging managers, women- and minority-owned firms are often
well represented (see CalPERS’s “Emerging & Diverse Manager Data Report” from March 2013), and some
institutions have used emerging manager programs or mandated allocations with emerging managers more
generally, to increase diversity within their investment portfolios. Despite the representation of diverse firms among
emerging managers, we do not capture any diverse firms from the emerging manager lists, unless they are identified
by other sources as having diverse ownership.
Page 23
221 Essex St. Ste. 21, Salem MA 01970
In addition to the sources described in the table above, we acquired proprietary lists from three
providers who prefer to remain anonymous. The first data source denotes women- and minority-
owned firms, using a 50% ownership threshold for a firm to be categorized as diverse. The
second data provider may track the degree of ownership but does not provide this level of detail
for the women- and minority-owned firms on the list we were given. The third list of diverse
firms does not provide an ownership threshold nor does it distinguish between women and
minority firms. For firms on this last list, we use the demographics of senior partners at the firm
as a proxy for ownership, using a 25% threshold. That is, a firm with one female partner and
three male partners would be classified as women-owned while a firm with one female partner
and four male partners would not. Data on management demographics were acquired from firm
websites.
Considering top-level management demographics is an imprecise measure of ownership level,
but this method mitigates the loss of diverse-owned firms that otherwise would not be included
in our dataset due to insufficient information in the source material. Further, many of the firms
we investigated have very small top-level management teams, consisting of only a few partners
or founders, lending more confidence to our classification of women versus minority ownership.
Ambiguous firms for which a diverse classification was not apparent are dropped from our
sample of diverse firms.
Our method for compiling a list of diverse-owned PE and real estate firms is imperfect, and we
do not claim to have comprehensive coverage of the diverse PE and real estate space. Those
firms identified by this method typically have allocations from large public funds or they are
very active in the diverse space (e.g., participating in emerging manager programs, being a sub-
fund investment for a FoF, or participating in conferences for diverse asset managers). We
expect that there may be a bias toward larger, more established, and more prominent diverse-
owned firms. Small, new firms may be difficult to identify using this methodology.
In addition, the majority of the third-party lists that we utilize focus exclusively on PE, and there
is substantial overlap among them. While we remain confident that the diverse PE firms are well
represented in our dataset, the real estate data suffer the most from incomplete diversity
information. There are undoubtedly a number of women- and minority-owned real estate firms
that are not included in this report. Therefore, this analysis should be considered a foundation for
future inquiry rather than a comprehensive view of diverse ownership in the real estate industry.
It is our hope that this project will catalyze more comprehensive reporting practices for both PE
and real estate.
Diverse PE and real estate firms were matched to demographic and fundraising data from Preqin
based on firm name. The final list of diverse firms with accompanying data in Preqin comprises
52 women-owned and 98 minority-owned PE funds and 6 women-owned and 18 minority-owned
real estate funds. We make a number of adjustments to both the PE and real estate databases
from Preqin before merging them with our list of diverse-owned firms:
Funds of funds are dropped from the PE and real estate datasets, for the reasons discussed
in previous sections.
Managers based outside the U.S. are dropped from the dataset.

Page 24
221 Essex St. Ste. 21, Salem MA 01970
For PE, the data are limited to funds with vintage years 2004 to present, allowing us to
construct a universe of funds that should be currently operating based on the typical life
of PE funds.
Since real estate funds exhibit a wider range of fund structures, we limit our dataset to
only the non-liquidated funds in order to capture the subset of current real estate funds.
Regional locations of firms are assigned based on the associated office address and
follow the same state/territory groupings as in the hedge fund analysis.
The AUM for each firm is calculated as the sum of the final size for each of a firm’s
funds raised from January 2004 through August 2016. Fund size and firm AUM
calculations are reported in U.S. dollars.
For the PE database, Preqin classifies fund types into a number of different categories.
We regroup these funds into three broad categories: PE, VC, and real estate.42 To avoid
double counting, we drop all PE funds categorized as real estate, as each of these funds is
also listed in the real estate database.
Because PE and real estate funds generally do not report intermediate valuations in Preqin, the
timeline analyses for these asset classes consist of the number of funds closed each year and the
sum of their final sizes. The performance analysis looks only at PE due to the very small sample
size for diverse real estate firms. We use net multiples as the performance measures since Preqin
provides good coverage of this metric compared to other performance metrics, such as IRRs.43
We also construct an “excess multiple” performance measure, using the median benchmark
multiples for PE and VC separately. The excess multiple is calculated as the fund’s actual
reported multiple minus the median benchmark for that fund’s type and vintage.44
The final analysis examines the institutional investors in PE firms. Again, because of the small
sample size of real estate funds, we only consider PE for this analysis. For each diverse PE firm,
we download the names of limited partners (LPs) associated with that firm from Preqin and
classify them into several investor types. Obtaining data in this way is prohibitively time-
intensive for all 2,000+ firms in the dataset. Therefore, we take a random sample of 100 PE firms
from the dataset and download the names and types of LPs associated with each of those firms
individually. Some firms do not have investor information in Preqin, so we discard firms without
investor information and sample another firm to replace it, so that there are 100 unique firms in
our sample, and each has a list of associated investors. We use this matching sample of 100 firms
as the control category when comparing the makeup of institutional investors in women- and
minority-owned PE firms.
42 PE includes Buyout, Growth, Mezzanine, Co-Investment Multi-Manager, Co-Investment, Balanced, Direct
Secondaries, Distressed Debt, Hybrid, PIPE, Natural Resources, Timber, Special Situations, Turnaround,
Secondaries, Infrastructure, Infrastructure Fund of Funds, Infrastructure Secondaries, Fund of Funds, and Hybrid
Fund of Funds.
VC includes Early Stage, Early Stage: Seed, Early Stage: Start-Up, Expansion/Late State, Venture (General), and
Venture Debt.
Real Estate includes Real Asset, Real Asset Fund of Funds, Real Estate, Real Estate Co-Investment, Real Estate
Fund of Funds, and Real Estate Secondaries. 43 Net multiples are reported net of fees in Preqin. 44 For VC, the benchmark includes U.S.-based funds with the strategies described in the previous footnote. The PE
benchmark includes U.S.-based funds with the strategies described in the previous footnote. These benchmarks are
calculated by vintage year.
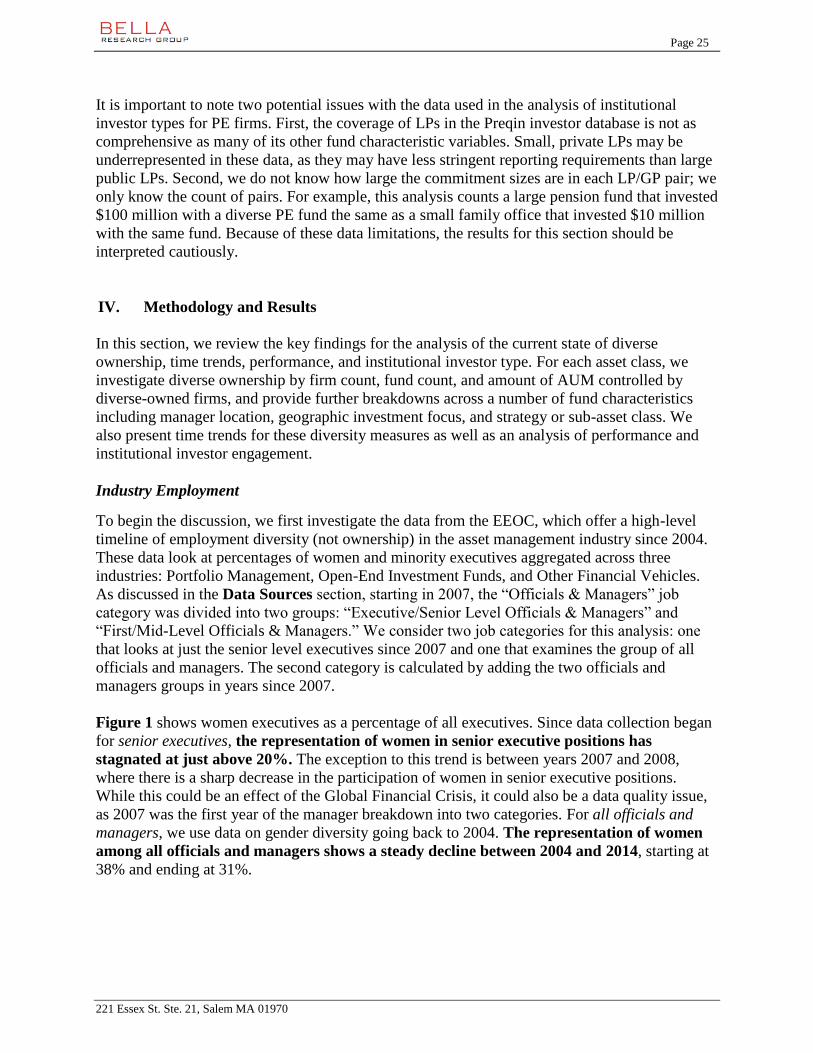
Page 25
221 Essex St. Ste. 21, Salem MA 01970
It is important to note two potential issues with the data used in the analysis of institutional
investor types for PE firms. First, the coverage of LPs in the Preqin investor database is not as
comprehensive as many of its other fund characteristic variables. Small, private LPs may be
underrepresented in these data, as they may have less stringent reporting requirements than large
public LPs. Second, we do not know how large the commitment sizes are in each LP/GP pair; we
only know the count of pairs. For example, this analysis counts a large pension fund that invested
$100 million with a diverse PE fund the same as a small family office that invested $10 million
with the same fund. Because of these data limitations, the results for this section should be
interpreted cautiously.
IV. Methodology and Results
In this section, we review the key findings for the analysis of the current state of diverse
ownership, time trends, performance, and institutional investor type. For each asset class, we
investigate diverse ownership by firm count, fund count, and amount of AUM controlled by
diverse-owned firms, and provide further breakdowns across a number of fund characteristics
including manager location, geographic investment focus, and strategy or sub-asset class. We
also present time trends for these diversity measures as well as an analysis of performance and
institutional investor engagement.
Industry Employment
To begin the discussion, we first investigate the data from the EEOC, which offer a high-level
timeline of employment diversity (not ownership) in the asset management industry since 2004.
These data look at percentages of women and minority executives aggregated across three
industries: Portfolio Management, Open-End Investment Funds, and Other Financial Vehicles.
As discussed in the Data Sources section, starting in 2007, the “Officials & Managers” job
category was divided into two groups: “Executive/Senior Level Officials & Managers” and
“First/Mid-Level Officials & Managers.” We consider two job categories for this analysis: one
that looks at just the senior level executives since 2007 and one that examines the group of all
officials and managers. The second category is calculated by adding the two officials and
managers groups in years since 2007.
Figure 1 shows women executives as a percentage of all executives. Since data collection began
for senior executives, the representation of women in senior executive positions has
stagnated at just above 20%. The exception to this trend is between years 2007 and 2008,
where there is a sharp decrease in the participation of women in senior executive positions.
While this could be an effect of the Global Financial Crisis, it could also be a data quality issue,
as 2007 was the first year of the manager breakdown into two categories. For all officials and
managers, we use data on gender diversity going back to 2004. The representation of women
among all officials and managers shows a steady decline between 2004 and 2014, starting at
38% and ending at 31%.
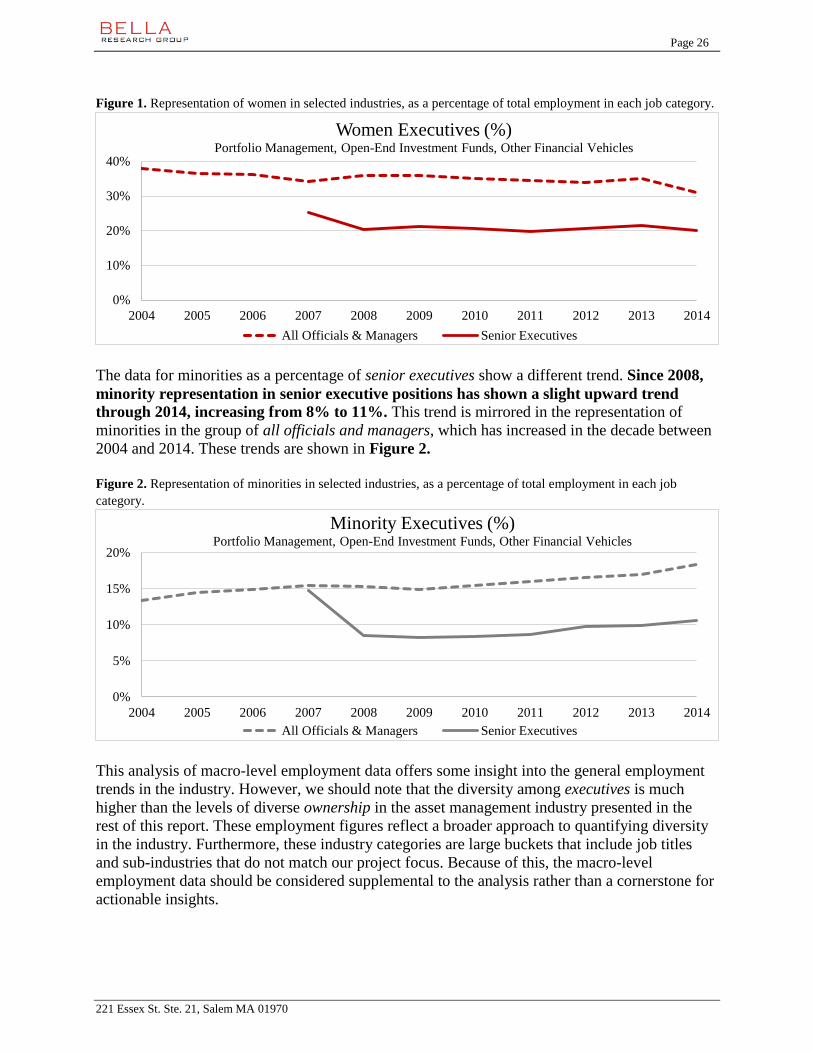
Page 26
221 Essex St. Ste. 21, Salem MA 01970
Figure 1. Representation of women in selected industries, as a percentage of total employment in each job category.
The data for minorities as a percentage of senior executives show a different trend. Since 2008,
minority representation in senior executive positions has shown a slight upward trend
through 2014, increasing from 8% to 11%. This trend is mirrored in the representation of
minorities in the group of all officials and managers, which has increased in the decade between
2004 and 2014. These trends are shown in Figure 2.
Figure 2. Representation of minorities in selected industries, as a percentage of total employment in each job
category.
This analysis of macro-level employment data offers some insight into the general employment
trends in the industry. However, we should note that the diversity among executives is much
higher than the levels of diverse ownership in the asset management industry presented in the
rest of this report. These employment figures reflect a broader approach to quantifying diversity
in the industry. Furthermore, these industry categories are large buckets that include job titles
and sub-industries that do not match our project focus. Because of this, the macro-level
employment data should be considered supplemental to the analysis rather than a cornerstone for
actionable insights.
0%
10%
20%
30%
40%
2004 2005 2006 2007 2008 2009 2010 2011 2012 2013 2014
Women Executives (%)Portfolio Management, Open-End Investment Funds, Other Financial Vehicles
All Officials & Managers Senior Executives
0%
5%
10%
15%
20%
2004 2005 2006 2007 2008 2009 2010 2011 2012 2013 2014
Minority Executives (%)Portfolio Management, Open-End Investment Funds, Other Financial Vehicles
All Officials & Managers Senior Executives
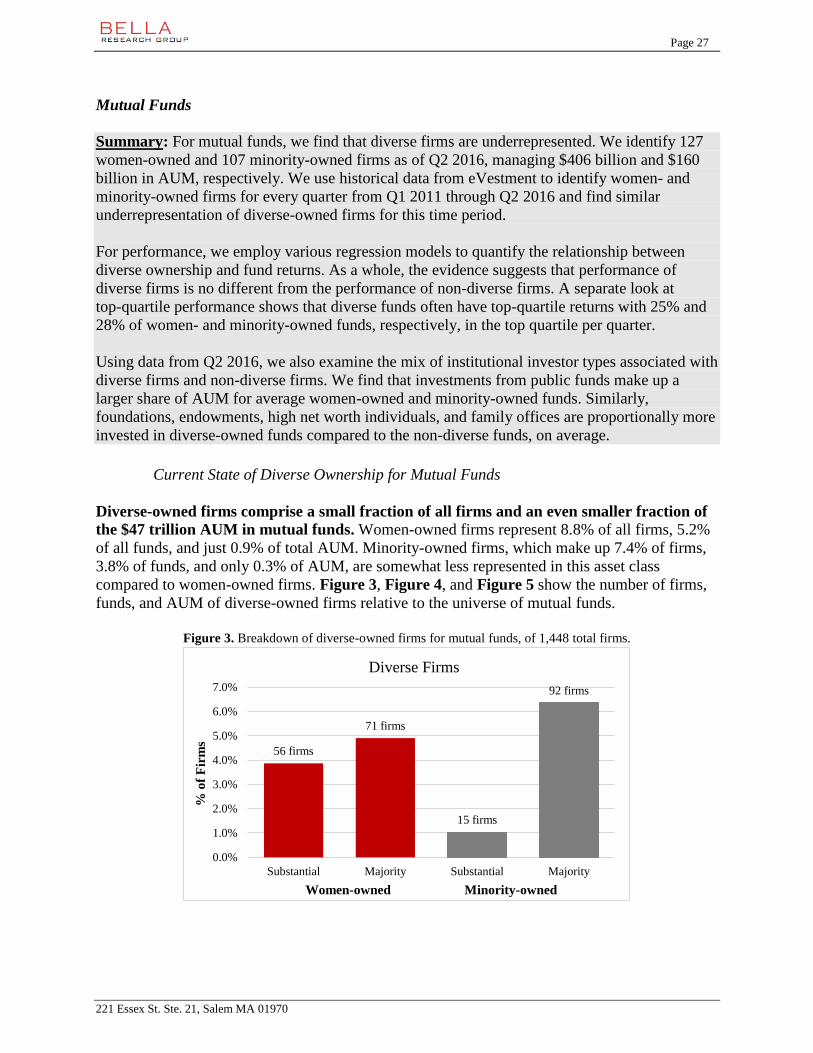
Page 27
221 Essex St. Ste. 21, Salem MA 01970
Mutual Funds
Summary: For mutual funds, we find that diverse firms are underrepresented. We identify 127
women-owned and 107 minority-owned firms as of Q2 2016, managing $406 billion and $160
billion in AUM, respectively. We use historical data from eVestment to identify women- and
minority-owned firms for every quarter from Q1 2011 through Q2 2016 and find similar
underrepresentation of diverse-owned firms for this time period.
For performance, we employ various regression models to quantify the relationship between
diverse ownership and fund returns. As a whole, the evidence suggests that performance of
diverse firms is no different from the performance of non-diverse firms. A separate look at
top-quartile performance shows that diverse funds often have top-quartile returns with 25% and
28% of women- and minority-owned funds, respectively, in the top quartile per quarter.
Using data from Q2 2016, we also examine the mix of institutional investor types associated with
diverse firms and non-diverse firms. We find that investments from public funds make up a
larger share of AUM for average women-owned and minority-owned funds. Similarly,
foundations, endowments, high net worth individuals, and family offices are proportionally more
invested in diverse-owned funds compared to the non-diverse funds, on average.
Current State of Diverse Ownership for Mutual Funds
Diverse-owned firms comprise a small fraction of all firms and an even smaller fraction of
the $47 trillion AUM in mutual funds. Women-owned firms represent 8.8% of all firms, 5.2%
of all funds, and just 0.9% of total AUM. Minority-owned firms, which make up 7.4% of firms,
3.8% of funds, and only 0.3% of AUM, are somewhat less represented in this asset class
compared to women-owned firms. Figure 3, Figure 4, and Figure 5 show the number of firms,
funds, and AUM of diverse-owned firms relative to the universe of mutual funds.
Figure 3. Breakdown of diverse-owned firms for mutual funds, of 1,448 total firms.
56 firms
71 firms
15 firms
92 firms
0.0%
1.0%
2.0%
3.0%
4.0%
5.0%
6.0%
7.0%
Substantial Majority Substantial Majority
% o
f F
irm
s
Women-owned Minority-owned
Diverse Firms

Page 28
221 Essex St. Ste. 21, Salem MA 01970
Figure 4. Breakdown of diverse-owned funds, for mutual funds, of 11,069 total funds.
Figure 5. Breakdown of diverse-owned AUM in mutual funds, of $47 trillion total AUM.
Diverse-owned firms are typically smaller than non-diverse firms, which partly explains their
very low proportion of diverse AUM compared to total AUM. Figure 6, Figure 7, and Figure 8
present several measures of firm size, broken out by ownership type.
Figure 6 presents the average AUM per firm by ownership type and shows the huge disparity
in AUM between diverse-owned firms and the universe of all firms. On average, women-
owned firms manage $4.4 billion of AUM, and minority-owned firms manage $2.1 billion of
AUM. The average AUM for the universe of all firms is $47.4 billion, a full order of magnitude
higher than the average AUM for diverse-owned firms.45
45 It is worth noting that this universe includes a number of large, publicly-traded firms which are owned by the
shareholders. It is very unlikely that these firms have a substantial level of diverse ownership. Firm AUM for
publicly-traded companies is much larger compared to diverse-owned firms as well as non-diverse firms that are not
publicly-traded.
288 funds 284 funds
51 funds
365 funds
0.0%
0.5%
1.0%
1.5%
2.0%
2.5%
3.0%
3.5%
4.0%
Substantial Majority Substantial Majority
% o
f F
un
ds
Women-owned Minority-owned
Diverse Funds
$207.4 bn $198.5 bn
$24.1 bn
$135.7 bn
0.0%
0.1%
0.2%
0.3%
0.4%
0.5%
0.6%
Substantial Majority Substantial Majority
% o
f A
UM
Women-owned Minority-owned
Diverse AUM
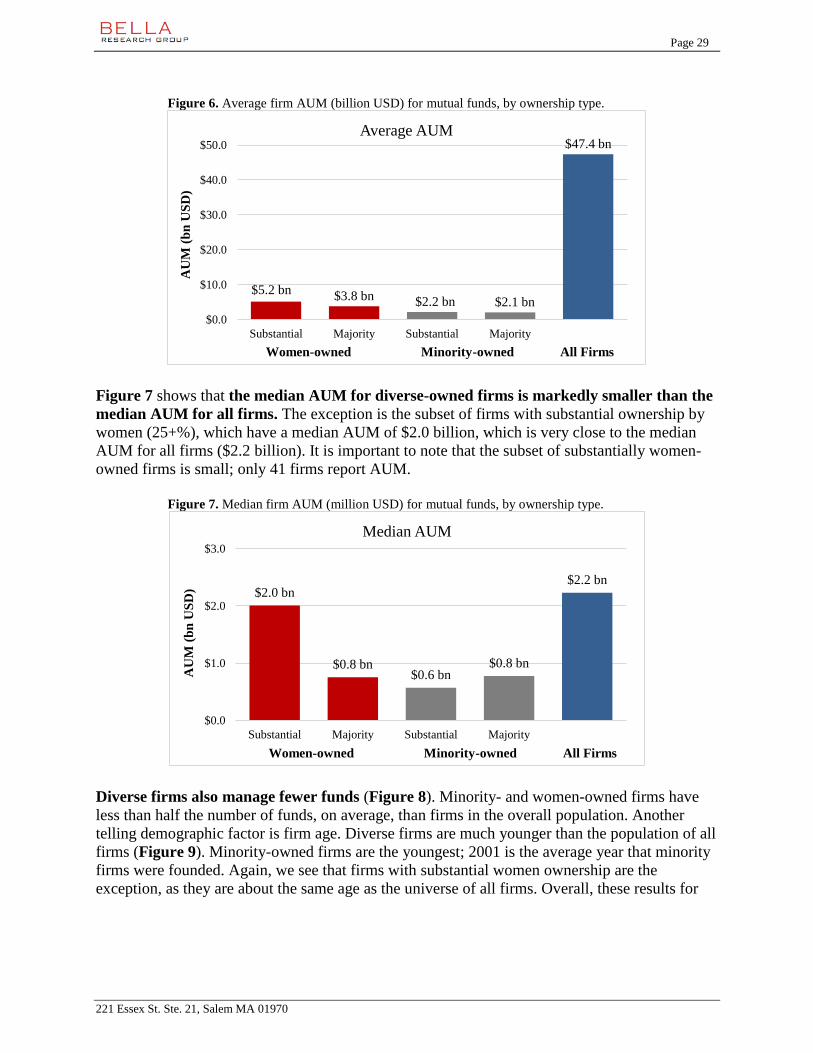
Page 29
221 Essex St. Ste. 21, Salem MA 01970
Figure 6. Average firm AUM (billion USD) for mutual funds, by ownership type.
Figure 7 shows that the median AUM for diverse-owned firms is markedly smaller than the
median AUM for all firms. The exception is the subset of firms with substantial ownership by
women (25+%), which have a median AUM of $2.0 billion, which is very close to the median
AUM for all firms ($2.2 billion). It is important to note that the subset of substantially women-
owned firms is small; only 41 firms report AUM.
Figure 7. Median firm AUM (million USD) for mutual funds, by ownership type.
Diverse firms also manage fewer funds (Figure 8). Minority- and women-owned firms have
less than half the number of funds, on average, than firms in the overall population. Another
telling demographic factor is firm age. Diverse firms are much younger than the population of all
firms (Figure 9). Minority-owned firms are the youngest; 2001 is the average year that minority
firms were founded. Again, we see that firms with substantial women ownership are the
exception, as they are about the same age as the universe of all firms. Overall, these results for
$5.2 bn$3.8 bn $2.2 bn $2.1 bn
$47.4 bn
$0.0
$10.0
$20.0
$30.0
$40.0
$50.0
Substantial Majority Substantial Majority
AU
M (
bn
US
D)
Women-owned Minority-owned All Firms
Average AUM
$2.0 bn
$0.8 bn$0.6 bn
$0.8 bn
$2.2 bn
$0.0
$1.0
$2.0
$3.0
Substantial Majority Substantial Majority
AU
M (
bn
US
D)
Women-owned Minority-owned All Firms
Median AUM
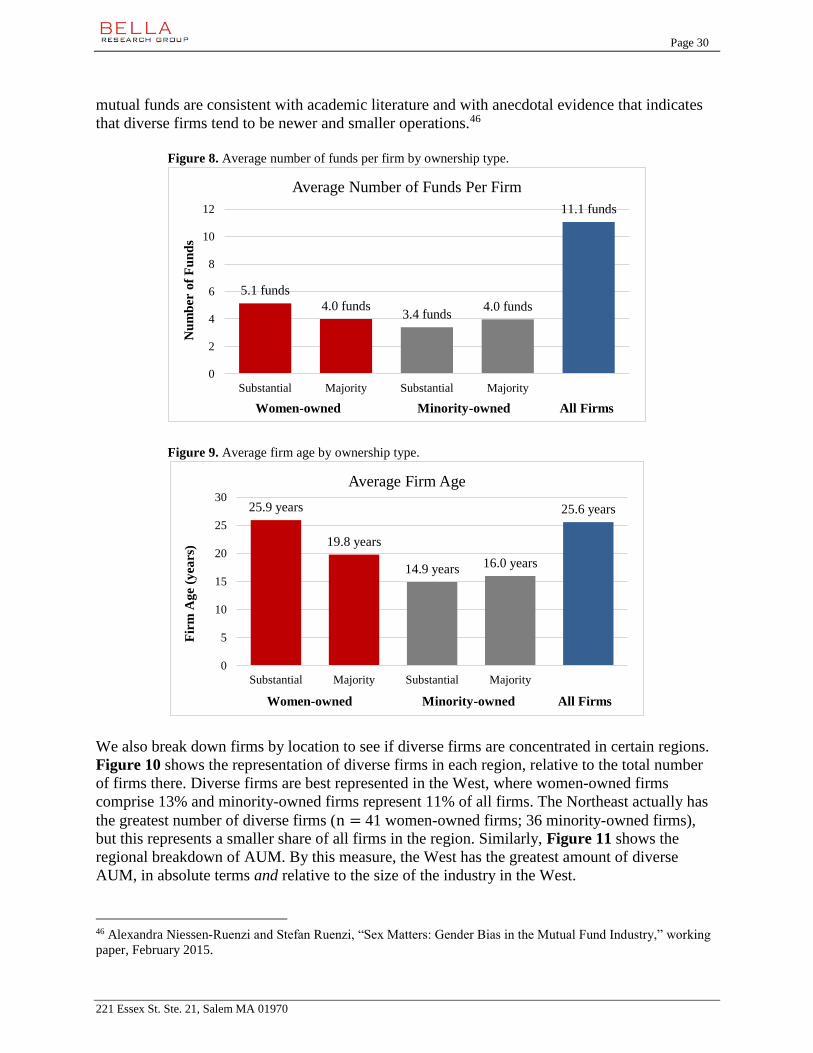
Page 30
221 Essex St. Ste. 21, Salem MA 01970
mutual funds are consistent with academic literature and with anecdotal evidence that indicates
that diverse firms tend to be newer and smaller operations.46
Figure 8. Average number of funds per firm by ownership type.
Figure 9. Average firm age by ownership type.
We also break down firms by location to see if diverse firms are concentrated in certain regions.
Figure 10 shows the representation of diverse firms in each region, relative to the total number
of firms there. Diverse firms are best represented in the West, where women-owned firms
comprise 13% and minority-owned firms represent 11% of all firms. The Northeast actually has
the greatest number of diverse firms (n = 41 women-owned firms; 36 minority-owned firms),
but this represents a smaller share of all firms in the region. Similarly, Figure 11 shows the
regional breakdown of AUM. By this measure, the West has the greatest amount of diverse
AUM, in absolute terms and relative to the size of the industry in the West.
46 Alexandra Niessen-Ruenzi and Stefan Ruenzi, “Sex Matters: Gender Bias in the Mutual Fund Industry,” working
paper, February 2015.
5.1 funds
4.0 funds3.4 funds
4.0 funds
11.1 funds
0
2
4
6
8
10
12
Substantial Majority Substantial Majority
Nu
mb
er o
f F
un
ds
Women-owned Minority-owned All Firms
Average Number of Funds Per Firm
25.9 years
19.8 years
14.9 years 16.0 years
25.6 years
0
5
10
15
20
25
30
Substantial Majority Substantial Majority
Fir
m A
ge
(yea
rs)
Women-owned Minority-owned All Firms
Average Firm Age
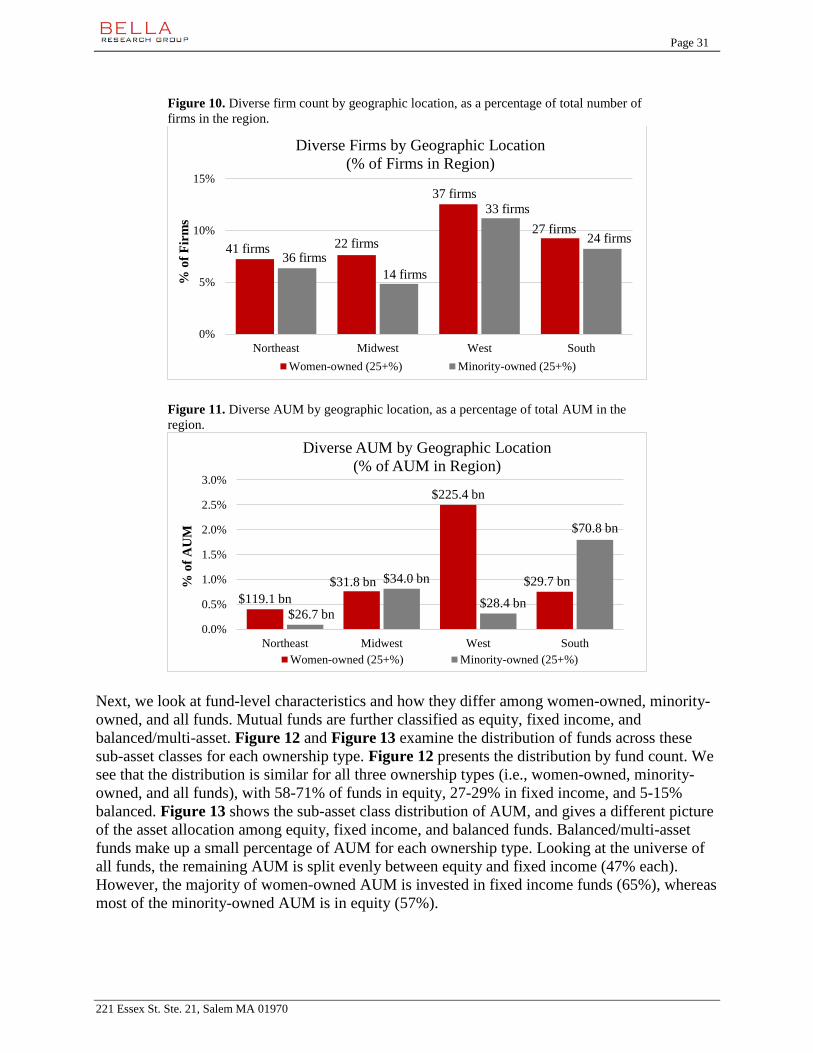
Page 31
221 Essex St. Ste. 21, Salem MA 01970
Figure 10. Diverse firm count by geographic location, as a percentage of total number of
firms in the region.
Figure 11. Diverse AUM by geographic location, as a percentage of total AUM in the
region.
Next, we look at fund-level characteristics and how they differ among women-owned, minority-
owned, and all funds. Mutual funds are further classified as equity, fixed income, and
balanced/multi-asset. Figure 12 and Figure 13 examine the distribution of funds across these
sub-asset classes for each ownership type. Figure 12 presents the distribution by fund count. We
see that the distribution is similar for all three ownership types (i.e., women-owned, minority-
owned, and all funds), with 58-71% of funds in equity, 27-29% in fixed income, and 5-15%
balanced. Figure 13 shows the sub-asset class distribution of AUM, and gives a different picture
of the asset allocation among equity, fixed income, and balanced funds. Balanced/multi-asset
funds make up a small percentage of AUM for each ownership type. Looking at the universe of
all funds, the remaining AUM is split evenly between equity and fixed income (47% each).
However, the majority of women-owned AUM is invested in fixed income funds (65%), whereas
most of the minority-owned AUM is in equity (57%).
41 firms 22 firms
37 firms
27 firms
36 firms
14 firms
33 firms
24 firms
0%
5%
10%
15%
Northeast Midwest West South
% o
f F
irm
s
Diverse Firms by Geographic Location
(% of Firms in Region)
Women-owned (25+%) Minority-owned (25+%)
$119.1 bn
$31.8 bn
$225.4 bn
$29.7 bn
$26.7 bn
$34.0 bn
$28.4 bn
$70.8 bn
0.0%
0.5%
1.0%
1.5%
2.0%
2.5%
3.0%
Northeast Midwest West South
% o
f A
UM
Diverse AUM by Geographic Location
(% of AUM in Region)
Women-owned (25+%) Minority-owned (25+%)

Page 32
221 Essex St. Ste. 21, Salem MA 01970
Figure 12. Geographic focus of mutual funds, by number of funds for each ownership type.
Figure 13. Geographic focus of mutual funds by AUM (billion USD) for each ownership type.
The main strategies for mutual funds are core, growth, passive index, and value. We look at the
distribution of strategies for women-owned, minority-owned, and all funds, first by number of
funds (Figure 14) and then by AUM (Figure 15). Distribution of strategies is similar across
ownership types, each having 35-38% of funds in core, 26-28% of funds in value, 23-26% of
funds in growth, 2-6% of funds in passive index, and 3-8% of funds in other. When viewed by
AUM, however, the dominant strategy and distribution of strategies change considerably. In
terms of AUM, core is the dominant strategy only for minority-owned funds (45% of AUM).
Another 39% of minority-owned AUM is in value, followed by 13% in growth, 3% in other, and
very little in passive index. For funds managed by women-owned firms, value is the most
dominant strategy in terms of AUM (39%) followed by core (31%), growth (22%), passive index
(7%), and other (1%). For all funds, the total AUM is more evenly distributed across value
(27%), growth (25%), core (24%), and passive index (19%), with the remaining 5% in other
strategies. Due to the economies of scale associated with setting up a passive index strategy,
small firms may not have the resources to offer these products.47 Since diverse-owned funds are
usually smaller than average, this may explain why diverse-owned funds are under-represented
in passive index funds, in terms of the number of funds and AUM.
47 Hortense Bioy, Jose Garcia-Zarate, Caroline Gutman, Kenneth Lamont, and Gordon Rose, “A Guided Tour of the
European ETF Marketplace,” online report for Morningstar, November 2014.
361 funds
152 funds
59 funds
288 funds
108 funds
20 funds
6,333 funds
3,138 funds
1,598 funds
0%
20%
40%
60%
80%
Equity Fixed Income Balanced
% o
f F
un
ds
Sub-Asset Class by Fund Count
Women-owned (25+%) Minority-owned (25+%) All Funds
$185 bn
$355 bn
$2.9 bn
$73 bn
$53 bn
$1.8 bn
$13,729 bn $13,736 bn
$1,972 bn
0%
25%
50%
75%
Equity Fixed Income Balanced
% o
f A
UM
Sub-Asset Class by AUM
Women-owned (25+%) Minority-owned (25+%) All Funds

Page 33
221 Essex St. Ste. 21, Salem MA 01970
Figure 14. Strategy for mutual funds, by number of funds for each ownership type. (Number of funds in each
strategy-ownership group shown above bars).
Figure 15. Strategy for mutual funds, by AUM (billion USD) for each ownership type.
The final characteristic we examine for mutual funds is the geographic investment focus. Figure
16 shows clearly that the vast majority of funds in our dataset are focused on U.S. investments,
regardless of ownership type (which is unsurprising since we only look at U.S.-based funds in
this report). Figure 17 tells a similar story, with most of the AUM in U.S.-focused funds.
Figure 16. Geographic focus of mutual funds, by number of funds for each ownership type.
145
99
22
105
10
107
81
5
75
24
2,301
1,549
359
1,848
587
0%
10%
20%
30%
40%
Core Growth Passive Index Value Other
% o
f F
un
ds
Strategy by Fund Count
Women-owned (25+%) Minority-owned (25+%) All Funds
433 funds
72 funds 67 funds
285 funds
55 funds 76 funds
7,033 funds
2,629 funds
1,407 funds
0%
20%
40%
60%
80%
US Global Other focus
% o
f F
un
ds
Geographic Focus by Fund Count
Women-owned (25+%) Minority-owned (25+%) All Funds
$58 bn
$40 bn
$12 bn
$72 bn
$2.6 bn
$34 bn
$9.8 bn
$0.0 bn
$30 bn
$2.0 bn
$3,527 bn
$2,801 bn
$3,721 bn $3,913 bn
$758 bn
0%
15%
30%
45%
Core Growth Passive Index Value Other
% o
f A
UM
Strategy by AUM
Women-owned (25+%) Minority-owned (25+%) All Funds

Page 34
221 Essex St. Ste. 21, Salem MA 01970
Figure 17. Geographic focus of mutual funds, by AUM (billion USD) for each ownership type.
This examination of firm- and fund-level characteristics shows that diverse and non-diverse
firms differ in meaningful ways, although there are some similarities between the ownership
types. Characteristics such as fund strategy and geographic focus are linked to performance, so it
will be important to control for these differences in the performance analysis.
Timeline of Diverse Ownership for Mutual Funds
We identify firms with women ownership (25%) or minority ownership (25%) for each quarter
from Q1 2011 through Q2 2016. We then calculate the proportion of diverse-owned firms,
diverse-owned funds, and diverse-owned AUM compared to the industry totals in each quarter.
Figure 18, Figure 19, and Figure 20 show the representation over time of diverse firms, funds,
and AUM, respectively.
Firm Count: In Figure 18, minority-owned firms comprise 6.1% to 7.9% of all firms in each
quarter. The representation of minority firms increases slightly over the period, from 6.8% of
firms in Q1 2011 to 7.8% of all firms in Q2 2016. Women-owned firms make up 8.7% to 10.6%
of all firms in any given quarter; representation of women firms decreases slightly over the
period, from 10.3% of firms to 9.3% of firms.
Figure 18. Timeline of diverse-owned mutual fund management firms.
$428 bn
$48 bn $67 bn
$97 bn
$4.9 bn
$26 bn
$21,183 bn
$4,809 bn$3,445 bn
0%
25%
50%
75%
US Global Other focus
% o
f A
UM
Geographic Focus by AUM
Women-owned (25+%) Minority-owned (25+%) All Funds
0.0%
2.0%
4.0%
6.0%
8.0%
10.0%
12.0%
Q1 2011 Q1 2012 Q1 2013 Q1 2014 Q1 2015 Q1 2016
% o
f A
ll F
irm
s
Diverse-Owned Firms by Quarter
as Percent of All Firms
Women-owned (25+%) Minority-owned (25+%)

Page 35
221 Essex St. Ste. 21, Salem MA 01970
Fund Count: As shown in Figure 19, the total representation of diverse-owned funds is smaller
compared to the representation of diverse-owned firms. This finding is consistent with findings
for the current state of diversity (as of Q2 2016), which shows that diverse-owned firms tend to
be smaller operations with fewer funds and lower AUM. Funds with women ownership represent
4.9% to 6.1% of all funds in a given quarter, while funds with minority ownership comprise
3.2% to 4.2% of the total. Similar to the firm analysis, we also observe fluctuation in funds over
time. The net change shows that both women- and minority-owned categories decrease slightly
in proportion to all funds (5.5% to 4.9% for women-owned firms; 3.6% to 3.2% for minority-
owned firms).
Figure 19. Timeline of mutual funds managed by diverse-owned firms.
AUM: In terms of AUM, we find that diverse-owned firms represent a very small fraction of
total AUM in each quarter (Figure 20). Women-owned firms comprise between 0.8% and 1.0%
of total AUM by quarter, while minority-owned firms comprise 0.4% to 0.9% of AUM per
quarter. These changes are associated with fairly large swings in assets from quarter to quarter.
During this period, the amount of AUM (Figure 21) managed by women-owned firms is $288.2
billion at the minimum in Q3 2011 and $440.3 billion at the maximum in Q2 2014. AUM for
minority-owned firms ranges from a low of $167.2 billion in Q2 2016 to a high of $408.6 billion
in Q2 2015.
The proportion of AUM with women-owned firms is virtually the same at the beginning and end
of this period (0.9% of total AUM). However, the amount of AUM with women-owned firms
increases from $318.8 billion in Q1 2011 to $411 billion in Q2 2016. For minority-owned firms,
the proportion of AUM and amount of AUM both decrease over this period (0.8% to 0.4% of
total AUM; $299.1 billion to $207.2 billion AUM). Figure 18 and Figure 19 show that the
proportion of minority-owned funds and firms is relatively more constant over the time period
compared to AUM. The exit of a large minority-owned firm or fund could produce a large drop
in AUM with minority-owned firms. In the data, we would see an “exit” for multiple reasons:
(1) a change in ownership so that a firm no longer meets the threshold for diverse ownership, (2)
a firm closes and stops reporting to the database, or (3) a firm is still active but stops reporting to
the database.
0.0%
1.0%
2.0%
3.0%
4.0%
5.0%
6.0%
7.0%
Q1 2011 Q1 2012 Q1 2013 Q1 2014 Q1 2015 Q1 2016
% o
f A
ll F
un
ds
Diverse-Owned Funds by Quarter
as Percent of All Funds
Women-owned (25+%) Minority-owned (25+%)
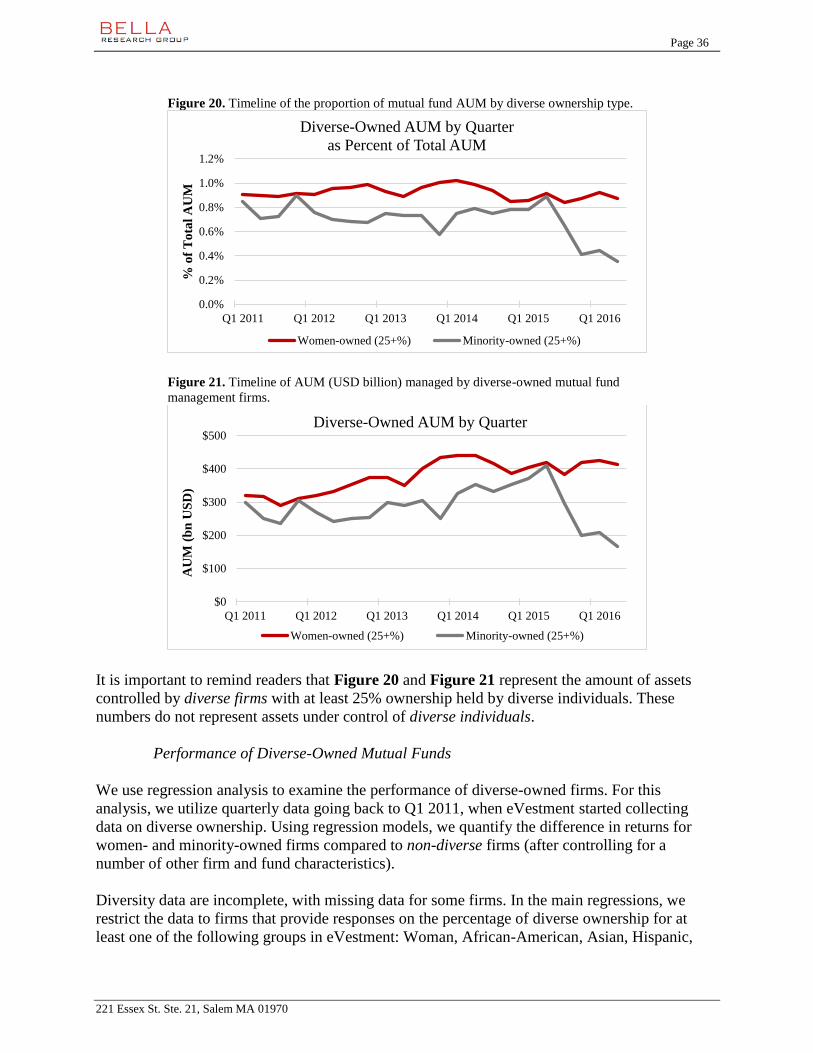
Page 36
221 Essex St. Ste. 21, Salem MA 01970
Figure 20. Timeline of the proportion of mutual fund AUM by diverse ownership type.
Figure 21. Timeline of AUM (USD billion) managed by diverse-owned mutual fund
management firms.
It is important to remind readers that Figure 20 and Figure 21 represent the amount of assets
controlled by diverse firms with at least 25% ownership held by diverse individuals. These
numbers do not represent assets under control of diverse individuals.
Performance of Diverse-Owned Mutual Funds
We use regression analysis to examine the performance of diverse-owned firms. For this
analysis, we utilize quarterly data going back to Q1 2011, when eVestment started collecting
data on diverse ownership. Using regression models, we quantify the difference in returns for
women- and minority-owned firms compared to non-diverse firms (after controlling for a
number of other firm and fund characteristics).
Diversity data are incomplete, with missing data for some firms. In the main regressions, we
restrict the data to firms that provide responses on the percentage of diverse ownership for at
least one of the following groups in eVestment: Woman, African-American, Asian, Hispanic,
0.0%
0.2%
0.4%
0.6%
0.8%
1.0%
1.2%
Q1 2011 Q1 2012 Q1 2013 Q1 2014 Q1 2015 Q1 2016
% o
f T
ota
l A
UM
Diverse-Owned AUM by Quarter
as Percent of Total AUM
Women-owned (25+%) Minority-owned (25+%)
$0
$100
$200
$300
$400
$500
Q1 2011 Q1 2012 Q1 2013 Q1 2014 Q1 2015 Q1 2016
AU
M (
bn
US
D)
Diverse-Owned AUM by Quarter
Women-owned (25+%) Minority-owned (25+%)
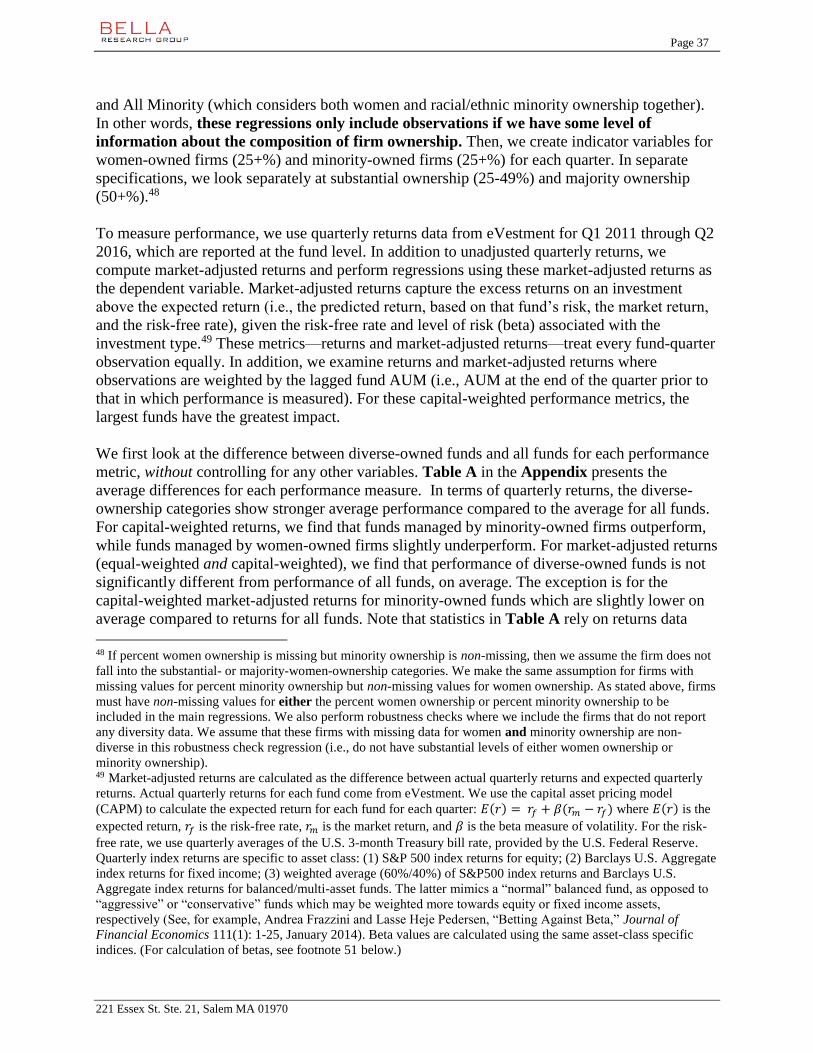
Page 37
221 Essex St. Ste. 21, Salem MA 01970
and All Minority (which considers both women and racial/ethnic minority ownership together).
In other words, these regressions only include observations if we have some level of
information about the composition of firm ownership. Then, we create indicator variables for
women-owned firms (25+%) and minority-owned firms (25+%) for each quarter. In separate
specifications, we look separately at substantial ownership (25-49%) and majority ownership
(50+%).48
To measure performance, we use quarterly returns data from eVestment for Q1 2011 through Q2
2016, which are reported at the fund level. In addition to unadjusted quarterly returns, we
compute market-adjusted returns and perform regressions using these market-adjusted returns as
the dependent variable. Market-adjusted returns capture the excess returns on an investment
above the expected return (i.e., the predicted return, based on that fund’s risk, the market return,
and the risk-free rate), given the risk-free rate and level of risk (beta) associated with the
investment type.49 These metrics—returns and market-adjusted returns—treat every fund-quarter
observation equally. In addition, we examine returns and market-adjusted returns where
observations are weighted by the lagged fund AUM (i.e., AUM at the end of the quarter prior to
that in which performance is measured). For these capital-weighted performance metrics, the
largest funds have the greatest impact.
We first look at the difference between diverse-owned funds and all funds for each performance
metric, without controlling for any other variables. Table A in the Appendix presents the
average differences for each performance measure. In terms of quarterly returns, the diverse-
ownership categories show stronger average performance compared to the average for all funds.
For capital-weighted returns, we find that funds managed by minority-owned firms outperform,
while funds managed by women-owned firms slightly underperform. For market-adjusted returns
(equal-weighted and capital-weighted), we find that performance of diverse-owned funds is not
significantly different from performance of all funds, on average. The exception is for the
capital-weighted market-adjusted returns for minority-owned funds which are slightly lower on
average compared to returns for all funds. Note that statistics in Table A rely on returns data
48 If percent women ownership is missing but minority ownership is non-missing, then we assume the firm does not
fall into the substantial- or majority-women-ownership categories. We make the same assumption for firms with
missing values for percent minority ownership but non-missing values for women ownership. As stated above, firms
must have non-missing values for either the percent women ownership or percent minority ownership to be
included in the main regressions. We also perform robustness checks where we include the firms that do not report
any diversity data. We assume that these firms with missing data for women and minority ownership are non-
diverse in this robustness check regression (i.e., do not have substantial levels of either women ownership or
minority ownership). 49 Market-adjusted returns are calculated as the difference between actual quarterly returns and expected quarterly
returns. Actual quarterly returns for each fund come from eVestment. We use the capital asset pricing model
(CAPM) to calculate the expected return for each fund for each quarter: 𝐸(𝑟) = 𝑟𝑓 + 𝛽(𝑟𝑚 − 𝑟𝑓) where 𝐸(𝑟) is the
expected return, 𝑟𝑓 is the risk-free rate, 𝑟𝑚 is the market return, and 𝛽 is the beta measure of volatility. For the risk-
free rate, we use quarterly averages of the U.S. 3-month Treasury bill rate, provided by the U.S. Federal Reserve.
Quarterly index returns are specific to asset class: (1) S&P 500 index returns for equity; (2) Barclays U.S. Aggregate
index returns for fixed income; (3) weighted average (60%/40%) of S&P500 index returns and Barclays U.S.
Aggregate index returns for balanced/multi-asset funds. The latter mimics a “normal” balanced fund, as opposed to
“aggressive” or “conservative” funds which may be weighted more towards equity or fixed income assets,
respectively (See, for example, Andrea Frazzini and Lasse Heje Pedersen, “Betting Against Beta,” Journal of
Financial Economics 111(1): 1-25, January 2014). Beta values are calculated using the same asset-class specific
indices. (For calculation of betas, see footnote 51 below.)

Page 38
221 Essex St. Ste. 21, Salem MA 01970
from multiple years and for mutual funds where the underlying assets may be public equity,
fixed income, or balanced/multi-asset. These averages do not control for any variables that may
be related to performance, such as quarter or sub-asset class, and therefore, do not isolate the true
effect of diverse ownership. These summary statistics are intended to provide an overview of the
performance data for mutual funds.
Next, we perform regressions of each performance measure and control for a number of relevant
firm and fund characteristics. Several studies indicate that firm and fund size are linked with
performance.50 Therefore, we control for fund and firm assets from the previous quarter. Since
different fund types are associated with different performance and risk profiles, all regressions
contain fixed effects (FE) for asset class (e.g., equity, fixed income, and balanced/multi-asset),
strategy (e.g., core, growth, value, and passive index), and regional focus (e.g., U.S., Europe,
Asia, Africa, Latin America, and Global). To control for market fluctuations, we include quarter
fixed effects, and most specifications also include quarter-asset class fixed effects, since certain
fund types may perform better under different market conditions. Alternative specifications
control directly for beta (a measure of fund volatility)51 and survivorship (whether the fund was
still active when we downloaded the dataset on August 25, 2016). All performance regressions
cluster standard errors by firm to account for the fact that each firm has multiple fund-quarter
observations.
To briefly summarize our approach, we estimate a series of six regressions that quantify the
effect of diverse ownership on performance and test the robustness of our findings:
1. Base Regression.
In this base model, we examine the effect of women and minority ownership on
unadjusted quarterly returns, controlling for fund assets (lagged one quarter), firm assets
(lagged one quarter), and fixed effects for several fund characteristics.
2. Base Regression with Additional Controls.
This model expands the Base Regression by adding beta (a measure of volatility) and a
variable to indicate whether the fund is active.
3. Market-Adjusted Regression.
This regression is similar to the Base Regression with Additional Controls, using market-
adjusted quarterly returns as the dependent variable. Since the calculation of market-
adjusted returns incorporates beta directly, this specification excludes beta as an
explanatory variable.
50 See for example: (1) Joseph Chen, Harrison Hong, Ming Huang, Jeffery D. Kubik, “Does Fund Size Erode Mutual
Fund Performance? The Role of Liquidity and Organization,” The American Economic Review 94(5): 1276-1302,
December 2004. (2) John A. Haslem, H. Kent Baker, David M. Smith, “Performance and Characteristics of Actively
Managed Retail Mutual Funds with Diverse Expense Ratios,” SSRN working paper, July 2008. 51 Betas are calculated as the correlation between a fund’s quarterly returns and the returns of the index for the same
time period. For equity funds and fixed income funds, we use S&P 500 index returns and Barclays Aggregate U.S.
index returns, respectively, as the indices for calculating beta. For balanced/multi-asset funds, we use a weighted
average of 60% S&P 500 index and 40% Barclays U.S. Aggregate index. For each quarter-fund observation, we
calculate a 12-quarter rolling beta using the funds’ actual quarterly returns and the asset-class-specific index returns
for the past three years.
Page 39
221 Essex St. Ste. 21, Salem MA 01970
4. Capital-Weighted Regression.
This version of the Base Regression weights observations by lagged fund assets. For this
reason, we exclude lagged fund assets as an explanatory variable.
5. Capital-Weighted Regression with Additional Controls.
This model is the same as the Base Regression with Additional Controls, except that
observations are weighted by lagged fund assets. Again, we exclude lagged fund assets as
an explanatory variable, since it is used for the weighting.
6. Capital-Weighted Market-Adjusted Regression.
This model is the capital-weighted version of the Market-Adjusted Regression, where
observations are weighted by lagged fund assets.
This set of six regressions is estimated twice, first using indicators for all women- and minority-
owned firms (25+% ownership) and second with separate indicators for substantial (25-49%) and
majority (50+%) ownership. Output from these sets of regressions can be found in Tables B and
C of the Appendix.
We find that larger firms and smaller funds are generally associated with higher returns, but this
effect is not significant in regressions of market-adjusted returns or capital-weighted returns. In
terms of asset class, equity and fixed income products typically exhibit lower returns (equally-
weighted and capital-weighted) compared to balanced/multi-asset products; on the other hand,
market-adjusted returns for fixed income and equity are typically higher. We find that higher
beta values are associated with higher returns. We also find that active funds tend to see
significantly higher returns in the equal-weighted regressions, but the coefficients are not
significant in the capital-weighted regressions.
The indicators for firms with 25+% women ownership and 25+% minority ownership are
insignificant for almost every specification in Table B. Only in model (4), we find that the
coefficient for majority women-owned firms is negative and significant, but model (5) with
additional controls for volatility and survivorship shows no significant difference in
performance. Further, all other regressions in Table B do not show any performance difference
between women-owned firms and non-women-owned firms. This suggests that the
performance of funds managed by diverse-owned firms is not different from that of non-
diverse firms, after controlling for firm and fund characteristics as described.
Table C tells a similar story, looking separately at substantially- and majority-women-owned
firms and substantially- and majority-minority-owned firms. In most specifications, we find no
significant differences in performance between diverse-owned firms and non-diverse firms, with
only two exceptions. The coefficient for majority women-owned firms is negative and significant
in the capital-weighted returns regression [column (4)], but all other specifications show no
significant differences for this group. For firms with majority ownership by minorities, there is
no significant effect of ownership on returns, market-adjusted returns, or capital-weighted
returns [columns (1)-(5)]. However, there is a negative and significant coefficient in model (6)
for capital-weighted market-adjusted returns. Taken as a whole, this evidence suggests that
diverse and non-diverse firms have similar performance.
Page 40
221 Essex St. Ste. 21, Salem MA 01970
We performed a number of robustness checks that substantiate these findings. First, we re-
estimate all regressions but include firms without any data on diverse ownership. We assume that
these firms do not belong to any diverse category. Second, we estimate the same models using
just the subset of equity and balanced/multi-asset funds, to see if the inclusion of fixed income
products is driving the results. Third, we include firm age as an explanatory variable since
diverse firms tend to be younger, and firm age may be correlated with survival, capital inflows,
and performance. Finally, we drop the top 5% largest firms from the dataset in order to diminish
the influence of large, publicly-traded companies, and we re-estimate the regression models.52
The results from each robustness check are generally consistent with the initial analysis, pointing
to similar performance between diverse and non-diverse firms.
While the regression results show no difference in average performance between diverse and
non-diverse firms (after controlling for many relevant factors), we are also interested in those
firms with above-average returns. In particular, how many women- and minority-owned funds
have top-quartile performance? For this analysis, we find the proportions of women- and
minority-owned mutual funds with top-quartile returns for each quarter, and we calculate the
average percentage across all quarters of data. Averages are weighted by the number of women-
or minority-owned funds with reported returns data for each quarter.
Table I in the Appendix demonstrates clearly that a number of women- and minority-owned
mutual funds outperform. On average, 25% of women-owned funds and 28% of minority-
owned funds are top quartile.
Institutional Investor Types for Diverse-Owned Mutual Funds
For mutual funds, the institutional investor analysis looks at the breakdown of AUM associated
with each investor type. First, we find the average amount of AUM per investor type for each of
the ownership categories (i.e., women-owned, minority-owned, and all funds). To calculate these
figures, we use data on how much fund-level capital comes from each investor type, and we take
averages across all funds in the women-owned, minority-owned, and all funds categories.
Figure 22 displays the average AUM amounts for the top five investor types by ownership
category. The average women-owned fund has nearly $540 million in AUM from corporate
clients53 followed by $200 million from public funds. The average minority-owned fund has
$168 million in AUM from public funds and $97 million from corporate clients.
52 Unfortunately, we could not identify the subset of privately-held companies in a systematic way without dropping
a large number of relevant observations. Therefore, we use firm size as a proxy for public ownership and exclude the
top 5% largest firms. 53 This large value for the average amount of AUM invested in women-owned funds is driven by a single women-
owned firm with several very large funds.
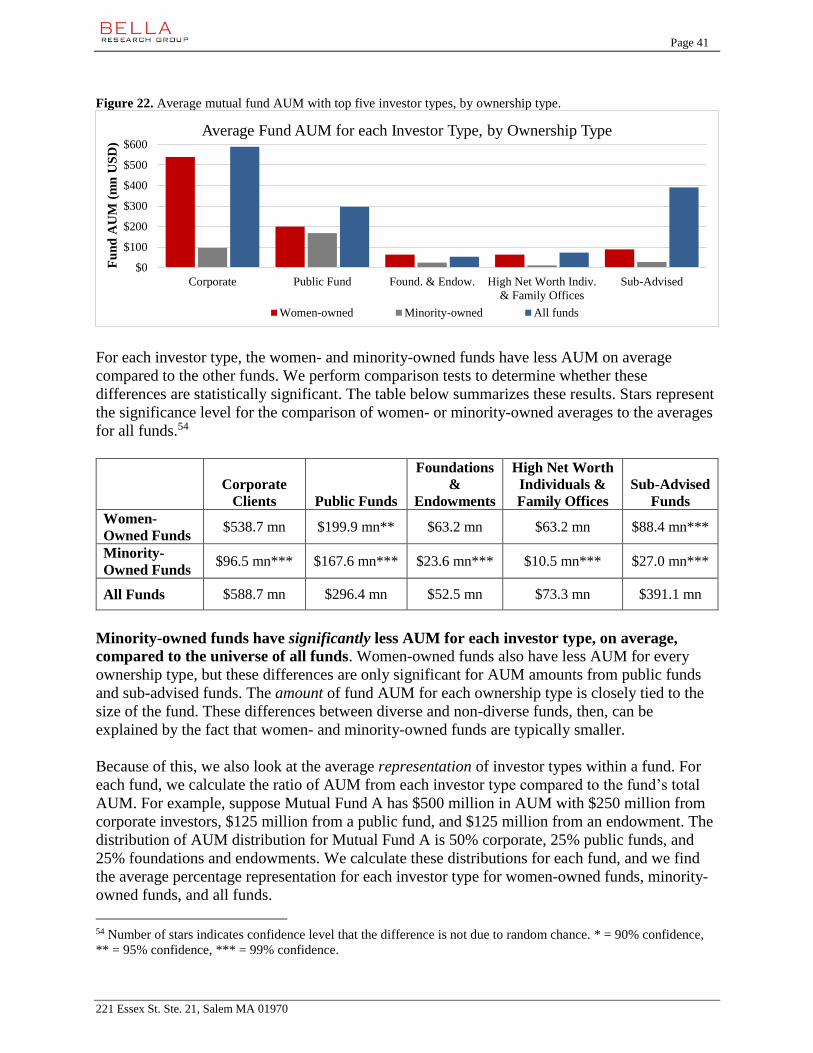
Page 41
221 Essex St. Ste. 21, Salem MA 01970
Figure 22. Average mutual fund AUM with top five investor types, by ownership type.
For each investor type, the women- and minority-owned funds have less AUM on average
compared to the other funds. We perform comparison tests to determine whether these
differences are statistically significant. The table below summarizes these results. Stars represent
the significance level for the comparison of women- or minority-owned averages to the averages
for all funds.54
Corporate
Clients Public Funds
Foundations
&
Endowments
High Net Worth
Individuals &
Family Offices
Sub-Advised
Funds
Women-
Owned Funds $538.7 mn $199.9 mn** $63.2 mn $63.2 mn $88.4 mn***
Minority-
Owned Funds $96.5 mn*** $167.6 mn*** $23.6 mn*** $10.5 mn*** $27.0 mn***
All Funds $588.7 mn $296.4 mn $52.5 mn $73.3 mn $391.1 mn
Minority-owned funds have significantly less AUM for each investor type, on average,
compared to the universe of all funds. Women-owned funds also have less AUM for every
ownership type, but these differences are only significant for AUM amounts from public funds
and sub-advised funds. The amount of fund AUM for each ownership type is closely tied to the
size of the fund. These differences between diverse and non-diverse funds, then, can be
explained by the fact that women- and minority-owned funds are typically smaller.
Because of this, we also look at the average representation of investor types within a fund. For
each fund, we calculate the ratio of AUM from each investor type compared to the fund’s total
AUM. For example, suppose Mutual Fund A has $500 million in AUM with $250 million from
corporate investors, $125 million from a public fund, and $125 million from an endowment. The
distribution of AUM distribution for Mutual Fund A is 50% corporate, 25% public funds, and
25% foundations and endowments. We calculate these distributions for each fund, and we find
the average percentage representation for each investor type for women-owned funds, minority-
owned funds, and all funds.
54 Number of stars indicates confidence level that the difference is not due to random chance. * = 90% confidence,
** = 95% confidence, *** = 99% confidence.
$0
$100
$200
$300
$400
$500
$600
Corporate Public Fund Found. & Endow. High Net Worth Indiv.
& Family Offices
Sub-Advised
Fu
nd
AU
M (
mn
US
D)
Average Fund AUM for each Investor Type, by Ownership Type
Women-owned Minority-owned All funds

Page 42
221 Essex St. Ste. 21, Salem MA 01970
Figure 23 shows the representation of investor types for each ownership type. Public fund
investments make up 11% of the AUM for other funds, but public fund investments represent
a much greater portion of AUM for diverse-owned mutual funds. These investments make
up 23% of AUM for women-owned funds and 32% of AUM for minority-owned funds, on
average. Similarly, investments from foundations, endowments, high net worth individuals, and
family offices make up a greater fraction of the AUM for women- and minority-owned funds
compared to other funds.
Figure 23. Average percentage of mutual fund AUM with top five investor types, by ownership type.
Again, we perform comparison tests to examine whether the representation of each investor type
is statistically different for women- and minority-owned funds compared to all funds. Results
from these tests are summarized in the table below, with stars representing the level of
confidence regarding each comparison test.
Corporate
Clients Public Funds
Foundations
&
Endowments
High Net Worth
Individuals &
Family Offices
Sub-Advised
Funds
Women-
Owned Funds 15.4% 23.2%*** 9.7%*** 14.8%** 8.4%***
Minority-
Owned Funds 15.0% 32.0%*** 7.1%* 10.9% 5.0%***
All Funds 15.9% 10.5% 4.3% 10.0% 13.2%
The analysis regarding investor type representation shows that public funds, foundations, and
endowments make up a significantly greater portion of AUM for women-owned or
minority-owned mutual funds. Diverse-owned funds also have a higher representation of AUM
from high net worth individuals and family offices, but this finding is statistically significant
only for the subset of women-owned funds. We also find that AUM from sub-advised funds
represents a significantly lower proportion of AUM for women- and minority-owned
mutual funds, while the representation of corporate clients is similar across all ownership
categories.
0%
5%
10%
15%
20%
25%
30%
35%
Corporate Public Fund Found. & Endow. High Net Worth Indiv.
& Family Offices
Sub-Advised
% o
f F
un
d A
UM
Average % AUM for each Investor Type, by Ownership Type
Women-owned Minority-owned All funds
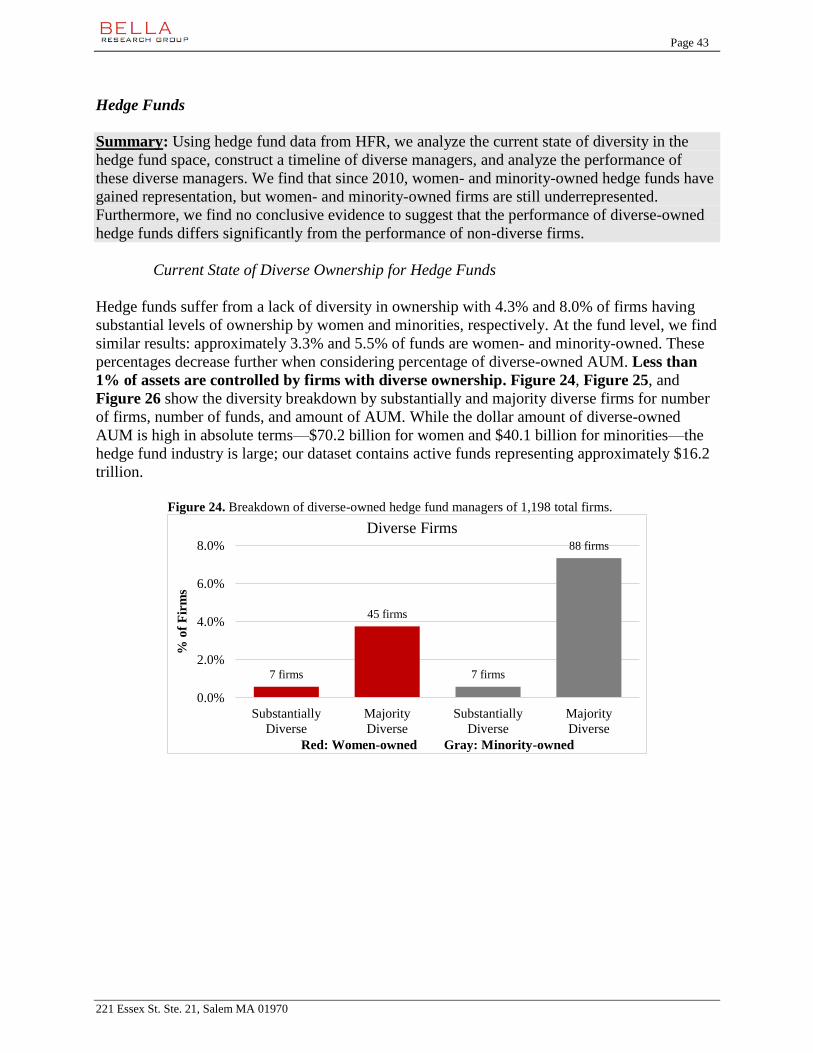
Page 43
221 Essex St. Ste. 21, Salem MA 01970
Hedge Funds
Summary: Using hedge fund data from HFR, we analyze the current state of diversity in the
hedge fund space, construct a timeline of diverse managers, and analyze the performance of
these diverse managers. We find that since 2010, women- and minority-owned hedge funds have
gained representation, but women- and minority-owned firms are still underrepresented.
Furthermore, we find no conclusive evidence to suggest that the performance of diverse-owned
hedge funds differs significantly from the performance of non-diverse firms.
Current State of Diverse Ownership for Hedge Funds
Hedge funds suffer from a lack of diversity in ownership with 4.3% and 8.0% of firms having
substantial levels of ownership by women and minorities, respectively. At the fund level, we find
similar results: approximately 3.3% and 5.5% of funds are women- and minority-owned. These
percentages decrease further when considering percentage of diverse-owned AUM. Less than
1% of assets are controlled by firms with diverse ownership. Figure 24, Figure 25, and
Figure 26 show the diversity breakdown by substantially and majority diverse firms for number
of firms, number of funds, and amount of AUM. While the dollar amount of diverse-owned
AUM is high in absolute terms––$70.2 billion for women and $40.1 billion for minorities––the
hedge fund industry is large; our dataset contains active funds representing approximately $16.2
trillion.
Figure 24. Breakdown of diverse-owned hedge fund managers of 1,198 total firms.
7 firms
45 firms
7 firms
88 firms
0.0%
2.0%
4.0%
6.0%
8.0%
Substantially
Diverse
Majority
Diverse
Substantially
Diverse
Majority
Diverse
% o
f F
irm
s
Red: Women-owned Gray: Minority-owned
Diverse Firms

Page 44
221 Essex St. Ste. 21, Salem MA 01970
Figure 25. Breakdown of diverse-owned hedge funds of 2,584 total funds.
Figure 26. Breakdown of diverse-owned hedge fund AUM of $16.2 trillion total AUM.
The fact that diverse-owned firms manage such an extremely low proportion of AUM is
partially explained by the smaller size of diverse-owned firms. In addition, diverse-owned firms
have raised fewer funds than the overall population of the dataset. Figure 27 shows the average
number of funds per firm by ownership type. We also find that the average and median AUM
are lower for women- and minority-owned firms compared to the population of hedge fund
managers. Figure 28 shows the average AUM across all diverse groups, with breakdowns for
substantial and majority ownership. For median AUM, however, we group substantial and
majority ownership together due to a skewed result caused by the small sample size of
substantially diverse women-owned firms. The median AUMs for diverse-owned firms are also
lower than the population median. This is shown in Figure 29.
13 funds
72 funds
12 funds
128 funds
0.0%
1.0%
2.0%
3.0%
4.0%
5.0%
Substantially
Diverse
Majority
Diverse
Substantially
Diverse
Majority
Diverse
% o
f F
un
ds
Red: Women-owned Gray: Minority-owned
Diverse Funds
$48.9 bn
$21.2 bn
$3.6 bn
$36.4 bn
0.00%
0.05%
0.10%
0.15%
0.20%
0.25%
0.30%
0.35%
Substantially
Diverse
Majority
Diverse
Substantially
Diverse
Majority
Diverse
% o
f A
UM
Red: Women-owned Gray: Minority-owned
Diverse AUM
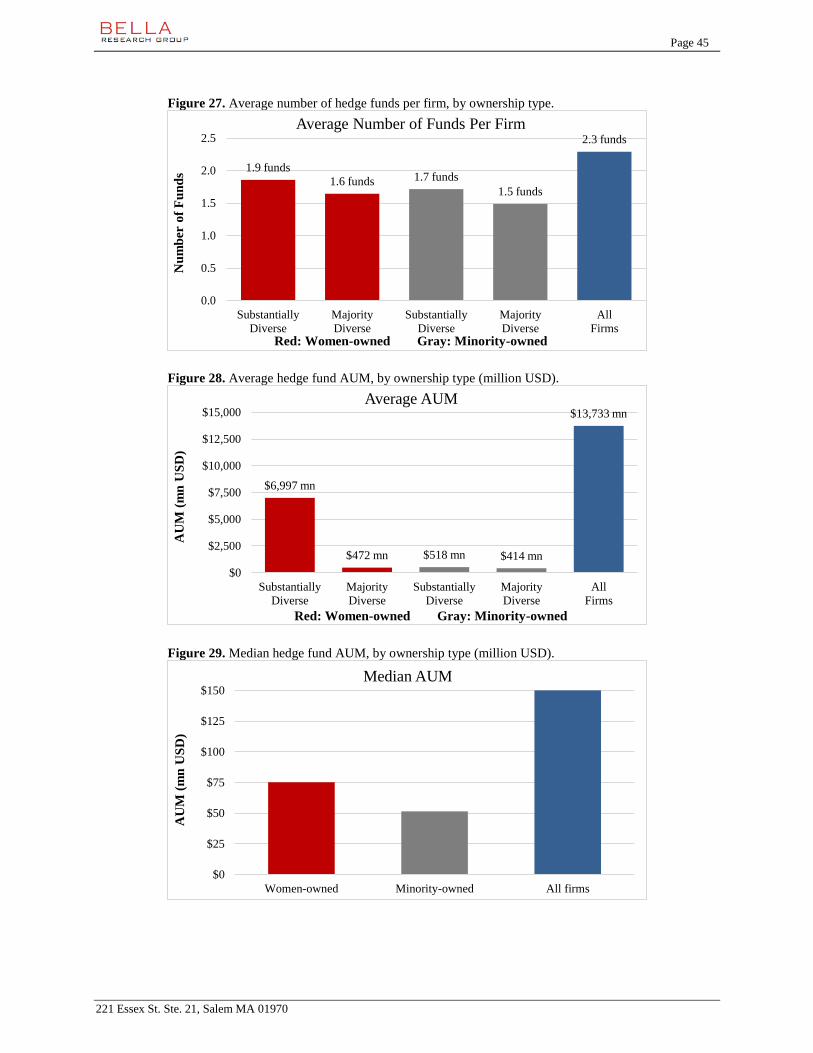
Page 45
221 Essex St. Ste. 21, Salem MA 01970
Figure 27. Average number of hedge funds per firm, by ownership type.
Figure 28. Average hedge fund AUM, by ownership type (million USD).
Figure 29. Median hedge fund AUM, by ownership type (million USD).
1.9 funds
1.6 funds 1.7 funds
1.5 funds
2.3 funds
0.0
0.5
1.0
1.5
2.0
2.5
Substantially
Diverse
Majority
Diverse
Substantially
Diverse
Majority
Diverse
All
Firms
Nu
mb
er o
f F
un
ds
Red: Women-owned Gray: Minority-owned
Average Number of Funds Per Firm
$6,997 mn
$472 mn $518 mn $414 mn
$13,733 mn
$0
$2,500
$5,000
$7,500
$10,000
$12,500
$15,000
Substantially
Diverse
Majority
Diverse
Substantially
Diverse
Majority
Diverse
All
Firms
AU
M (
mn
US
D)
Red: Women-owned Gray: Minority-owned
Average AUM
$0
$25
$50
$75
$100
$125
$150
Women-owned Minority-owned All firms
AU
M (
mn
US
D)
Median AUM
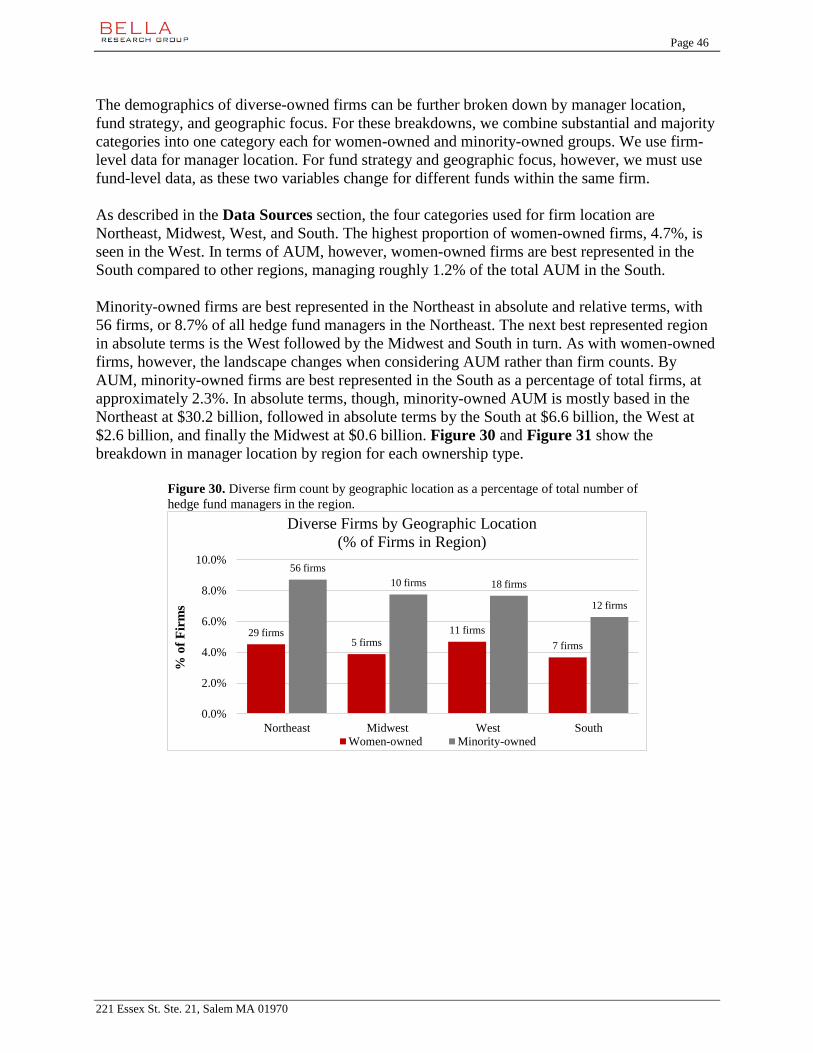
Page 46
221 Essex St. Ste. 21, Salem MA 01970
The demographics of diverse-owned firms can be further broken down by manager location,
fund strategy, and geographic focus. For these breakdowns, we combine substantial and majority
categories into one category each for women-owned and minority-owned groups. We use firm-
level data for manager location. For fund strategy and geographic focus, however, we must use
fund-level data, as these two variables change for different funds within the same firm.
As described in the Data Sources section, the four categories used for firm location are
Northeast, Midwest, West, and South. The highest proportion of women-owned firms, 4.7%, is
seen in the West. In terms of AUM, however, women-owned firms are best represented in the
South compared to other regions, managing roughly 1.2% of the total AUM in the South.
Minority-owned firms are best represented in the Northeast in absolute and relative terms, with
56 firms, or 8.7% of all hedge fund managers in the Northeast. The next best represented region
in absolute terms is the West followed by the Midwest and South in turn. As with women-owned
firms, however, the landscape changes when considering AUM rather than firm counts. By
AUM, minority-owned firms are best represented in the South as a percentage of total firms, at
approximately 2.3%. In absolute terms, though, minority-owned AUM is mostly based in the
Northeast at $30.2 billion, followed in absolute terms by the South at $6.6 billion, the West at
$2.6 billion, and finally the Midwest at $0.6 billion. Figure 30 and Figure 31 show the
breakdown in manager location by region for each ownership type.
Figure 30. Diverse firm count by geographic location as a percentage of total number of
hedge fund managers in the region.
29 firms5 firms
11 firms
7 firms
56 firms
10 firms 18 firms
12 firms
0.0%
2.0%
4.0%
6.0%
8.0%
10.0%
Northeast Midwest West South
% o
f F
irm
s
Diverse Firms by Geographic Location
(% of Firms in Region)
Women-owned Minority-owned

Page 47
221 Essex St. Ste. 21, Salem MA 01970
Figure 31. Diverse AUM by geographic location as a percentage of total hedge fund AUM
in the region.
The HFR database breaks strategy into five groups: equity hedge, event driven, fund of funds,
macro, and relative value. As described in the Data Sources section, we drop all funds of funds
from this analysis, leaving the other four strategy groups. Across each ownership group, equity
hedge is the most popular strategy by fund count, with 48% of women-owned funds, 45% of
minority-owned funds, and 44% of all funds focusing on this strategy. When considering
strategies by the amount of AUM dedicated to each, equity hedge remains the top choice for
minority-owned funds, with 33% of AUM in funds using that strategy. AUM managed by
women-owned firms, however, is most concentrated in event-driven funds at 37%. Strategy
breakdowns by fund count and AUM are shown in Figure 32 and Figure 33.
Figure 32. Main hedge fund strategy by number of funds for each ownership type.
$62.7 bn
$0.3 bn $3.8 bn
$3.4 bn
$30.2 bn $0.6 bn $2.6 bn
$6.6 bn
0.0%
0.5%
1.0%
1.5%
2.0%
2.5%
Northeast Midwest West South
% o
f A
UM
Diverse AUM by Geographic Location
(% of AUM in Region)
Women-owned Minority-owned
41 funds
11 funds
20 funds
13 funds
64 funds
15 funds
33 funds29 funds
1,147 funds
326 funds
540 funds 571 funds
0%
10%
20%
30%
40%
50%
Equity Hedge Event Driven Macro Relative Value
% o
f F
un
ds
Main Strategy by Fund Count
Women-owned Minority-owned All Funds
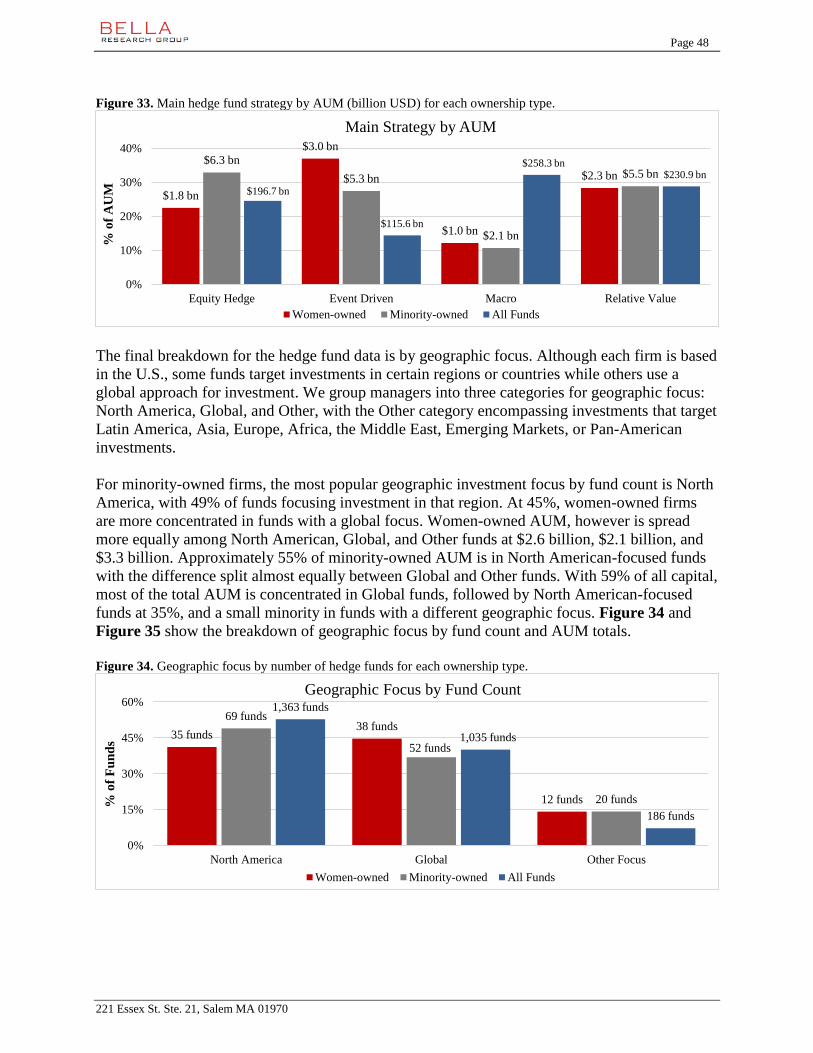
Page 48
221 Essex St. Ste. 21, Salem MA 01970
Figure 33. Main hedge fund strategy by AUM (billion USD) for each ownership type.
The final breakdown for the hedge fund data is by geographic focus. Although each firm is based
in the U.S., some funds target investments in certain regions or countries while others use a
global approach for investment. We group managers into three categories for geographic focus:
North America, Global, and Other, with the Other category encompassing investments that target
Latin America, Asia, Europe, Africa, the Middle East, Emerging Markets, or Pan-American
investments.
For minority-owned firms, the most popular geographic investment focus by fund count is North
America, with 49% of funds focusing investment in that region. At 45%, women-owned firms
are more concentrated in funds with a global focus. Women-owned AUM, however is spread
more equally among North American, Global, and Other funds at $2.6 billion, $2.1 billion, and
$3.3 billion. Approximately 55% of minority-owned AUM is in North American-focused funds
with the difference split almost equally between Global and Other funds. With 59% of all capital,
most of the total AUM is concentrated in Global funds, followed by North American-focused
funds at 35%, and a small minority in funds with a different geographic focus. Figure 34 and
Figure 35 show the breakdown of geographic focus by fund count and AUM totals.
Figure 34. Geographic focus by number of hedge funds for each ownership type.
$1.8 bn
$3.0 bn
$1.0 bn
$2.3 bn
$6.3 bn
$5.3 bn
$2.1 bn
$5.5 bn
$196.7 bn
$115.6 bn
$258.3 bn$230.9 bn
0%
10%
20%
30%
40%
Equity Hedge Event Driven Macro Relative Value
% o
f A
UM
Main Strategy by AUM
Women-owned Minority-owned All Funds
35 funds38 funds
12 funds
69 funds
52 funds
20 funds
1,363 funds
1,035 funds
186 funds
0%
15%
30%
45%
60%
North America Global Other Focus
% o
f F
un
ds
Geographic Focus by Fund Count
Women-owned Minority-owned All Funds
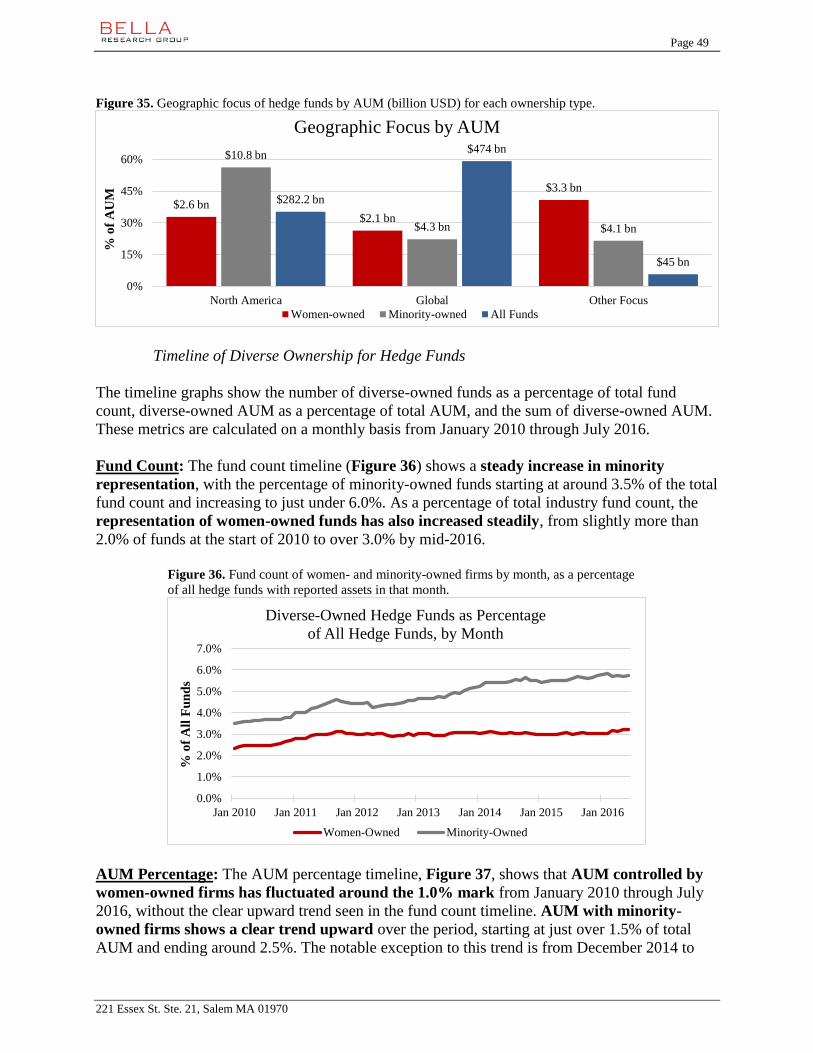
Page 49
221 Essex St. Ste. 21, Salem MA 01970
Figure 35. Geographic focus of hedge funds by AUM (billion USD) for each ownership type.
Timeline of Diverse Ownership for Hedge Funds
The timeline graphs show the number of diverse-owned funds as a percentage of total fund
count, diverse-owned AUM as a percentage of total AUM, and the sum of diverse-owned AUM.
These metrics are calculated on a monthly basis from January 2010 through July 2016.
Fund Count: The fund count timeline (Figure 36) shows a steady increase in minority
representation, with the percentage of minority-owned funds starting at around 3.5% of the total
fund count and increasing to just under 6.0%. As a percentage of total industry fund count, the
representation of women-owned funds has also increased steadily, from slightly more than
2.0% of funds at the start of 2010 to over 3.0% by mid-2016.
Figure 36. Fund count of women- and minority-owned firms by month, as a percentage
of all hedge funds with reported assets in that month.
AUM Percentage: The AUM percentage timeline, Figure 37, shows that AUM controlled by
women-owned firms has fluctuated around the 1.0% mark from January 2010 through July
2016, without the clear upward trend seen in the fund count timeline. AUM with minority-
owned firms shows a clear trend upward over the period, starting at just over 1.5% of total
AUM and ending around 2.5%. The notable exception to this trend is from December 2014 to
$2.6 bn
$2.1 bn
$3.3 bn
$10.8 bn
$4.3 bn $4.1 bn
$282.2 bn
$474 bn
$45 bn
0%
15%
30%
45%
60%
North America Global Other Focus
% o
f A
UM
Geographic Focus by AUM
Women-owned Minority-owned All Funds
0.0%
1.0%
2.0%
3.0%
4.0%
5.0%
6.0%
7.0%
Jan 2010 Jan 2011 Jan 2012 Jan 2013 Jan 2014 Jan 2015 Jan 2016
% o
f A
ll F
un
ds
Diverse-Owned Hedge Funds as Percentage
of All Hedge Funds, by Month
Women-Owned Minority-Owned
Page 50
221 Essex St. Ste. 21, Salem MA 01970
January 2015, where there is a drop in the amount of AUM controlled by minority-owned firms.
This sharp downturn is due in large part to the exit of one big firm.
Figure 37. Amount of AUM managed by women- and minority-owned firms by month,
as a percentage of all hedge funds with reported assets in that month.
Total AUM: The same phenomenon is seen in Figure 38, which shows the sum of AUM
managed by women- and minority-owned firms. This figure tracks very closely to the AUM
percentage timeline, including the drop in minority AUM from December 2014 to January 2015.
The analysis of AUM over time relies on monthly assets data that has imperfect coverage.
Therefore, the timeline should be considered indicative of overall trends in the hedge fund
industry rather than representative of the true level of diversity at any individual point in time.
Figure 38. Timeline of diverse hedge fund AUM.
0.0%
0.5%
1.0%
1.5%
2.0%
2.5%
3.0%
Jan 2010 Jan 2011 Jan 2012 Jan 2013 Jan 2014 Jan 2015 Jan 2016
% o
f T
ota
l A
UM
Diverse-Owned AUM as Percentage
of Total AUM, by Month
Women-Owned Minority-Owned
$0.0
$5.0
$10.0
$15.0
$20.0
$25.0
Jan 2010 Jan 2011 Jan 2012 Jan 2013 Jan 2014 Jan 2015 Jan 2016
AU
M (
bn
US
D)
Diverse-Owned AUM, by Month
Women Minority
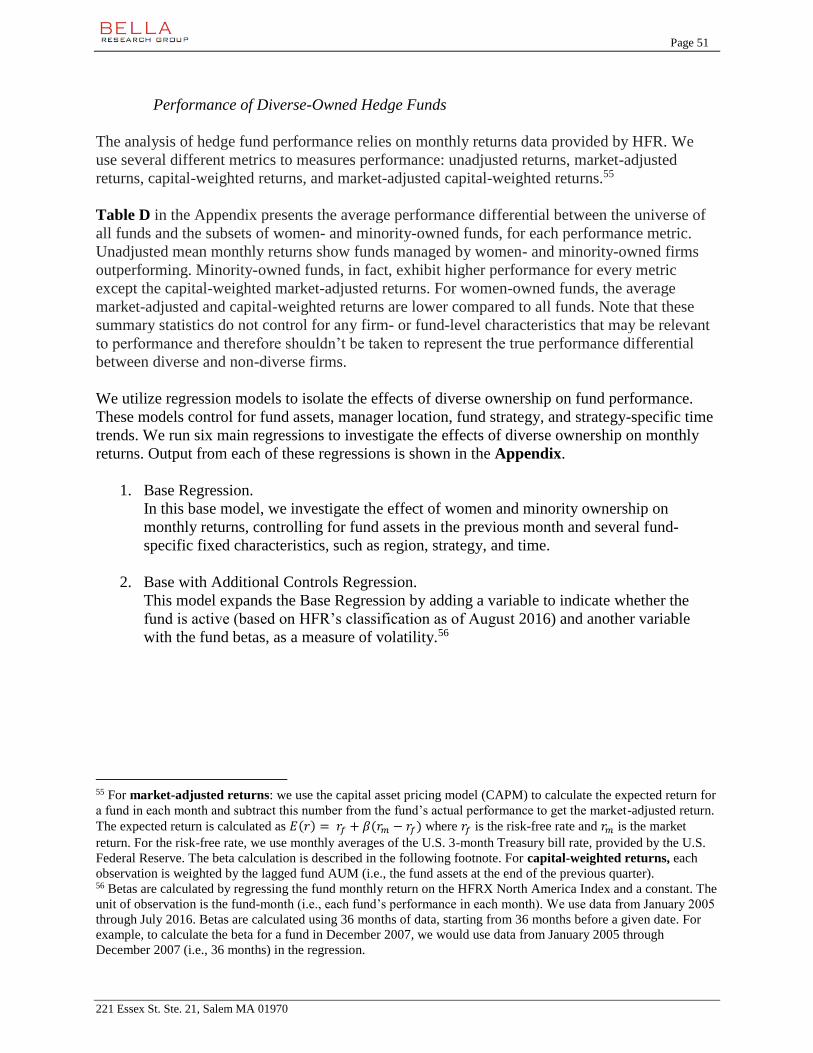
Page 51
221 Essex St. Ste. 21, Salem MA 01970
Performance of Diverse-Owned Hedge Funds
The analysis of hedge fund performance relies on monthly returns data provided by HFR. We
use several different metrics to measures performance: unadjusted returns, market-adjusted
returns, capital-weighted returns, and market-adjusted capital-weighted returns.55
Table D in the Appendix presents the average performance differential between the universe of
all funds and the subsets of women- and minority-owned funds, for each performance metric.
Unadjusted mean monthly returns show funds managed by women- and minority-owned firms
outperforming. Minority-owned funds, in fact, exhibit higher performance for every metric
except the capital-weighted market-adjusted returns. For women-owned funds, the average
market-adjusted and capital-weighted returns are lower compared to all funds. Note that these
summary statistics do not control for any firm- or fund-level characteristics that may be relevant
to performance and therefore shouldn’t be taken to represent the true performance differential
between diverse and non-diverse firms.
We utilize regression models to isolate the effects of diverse ownership on fund performance.
These models control for fund assets, manager location, fund strategy, and strategy-specific time
trends. We run six main regressions to investigate the effects of diverse ownership on monthly
returns. Output from each of these regressions is shown in the Appendix.
1. Base Regression.
In this base model, we investigate the effect of women and minority ownership on
monthly returns, controlling for fund assets in the previous month and several fund-
specific fixed characteristics, such as region, strategy, and time.
2. Base with Additional Controls Regression.
This model expands the Base Regression by adding a variable to indicate whether the
fund is active (based on HFR’s classification as of August 2016) and another variable
with the fund betas, as a measure of volatility.56
55 For market-adjusted returns: we use the capital asset pricing model (CAPM) to calculate the expected return for
a fund in each month and subtract this number from the fund’s actual performance to get the market-adjusted return.
The expected return is calculated as 𝐸(𝑟) = 𝑟𝑓 + 𝛽(𝑟𝑚 − 𝑟𝑓) where 𝑟𝑓 is the risk-free rate and 𝑟𝑚 is the market
return. For the risk-free rate, we use monthly averages of the U.S. 3-month Treasury bill rate, provided by the U.S.
Federal Reserve. The beta calculation is described in the following footnote. For capital-weighted returns, each
observation is weighted by the lagged fund AUM (i.e., the fund assets at the end of the previous quarter). 56 Betas are calculated by regressing the fund monthly return on the HFRX North America Index and a constant. The
unit of observation is the fund-month (i.e., each fund’s performance in each month). We use data from January 2005
through July 2016. Betas are calculated using 36 months of data, starting from 36 months before a given date. For
example, to calculate the beta for a fund in December 2007, we would use data from January 2005 through
December 2007 (i.e., 36 months) in the regression.
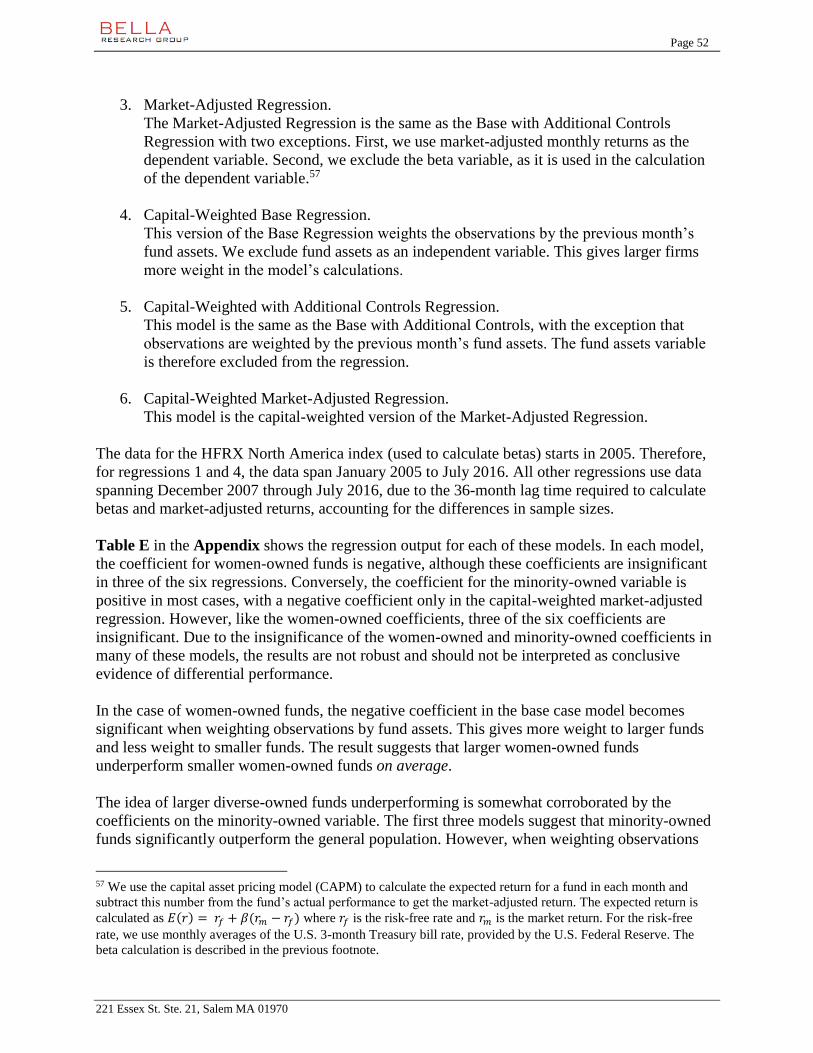
Page 52
221 Essex St. Ste. 21, Salem MA 01970
3. Market-Adjusted Regression.
The Market-Adjusted Regression is the same as the Base with Additional Controls
Regression with two exceptions. First, we use market-adjusted monthly returns as the
dependent variable. Second, we exclude the beta variable, as it is used in the calculation
of the dependent variable.57
4. Capital-Weighted Base Regression.
This version of the Base Regression weights the observations by the previous month’s
fund assets. We exclude fund assets as an independent variable. This gives larger firms
more weight in the model’s calculations.
5. Capital-Weighted with Additional Controls Regression.
This model is the same as the Base with Additional Controls, with the exception that
observations are weighted by the previous month’s fund assets. The fund assets variable
is therefore excluded from the regression.
6. Capital-Weighted Market-Adjusted Regression.
This model is the capital-weighted version of the Market-Adjusted Regression.
The data for the HFRX North America index (used to calculate betas) starts in 2005. Therefore,
for regressions 1 and 4, the data span January 2005 to July 2016. All other regressions use data
spanning December 2007 through July 2016, due to the 36-month lag time required to calculate
betas and market-adjusted returns, accounting for the differences in sample sizes.
Table E in the Appendix shows the regression output for each of these models. In each model,
the coefficient for women-owned funds is negative, although these coefficients are insignificant
in three of the six regressions. Conversely, the coefficient for the minority-owned variable is
positive in most cases, with a negative coefficient only in the capital-weighted market-adjusted
regression. However, like the women-owned coefficients, three of the six coefficients are
insignificant. Due to the insignificance of the women-owned and minority-owned coefficients in
many of these models, the results are not robust and should not be interpreted as conclusive
evidence of differential performance.
In the case of women-owned funds, the negative coefficient in the base case model becomes
significant when weighting observations by fund assets. This gives more weight to larger funds
and less weight to smaller funds. The result suggests that larger women-owned funds
underperform smaller women-owned funds on average.
The idea of larger diverse-owned funds underperforming is somewhat corroborated by the
coefficients on the minority-owned variable. The first three models suggest that minority-owned
funds significantly outperform the general population. However, when weighting observations
57 We use the capital asset pricing model (CAPM) to calculate the expected return for a fund in each month and
subtract this number from the fund’s actual performance to get the market-adjusted return. The expected return is
calculated as 𝐸(𝑟) = 𝑟𝑓 + 𝛽(𝑟𝑚 − 𝑟𝑓) where 𝑟𝑓 is the risk-free rate and 𝑟𝑚 is the market return. For the risk-free
rate, we use monthly averages of the U.S. 3-month Treasury bill rate, provided by the U.S. Federal Reserve. The
beta calculation is described in the previous footnote.
Page 53
221 Essex St. Ste. 21, Salem MA 01970
by fund assets, each of these coefficients loses significance. Since larger funds are weighted
more heavily in the capital-weighted regressions, this suggests that the larger minority-owned
funds perform worse than smaller minority-owned funds on average.
The larger takeaway from this exercise is the lack of robustness of results for the relative
performance of diverse-owned hedge funds. While some models suggest that these hedge funds
outperform or underperform compared to funds in the general population, others return
insignificant results. Furthermore, the relative performance changes based on how performance
is measured. Because the results are not robust to changes in the model specification, we cannot
conclude that there is a significant difference in performance between funds managed by
women- or minority-owned firms and non-diverse funds.
As a robustness check and for ease of comparison across asset classes, we run the same set of
regressions using data exclusively from January 2011 through July 2016. This is the same time
period used for the hedge funds timeline and for the performance analysis of mutual funds.
Output for this robustness check is presented in Table F in the Appendix. While there is some
change in the coefficients, the results are qualitatively similar. In fact, fewer of the coefficients
for the diverse-ownership variables are significant, providing more support for our conclusion
that the performance of diverse-owned hedge funds is not different from the performance of non-
diverse-owned hedge funds.
To augment this analysis of the average performance of hedge funds, we also investigate to what
extent diverse-owned hedge funds obtain top-quartile returns. While there is some debate about
whether hedge fund managers display persistence or skill in performance, it is nonetheless
important to choose top funds in order to obtain outsized returns. We investigate the distribution
of returns over time and find that it is possible to obtain top-quartile returns by investing with
diverse-owned hedge funds. Table I shows the results of this analysis, which investigates the
average representation of women- and minority-owned hedge funds in the top performance
quartile over time. We find that 24% of women-owned hedge funds and 28% of minority-owned
hedge funds exhibit top-quartile returns during the period of January 2005 through July 2016.
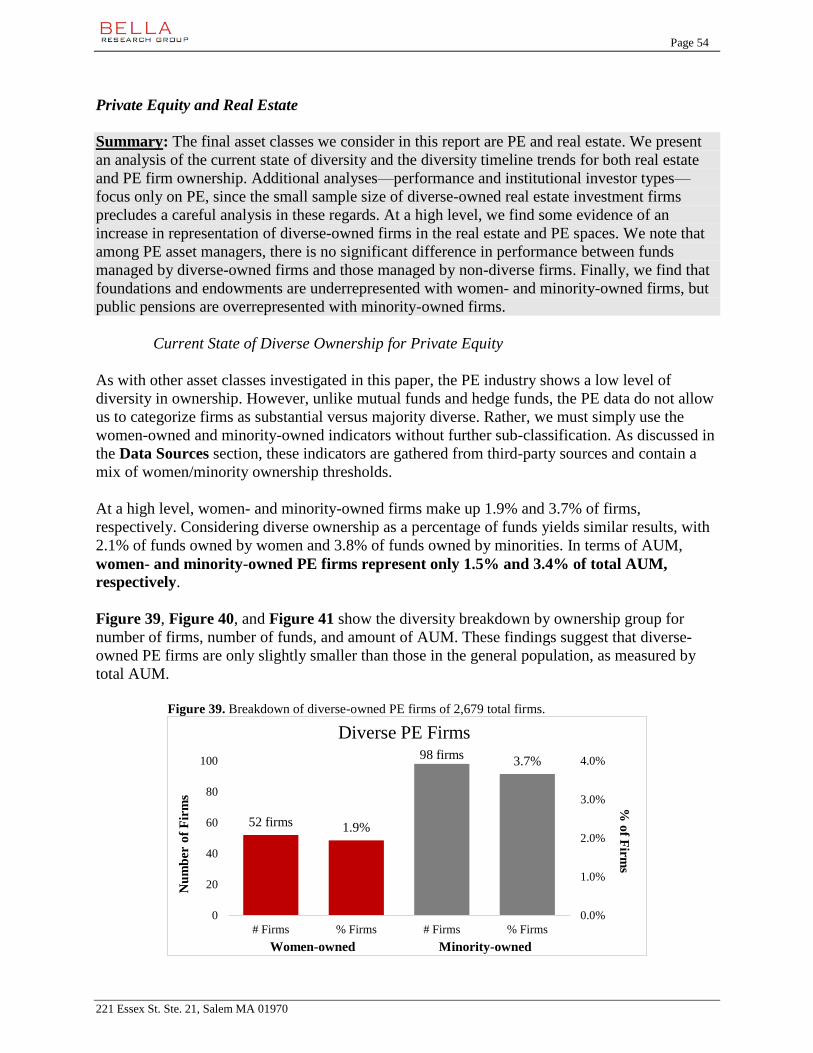
Page 54
221 Essex St. Ste. 21, Salem MA 01970
Private Equity and Real Estate
Summary: The final asset classes we consider in this report are PE and real estate. We present
an analysis of the current state of diversity and the diversity timeline trends for both real estate
and PE firm ownership. Additional analyses––performance and institutional investor types—
focus only on PE, since the small sample size of diverse-owned real estate investment firms
precludes a careful analysis in these regards. At a high level, we find some evidence of an
increase in representation of diverse-owned firms in the real estate and PE spaces. We note that
among PE asset managers, there is no significant difference in performance between funds
managed by diverse-owned firms and those managed by non-diverse firms. Finally, we find that
foundations and endowments are underrepresented with women- and minority-owned firms, but
public pensions are overrepresented with minority-owned firms.
Current State of Diverse Ownership for Private Equity
As with other asset classes investigated in this paper, the PE industry shows a low level of
diversity in ownership. However, unlike mutual funds and hedge funds, the PE data do not allow
us to categorize firms as substantial versus majority diverse. Rather, we must simply use the
women-owned and minority-owned indicators without further sub-classification. As discussed in
the Data Sources section, these indicators are gathered from third-party sources and contain a
mix of women/minority ownership thresholds.
At a high level, women- and minority-owned firms make up 1.9% and 3.7% of firms,
respectively. Considering diverse ownership as a percentage of funds yields similar results, with
2.1% of funds owned by women and 3.8% of funds owned by minorities. In terms of AUM,
women- and minority-owned PE firms represent only 1.5% and 3.4% of total AUM,
respectively.
Figure 39, Figure 40, and Figure 41 show the diversity breakdown by ownership group for
number of firms, number of funds, and amount of AUM. These findings suggest that diverse-
owned PE firms are only slightly smaller than those in the general population, as measured by
total AUM.
Figure 39. Breakdown of diverse-owned PE firms of 2,679 total firms.
52 firms
98 firms
1.9%
3.7%
0.0%
1.0%
2.0%
3.0%
4.0%
0
20
40
60
80
100
# Firms % Firms # Firms % Firms
% o
f Firm
sN
um
ber
of
Fir
ms
Women-owned Minority-owned
Diverse PE Firms
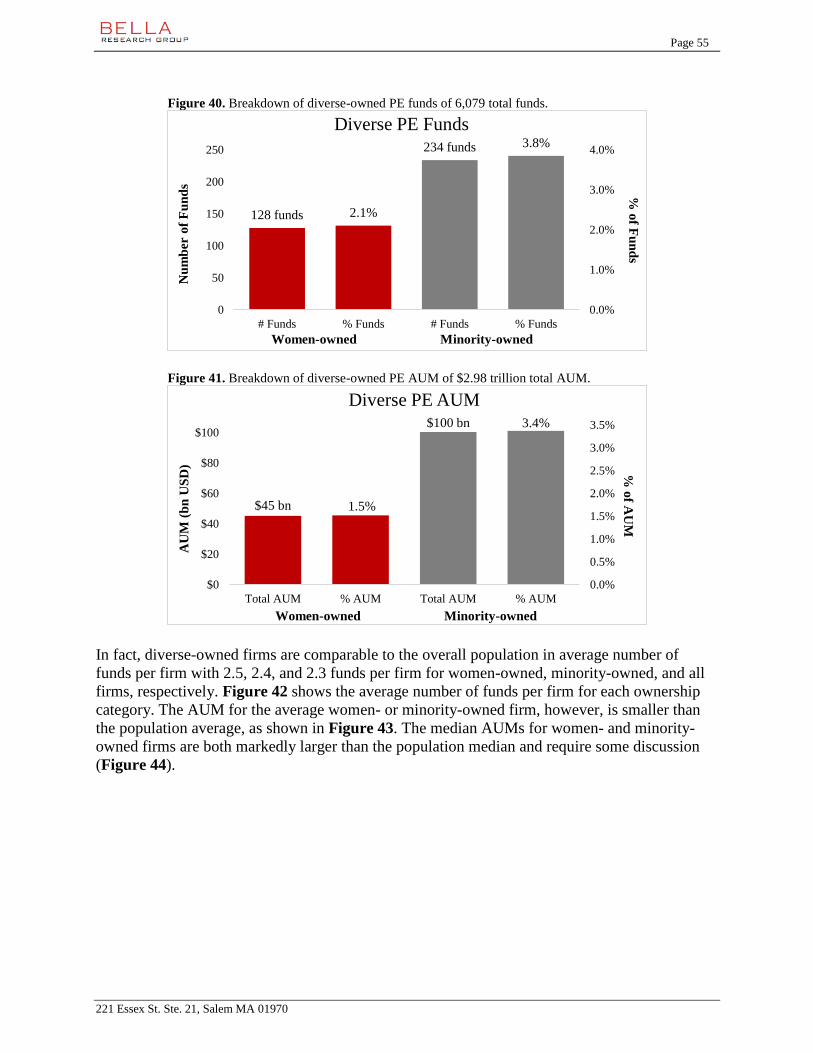
Page 55
221 Essex St. Ste. 21, Salem MA 01970
Figure 40. Breakdown of diverse-owned PE funds of 6,079 total funds.
Figure 41. Breakdown of diverse-owned PE AUM of $2.98 trillion total AUM.
In fact, diverse-owned firms are comparable to the overall population in average number of
funds per firm with 2.5, 2.4, and 2.3 funds per firm for women-owned, minority-owned, and all
firms, respectively. Figure 42 shows the average number of funds per firm for each ownership
category. The AUM for the average women- or minority-owned firm, however, is smaller than
the population average, as shown in Figure 43. The median AUMs for women- and minority-
owned firms are both markedly larger than the population median and require some discussion
(Figure 44).
128 funds
234 funds
2.1%
3.8%
0.0%
1.0%
2.0%
3.0%
4.0%
0
50
100
150
200
250
# Funds % Funds # Funds % Funds
% o
f Fu
nd
sN
um
ber
of
Fu
nd
s
Women-owned Minority-owned
Diverse PE Funds
$45 bn
$100 bn
1.5%
3.4%
0.0%
0.5%
1.0%
1.5%
2.0%
2.5%
3.0%
3.5%
$0
$20
$40
$60
$80
$100
Total AUM % AUM Total AUM % AUM
% o
f AU
MA
UM
(b
n U
SD
)
Women-owned Minority-owned
Diverse PE AUM

Page 56
221 Essex St. Ste. 21, Salem MA 01970
Figure 42. Average number of PE funds per firm, by ownership type.
Figure 43. Average PE AUM by ownership type (million USD).
Figure 44. Median PE AUM by ownership type (million USD).
2.5 funds 2.4 funds2.3 funds
0.0
0.5
1.0
1.5
2.0
2.5
Women-owned Minority-owned All Firms
Nu
mb
er o
f F
un
ds
Average Number of Funds Per PE Firm
$869 mn
$1,024 mn$1,112 mn
$0
$250
$500
$750
$1,000
$1,250
Women-owned Minority-owned All Firms
AU
M (
mn
US
D)
Average PE AUM by Ownership Type
$336 mn$310 mn
$158 mn
$0
$50
$100
$150
$200
$250
$300
$350
Women-owned Minority-owned All Firms
AU
M (
mn
US
D)
Median PE AUM by Ownership Type
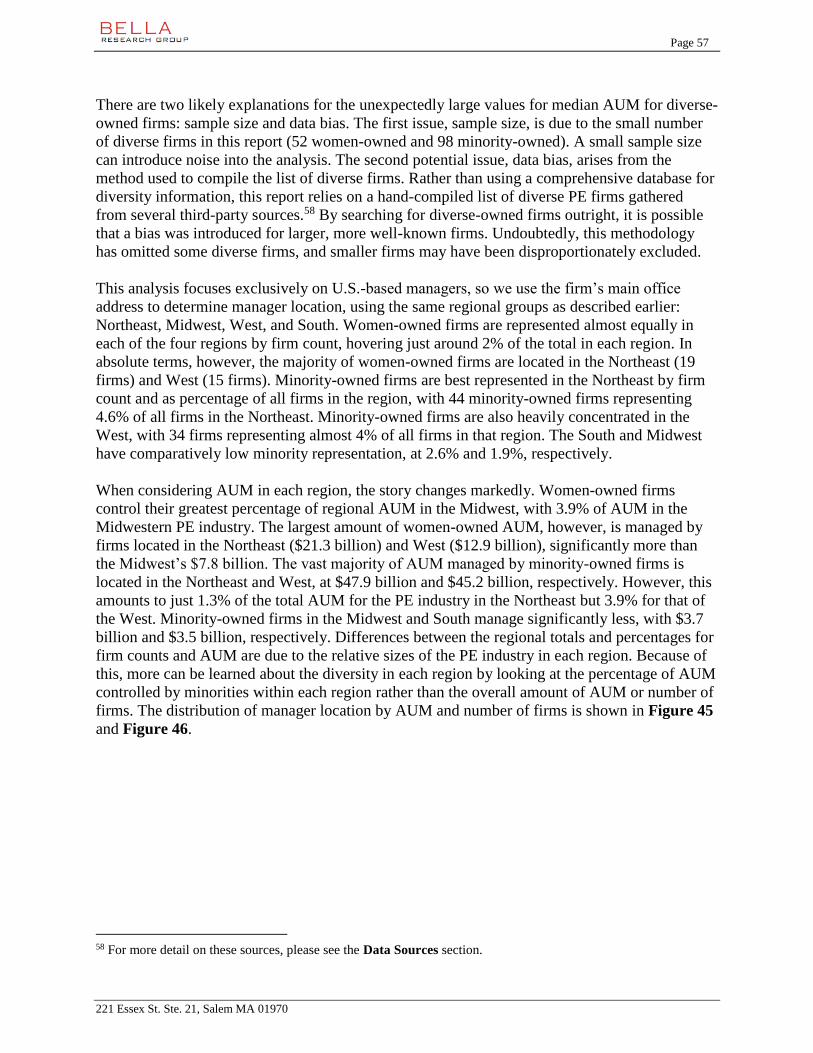
Page 57
221 Essex St. Ste. 21, Salem MA 01970
There are two likely explanations for the unexpectedly large values for median AUM for diverse-
owned firms: sample size and data bias. The first issue, sample size, is due to the small number
of diverse firms in this report (52 women-owned and 98 minority-owned). A small sample size
can introduce noise into the analysis. The second potential issue, data bias, arises from the
method used to compile the list of diverse firms. Rather than using a comprehensive database for
diversity information, this report relies on a hand-compiled list of diverse PE firms gathered
from several third-party sources.58 By searching for diverse-owned firms outright, it is possible
that a bias was introduced for larger, more well-known firms. Undoubtedly, this methodology
has omitted some diverse firms, and smaller firms may have been disproportionately excluded.
This analysis focuses exclusively on U.S.-based managers, so we use the firm’s main office
address to determine manager location, using the same regional groups as described earlier:
Northeast, Midwest, West, and South. Women-owned firms are represented almost equally in
each of the four regions by firm count, hovering just around 2% of the total in each region. In
absolute terms, however, the majority of women-owned firms are located in the Northeast (19
firms) and West (15 firms). Minority-owned firms are best represented in the Northeast by firm
count and as percentage of all firms in the region, with 44 minority-owned firms representing
4.6% of all firms in the Northeast. Minority-owned firms are also heavily concentrated in the
West, with 34 firms representing almost 4% of all firms in that region. The South and Midwest
have comparatively low minority representation, at 2.6% and 1.9%, respectively.
When considering AUM in each region, the story changes markedly. Women-owned firms
control their greatest percentage of regional AUM in the Midwest, with 3.9% of AUM in the
Midwestern PE industry. The largest amount of women-owned AUM, however, is managed by
firms located in the Northeast ($21.3 billion) and West ($12.9 billion), significantly more than
the Midwest’s $7.8 billion. The vast majority of AUM managed by minority-owned firms is
located in the Northeast and West, at $47.9 billion and $45.2 billion, respectively. However, this
amounts to just 1.3% of the total AUM for the PE industry in the Northeast but 3.9% for that of
the West. Minority-owned firms in the Midwest and South manage significantly less, with $3.7
billion and $3.5 billion, respectively. Differences between the regional totals and percentages for
firm counts and AUM are due to the relative sizes of the PE industry in each region. Because of
this, more can be learned about the diversity in each region by looking at the percentage of AUM
controlled by minorities within each region rather than the overall amount of AUM or number of
firms. The distribution of manager location by AUM and number of firms is shown in Figure 45
and Figure 46.
58 For more detail on these sources, please see the Data Sources section.
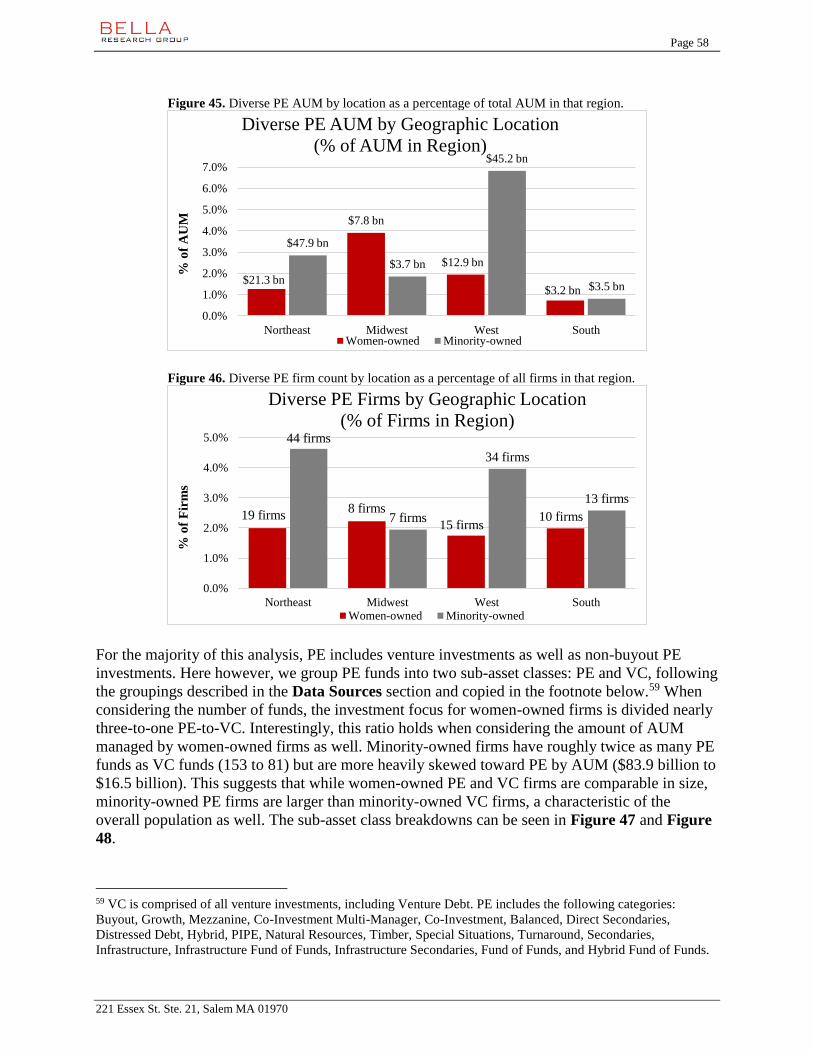
Page 58
221 Essex St. Ste. 21, Salem MA 01970
Figure 45. Diverse PE AUM by location as a percentage of total AUM in that region.
Figure 46. Diverse PE firm count by location as a percentage of all firms in that region.
For the majority of this analysis, PE includes venture investments as well as non-buyout PE
investments. Here however, we group PE funds into two sub-asset classes: PE and VC, following
the groupings described in the Data Sources section and copied in the footnote below.59 When
considering the number of funds, the investment focus for women-owned firms is divided nearly
three-to-one PE-to-VC. Interestingly, this ratio holds when considering the amount of AUM
managed by women-owned firms as well. Minority-owned firms have roughly twice as many PE
funds as VC funds (153 to 81) but are more heavily skewed toward PE by AUM ($83.9 billion to
$16.5 billion). This suggests that while women-owned PE and VC firms are comparable in size,
minority-owned PE firms are larger than minority-owned VC firms, a characteristic of the
overall population as well. The sub-asset class breakdowns can be seen in Figure 47 and Figure
48.
59 VC is comprised of all venture investments, including Venture Debt. PE includes the following categories:
Buyout, Growth, Mezzanine, Co-Investment Multi-Manager, Co-Investment, Balanced, Direct Secondaries,
Distressed Debt, Hybrid, PIPE, Natural Resources, Timber, Special Situations, Turnaround, Secondaries,
Infrastructure, Infrastructure Fund of Funds, Infrastructure Secondaries, Fund of Funds, and Hybrid Fund of Funds.
$21.3 bn
$7.8 bn
$12.9 bn
$3.2 bn
$47.9 bn
$3.7 bn
$45.2 bn
$3.5 bn
0.0%
1.0%
2.0%
3.0%
4.0%
5.0%
6.0%
7.0%
Northeast Midwest West South
% o
f A
UM
Diverse PE AUM by Geographic Location
(% of AUM in Region)
Women-owned Minority-owned
19 firms8 firms
15 firms10 firms
44 firms
7 firms
34 firms
13 firms
0.0%
1.0%
2.0%
3.0%
4.0%
5.0%
Northeast Midwest West South
% o
f F
irm
s
Diverse PE Firms by Geographic Location
(% of Firms in Region)
Women-owned Minority-owned

Page 59
221 Essex St. Ste. 21, Salem MA 01970
Figure 47. Main fund strategy by number of PE funds for each ownership type.
Figure 48. Main PE fund strategy by AUM for each ownership type (billion USD).
Finally, we look at the geographic investment focus across PE firms, shown in Figure 49 and
Figure 50. The overwhelming majority of funds in our database, both diverse and non-diverse,
have a U.S. investment focus (again, this is not surprising given that we restrict the sample to
U.S.-based funds). There are only four women-owned funds with an investment focus outside the
U.S., representing $0.8 billion of the $44.4 billion AUM managed by women-owned firms in our
database. Minority-owned funds tell a similar story: all but 16 of the 234 minority-owned funds
focus on the U.S., which amounts to just $2.3 billion in funds with non-U.S. investment focuses.
The geographic distributions of diverse-owned funds are very similar to those of the overall
population, in which 91% of funds, representing 89% of AUM, have a U.S. investment focus.
These metrics are perhaps not surprising, given that this analysis looks exclusively at U.S.-based
firms. Nevertheless, it is worth highlighting that diverse-owned firms are more focused on
domestic investments than firms in the overall population.
95 funds
33 funds
153 funds
81 funds
3,445 funds
2,634 funds
0%
20%
40%
60%
80%
Private Equity Venture Capital
% o
f F
un
ds
Sub-Asset Class (% of Funds in Ownership Type)
Women-owned Minority-owned All Funds
$33.6 bn
$11.6 bn
$83.9 bn
$16.5 bn
$2,587.6 bn
$390.4 bn
0%
20%
40%
60%
80%
100%
Private Equity Venture Capital
% o
f A
UM
Sub-Asset Class (% of AUM in Ownership Type)
Women-owned Minority-owned All Funds
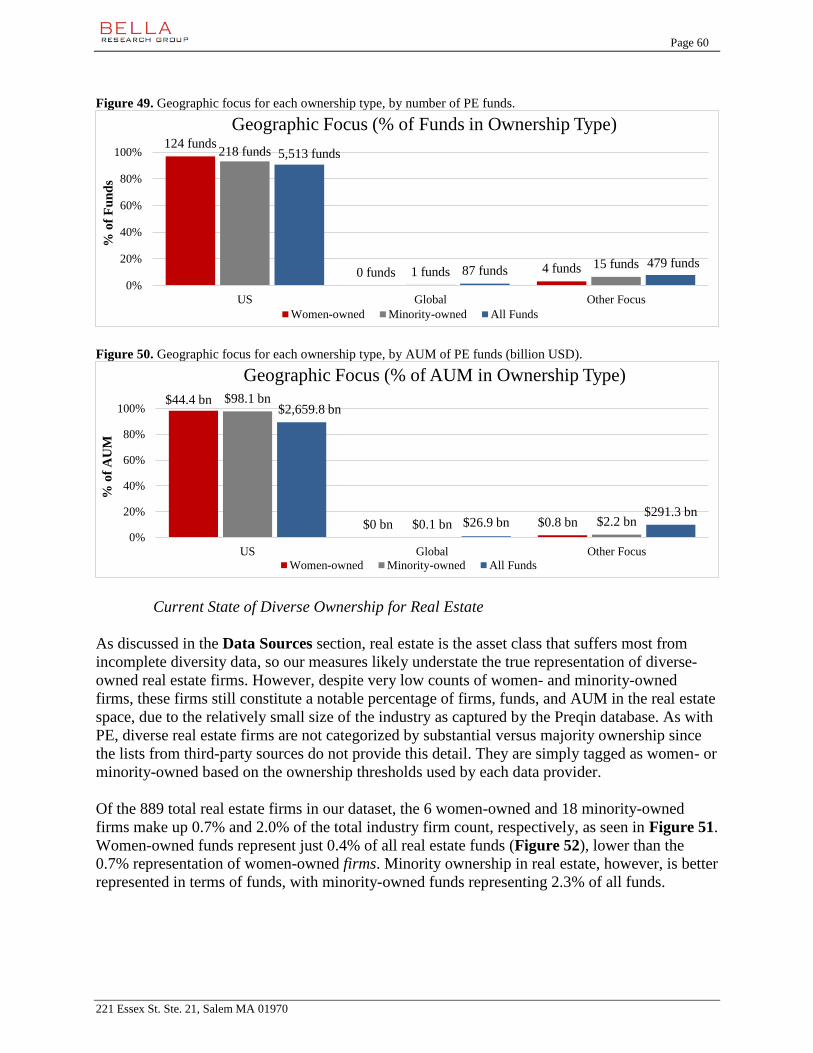
Page 60
221 Essex St. Ste. 21, Salem MA 01970
Figure 49. Geographic focus for each ownership type, by number of PE funds.
Figure 50. Geographic focus for each ownership type, by AUM of PE funds (billion USD).
Current State of Diverse Ownership for Real Estate
As discussed in the Data Sources section, real estate is the asset class that suffers most from
incomplete diversity data, so our measures likely understate the true representation of diverse-
owned real estate firms. However, despite very low counts of women- and minority-owned
firms, these firms still constitute a notable percentage of firms, funds, and AUM in the real estate
space, due to the relatively small size of the industry as captured by the Preqin database. As with
PE, diverse real estate firms are not categorized by substantial versus majority ownership since
the lists from third-party sources do not provide this detail. They are simply tagged as women- or
minority-owned based on the ownership thresholds used by each data provider.
Of the 889 total real estate firms in our dataset, the 6 women-owned and 18 minority-owned
firms make up 0.7% and 2.0% of the total industry firm count, respectively, as seen in Figure 51.
Women-owned funds represent just 0.4% of all real estate funds (Figure 52), lower than the
0.7% representation of women-owned firms. Minority ownership in real estate, however, is better
represented in terms of funds, with minority-owned funds representing 2.3% of all funds.
124 funds
0 funds 4 funds
218 funds
1 funds15 funds
5,513 funds
87 funds479 funds
0%
20%
40%
60%
80%
100%
US Global Other Focus
% o
f F
un
ds
Geographic Focus (% of Funds in Ownership Type)
Women-owned Minority-owned All Funds
$44.4 bn
$0 bn $0.8 bn
$98.1 bn
$0.1 bn $2.2 bn
$2,659.8 bn
$26.9 bn$291.3 bn
0%
20%
40%
60%
80%
100%
US Global Other Focus
% o
f A
UM
Geographic Focus (% of AUM in Ownership Type)
Women-owned Minority-owned All Funds
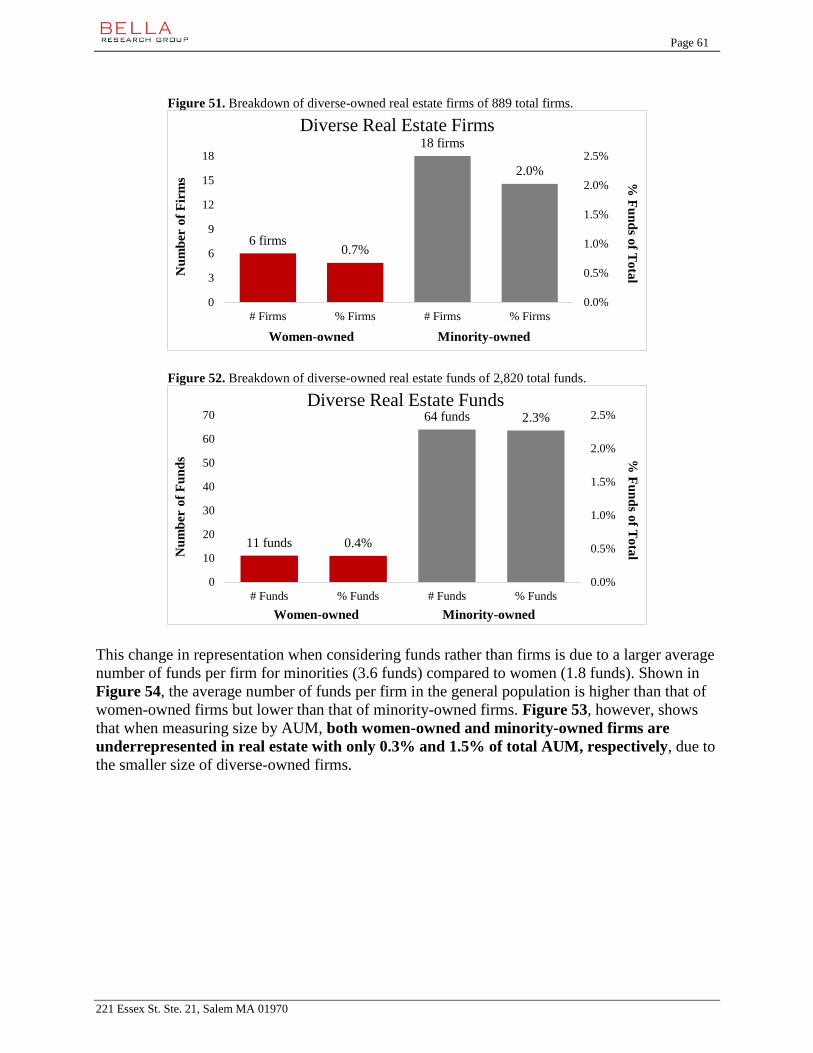
Page 61
221 Essex St. Ste. 21, Salem MA 01970
Figure 51. Breakdown of diverse-owned real estate firms of 889 total firms.
Figure 52. Breakdown of diverse-owned real estate funds of 2,820 total funds.
This change in representation when considering funds rather than firms is due to a larger average
number of funds per firm for minorities (3.6 funds) compared to women (1.8 funds). Shown in
Figure 54, the average number of funds per firm in the general population is higher than that of
women-owned firms but lower than that of minority-owned firms. Figure 53, however, shows
that when measuring size by AUM, both women-owned and minority-owned firms are
underrepresented in real estate with only 0.3% and 1.5% of total AUM, respectively, due to
the smaller size of diverse-owned firms.
6 firms
18 firms
0.7%
2.0%
0.0%
0.5%
1.0%
1.5%
2.0%
2.5%
0
3
6
9
12
15
18
# Firms % Firms # Firms % Firms
% F
un
ds o
f To
talN
um
ber
of
Fir
ms
Women-owned Minority-owned
Diverse Real Estate Firms
11 funds
64 funds
0.4%
2.3%
0.0%
0.5%
1.0%
1.5%
2.0%
2.5%
0
10
20
30
40
50
60
70
# Funds % Funds # Funds % Funds
% F
un
ds o
f To
talN
um
ber
of
Fu
nd
s
Women-owned Minority-owned
Diverse Real Estate Funds
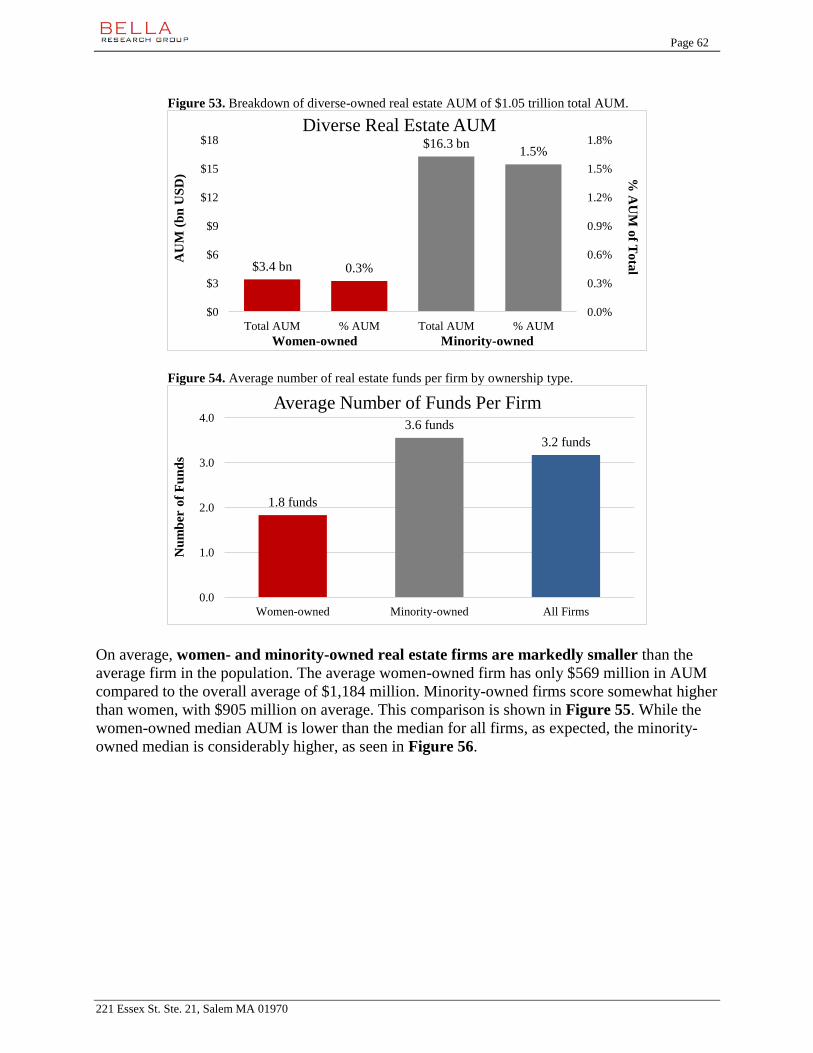
Page 62
221 Essex St. Ste. 21, Salem MA 01970
Figure 53. Breakdown of diverse-owned real estate AUM of $1.05 trillion total AUM.
Figure 54. Average number of real estate funds per firm by ownership type.
On average, women- and minority-owned real estate firms are markedly smaller than the
average firm in the population. The average women-owned firm has only $569 million in AUM
compared to the overall average of $1,184 million. Minority-owned firms score somewhat higher
than women, with $905 million on average. This comparison is shown in Figure 55. While the
women-owned median AUM is lower than the median for all firms, as expected, the minority-
owned median is considerably higher, as seen in Figure 56.
$3.4 bn
$16.3 bn
0.3%
1.5%
0.0%
0.3%
0.6%
0.9%
1.2%
1.5%
1.8%
$0
$3
$6
$9
$12
$15
$18
Total AUM % AUM Total AUM % AUM
% A
UM
of T
ota
lA
UM
(b
n U
SD
)
Women-owned Minority-owned
Diverse Real Estate AUM
1.8 funds
3.6 funds
3.2 funds
0.0
1.0
2.0
3.0
4.0
Women-owned Minority-owned All Firms
Nu
mb
er o
f F
un
ds
Average Number of Funds Per Firm
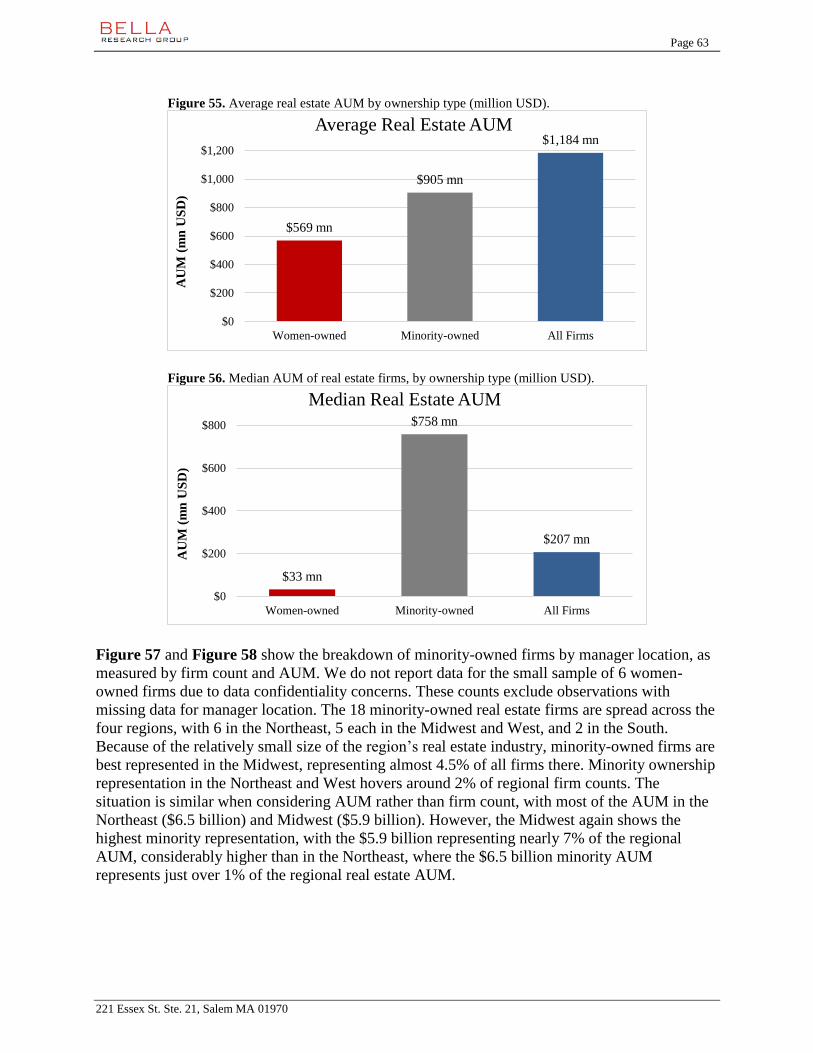
Page 63
221 Essex St. Ste. 21, Salem MA 01970
Figure 55. Average real estate AUM by ownership type (million USD).
Figure 56. Median AUM of real estate firms, by ownership type (million USD).
Figure 57 and Figure 58 show the breakdown of minority-owned firms by manager location, as
measured by firm count and AUM. We do not report data for the small sample of 6 women-
owned firms due to data confidentiality concerns. These counts exclude observations with
missing data for manager location. The 18 minority-owned real estate firms are spread across the
four regions, with 6 in the Northeast, 5 each in the Midwest and West, and 2 in the South.
Because of the relatively small size of the region’s real estate industry, minority-owned firms are
best represented in the Midwest, representing almost 4.5% of all firms there. Minority ownership
representation in the Northeast and West hovers around 2% of regional firm counts. The
situation is similar when considering AUM rather than firm count, with most of the AUM in the
Northeast ($6.5 billion) and Midwest ($5.9 billion). However, the Midwest again shows the
highest minority representation, with the $5.9 billion representing nearly 7% of the regional
AUM, considerably higher than in the Northeast, where the $6.5 billion minority AUM
represents just over 1% of the regional real estate AUM.
$569 mn
$905 mn
$1,184 mn
$0
$200
$400
$600
$800
$1,000
$1,200
Women-owned Minority-owned All Firms
AU
M (
mn
US
D)
Average Real Estate AUM
$33 mn
$758 mn
$207 mn
$0
$200
$400
$600
$800
Women-owned Minority-owned All Firms
AU
M (
mn
US
D)
Median Real Estate AUM
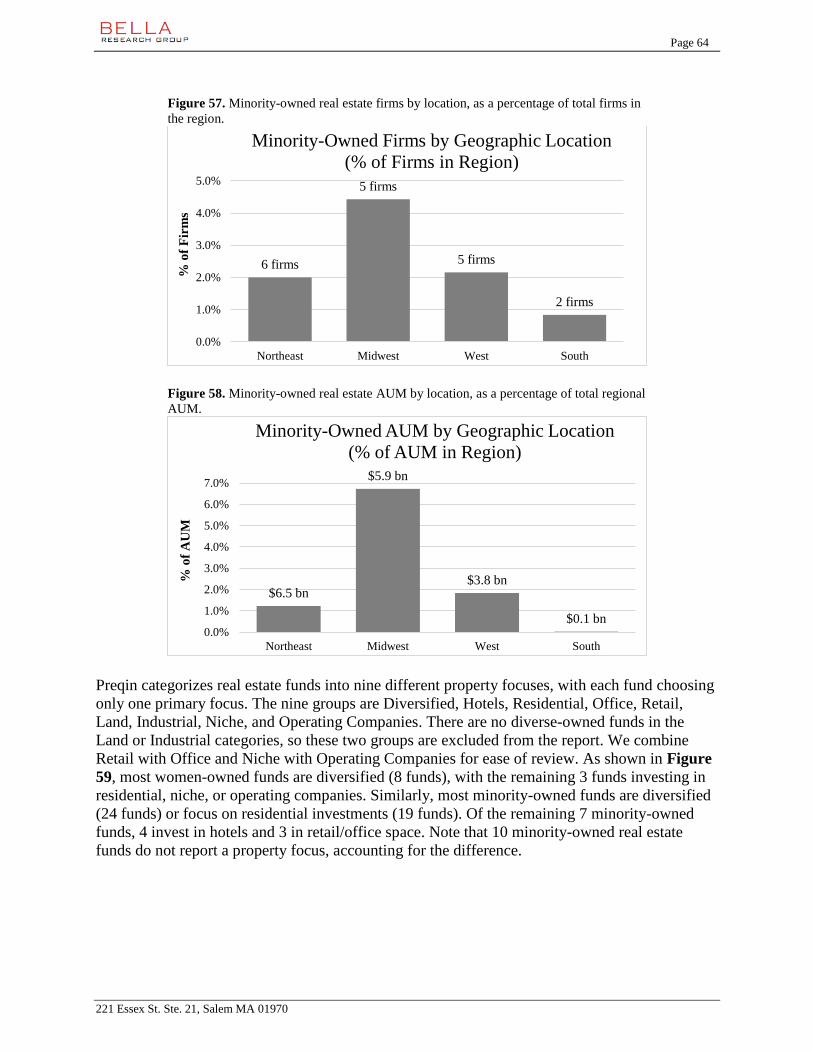
Page 64
221 Essex St. Ste. 21, Salem MA 01970
Figure 57. Minority-owned real estate firms by location, as a percentage of total firms in
the region.
Figure 58. Minority-owned real estate AUM by location, as a percentage of total regional
AUM.
Preqin categorizes real estate funds into nine different property focuses, with each fund choosing
only one primary focus. The nine groups are Diversified, Hotels, Residential, Office, Retail,
Land, Industrial, Niche, and Operating Companies. There are no diverse-owned funds in the
Land or Industrial categories, so these two groups are excluded from the report. We combine
Retail with Office and Niche with Operating Companies for ease of review. As shown in Figure
59, most women-owned funds are diversified (8 funds), with the remaining 3 funds investing in
residential, niche, or operating companies. Similarly, most minority-owned funds are diversified
(24 funds) or focus on residential investments (19 funds). Of the remaining 7 minority-owned
funds, 4 invest in hotels and 3 in retail/office space. Note that 10 minority-owned real estate
funds do not report a property focus, accounting for the difference.
6 firms
5 firms
5 firms
2 firms
0.0%
1.0%
2.0%
3.0%
4.0%
5.0%
Northeast Midwest West South
% o
f F
irm
s
Minority-Owned Firms by Geographic Location
(% of Firms in Region)
$6.5 bn
$5.9 bn
$3.8 bn
$0.1 bn0.0%
1.0%
2.0%
3.0%
4.0%
5.0%
6.0%
7.0%
Northeast Midwest West South
% o
f A
UM
Minority-Owned AUM by Geographic Location
(% of AUM in Region)
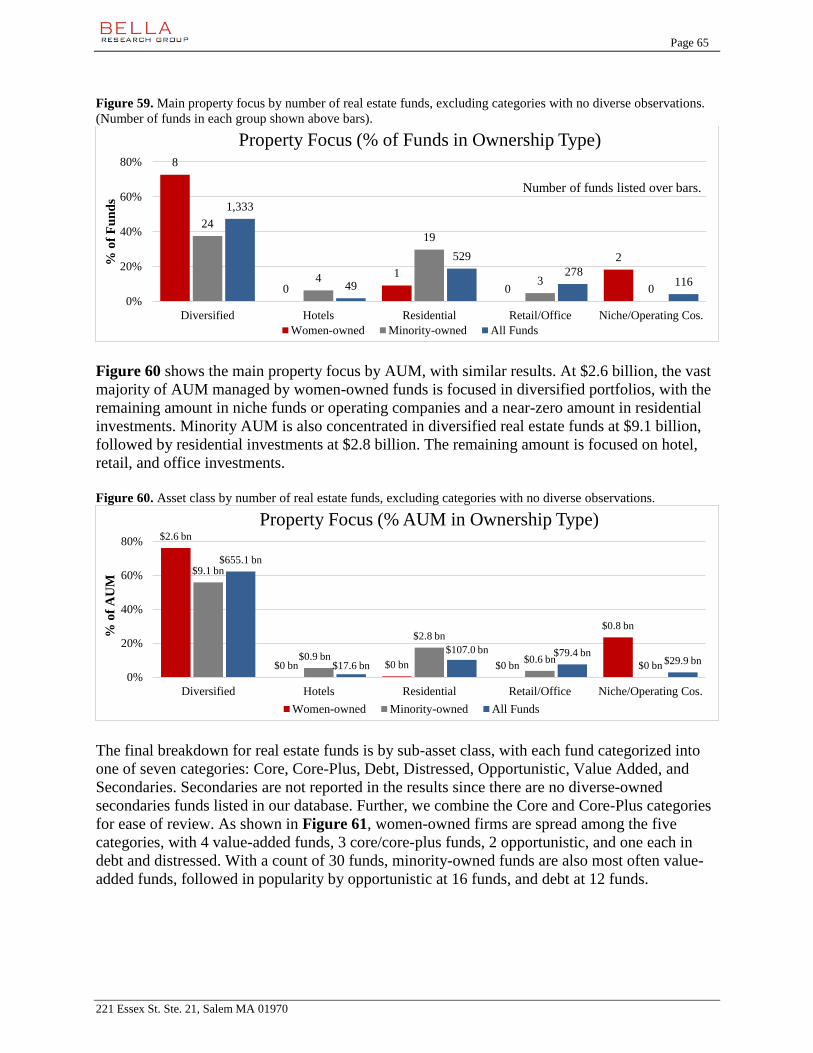
Page 65
221 Essex St. Ste. 21, Salem MA 01970
Figure 59. Main property focus by number of real estate funds, excluding categories with no diverse observations.
(Number of funds in each group shown above bars).
Figure 60 shows the main property focus by AUM, with similar results. At $2.6 billion, the vast
majority of AUM managed by women-owned funds is focused in diversified portfolios, with the
remaining amount in niche funds or operating companies and a near-zero amount in residential
investments. Minority AUM is also concentrated in diversified real estate funds at $9.1 billion,
followed by residential investments at $2.8 billion. The remaining amount is focused on hotel,
retail, and office investments.
Figure 60. Asset class by number of real estate funds, excluding categories with no diverse observations.
The final breakdown for real estate funds is by sub-asset class, with each fund categorized into
one of seven categories: Core, Core-Plus, Debt, Distressed, Opportunistic, Value Added, and
Secondaries. Secondaries are not reported in the results since there are no diverse-owned
secondaries funds listed in our database. Further, we combine the Core and Core-Plus categories
for ease of review. As shown in Figure 61, women-owned firms are spread among the five
categories, with 4 value-added funds, 3 core/core-plus funds, 2 opportunistic, and one each in
debt and distressed. With a count of 30 funds, minority-owned funds are also most often value-
added funds, followed in popularity by opportunistic at 16 funds, and debt at 12 funds.
8
0
1
0
2
24
4
19
30
1,333
49
529
278116
0%
20%
40%
60%
80%
Diversified Hotels Residential Retail/Office Niche/Operating Cos.
% o
f F
un
ds
Property Focus (% of Funds in Ownership Type)
Women-owned Minority-owned All Funds
Number of funds listed over bars.
$2.6 bn
$0 bn $0 bn $0 bn
$0.8 bn
$9.1 bn
$0.9 bn
$2.8 bn
$0.6 bn$0 bn
$655.1 bn
$17.6 bn
$107.0 bn $79.4 bn$29.9 bn
0%
20%
40%
60%
80%
Diversified Hotels Residential Retail/Office Niche/Operating Cos.
% o
f A
UM
Property Focus (% AUM in Ownership Type)
Women-owned Minority-owned All Funds
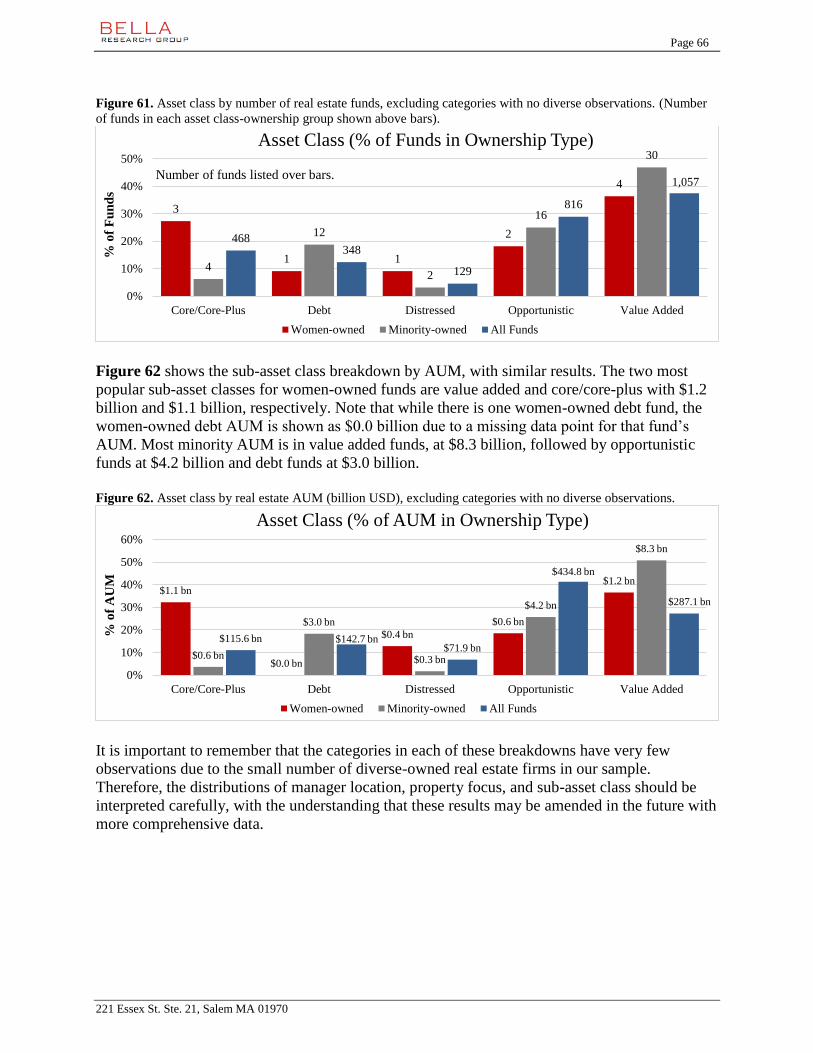
Page 66
221 Essex St. Ste. 21, Salem MA 01970
Figure 61. Asset class by number of real estate funds, excluding categories with no diverse observations. (Number
of funds in each asset class-ownership group shown above bars).
Figure 62 shows the sub-asset class breakdown by AUM, with similar results. The two most
popular sub-asset classes for women-owned funds are value added and core/core-plus with $1.2
billion and $1.1 billion, respectively. Note that while there is one women-owned debt fund, the
women-owned debt AUM is shown as $0.0 billion due to a missing data point for that fund’s
AUM. Most minority AUM is in value added funds, at $8.3 billion, followed by opportunistic
funds at $4.2 billion and debt funds at $3.0 billion.
Figure 62. Asset class by real estate AUM (billion USD), excluding categories with no diverse observations.
It is important to remember that the categories in each of these breakdowns have very few
observations due to the small number of diverse-owned real estate firms in our sample.
Therefore, the distributions of manager location, property focus, and sub-asset class should be
interpreted carefully, with the understanding that these results may be amended in the future with
more comprehensive data.
3
1 1
2
4
4
12
2
16
30
468348
129
816
1,057
0%
10%
20%
30%
40%
50%
Core/Core-Plus Debt Distressed Opportunistic Value Added
% o
f F
un
ds
Asset Class (% of Funds in Ownership Type)
Women-owned Minority-owned All Funds
Number of funds listed over bars.
$1.1 bn
$0.0 bn
$0.4 bn
$0.6 bn
$1.2 bn
$0.6 bn
$3.0 bn
$0.3 bn
$4.2 bn
$8.3 bn
$115.6 bn $142.7 bn$71.9 bn
$434.8 bn
$287.1 bn
0%
10%
20%
30%
40%
50%
60%
Core/Core-Plus Debt Distressed Opportunistic Value Added
% o
f A
UM
Asset Class (% of AUM in Ownership Type)
Women-owned Minority-owned All Funds
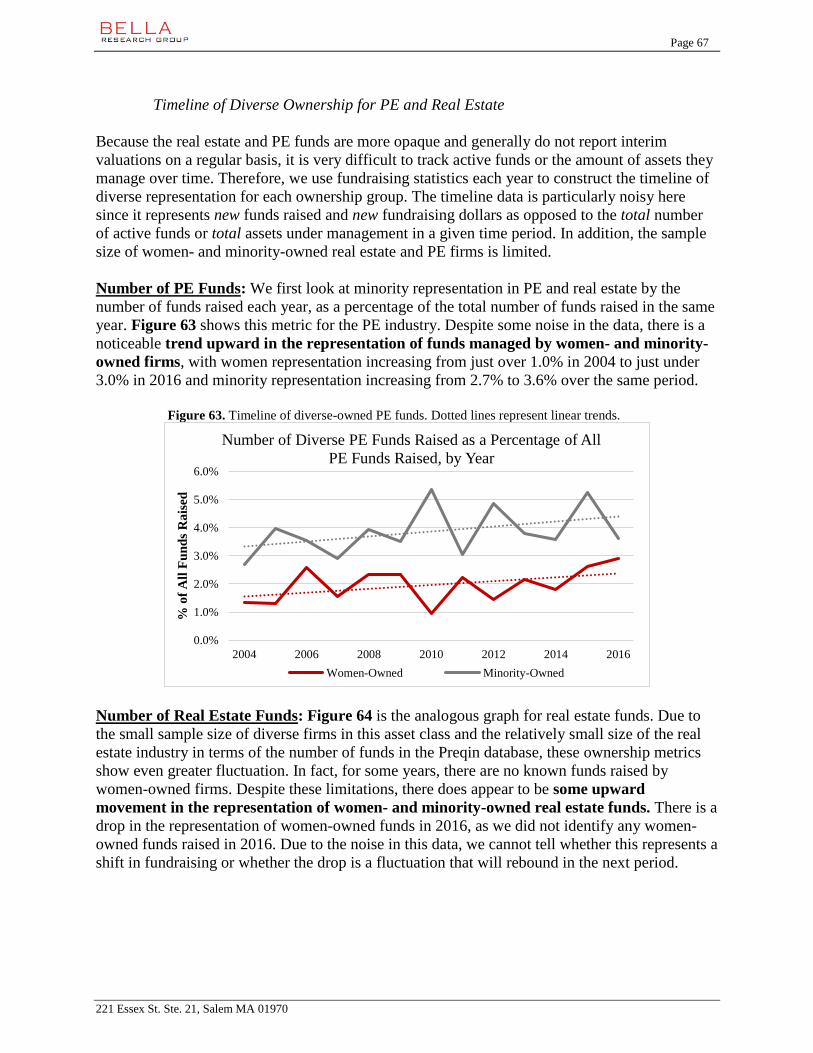
Page 67
221 Essex St. Ste. 21, Salem MA 01970
Timeline of Diverse Ownership for PE and Real Estate
Because the real estate and PE funds are more opaque and generally do not report interim
valuations on a regular basis, it is very difficult to track active funds or the amount of assets they
manage over time. Therefore, we use fundraising statistics each year to construct the timeline of
diverse representation for each ownership group. The timeline data is particularly noisy here
since it represents new funds raised and new fundraising dollars as opposed to the total number
of active funds or total assets under management in a given time period. In addition, the sample
size of women- and minority-owned real estate and PE firms is limited.
Number of PE Funds: We first look at minority representation in PE and real estate by the
number of funds raised each year, as a percentage of the total number of funds raised in the same
year. Figure 63 shows this metric for the PE industry. Despite some noise in the data, there is a
noticeable trend upward in the representation of funds managed by women- and minority-
owned firms, with women representation increasing from just over 1.0% in 2004 to just under
3.0% in 2016 and minority representation increasing from 2.7% to 3.6% over the same period.
Figure 63. Timeline of diverse-owned PE funds. Dotted lines represent linear trends.
Number of Real Estate Funds: Figure 64 is the analogous graph for real estate funds. Due to
the small sample size of diverse firms in this asset class and the relatively small size of the real
estate industry in terms of the number of funds in the Preqin database, these ownership metrics
show even greater fluctuation. In fact, for some years, there are no known funds raised by
women-owned firms. Despite these limitations, there does appear to be some upward
movement in the representation of women- and minority-owned real estate funds. There is a
drop in the representation of women-owned funds in 2016, as we did not identify any women-
owned funds raised in 2016. Due to the noise in this data, we cannot tell whether this represents a
shift in fundraising or whether the drop is a fluctuation that will rebound in the next period.
0.0%
1.0%
2.0%
3.0%
4.0%
5.0%
6.0%
2004 2006 2008 2010 2012 2014 2016
% o
f A
ll F
un
ds
Ra
ised
Number of Diverse PE Funds Raised as a Percentage of All
PE Funds Raised, by Year
Women-Owned Minority-Owned

Page 68
221 Essex St. Ste. 21, Salem MA 01970
Figure 64. Timeline of diverse-owned real estate funds. Dotted lines represent linear trends.
AUM Raised for PE: We also construct timelines based on the total amount of AUM raised in a
given vintage year. For this metric, we sum the final size of each fund raised in each vintage
year, grouped by ownership type. Figure 65 shows the results for the PE industry. Using the
final fund size metric, minority representation increases more than when considering fund count,
growing from approximately 1.75% in 2004 to approximately 4.75% of fundraising in 2016
(through August 2016). While there is a clear upward trend in fundraising by minority-
owned firms compared to total PE fundraising, there is no distinct trend for women-owned firms
over the same time period.
Figure 65. Timeline of percentage of AUM managed by diverse-owned PE firms. Dotted
lines represent linear trends.
We also construct timelines for the total AUM raised in each year for diverse-owned firms.
Figure 66 shows the AUM timeline for PE firms from 2004 through 2016. AUM raised by
minority-owned firms has increased substantially over the time frame, from $1.3 billion in
2004 to $18.5 billion in 2016. This metric shows a consistent upward trend, with the notable
0.0%
1.0%
2.0%
3.0%
4.0%
2004 2006 2008 2010 2012 2014 2016
% o
f A
ll F
un
ds
Ra
ised
Number of Diverse Real Estate Funds Raised as a
Percentage of All Real Estate Funds Raised, by Year
Women-Owned Minority-Owned
0.0%
1.0%
2.0%
3.0%
4.0%
5.0%
6.0%
2004 2006 2008 2010 2012 2014 2016
% o
f T
ota
l F
un
dra
isin
g D
oll
ars
Amount of Fundraising by Diverse PE Firms as a
Percentage of Total PE Fundraising, by Year
Women-Owned Minority-Owned
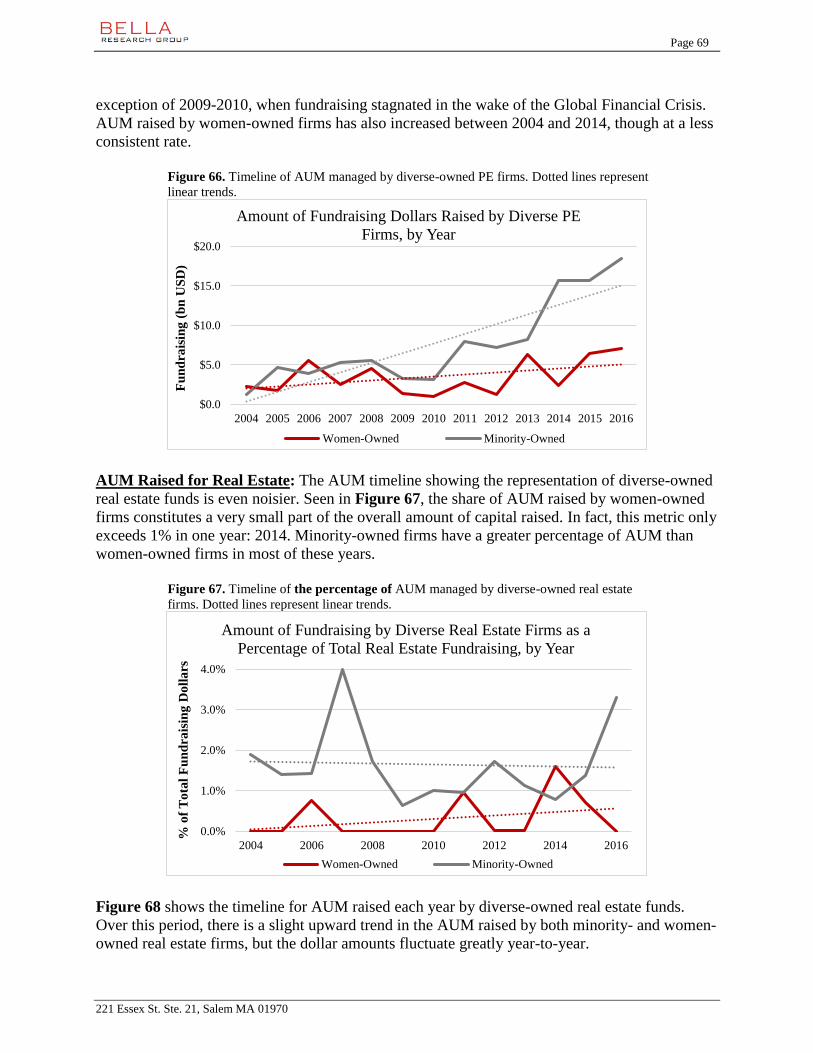
Page 69
221 Essex St. Ste. 21, Salem MA 01970
exception of 2009-2010, when fundraising stagnated in the wake of the Global Financial Crisis.
AUM raised by women-owned firms has also increased between 2004 and 2014, though at a less
consistent rate.
Figure 66. Timeline of AUM managed by diverse-owned PE firms. Dotted lines represent
linear trends.
AUM Raised for Real Estate: The AUM timeline showing the representation of diverse-owned
real estate funds is even noisier. Seen in Figure 67, the share of AUM raised by women-owned
firms constitutes a very small part of the overall amount of capital raised. In fact, this metric only
exceeds 1% in one year: 2014. Minority-owned firms have a greater percentage of AUM than
women-owned firms in most of these years.
Figure 67. Timeline of the percentage of AUM managed by diverse-owned real estate
firms. Dotted lines represent linear trends.
Figure 68 shows the timeline for AUM raised each year by diverse-owned real estate funds.
Over this period, there is a slight upward trend in the AUM raised by both minority- and women-
owned real estate firms, but the dollar amounts fluctuate greatly year-to-year.
$0.0
$5.0
$10.0
$15.0
$20.0
2004 2005 2006 2007 2008 2009 2010 2011 2012 2013 2014 2015 2016
Fu
nd
rais
ing
(b
n U
SD
)
Amount of Fundraising Dollars Raised by Diverse PE
Firms, by Year
Women-Owned Minority-Owned
0.0%
1.0%
2.0%
3.0%
4.0%
2004 2006 2008 2010 2012 2014 2016
% o
f T
ota
l F
un
dra
isin
g D
oll
ars
Amount of Fundraising by Diverse Real Estate Firms as a
Percentage of Total Real Estate Fundraising, by Year
Women-Owned Minority-Owned
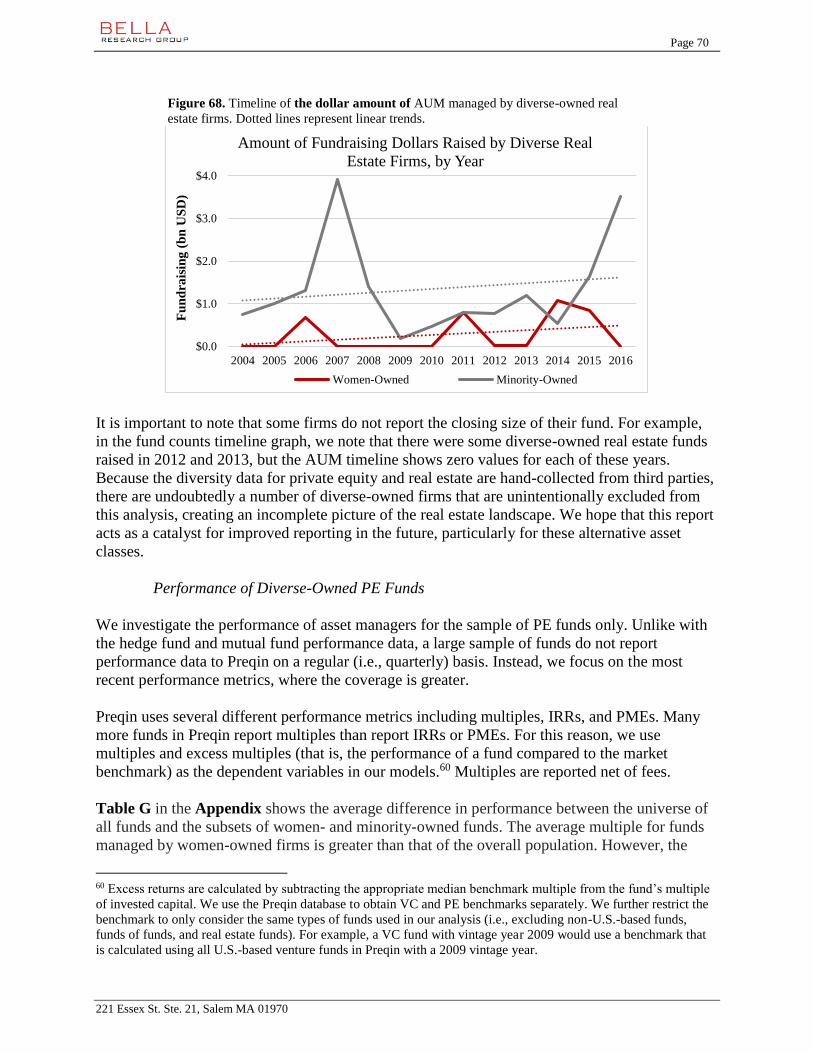
Page 70
221 Essex St. Ste. 21, Salem MA 01970
Figure 68. Timeline of the dollar amount of AUM managed by diverse-owned real
estate firms. Dotted lines represent linear trends.
It is important to note that some firms do not report the closing size of their fund. For example,
in the fund counts timeline graph, we note that there were some diverse-owned real estate funds
raised in 2012 and 2013, but the AUM timeline shows zero values for each of these years.
Because the diversity data for private equity and real estate are hand-collected from third parties,
there are undoubtedly a number of diverse-owned firms that are unintentionally excluded from
this analysis, creating an incomplete picture of the real estate landscape. We hope that this report
acts as a catalyst for improved reporting in the future, particularly for these alternative asset
classes.
Performance of Diverse-Owned PE Funds
We investigate the performance of asset managers for the sample of PE funds only. Unlike with
the hedge fund and mutual fund performance data, a large sample of funds do not report
performance data to Preqin on a regular (i.e., quarterly) basis. Instead, we focus on the most
recent performance metrics, where the coverage is greater.
Preqin uses several different performance metrics including multiples, IRRs, and PMEs. Many
more funds in Preqin report multiples than report IRRs or PMEs. For this reason, we use
multiples and excess multiples (that is, the performance of a fund compared to the market
benchmark) as the dependent variables in our models.60 Multiples are reported net of fees.
Table G in the Appendix shows the average difference in performance between the universe of
all funds and the subsets of women- and minority-owned funds. The average multiple for funds
managed by women-owned firms is greater than that of the overall population. However, the
60 Excess returns are calculated by subtracting the appropriate median benchmark multiple from the fund’s multiple
of invested capital. We use the Preqin database to obtain VC and PE benchmarks separately. We further restrict the
benchmark to only consider the same types of funds used in our analysis (i.e., excluding non-U.S.-based funds,
funds of funds, and real estate funds). For example, a VC fund with vintage year 2009 would use a benchmark that
is calculated using all U.S.-based venture funds in Preqin with a 2009 vintage year.
$0.0
$1.0
$2.0
$3.0
$4.0
2004 2005 2006 2007 2008 2009 2010 2011 2012 2013 2014 2015 2016
Fu
nd
rais
ing
(b
n U
SD
)
Amount of Fundraising Dollars Raised by Diverse Real
Estate Firms, by Year
Women-Owned Minority-Owned
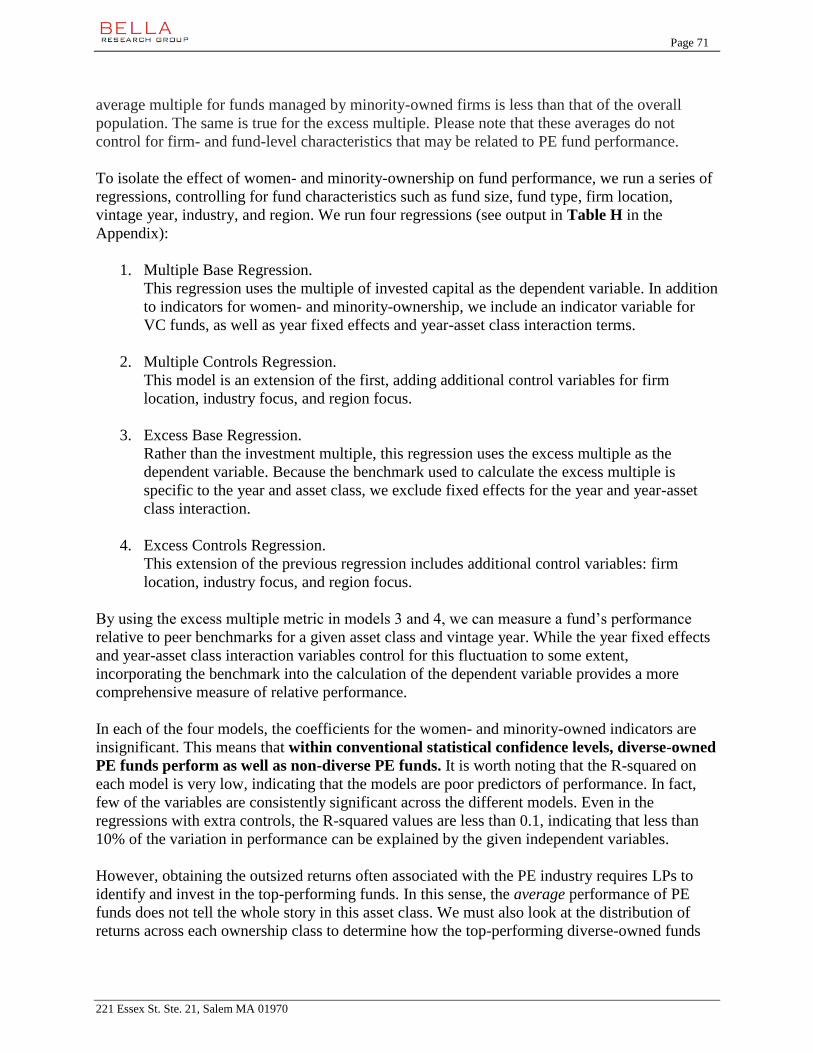
Page 71
221 Essex St. Ste. 21, Salem MA 01970
average multiple for funds managed by minority-owned firms is less than that of the overall
population. The same is true for the excess multiple. Please note that these averages do not
control for firm- and fund-level characteristics that may be related to PE fund performance.
To isolate the effect of women- and minority-ownership on fund performance, we run a series of
regressions, controlling for fund characteristics such as fund size, fund type, firm location,
vintage year, industry, and region. We run four regressions (see output in Table H in the
Appendix):
1. Multiple Base Regression.
This regression uses the multiple of invested capital as the dependent variable. In addition
to indicators for women- and minority-ownership, we include an indicator variable for
VC funds, as well as year fixed effects and year-asset class interaction terms.
2. Multiple Controls Regression.
This model is an extension of the first, adding additional control variables for firm
location, industry focus, and region focus.
3. Excess Base Regression.
Rather than the investment multiple, this regression uses the excess multiple as the
dependent variable. Because the benchmark used to calculate the excess multiple is
specific to the year and asset class, we exclude fixed effects for the year and year-asset
class interaction.
4. Excess Controls Regression.
This extension of the previous regression includes additional control variables: firm
location, industry focus, and region focus.
By using the excess multiple metric in models 3 and 4, we can measure a fund’s performance
relative to peer benchmarks for a given asset class and vintage year. While the year fixed effects
and year-asset class interaction variables control for this fluctuation to some extent,
incorporating the benchmark into the calculation of the dependent variable provides a more
comprehensive measure of relative performance.
In each of the four models, the coefficients for the women- and minority-owned indicators are
insignificant. This means that within conventional statistical confidence levels, diverse-owned
PE funds perform as well as non-diverse PE funds. It is worth noting that the R-squared on
each model is very low, indicating that the models are poor predictors of performance. In fact,
few of the variables are consistently significant across the different models. Even in the
regressions with extra controls, the R-squared values are less than 0.1, indicating that less than
10% of the variation in performance can be explained by the given independent variables.
However, obtaining the outsized returns often associated with the PE industry requires LPs to
identify and invest in the top-performing funds. In this sense, the average performance of PE
funds does not tell the whole story in this asset class. We must also look at the distribution of
returns across each ownership class to determine how the top-performing diverse-owned funds
Page 72
221 Essex St. Ste. 21, Salem MA 01970
compare to their non-diverse peers. While there is some debate about the extent to which LPs
can predict which funds will outperform, it is widely accepted that manager selection is
important in obtaining top returns in a PE portfolio.
With this in mind, we investigate the distribution of performance for diverse-owned PE firms.
We first find the percentage of diverse-owned funds that fall in the top quartile of performance in
each month and average these percentages over the time period for which we have data. The
results, presented in Table I, show that 33% of funds managed by women-owned firms and 20%
of funds managed by minority-owned firms fall in the top quartile, measuring performance using
the net multiple. This suggests that it is possible to construct a portfolio of top diverse-owned
PE firms that outperforms the PE benchmark.
Institutional Investor Types for Diverse-Owned PE Firms
This analysis looks at what types of institutional investors commit capital to diverse asset
managers. To address this question, we use the institutional investor datasets provided by Preqin
to analyze the breakdown of the types of LPs associated with each PE firm. Using these LP/GP
pairs, we assign to each of the LPs a “type” based on their classification in Preqin. Examples of
these types include public pension fund, endowment, advisor, etc.
For each PE firm, we count the number of LPs of each type that invest with that firm and
calculate the representation of each LP type with each firm. As an example, suppose that there
are 2 public pension funds and 3 endowments that invest in funds managed by PE Firm A,
meaning that 40% of the LPs engaged with PE Firm A are pensions and 60% are endowments.
Using these counts and percentages, we describe the average representation of each LP type for
women-owned PE firms and minority-owned PE firms. We compare LP types for diverse PE
firms with LP types for a random sample of 100 matching firms from the general population of
firms.61 The metrics for the 100 Matching Firms Sample are calculated in the same way as the
counts and percentages were calculated for the women- and minority-owned firms.
We first look at the count of institutional investor types for each PE ownership category,
summarized in the table below. These numbers represent the average number of LP types
engaged with PE firms, by diversity category. For example, there are 6.05 public pension funds
invested with each women-owned PE firm on average. The stars indicate whether the difference
between the women- or minority-owned averages are significantly different than the average for
the 100 Matching Firms sample.62 For example, there are an average of 1.86 foundations and
endowments invested with each women-owned PE firm compared to 3.71 foundations and
endowments engaged with the one of the 100 Matching Firms, on average. This difference is
significant at a 90% confidence level, as shown with the star on the 1.86 value. On the other
hand, although more public pensions invested with the average minority-owned firm than with
one of the 100 Matching Firms (6.68 versus 5.51), this difference is not statistically significant.
61 For a discussion on how we obtained the sample of funds, see the Data Sources section. 62 Number of stars indicates confidence level. * = 90% confidence, ** = 95% confidence, *** = 99% confidence.
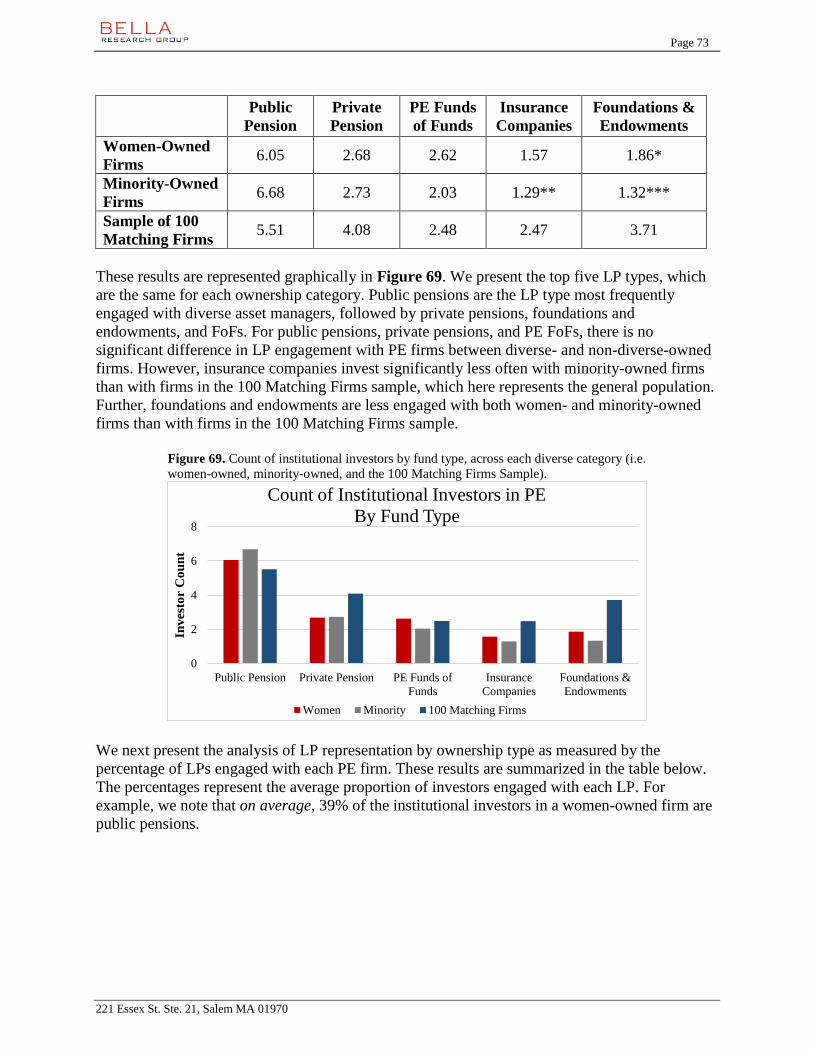
Page 73
221 Essex St. Ste. 21, Salem MA 01970
Public
Pension
Private
Pension
PE Funds
of Funds
Insurance
Companies
Foundations &
Endowments
Women-Owned
Firms 6.05 2.68 2.62 1.57 1.86*
Minority-Owned
Firms 6.68 2.73 2.03 1.29** 1.32***
Sample of 100
Matching Firms 5.51 4.08 2.48 2.47 3.71
These results are represented graphically in Figure 69. We present the top five LP types, which
are the same for each ownership category. Public pensions are the LP type most frequently
engaged with diverse asset managers, followed by private pensions, foundations and
endowments, and FoFs. For public pensions, private pensions, and PE FoFs, there is no
significant difference in LP engagement with PE firms between diverse- and non-diverse-owned
firms. However, insurance companies invest significantly less often with minority-owned firms
than with firms in the 100 Matching Firms sample, which here represents the general population.
Further, foundations and endowments are less engaged with both women- and minority-owned
firms than with firms in the 100 Matching Firms sample.
Figure 69. Count of institutional investors by fund type, across each diverse category (i.e.
women-owned, minority-owned, and the 100 Matching Firms Sample).
We next present the analysis of LP representation by ownership type as measured by the
percentage of LPs engaged with each PE firm. These results are summarized in the table below.
The percentages represent the average proportion of investors engaged with each LP. For
example, we note that on average, 39% of the institutional investors in a women-owned firm are
public pensions.
0
2
4
6
8
Public Pension Private Pension PE Funds of
Funds
Insurance
Companies
Foundations &
Endowments
Inv
esto
r C
ou
nt
Count of Institutional Investors in PE
By Fund Type
Women Minority 100 Matching Firms

Page 74
221 Essex St. Ste. 21, Salem MA 01970
Public
Pension
Private
Pension
PE Funds
of Funds
Insurance
Companies
Foundations &
Endowments
Women-Owned
Firms 39% 15% 10% 16% 12%
Minority-Owned
Firms 41%** 17% 14% 9%* 7%***
Sample of 100
Matching Firms 29% 14% 14% 14% 15%
These results are shown graphically in Figure 70. We note that in this calculation as well, public
pensions are the most represented LP type. While there are some differences between women-
owned firms and firms in the 100 Matching Firms Sample, none of the differences are
statistically significant. However, for minority-owned firms, we note three significant results.
First, public pensions make up a larger percentage of the average minority-owned firm’s
investors than would be expected. However, insurance companies and foundations and
endowments make up a smaller percentage of the average minority-owned firm’s investors than
would be expected, given the results of the analysis of the 100 Matching Firms sample.
Figure 70. Percentage of institutional investors by fund type, across each diverse
category (i.e. women-owned, minority-owned, and the 100 Matching Firms sample).
These findings suggest that foundations and endowments are underrepresented in women-
and minority-owned PE firms. Further, insurance companies appear to also underinvest in
minority-owned firms. However, public pensions are better represented among investors in
minority-owned firms than would be expected. However, because of the data limitations
discussed in the Data Sources section––namely that none of these pairs has associated dollar
amounts––these measures of LP engagement with diverse managers should be considered a first
attempt at quantifying these relationships. More robust data collection in the future is critical to a
proper understanding of these relationships.
0%
10%
20%
30%
40%
50%
Public Pension Private Pension PE Funds of
Funds
Insurance
Companies
Foundations &
Endowments
Inves
tor
Per
centa
ge
Percentage of Institutional Investors in PE
By Fund Type
Women Minority 100 Matching Firms
Page 75
221 Essex St. Ste. 21, Salem MA 01970
V. Conclusion
This study aims to provide a first look at diversity in the ownership of asset management firms
and to quantify the level of ownership across a variety of metrics. For this project, the Knight
Foundation contracted with Bella Research Group to collect and analyze data on the
representation of women- and minority-owned firms in the United States across four asset
classes: mutual funds; hedge funds; private equity; and real estate.
The primary focus of this project is quantifying the number of diverse-owned firms and funds as
well as the amount of AUM compared to the population totals. Where the available data permit,
we also investigate trends over time, performance, and institutional investors for diverse-owned
firms. Our findings are summarized by asset class below:
Mutual Funds:
Women- and minority-owned firms are underrepresented, whether measured by number of firms,
number of funds, or amount of AUM. Over the past five years, the representation of diverse-
owned firms has fluctuated, but there is no clear trend in either direction. Sub-par investment
performance should not be considered a contributing factor to this underrepresentation, as
diverse-owned firms perform as well as non-diverse firms, within conventional confidence
intervals.
Hedge Funds:
Similarly, we note an underrepresentation of diverse-owned firms in the hedge fund space,
though there is some evidence for increased representation since 2010. The performance analysis
provides no conclusive evidence that performance of diverse-owned hedge funds is worse than
performance of non-diverse hedge funds.
Private Equity and Real Estate:
We find very low representation of diverse-owned firms in the PE and real estate space, noting
possible biases due to our efforts to identify women and minority ownership from public and
proprietary sources. We find some evidence of an increase in the representation of women- and
minority-owned firms since 2004. While the small sample size precludes an analysis of
performance for diverse-owned real estate firms, we note that for PE, there is no significant
difference in performance between funds managed by diverse-owned firms and those managed
by non-diverse firms.
Other Conclusions:
We hope that this report provides the foundation for future inquiry and more robust data
collection. Importantly, we highlight the need for data sources with comprehensive and detailed
reporting of diverse ownership and diverse management. This demographic information is most
notably absent in the PE and real estate spaces. Creating a publicly-available, non-proprietary
database with this information should be a top priority for the investment community. It is our
hope that these analyses will spur increased awareness and knowledge on this topic and
encourage enhanced data reporting in the future.

Page 76
221 Essex St. Ste. 21, Salem MA 01970
VI. Acknowledgements
Funding for this report was provided by The John S. and James L. Knight Foundation, which is
gratefully acknowledged. The authors would also like to thank the external reviewers who
provided helpful feedback on this report. This advisory group includes Knight Foundation, the
National Association of Investment Companies, Protégé Search, Exelon Corporation, RG +
Associates, Cambridge Associates, MJ Alternative Investment Research, and the Raben Group.
This advisory group provided input on potential investment databases for the study and provided
comments on a draft of the report. They did not have editorial privileges, and the final
methodology and results were solely at the discretion of the Bella Research Group.
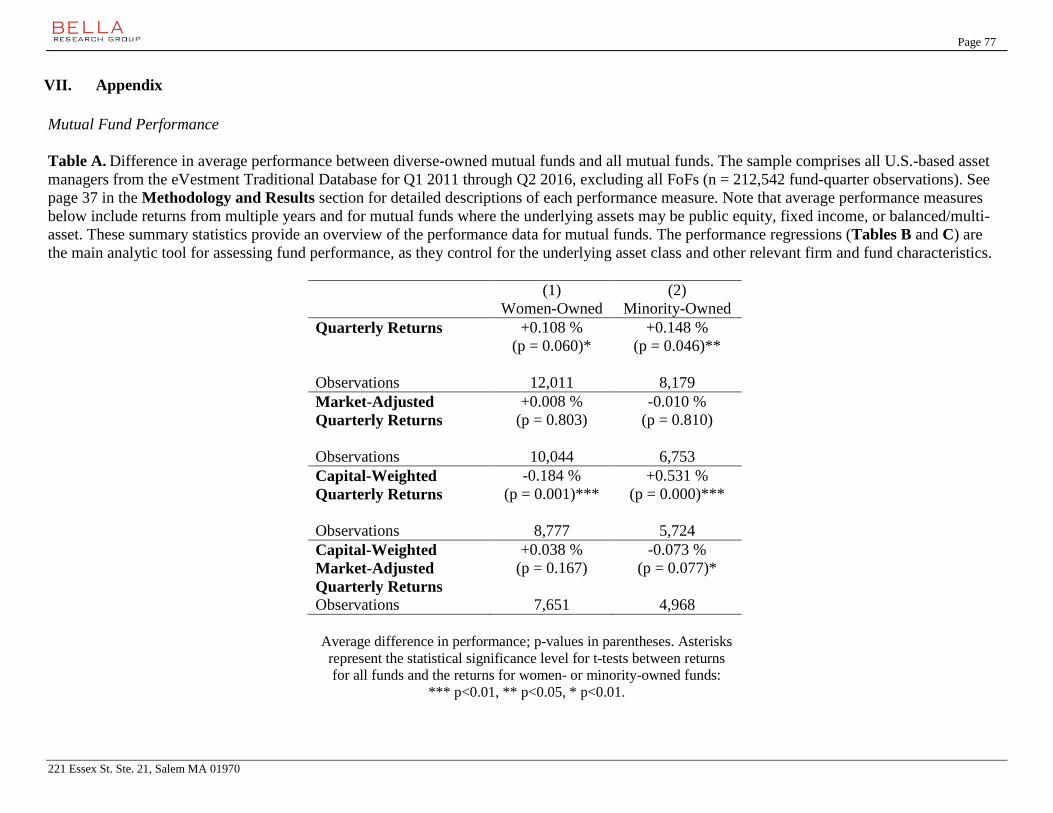
Page 77
221 Essex St. Ste. 21, Salem MA 01970
VII. Appendix
Mutual Fund Performance
Table A. Difference in average performance between diverse-owned mutual funds and all mutual funds. The sample comprises all U.S.-based asset
managers from the eVestment Traditional Database for Q1 2011 through Q2 2016, excluding all FoFs (n = 212,542 fund-quarter observations). See
page 37 in the Methodology and Results section for detailed descriptions of each performance measure. Note that average performance measures
below include returns from multiple years and for mutual funds where the underlying assets may be public equity, fixed income, or balanced/multi-
asset. These summary statistics provide an overview of the performance data for mutual funds. The performance regressions (Tables B and C) are
the main analytic tool for assessing fund performance, as they control for the underlying asset class and other relevant firm and fund characteristics.
(1) (2)
Women-Owned Minority-Owned
Quarterly Returns +0.108 % +0.148 %
(p = 0.060)* (p = 0.046)**
Observations 12,011 8,179
Market-Adjusted
Quarterly Returns
+0.008 % -0.010 %
(p = 0.803) (p = 0.810)
Observations 10,044 6,753
Capital-Weighted
Quarterly Returns
-0.184 % +0.531 %
(p = 0.001)*** (p = 0.000)***
Observations 8,777 5,724
Capital-Weighted
Market-Adjusted
Quarterly Returns
+0.038 % -0.073 %
(p = 0.167) (p = 0.077)*
Observations 7,651 4,968
Average difference in performance; p-values in parentheses. Asterisks
represent the statistical significance level for t-tests between returns
for all funds and the returns for women- or minority-owned funds:
*** p<0.01, ** p<0.05, * p<0.01.
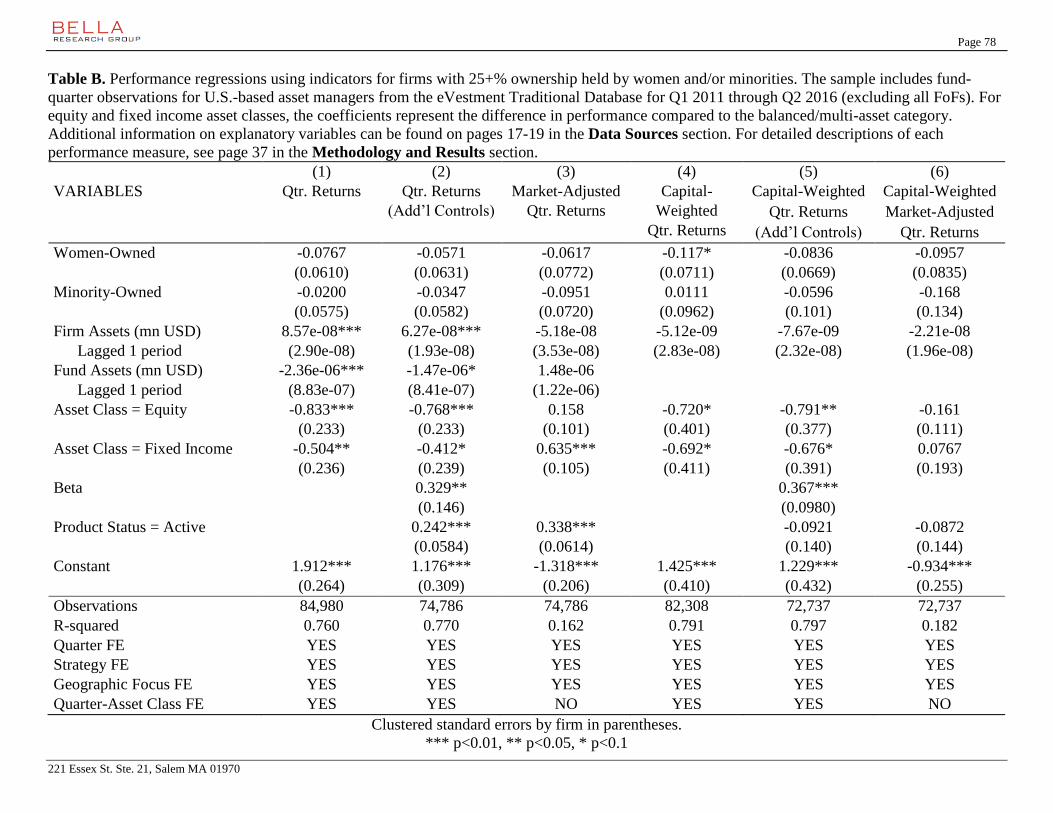
Page 78
221 Essex St. Ste. 21, Salem MA 01970
Table B. Performance regressions using indicators for firms with 25+% ownership held by women and/or minorities. The sample includes fund-
quarter observations for U.S.-based asset managers from the eVestment Traditional Database for Q1 2011 through Q2 2016 (excluding all FoFs). For
equity and fixed income asset classes, the coefficients represent the difference in performance compared to the balanced/multi-asset category.
Additional information on explanatory variables can be found on pages 17-19 in the Data Sources section. For detailed descriptions of each
performance measure, see page 37 in the Methodology and Results section.
(1) (2) (3) (4) (5) (6)
VARIABLES Qtr. Returns Qtr. Returns
(Add’l Controls)
Market-Adjusted
Qtr. Returns
Capital-
Weighted
Qtr. Returns
Capital-Weighted Capital-Weighted
Qtr. Returns Market-Adjusted
(Add’l Controls) Qtr. Returns
Women-Owned -0.0767 -0.0571 -0.0617 -0.117* -0.0836 -0.0957
(0.0610) (0.0631) (0.0772) (0.0711) (0.0669) (0.0835)
Minority-Owned -0.0200 -0.0347 -0.0951 0.0111 -0.0596 -0.168
(0.0575) (0.0582) (0.0720) (0.0962) (0.101) (0.134)
Firm Assets (mn USD)
Lagged 1 period
8.57e-08*** 6.27e-08*** -5.18e-08 -5.12e-09 -7.67e-09 -2.21e-08
(2.90e-08) (1.93e-08) (3.53e-08) (2.83e-08) (2.32e-08) (1.96e-08)
Fund Assets (mn USD)
Lagged 1 period
-2.36e-06*** -1.47e-06* 1.48e-06
(8.83e-07) (8.41e-07) (1.22e-06)
Asset Class = Equity -0.833*** -0.768*** 0.158 -0.720* -0.791** -0.161
(0.233) (0.233) (0.101) (0.401) (0.377) (0.111)
Asset Class = Fixed Income -0.504** -0.412* 0.635*** -0.692* -0.676* 0.0767
(0.236) (0.239) (0.105) (0.411) (0.391) (0.193)
Beta 0.329** 0.367***
(0.146) (0.0980)
Product Status = Active 0.242*** 0.338*** -0.0921 -0.0872
(0.0584) (0.0614) (0.140) (0.144)
Constant 1.912*** 1.176*** -1.318*** 1.425*** 1.229*** -0.934***
(0.264) (0.309) (0.206) (0.410) (0.432) (0.255)
Observations 84,980 74,786 74,786 82,308 72,737 72,737
R-squared 0.760 0.770 0.162 0.791 0.797 0.182
Quarter FE YES YES YES YES YES YES
Strategy FE YES YES YES YES YES YES
Geographic Focus FE YES YES YES YES YES YES
Quarter-Asset Class FE YES YES NO YES YES NO
Clustered standard errors by firm in parentheses.
*** p<0.01, ** p<0.05, * p<0.1

Page 79
221 Essex St. Ste. 21, Salem MA 01970
Table C. Performance regressions using indicators for substantial women ownership (25-49%), majority women ownership (50+%), substantial
minority ownership (25-49%), and majority minority ownership (50+%). The sample includes fund-quarter observations for U.S.-based asset
managers from the eVestment Traditional Database for Q1 2011 through Q2 2016 (excluding all FoFs). For equity and fixed income asset classes, the
coefficients represent the difference in performance compared to the balanced/multi-asset category. Additional information on explanatory variables
can be found on pages 17-19 in the Data Sources section. For detailed descriptions of each performance measure, see page 37 in the Methodology
and Results section.
(1) (2) (3) (4) (5) (6)
VARIABLES Qtr. Returns Qtr. Returns
(Add’l Controls)
Market-Adjusted
Qtr. Returns
Capital-Weighted
Qtr. Returns
Capital-Weighted Capital-Weighted
Qtr. Returns Market-Adjusted
(Add’l Controls) Qtr. Returns
Substantially Women-Owned -0.153 -0.130 -0.117 -0.0336 -0.0216 -0.0632
(0.0964) (0.102) (0.132) (0.0995) (0.103) (0.130)
Majority Women-Owned -0.0180 0.000144 -0.0149 -0.156** -0.113 -0.113
(0.0686) (0.0675) (0.0815) (0.0763) (0.0762) (0.102)
Substantially Minority-Owned 0.00855 0.0355 -0.117 0.161 0.0586 0.0730
(0.127) (0.137) (0.181) (0.115) (0.193) (0.248)
Majority Minority-Owned -0.0229 -0.0429 -0.0901 -0.0567 -0.108 -0.253*
(0.0629) (0.0632) (0.0771) (0.114) (0.112) (0.139)
Firm Assets (mn USD)
Lagged 1 period
8.52e-08*** 6.26e-08*** -5.19e-08 -5.00e-09 -7.58e-09 -2.20e-08
(2.90e-08) (1.92e-08) (3.52e-08) (2.83e-08) (2.32e-08) (1.96e-08)
Fund Assets (mn USD)
Lagged 1 period
-2.39e-06*** -1.50e-06* 1.46e-06
(8.88e-07) (8.46e-07) (1.22e-06)
Asset Class = Equity -0.839*** -0.773*** 0.154 -0.720* -0.790** -0.160
(0.233) (0.233) (0.101) (0.401) (0.377) (0.111)
Asset Class = Fixed Income -0.506** -0.415* 0.633*** -0.689* -0.673* 0.0803
(0.236) (0.239) (0.104) (0.411) (0.391) (0.193)
Beta 0.329** 0.367***
(0.147) (0.0981)
Product Status = Active 0.244*** 0.340*** -0.0932 -0.0885
(0.0583) (0.0610) (0.140) (0.143)
Constant 1.917*** 1.177*** -1.318*** 1.425*** 1.230*** -0.934***
(0.263) (0.309) (0.206) (0.410) (0.432) (0.255)
Observations 84,980 74,786 74,786 82,308 72,737 72,737
R-squared 0.760 0.770 0.162 0.791 0.797 0.182
Quarter FE YES YES YES YES YES YES
Strategy FE YES YES YES YES YES YES
Geographic Focus FE YES YES YES YES YES YES
Quarter-Asset Class FE YES YES NO YES YES NO Clustered standard errors by firm in parentheses.
*** p<0.01, ** p<0.05, * p<0.1
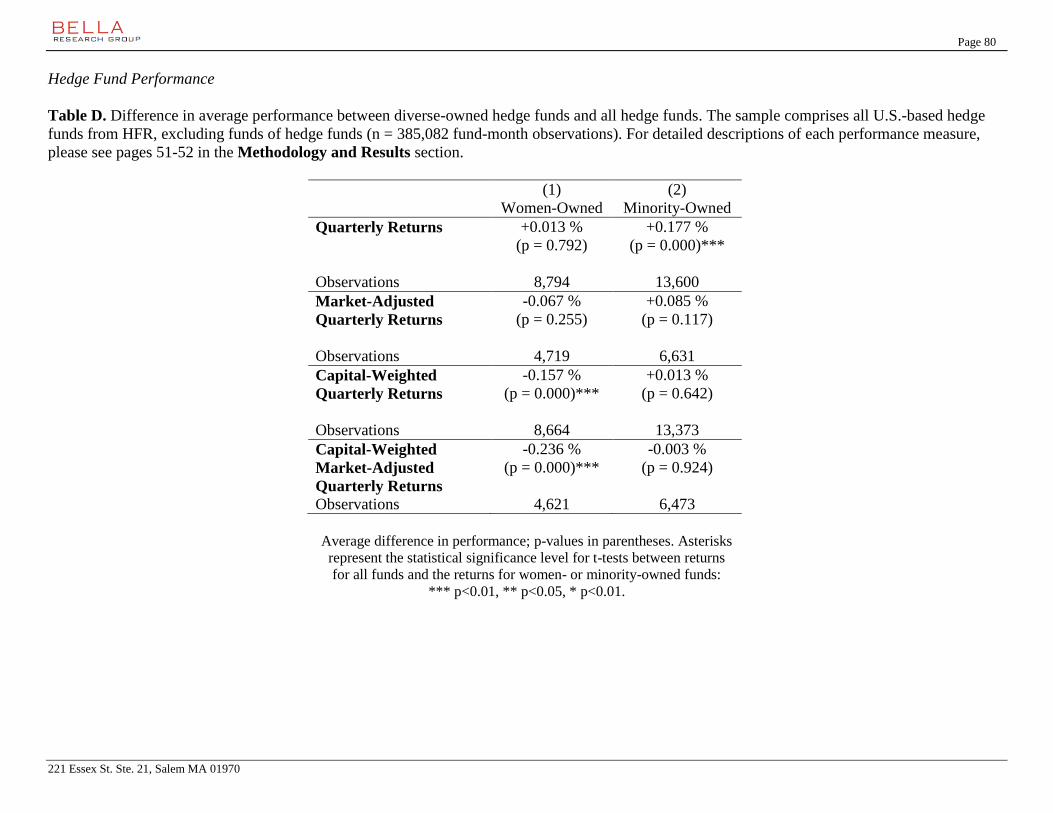
Page 80
221 Essex St. Ste. 21, Salem MA 01970
Hedge Fund Performance
Table D. Difference in average performance between diverse-owned hedge funds and all hedge funds. The sample comprises all U.S.-based hedge
funds from HFR, excluding funds of hedge funds (n = 385,082 fund-month observations). For detailed descriptions of each performance measure,
please see pages 51-52 in the Methodology and Results section.
(1) (2)
Women-Owned Minority-Owned
Quarterly Returns +0.013 % +0.177 %
(p = 0.792) (p = 0.000)***
Observations 8,794 13,600
Market-Adjusted
Quarterly Returns
-0.067 % +0.085 %
(p = 0.255) (p = 0.117)
Observations 4,719 6,631
Capital-Weighted
Quarterly Returns
-0.157 % +0.013 %
(p = 0.000)*** (p = 0.642)
Observations 8,664 13,373
Capital-Weighted
Market-Adjusted
Quarterly Returns
-0.236 % -0.003 %
(p = 0.000)*** (p = 0.924)
Observations 4,621 6,473
Average difference in performance; p-values in parentheses. Asterisks
represent the statistical significance level for t-tests between returns
for all funds and the returns for women- or minority-owned funds:
*** p<0.01, ** p<0.05, * p<0.01.
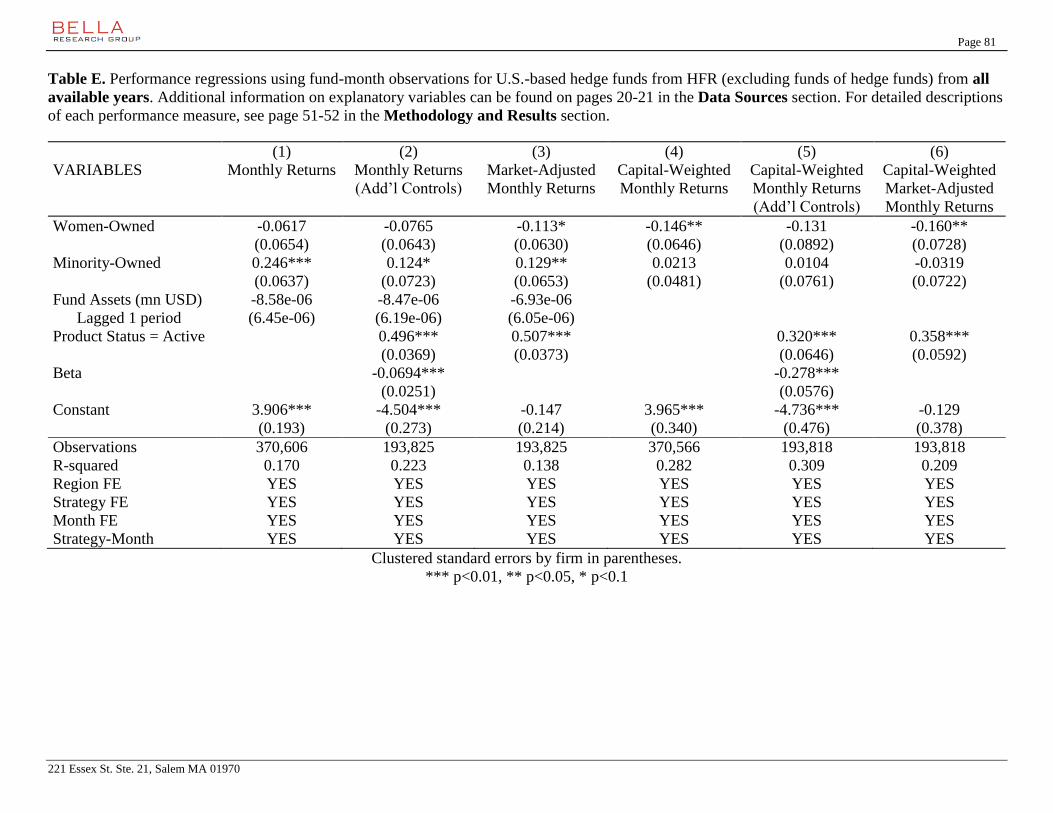
Page 81
221 Essex St. Ste. 21, Salem MA 01970
Table E. Performance regressions using fund-month observations for U.S.-based hedge funds from HFR (excluding funds of hedge funds) from all
available years. Additional information on explanatory variables can be found on pages 20-21 in the Data Sources section. For detailed descriptions
of each performance measure, see page 51-52 in the Methodology and Results section.
(1) (2) (3) (4) (5) (6)
VARIABLES Monthly Returns Monthly Returns
(Add’l Controls)
Market-Adjusted
Monthly Returns
Capital-Weighted
Monthly Returns
Capital-Weighted
Monthly Returns
(Add’l Controls)
Capital-Weighted
Market-Adjusted
Monthly Returns
Women-Owned -0.0617 -0.0765 -0.113* -0.146** -0.131 -0.160**
(0.0654) (0.0643) (0.0630) (0.0646) (0.0892) (0.0728)
Minority-Owned 0.246*** 0.124* 0.129** 0.0213 0.0104 -0.0319
(0.0637) (0.0723) (0.0653) (0.0481) (0.0761) (0.0722)
Fund Assets (mn USD)
Lagged 1 period
-8.58e-06 -8.47e-06 -6.93e-06
(6.45e-06) (6.19e-06) (6.05e-06)
Product Status = Active 0.496*** 0.507*** 0.320*** 0.358***
(0.0369) (0.0373) (0.0646) (0.0592)
Beta -0.0694*** -0.278***
(0.0251) (0.0576)
Constant 3.906*** -4.504*** -0.147 3.965*** -4.736*** -0.129
(0.193) (0.273) (0.214) (0.340) (0.476) (0.378)
Observations 370,606 193,825 193,825 370,566 193,818 193,818
R-squared 0.170 0.223 0.138 0.282 0.309 0.209
Region FE YES YES YES YES YES YES
Strategy FE YES YES YES YES YES YES
Month FE YES YES YES YES YES YES
Strategy-Month YES YES YES YES YES YES
Clustered standard errors by firm in parentheses.
*** p<0.01, ** p<0.05, * p<0.1
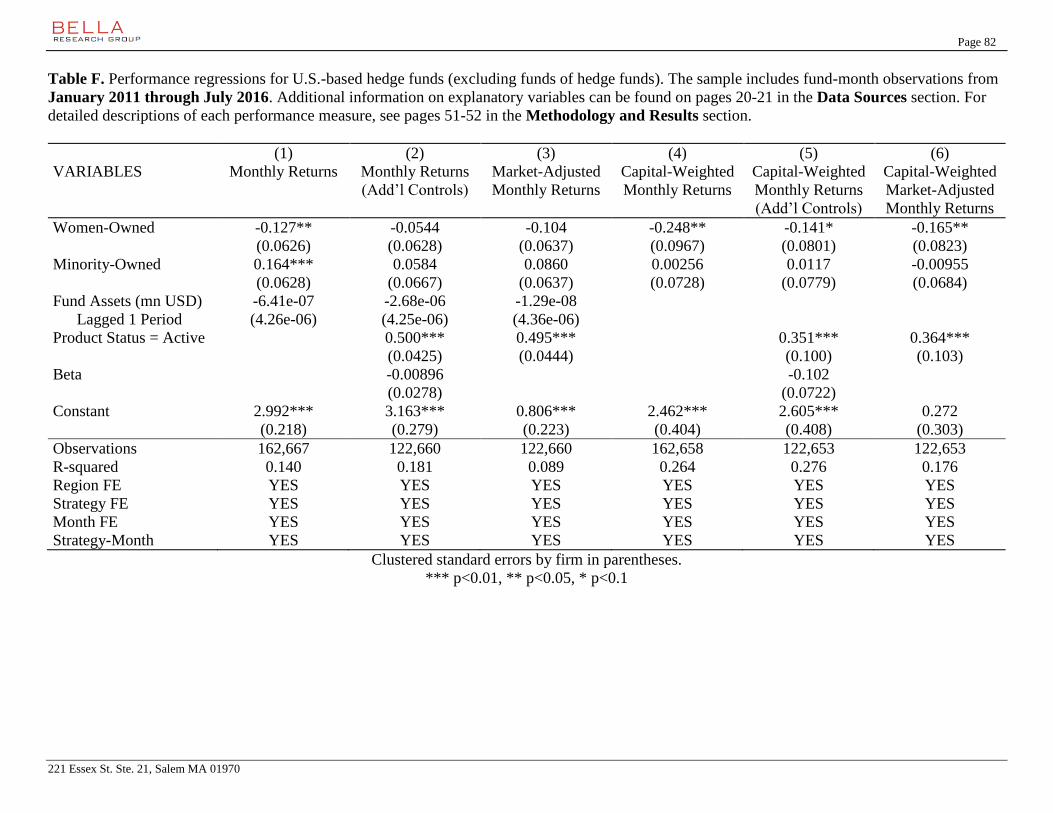
Page 82
221 Essex St. Ste. 21, Salem MA 01970
Table F. Performance regressions for U.S.-based hedge funds (excluding funds of hedge funds). The sample includes fund-month observations from
January 2011 through July 2016. Additional information on explanatory variables can be found on pages 20-21 in the Data Sources section. For
detailed descriptions of each performance measure, see pages 51-52 in the Methodology and Results section.
(1) (2) (3) (4) (5) (6)
VARIABLES Monthly Returns Monthly Returns
(Add’l Controls)
Market-Adjusted
Monthly Returns
Capital-Weighted
Monthly Returns
Capital-Weighted
Monthly Returns
(Add’l Controls)
Capital-Weighted
Market-Adjusted
Monthly Returns
Women-Owned -0.127** -0.0544 -0.104 -0.248** -0.141* -0.165**
(0.0626) (0.0628) (0.0637) (0.0967) (0.0801) (0.0823)
Minority-Owned 0.164*** 0.0584 0.0860 0.00256 0.0117 -0.00955
(0.0628) (0.0667) (0.0637) (0.0728) (0.0779) (0.0684)
Fund Assets (mn USD) -6.41e-07 -2.68e-06 -1.29e-08
Lagged 1 Period (4.26e-06) (4.25e-06) (4.36e-06)
Product Status = Active 0.500*** 0.495*** 0.351*** 0.364***
(0.0425) (0.0444) (0.100) (0.103)
Beta -0.00896 -0.102
(0.0278) (0.0722)
Constant 2.992*** 3.163*** 0.806*** 2.462*** 2.605*** 0.272
(0.218) (0.279) (0.223) (0.404) (0.408) (0.303)
Observations 162,667 122,660 122,660 162,658 122,653 122,653
R-squared 0.140 0.181 0.089 0.264 0.276 0.176
Region FE YES YES YES YES YES YES
Strategy FE YES YES YES YES YES YES
Month FE YES YES YES YES YES YES
Strategy-Month YES YES YES YES YES YES
Clustered standard errors by firm in parentheses.
*** p<0.01, ** p<0.05, * p<0.1
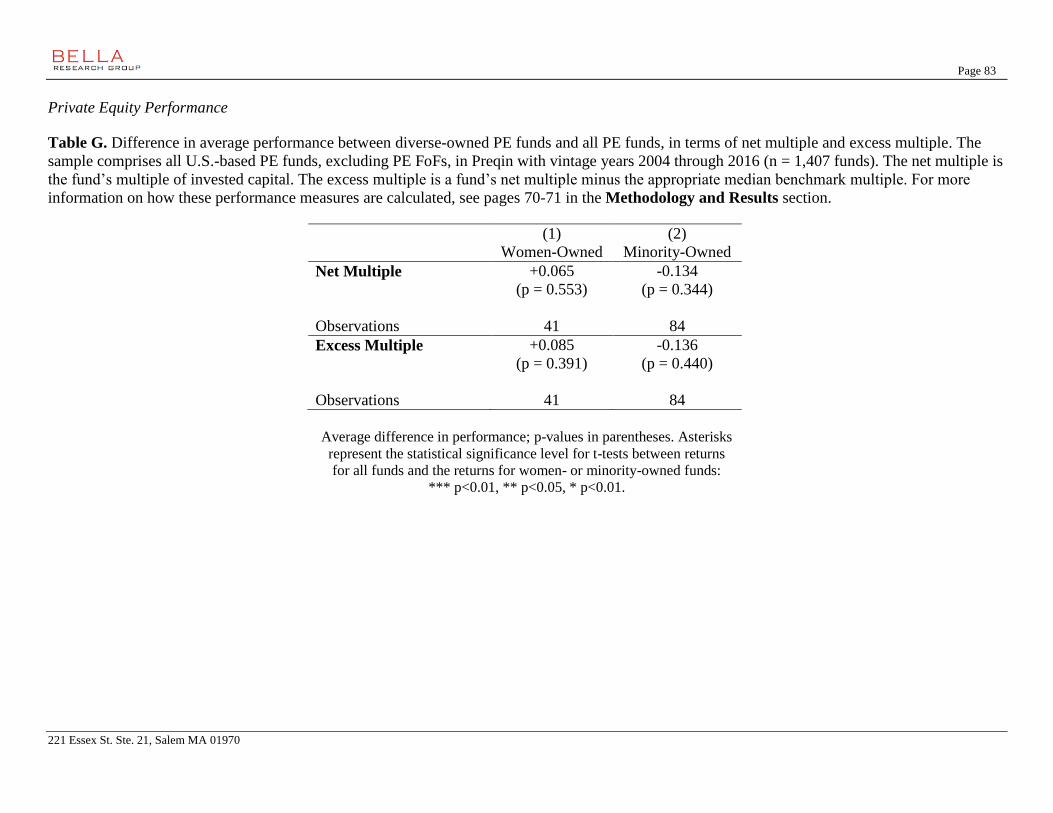
Page 83
221 Essex St. Ste. 21, Salem MA 01970
Private Equity Performance
Table G. Difference in average performance between diverse-owned PE funds and all PE funds, in terms of net multiple and excess multiple. The
sample comprises all U.S.-based PE funds, excluding PE FoFs, in Preqin with vintage years 2004 through 2016 (n = 1,407 funds). The net multiple is
the fund’s multiple of invested capital. The excess multiple is a fund’s net multiple minus the appropriate median benchmark multiple. For more
information on how these performance measures are calculated, see pages 70-71 in the Methodology and Results section.
(1) (2)
Women-Owned Minority-Owned
Net Multiple +0.065 -0.134
(p = 0.553) (p = 0.344)
Observations 41 84
Excess Multiple +0.085 -0.136
(p = 0.391) (p = 0.440)
Observations 41 84
Average difference in performance; p-values in parentheses. Asterisks
represent the statistical significance level for t-tests between returns
for all funds and the returns for women- or minority-owned funds:
*** p<0.01, ** p<0.05, * p<0.01.
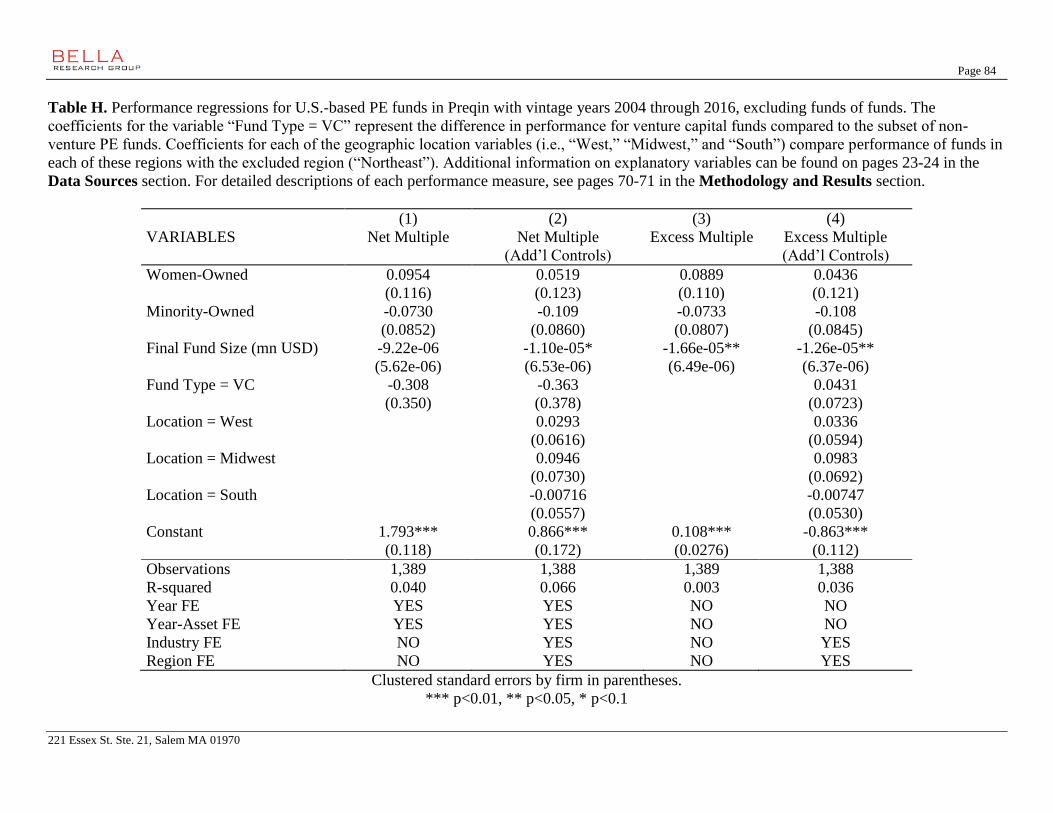
Page 84
221 Essex St. Ste. 21, Salem MA 01970
Table H. Performance regressions for U.S.-based PE funds in Preqin with vintage years 2004 through 2016, excluding funds of funds. The
coefficients for the variable “Fund Type = VC” represent the difference in performance for venture capital funds compared to the subset of non-
venture PE funds. Coefficients for each of the geographic location variables (i.e., “West,” “Midwest,” and “South”) compare performance of funds in
each of these regions with the excluded region (“Northeast”). Additional information on explanatory variables can be found on pages 23-24 in the
Data Sources section. For detailed descriptions of each performance measure, see pages 70-71 in the Methodology and Results section.
(1) (2) (3) (4)
VARIABLES Net Multiple Net Multiple
(Add’l Controls)
Excess Multiple Excess Multiple
(Add’l Controls)
Women-Owned 0.0954 0.0519 0.0889 0.0436
(0.116) (0.123) (0.110) (0.121)
Minority-Owned -0.0730 -0.109 -0.0733 -0.108
(0.0852) (0.0860) (0.0807) (0.0845)
Final Fund Size (mn USD) -9.22e-06 -1.10e-05* -1.66e-05** -1.26e-05**
(5.62e-06) (6.53e-06) (6.49e-06) (6.37e-06)
Fund Type = VC -0.308 -0.363 0.0431
(0.350) (0.378) (0.0723)
Location = West 0.0293 0.0336
(0.0616) (0.0594)
Location = Midwest 0.0946 0.0983
(0.0730) (0.0692)
Location = South -0.00716 -0.00747
(0.0557) (0.0530)
Constant 1.793*** 0.866*** 0.108*** -0.863***
(0.118) (0.172) (0.0276) (0.112)
Observations 1,389 1,388 1,389 1,388
R-squared 0.040 0.066 0.003 0.036
Year FE YES YES NO NO
Year-Asset FE YES YES NO NO
Industry FE NO YES NO YES
Region FE NO YES NO YES
Clustered standard errors by firm in parentheses.
*** p<0.01, ** p<0.05, * p<0.1
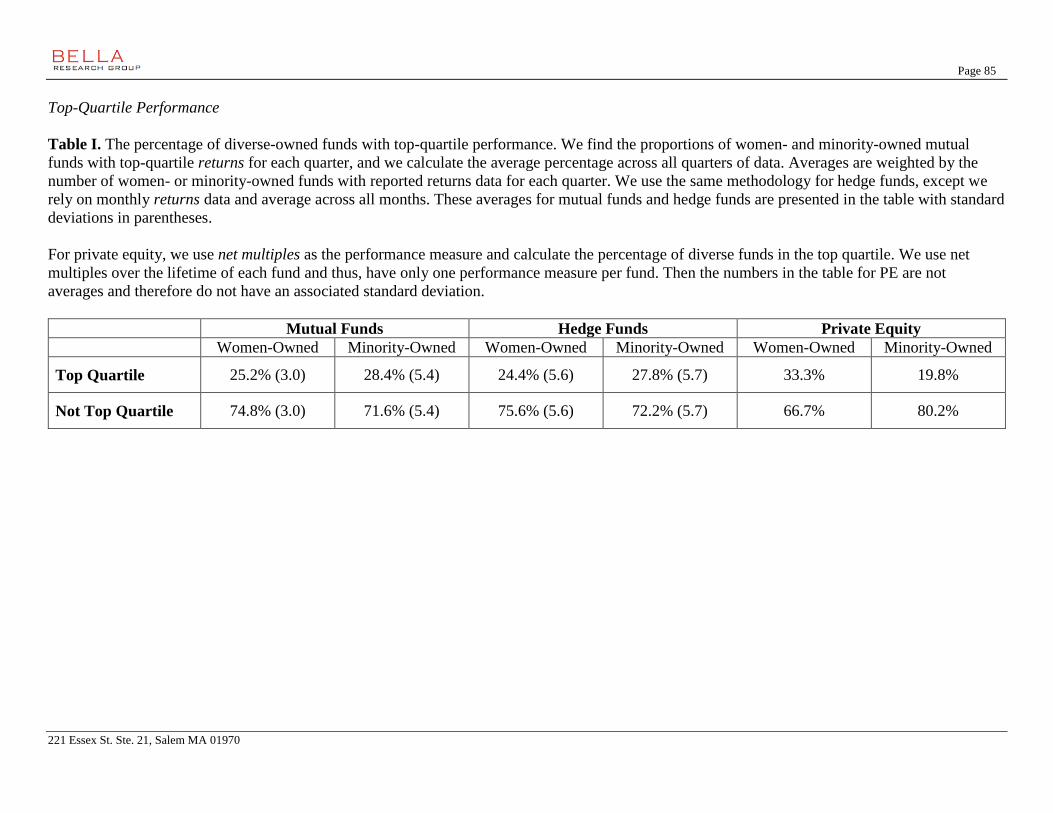
Page 85
221 Essex St. Ste. 21, Salem MA 01970
Top-Quartile Performance
Table I. The percentage of diverse-owned funds with top-quartile performance. We find the proportions of women- and minority-owned mutual
funds with top-quartile returns for each quarter, and we calculate the average percentage across all quarters of data. Averages are weighted by the
number of women- or minority-owned funds with reported returns data for each quarter. We use the same methodology for hedge funds, except we
rely on monthly returns data and average across all months. These averages for mutual funds and hedge funds are presented in the table with standard
deviations in parentheses.
For private equity, we use net multiples as the performance measure and calculate the percentage of diverse funds in the top quartile. We use net
multiples over the lifetime of each fund and thus, have only one performance measure per fund. Then the numbers in the table for PE are not
averages and therefore do not have an associated standard deviation.
Mutual Funds Hedge Funds Private Equity
Women-Owned Minority-Owned Women-Owned Minority-Owned Women-Owned Minority-Owned
Top Quartile 25.2% (3.0) 28.4% (5.4) 24.4% (5.6) 27.8% (5.7) 33.3% 19.8%
Not Top Quartile 74.8% (3.0) 71.6% (5.4) 75.6% (5.6) 72.2% (5.7) 66.7% 80.2%